2017 OUTLOOK - MIDF Official · PDF filedecember 2016. 1. malaysia equity research. kindly...
64
KDN : PP 10744/05/2013 (033520) MALAYSIA 27 DECEMBER 2016 KINDLY REFER TO THE LAST PAGE OF THIS PUBLICATION FOR IMPORTANT DISCLOSURES 2017 OUTLOOK: UNCLE SAM’S POWER PLAY
Transcript of 2017 OUTLOOK - MIDF Official · PDF filedecember 2016. 1. malaysia equity research. kindly...

1DECEMBER 2016
MALAYSIA EQUITY RESEARCH
KINDLY REFER TO THE LAST PAGE OF THIS PUBLICATION FOR IMPORTANT DISCLOSURES
KDN : PP 10744/05/2013 (033520)
MALAYSIA27 DECEMBER 2016
KINDLY REFER TO THE LAST PAGE OF THIS PUBLICATION FOR IMPORTANT DISCLOSURES
2017 OUTLOOK: UNCLE SAM’S POWER PLAY
2 DECEMBER 2016
MALAYSIA EQUITY RESEARCH
TABLE OF CONTENTS
KINDLY REFER TO THE LAST PAGE OF THIS PUBLICATION FOR IMPORTANT DISCLOSURES
Executive summary ......................................................................................................... 3
A. 2016 Review and 2017 Outlooki. Performance, comparisons and assessment ........................................................................4ii. Macro economics performance ...........................................................................................10iii. Corporate earnings .............................................................................................................14iv. Valuation and stock selection ..............................................................................................18
B. 2017 Issues, Risks and Themesi. Dragon Reawakens .............................................................................................................24ii. Effect on trade balances from exchange rate depreciation .................................................27iii. Global trade slowdown: Why it matters ...............................................................................29
C. Sectoral Viewi. Aviation (Transportation) .....................................................................................................31ii. Construction .......................................................................................................................31iii. Healthcare ..........................................................................................................................32iv. Insurance ............................................................................................................................33v. Oil and Gas .........................................................................................................................35vi. Plantation ............................................................................................................................36vii. Power (Utility) .....................................................................................................................38viii. Shipping and Port (Transportation) .....................................................................................40ix. Banking ...............................................................................................................................40x. Automotive ..........................................................................................................................42 xi. Consumer ...........................................................................................................................44xii. Media ..................................................................................................................................46xiii. Property ..............................................................................................................................48xiv. Real Estate Investment Trust (REIT) ..................................................................................49xv. Gloves ................................................................................................................................51 xvi. Telecommunication ............................................................................................................52 xvii. Technology .........................................................................................................................54 xviii. Building Materials ...............................................................................................................56xix. Tobacco ..............................................................................................................................56
MIDF Research Stock Universe ........................................................................................... 58-62
3DECEMBER 2016
MALAYSIA EQUITY RESEARCH
2016 REVIEW IN BRIEF
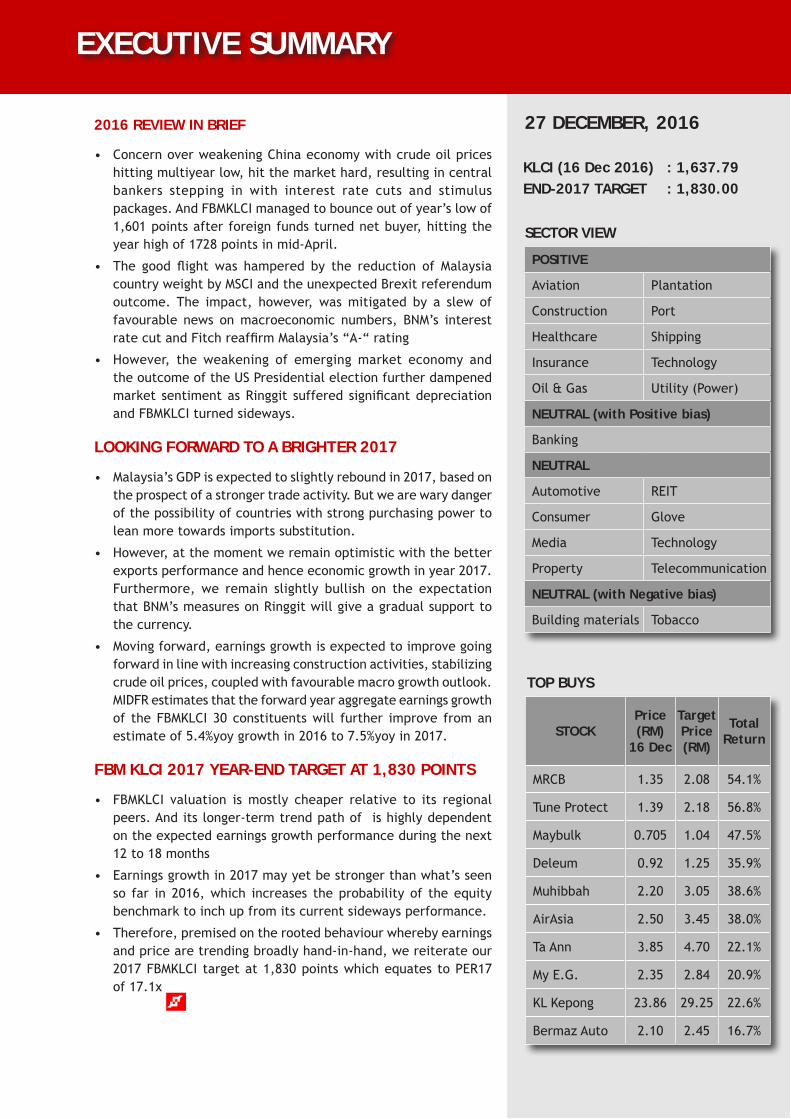
• ConcernoverweakeningChinaeconomywithcrudeoilpriceshittingmultiyearlow,hitthemarkethard,resultingincentralbankers stepping in with interest rate cuts and stimuluspackages.AndFBMKLCImanagedtobounceoutofyear’slowof1,601pointsafterforeignfundsturnednetbuyer,hittingtheyearhighof1728pointsinmid-April.
• The good flightwas hampered by the reduction of MalaysiacountryweightbyMSCIandtheunexpectedBrexitreferendumoutcome.The impact, however,wasmitigated by a slew offavourable news onmacroeconomic numbers, BNM’s interestratecutandFitchreaffirmMalaysia’s“A-“rating
• However, the weakening of emergingmarket economy andtheoutcomeoftheUSPresidentialelectionfurtherdampenedmarket sentimentasRinggit suffered significantdepreciationandFBMKLCIturnedsideways.
LOOKING FORWARD TO A BRIGHTER 2017
• Malaysia’sGDPisexpectedtoslightlyreboundin2017,basedontheprospectofastrongertradeactivity.Butwearewarydangerofthepossibilityofcountrieswithstrongpurchasingpowertoleanmoretowardsimportssubstitution.
• However,atthemomentweremainoptimisticwiththebetterexportsperformanceandhenceeconomicgrowthinyear2017.Furthermore,we remain slightly bullish on the expectationthatBNM’smeasuresonRinggitwillgiveagradualsupporttothecurrency.
• Movingforward,earningsgrowthisexpectedtoimprovegoingforwardinlinewithincreasingconstructionactivities,stabilizingcrudeoilprices,coupledwithfavourablemacrogrowthoutlook.MIDFRestimatesthattheforwardyearaggregateearningsgrowthof theFBMKLCI 30 constituentswill further improve fromanestimateof5.4%yoygrowthin2016to7.5%yoyin2017.
FBM KLCI 2017 YEAR-END TARGET AT 1,830 POINTS
• FBMKLCI valuation ismostly cheaper relative to its regionalpeers.Anditslonger-termtrendpathofishighlydependentontheexpectedearningsgrowthperformanceduringthenext12to18months
• Earningsgrowthin2017mayyetbestrongerthanwhat’sseenso far in 2016,which increases theprobability of theequitybenchmarktoinchupfromitscurrentsidewaysperformance.
• Therefore,premisedontherootedbehaviourwherebyearningsandpricearetrendingbroadlyhand-in-hand,wereiterateour2017FBMKLCI targetat1,830pointswhichequatestoPER17of17.1x
EXECUTIVE SUMMARY
KLCI (16 Dec 2016) : 1,637.79END-2017 TARGET : 1,830.00
27 DECEMBER, 2016
SECTOR VIEW
TOP BUYS
STOCKPrice (RM)
16 Dec
Target Price (RM)
Total Return
MRCB 1.35 2.08 54.1%
TuneProtect 1.39 2.18 56.8%
Maybulk 0.705 1.04 47.5%
Deleum 0.92 1.25 35.9%
Muhibbah 2.20 3.05 38.6%
AirAsia 2.50 3.45 38.0%
TaAnn 3.85 4.70 22.1%
MyE.G. 2.35 2.84 20.9%
KLKepong 23.86 29.25 22.6%
BermazAuto 2.10 2.45 16.7%
POSITIVE
Aviation Plantation
Construction Port
Healthcare Shipping
Insurance Technology
Oil&Gas Utility(Power)
NEUTRAL (with Positive bias)
Banking
NEUTRAL
Automotive REIT
Consumer Glove
Media Technology
Property Telecommunication
NEUTRAL (with Negative bias)
Buildingmaterials Tobacco
4 DECEMBER 2016
MALAYSIA EQUITY RESEARCH
I. PERFORMANCE, COMPARISONS AND ASSESSMENT
PERFORMANCE
• Market started the year under selling pressure amidst global ‘uncertainties’.ThePeople’sBankof
ChinacontinuousattempttoweakenedyuancurrencyandreportsthatsomebanksinShanghaihave
haltedacceptingsharesofsmallerlistedcompaniesascollateralforloans,hadspookedthemarket,
triggeringofitsequitiesmarket’scircuitbreakerhaltedtradingonthelatterfirstdayofimplementation.
Inaddition,escalatingtensionbetweenSaudiArabiaandIranunderscoredgeopoliticalrisksinthe
MiddleEast,resultingtheFBMKLCI,aswithotherworld’smajormarkets,tosuccumbedtoselling
pressureduringtheopeningweeksof2016.
• Japan’sfirstnegativeinterestrateshocksthemarket.Themove,whichinvolvedchargingbanksfor
theprivilegeofparkingtheirexcesscapital,showedJapan’sresolveinitsattempttorevivegrowth
whileatthesametime,keeptheeconomyfromslidingbackintothestagnation
• Crude oil faced with a supply glut.TheBrentcrudeoilpricestouchedaslowasUSD29.28/bblfor
arecord12yearlow.Oilfirmscontinuedlayingoffworkersandcurrencymarketsfromcommodity-
producingcountrieswereinturmoil,asCrudeinventoriesroseby4.6millionbarrelsintheweekon
Jan.15to485.2million,wellaboveanalysts’expectationsforanincreaseof2.8millionbarrels.
• China continue to fall, but Indonesia bucked the trend.Foreigninvestorscontinuedtopourmoney
intoIndonesianstockmarket,thesolenetflowamongmajorAsianmarkets,andpushedtheRupiah
A. 2016 REVIEW AND 2017 OUTLOOK
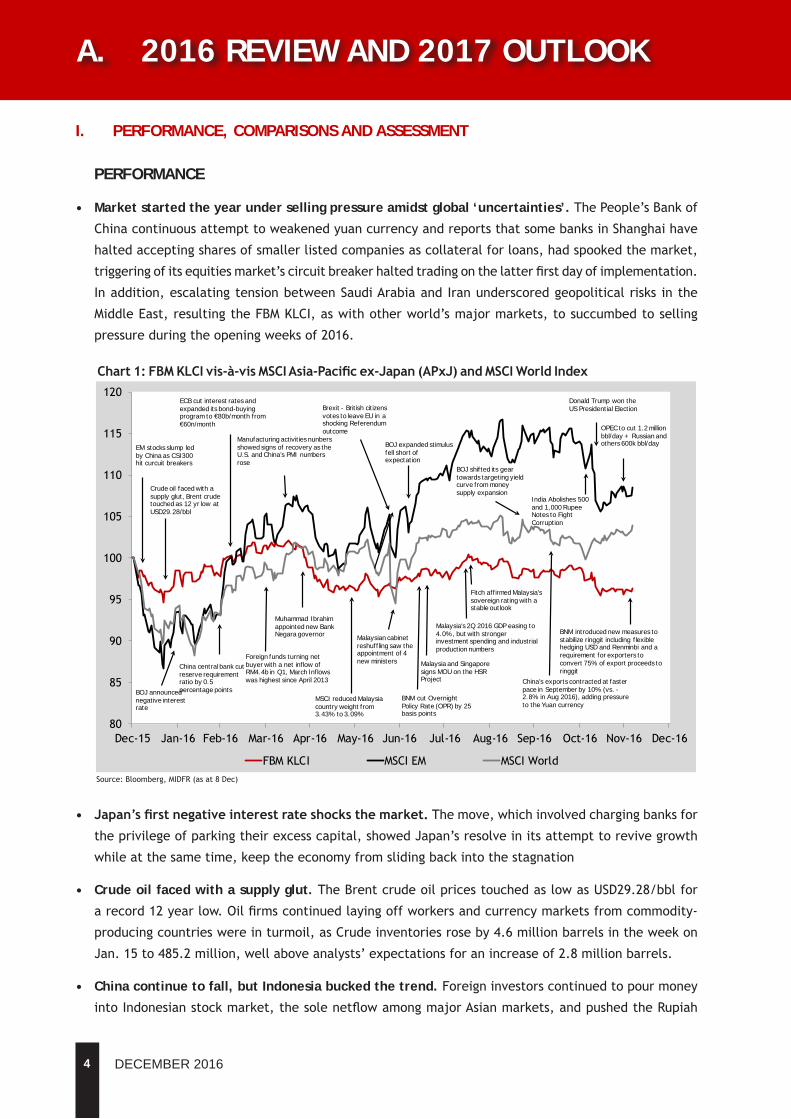
Chart1:FBMKLCIvis-à-visMSCIAsia-Pacificex-Japan(APxJ)andMSCIWorldIndex
Source:Bloomberg,MIDFR(asat8Dec)
80
85
90
95
100
105
110
115
120
Dec-15 Jan-16 Feb-16 Mar-16 Apr-16 May-16 Jun-16 Jul-16 Aug-16 Sep-16 Oct-16 Nov-16 Dec-16
FBMKLCI MSCIEM MSCIWorld
China central bank cut reserve requirement ratio by 0.5 percentage points
India Abolishes 500 and 1,000 Rupee Notes to Fight Corruption
Fitch affirmed Malaysia's sovereign rating with a stable outlook
Malaysian cabinet reshuffling saw the appointment of 4 new ministers
ECB cut interest rates and expanded its bond-buying program to €80b/month from €60n/month
BOJ announced negative interest rate
EM stocks slump led by China as CSI300 hit curcuit breakers
Muhammad Ibrahim appointed new Bank Negara governor
Brexit - British citizens votes to leave EU in a shocking Referendum outcome
BOJ expanded stimulus fell short of expectation
BNM cut Overnight Policy Rate (OPR) by 25 basis points
Malaysia and Singapore signs MOU on the HSR Project
BOJ shifted its gear towards targeting yield curve from money supply expansion
Donald Trump won theUS Presidential Election
OPEC to cut 1.2 million bbl/day + Russian and others 600k bbl/day
Crude oil faced with a supply glut, Brent crude touched as 12 yr low atUSD29.28/bbl
Manufacturing activities nunbers showed signs of recovery as the U.S. and China’s PMI numbers rose
Foreign funds turning net buyer with a net inflow of RM4.4b in Q1, March Inflows was highest since April 2013
MSCI reduced Malaysia country weight from 3.43% to 3.09%
Malaysia's 2Q 2016 GDP easing to 4.0%, but with stronger investment spending and industrial production numbers
China’s exports contracted at faster pace in September by 10% (vs. -2.8% in Aug 2016), adding pressure to the Yuan currency
BNM introduced new measures to stabilize ringgit including flexible hedging USD and Renminbi and a requirement for exporters to convert 75% of export proceeds to ringgit

5DECEMBER 2016
MALAYSIA EQUITY RESEARCH
currencyhigher inFebruary.Meanwhile,Chinastockscontinued its fall,as theGroupof20 (G20)
meetinginShanghaifailedtoprovidearayofhopeovermeasuretoboosteconomicgrowth.
• Market rebounded in March… astheUSFederalReserveheldtheinterestratesteadyandexpected
tohave fewer ratehikes through theyeardue to theexternal risks facing theUSeconomy. The
marketreactedfavourablytotherecoveryofthemanufacturingsectorastheU.S.InstituteofSupply
Management’smanufacturingPurchasingManagersIndex(PMI)rosetoan8-monthhighof51.8points
inMarchfrom49.5pointsinFebruary.Furthermore,China’sofficialmanufacturingPMIalsorosetoa
9-monthhighof50.2pointsinMarchfrom49.0pointsinFebruary.
• …whileECBcontinueditsresolvetocombatdeflation.ECBannouncedaseriesofpolicyactions
whichincludedareductioninitsmainrefinancingrateby5basispointsto0.00%,andthedepositrate
reductionby10basispointsto-0.40%.Ithasalsoincreasedthepaceofitsasset-buyingprogramfrom
€60bto€80bwitheffectfromApril2016andpledgetobuycorporatebondsinadditiontosovereign
debt.
• FBMKLCI breached 1,700 level.ThebenchmarkindexcontinueditsclimbinMarchandclosethe1Q
2016at1,718points,withtheforeignfundsturningnetbuyerwithanetinflowofRM4.4bduringthe
quarterintotheequitiesmarket.InflowsforMarchwasatthehighestsinceApril2013.Theringgit
alsocontinuedtostrengthenagainstUSDdespiteamoderatingcrudeoilpricestoclosethequarter
atRM3.93tothedollar.
• A new era in Bank Negara.ThecentralbankannouncedtheappointmentofDatukMuhammadIbrahim
asitsnewgovernoron27April.Itwasviewedfavorablyandhelpedtoalleviateuncertaintiesoverthe
directionofthefuturemonetarypolicy.ThisnewsandafirmerBrentcrudeoilpriceataboveUSD40/
bbl,furtherstrengthenedtheringgitcurrencytoremainbelowRM3.90levelagainstthegreenback.
• But the upward momentum didn’t last long. Regionalmarketsbroadlydeclineinthelastweekof
AprilamidstnewsthattheBankofJapan(BOJ)resortednottochangeitsmonetarypolicy.Marketwas
expectingmorestimulusmeasures,includinganinterestratecut.FBMKLCIfellbelow1,700points,
registeringadeclineof-2.6%duringthelastweekofAprilalone.
• The lackluster sentiment continues….astheringgitweakenedtoaboveRM4.00levelandconcerns
overaweakeningChina’seconomicgrowthmomentum.Thelatter’sexportsdeclined-1.8%andimports
down-10.9%inApril.Meanwhile,BrentcrudeoilpricecontinuedtoitsupwardstrendtowardsUSD50/
bbl,puttingfurtherpressureonRinggit.
• ...and MSCI reduction of Malaysia country weight added pressure to FBMKLCI.Thereduction in
weightfrom3.43%to3.09%inthepopularMSCIEmergingMarketindexduringtheMay2016index
reviewresultedinpeaknetoutflowofforeignfundsofRM597mduringtheindexrebalancingdayon
31May2016.FBMKLCIfluctuatedbetween1,620and1,640levelformostofMay.
• TheBrexitreferendumandtheunexpectedoutcome.Marketswereinitiallyspooked,afterBritish
citizensunexpectedlyvotedtoexittheEuropeanUnion,causingtheplungeoftheBritishPoundand
alsoFTSE100benchmarkindex,recording11%and9%declinethesubsequentmarketday.FBMKLCI
alsofellto1,630pointsthefollowingweek,alongwithothermarkets.
6 DECEMBER 2016
MALAYSIA EQUITY RESEARCH
• AminorMalaysian cabinet reshuffling. June 27 saw aMalaysian cabinet reshuffling,with theappointmentof4newministers,includinganewsecondFinanceMinister,andfewdeputyministers.ThisprovidedconfidencethatthePrimeMinisternowhasfirmercontroloftheFederalGovernment,andFBMKLCIsubsequentlyrecoveredtoclosethe2Q2016at1,654points.
• BNM cut OPR by 25 basis points… inresponsetorisingrisksfromBrexit.Thedecisionprovidedabreathertothemarket.Supportedbygainsinregionalanddevelopedmarkets,FBMKLCItouched1,668points.
• A milestone in the KL-Singapore High Speed Rail (HSR) project. ThegovernmentsofMalaysiaandSingaporesignedanMOUontheHSRproject,providingaboosttotheFBMKLCI.However,softeningoilpricesaffectedmarketsentimentandthebenchmarkindexgaveupitsgainsandtradedsideways.
• BOJ’sexpandedstimulusfellshortofexpectation.BOJdecisiontoincreaseETFpurchasespacetoanannualpaceof6trillionYenfrom3.3trillionYen,whileleavinginterestrateunchanged,raisedconcernoverpossibilityofachievingits2%inflationtarget.
• Despite Malaysian 2Q 2016 GDP easing to 4.0% from 4.2% in 1Q 2016,increasesinprivateandpublicinvestments,andminingandmanufacturingactivities,sawstrongerinvestmentspendingandindustrialproductionnumbersat6.1%and5.3%respectively.
• FitchreaffirmedMalaysia’s“A-“Rating…The‘A-’withaStableOutlook,reflectMalaysia’sstrongnetexternalcreditorposition,GDPgrowththatremainedstrongerthanthemedianof‘A’ratedpeersandacurrentaccountthatwasstillinsurplus.ThisstrengthenedUSD/MYR,asitbroketheRM4.00barrier,andpushedFBMKLCIclosertothe1,700pointslevel.
• BOJshifteditsgeartowardstargetingyieldcurvefrommoneysupplyexpansion.BOJsaidthatitwillcontrolthevolumeofassetpurchasestocontrolbondyields,followingacomprehensivereviewtoreachits2percentinflationtarget.
• Concern over stability of European banks.DeutscheBankwasslappedwithaUSD14bfineproposedbytheUSDepartmentofJusticeearlierthismonthformis-sellingmortgagebackedsecurities.ThisaffectedthealreadysombreSeptembermonth,leadingFBMKLCItoend3Q2016at1,653points.
• Concerns over China’s economy escalated…asChina’sexportscontractedatfasterpaceinSeptemberby10%comparedtoacontractionof2.8%inAugustwithimportsdeclining1.9%.ThesenumbersaddedpressuretotheYuancurrencydespiteChina’sofficialsreiteratingthatthecurrency’sdepreciation’simpactontradeislimited.
• Budget 2017 provided some reprieve to FBMKLCI.WithBrentCrudeOilpricetradingatabovetheconservativeaverageoilpriceassumptionofUS$45/bblintheannouncedbudget,thereispotentialupsidetothegovernment’sincomeshouldtheoilpriceremainsathigherlevels.InvestorsreactedpositivelypushingFBMKLCIbacktoabove1,670pointslevel,despiteRinggiteasingtoRM4.20totheUSDollar.
• …andthencomeDonaldTrump’sunexpectedwinintheUSPresidencyElection.Theshockwinplungedglobalmarketsintoaperiodofhighvolatility,amidstuncertaintiesoverhowTrumppresidencywillaffectcurrentUSeconomicpoliciesandworldeconomicclimate.AsaresultFBMKLCIdeclinedto
below1,620pointsforthefirsttimesinceJune2016.
• MYR was one of the worst affected currency. WiththeUSbenchmarkindicesrisingtorecordlevels,therewasalsoacertaintythattheFedwillincreasetheinterestrateinDecember.Thisresultedinmassiveflighttosafetyasforeigninvestorspulledouttheirmoneyatrecordlevels,puttingpressureonRinggitresultingittodepreciatesaboveRM4.45level.
7DECEMBER 2016
MALAYSIA EQUITY RESEARCH
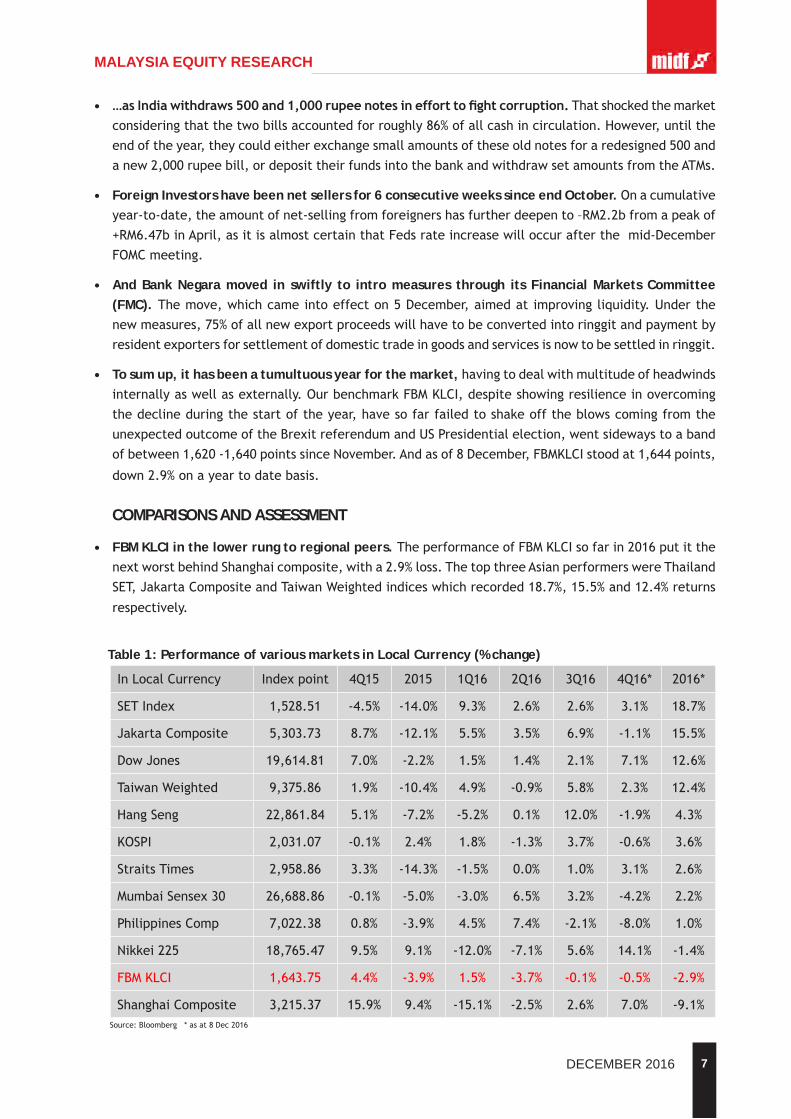
• …asIndiawithdraws500and1,000rupeenotesinefforttofightcorruption.Thatshockedthemarketconsideringthatthetwobillsaccountedforroughly86%ofallcashincirculation.However,untiltheendoftheyear,theycouldeitherexchangesmallamountsoftheseoldnotesforaredesigned500andanew2,000rupeebill,ordeposittheirfundsintothebankandwithdrawsetamountsfromtheATMs.
• Foreign Investors have been net sellers for 6 consecutive weeks since end October.Onacumulativeyear-to-date,theamountofnet-sellingfromforeignershasfurtherdeepento–RM2.2bfromapeakof+RM6.47binApril,asitisalmostcertainthatFedsrateincreasewilloccurafterthemid-DecemberFOMCmeeting.
• And Bank Negara moved in swiftly to intro measures through its Financial Markets Committee (FMC). Themove,whichcameintoeffecton5December,aimedatimprovingliquidity.Underthenewmeasures,75%ofallnewexportproceedswillhavetobeconvertedintoringgitandpaymentbyresidentexportersforsettlementofdomestictradeingoodsandservicesisnowtobesettledinringgit.
• To sum up, it has been a tumultuous year for the market,havingtodealwithmultitudeofheadwindsinternallyaswellasexternally.OurbenchmarkFBMKLCI,despiteshowingresilienceinovercomingthedeclineduringthestartoftheyear,havesofarfailedtoshakeofftheblowscomingfromtheunexpectedoutcomeoftheBrexitreferendumandUSPresidentialelection,wentsidewaystoabandofbetween1,620-1,640pointssinceNovember.Andasof8December,FBMKLCIstoodat1,644points,
down2.9%onayeartodatebasis.
COMPARISONS AND ASSESSMENT
• FBM KLCI in the lower rung to regional peers. TheperformanceofFBMKLCIsofarin2016putitthenextworstbehindShanghaicomposite,witha2.9%loss.ThetopthreeAsianperformerswereThailandSET,JakartaCompositeandTaiwanWeightedindiceswhichrecorded18.7%,15.5%and12.4%returns
respectively.
Table 1: Performance of various markets in Local Currency (% change)
Source:Bloomberg*asat8Dec2016
InLocalCurrency Indexpoint 4Q15 2015 1Q16 2Q16 3Q16 4Q16* 2016*
SETIndex 1,528.51 -4.5% -14.0% 9.3% 2.6% 2.6% 3.1% 18.7%
JakartaComposite 5,303.73 8.7% -12.1% 5.5% 3.5% 6.9% -1.1% 15.5%
DowJones 19,614.81 7.0% -2.2% 1.5% 1.4% 2.1% 7.1% 12.6%
TaiwanWeighted 9,375.86 1.9% -10.4% 4.9% -0.9% 5.8% 2.3% 12.4%
HangSeng 22,861.84 5.1% -7.2% -5.2% 0.1% 12.0% -1.9% 4.3%
KOSPI 2,031.07 -0.1% 2.4% 1.8% -1.3% 3.7% -0.6% 3.6%
StraitsTimes 2,958.86 3.3% -14.3% -1.5% 0.0% 1.0% 3.1% 2.6%
MumbaiSensex30 26,688.86 -0.1% -5.0% -3.0% 6.5% 3.2% -4.2% 2.2%
PhilippinesComp 7,022.38 0.8% -3.9% 4.5% 7.4% -2.1% -8.0% 1.0%
Nikkei225 18,765.47 9.5% 9.1% -12.0% -7.1% 5.6% 14.1% -1.4%
FBMKLCI 1,643.75 4.4% -3.9% 1.5% -3.7% -0.1% -0.5% -2.9%
ShanghaiComposite 3,215.37 15.9% 9.4% -15.1% -2.5% 2.6% 7.0% -9.1%

8 DECEMBER 2016
MALAYSIA EQUITY RESEARCH
• Unchange position when ranked in USD terms. WhenmeasuredintermsofUSDollar,theranking
ofFBMKLCIremained2ndlastwithabigger-5.4%dollar-adjustedreturn.Meanwhile,theJakarta
CompositetooktoppositionfollowedbyThailandSETandTaiwanWeighted.
• Construction led the sectorial race…ConstructionisthebiggestwinnerfollowedbyPlantationand
Financesectorssofarthisyearhavinggained3.9%,1.6%and1.4%respectively.Andthesearethe
onlysectorsthatmanagedtorecordgains.Constructionstocksoutperformedothersectorsthisyear,
benefittingfromtheaslewofpositivenewsflowparticularlyintherailsector.
Table 2: Performance of various markets in US Dollar (% change)
Source:Bloomberg*asat8Dec2016
InLocalCurrency Indexpoint 4Q15 2015 1Q16 2Q16 3Q16 4Q16* 2016*
JakartaComposite 5,303.73 14.8% -21.3% 11.5% 3.1% 8.2% -3.0% 20.6%
SETIndex 1,528.51 -3.7% -21.6% 12.3% 2.6% 4.2% 0.2% 20.2%
TaiwanWeighted 9,375.86 2.2% -13.9% 7.2% -0.9% 8.9% 1.1% 16.9%
DowJones 19,614.81 7.0% -2.2% 1.5% 1.4% 2.1% 7.1% 12.6%
KOSPI 2,031.07 0.5% -4.7% 5.0% -2.1% 8.7% -5.7% 5.3%
Nikkei225 18,765.47 8.6% 8.0% -5.6% 1.3% 7.4% 1.8% 4.7%
HangSeng 22,861.84 5.1% -7.1% -5.3% 0.0% 12.1% -1.9% 4.2%
StraitsTimes 2,958.86 3.8% -19.9% 3.7% -0.2% -0.1% -0.7% 2.7%
MumbaiSensex30 26,688.86 -1.2% -9.3% -2.8% 4.4% 4.6% -5.3% 0.5%
PhilippinesComp 7,022.38 0.4% -8.4% 6.7% 4.7% -4.5% -10.6% -4.6%
FBMKLCI 1,643.75 6.4% -21.8% 12.8% -6.6% -3.4% -7.1% -5.4%
ShanghaiComposite 3,215.37 13.6% 4.7% -14.7% -5.4% 2.4% 3.7% -14.3%
Table 3: Performance by sector (% change)
Source:Bloomberg*asat8Dec2016
Indexpoint 4Q15 2015 1Q16 2Q16 3Q16 4Q16* 2016*
Construction 287.11 5.7% -0.8% 4.8% -2.6% 0.9% 0.9% 3.9%
Plantation 7,742.89 6.5% -3.4% 3.3% -3.9% 4.7% -2.2% 1.6%
Finance 14,353.88 1.8% -9.8% 4.3% -3.8% -0.3% 1.4% 1.4%
Consumer 579.77 4.5% 5.8% 1.1% 0.0% 1.3% -4.0% -1.6%
Services&Trading 219.36 5.5% -0.1% 1.2% -3.9% 0.9% -2.6% -4.3%
Property 1,129.57 2.7% -7.6% -0.1% -4.5% 6.3% -6.2% -4.9%
Industrial 3,097.56 3.3% 2.9% 0.2% -5.2% 0.1% -0.4% -5.3%
Technology 21.77 19.7% 52.4% -10.9% -6.5% 6.4% -3.5% -14.5%
FBM100 11,223.61 5.0% -2.9% 1.3% -3.3% 1.3% -1.4% -2.2%
FBMEmas 11,484.21 5.3% -2.3% 1.1% -3.3% 1.4% -1.7% -2.6%
FBMKLCI 1,643.75 4.4% -3.9% 1.5% -3.7% -0.1% -0.5% -2.9%
FBMSmallCap 14,356.54 8.6% 6.0% -2.1% -3.3% 2.0% -6.7% -10.0%

9DECEMBER 2016
MALAYSIA EQUITY RESEARCH
Source:Bloomberg,MIDFR|TP=12-monthtargetprice
Table 4: Performance of MIDF Research stocks under coverage
OUT-PERFORMERS
Shareprice(RM) %change TP UNDER-
PERFORMERS
Shareprice(RM) %change TP
8/12/16 30/09/16 812/16 30/09/16WCT 1.77 1.61 9.9% 1.61 FeldaGlobal 1.64 2.34 -29.9% 1.77AMMB 4.45 4.09 8.8% 4.55 LionIndustries 0.37 0.50 -26.3% 0.23SimeDarby 8.14 7.65 6.4% 9.05 Vivocom 0.16 0.20 -20.0% 0.40IJMCorp 3.40 3.21 5.9% 4.00 KNMGroup 0.33 0.41 -19.8% 0.41AffinHoldings 2.31 2.19 5.5% 2.50 BumiArmada 0.57 0.70 -18.6% 0.63DialogGroup 1.54 1.46 5.5% 1.68 IOIProp 2.04 2.49 -18.1% 2.34MayBank 7.90 7.50 5.3% 8.10 Dayang 0.84 1.00 -16.1% 0.95TaAnn 3.76 3.58 5.0% 4.70 Deleum 0.84 1.00 -16.1% 1.25AllianceFin. 3.89 3.72 4.6% 4.05 MediaPrima 1.11 1.32 -15.9% 0.78MMC 2.38 2.28 4.4% 2.94 MMHE 0.86 1.01 -14.9% 0.77RHBBank 4.83 4.65 3.9% 5.15 UMWHoldings 4.97 5.83 -14.8% 5.30PetronasChem 6.90 6.65 3.8% 6.46 TuneProtect 1.43 1.64 -12.8% 2.18Daibochi 2.30 2.22 3.6% 2.14 UEMSunrise 1.03 1.18 -12.7% 1.03CahyaMataSwk 3.91 3.80 2.9% 4.36 WahSeong 0.77 0.88 -12.0% 0.65BIMB 4.25 4.14 2.7% 4.35 YTLCorp 1.58 1.79 -11.7% 1.50Hartalega 4.75 4.64 2.4% 4.48 Panasonic 31.80 36.00 -11.7% 35.32Astro 2.78 2.73 1.8% 3.78 Axiata 4.64 5.22 -11.1% 4.74HongLeongBk 13.34 13.12 1.7% 15.00 AEONCo. 2.58 2.89 -10.7% 2.35SunwayCons 1.65 1.63 1.2% 1.74 E&O 1.50 1.68 -10.7% 1.58Pavilion 1.79 1.77 1.1% 1.68 EcoWorld 1.50 1.68 -10.7% 1.68IHHHealthcare 6.40 6.33 1.1% 6.58 MahSing 1.45 1.62 -10.5% 1.57KLCCPStp.Grp 7.80 7.72 1.0% 7.16 Maybulk 0.70 0.78 -10.3% 1.04LPICapital 16.74 16.58 1.0% 17.84 Telekom 6.11 6.78 -9.9% 8.18KLKepong 24.06 23.98 0.3% 29.25 YTLPower 1.45 1.60 -9.4% 1.40DiGi 4.99 4.98 0.2% 5.02 AirAsia 2.53 2.79 -9.3% 3.45MRCB 1.30 1.30 0.0% 2.08 HockSengLee 1.59 1.75 -9.1% 2.19Superlon 2.36 2.36 0.0% 2.89 Padini 2.60 2.85 -8.8% 2.81PetronasDag 23.46 23.50 -0.2% 24.80 Globetronics 3.34 3.65 -8.5% 3.64 BAT 44.98 49.14 -8.5% 41.27 Star 2.30 2.51 -8.4% 2.46 UOADev’t 2.30 2.50 -8.0% 2.68 IJMPlant 3.30 3.57 -7.6% 3.30 AxisREIT 1.62 1.75 -7.4% 1.68 MBMRes. 2.32 2.50 -7.2% 2.90 TiongNam 1.58 1.70 -7.1% 2.16 Bermaz 2.12 2.28 -7.0% 2.70 Unisem 2.35 2.52 -6.7% 3.06 Glomac 0.73 0.78 -6.5% 0.76 Muhibbah 2.16 2.30 -6.1% 3.05 LafargeM’sia 7.45 7.92 -5.9% 5.50 TanChong 1.83 1.93 -5.2% 1.95 AirAsiaX 0.37 0.39 -5.1% 0.50 SPSetia 3.32 3.49 -4.9% 3.38 IGBREIT 1.57 1.64 -4.3% 1.63 Kossan 6.59 6.88 -4.2% 7.85 MBSB 0.90 0.94 -3.7% 1.08 Nestle 76.20 78.86 -3.4% 82.82 Sunway 3.00 3.10 -3.2% 3.25 MAHB 6.34 6.54 -3.1% 7.60 MISC 7.33 7.55 -2.9% 7.96 F&N 23.40 24.06 -2.7% 25.32 UEMEdgenta 3.24 3.33 -2.7% 3.41 PetronasGas 21.28 21.84 -2.6% 19.63 TopGlove 4.97 5.10 -2.5% 5.24 GentingPlant 10.74 11.00 -2.4% 11.50 Supermax 2.13 2.18 -2.3% 2.42 SyarikatTakaful 4.08 4.17 -2.2% 4.84 TenagaNasional 14.00 14.30 -2.1% 16.80 GasMalaysia 2.52 2.57 -1.9% 3.07 BursaMalaysia 8.65 8.82 -1.9% 8.95 MSM 4.80 4.89 -1.8% 4.02 Maxis 6.05 6.16 -1.8% 6.55 Sunreit 1.70 1.73 -1.7% 1.83 Gamuda 4.82 4.90 -1.6% 5.50 TSHResources 1.88 1.91 -1.6% 2.15 CIMB 4.64 4.71 -1.5% 5.90 AnnJooRes. 2.04 2.07 -1.4% 0.85 HongLeongFin. 15.20 15.42 -1.4% 17.20 MyE.G. 2.25 2.28 -1.3% 2.84 SapuraKencana 1.55 1.57 -1.3% 1.71 KPJ 4.18 4.23 -1.2% 4.05 IOICorp 4.40 4.45 -1.1% 5.30 PPBGoup 16.00 16.18 -1.1% 16.80 LITRAK 5.74 5.80 -1.0% 6.50 PublicBank 19.62 19.82 -1.0% 22.20 Westports 4.35 4.39 -0.9% 5.00 Capitaland 1.54 1.55 -0.6% 1.69 Inari 3.30 3.32 -0.6% 4.32 AEONCredit 14.32 14.40 -0.6% 15.40 FBMKLCI 1,643.75 1,652.55 -0.5% 1,700.00

10 DECEMBER 2016
MALAYSIA EQUITY RESEARCH
• …while Technology occupied the bottom spot. TheTechnologyindexlaggedalltheothersectorswith
a-14.5%dropattributabletolowon-yearearningsgrowthasaresultofchallengingrevenuegrowth
andpressureoncosts.
• Abouttwentysixpercentofstocksundercoverageoutperformed.28outof107stocksrepresenting
circa26%ofMIDFResearchcoverageoutperformedtheFBMKLCI’s0.5%slidesofarin2016.WCTled
therisewitha9.9%gain,followedbyAMMBandSimeDarby,with8.8%and6.4%gainsrespectively.
• Worst underperformer. Conversely,FeldaGlobalVenturewastheworstperformeramongthestocks
underourcoveragewithamassivelossof29.9%sofarin2016.LionIndustriesandVivocomwerethe
next,withlossesof26.3%and20.0%respectively
II. MACRO ECONOMICS PERFORMANCE
Malaysia’s GDP is expected to slightly rebound in 2017, growing between 4.2% - 4.4%yoy
as compared to 4.1%yoy in 2016. The rebound is based on the prospect of a stronger trade
activity next year, though we do not deny the risk coming from Trump’s policies biased towards
protectionism measures.
• GDP growth is likely to rebound to 4.3% in 2017.TheGDPgrowthforyear2016islikelytobeinline
withourOutlook2016targetatarangeof4.1%-4.3%,thoughwehavesincemadeapointforecastat
4.0%andlaterrevisedto4.1%.Overall,momentumofdomesticeconomyremainsmoderate,fromboth
theconsumptionandinvestmentfront,whiletheGDPnumbersremainsupportedbytheproliferation
oftradebalance.Domesticsectorwillremainasakeydrivertosupporttheeconomicgrowthin2016.
Likewise,weopinethatthetrendwillcontinuein2017,leadingtoahigherGDPgrowthfortheyear.
Chart 2: Malaysia Leading Indicator VS Real GDP Growth
Source:DOS,CEIC,MIDFR
-15%
-10%
-5%
0%
5%
10%
15%
1Q95 1Q98 1Q01 1Q04 1Q07 1Q10 1Q13 1Q16
GDP(%yoy)
LeadingIndicator(%yoy)
11DECEMBER 2016
MALAYSIA EQUITY RESEARCH
• Leading indicator back in the red. Theleadingindicatorwasinthered8outof9timesthisyear’s;
itisworthtoberemindedthatMalaysiahasneverexperiencedconsecutivenegativegrowthsofthe
leadingindicatorexceptpriortoacrisis.Therecenttrendinleadingindicatorresemblesthatof2001,
concurrentwiththentimewhentheUSexperiencedslightrecession.Thistimearound,thenegative
growthweremainlycontributedbymoderatingglobaltradeactivityandfundoutflowsfromMalaysia
intotheUSeconomy,leadingtoaweakgrowthofmoneysupply.Assuch,despitetheriskthatitbrings,
theleadingindicatorhasyettobeanywherenearpre-crisislevel.Historicalexperienceshowedthat
forthe6-monthspriortocrisis,leadingindicatorwouldcontractbymorethan3.0%yoy.Thisyear,the
highestcontractionwasonly2.7%yoywhichwasinApril.
• The main risk on Malaysia’s growth lies not with protectionism, but with imports substitution.
Despitetheincreasingconcernanddiscussionregardingprotectionism,weareundertheimpression
thatthemaindangerliesonthetendencytowardsimportssubstitution,ratherthanprotectionismper
se.Allthewhile,countrieswithhighnumberofpopulationandstrongpurchasingpowerhavebeen
theworld’stopconsumers,suchastheUSandChina.However,thesecountriesarecurrentlygoing
towardsthedirectionofimportssubstitution.Inpossessionofahugelandmassandtalentpool,they
havethecapabilitytoconductimportssubstitutionfrommining,agriculturaltomanufacturingsector.
Ifthatweretohappen,theglobaltradeactivitywillbeatrisk.
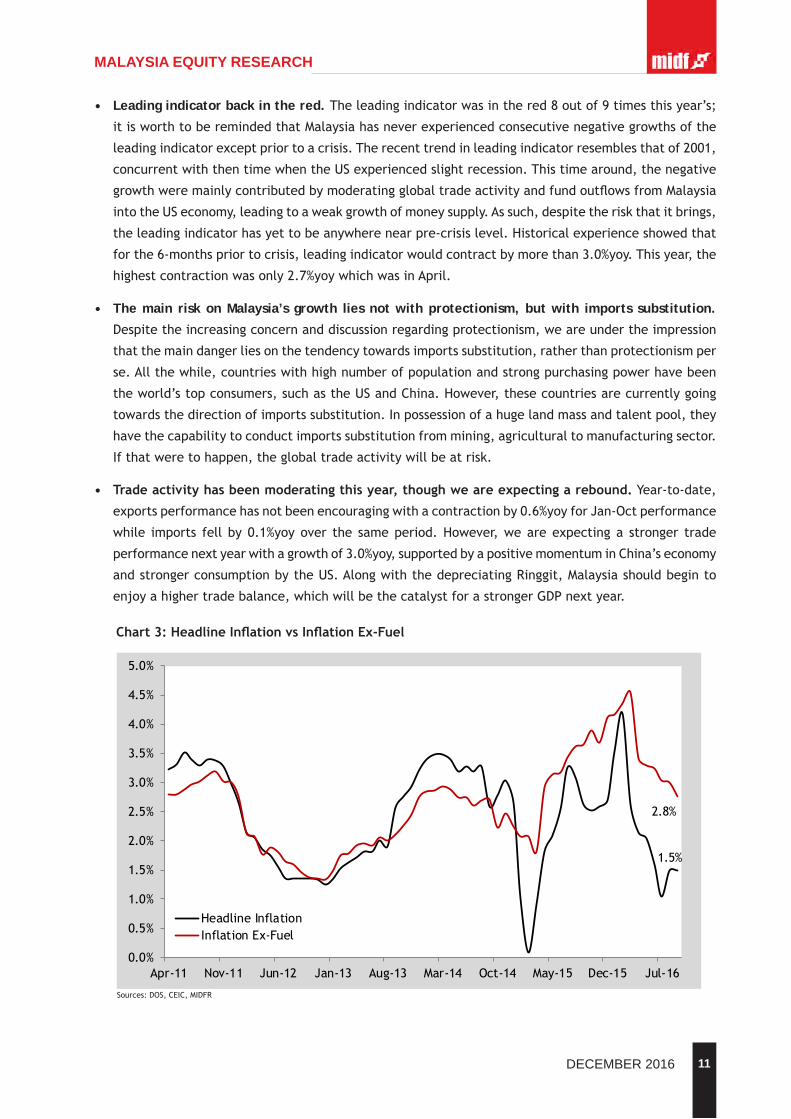
• Tradeactivityhasbeenmoderatingthisyear,thoughweareexpectingarebound.Year-to-date,
exportsperformancehasnotbeenencouragingwithacontractionby0.6%yoyforJan-Octperformance
while imports fell by0.1%yoyover the sameperiod.However,weareexpecting a stronger trade
performancenextyearwithagrowthof3.0%yoy,supportedbyapositivemomentuminChina’seconomy
andstrongerconsumptionbytheUS.AlongwiththedepreciatingRinggit,Malaysiashouldbeginto
enjoyahighertradebalance,whichwillbethecatalystforastrongerGDPnextyear.
Chart3:HeadlineInflationvsInflationEx-Fuel
Sources:DOS,CEIC,MIDFR
1.5%
2.8%
0.0%
0.5%
1.0%
1.5%
2.0%
2.5%
3.0%
3.5%
4.0%
4.5%
5.0%
Apr-11 Nov-11 Jun-12 Jan-13 Aug-13 Mar-14 Oct-14 May-15 Dec-15 Jul-16
HeadlineInflationInflationEx-Fuel
12 DECEMBER 2016
MALAYSIA EQUITY RESEARCH
• Inflationtoremainstable,whileexportsrebound. Inflationratehasremainedmodestthisyear,
mainlyduetothelowerpumppricesascomparedto2015.Year-to-date,inflationrateforyear2016
isat2.2%,whichisontrackofourfull-yearforecastof2.3%.Weareexpectinginflationratetobe
at2.8%in2017,slightlyhigherthan2.3%thisyearwhichcanbeattributedtohigherpumppricesin
2017.OurforecastisbasedontheexpectationtheRON95willaverageatRM1.95nextyear,reflecting
ourUSD50perbarrelforecast.Atthesametime,weexpecttheweakeningofRinggitwillplayarole
inimportedinflation,leadingtoahigherinflationarypressurenextyear.
• BothoilpricesandRinggitisexpectedtoremainflatoverallbutvolatile.Theuncertaintiesand
eventshappeninggloballyarecausingboththeoilpriceandRinggittoexperiencesomedegreesof
volatility,andthereisalikelihoodthatitwillremainsonextyear.Thepossibilityofanelection(GE14),
theparadoxofdemandandsupplyofoilanduncertaintiesofUSfiscalandmonetarypolicyareall
verylikelytoleadbothRinggitandcrudeoilintoaroller-coasterride.However,weexpectthatthe
overallmovementofthetwowillbeflattishwithupwardbias,withourRinggityear-endforecastat
RM4.20andoilpriceatUSD50perbarrelonaveragein2017.
• Optimism on US economy will not bode well for Ringgit.Atthemoment,theoptimismonUSfinancial
marketcausedbyTrump’seconomicplanhasledtomassivecapitaloutflowfromemergingmarket
economiesincludingMalaysia.Furthermore,BNM’sdecisiontohaltinvolvementinNDFoffshoretrading
triggeredforeigninvestorstoremaincautiousfromenteringintoMalaysiacapitalmarket.AbetterUS
economyfromtheinfrastructureplan,aboostinconsumerconfidenceandthewealtheffectcoming
fromastrongerequitymarketwilllikelytocauseafasterpaceofUSratehikeascomparedtothis
year.Hence,despitethestrongeroilpricenextyear,thelackofinterestinourcapitalmarketwill
notbesupportiveofRinggit.Despitethat,weremainslightlybullishontheexpectationthatBNM’s
measuresonRinggitwillgiveagradualsupporttothecurrency.
• PossibilityofoneratecutinOPR,thoughtheMPChasthefinalsay.Thefinancialmarketwasshocked
bytheoneratecutconductedbyBNM inJuly2016,whichwehadearlierexpectedtohappen in
September.However,thereasonbehindthecutremainsunclear,whetheritwasapre-emptivemove
duetotheearlysignsofriskonMalaysiaeconomy,oritwasseenasthenaturalrateforOPR,asboth
themedianandaveragehistoricalOPRisat3%.Ifitweretheformer,thanthereisahigherpossibility
ofanotherratecutin2017;whileifitisthelatter,thanthereisalikelihoodthattheOPRwillremain
atthecurrentlevel.However,atthemomentwearemaintainingouroneratecutscenariointhe
interquartileof2017by25bps.
• China’s positive momentum will remain until 2017.Atthemoment,therelativelystrongerChina’s
economicmomentumisexpectedtocontinue,atleastuntil2017.Inspiteofouroptimism,ourconcern
lieswiththelikelihoodofsuccessfulimportssubstitution.Ifitsimportssubstitutionplanbecomea
reality,ourexportsactivitywillnotbeabletoridealongChina’seconomicmomentum.However,at
themomentweremainoptimisticwiththeE&Esectorandmaintainingourexpectationthatitwill
leadtoabetterexportsperformanceandhenceeconomicgrowthinyear2017.
13DECEMBER 2016
MALAYSIA EQUITY RESEARCH
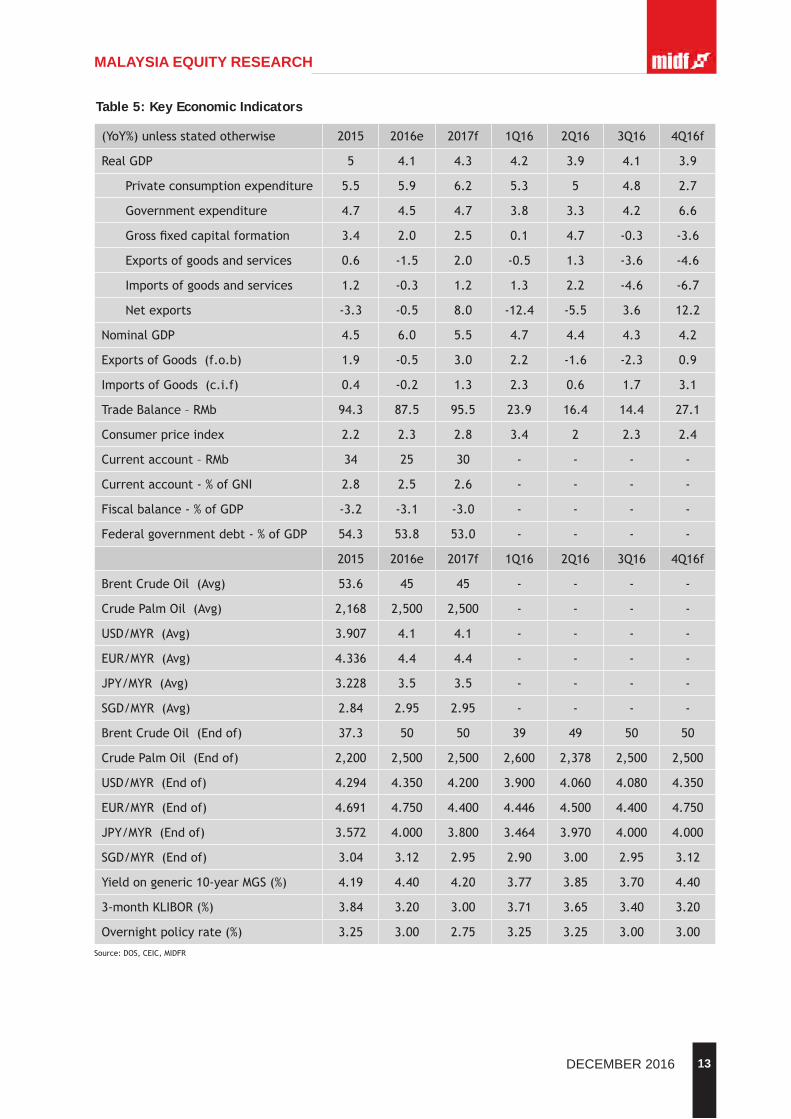
(YoY%)unlessstatedotherwise 2015 2016e 2017f 1Q16 2Q16 3Q16 4Q16f
RealGDP 5 4.1 4.3 4.2 3.9 4.1 3.9
Privateconsumptionexpenditure 5.5 5.9 6.2 5.3 5 4.8 2.7
Governmentexpenditure 4.7 4.5 4.7 3.8 3.3 4.2 6.6
Grossfixedcapitalformation 3.4 2.0 2.5 0.1 4.7 -0.3 -3.6
Exportsofgoodsandservices 0.6 -1.5 2.0 -0.5 1.3 -3.6 -4.6
Importsofgoodsandservices 1.2 -0.3 1.2 1.3 2.2 -4.6 -6.7
Netexports -3.3 -0.5 8.0 -12.4 -5.5 3.6 12.2
NominalGDP 4.5 6.0 5.5 4.7 4.4 4.3 4.2
ExportsofGoods(f.o.b) 1.9 -0.5 3.0 2.2 -1.6 -2.3 0.9
ImportsofGoods(c.i.f) 0.4 -0.2 1.3 2.3 0.6 1.7 3.1
TradeBalance–RMb 94.3 87.5 95.5 23.9 16.4 14.4 27.1
Consumerpriceindex 2.2 2.3 2.8 3.4 2 2.3 2.4
Currentaccount–RMb 34 25 30 - - - -
Currentaccount-%ofGNI 2.8 2.5 2.6 - - - -
Fiscalbalance-%ofGDP -3.2 -3.1 -3.0 - - - -
Federalgovernmentdebt-%ofGDP 54.3 53.8 53.0 - - - -
2015 2016e 2017f 1Q16 2Q16 3Q16 4Q16f
BrentCrudeOil(Avg) 53.6 45 45 - - - -
CrudePalmOil(Avg) 2,168 2,500 2,500 - - - -
USD/MYR(Avg) 3.907 4.1 4.1 - - - -
EUR/MYR(Avg) 4.336 4.4 4.4 - - - -
JPY/MYR(Avg) 3.228 3.5 3.5 - - - -
SGD/MYR(Avg) 2.84 2.95 2.95 - - - -
BrentCrudeOil(Endof) 37.3 50 50 39 49 50 50
CrudePalmOil(Endof) 2,200 2,500 2,500 2,600 2,378 2,500 2,500
USD/MYR(Endof) 4.294 4.350 4.200 3.900 4.060 4.080 4.350
EUR/MYR(Endof) 4.691 4.750 4.400 4.446 4.500 4.400 4.750
JPY/MYR(Endof) 3.572 4.000 3.800 3.464 3.970 4.000 4.000
SGD/MYR(Endof) 3.04 3.12 2.95 2.90 3.00 2.95 3.12
Yieldongeneric10-yearMGS(%) 4.19 4.40 4.20 3.77 3.85 3.70 4.40
3-monthKLIBOR(%) 3.84 3.20 3.00 3.71 3.65 3.40 3.20
Overnightpolicyrate(%) 3.25 3.00 2.75 3.25 3.25 3.00 3.00
Table 5: Key Economic Indicators
Source:DOS,CEIC,MIDFR

14 DECEMBER 2016
MALAYSIA EQUITY RESEARCH
III. CORPORATE EARNINGS
• The aggregate reported earnings of FBM KLCI 30 constituents totalled RM14.25b in 3QCY16.The
figurewaslowersequentiallybuthigheron-yearat-2.3%qoqand19.6%yoyrespectively.However,the
aggregatereportedearningsfigurerequiressomeadjustmentsinorderforthesequentialandon-year
growthnumberstoreflectafairerpictureofthebenchmark’searningsperformance.
• Theaggregatenormalized3QCY16earningsofFBMKLCI30constituentswere loweratRM13.80b.
Someofthemajornon-operationalitemsreportedduringthereviewquarterinclude(i)RM198mgain
ondisposals(mainlyRM131mfromdisposalofpropertyinSingaporeandRM35mfromdisposalof10%
Chart 4: Quarterly Aggregate Earnings of FBM KLCI (RMb)
Source:Bloomberg,MIDFR
14.2514.59
11.93
15.13
11.91
14.0813.80
14.70
13.89
14.92
16.91
15.63
8
9
10
11
12
13
14
15
16
17
18
3QCY161QCY163QCY151QCY153QCY141QCY14
QuarterlyAggregateEarningsofFBMKLCI(RMbillion)
Adjusted(in grey)
Chart 5: Quarterly Aggregate Earnings of FBM KLCI (QoQ%)
Source:Bloomberg,MIDFR
-2.3%
22.3%
-21.1%
27.0%
-15.4%
2.0%
-6.2%
5.9%
-6.9%
-11.8%
8.2%
18.5%
-30%
-20%
-10%
0%
10%
20%
30%
3QCY161QCY163QCY151QCY153QCY141QCY14
QuarterlyAggregateEarningsofFBMKLCI(QoQ%Growth)
Adjusted(in grey)
15DECEMBER 2016
MALAYSIA EQUITY RESEARCH
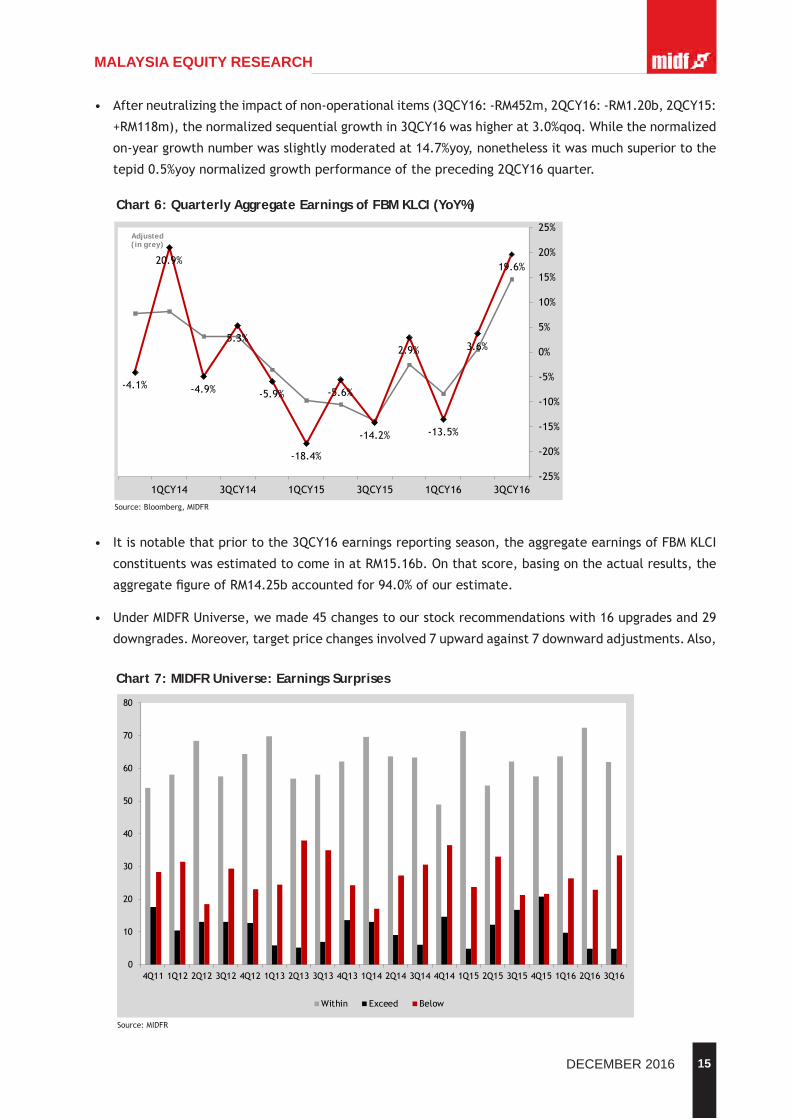
• Afterneutralizingtheimpactofnon-operationalitems(3QCY16:-RM452m,2QCY16:-RM1.20b,2QCY15:
+RM118m),thenormalizedsequentialgrowthin3QCY16washigherat3.0%qoq.Whilethenormalized
on-yeargrowthnumberwasslightlymoderatedat14.7%yoy,nonethelessitwasmuchsuperiortothe
tepid0.5%yoynormalizedgrowthperformanceofthepreceding2QCY16quarter.
• Itisnotablethatpriortothe3QCY16earningsreportingseason,theaggregateearningsofFBMKLCI
constituentswasestimatedtocomeinatRM15.16b.Onthatscore,basingontheactualresults,the
aggregatefigureofRM14.25baccountedfor94.0%ofourestimate.
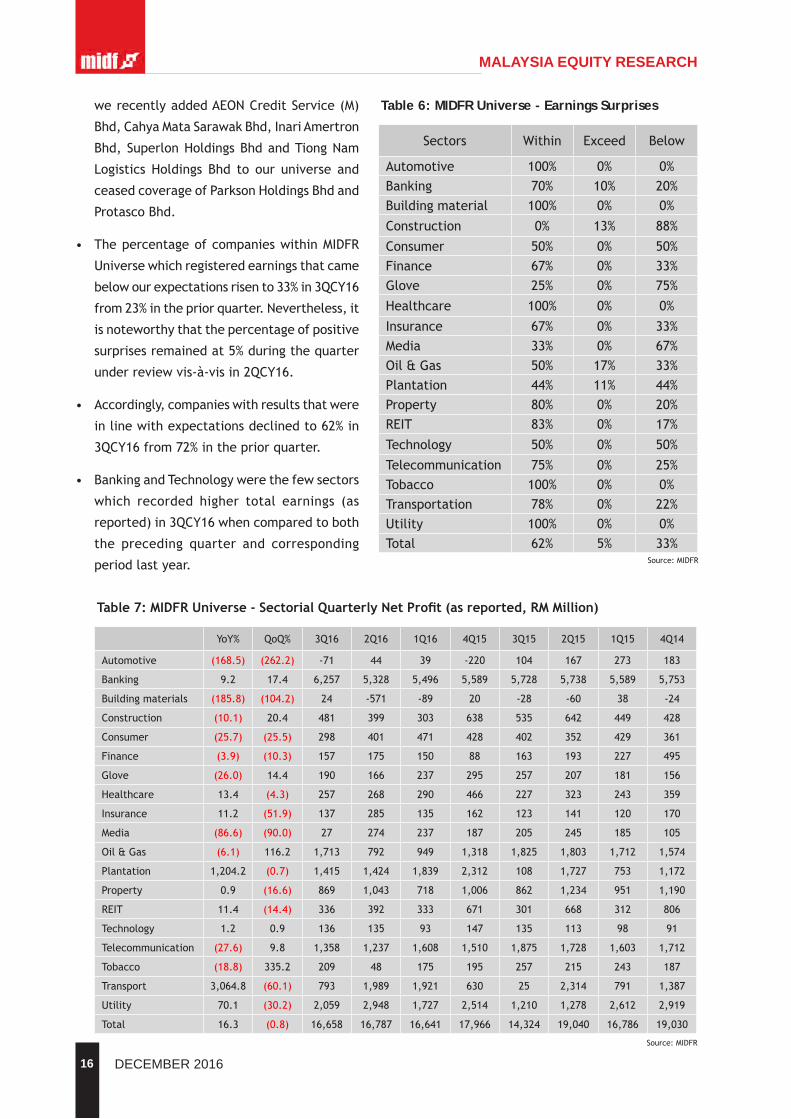
• UnderMIDFRUniverse,wemade45changestoourstockrecommendationswith16upgradesand29
downgrades.Moreover,targetpricechangesinvolved7upwardagainst7downwardadjustments.Also,
Source:Bloomberg,MIDFR
Chart 6: Quarterly Aggregate Earnings of FBM KLCI (YoY%)
19.6%
3.6%
-13.5%
2.9%
-14.2%
-5.6%
-18.4%
-5.9%
5.3%
-4.9%
20.9%
-4.1%
-25%
-20%
-15%
-10%
-5%
0%
5%
10%
15%
20%
25%
3QCY161QCY163QCY151QCY153QCY141QCY14
QuarterlyAggregateEarningsofFBMKLCI(YoY%Growth)
Adjusted(in grey)
Chart 7: MIDFR Universe: Earnings Surprises
Source:MIDFR
0
10
20
30
40
50
60
70
80
4Q11 1Q12 2Q12 3Q12 4Q12 1Q13 2Q13 3Q13 4Q13 1Q14 2Q14 3Q14 4Q14 1Q15 2Q15 3Q15 4Q15 1Q16 2Q16 3Q16
MIDFRUniverse: EarningsSurprises
Within Exceed Below
16 DECEMBER 2016
MALAYSIA EQUITY RESEARCH
werecentlyaddedAEONCreditService(M)
Bhd,CahyaMataSarawakBhd,InariAmertron
Bhd,SuperlonHoldingsBhdandTiongNam
Logistics Holdings Bhd to our universe and
ceasedcoverageofParksonHoldingsBhdand
ProtascoBhd.
• ThepercentageofcompanieswithinMIDFR
Universewhichregisteredearningsthatcame
belowourexpectationsrisento33%in3QCY16
from23%inthepriorquarter.Nevertheless,it
isnoteworthythatthepercentageofpositive
surprisesremainedat5%duringthequarter
underreviewvis-à-visin2QCY16.
• Accordingly,companieswithresultsthatwere
inlinewithexpectationsdeclinedto62%in
3QCY16from72%inthepriorquarter.
• BankingandTechnologywerethefewsectors
which recorded higher total earnings (as
reported)in3QCY16whencomparedtoboth
the preceding quarter and corresponding
periodlastyear.
Table 6: MIDFR Universe - Earnings Surprises
Sectors Within Exceed Below
Automotive 100% 0% 0%Banking 70% 10% 20%Buildingmaterial 100% 0% 0%
Construction 0% 13% 88%
Consumer 50% 0% 50%Finance 67% 0% 33%Glove 25% 0% 75%
Healthcare 100% 0% 0%
Insurance 67% 0% 33%Media 33% 0% 67%Oil&Gas 50% 17% 33%Plantation 44% 11% 44%Property 80% 0% 20%REIT 83% 0% 17%
Technology 50% 0% 50%
Telecommunication 75% 0% 25%Tobacco 100% 0% 0%Transportation 78% 0% 22%Utility 100% 0% 0%Total 62% 5% 33%
Source:MIDFR
YoY% QoQ% 3Q16 2Q16 1Q16 4Q15 3Q15 2Q15 1Q15 4Q14
Automotive (168.5) (262.2) -71 44 39 -220 104 167 273 183
Banking 9.2 17.4 6,257 5,328 5,496 5,589 5,728 5,738 5,589 5,753
Buildingmaterials (185.8) (104.2) 24 -571 -89 20 -28 -60 38 -24
Construction (10.1) 20.4 481 399 303 638 535 642 449 428
Consumer (25.7) (25.5) 298 401 471 428 402 352 429 361
Finance (3.9) (10.3) 157 175 150 88 163 193 227 495
Glove (26.0) 14.4 190 166 237 295 257 207 181 156
Healthcare 13.4 (4.3) 257 268 290 466 227 323 243 359
Insurance 11.2 (51.9) 137 285 135 162 123 141 120 170
Media (86.6) (90.0) 27 274 237 187 205 245 185 105
Oil&Gas (6.1) 116.2 1,713 792 949 1,318 1,825 1,803 1,712 1,574
Plantation 1,204.2 (0.7) 1,415 1,424 1,839 2,312 108 1,727 753 1,172
Property 0.9 (16.6) 869 1,043 718 1,006 862 1,234 951 1,190
REIT 11.4 (14.4) 336 392 333 671 301 668 312 806
Technology 1.2 0.9 136 135 93 147 135 113 98 91
Telecommunication (27.6) 9.8 1,358 1,237 1,608 1,510 1,875 1,728 1,603 1,712
Tobacco (18.8) 335.2 209 48 175 195 257 215 243 187
Transport 3,064.8 (60.1) 793 1,989 1,921 630 25 2,314 791 1,387
Utility 70.1 (30.2) 2,059 2,948 1,727 2,514 1,210 1,278 2,612 2,919
Total 16.3 (0.8) 16,658 16,787 16,641 17,966 14,324 19,040 16,786 19,030
Table7:MIDFRUniverse-SectorialQuarterlyNetProfit(asreported,RMMillion)
Source:MIDFR
17DECEMBER 2016
MALAYSIA EQUITY RESEARCH
• On the other hand, Automotive,
BuildingMaterial,Consumer,Finance
andMedia sectorswere those that
showednegativesequentialaswellas
on-yearearnings(asreported)growth
percentagesin3QCY16.
• Priortothejustconcludedearnings
reporting season, the aggregate
3QCY16 earnings of FBM KLCI
constituentswereestimatedtocome
inatRM15.16b.Hence,basingonthe
actualresults,wetherebyconcludethatthe3QCY16earningsofFBMKLCIconstituentsslightlylagged
(i.e.morethan-5ppts)ourexpectationastheaggregatefigureofRM14.25baccountedforonly94.0%
ofourestimate.
No.ofOutperformer No.ofUnderperformer
3QCY16 2 5
2QCY16 1 4
1QCY16 0 8
4QCY15 7 7
3QCY15 5 8
2QCY15 4 9
Table 8: FBM KLCI - Outperformer versus Underperformer
Source:MIDFR
Table 9: Sectorial Valuation
Source:MIDFR2/Only27FBMKLCIcomponentstockscoveredundertheMIDFRUniverse1/Asat8Dec2016
KLCI:1,674.35
EarningsGrowth(%) PER(x)1/Recommendation
FY15 FY16 FY17 FY15 FY16 FY17
Automotive (30.9) (85.1) 114.1 19.4 94.1 44.0 Neutral
Aviation (22.3) (942.6) 15.9 (74.6) 12.4 10.7 Positive
Banking (0.4) (3.7) 12.3 11.9 12.8 11.4 Neutral(+)
Cement (3.4) (28.1) (1.1) 30.1 35.2 35.6 Neutral(-)
Construction (10.2) 9.2 19.9 18.5 16.8 14.0 Positive
Consumer 2.3 6.8 16.6 23.0 23.5 20.1 Neutral
Finance (51.6) (7.3) 19.1 15.1 19.1 16.1 Positive
Glove 31.9 5.2 11.5 31.6 22.4 20.1 Neutral
Healthcare 15.4 (2.5) 34.0 50.9 51.0 38.1 Positive
Insurance 9.4 (5.1) 12.0 17.4 19.3 17.2 Positive
Media 25.8 (4.0) 8.7 22.1 22.9 21.1 Neutral
Oil&Gas 6.9 2.9 (15.8) 20.5 18.2 21.7 Positive
Plantation (35.3) 4.2 21.8 29.8 29.9 24.6 Positive
Port (2.3) 18.4 5.9 27.6 24.6 23.2 Positive
Power (7.3) 19.4 (7.4) 12.2 10.7 11.5 Positive
Property (1.7) 2.1 5.8 12.7 13.5 12.7 Neutral
REIT (18.4) 62.0 3.5 28.6 19.9 19.2 Neutral
Shipping 14.7 (5.2) 11.8 21.9 18.1 16.2 Positive
Steel (21.7) 123.4 (101.7) (1.4) (1.5) 90.2 Negative
Technology 56.0 6.6 23.3 27.8 24.0 19.5 Neutral
Telecommunication (5.6) (1.1) 0.2 27.2 23.4 23.3 Neutral
Tobacco 1.0 (42.3) 18.4 17.6 24.4 20.6 Neutral(-)
Toll (0.4) 26.1 48.1 19.5 17.9 12.1 Positive
MIDFRUniverse (5.5) 3.2 8.5 18.8 17.8 16.4
FBMKLCI2/ (0.9) 1.4 3.8 17.9 17.1 16.5

18 DECEMBER 2016
MALAYSIA EQUITY RESEARCH
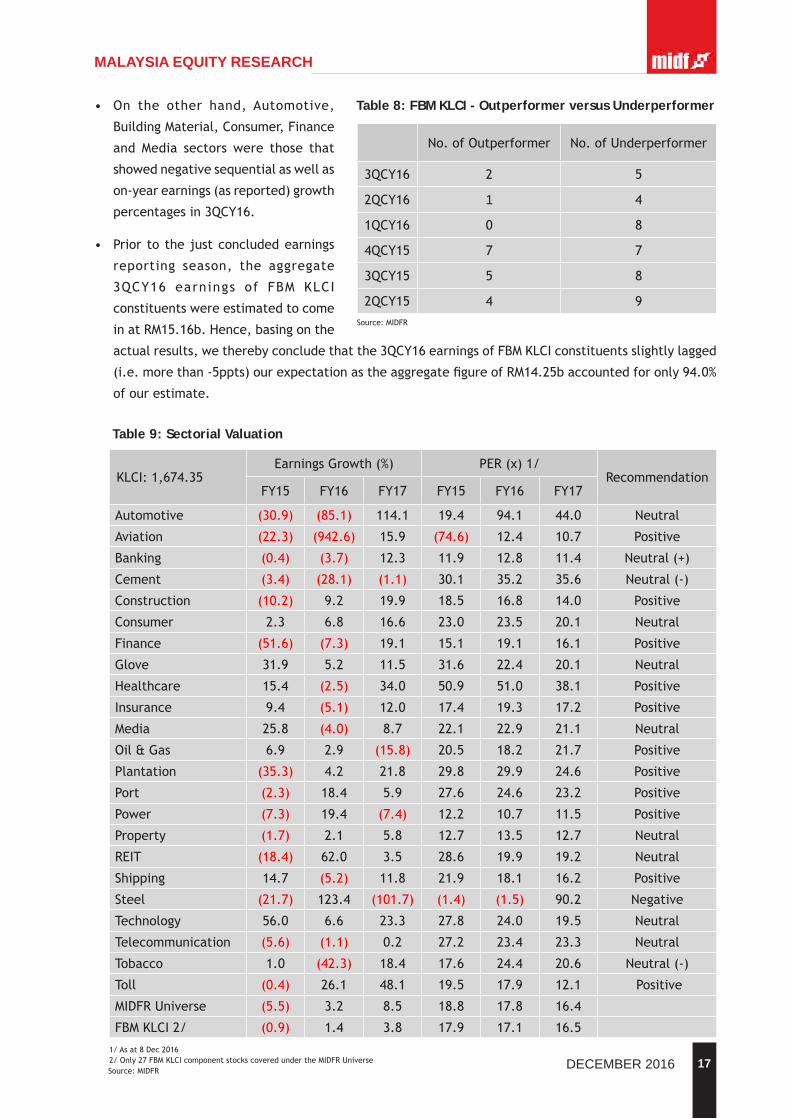
• ItisalsonotablethattheratioofoutperformeragainstunderperformeramongtheFBMKLCIconstituents
remainsskewedtowardthelatterat2:5in3QCY16.TheoutperformerswerePetronasDaganganand
TenagaNasionalwhile the underperformerswere CIMB,Maybank,MISC, SimeDarby andTelekom
Malaysia.
• Whilethe3QCY16ratiowasquitecomparabletothepreceding2QCY16performance,nonethelessit
wasaclearimprovementoverthezerooutperformeragainst8underperformersin1QCY16.
• TheaggregateFY2016earningsoftheFBMKLCIconstituentsunderourcoveragewereadjustedlower
by-1.3%toRM53.58bvis-à-visourearlierestimatepursuanttothepriorreportingseason.Likewise,
theaggregateFY2016earningsofthestocksunderMIDFRcoverageuniversewasalsotrimmedby-2.0%
toRM69.30bvis-à-visourearlierestimatepursuanttothepriorreportingseason.
IV. VALUATION AND STOCK SELECTION
VALUATION
• FBM KLCI valuation is mostly cheaper relative to its regional peers. Asatthecloseofweekended2
December,thePERofFBMKLCIstoodat15.4xbasedonforwardyearearnings(currentyearearnings:
16.4x).Withastandarddeviation(SD)tothePERof0.04,thevaluationofFBMKLCIisnominallylower
andrelativelycheaperincomparisontomostitsmainregionalpeers.
• Plausiblejustificationtoaboveaveragevaluationininternationalmarkets.Againstotherinternational
markets,theFBMKLCIistradingatanominallylowerSDtothePERvaluation.Itmusthoweverbenoted
thattheseinternationalmarketsareatdifferentphasesoftheeconomiccycle.Astheireconomiesare
eitherrecoveringorarestillstrugglingtorecuperate,itisnotunusualfortheSDtothePERvaluation
yardsticktohoversubstantiallyabovetheparitymark.Butincontrast,mostoftheemergingeconomies
arearguablyatadvancedstagesofthegrowthphaseorevenenteringintothematurityphaseofthe
economiccycle.
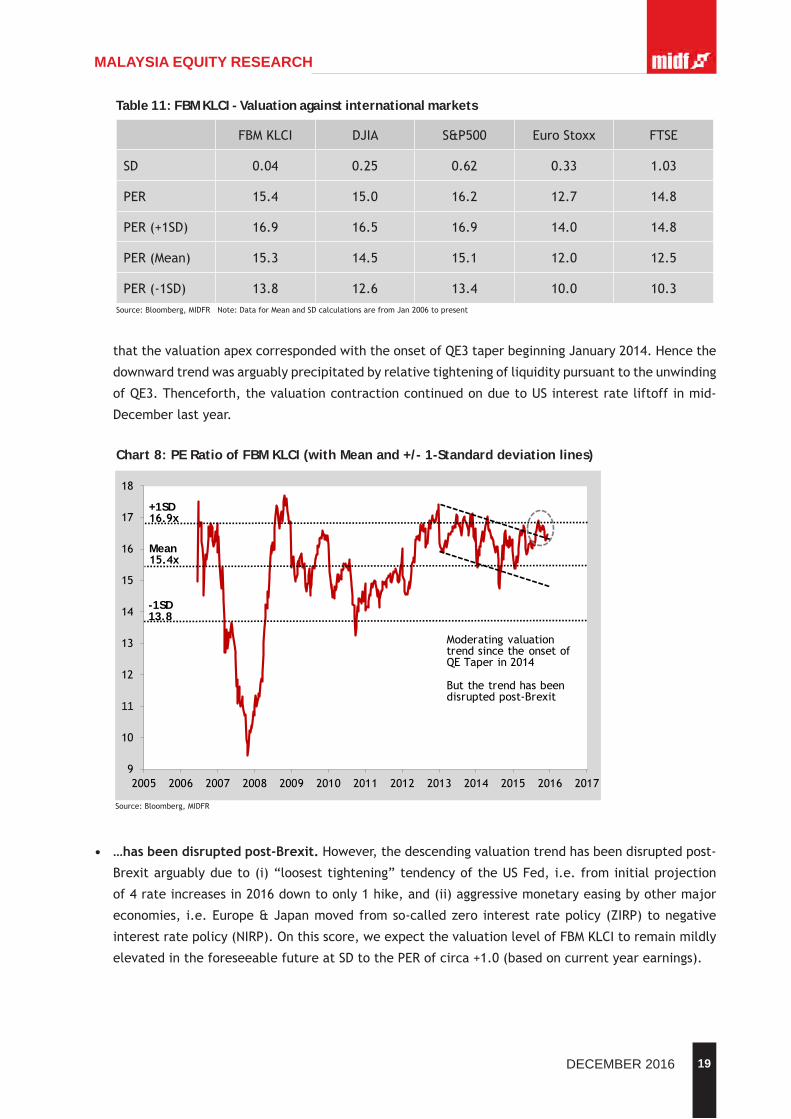
• Easing valuation trend precipitated by QE3 taper… ItisnotablethatthePERofFBMKLCIhasexhibited
adescendingtrendtowardsitslong-termmeansinceitspeakinend-2013.Itmustalsobehighlighted
Table 10: FBM KLCI - Valuation against regional markets
Source:Bloomberg,MIDFRNote:DataforMeanandSDcalculationsarefromJan2006topresent
FBMKLCI FSSTI JCI SET PCOMP
SD 0.04 -0.57 0.30 0.58 0.66
PER 15.4 13.1 15.1 13.9 17.8
PER(+1SD) 16.9 15.5 16.7 14.9 18.8
PER(Mean) 15.3 13.9 14.4 12.5 15.8
PER(-1SD) 13.8 12.4 12.1 10.1 12.7
19DECEMBER 2016
MALAYSIA EQUITY RESEARCH
thatthevaluationapexcorrespondedwiththeonsetofQE3taperbeginningJanuary2014.Hencethe
downwardtrendwasarguablyprecipitatedbyrelativetighteningofliquiditypursuanttotheunwinding
ofQE3.Thenceforth,thevaluationcontractioncontinuedonduetoUSinterestrateliftoffinmid-
Decemberlastyear.
• …hasbeendisruptedpost-Brexit.However,thedescendingvaluationtrendhasbeendisruptedpost-
Brexitarguablydueto(i)“loosesttightening”tendencyoftheUSFed,i.e.frominitialprojection
of4rateincreasesin2016downtoonly1hike,and(ii)aggressivemonetaryeasingbyothermajor
economies, i.e.Europe&Japanmovedfromso-calledzero interestratepolicy(ZIRP)tonegative
interestratepolicy(NIRP).Onthisscore,weexpectthevaluationlevelofFBMKLCItoremainmildly
elevatedintheforeseeablefutureatSDtothePERofcirca+1.0(basedoncurrentyearearnings).
Table 11: FBM KLCI - Valuation against international markets
FBMKLCI DJIA S&P500 EuroStoxx FTSE
SD 0.04 0.25 0.62 0.33 1.03
PER 15.4 15.0 16.2 12.7 14.8
PER(+1SD) 16.9 16.5 16.9 14.0 14.8
PER(Mean) 15.3 14.5 15.1 12.0 12.5
PER(-1SD) 13.8 12.6 13.4 10.0 10.3Source:Bloomberg,MIDFRNote:DataforMeanandSDcalculationsarefromJan2006topresent
Chart 8: PE Ratio of FBM KLCI (with Mean and +/- 1-Standard deviation lines)
Source:Bloomberg,MIDFR
9
10
11
12
13
14
15
16
17
18
2005 2006 2007 2008 2009 2010 2011 2012 2013 2014 2015 2016 2017
-1SD13.8
Mean15.4x
+1SD16.9x
ModeratingvaluationtrendsincetheonsetofQETaperin2014
Butthetrendhasbeendisruptedpost-Brexit
20 DECEMBER 2016
MALAYSIA EQUITY RESEARCH
• Trajectory of FBM KLCI to be dictated by… Empiricalobservationsbetweenearningsandpriceare
conclusivewithregardtothenatureoftheirseculardirectrelationship.Thisisdespitetheeverpresent
‘noises’fromshort-termpricevolatilitywhichisinfluencedbymarketsentimentandothersituational
issues.Henceourassessmentonthelikelylonger-termtrendpathoftheFBMKLCIishighlydependent
ontheexpectedearningsgrowthperformanceduringthenext12to18months.
• …the pace of recovery in corporate earnings
growth. Onthatscore,itmustbehighlighted
that the (Bloomberg) consensus FBM KLCI
earnings growth is forecasted to improve
furtherto7.5%yoyin2017fromanestimate
of5.5%yoygrowthin2016.Theanticipated
currentandforwardyeargrowthpaceisin
starkcontrasttotherecessionaryearnings
performanceofbetween2013and2015.
• Macro outlook may restrict market downside. Inaddition,astheoutlookforMalaysia’seconomy
remainsrathersanguinewithourin-houseGDPgrowthestimatesforthisyearandnextexpectedat
4.1%and4.3%respectively,wedonotforeseetheequitymarketturningbearanytimesoon.Having
saidthat,evenamidstcontinueddecentmacrogrowth,weremainmindfulofintermittentcyclical
pullbacksthatmaytakeplaceasaresultofsituationalissueswhichareaffectingmarketsentiment.
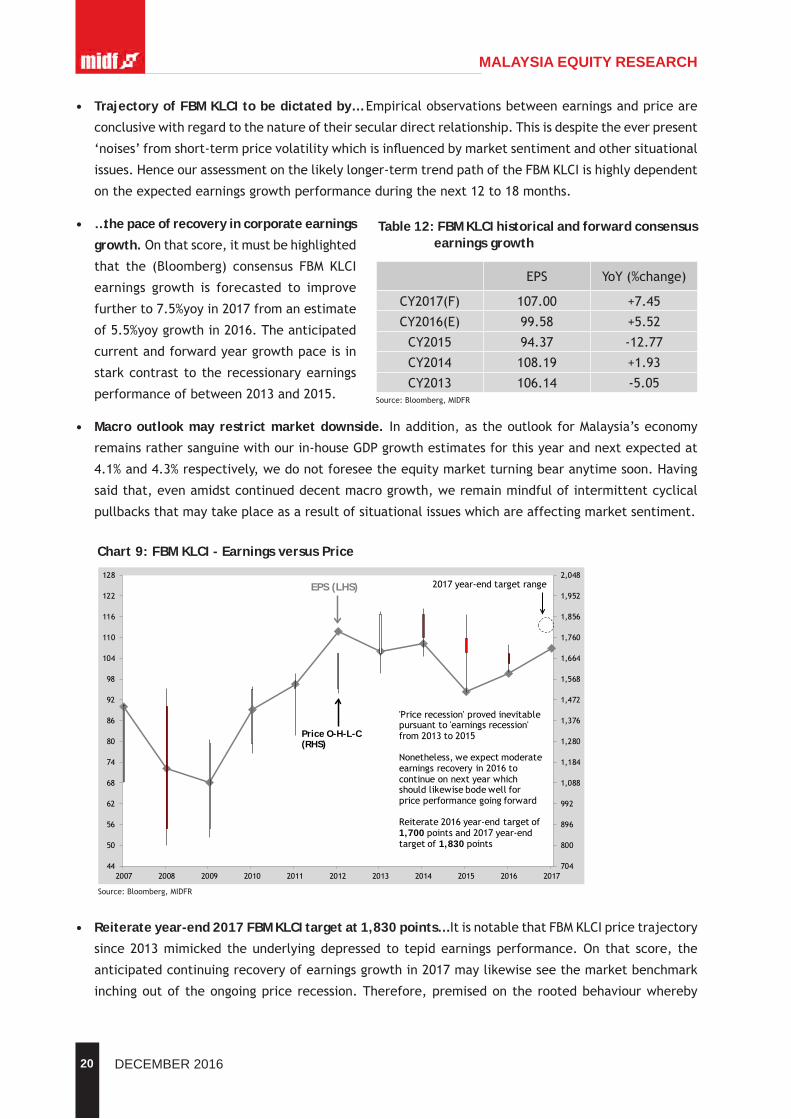
• Reiterate year-end 2017 FBM KLCI target at 1,830 points… ItisnotablethatFBMKLCIpricetrajectory
since2013mimicked theunderlyingdepressed to tepidearningsperformance.On that score, the
anticipatedcontinuingrecoveryofearningsgrowthin2017maylikewiseseethemarketbenchmark
inchingoutoftheongoingpricerecession.Therefore,premisedontherootedbehaviourwhereby
Table 12: FBM KLCI historical and forward consensus earnings growth
Source:Bloomberg,MIDFR
EPS YoY(%change)
CY2017(F) 107.00 +7.45
CY2016(E) 99.58 +5.52
CY2015 94.37 -12.77
CY2014 108.19 +1.93
CY2013 106.14 -5.05
Chart 9: FBM KLCI - Earnings versus Price
Source:Bloomberg,MIDFR
704
800
896
992
1,088
1,184
1,280
1,376
1,472
1,568
1,664
1,760
1,856
1,952
2,048
44
50
56
62
68
74
80
86
92
98
104
110
116
122
128
2007 2008 2009 2010 2011 2012 2013 2014 2015 2016 2017
EPS (LHS)
Price O-H-L-C(RHS)
'Pricerecession'provedinevitablepursuantto 'earningsrecession'from2013to2015
Nonetheless,weexpectmoderateearningsrecoveryin2016tocontinueonnextyearwhichshouldlikewisebodewellforpriceperformancegoingforward
Reiterate2016year-endtargetof1,700 pointsand2017year-endtargetof1,830 points
2017year-endtargetrange

21DECEMBER 2016
MALAYSIA EQUITY RESEARCH
earningsandpricearetrendingbroadlyhand-in-hand,wereiterateour2017FBMKLCItargetat1,830
pointswhichequatestoPER17of17.1x.
• …and year-end 2016 FBM KLCI target of 1,700 points. Also,wereaffirmouryear-end2016FBMKLCI
targetof1,700pointswhichequatestoPER16of17.1x.
STOCK SELECTION
• Portfolio & stocks selection criteria. Whileweremainanadvocateofa‘bias’towardrisk-conservative
equityportfolio,wearealsoconsciousovercapitalgainsopportunities.Accordingly,wewouldliketo
recommendportfolioexposureswithacombinationofstocksinthefollowingorderofpreference(high
tolow):(i)inherentearningsquality,(ii)attractivevaluation,and(iii)GrowthatReasonablePrice
(GARP)strategy(refertoourQuantViewReport:GARPInvestingdated23Nov2016).
• Belowisalistof10stocksthatfittheabovementionedcriteria,whichcomefromvarioussectors
withinourstockuniverse
» Malaysian Resources Corporation Berhad (BUY, TP: RM2.08). Key Catalysts for the company
includes:(i)constructionorderbookofRM1.5bproviding36-monthsconstructionbacklogunderpinned
by1.91xFY15constructionrevenuecover,(ii)DevelopmentofKwasaDamansaraPlotC-8(RM3.0b),
KualaLumpurSportsCity(RM1.6b)andCyberjayaCityCentre(RM9.0bGDV)and(iii)potentialsale
ofEDLforRM1.8btounlockitsbalancesheet.
» Tune Protect Group Berhad (BUY, TP: RM2.18).WeareoverweightonTuneProtectGrouppremised
on(1)theGrouphasafirstmover’sadvantageofdigitalinsurancespaceanditwillcontinuously
growwithinthatparameter.Tunehas(2)alsopredominantmarketshareinlocaltravelinsurance
andextendstoestablishnewairlinepartnershipsandventurebeyondairlineindustryinthenext
twoyears.Thiswilltranslateintopositivesignificantfundamentalimpact,which(3)weexpect
sturdyFY17estimatedearningsgrowthandimprovementinunderwritingmarginof15%and23%
respectively.Onbalancesheet,theGroupwillstandon(4)strongforecasteddoubledigitROEof
17%and(5)anetcashposition.Indeed,ourTPofRM2.18isat(6)undemandingvaluationofPBVand
PERof2.8xand15.5xagainstits3-yearhistoricalPBVandPERaverageofrespective3.6xand17.8x.
» Malaysian Bulk Carriers Berhad (BUY, TP: RM1.04).TheBalticDryIndex(BDI)whichmeasurescharter
ratesacrossdrybulkshipsizesandrouteshasrecentlysurpassedthe1200levelafteraveragingat
500forthemajorityof1HFY16.TherecentsurgeintheBDIcanbeattributedtoarecentincrease
incoalandironoreimportsfromChinaduetolowerdomesticproductionofthesematerialsand
apick-upindemandforconstructionandpowergeneration.Inaddition,theprospectsoftheUS
embarkingoninfrastructurespendingaspartofitsstimulusmeasureshavealsoproppedupsentiment
ontheindustry.OurBUYcallonMaybulkwithtargetpriceofRM1.04isbasedon5-yearaverage
price-to-book(PB)ratioof0.88x.
» Deleum Berhad (BUY, TP: RM1.25).Deleumisanoilandgasservicesspecialistwithundemanding
valuation currently trading at forward PER of only 7x. The company’s orderbook stands at
approximatelyRM2.9bprovidingearningsvisibilityofuptofouryears.Inaddition,thecompany
22 DECEMBER 2016
MALAYSIA EQUITY RESEARCH
is a frontrunner for PETRONASmaintenance, construction andmodification (MCM)worksworth
approximatelyRM500mforitsportion.OurTPofRM1.25isbasedonEPS17of12.5senpeggedto
PER17of10x.OurtargetPER17isbasedonitsfiveyearhistoricalaveragerollingPER.Atpeak
valuation,thestocktradedatPERsinexcessof18x.
» Muhibbah Engineering Berhad (BUY, TP: RM3.05). KeyCatalystsare:(i)Constructionorderbookof
RM3.0bproviding36-monthsconstructionbacklogor3.5xconstructionrevenue,(ii)steadygrowthof
15.0%fromoperatingincomeand(iii)annualgrowthof5.0mfrom3.3mpassengers(11.0%growth
rate)forthethreeconcessionairports;SiemReap,SihanoukvilleandPhnomPenh.
» Air Asia Berhad (BUY, TP: RM3.45). Airasiamakesare-entryintoourtop10picksafterarecent
sharepricecorrectionwhichsawa21%dropfromitshighofRM3.20reachedinAugust2016stemming
fromtheRinggitlosinggroundagainstthegreenback.However,wearenottooconcernedaboutthe
fallingRinggitasAirasia’sunhedgedexposuretoUSDforitsborrowingsandexpensesarecappedat
33%and50%respectively.Meanwhile,Airasiarecentlyrecordeda9MFY16loadfactorof89%which
wasaGrouprecord.Lookingahead,4QFY16willbeevenbetterasOct-Novloadshavealreadyhit
93%.Airasiahighlightedthatithasreceived8non-bindingbidsforfullownershipinAACand1for
an80%stake.Weareincreasinglyoptimisticonthepotentialforspecialdividendsasthedealdraws
nearertoapossibleconclusion.Recallthatadivestmentofa70-80%stakeinAirasia’sleasingarm
couldtranslateintoproceedsofRM2.9b-RM3.3b(RM1.04-RM1.19pershare)whichcouldbeused
toparedebts,fundfutureexpansionandbepaidoutasspecialdividends.OurTPisbasedonFY17
earnings,peggedtoaPERof8.5x.
» Ta Ann Holdings Berhad (BUY, TP: RM4.70). Welikethecompanydueto(i)itsgoodsetofearnings
in9MFY16duetobetterthanexpectedFFBproduction;itsproductiongrowthisthestrongestamong
peers(+8%yoyin9MFY16)and(ii)betteroutlookfortimberdivisionduetorecentstrengtheningof
USDandSarawakStateGovernment’sefforttopromotetimberproductsinJapan.
» My E.G. Services Berhad (BUY, TP: RM2.84).MYEGhasanattractivebusinessmodelandstrong
cash-richbalancesheet.Asat1QFY17,ithasanetcashpositionofRM49.7m.Itisalsoenjoying
anattractiveprofitmarginofmorethan50%.TheupcomingimplementationoftheCustomstax
projectswouldalsoreaffirmthegroup’srevenueandearningsgrowthtrajectory.OurTPofRM2.84
ispremisedonFY18EPSof10.8senpeggedtoFY18forwardPERof26.3x.OurtargetPERisbased
onits3-yearhistoricallowPER.
» Kuala Lumpur Kepong Berhad (BUY, TP: RM29.05). Keypositivesaboutthecompanyincludes:(i)
Itshighexposuretopalmoilbusinessandgoodearningsgrowthof+33%yoytoRM1.05binFY16.(ii)
newcapacitiesinthefattyacidbusinesshasstartedtocontributepositivelytothecompany,with
FY16EBITfordownstreamdivisionsurgingby75%toRM323m.
» Bermaz Auto Berhad (BUY, TP: RM2.45).Significantvaluehasemergedaftera10%fallinshare
pricesincethemarketselldownpost-USelections.Ex-cash,BAutonowtradesatjust9xCY17F
earnings.TheJPYhasactuallyweakenedtoRM3.80-3.90levelsanditwasmainlytheUSD(which

23DECEMBER 2016
MALAYSIA EQUITY RESEARCH
BAutohasnoexposureto)thatstrengthenedagainsttheRinggitinthepastmonth.Keyshareprice
catalystsoverthenext12months:(1)Attractivedividendyieldof7%(basedon85%payoutratio)
underpinnedbynetcashwhichaccountsfor12%ofmarketcapandasolid9%FCFEyield(FY17F).
ListingofPhilippinesunitwill bumpyieldsup furthergivenpotential one-off specialdividends
(SeeBAutoreportdated1stNov2016).(2)ValueunlockingfromthelistingofBAutoPhilippines
(BAP).CurrentmarketcapattributespracticallynovaluetoBAuto’sstakeinBAPrelativetothe
16xindicativeIPOvaluationandhistoricalsectorvaluationof12x(forMalaysianautos).Ex-cash,
BAutotradesatjust9xCY17Fearnings.(3)Amorethandoublinginassociateearningscontribution
togroup(via30%-ownedMazdaMalaysiaSBand29%-ownedInokom)givenamassiveexportmarket
expansionwhichwilltripleMMSB’sprospectivemarket.
Stock BETA Price(RM)08-Dec
TargetPrice(RM)
%PriceReturn %Div.Yield %Total
Return
MRCB 1.0 1.30 2.08 60.0 3.3 63.3
TuneProtect 1.1 1.43 2.18 52.4 3.1 55.5
Maybulk 1.2 0.70 1.04 48.6 0.0 48.6
Deleum 1.8 0.87 1.25 43.7 6.6 50.2
Muhibbah 1.2 2.16 3.05 41.2 2.3 43.5
AirAsia 1.2 2.53 3.45 36.4 3.8 40.2
TaAnn 0.4 3.76 4.70 25.0 3.7 28.7
MyE.G. 0.5 2.25 2.84 26.2 1.2 27.4
KLKepong 1.0 24.06 29.25 21.6 2.7 24.3
BermazAuto 1.0 2.12 2.45 15.6 6.6 22.2
Source:Bloomberg,MIDFR(asat8Dec2016)
Table 13: Top 10 Stock Picks

24 DECEMBER 2016
MALAYSIA EQUITY RESEARCH
I. THE DRAGON REAWAKENS
POPULATION AND ECONOMY
• Like Japan decades before, China is greying…
Chinaliftedtheonechildpolicyin2015inviewofits
increasinglygreyingsociety.Onthisscore,itisnotable
that theprevailing agedemographic inChinaechoes
theconditionthatexistedinJapansome2decadesago.
• …while its economy is slowing… Apart from the
population age profile, the current economic phase
ofChinaalsoarguablyreflectsthecircumstancesthat
existedinJapaninthe1990s.Forone,itisnoteworthy
thatChinaisnowtheworld’ssecondlargesteconomy,
the same spot held by Japan 2 decades ago. More
crucially, China economy has been experiencing
incessantslowdownduringthepastseveralyearswhich
wasthesamepredicamentfacingJapanin1990s.
• …which complicates structural reform.Asagreying
society, it isdifficultforChinatorapidlyreorient its
economytowardsaconsumption-basedgrowthmodel
asolderworkingpeoplearegenerallymoreinterested
in savings and investment but less on consumption.
Likewise,Japanwasbeleagueredbyasimilarstructural
problemacoupleofdecadesago.Inordertodealwith
theincessantslowdown,theexpeditiouswayoutisto
continuerelyingontheinvestment-ledgrowthmodel
andsupportedbymonetarypump-priming.
MONETARY RESPONSE
• Like BOJ decades ago, PBOC takes a similar step…Furthermore,itisinterestingtonotethatthe
monetaryactionstakenbyChina’sPBOCsince2014to-datebearahighresemblancetothestance
takenbyJapan’sBOJin1992onward.ItseemsthePBOCisborrowingaleafoutofBOJ’soldmonetary
playbookinthefaceofanenduringeconomicslowdown.
• …of aggressive rate cutting.ItmustbehighlightedthatJapan’seconomyreactedquitefavorablytothe
seriesofBOJ-administeredliquidityinjectionsasitsoutputratebegantostabilizein1994.Thenceforth,
theBOJtemporarilystoppedcuttingratesbutresumedagainin1995soastolendfurthersupportto
theensuingrecovery.Infact,Japan’seconomyrecordedanencouraging3-yearrecoveryuntil1996
(beforeitsoutputfinallyplummetedtogetherwithmostoftheEastAsianeconomiesin1997/98).
B. 2017 ISSUES, RISKS AND THEMES
Chart 10: JAPAN - Population age pyramid (1995)
Source:worldlifeexpectency.com
Chart 11: CHINA - Population age pyramid (2015)
Source:worldlifeexpectency.com
25DECEMBER 2016
MALAYSIA EQUITY RESEARCH
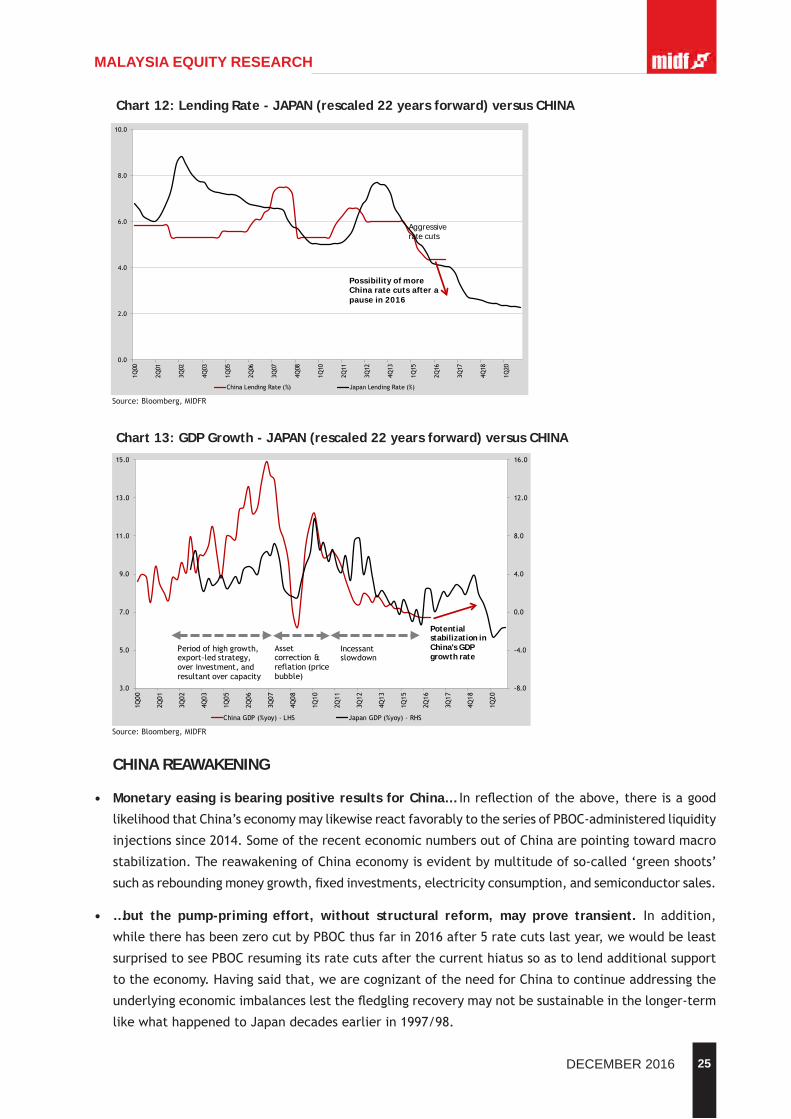
CHINA REAWAKENING
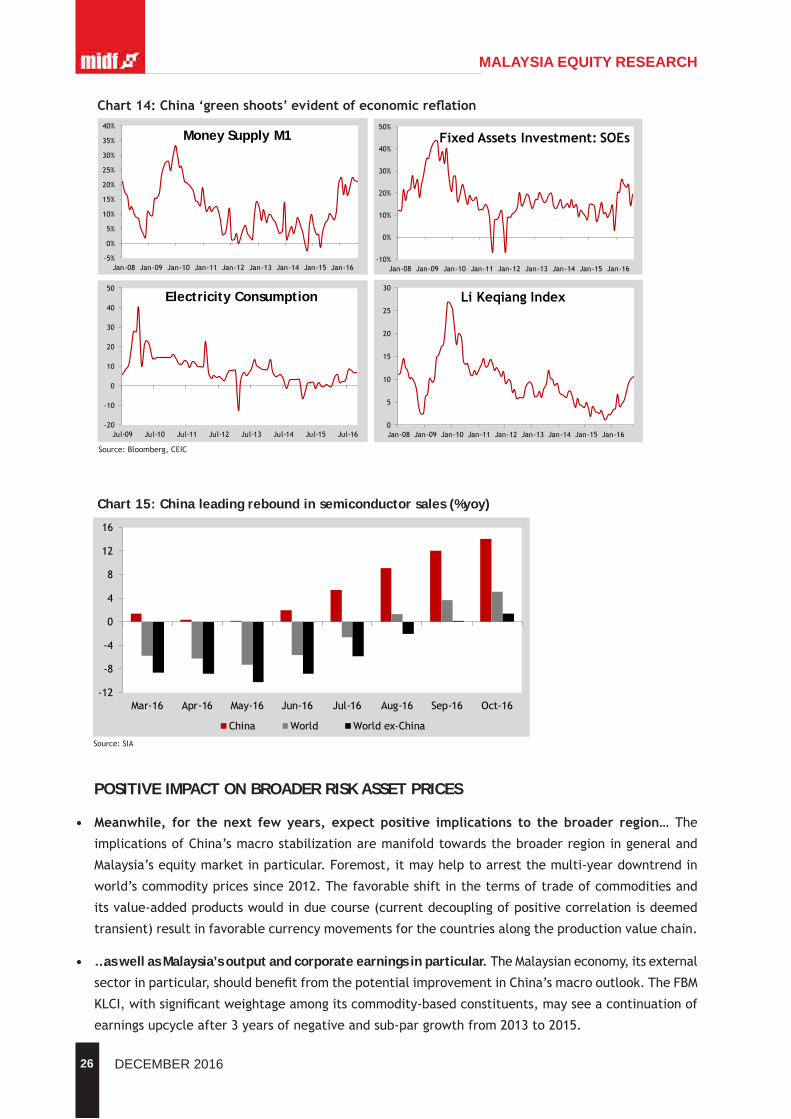
• Monetary easing is bearing positive results for China…Inreflectionoftheabove,thereisagood
likelihoodthatChina’seconomymaylikewisereactfavorablytotheseriesofPBOC-administeredliquidity
injectionssince2014.SomeoftherecenteconomicnumbersoutofChinaarepointingtowardmacro
stabilization.ThereawakeningofChinaeconomyisevidentbymultitudeofso-called‘greenshoots’
suchasreboundingmoneygrowth,fixedinvestments,electricityconsumption,andsemiconductorsales.
• …but the pump-priming effort, without structural reform, may prove transient. In addition,
whiletherehasbeenzerocutbyPBOCthusfarin2016after5ratecutslastyear,wewouldbeleast
surprisedtoseePBOCresumingitsratecutsafterthecurrenthiatussoastolendadditionalsupport
totheeconomy.Havingsaidthat,wearecognizantoftheneedforChinatocontinueaddressingthe
underlyingeconomicimbalanceslestthefledglingrecoverymaynotbesustainableinthelonger-term
likewhathappenedtoJapandecadesearlierin1997/98.
Chart 13: GDP Growth - JAPAN (rescaled 22 years forward) versus CHINA
Source:Bloomberg,MIDFR
-8.0
-4.0
0.0
4.0
8.0
12.0
16.0
3.0
5.0
7.0
9.0
11.0
13.0
15.0
1Q00
2Q01
3Q02
4Q03
1Q05
2Q06
3Q07
4Q08
1Q10
2Q11
3Q12
4Q13
1Q15
2Q16
3Q17
4Q18
1Q20
ChinaGDP(%yoy)-LHS JapanGDP(%yoy)-RHS
Periodofhighgrowth,export-ledstrategy,overinvestment,andresultantovercapacity
Assetcorrection&reflation(pricebubble)
Potentialstabilization in China's GDP growth rate
Incessantslowdown
Chart 12: Lending Rate - JAPAN (rescaled 22 years forward) versus CHINA
Source:Bloomberg,MIDFR
0.0
2.0
4.0
6.0
8.0
10.01Q
00
2Q01
3Q02
4Q03
1Q05
2Q06
3Q07
4Q08
1Q10
2Q11
3Q12
4Q13
1Q15
2Q16
3Q17
4Q18
1Q20
ChinaLendingRate(%) JapanLendingRate(%)
Possibility of more China rate cuts after a pause in 2016
Aggressiverate cuts
26 DECEMBER 2016
MALAYSIA EQUITY RESEARCH
POSITIVE IMPACT ON BROADER RISK ASSET PRICES
• Meanwhile, for the next few years, expect positive implications to the broader region…The
implicationsofChina’smacrostabilizationaremanifoldtowardsthebroaderregioningeneraland
Malaysia’sequitymarketinparticular.Foremost,itmayhelptoarrestthemulti-yeardowntrendin
world’scommoditypricessince2012.Thefavorableshiftinthetermsoftradeofcommoditiesand
itsvalue-addedproductswouldinduecourse(currentdecouplingofpositivecorrelationisdeemed
transient)resultinfavorablecurrencymovementsforthecountriesalongtheproductionvaluechain.
• …as well as Malaysia’s output and corporate earnings in particular. TheMalaysianeconomy,itsexternal
sectorinparticular,shouldbenefitfromthepotentialimprovementinChina’smacrooutlook.TheFBM
KLCI,withsignificantweightageamongitscommodity-basedconstituents,mayseeacontinuationof
earningsupcycleafter3yearsofnegativeandsub-pargrowthfrom2013to2015.
Chart14:China‘greenshoots’evidentofeconomicreflation
Source:Bloomberg,CEIC
-5%
0%
5%
10%
15%
20%
25%
30%
35%
40%
Jan-08 Jan-09 Jan-10 Jan-11 Jan-12 Jan-13 Jan-14 Jan-15 Jan-16
Money Supply M1
-10%
0%
10%
20%
30%
40%
50%
Jan-08 Jan-09 Jan-10 Jan-11 Jan-12 Jan-13 Jan-14 Jan-15 Jan-16
FixedAssetsInvestment:SOEs
-20
-10
0
10
20
30
40
50
Jul-09 Jul-10 Jul-11 Jul-12 Jul-13 Jul-14 Jul-15 Jul-16
Electricity Consumption
0
5
10
15
20
25
30
Jan-08 Jan-09 Jan-10 Jan-11 Jan-12 Jan-13 Jan-14 Jan-15 Jan-16
LiKeqiangIndex
Chart 15: China leading rebound in semiconductor sales (%yoy)
Source:SIA
-12
-8
-4
0
4
8
12
16
Mar-16 Apr-16 May-16 Jun-16 Jul-16 Aug-16 Sep-16 Oct-16
China World Worldex-China

27DECEMBER 2016
MALAYSIA EQUITY RESEARCH
• As equity price trajectory is empirically earnings-dependent…Thecontinuedrecoveryinearnings
growthiscentraltoourassessmentonthelikelypricetrajectoryoftheFBMKLCIgoingforward.Itis
supportedbyempiricalobservationsbetweenearningsandpricewhichareconclusivewithregardto
thenatureoftheirseculardirectrelationship.Thisisdespitetheeverpresent‘noises’fromshort-term
pricevolatilitywhichisinfluencedbymarketsentimentandothersituationalissues.
• …henceexpecttheFBMKLCItoregainupwardthrust.Therefore,premisedontheempiricallyrooted
behaviourwherebyearningsandpricearetrendingbroadlyhand-in-hand,wereiterateourviewthat
theFBMKLCIshallregainitsupwardthrustgoingforwardamidstintermittentcyclicalpullbacks.
II. EFFECTS ON TRADE BALANCES FROM EXCHANGE RATE DEPRECIATION
• Theoretically,thedepreciationofalocalcurrencyisgoodfortheexportsector,ceterisparibus;it
wouldincreasecompetitivenessofexportgoodsinforeignmarkets.Ontheotherhand,itwouldcause
higherlevelofimportprice.
• Thehigherimportpricecouldbringinflationarypressureespeciallythosewhoimportalotofindustrial
products,energyresources,intermediategoodsandconsumergoods.Hence,theoveralleconomic
impactofcurrencydepreciationcan’tbeeasilyconcludednorquantified.
• Theexchangerateinagiveneconomyoftenplaysamoreprominentrolethantheinterestrateinthe
transmissionmechanismofmonetarypolicy.Formostdevelopingcountries,ithasbeenassumedthat
depreciationisanappropriatemacroeconomicfundamentaltosupporttheexportsector.
• Intheseregards,higherexportsandlowerimportswillincreasethetradesurplusofacountryandin
turn,alsoincreasestheaggregatedemand(AD)resultinginhigherleveloftherealGDP(economic
growth).
• Thisimpliesthattherearetwoelementstobenotedoncurrencydepreciationanditsimpactontrade
balance.Firstly,wesupposethatacountryhasexportpotential,anddepreciationhasthepriceelastic
forexportgoodsinforeignmarkets.Secondly,wealsoassumethatdepreciationissupportedbysound
Chart 16: China GDP Growth versus Commodity Prices (CMCIPI) and Asian Currencies (ADXY)
Source:Bloomberg,MIDFR

28 DECEMBER 2016
MALAYSIA EQUITY RESEARCH
macroeconomicfundamentalsthathelptoensureacountry’scompetitivenessinforeignmarketsi.e.
theeconomyhascapacitytoproducemoreoutputforexport.
• Althougheconomictheorysuggeststheabovescenarioswithrespecttotheimpactofdepreciationon
tradebalanceandeconomicgrowth,theresultsfromempiricalresearchisinconclusive.Sometimes
depreciationwouldbringnegativeimpactontradebalance.Somestudiesshowthatthereshouldbe
asetofnecessaryconditionsonthesizeofimportdemand,exportdemandandsupplyelasticitiesof
depreciation.
• Thiscanbeinterpretedfromtwodifferentaspects.Firstly,theelasticityofdemandforexportsand
importsispriceinelastic,andthereducedpriceofexportgoodsabroadwouldleadtoonlyasmall
increaseinquantitysold.Hence,thetotalamountofexportsmaybereduced(inUSD,butwillincrease
inRinggit).Furthermore,theimpactofthedepreciationmayrequiresometimetoadjustinthereal
economy.
• Intheshortrun,thedemandforexportgoodsinforeignmarketsmaybeinelastic,butastimegoes
on,thedemandforgoodsbecomepriceelasticinthelongrun,andhencebringgreaterimpactto
theexportsector.Secondly,thestateoftheglobaleconomycouldaffecttheexportsector.Whenthe
globaleconomyisinrecession,depreciationmaynotbringmuchimpactonthedemandforexport
goodsabroadandviceversa.
• Considering the current trend in global trade,wheregrowth is subdued; any changes in currency
(depreciation)willbemuted,atleastintheshortterm.
• Anothermajor determinant in favour of the trade balance (positive) with regards to currency
depreciation istheoverallcompositionofexports.Thecountrywithhighpercentageofexportof
manufacturedgoodswouldbenefitmorefromthedepreciationofcurrencyascomparedtothosewhich
reliesonexportofcommoditiesandagriculturalproducts.Thisisduetotheabilityofthesectorto
respondandtakingadvantageofthechangeinforeignexchangemarket.
• Inthisregards,wewouldaspectMalaysia’stradebalancestobenefitfromthecurrentdepreciation
ofMYR.
Chart 17: Malaysia - Trade Balance vs USDMYR
Source:CEIC,MIDFR
2
2.5
3
3.5
4
4.5
5
-4.0
-2.0
0.0
2.0
4.0
6.0
8.0
10.0
12.0
14.0
16.0
18.0
Jan-90 Feb-92 Mar-94 Apr-96 May-98 Jun-00 Jul-02 Aug-04 Sep-06 Oct-08 Nov-10 Dec-12 Jan-15
TradeBalance(RMb)
USDMYR(RHS)
29DECEMBER 2016
MALAYSIA EQUITY RESEARCH
III. GLOBAL TRADE SLOWDOWN: WHY IT MATTERS
• Oneofthemaincatalystbehindthegrowthoftheworldeconomyinrecentdecadesismainlyattributed
totheexpansioninworldtrade.TheinclusionofChinainWTOin2001,helptoacceleratetheworld
tradebyopeningupitshugedomesticeconomyofnearly1.2billionpeople.However,inthelast5
yearsgrowthinglobaltradehasseensignificantdeclines,translatingintoslowdownintheoverall
globaleconomicgrowth.
• Inconcurringthistrend,WorldBankreducesitsworldgrowthforecastfrom2.9%to2.4%inApril2016,
IMFechoedasimilartonewithdownwardrevisionofitsforecastfrom3.5%to3.2%.However,IMFwas
optimisticthatworldgrowthwillreboundslightlyinnextyearto3.5%,drivenbygrowthfromthe
emergingmarkets.
• Inregardstotrade,WTOhasalsotrimmeddownitsworldtradegrowthforecastfrom2.8%to1.7%in
2016.TheglobaltradegrowthforecastreflectsaslowdowninChinaaswellasslowdownindemand
fromdevelopedeconomies.The1.7%growthfiguremarkedthefirsttimethatglobaltradewasexpected
tolagthegrowthoftheworldeconomyinthelast15years.
• Themoderationinglobaltradeispointingtowardasignofimpendingglobalrecessionratherthan
sluggishexpansion.Globaltradegrowthisoneofthemajorcontributorstosupply-sidegainsinglobal
GDP.Therefore,aslow-downinunderlyingglobaltradegrowthreflectspossiblelossesinwelfare.
• Fromatrendperspective,overthelongerterm,globaltradehasgrownattwicetherateofworldGDP
andthemorerecenttrendsareshowingthattherelationshiphasbrokendown.Themainquestionat
handiswhethertheslowdownisacyclicalortrendphenomenon.
• Variousfactorscanbelinkedtotheglobaltradeslowdownwhichareamongothers;
» Weak economic activity, particularly in respect to investment. The dramatic slowdown in
investmentactivitysince2012,especiallyinvestment,contributessignificantlytothedeclineintrade
activity.Lackofinvestmentcouldpossiblycapthefutureexpansionofbothtradeandglobalgrowth.
» Stalled trade liberation initiatives arealsooneofthecontributingfactorsthatdistorttheglobal
tradegrowth.
» Spikes in protectionism measures are on the rise. Measureslikeanti-dumping,countervailingduties,
temporarytradebarriersareamongsomethesignsthatprotectionisminontherise.Protectionism
iskillingtheglobaleconomy.OnecouldblameChinafortheslowdowninglobaltradeactivity,
thoughweopinethattheproblemisnotwithChinaspecifically,butontheincreasingtrendof
protectionismglobally–whichofcoursealsoappliestoChina.Nowadaysmostcountriesaretrying
to reduce their imports contentwhile increasing their exports i.e. imports substitution,which
eventuallyleadtoverycompetitivetradingenvironmentwithfactoriesshiftingtocountrieswith
lowercostofproduction.Awinnerhasyettoemerge,thoughcountriessuchasChinaandVietnam
havestrongchanceofwinningthewar,withrecentlyUSbecomingamajorthreatwithTrump’s
biasednesstowardsprotectionism.However,inthelongrunweareoftheviewthatcountrieswhich
possessthemostfreetradeagreements(FTA)withothercountrieswouldeventuallybenefitthe
mainbeneficiaries.
» Shrinking global value chainwouldresultincompaniesmovingtheirproductionlinesnearertotheir
30 DECEMBER 2016
MALAYSIA EQUITY RESEARCH
markets,depletinginter-countriestradeopportunities.Innovationandchangeintechnologywill
drivedownproductioncostandreducethecomparativeadvantageofcheaplabourpropositions,
makingitpossibleforfirmstoinvestincapitalandbenearertotheirrespectivetargetmarket
withoutdependingonthecheapfactorofproduction.
• Ingauging through the significant impactofglobal trade slowdown,wehave tobear inmind the
followingthreemainconnections;
» Exportsaresourceofjobs,andhigherpayingjobsisanoutcomeofhigherproductivity
» Inthelargerperspective,exportsimprovethetradebalance(ornetexports).Subsequently,
aggregatedemandinaneconomywillincreaseandifthereisenoughslack,thiswillresultinhigher
levelsofnationalincomeandlowerlevelsofunemployment.Fallingexportsputthisprocessinto
reverse.
» Governments can react to falling exports throughmore or less discriminatoryways.One
shouldfearifthegovernmentdecidestocounterfallingexportsbyofferingfiscalincentivesand
subsidisedtradefinance,withthe(oftenunsaid)goalofstealingmarketsharefromothercountry
exporters.Anotherbadoptionisseekingtopreservethenationaltradebalancebydiscriminating
againstimports,donebymatchingafallinexportswithafallinpurchasesfromabroad.Preferred
alternativeswould involveundertakingreformsto improveexportperformanceandnegotiating
dealswithothercountriestoopenupnewcommercialopportunitiesaroundtheglobe.
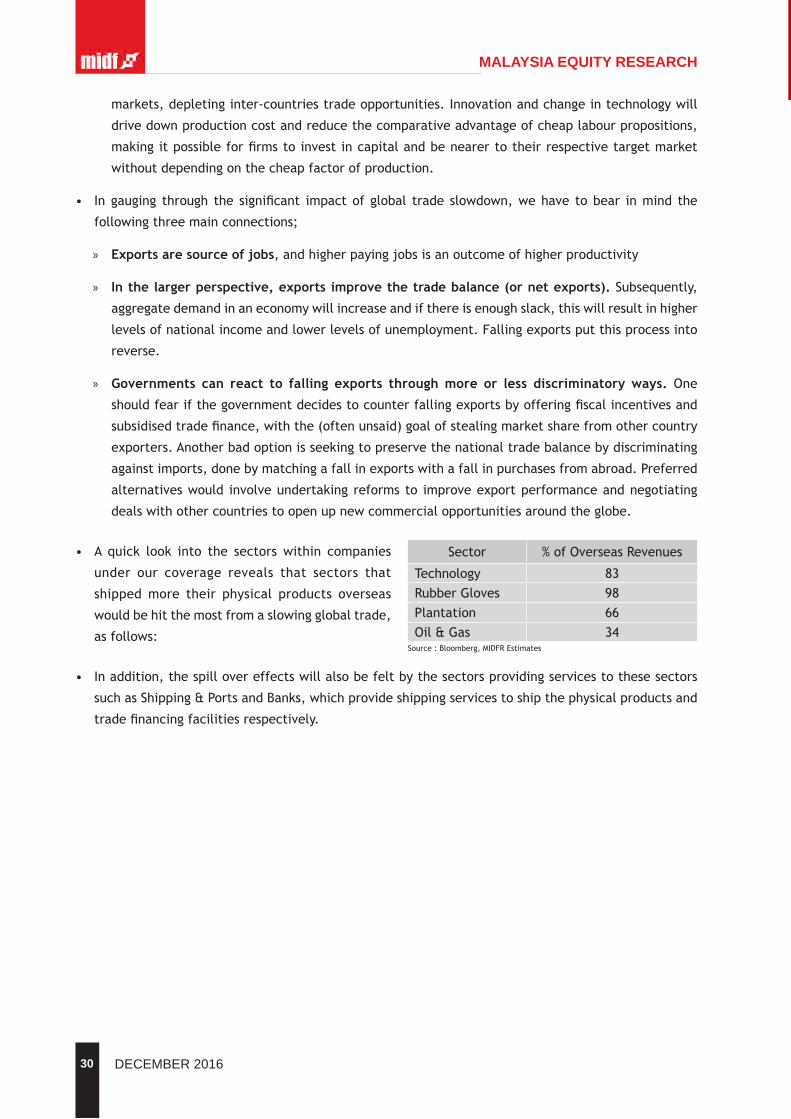
• A quick look into the sectorswithin companies
under our coverage reveals that sectors that
shippedmore their physical products overseas
wouldbehitthemostfromaslowingglobaltrade,
asfollows:
• Inaddition,thespillovereffectswillalsobefeltbythesectorsprovidingservicestothesesectors
suchasShipping&PortsandBanks,whichprovideshippingservicestoshipthephysicalproductsand
tradefinancingfacilitiesrespectively.
Sector %ofOverseasRevenues
Technology 83RubberGloves 98Plantation 66Oil&Gas 34
Source:Bloomberg,MIDFREstimates
31DECEMBER 2016
MALAYSIA EQUITY RESEARCHC. SECTORAL VIEW
I. AVIATION (TRANSPORTATION)Allgearedupforanexciting4QFY16 ............................................................ POSITIVE
• Recordhighloadfactorsexpectedin4QFY16.SeveralfactorshaveledtostrongdemandfortravelincludingaweakerRinggithelpinginboundtourists,areturnofChinesetouristsinFY16aswellasdirectinternationalflightsfromsecondarycities,i.e.KK,LangkawiandKuching.MalaysiaAirasialoggeda9MFY16loadfactorof89%whichwasaGrouprecord.However,thiswillbeshort-livedasOct-Novloadshavealreadyhit93%andwillonlygetbetterinDecember.Meanwhile,AAXisexpectedtorecordloadfactorsabove80%in4QFY16despiteaddingmorethan20%incapacity.WemaintainourBUYcallsonbothAirAsia(BUY,TP:RM3.45)andAAX(BUY,TP:RM0.50).
• More details on the sale of Asia Aviation Capital (AAC) in 4QFY16.Airasiahighlightedthatithasreceived8non-bindingbidsforfullownershipinAACand1foran80%stake.BidderswouldbeallowedtoconductduediligenceonAAC’sinDecemberwhilethedealistargetedtobeconcludedinApril2017.Weareincreasinglyoptimisticonthepotentialforspecialdividendsasthedealdrawsnearertoapossibleconclusion.Recallthatadivestmentofa70-80%stakeinAirasia’sleasingarmcouldtranslateintoproceedsofRM2.9b-RM3.3b(RM1.04-RM1.19pershare)whichcouldbeusedtoparedebts,fundfutureexpansionandbepaidoutasspecialdividends.
• Concerns on the Ringgit’s slide could be overblown. Airasia’ssharepricehascorrectedby21%fromitshighofRM3.20inAugust.WebelievethattheselldowncouldhavestemmedfromtheRinggitlosinggroundagainstthegreenback.However,wearenottooconcernedaboutthefallingRinggitasAirasia’sunhedgedexposuretoUSDforitsborrowingsandexpensesarecappedat33%and50%respectively.Inaddition,Oct-Nov2016averageUSD/MYRexchangeratestandsat4.23,stillbelowthe4.28recordedin4QFY15whichsawAirasiarecordingcorenetprofitofRM464m.
• 10MFY16trafficgrowthatMalaysianairportsof+5.4%yoyexceededourforecastof+4%yoy.Weexpectpaxtraffictocontinuetoperformwellinthefinal2monthsof2016duetotheschoolholidayperiod.Trafficgrowthwasunderpinnedbyairlinecapacityexpansions,namelyMalindoandAAX.KLIAmainterminalbuilding(MTB)sawstronggrowthof+34.2%yoyinOctober(ytd:+9%yoy)duetoMABresumingitscapacityexpansionafterayearofcuts.Meanwhile,MTB’sgrowthwasalsoaidedbyMalindoshiftingitsoperationsandexpanding.DespiteKLIA2losingMalindotoMTB,AirasiaandAAXwereabletofillinthevoid,registeringyear-to-datepaxgrowthof+4.7%yoyinKLIA2.
• PSC revision neutral on MAHB’s earnings asourcalculationsindicatethatPSCrevenuecouldseeonlyaminornetincreaseof+1.1%(+RM61.5m)basedonFY16FPSCrevenue.OurestimateisderivedbymultiplyingthechangeinPSCratesagainstdeparturesbyairports(KLIA,KLIA2andotherairports)aswellasdestination(ASEAN,Non-ASEANanddomestic).Also,weassumethatthereisafairchance(50%)thatMAHBcouldnegotiatewiththegovernmenttobecompensatedbyMARCSastherevisedPSCrateforASEANatKLIAandotherairportsofRM35wouldbesignificantlylowerthantheRM71stated
initsoperatingagreement.Hence,wehaveaBUYcallonMAHBwithTPofRM7.60.
II. CONSTRUCTIONTimes of sturdy growth ............................................................................. POSITIVE
• 4keydriverswillinfluencepositiveimpactforthesector.Infrastructurelargessefromthestrongneed
ofpubliclandtransportisexpectedtohousingandimpacttheconstructionsectorinFY17favourably.
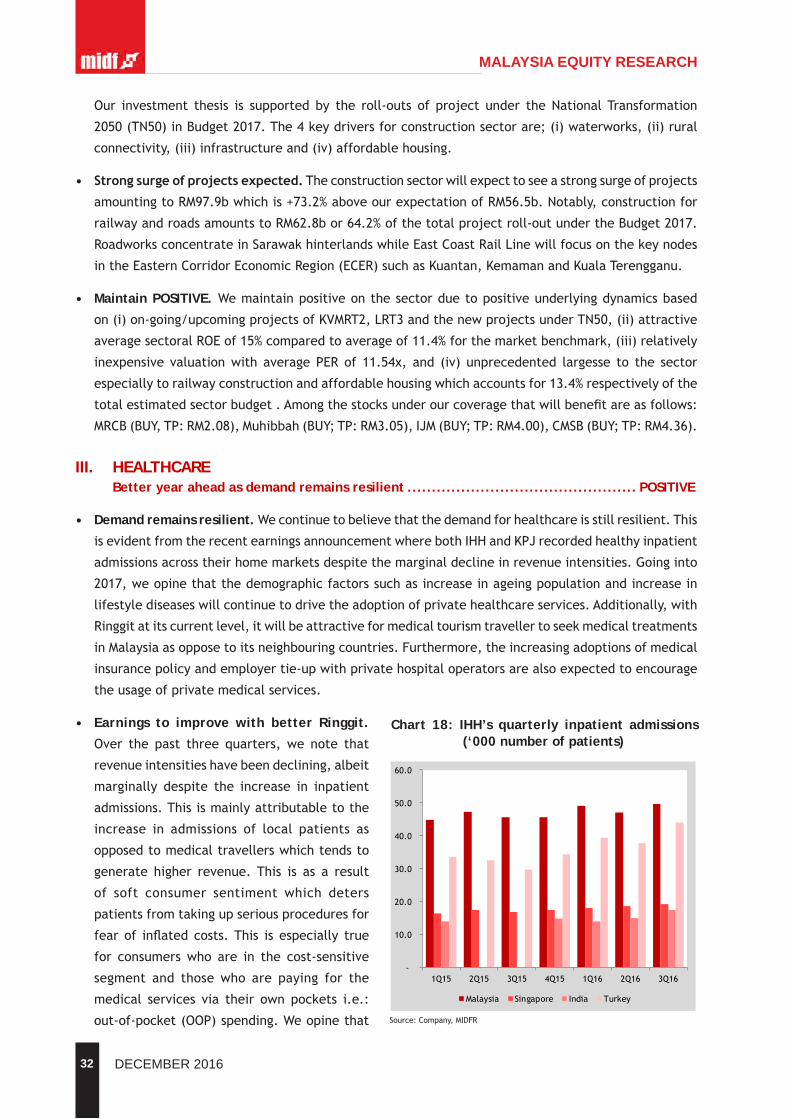
32 DECEMBER 2016
MALAYSIA EQUITY RESEARCH
Our investment thesis is supported by the roll-outs of project under theNationalTransformation
2050(TN50)inBudget2017.The4keydriversforconstructionsectorare;(i)waterworks,(ii)rural
connectivity,(iii)infrastructureand(iv)affordablehousing.
• Strongsurgeofprojectsexpected.Theconstructionsectorwillexpecttoseeastrongsurgeofprojects
amountingtoRM97.9bwhichis+73.2%aboveourexpectationofRM56.5b.Notably,constructionfor
railwayandroadsamountstoRM62.8bor64.2%ofthetotalprojectroll-outundertheBudget2017.
RoadworksconcentrateinSarawakhinterlandswhileEastCoastRailLinewillfocusonthekeynodes
intheEasternCorridorEconomicRegion(ECER)suchasKuantan,KemamanandKualaTerengganu.
• Maintain POSITIVE. Wemaintainpositiveonthesectorduetopositiveunderlyingdynamicsbased
on(i)on-going/upcomingprojectsofKVMRT2,LRT3andthenewprojectsunderTN50,(ii)attractive
averagesectoralROEof15%comparedtoaverageof11.4%forthemarketbenchmark,(iii)relatively
inexpensive valuationwith average PER of 11.54x, and (iv) unprecedented largesse to the sector
especiallytorailwayconstructionandaffordablehousingwhichaccountsfor13.4%respectivelyofthe
totalestimatedsectorbudget.Amongthestocksunderourcoveragethatwillbenefitareasfollows:
MRCB(BUY,TP:RM2.08),Muhibbah(BUY;TP:RM3.05),IJM(BUY;TP:RM4.00),CMSB(BUY;TP:RM4.36).
III. HEALTHCAREBetter year ahead as demand remains resilient ............................................... POSITIVE
• Demand remains resilient. Wecontinuetobelievethatthedemandforhealthcareisstillresilient.This
isevidentfromtherecentearningsannouncementwherebothIHHandKPJrecordedhealthyinpatient
admissionsacrosstheirhomemarketsdespitethemarginaldeclineinrevenueintensities.Goinginto
2017,weopinethatthedemographicfactorssuchasincreaseinageingpopulationandincreasein
lifestylediseaseswillcontinuetodrivetheadoptionofprivatehealthcareservices.Additionally,with
Ringgitatitscurrentlevel,itwillbeattractiveformedicaltourismtravellertoseekmedicaltreatments
inMalaysiaasopposetoitsneighbouringcountries.Furthermore,theincreasingadoptionsofmedical
insurancepolicyandemployertie-upwithprivatehospitaloperatorsarealsoexpectedtoencourage
theusageofprivatemedicalservices.
• Earnings to improve with better Ringgit.
Over the past three quarters,we note that
revenueintensitieshavebeendeclining,albeit
marginally despite the increase in inpatient
admissions.Thisismainlyattributabletothe
increase in admissions of local patients as
opposedtomedicaltravellerswhichtendsto
generate higher revenue.This is as a result
of soft consumer sentiment which deters
patientsfromtakingupseriousproceduresfor
fear of inflated costs.This is especially true
for consumerswho are in the cost-sensitive
segment and thosewho are paying for the
medical services via their own pockets i.e.:
out-of-pocket(OOP)spending.Weopinethat
Chart 18: IHH’s quarterly inpatient admissions (‘000 number of patients)
Source:Company,MIDFR
-
10.0
20.0
30.0
40.0
50.0
60.0
1Q15 2Q15 3Q15 4Q15 1Q16 2Q16 3Q16
Malaysia Singapore India Turkey
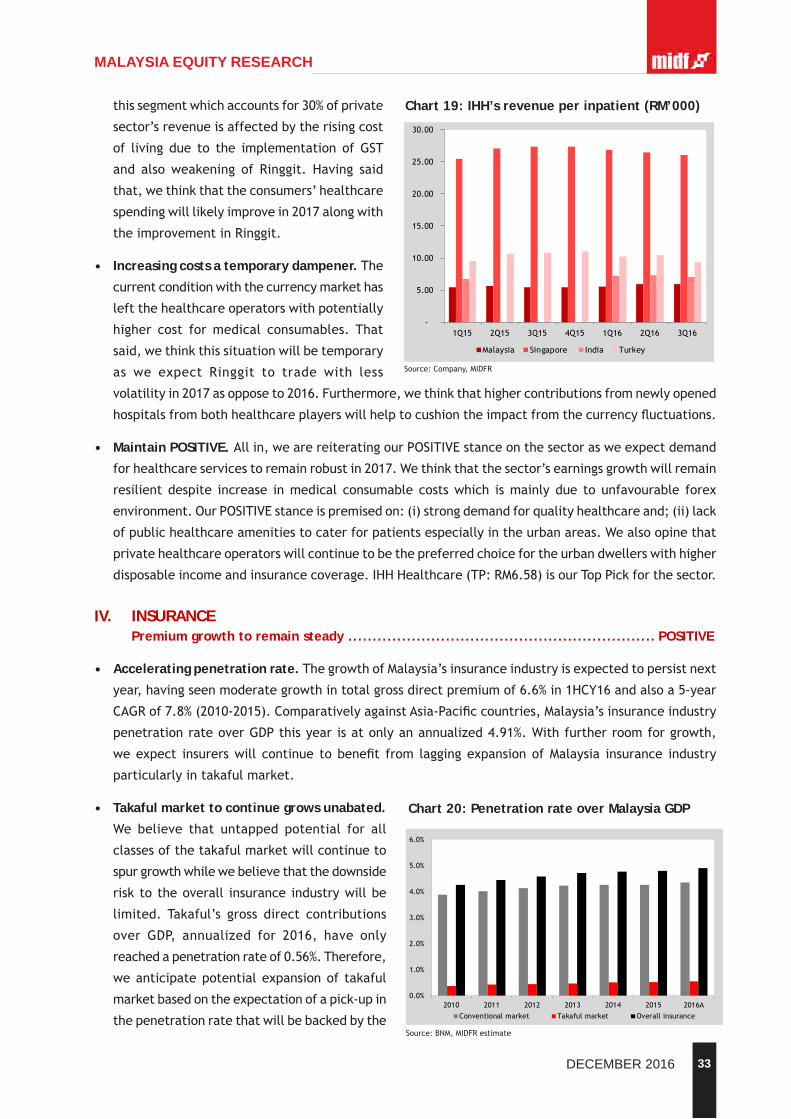
33DECEMBER 2016
MALAYSIA EQUITY RESEARCH
thissegmentwhichaccountsfor30%ofprivate
sector’srevenueisaffectedbytherisingcost
of living due to the implementation ofGST
and alsoweakening of Ringgit. Having said
that,wethinkthattheconsumers’healthcare
spendingwilllikelyimprovein2017alongwith
theimprovementinRinggit.
• Increasing costs a temporary dampener.The
currentconditionwiththecurrencymarkethas
leftthehealthcareoperatorswithpotentially
higher cost formedical consumables. That
said,wethinkthissituationwillbetemporary
as we expect Ringgit to trade with less
volatilityin2017asopposeto2016.Furthermore,wethinkthathighercontributionsfromnewlyopened
hospitalsfrombothhealthcareplayerswillhelptocushiontheimpactfromthecurrencyfluctuations.
• Maintain POSITIVE. Allin,wearereiteratingourPOSITIVEstanceonthesectorasweexpectdemand
forhealthcareservicestoremainrobustin2017.Wethinkthatthesector’searningsgrowthwillremain
resilientdespite increase inmedical consumable costswhich ismainlydue tounfavourable forex
environment.OurPOSITIVEstanceispremisedon:(i)strongdemandforqualityhealthcareand;(ii)lack
ofpublichealthcareamenitiestocaterforpatientsespeciallyintheurbanareas.Wealsoopinethat
privatehealthcareoperatorswillcontinuetobethepreferredchoicefortheurbandwellerswithhigher
disposableincomeandinsurancecoverage.IHHHealthcare(TP:RM6.58)isourTopPickforthesector.
IV. INSURANCEPremium growth to remain steady ............................................................... POSITIVE
• Accelerating penetration rate.ThegrowthofMalaysia’sinsuranceindustryisexpectedtopersistnext
year,havingseenmoderategrowthintotalgrossdirectpremiumof6.6%in1HCY16andalsoa5-year
CAGRof7.8%(2010-2015).ComparativelyagainstAsia-Pacificcountries,Malaysia’sinsuranceindustry
penetrationrateoverGDPthisyearisatonlyanannualized4.91%.Withfurtherroomforgrowth,
weexpect insurerswill continue tobenefit from laggingexpansionofMalaysia insurance industry
particularlyintakafulmarket.
• Takaful market to continue grows unabated.
We believe that untapped potential for all
classesofthetakafulmarketwillcontinueto
spurgrowthwhilewebelievethatthedownside
risktotheoverall insurance industrywillbe
limited. Takaful’s gross direct contributions
over GDP, annualized for 2016, have only
reachedapenetrationrateof0.56%.Therefore,
weanticipatepotentialexpansionof takaful
marketbasedontheexpectationofapick-upin
thepenetrationratethatwillbebackedbythe
Chart 20: Penetration rate over Malaysia GDP
Source:BNM,MIDFRestimate
0.0%
1.0%
2.0%
3.0%
4.0%
5.0%
6.0%
2010 2011 2012 2013 2014 2015 2016AConventionalmarket Takafulmarket Overallinsurance
Chart 19: IHH’s revenue per inpatient (RM’000)
Source:Company,MIDFR
-
5.00
10.00
15.00
20.00
25.00
30.00
1Q15 2Q15 3Q15 4Q15 1Q16 2Q16 3Q16
Malaysia Singapore India Turkey
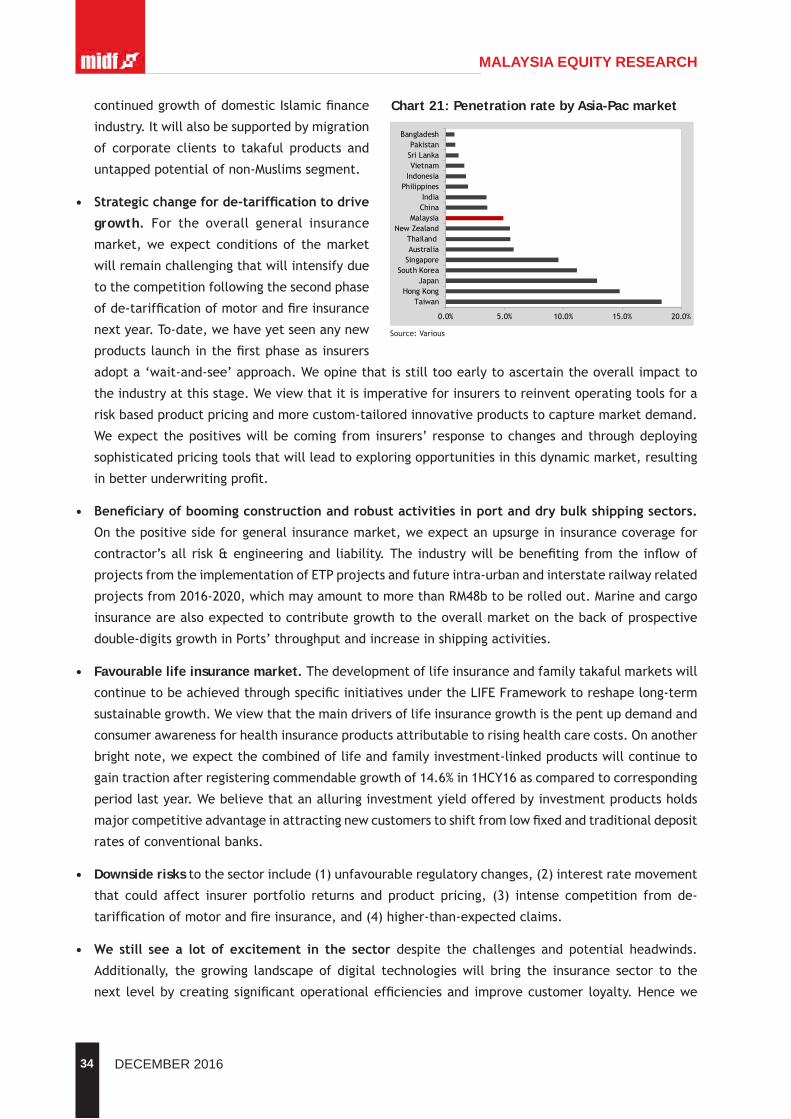
34 DECEMBER 2016
MALAYSIA EQUITY RESEARCH
continuedgrowthofdomesticIslamicfinance
industry.Itwillalsobesupportedbymigration
of corporate clients to takaful products and
untappedpotentialofnon-Muslimssegment.
• Strategicchangeforde-tarifficationtodrive
growth. For the overall general insurance
market,weexpect conditionsof themarket
willremainchallengingthatwillintensifydue
tothecompetitionfollowingthesecondphase
ofde-tarifficationofmotorandfireinsurance
nextyear.To-date,wehaveyetseenanynew
productslaunchinthefirstphaseasinsurers
adopta‘wait-and-see’approach.Weopinethatisstilltooearlytoascertaintheoverallimpactto
theindustryatthisstage.Weviewthatitisimperativeforinsurerstoreinventoperatingtoolsfora
riskbasedproductpricingandmorecustom-tailoredinnovativeproductstocapturemarketdemand.
Weexpect thepositiveswillbecoming from insurers’ responsetochangesandthroughdeploying
sophisticatedpricingtoolsthatwillleadtoexploringopportunitiesinthisdynamicmarket,resulting
inbetterunderwritingprofit.
• Beneficiaryofboomingconstructionandrobustactivitiesinportanddrybulkshippingsectors.
Onthepositivesideforgeneralinsurancemarket,weexpectanupsurgeininsurancecoveragefor
contractor’sall risk&engineeringand liability.The industrywillbebenefiting fromthe inflowof
projectsfromtheimplementationofETPprojectsandfutureintra-urbanandinterstaterailwayrelated
projectsfrom2016-2020,whichmayamounttomorethanRM48btoberolledout.Marineandcargo
insurancearealsoexpectedtocontributegrowthtotheoverallmarketonthebackofprospective
double-digitsgrowthinPorts’throughputandincreaseinshippingactivities.
• Favourable life insurance market. Thedevelopmentoflifeinsuranceandfamilytakafulmarketswill
continuetobeachievedthroughspecificinitiativesundertheLIFEFrameworktoreshapelong-term
sustainablegrowth.Weviewthatthemaindriversoflifeinsurancegrowthisthepentupdemandand
consumerawarenessforhealthinsuranceproductsattributabletorisinghealthcarecosts.Onanother
brightnote,weexpectthecombinedoflifeandfamilyinvestment-linkedproductswillcontinueto
gaintractionafterregisteringcommendablegrowthof14.6%in1HCY16ascomparedtocorresponding
periodlastyear.Webelievethatanalluringinvestmentyieldofferedbyinvestmentproductsholds
majorcompetitiveadvantageinattractingnewcustomerstoshiftfromlowfixedandtraditionaldeposit
ratesofconventionalbanks.
• Downside risks tothesectorinclude(1)unfavourableregulatorychanges,(2)interestratemovement
that could affect insurer portfolio returns and product pricing, (3) intense competition fromde-
tarifficationofmotorandfireinsurance,and(4)higher-than-expectedclaims.
• We still see a lot of excitement in the sector despite the challenges and potential headwinds.
Additionally, the growing landscape of digital technologieswill bring the insurance sector to the
next levelbycreatingsignificantoperationalefficienciesand improvecustomer loyalty.Hencewe
Chart 21: Penetration rate by Asia-Pac market
Source:Various
0.0% 5.0% 10.0% 15.0% 20.0%
TaiwanHongKong
JapanSouthKoreaSingaporeAustraliaThailand
NewZealandMalaysia
ChinaIndia
PhilippinesIndonesiaVietnamSriLankaPakistan
Bangladesh

35DECEMBER 2016
MALAYSIA EQUITY RESEARCH
maintainourPOSITIVErecommendationonthesector.WereiterateourBUYcallsforallinsurance/
takafulcompaniesunderourcoverageuniverse,namelySyarikatTakafulMalaysia(BUY,TP:RM4.84),
LPICapital(BUY,TP:RM17.84),andTuneProtect(BUY,TP:RM2.18).
V. OIL AND GAS Opportunities in the midst of challenges ........................................................ POSITIVE
(Downstream positive, Upstream negative)
• Oil price review. Brent crude oil prices in
2016 were volatile, trading between the
low of USD27.88pb in January to a high of
USD55pbinDecember.Theyearaverageisat
USD45pb, in-linewith our forecastsmade in
early2016.Movingforward,weareexpecting
prices to remain volatile, averaging higher
at approximately USD50pb in 2017. Despite
accordshavebeenreachedtolimitthesupply
ofcrudeoilfromOPECmembercountries,the
actualproductioncutremainstobeseen–both
Iranand Iraqhavebeenproducingat record
highatover90%oftheirproductioncapacity.In
addition,therecentlyagreedproductionceiling
isonlyfortheperiodofsixmonthsandnofirm
figureshavebeenset.Assuch,downsiderisks
toglobalcrudeoilpricesremain.
• CAPEXexpectationsfromoilmajors.In2016,
capitalexpenditure(CAPEX)formajorglobal
oil and gas producers including independent
exploration and production companies had
declinedbycloseto-30%yoy.In2017however,
theoutlookremainsrosierasCAPEXisexpected
topickuppacebyahumble+2.8%.Locally,
CAPEX from PETRONAS had been waning,
similar to global trend. In 2016, PETRONAS’
CAPEX is expected to be at approximately
RM45-50b,asignificantdeclinecomparedwith
thatof2015and2014atRM64.7bandRM71b
respectively. InFY17,CAPEXbyPETRONASis
expectedtohoveratlevelsseenin2016asthe
bulkofCAPEXwillbededicatedtowardsRAPID
inPengerang,Johor.
• Offshore assets and vessel charter rates.
Large offshore asset utilisation rates and
Chart23:PETRONASCapitalExpenditure
Source:PETRONAS
45.6
56.6
71.064.7
40.0 40.0
0
10
20
30
40
50
60
70
80
2012 2013 2014 2015 2016E 2017F
Chart 24: South East Asia Jackup Rates
Source:IHS
0
20
40
60
80
100
120
140
160
180
Jan-13 Jul-13 Jan-14 Jul-14 Jan-15 Jul-15 Jan-16 Jul-16
Chart 22: Brent Crude Oil Price
Source:Bloomberg
0
20
40
60
80
100
120
140
Jan-14 May-14 Sep-14 Jan-15 May-15 Sep-15 Jan-16 May-16 Sep-16
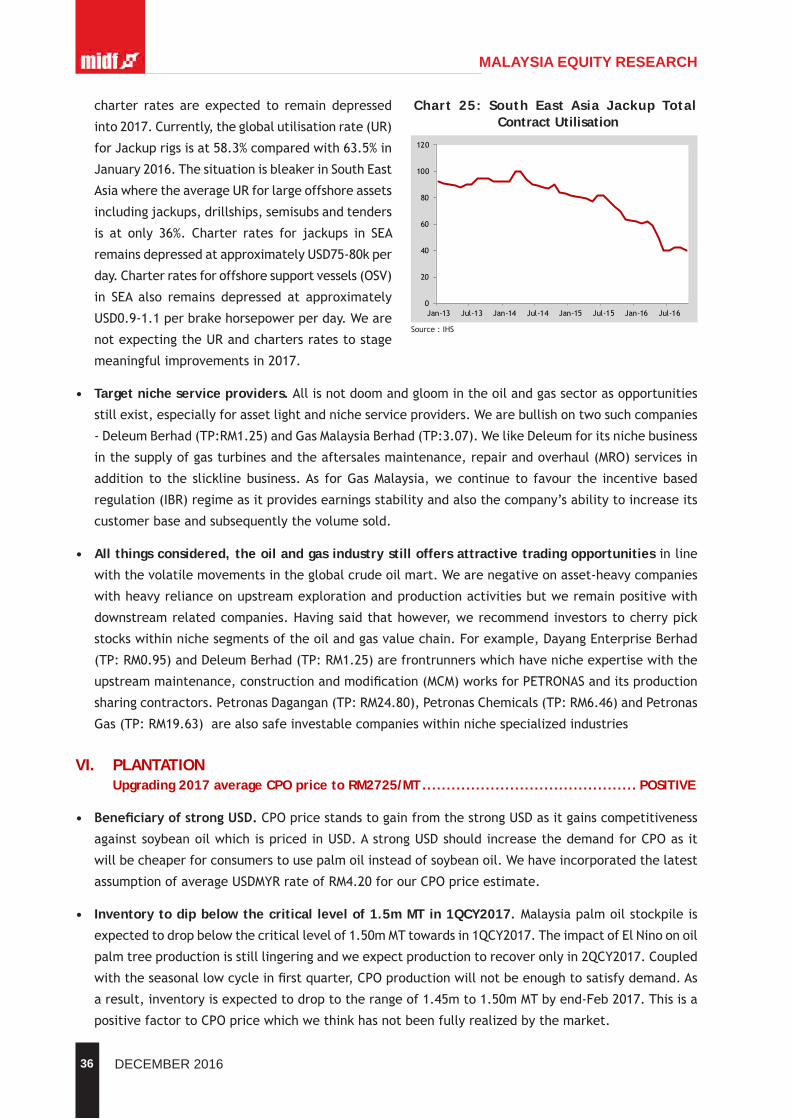
36 DECEMBER 2016
MALAYSIA EQUITY RESEARCH
charter rates are expected to remain depressed
into2017.Currently,theglobalutilisationrate(UR)
forJackuprigsisat58.3%comparedwith63.5%in
January2016.ThesituationisbleakerinSouthEast
AsiawheretheaverageURforlargeoffshoreassets
includingjackups,drillships,semisubsandtenders
is at only 36%. Charter rates for jackups in SEA
remainsdepressedatapproximatelyUSD75-80kper
day.Charterratesforoffshoresupportvessels(OSV)
in SEA also remains depressed at approximately
USD0.9-1.1perbrakehorsepowerperday.Weare
notexpectingtheURandchartersratestostage
meaningfulimprovementsin2017.
• Target niche service providers.Allisnotdoomandgloomintheoilandgassectorasopportunities
stillexist,especiallyforassetlightandnicheserviceproviders.Wearebullishontwosuchcompanies
-DeleumBerhad(TP:RM1.25)andGasMalaysiaBerhad(TP:3.07).WelikeDeleumforitsnichebusiness
inthesupplyofgasturbinesandtheaftersalesmaintenance,repairandoverhaul(MRO)servicesin
addition to the slicklinebusiness.As forGasMalaysia,wecontinue to favour the incentivebased
regulation(IBR)regimeasitprovidesearningsstabilityandalsothecompany’sabilitytoincreaseits
customerbaseandsubsequentlythevolumesold.
• All things considered, the oil and gas industry still offers attractive trading opportunitiesinline
withthevolatilemovementsintheglobalcrudeoilmart.Wearenegativeonasset-heavycompanies
withheavyrelianceonupstreamexplorationandproductionactivitiesbutweremainpositivewith
downstreamrelatedcompanies.Havingsaidthathowever,werecommendinvestorstocherrypick
stockswithinnichesegmentsoftheoilandgasvaluechain.Forexample,DayangEnterpriseBerhad
(TP:RM0.95)andDeleumBerhad(TP:RM1.25)arefrontrunnerswhichhavenicheexpertisewiththe
upstreammaintenance,constructionandmodification(MCM)worksforPETRONASanditsproduction
sharingcontractors.PetronasDagangan(TP:RM24.80),PetronasChemicals(TP:RM6.46)andPetronas
Gas(TP:RM19.63)arealsosafeinvestablecompanieswithinnichespecializedindustries
VI. PLANTATIONUpgrading 2017 average CPO price to RM2725/MT ............................................ POSITIVE
• BeneficiaryofstrongUSD.CPOpricestandstogainfromthestrongUSDasitgainscompetitiveness
againstsoybeanoilwhichispricedinUSD.AstrongUSDshouldincreasethedemandforCPOasit
willbecheaperforconsumerstousepalmoilinsteadofsoybeanoil.Wehaveincorporatedthelatest
assumptionofaverageUSDMYRrateofRM4.20forourCPOpriceestimate.
• Inventory to dip below the critical level of 1.5m MT in 1QCY2017.Malaysiapalmoilstockpileis
expectedtodropbelowthecriticallevelof1.50mMTtowardsin1QCY2017.TheimpactofElNinoonoil
palmtreeproductionisstilllingeringandweexpectproductiontorecoveronlyin2QCY2017.Coupled
withtheseasonallowcycleinfirstquarter,CPOproductionwillnotbeenoughtosatisfydemand.As
aresult,inventoryisexpectedtodroptotherangeof1.45mto1.50mMTbyend-Feb2017.Thisisa
positivefactortoCPOpricewhichwethinkhasnotbeenfullyrealizedbythemarket.
Chart 25: South East Asia Jackup Total Contract Utilisation
Source:IHS
0
20
40
60
80
100
120
Jan-13 Jul-13 Jan-14 Jul-14 Jan-15 Jul-15 Jan-16 Jul-16

37DECEMBER 2016
MALAYSIA EQUITY RESEARCH
• US record high biofuel mandate is positive for CPO price. Recently,UnitedStateshasincreasedits
biofuelmandateby6%to19.28bgallonsin2017whichisanewrecord.Thenewshascausedsoybean
oilpricetosurgeintheChicagoBoardofTrade(CBOT)market.Notethatsoybeanoilisthemaininput
usedtoproducebiofuelintheUS.InAugust-2016,54%ofthetotalinputusedtoproducebiofuelin
UScamefromsoybeanoil.ThenewsispositivetoCPOpriceasitisusedasacommonsubstituteto
soybeanoil.
• Maintain POSITIVE view on the sector. InlinewithhigherCPOpriceassumption,wehaveincreased
ourearningsassumptionforFY16andFY17forallplantersunderourcoverage.Accordingly,ourTarget
PricehasbeenincreasedforallplantersexceptFGVwhichismaintainedasweareusing1.0xPrice
toBookValuemethod.ForPPB,wearechangingourvaluationmethodto1.0xPriceToBookValueas
wenoticedthatthestockpricestabilityreflectsitsBookValueratherthanthevolatileearningsof
theCompany.
Chart 27: Relationship between USDMYR and CPO price
Source:Bloomberg,MIDFR
2.0
2.5
3.0
3.5
4.0
4.5
5.0
1,500
1,700
1,900
2,100
2,300
2,500
2,700
2,900
3,100
3,300
Dec-12 May-13 Oct-13 Feb-14 Jul-14 Dec-14 Apr-15 Sep-15 Jan-16 Jun-16 Oct-16
CPOPrice,RM USDMYR
Chart 26: Relationship between CPO price and inventory
Source:MPOB,MIDFR
1000
1500
2000
2500
3000
3500
1500
1700
1900
2100
2300
2500
2700
2900
3100
3300
Dec-12 Jun-13 Nov-13 Apr-14 Oct-14 Mar-15 Aug-15 Jan-16 Jul-16
CPO Price, RM Inventory ('000 MT)
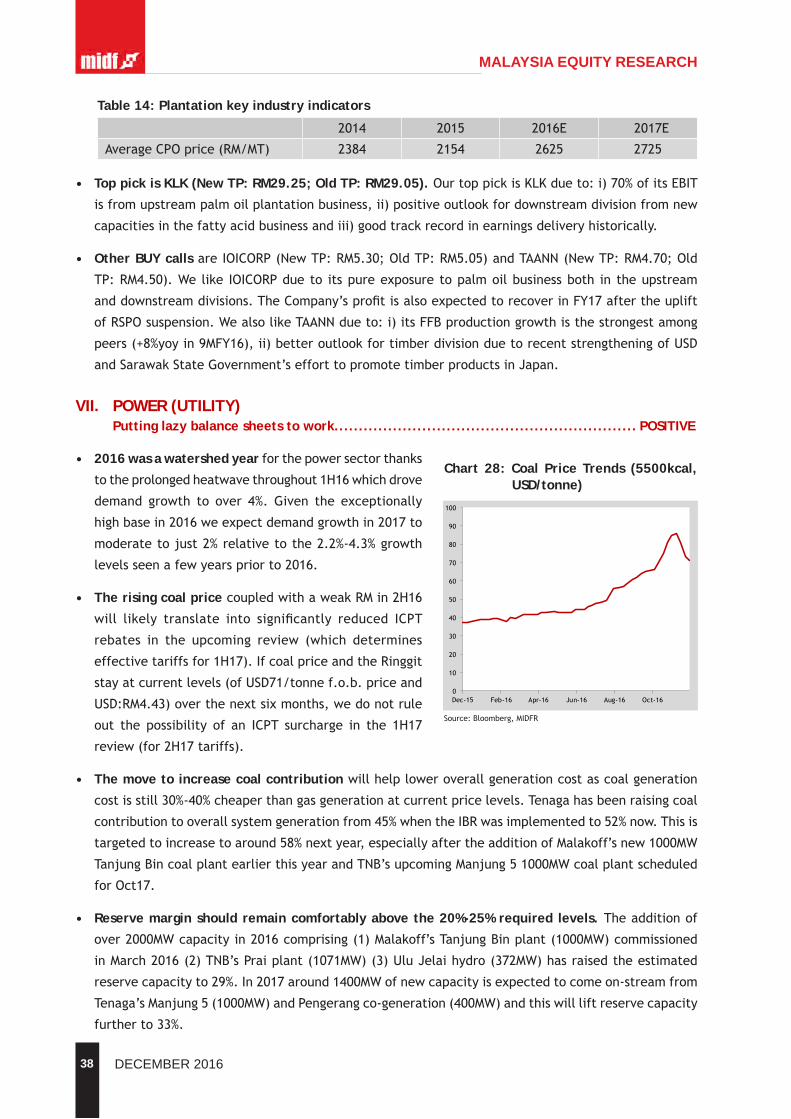
38 DECEMBER 2016
MALAYSIA EQUITY RESEARCH
• Top pick is KLK (New TP: RM29.25; Old TP: RM29.05). OurtoppickisKLKdueto:i)70%ofitsEBIT
isfromupstreampalmoilplantationbusiness,ii)positiveoutlookfordownstreamdivisionfromnew
capacitiesinthefattyacidbusinessandiii)goodtrackrecordinearningsdeliveryhistorically.
• Other BUY callsareIOICORP(NewTP:RM5.30;OldTP:RM5.05)andTAANN(NewTP:RM4.70;Old
TP:RM4.50).We like IOICORPdueto itspureexposuretopalmoilbusinessboth intheupstream
anddownstreamdivisions.TheCompany’sprofitisalsoexpectedtorecoverinFY17aftertheuplift
ofRSPOsuspension.WealsolikeTAANNdueto:i)itsFFBproductiongrowthisthestrongestamong
peers(+8%yoyin9MFY16),ii)betteroutlookfortimberdivisionduetorecentstrengtheningofUSD
andSarawakStateGovernment’sefforttopromotetimberproductsinJapan.
VII. POWER (UTILITY)Putting lazy balance sheets to work.............................................................. POSITIVE
• 2016 was a watershed yearforthepowersectorthanks
totheprolongedheatwavethroughout1H16whichdrove
demand growth to over 4%. Given the exceptionally
highbasein2016weexpectdemandgrowthin2017to
moderatetojust2%relativetothe2.2%-4.3%growth
levelsseenafewyearspriorto2016.
• The rising coal price coupledwithaweakRMin2H16
will likely translate into significantly reduced ICPT
rebates in the upcoming review (which determines
effectivetariffsfor1H17).IfcoalpriceandtheRinggit
stayatcurrentlevels(ofUSD71/tonnef.o.b.priceand
USD:RM4.43)overthenextsixmonths,wedonotrule
out the possibility of an ICPT surcharge in the 1H17
review(for2H17tariffs).
• The move to increase coal contributionwillhelploweroverallgenerationcostascoalgeneration
costisstill30%-40%cheaperthangasgenerationatcurrentpricelevels.Tenagahasbeenraisingcoal
contributiontooverallsystemgenerationfrom45%whentheIBRwasimplementedto52%now.Thisis
targetedtoincreasetoaround58%nextyear,especiallyaftertheadditionofMalakoff’snew1000MW
TanjungBincoalplantearlierthisyearandTNB’supcomingManjung51000MWcoalplantscheduled
forOct17.
• Reserve margin should remain comfortably above the 20%-25% required levels. Theadditionof
over2000MWcapacityin2016comprising(1)Malakoff’sTanjungBinplant(1000MW)commissioned
inMarch2016(2)TNB’sPraiplant(1071MW)(3)UluJelaihydro(372MW)hasraisedtheestimated
reservecapacityto29%.In2017around1400MWofnewcapacityisexpectedtocomeon-streamfrom
Tenaga’sManjung5(1000MW)andPengerangco-generation(400MW)andthiswillliftreservecapacity
furtherto33%.
Table 14: Plantation key industry indicators
2014 2015 2016E 2017E
AverageCPOprice(RM/MT) 2384 2154 2625 2725
Chart 28: Coal Price Trends (5500kcal, USD/tonne)
Source:Bloomberg,MIDFR
0
10
20
30
40
50
60
70
80
90
100
Dec-15 Feb-16 Apr-16 Jun-16 Aug-16 Oct-16

39DECEMBER 2016
MALAYSIA EQUITY RESEARCH
• Balance sheets are underutilized.Allthelocalpowerplayersaresittingonstrongbalancesheets,
i.e.lownetgearingof0.35x-1.20xrelativetoregionalaverageof1.5x.Tenagainfact,isoneof
themostunderleveragedamongregionalpeersatjust0.35xnetdebt-to-equity.Thispositionsthe
localpowersectorstrategicallytocapitalizeonacquisitionorexpansionopportunitiesthatmayarise
inthecurrentdowncycle,particularlyoverseas.Wealsoseescopefordividendupside-besidesan
underleveragedbalancesheet;TenagaentailsstrongFCFyieldsof6%-7%(FY16F)whileYTLPower
entailsFCFyieldsofupto13%(FY17F).
• Key sector catalysts: (1)Playersaresittingonunderutilizedbalancesheets,particularlyTenaga.Akey
focuswillbefinalizationofTenaga’scapitaloptimizationplansoon(whichwillpaintbetterclarityon
Tenaga’snewdividendpolicy)andtheoutcomeoflegalproceedingsonitsRM2.1btaxissuewiththe
IRBwhichhasbeenanoverhangingconcern.(2)Regionalexpansiononthecardsforplayersi.e.Tenaga
isonthelookoutforregionalopportunitiesafterhavingacquiredGMREnergy(India)andGAMAEnerji
(Turkey)thisyearwhileYTLPower’sexpansionofitsIndonesianoperationsviaTanjungJatibodeswell
duetodiminishingreturnsinMalaysianpowergeneration.
• We maintain POSITIVE on the power sector. Tenaga (BUY,TP: RM16.80/share) is our top sector
pick.Keycatalystsoverthenext12months:(1)DividendcatalystonthebackofFCFyieldof~7%
(FY16F/17F),anunder-gearedbalancesheetandacapitaloptimizationexercisetobefinalizedbyend
CY16,(2)Overseasexpansionprovidesscopeforstrongergrowthandbetterreturnsinthemid-term,
(3)Strongearningsvisibilitypost-ICPTimplementation,(4)ResolutionofTenaga’sRM2btaxdispute
withtheInlandRevenueBoard.
• We remain NEUTRAL on YTL Power (TP: RM1.40/share) given: (1) Continuous delays in the PPA
extensionforits585MWPakaplant-legalproceedingbetweenTNBandtheEnergyCommissionwill
draginto2017onthis,(2)OvercapacityintheSingaporemarketimpactingPowerSerayanegatively
-thesituationhasstabilizedbutrecoverycouldbesomewayout,(3)PotentialdragfromYES4G’s
initiallosses.However,dividendyieldsareveryattractiveat6%-7%(FY17F-18F,FYEJune).
Table 15: Pipeline of new power projects
PowerProjects Fuel Capacity(MW) Operationdate
Pengerangco-generation Gas 400 Jun-17
TNBManjungFive Coal 1,000 Oct-17
AdditionalChenderoh Hydro 12 Oct-18
JimahEastPower Coal 2,000 Jun2019(Phase1),Dec2019(Phase2)
Tekai Hydro 156 Dec-20
Project4A(PasirGudang) Gas 1,000 Jan-20
Edra Gas 2,400 Jan-21
Tekai Hydro 168 Jul-21
Telom Hydro 132 Dec-22
Nenggiri hydro 416 Dec-24
Lebir hydro 274 Dec-24Source:EnergyCommission,TNB,MIDFR
40 DECEMBER 2016
MALAYSIA EQUITY RESEARCH
VIII. SHIPPING AND PORT (TRANSPORTATION)
Ports and dry bulk shipping ........................................................................ POSITIVE
• Port Klang throughput growth showing no signs of a slowdown.BothWestportsandNCBgrewby
doubledigits,at+10.1%yoyand+14.2%yoyrespectively.Muchofthegrowthcanbeattributedtothe
Intra-AsiatradelanewhereAseantradehasbeenrobust.Withinthesector,wehaveBUYcallson
Westport(TP:RM5.00)andMMC(TP:RM2.94).
• Shipping alliance route announcements have been promising for Westports. TheOceanAlliancehas
includedWestportsinitsTrans-PacificandAsia-MiddleEastservices,allayingconcernsthatWPRTScould
besnubbedbythemegaallianceinfavourofPortofSingapore(PSA).Meanwhile,WPRTSisstillvying
forOceanAlliance’sAsia-Europe,Asia-MediterraneanandAsia-RedSeaservicesaswellasservicesfor
THEAlliance.WereckonthatWPRTShasadecentchanceofsecuringanumberofportcallswithin
theseservicesduetoitscheapertariffswhileofferingsimilarspeedandefficiency.
• WPRTShasbroughtforwarditsCT9wharfextensionplansinviewof1)Concernsonportcongestion
(utilisationratehasexceeded80%duetohigherthanexpectedgrowth);2)ITAexpirationinFY17
and;3)Inanticipationforfuturerequirementsofshippingcustomers.CT9phase1isscheduledtobe
completebyend-FY17(from:FY18)entailinganadditional0.5mtwenty-foodequivalentunit(TEU)
capacitytoreach14mTEUbyFY17(from:13.5mTEU).
• Seasonal uptick for petroleum and LNG shipping in 4QFY16. Petroleum tanker charter rates in
4QFY16couldimproveasacolderwinterandincreasedrefineryactivityisexpected.MISCcouldbe
wellpositionedtosecurehighertermcharterratesin4QFY16asitstermtospotmixhasfallento
50:50(from60:40).Meanwhile,LNGratescouldalsotrendhigherasdemandforLNGcargopicksup
inJapan,China,ArgentinaandEgyptwitha+9%increaseinimportsalreadywitnessedsinceAugust
2016.Chartersratesshouldholdtheirgroundgoinginto4QFY16asacolderwinterisexpectedinthe
northernhemisphere.WehaveaNEUTRALrecommendationonMISC(TP:RM8.05).
• US infrastructure spending positive on the dry bulk shipping sector. TheBalticDryIndex(BDI)which
measurescharterratesacrossdrybulkshipsizesandrouteshassurgedoverthe1,200levelafter
averagingataround500forthemajorityof1HFY16.TherecentsurgeintheBDIcanbeattributed
toarecentincreaseincoalimportsfromChinaarisingfromlimitsimposedonlocallyproducedcoal
andexpectationsthattheUSwillincreaseinfrastructurespendingwhichrequiresimportofdrybulk
materials.WehaveBUYcallonMaybulkwithtargetpriceofRM1.04basedon5-yearaverageprice-
to-book(PB)ratioof0.88x.
IX. BANKINGCautious optimism for a better year ahead .................................. NEUTRAL (positive bias)
• A challenging 2016… Themainobservationwehavemadeofthebankingindustryin2016istheoverall
cautiousnessofthebanksintermsoflendingactivitiesandensuringstableassetquality.Loansgrowth
hadcomeinshortofourexpectationsthusfar.Forexample,totalloansgrew+4.5%yoyasat31October
2016,downfrom+9.1%yoyregisteredonthesameperiodlastyear.Thiswasduetoslowergrowthinall
sectorsexceptforfinancing,insuranceandbusinessservices.Intermsofassetquality,wehaveseen
aslightuptickin2016.AsatendOctober2016,grossimpairedloans(GIL)ratiocameinat1.65%from
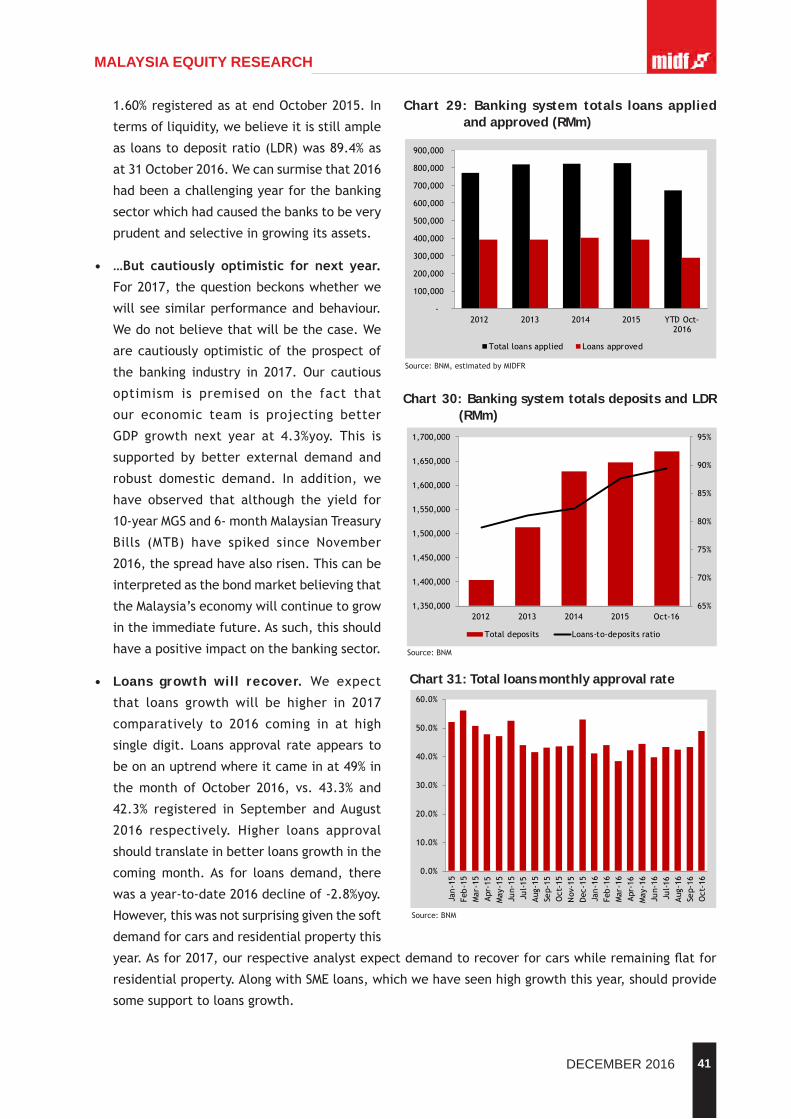
41DECEMBER 2016
MALAYSIA EQUITY RESEARCH
1.60%registeredasatendOctober2015.In
termsofliquidity,webelieveitisstillample
asloanstodepositratio(LDR)was89.4%as
at31October2016.Wecansurmisethat2016
hadbeenachallengingyearforthebanking
sectorwhichhadcausedthebankstobevery
prudentandselectiveingrowingitsassets.
• …But cautiously optimistic for next year.
For2017,thequestionbeckonswhetherwe
willseesimilarperformanceandbehaviour.
Wedonotbelievethatwillbethecase.We
arecautiouslyoptimisticof theprospectof
the banking industry in 2017.Our cautious
optimism is premised on the fact that
our economic team is projecting better
GDP growth next year at 4.3%yoy. This is
supported by better external demand and
robust domestic demand. In addition, we
have observed that although the yield for
10-yearMGSand6-monthMalaysianTreasury
Bills (MTB) have spiked since November
2016,thespreadhavealsorisen.Thiscanbe
interpretedasthebondmarketbelievingthat
theMalaysia’seconomywillcontinuetogrow
intheimmediatefuture.Assuch,thisshould
haveapositiveimpactonthebankingsector.
• Loans growth will recover. We expect
that loans growth will be higher in 2017
comparatively to 2016 coming in at high
singledigit.Loansapproval rateappears to
beonanuptrendwhereitcameinat49%in
themonth of October 2016, vs. 43.3% and
42.3% registered in September andAugust
2016 respectively. Higher loans approval
shouldtranslateinbetterloansgrowthinthe
comingmonth.As for loans demand, there
wasayear-to-date2016declineof-2.8%yoy.
However,thiswasnotsurprisinggiventhesoft
demandforcarsandresidentialpropertythis
year.Asfor2017,ourrespectiveanalystexpectdemandtorecoverforcarswhileremainingflatfor
residentialproperty.AlongwithSMEloans,whichwehaveseenhighgrowththisyear,shouldprovide
somesupporttoloansgrowth.
Chart 29: Banking system totals loans applied and approved (RMm)
Source:BNM,estimatedbyMIDFR
-
100,000
200,000
300,000
400,000
500,000
600,000
700,000
800,000
900,000
2012 2013 2014 2015 YTDOct-2016
Totalloansapplied Loansapproved
Chart 30: Banking system totals deposits and LDR (RMm)
Source:BNM
65%
70%
75%
80%
85%
90%
95%
1,350,000
1,400,000
1,450,000
1,500,000
1,550,000
1,600,000
1,650,000
1,700,000
2012 2013 2014 2015 Oct-16
Totaldeposits Loans-to-depositsratio
Chart 31: Total loans monthly approval rate
Source:BNM
0.0%
10.0%
20.0%
30.0%
40.0%
50.0%
60.0%
Jan-15
Feb-15
Mar-15
Apr-15
May
-15
Jun-15
Jul-15
Aug
-15
Sep-15
Oct-15
Nov-15
Dec
-15
Jan-16
Feb-16
Mar-16
Apr-16
May
-16
Jun-16
Jul-16
Aug
-16
Sep-16
Oct-16
42 DECEMBER 2016
MALAYSIA EQUITY RESEARCH
• No undue concern for asset quality.Weexpectassetqualitytoremainstablein2017.Although,there
wasanuptickof+5bpsyoyinGILratioasatendOctober2016,wearenotoverlyconcerned.Thisis
duetothefactthatGILratiowas1.75%asatendOctober2014.Webasedourassumptionofastable
GILonthefactthatthegrowthinimpairmentsofindividualaccountsmaybewaning.
• Ampleliquidityexpected.Intermsofdeposits,weexpectthatgrowthwillbeslightlybetterthanthe
+2.6yoythatcameinasatendOctober2016.Indeed,intheSeptemberroundofresults,wehavebeen
pleasantlysurprisedwithpaceofdepositsgrowthregisteredbysomebanks.Moreencouragingly,CASA
havegrown+2.8%yoyasatendOctober2016,ensuringastableCASAratioof25.9%,resultinginastable
LDR.LiquiditycoverageratioasatendOctober2016wasabovetheminimum70%at127%.Weexpect
thetrendofCASAgrowth,CASAratioandstableLDRtocontinuein2017.Moreimportantly,itgives
roomforbankstogrowitsloansbookshouldtheeconomicsituationscomesinbetterthanexpected.
• Headwind from NIM compression in 2017.Mainheadwindforthebankingsectorwillbethecontinued
pressuretonetinterestmargin(NIM).WebelievethattheNIMcompressionwillbecomingmainlyfrom
theexpectedOvernightPolicyRatecutin1HCY17,asassumedbyoureconomicsteam.However,we
havenoticedthatthereisnounduecompetitioninpricingofdepositsorloansbythebanks.Thiswill
ensurestabilityofNIMin2017shoulditcontinue.
• Potential write-backs may boost earnings.Intermsofearnings,weexpectsomerecoveryfollowing
from stableoperationsand thewaningof impairments.Weunderstand that thebankshavebeen
activelyrestructuringandrescheduling(R&R)individualloansaccounts.Whiletheseaccountsmaybe
stillperforming,bankswouldstillhavetoimpairtheseR&Rloansaccounts.Hence,thereisapotential
ofwrite-backstoboostearningsin2017.
• Whileweareexpectingbetterperformanceforthesectorin2017,wearecognizantofthepotential
headwindsespeciallyonNIMcompressionandontheslightchanceofassetqualitydeclining.Hence,
aftertakingeverythingintoconsideration,wemaintainourrecommendationofNEUTRALwithapositive
biasforthesector.OurBUYcallsareCIMB(TP:RM5.90),PublicBank(RM22.20),HongLeongBank(TP:
RM15.00)andAffinHoldingsBhd(TP:RM2.50)
X. AUTOMOTIVEStuckinfirstgear ....................................................................................NEUTRAL
• 2016 was a miserable year for autoswithadoublewhammyofweakdemandandaweakRM.Inthis
report,wetrimour2016TIVforecastto576,636units(from593,302unitspreviously)giventheweak
builduptothetypicalyear-endsalescampaigns.Salesupto10M16hasbeenweak(-14%ytd)partly
duetoconsumersholdingbackpurchasesaheadofapick-upinnewlaunchesin2H16andrumorsof
afirstcarbuyerincentivepriortoBudget2017announcement,whichdidnotquitematerializeasit
wasexpectedto.
• Onthebrightside,weexpect2017FTIVtorecoverby2.2%to589,033units,offtheexceptionally
weakbasein2016andconsideringthenationalcarsegment’svolumemodellaunchese.g.Perodua
Bezza,ProtonPersona,ProtonSaga,ProtonErtigatowardsend3Q16and4Q16,whichwillseetheirfull
43DECEMBER 2016
MALAYSIA EQUITY RESEARCH
yearimpactnextyear.Protonspecifically,shouldalsoseethebenefitsoftheGovernment’sRM4,000
rebate for Iriz puchases trickle in next year (for 1st car buyers and forUber-driving purposes as
announcedunderBudget2017).WeexpectProtontoleadTIVgrowthandgainmarketshareto14.6%
nextyearfrom12.4%in2016.
• Volume growth aside, the issue of a weak RM still persists and in fact worsened in 4Q16.Torecap,
theRMweakenedtoUSD:RM4.46post-USelectionsandhasremainedatthislevelsofar.Oureconomics
teamhasrevisedouryear-endRMforecasttoUSD:RM4.35fromUSD:RM4.10previouslywhile2017
year-endforecastnowstandsatUSD:RM4.20.
• Earlier in 2016, key Japanese players, Toyota and Honda raised pricingfortheirmodelsbetween
3%-9%(oranaverageof5%)topartlyoffsetthe25%weakeningoftheRMagainsttheUSDin2015.
Onourpreviousestimatesthepricehikeonlycovers34%oftheincrementalcostfromtheweakerRM.
WiththeRMhavingweakenedafurther9%sincethen,afreshroundofpricehikelooksverylikely.On
topofthis,theJPY-exposedplayers(thatdidnotparticipateintheprevioushike)arelikelytodoso
thistimearoundastheJPYhadalsoappreciated14%againsttheRMinthepast12months.Theprice
hikesmightimpactTIVifitmaterializes.
• WecutourFY17FearningstoreflecthigheraverageUSDassumptionofUSD:RM4.30fromUSD:RM4.00
previouslyfollowingthechangeinoureconomicteam’sforecast.WenowexpectUMWtoregistera
largerFY17FnetlossofRM161mfromRM12mpreviouslyandTanChongtoregisteranRM171mnetloss
fromRM81mpreviously.BermazAutoistheonlyautocompanyundercoverageexpectedtoremain
profitableinCY17FasitsexposuretoJPYimportsislimitedtoCBUmodelsandearningsissupported
byitsboomingPhilippinesunitaswellasexports.Ourprojectionshaveyettofactorinpotentialprice
hikespendingfurtherclarityonthis.
• From a valuation standpoint,mostautostocksunderourcoveragearealreadytradingat5%-50%
discounttoFY17Fbookvaluebuttobefair,forecastriskisstillprettyhighconsideringthevolatile
forexenvironment.Earningsareworsethanthe2008-09crisiswhilemeaningfulupsidecatalystsare
stilllacking.Moreimportantly,balancesheetsaredeterioratingasaresultofthelossesandnegative
cashflows.Autoplayersarebuildingupdebttofinanceworkingcapitalandthebigquestionishowlong
thiscanbesustainedbeforeplayersneedtoresorttoacashcall,whichinturnwilldilutevaluations.
Notwithstandingtheslightrecoveryin2017FTIV,weremainNEUTRALonthesector.
• Tan Chong and UMW remain as NEUTRALsbutTP’scuttoRM1.90andRM5.15fromRM1.95andRM5.30
respectively.OurtopsectorpickisBermazAuto(BUY,TP:RM2.45/share).Keycompany-specificcatalysts
overthenext12months:(1)Attractivedividendyieldof7%underpinnedbynetcashwhichaccounts
for12%ofmarketcapandsolid10%FCFEyield(FY17F).ListingofPhilippinesunitwillbumpyields
upfurthergivenpotentialone-offspecialdividends(SeeBAutoreportdated1stNov2016).(2)Value
unlockingfromthelistingofBAutoPhilippines(BAP).Currentmarketcapattributespracticallynovalue
toBAuto’sstakeinBAPrelativetothe16xindicativeIPOvaluationandhistoricalsectorvaluationof
12x(forMalaysianautos).Ex-cash,BAutotradesatjust9xCY17Fearnings.(3)Amorethandoubling
inassociateearningscontributiontogroup(via30%-ownedMazdaMalaysiaSBand29%-ownedInokom)
givenamassiveexportmarketexpansionwhichwilltripleMMSB’sprospectivemarket.

44 DECEMBER 2016
MALAYSIA EQUITY RESEARCH
XI. CONSUMERCautious outlook going forward ...................................................................NEUTRAL
• Consumersentimentisnotexpectedtoimprovetoameaningfullevel.Consumersentimentindex
(CSI)for3Q16hasmarginallydroppedby-4.9pointstoa73.60.Thisishowever,stillreasonablyhigher
thanthe63.8levelrecordedin4Q15whichisthelowestsince2006.Thedropinconsumersentiment
isattributabletothepessimisticviewofconsumerstowardsthecurrentenvironmentwhichmarked
bythevolatileequitymarket,weakeningRinggitandincreasesinthepricesofgoodsandservices
thathavecutintobuyingpower.WeexpectthatthedropinCSIwillcontinuein4Q16beforeslightly
improvinginFY17.However,wedonotexpectthattheimprovementwillreachtoameaningfullevel.
• Mild effect on consumer spending despite increase disposable income.Thegovernmenthasintroduced
variousmeasuresamongstothersthe3%cutinEPFcontributionfromMarch,theincreaseinminimum
wages from July (RM1,000 for PeninsularMalaysia andRM920 for EastMalaysia) and the increase
inBR1Mpayout(increasesbyRM50toRM150)inBudget2017inordertospurconsumerspending.
Nevertheless,weobservethatduringtheyear,pricesofconsumerstapleshaveincreasedwhichmight
Table 16: TIV Projections for 2016/17F
Source:MAA,MIDFR
2013 2014 2015 2016F 2017F
Proton 138,683 115,783 102,175 71,523 85,827
Perodua 196,071 195,579 213,307 203,261 209,935
Toyota 91,185 102,035 93,760 64,382 75,964
Honda 51,544 77,495 94,902 88,259 89,141
Nissan 53,156 46,352 47,235 38,510 39,488
Mazda 9,197 11,382 14,325 14,952 15,436
Others 115,957 117,839 100,927 95,749 73,242
Total 655,793 666,465 666,631 576,636 589,033
MarketShare
Proton 21.1% 17.4% 15.3% 12.4% 14.6%
Perodua 29.9% 29.3% 32.0% 35.2% 35.6%
Toyota 13.9% 15.3% 14.1% 11.2% 12.9%
Honda 7.9% 11.6% 14.2% 15.3% 15.1%
Nissan 8.1% 7.0% 7.1% 6.7% 6.7%
Mazda 1.4% 1.7% 2.1% 2.6% 2.6%
Others 17.7% 17.7% 15.1% 16.6% 12.4%
Growth
Proton -1.7% -16.5% -11.8% -30.0% 20.0%
Perodua 3.7% -0.3% 9.1% -4.7% 3.3%
Toyota -13.3% 11.9% -8.1% -31.3% 18.0%
Honda 47.5% 50.3% 22.5% -7.0% 1.0%
Nissan 46.6% -12.8% 1.9% -18.5% 2.5%
Mazda 45.2% 23.8% 25.9% 4.4% 3.2%
Others 1.1% 1.6% -14.4% -5.1% -23.5%
Total 4.5% 1.6% 0.0% -13.5% 2.2%
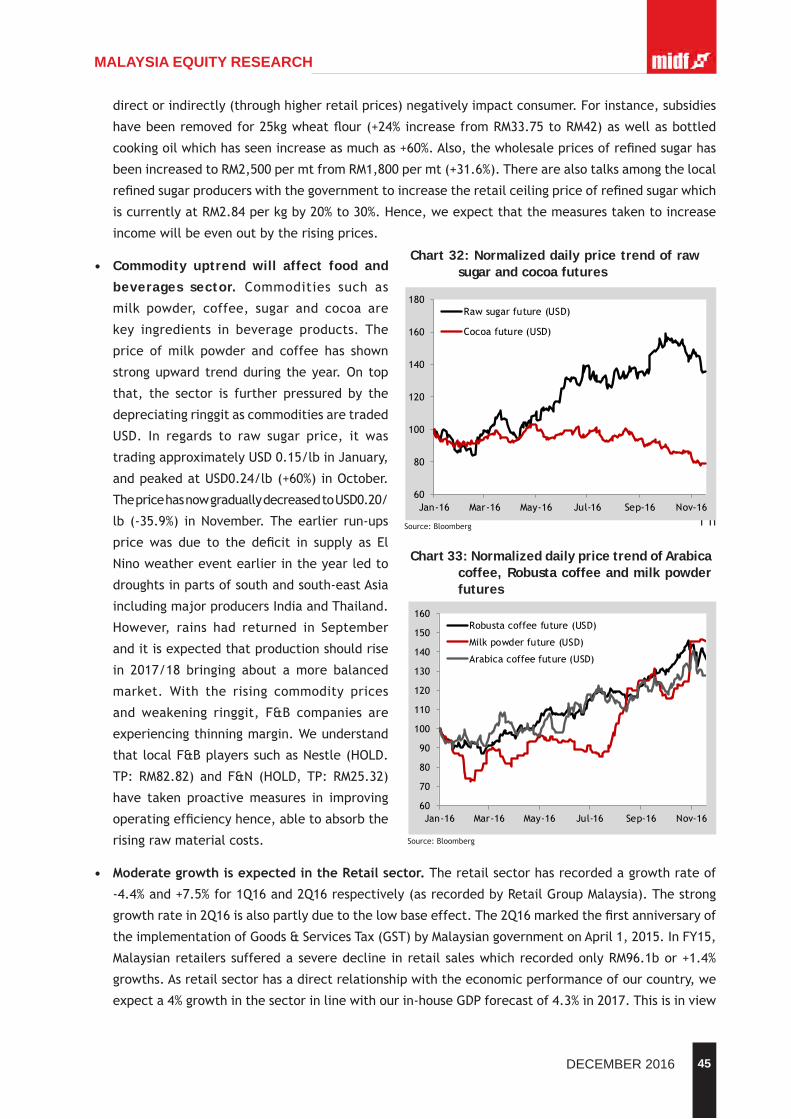
45DECEMBER 2016
MALAYSIA EQUITY RESEARCH
directorindirectly(throughhigherretailprices)negativelyimpactconsumer.Forinstance,subsidies
havebeenremovedfor25kgwheatflour(+24%increasefromRM33.75toRM42)aswellasbottled
cookingoilwhichhasseenincreaseasmuchas+60%.Also,thewholesalepricesofrefinedsugarhas
beenincreasedtoRM2,500permtfromRM1,800permt(+31.6%).Therearealsotalksamongthelocal
refinedsugarproducerswiththegovernmenttoincreasetheretailceilingpriceofrefinedsugarwhich
iscurrentlyatRM2.84perkgby20%to30%.Hence,weexpectthatthemeasurestakentoincrease
incomewillbeevenoutbytherisingprices.
• Commodity uptrend will affect food and
beverages sector. Commodities such as
milk powder, coffee, sugar and cocoa are
key ingredients in beverage products. The
price ofmilk powder and coffee has shown a
strongupward trendduring theyear.On top o f
that, the sector is further pressured by the
depreciatingringgitascommoditiesaretraded i n
USD. In regards to raw sugar price, it was
tradingapproximatelyUSD0.15/lbinJanuary,
andpeakedatUSD0.24/lb(+60%)inOctober.
ThepricehasnowgraduallydecreasedtoUSD0.20/
lb (-35.9%) inNovember.Theearlier run-ups i n
pricewas due to the deficit in supply as El
Ninoweathereventearlierintheyearledto
droughtsinpartsofsouthandsouth-eastAsia
includingmajorproducersIndiaandThailand.
However, rains had returned in September
anditisexpectedthatproductionshouldrise
in 2017/18 bringing about amore balanced
market. With the rising commodity prices
andweakening ringgit, F&B companies are
experiencingthinningmargin.Weunderstand
thatlocalF&BplayerssuchasNestle(HOLD.
TP: RM82.82) and F&N (HOLD,TP: RM25.32)
have taken proactivemeasures in improving
operatingefficiencyhence,abletoabsorbthe
risingrawmaterialcosts.
• ModerategrowthisexpectedintheRetailsector.Theretailsectorhasrecordedagrowthrateof
-4.4%and+7.5%for1Q16and2Q16respectively(asrecordedbyRetailGroupMalaysia).Thestrong
growthratein2Q16isalsopartlyduetothelowbaseeffect.The2Q16markedthefirstanniversaryof
theimplementationofGoods&ServicesTax(GST)byMalaysiangovernmentonApril1,2015.InFY15,
Malaysianretailerssufferedaseveredecline inretailsaleswhichrecordedonlyRM96.1bor+1.4%
growths.Asretailsectorhasadirectrelationshipwiththeeconomicperformanceofourcountry,we
expecta4%growthinthesectorinlinewithourin-houseGDPforecastof4.3%in2017.Thisisinview
Chart 33: Normalized daily price trend of Arabica coffee, Robusta coffee and milk powder futures
Source:Bloomberg
60
70
80
90
100
110
120
130
140
150
160
Jan-16 Mar-16 May-16 Jul-16 Sep-16 Nov-16
Robustacoffeefuture(USD)
Milkpowderfuture(USD)
Arabicacoffeefuture(USD)
Chart 32: Normalized daily price trend of raw sugar and cocoa futures
Source:Bloomberg
60
80
100
120
140
160
180
Jan-16 Mar-16 May-16 Jul-16 Sep-16 Nov-16
Rawsugarfuture(USD)
Cocoafuture(USD)
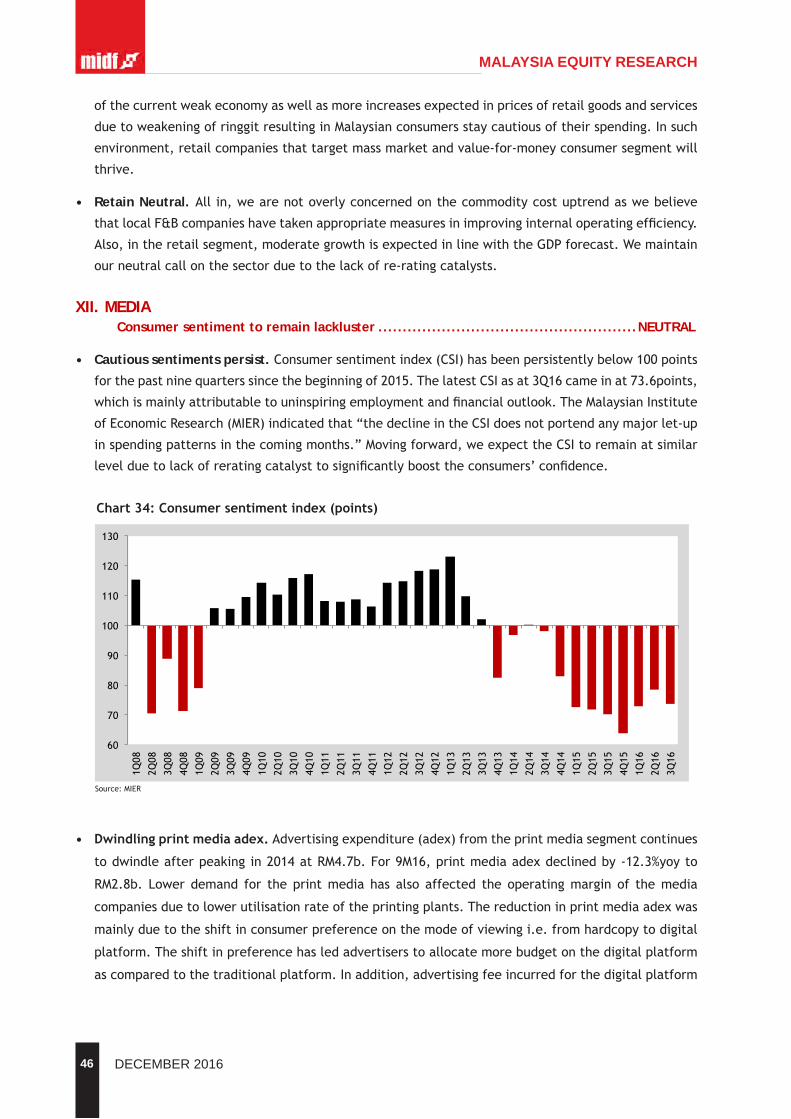
46 DECEMBER 2016
MALAYSIA EQUITY RESEARCH
ofthecurrentweakeconomyaswellasmoreincreasesexpectedinpricesofretailgoodsandservices
duetoweakeningofringgitresultinginMalaysianconsumersstaycautiousoftheirspending.Insuch
environment,retailcompaniesthattargetmassmarketandvalue-for-moneyconsumersegmentwill
thrive.
• Retain Neutral. Allin,wearenotoverlyconcernedonthecommoditycostuptrendaswebelieve
thatlocalF&Bcompanieshavetakenappropriatemeasuresinimprovinginternaloperatingefficiency.
Also,intheretailsegment,moderategrowthisexpectedinlinewiththeGDPforecast.Wemaintain
ourneutralcallonthesectorduetothelackofre-ratingcatalysts.
XII. MEDIA Consumer sentiment to remain lackluster .....................................................NEUTRAL
• Cautious sentiments persist.Consumersentimentindex(CSI)hasbeenpersistentlybelow100points
forthepastninequarterssincethebeginningof2015.ThelatestCSIasat3Q16cameinat73.6points,
whichismainlyattributabletouninspiringemploymentandfinancialoutlook.TheMalaysianInstitute
ofEconomicResearch(MIER)indicatedthat“thedeclineintheCSIdoesnotportendanymajorlet-up
inspendingpatternsinthecomingmonths.”Movingforward,weexpecttheCSItoremainatsimilar
levelduetolackofreratingcatalysttosignificantlyboosttheconsumers’confidence.
• Dwindlingprintmediaadex.Advertisingexpenditure(adex)fromtheprintmediasegmentcontinues
todwindleafterpeakingin2014atRM4.7b.For9M16,printmediaadexdeclinedby-12.3%yoyto
RM2.8b. Lower demand for the printmedia has also affected the operatingmargin of themedia
companiesduetolowerutilisationrateoftheprintingplants.Thereductioninprintmediaadexwas
mainlyduetotheshiftinconsumerpreferenceonthemodeofviewingi.e.fromhardcopytodigital
platform.Theshiftinpreferencehasledadvertiserstoallocatemorebudgetonthedigitalplatform
ascomparedtothetraditionalplatform.Inaddition,advertisingfeeincurredforthedigitalplatform
Chart34:Consumersentimentindex(points)
Source:MIER
60
70
80
90
100
110
120
130
1Q08
2Q08
3Q08
4Q08
1Q09
2Q09
3Q09
4Q09
1Q10
2Q10
3Q10
4Q10
1Q11
2Q11
3Q11
4Q11
1Q12
2Q12
3Q12
4Q12
1Q13
2Q13
3Q13
4Q13
1Q14
2Q14
3Q14
4Q14
1Q15
2Q15
3Q15
4Q15
1Q16
2Q16
3Q16

47DECEMBER 2016
MALAYSIA EQUITY RESEARCH
isalsomuchcheaper,furtherencouragingtheshiftinadvertisingpreference.Apartfromthelow-cost
factor,companiesaremoreinclinedtothedigitalplatformduetoitsmuchwiderreachaswellas
availabilityofinteractivefeatures.Wecansafelyassumethattheprintmediaadexwillcontinueto
slide,unlessmediacompaniescomeupwithnewinnovations.
• Free-to-air(FTA)TVadextrendingdown.Similarly,adexfromtheFTATVsegmenthasbeenonthe
declinesince2015.Predominantly,annualFTATVadexnormallycameinatapproximatelyRM3.0b.
However,theadventoftechnologyhasinitiatedthechangesonTVviewershiptrend.Thenewdigital
platformhascreatedmuchgreatervarietiesandmuchlowercoststoincreasinglydemandingviewers.
Nonetheless,therecouldberesumptioninTVadexgrowthinthelongtermoncethedigitalterrestrial
televisionbroadcastingserviceisimplementednationwide.
• Higher revenue fromnon-adexstreams.Asoutlook for traditional-based revenue isexpected to
continuetobelackluster,mediacompaniesareseentobetappingintotheconsumermarketbyventuring
intothehomeshoppingbusiness.ThiscanbeseeninAstroMalaysiaHoldingsBhd’sandMediaPrima
Bhd’sactiveparticipationinthehomeshoppingbusinesseswiththeirrespectivejointventurepartners.
Leveragingonnon-adexcontributioncouldpotentiallyprovidesomebufferforthechallengingprint
mediaandTVsegments.Thatbeingsaid,revenuecontributionfromnon-adexstreamsremainsminute
atthisjuncture.Meanwhile,StarMediaGroup(Star)hasalsoplaceheavyrelianceonitssubsidiary,
CityneonHoldingsLtd,tobecomethemaincontributortothegroup’sfinancialperformanceinthe
future.
• Maintain NEUTRAL.Wedonotexpectmuchearningsgrowthprospectfrommediacountersmainly
duetotheweakconsumersentiments.Nonetheless,weviewthatmediastockshavebeenfavoured
byinvestorsduetoitsattractivedividendyield.ForFY17,companywithstrongcashpilesuchasStar
MediaGroupBhd(HOLD,TP:RM2.46)toprovideanattractivedividendyieldofapproximately6%.In
addition,MediaPrimaBhd(SELL,TP:RM0.78)andAstroMalaysiaHoldingsBhd(BUY,TP:RM3.78)have
diversifyfromtheirtraditionalcorebusinesses.Assuch,wereiterateourNEUTRALstanceonthesector.
OurtoppickforthesectorresidewithAstroMalaysiaHoldingsBhdduetobetterearningsvisibility
andstrongcashgenerationcapabilitywhichenablestheadoptionofaprogressivedividendpolicy.
Chart35:Newspaperadex(RM’b)
Source:Nielsen,MIDFR
Chart36:FTATVadex(RM’b)
Source:Nielsen,MIDFR
3.3 3.4
3.9
4.4 4.34.6 4.7
4.2
3.1
2.8
2
3
4
5
2008
2009
2010
2011
2012
2013
2014
2015
9M20
15
9M20
16*
2.22.4
2.93.0
3.2 3.2 3.2
2.9
2.1 2.1
1
2
3
4
2008
2009
2010
2011
2012
2013
2014
2015
9M20
15
9M20
16*
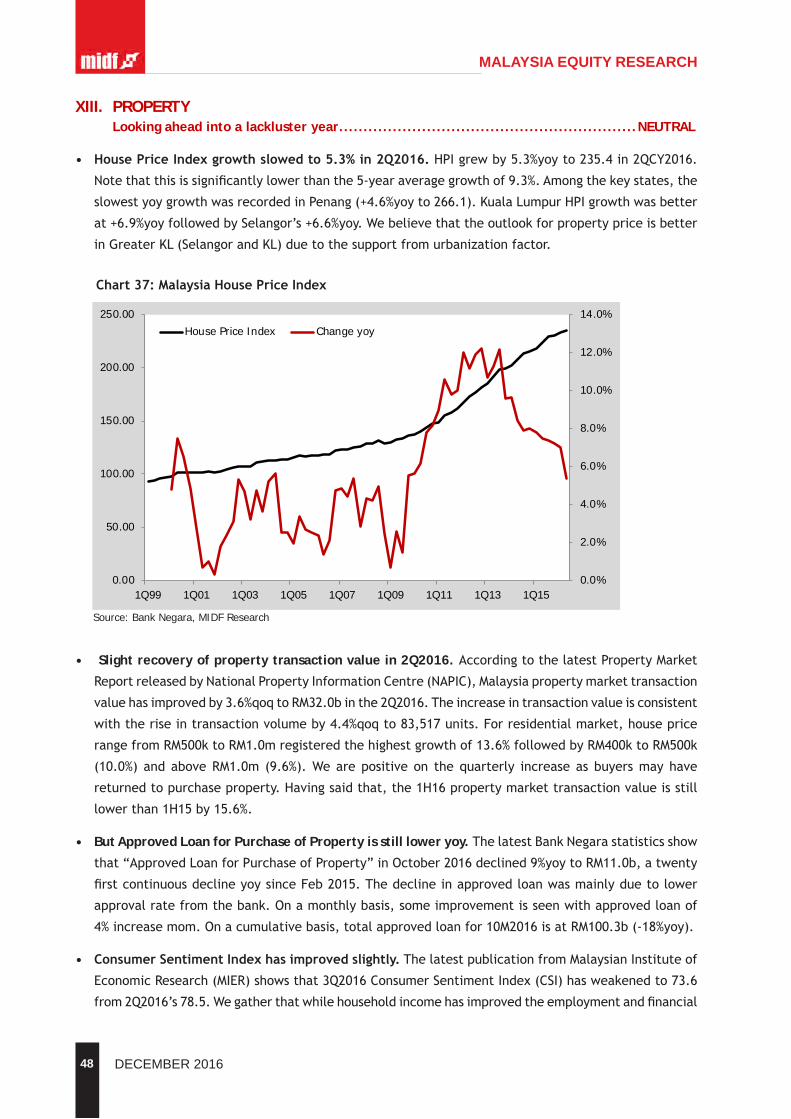
48 DECEMBER 2016
MALAYSIA EQUITY RESEARCH
XIII. PROPERTYLooking ahead into a lackluster year .............................................................NEUTRAL
• HousePriceIndexgrowthslowedto5.3%in2Q2016.HPIgrewby5.3%yoyto235.4in2QCY2016.
Notethatthisissignificantlylowerthanthe5-yearaveragegrowthof9.3%.Amongthekeystates,the
slowestyoygrowthwasrecordedinPenang(+4.6%yoyto266.1).KualaLumpurHPIgrowthwasbetter
at+6.9%yoyfollowedbySelangor’s+6.6%yoy.Webelievethattheoutlookforpropertypriceisbetter
inGreaterKL(SelangorandKL)duetothesupportfromurbanizationfactor.
• Slight recovery of property transaction value in 2Q2016. AccordingtothelatestPropertyMarket
ReportreleasedbyNationalPropertyInformationCentre(NAPIC),Malaysiapropertymarkettransaction
valuehasimprovedby3.6%qoqtoRM32.0binthe2Q2016.Theincreaseintransactionvalueisconsistent
withtheriseintransactionvolumeby4.4%qoqto83,517units.Forresidentialmarket,houseprice
rangefromRM500ktoRM1.0mregisteredthehighestgrowthof13.6%followedbyRM400ktoRM500k
(10.0%) andaboveRM1.0m (9.6%).Wearepositiveon thequarterly increaseasbuyersmayhave
returnedtopurchaseproperty.Havingsaidthat,the1H16propertymarkettransactionvalueisstill
lowerthan1H15by15.6%.
• But Approved Loan for Purchase of Property is still lower yoy.ThelatestBankNegarastatisticsshow
that“ApprovedLoanforPurchaseofProperty”inOctober2016declined9%yoytoRM11.0b,atwenty
firstcontinuousdeclineyoysinceFeb2015.Thedeclineinapprovedloanwasmainlyduetolower
approvalratefromthebank.Onamonthlybasis,someimprovementisseenwithapprovedloanof
4%increasemom.Onacumulativebasis,totalapprovedloanfor10M2016isatRM100.3b(-18%yoy).
• ConsumerSentimentIndexhasimprovedslightly.ThelatestpublicationfromMalaysianInstituteof
EconomicResearch(MIER)showsthat3Q2016ConsumerSentimentIndex(CSI)hasweakenedto73.6
from2Q2016’s78.5.Wegatherthatwhilehouseholdincomehasimprovedtheemploymentandfinancial
Chart37:MalaysiaHousePriceIndex
Source: Bank Negara, MIDF Research
0.0%
2.0%
4.0%
6.0%
8.0%
10.0%
12.0%
14.0%
0.00
50.00
100.00
150.00
200.00
250.00
1Q99 1Q01 1Q03 1Q05 1Q07 1Q09 1Q11 1Q13 1Q15
House Price Index Change yoy
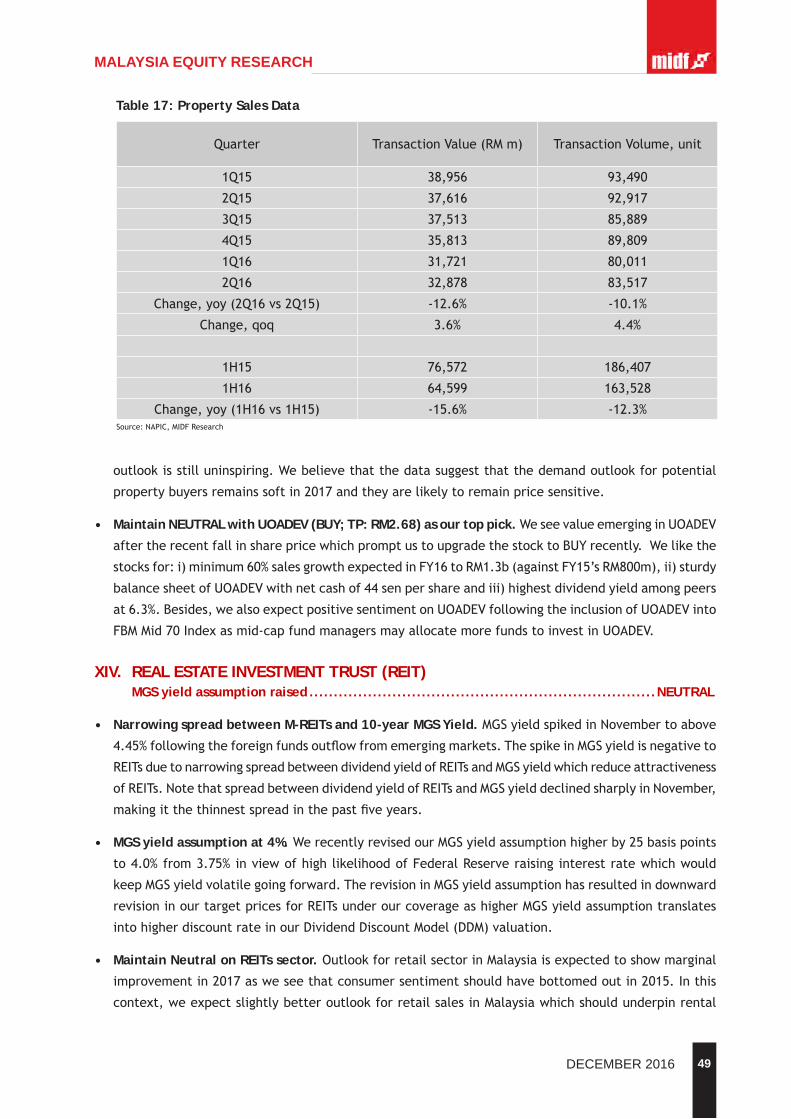
49DECEMBER 2016
MALAYSIA EQUITY RESEARCH
outlookisstilluninspiring.Webelievethatthedatasuggestthatthedemandoutlookforpotential
propertybuyersremainssoftin2017andtheyarelikelytoremainpricesensitive.
• Maintain NEUTRAL with UOADEV (BUY; TP: RM2.68) as our top pick.WeseevalueemerginginUOADEV
aftertherecentfallinsharepricewhichpromptustoupgradethestocktoBUYrecently.Welikethe
stocksfor:i)minimum60%salesgrowthexpectedinFY16toRM1.3b(againstFY15’sRM800m),ii)sturdy
balancesheetofUOADEVwithnetcashof44senpershareandiii)highestdividendyieldamongpeers
at6.3%.Besides,wealsoexpectpositivesentimentonUOADEVfollowingtheinclusionofUOADEVinto
FBMMid70Indexasmid-capfundmanagersmayallocatemorefundstoinvestinUOADEV.
XIV. REAL ESTATE INVESTMENT TRUST (REIT)MGS yield assumption raised .......................................................................NEUTRAL
• Narrowing spread between M-REITs and 10-year MGS Yield. MGSyieldspikedinNovembertoabove
4.45%followingtheforeignfundsoutflowfromemergingmarkets.ThespikeinMGSyieldisnegativeto
REITsduetonarrowingspreadbetweendividendyieldofREITsandMGSyieldwhichreduceattractiveness
ofREITs.NotethatspreadbetweendividendyieldofREITsandMGSyielddeclinedsharplyinNovember,
makingitthethinnestspreadinthepastfiveyears.
• MGS yield assumption at 4%. WerecentlyrevisedourMGSyieldassumptionhigherby25basispoints
to4.0%from3.75%inviewofhighlikelihoodofFederalReserveraisinginterestratewhichwould
keepMGSyieldvolatilegoingforward.TherevisioninMGSyieldassumptionhasresultedindownward
revisioninourtargetpricesforREITsunderourcoverageashigherMGSyieldassumptiontranslates
intohigherdiscountrateinourDividendDiscountModel(DDM)valuation.
• Maintain Neutral on REITs sector. OutlookforretailsectorinMalaysiaisexpectedtoshowmarginal
improvementin2017asweseethatconsumersentimentshouldhavebottomedoutin2015.Inthis
context,weexpectslightlybetteroutlookforretailsalesinMalaysiawhichshouldunderpinrental
Table 17: Property Sales Data
Quarter TransactionValue(RMm) TransactionVolume,unit
1Q15 38,956 93,490
2Q15 37,616 92,917
3Q15 37,513 85,889
4Q15 35,813 89,809
1Q16 31,721 80,011
2Q16 32,878 83,517
Change,yoy(2Q16vs2Q15) -12.6% -10.1%
Change,qoq 3.6% 4.4%
1H15 76,572 186,407
1H16 64,599 163,528
Change,yoy(1H16vs1H15) -15.6% -12.3%Source:NAPIC,MIDFResearch

50 DECEMBER 2016
MALAYSIA EQUITY RESEARCH
reversionforretailsegmenttoremaininpositiveterritory.Meanwhile,weopinethatofficesegment
ofMalaysiapropertymarketwillcontinuetobetenants’marketduetotheoversupplyofofficespace
whichrenderlimitedupsidetorentalreversion.Overall,wemaintainourNeutralratingonREITssector.
• Top Picks are SUNWAY REIT (BUY; TP: RM1.83) and CMMT (BUY; TP: RM1.69).WelikeSUNWAYREIT
aswearepositiveonitsretaildivisionwhichwouldmainlyunderpinbyresilientperformanceofits
flagshipSunwayPyramidShoppingMallwhileitsofficedivisionshouldseerecoveryinFY17fromthe
lowbaseinFY16.AsforCMMT,wecontinuetoseepositiveearningsoutlookwhichwouldbedrivenby
thesteadyperformancefromGurneyPlazaandEastCoastMall.Wealsoopinethatearningsdownside
riskfromSungeiWangPlaza(SWP)islimitedasSWPhasbecomethesmallestearningscontributorto
Chart 38: Spread between REITs yield and 10-year MGS yield
Source:Bloomberg,MIDFResearch
0
1
2
3
4
5
6
7
8
Jan-12 Jul-12 Jan-13 Jul-13 Jan-14 Jul-14 Jan-15 Jul-15 Jan-16 Jul-16
Spread Average M-REIT yield 10-year MGS Yield
Chart39:Bottomingconsumersentimentindexin2015
Source:Bloomberg,MIDFResearch
40
50
60
70
80
90
100
110
120
130
Mar-08 Dec-08 Sep-09 Jun-10 Mar-11 Dec-11 Sep-12 Jun-13 Mar-14 Dec-14 Sep-15 Jun-16
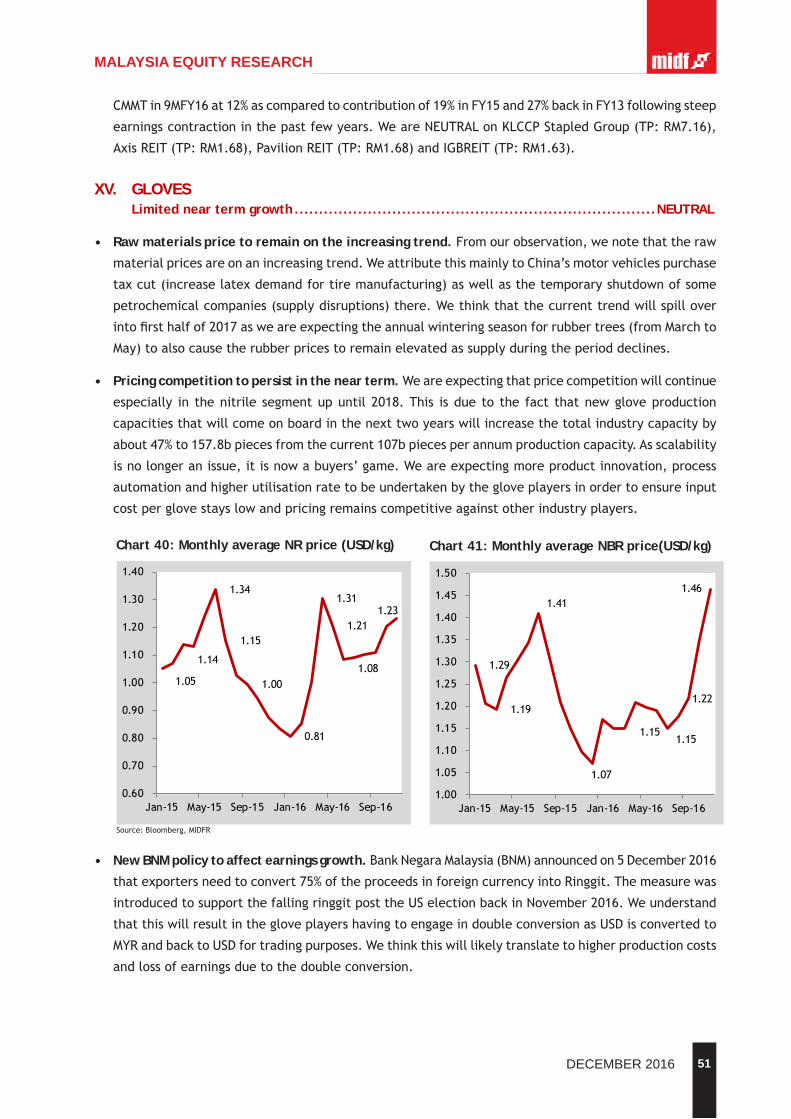
51DECEMBER 2016
MALAYSIA EQUITY RESEARCH
CMMTin9MFY16at12%ascomparedtocontributionof19%inFY15and27%backinFY13followingsteep
earningscontractioninthepastfewyears.WeareNEUTRALonKLCCPStapledGroup(TP:RM7.16),
AxisREIT(TP:RM1.68),PavilionREIT(TP:RM1.68)andIGBREIT(TP:RM1.63).
XV. GLOVESLimited near term growth ..........................................................................NEUTRAL
• Raw materials price to remain on the increasing trend. Fromourobservation,wenotethattheraw
materialpricesareonanincreasingtrend.WeattributethismainlytoChina’smotorvehiclespurchase
taxcut(increaselatexdemandfortiremanufacturing)aswellasthetemporaryshutdownofsome
petrochemicalcompanies(supplydisruptions)there.Wethinkthatthecurrenttrendwillspillover
intofirsthalfof2017asweareexpectingtheannualwinteringseasonforrubbertrees(fromMarchto
May)toalsocausetherubberpricestoremainelevatedassupplyduringtheperioddeclines.
• Pricing competition to persist in the near term.Weareexpectingthatpricecompetitionwillcontinue
especially in thenitrile segmentupuntil2018.This isdue to the fact thatnewgloveproduction
capacitiesthatwillcomeonboardinthenexttwoyearswillincreasethetotalindustrycapacityby
about47%to157.8bpiecesfromthecurrent107bpiecesperannumproductioncapacity.Asscalability
isnolongeranissue,itisnowabuyers’game.Weareexpectingmoreproductinnovation,process
automationandhigherutilisationratetobeundertakenbythegloveplayersinordertoensureinput
costperglovestayslowandpricingremainscompetitiveagainstotherindustryplayers.
• New BNM policy to affect earnings growth.BankNegaraMalaysia(BNM)announcedon5December2016
thatexportersneedtoconvert75%oftheproceedsinforeigncurrencyintoRinggit.Themeasurewas
introducedtosupportthefallingringgitposttheUSelectionbackinNovember2016.Weunderstand
thatthiswillresultinthegloveplayershavingtoengageindoubleconversionasUSDisconvertedto
MYRandbacktoUSDfortradingpurposes.Wethinkthiswilllikelytranslatetohigherproductioncosts
andlossofearningsduetothedoubleconversion.
Chart 41: Monthly average NBR price(USD/kg)
1.29
1.19
1.41
1.07
1.151.15
1.22
1.46
1.00
1.05
1.10
1.15
1.20
1.25
1.30
1.35
1.40
1.45
1.50
Jan-15 May-15 Sep-15 Jan-16 May-16 Sep-16
Chart 40: Monthly average NR price (USD/kg)
Source:Bloomberg,MIDFR
1.05
1.14
1.34
1.15
1.00
0.81
1.31
1.21
1.08
1.23
0.60
0.70
0.80
0.90
1.00
1.10
1.20
1.30
1.40
Jan-15 May-15 Sep-15 Jan-16 May-16 Sep-16

52 DECEMBER 2016
MALAYSIA EQUITY RESEARCH
• Maintain NEUTRAL. WearemaintainingourNEUTRALstanceonthesectorasweviewthenearterm
prospectsforthegloveindustryremainschallenging.Thisisonthebackof:(i)increasingrawmaterial
prices;(ii)ongoingpricecompetitionaswellas;(iii)thenewcounterproductivepolicyannounced
recentlybyBNM.Despitehavingacautiousoutlookon thenear termprospectsof the sector,we
remainpositiveonthesector’slongtermoutlookwhichisexpectedtobenefitwellfromthecurrent
expansionincapacity.
XVI. TELECOMMUNICATION Another round of spectrum reallocation in 2017 ..............................................NEUTRAL
• More spectrums due for reallocation. Theexistinglicensesfor2,300MHzand2,600MHzbandsare
settoexpirein2017.Inaddition,the700MHzbandisexpectedtobefreeupin2017followingthe
TVanalogueswitchoffwhichisnowscheduledtotakeplacein2018.Thereallocationofthethree
spectrumscouldtakeplaceasearlyas1H17via‘spectrumassignment’.Therecouldbemoremobile
serviceproviders(suchasWebeandYTL)contestingforthereallocation.Thisisparticularlysoforthe
700Mhzduetoitswidercoveragecapability.
• Borrowing to increase further.Thenewpricingannouncementforthethreespectrumscouldalso
followsuit.Intherecentallocation,thefourincumbentshaspaidhugesumsforthespectrums’rights
byrelyingonacombinationofborrowingsand/orinternallygeneratedfunds.Weexpectthesame
exercisewouldtakeplace,puttingmorepressureonthebalancesheet.
• More competitive postpaid realm. In November 2016,Webe’s hasmade its RM79 postpaid plan
availablewhiledoingawaywithitsoldcriteria.Maxis,Digi,CelcomandUmobilehavealsorevised
theirpostpaidpackagestobemorecompetitive.Asat3Q16,DigiandCelcom’spostpaidARPUcontinue
todecrease,broughtaboutbythechangesinthepostpaidplans.However,Maxis’postpaidARPUhas
increasedslightlymainlyduetohigherproportionofMaxisONEplansubscribersasweviewthatthe
lower-tieredMaxispostpaidcustomerhasportouttothecompetitors(refertochart42).Tominimise
theimpactoflowerARPU,itisimperativethatthemobileserviceprovidersstepupeffortstoincrease
Table18:Existingspectrumallocation
Source:MCMC,MIDFR
Spectrum(MHz)
Company
Redtone Maxis Umobile Celcom Altel Digi Webe YTL
2600 2x10MHz(2017)
2x10MHz(2017)
2x10MHz(2017)
2x10MHz(2017)
2x10MHz(2017)
2x10MHz(2017)
2x10MHz(2017)
2x10MHz(2017)
2300 30MHz(2017)
30MHz(2017)
30MHz(2017)
2100 2x15MHz(2018)
2x15MHz(2018)
2x15MHz(2018)
2x15MHz(2018)
1800 2x20MHz(2032)
2x15MHz(2032)
2x20MHz(2032)
2x20MHz(2032)
900 2x10MHz(2032)
2x5MHz(2032)
2x10MHz(2032)
2x5MHz(2032)
850 2x10MHz
700 2x40MHzwillbereframedformobilebroadband(LTE)in2018
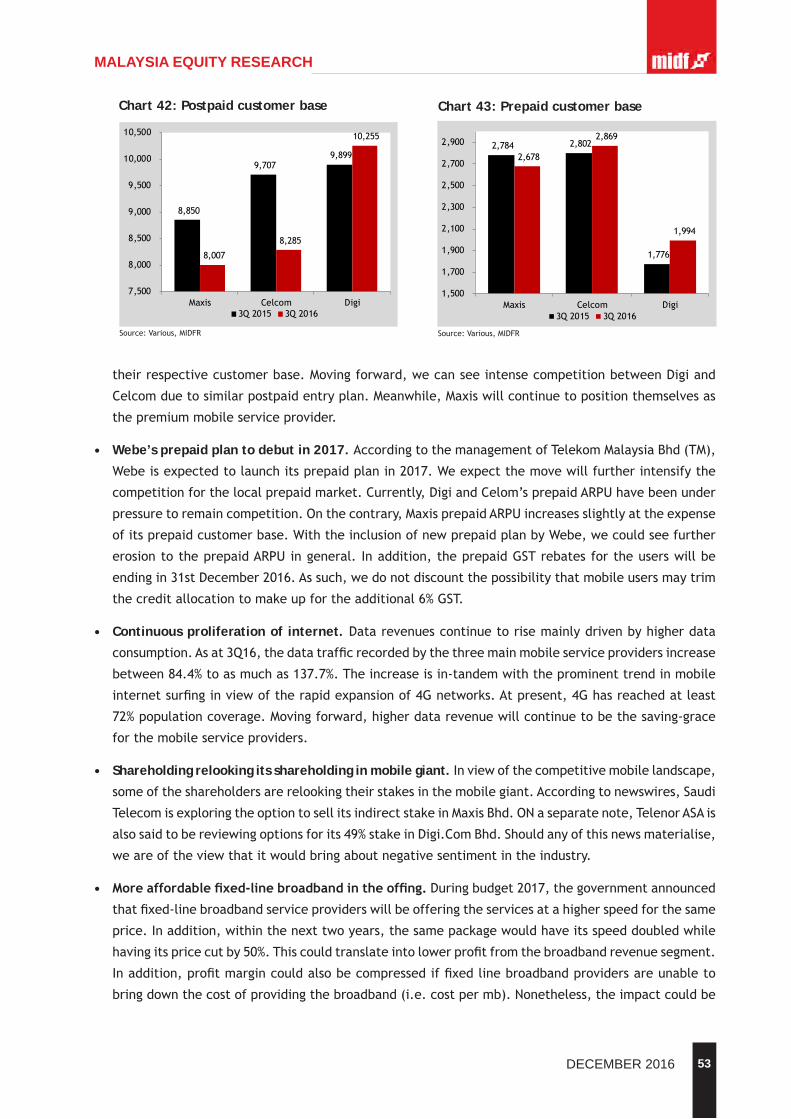
53DECEMBER 2016
MALAYSIA EQUITY RESEARCH
theirrespectivecustomerbase.Movingforward,wecanseeintensecompetitionbetweenDigiand
Celcomduetosimilarpostpaidentryplan.Meanwhile,Maxiswillcontinuetopositionthemselvesas
thepremiummobileserviceprovider.
• Webe’s prepaid plan to debut in 2017. AccordingtothemanagementofTelekomMalaysiaBhd(TM),
Webeisexpectedtolaunchitsprepaidplanin2017.Weexpectthemovewillfurtherintensifythe
competitionforthelocalprepaidmarket.Currently,DigiandCelom’sprepaidARPUhavebeenunder
pressuretoremaincompetition.Onthecontrary,MaxisprepaidARPUincreasesslightlyattheexpense
ofitsprepaidcustomerbase.WiththeinclusionofnewprepaidplanbyWebe,wecouldseefurther
erosiontotheprepaidARPUingeneral. Inaddition,theprepaidGSTrebatesfortheuserswillbe
endingin31stDecember2016.Assuch,wedonotdiscountthepossibilitythatmobileusersmaytrim
thecreditallocationtomakeupfortheadditional6%GST.
• Continuous proliferation of internet.Datarevenuescontinuetorisemainlydrivenbyhigherdata
consumption.Asat3Q16,thedatatrafficrecordedbythethreemainmobileserviceprovidersincrease
between84.4%toasmuchas137.7%.Theincreaseisin-tandemwiththeprominenttrendinmobile
internetsurfinginviewoftherapidexpansionof4Gnetworks.Atpresent,4Ghasreachedatleast
72%populationcoverage.Movingforward,higherdatarevenuewillcontinuetobethesaving-grace
forthemobileserviceproviders.
• Shareholding relooking its shareholding in mobile giant.Inviewofthecompetitivemobilelandscape,
someoftheshareholdersarerelookingtheirstakesinthemobilegiant.Accordingtonewswires,Saudi
TelecomisexploringtheoptiontosellitsindirectstakeinMaxisBhd.ONaseparatenote,TelenorASAis
alsosaidtobereviewingoptionsforits49%stakeinDigi.ComBhd.Shouldanyofthisnewsmaterialise,
weareoftheviewthatitwouldbringaboutnegativesentimentintheindustry.
• Moreaffordablefixed-linebroadbandintheoffing.Duringbudget2017,thegovernmentannounced
thatfixed-linebroadbandserviceproviderswillbeofferingtheservicesatahigherspeedforthesame
price.Inaddition,withinthenexttwoyears,thesamepackagewouldhaveitsspeeddoubledwhile
havingitspricecutby50%.Thiscouldtranslateintolowerprofitfromthebroadbandrevenuesegment.
Inaddition,profitmargincouldalsobecompressediffixedlinebroadbandprovidersareunableto
bringdownthecostofprovidingthebroadband(i.e.costpermb).Nonetheless,theimpactcouldbe
Chart 43: Prepaid customer base
Source:Various,MIDFR
2,784 2,802
1,776
2,678
2,869
1,994
1,500
1,700
1,900
2,100
2,300
2,500
2,700
2,900
Maxis Celcom Digi3Q2015 3Q2016
Chart 42: Postpaid customer base
Source:Various,MIDFR
8,850
9,7079,899
8,007
8,285
10,255
7,500
8,000
8,500
9,000
9,500
10,000
10,500
Maxis Celcom Digi3Q2015 3Q2016
54 DECEMBER 2016
MALAYSIA EQUITY RESEARCH
partiallybufferedbytheincreaseinfixed-linebroadbandusersasTMiscurrentlycarryingouttheHigh
SpeedBroadbandProjectPhase2(HSBB2)andSub-UrbanBroadband(SUBB)projects.
• Maintain NEUTRAL. Competition remains intenseasnewplayers seek to takeawaymarket share
fromthemobilegiantinthealready-saturatedmarket.Onanothernote,theheftycostofacquiring
andmaintainingnewspectrumallocationservesasachallengetolocalmobileplayers.Mobileservice
providersareseentorelyheavilyonborrowingstofundthe900MHzand1800MHzspectrumfees.
Weexpectthebalancesheetwillbeimpactedfurthererfortheallocationsof700MHz,2300MHzand
2600MHz.Toseekrefugefromthecompetitivemobile landscape,weadvise investors toshift the
telecommunicationportfoliotofixedlineplayerssuchasTelekomMalaysia(Buy;TP:RM7.42).Allin,
wemaintainourNEUTRALstanceonthesector.
XVII. TECHNOLOGYCountingonthenextgenerationiPhonetosteerdemand ..................................NEUTRAL
• Monthly sales pick up pace. In recentmonths, theGlobal Semiconductor Sales (GSS) has shown
improvementonayear-over-yearbasissinceAugust2016.Highersaleswererecordedacrossallregions
withtheexceptionofEurope.SalesgrowthfromChinahasremainsimpressive,chartingadoubledigit
growth.Onanothernote,highersalesarealsoseenfornearlyeverymajorsemiconductorproducts.
Nonetheless,onayear-to-datebasis,theGSSstilltrailbehindtheWorldSemiconductorTradeStatistics’
(WSTS)salesforecasts.
• Highersalesexpectationfor2017.TheWSTShasrevisedupward2017salesprojectionby+3.7%to
USD346.1b.Thistranslatesintoanexpectedannualincreaseof+3.3%yoyfrom+2.0%yoypreviously.
Theupwardrevisionreflectsexpectationofbettersalesgrowth,mainlyfromthesensorandmemory
productcategories.WeviewthathighsensorsalesareintandemwiththeuptakeintheInternetof
Things(IOT).Meanwhile,highermemorysalesforecastscouldbedrivenbyshortageofNANDflash
memoryandnew3DNANDramp-upcomingon-stream.Moreimportantly,salesestimatesfromAsia
Pacificregionareexpectedtoincreaseby+3.2%yoy.
• Equipment purchases activities to remain active.Onayear-to-datebasis,theBook-to-Bill(BTB)ratio
hasgenerallybeenencouraging.BTBratiohasbeenatoraboveparityforninemonths.Thisshows
thattherearestronginvestmentsmadebydevicemanufacturerstoeitheraddorimproveexisting
productionline.WeattributethistothestrongpurchaseactivityinChina.Weremainsanguinethat
thestrongpurchasingactivitiesinChinawillcontinueasitissteppingupeffortstobecomeamajor
playerinsemiconductordesignandmanufacturing.Accordingtonewswires,logicmanufacturersfocus
theirspendingonrampingfabsfortheintroductionofhigh-volume10-nanometerproductionin2017
andmemoryproducersarefocusingonthemoveto3DNANDflash.
• No immediate risk in relocation of production.Therecouldbeadisruptionwithinthesemiconductor’s
supplychainduetothepossiblerelocationofoffshoreproductionintotheU.S.However,management
isoftheviewthattheriskofassemblyoperationsbeingrelocatedisminuteatthisjuncture.This
wouldbeacostlyexerciseaslabourcostswouldincreasesignificantly.Inaddition,theassemblyprocess
providessmallermarginwhichisusuallyinthemid-teens.Assuch,initialfocuscouldbetorelocate
high-valueaddedserviceswhichprovidemuchbetterprofitmargin.
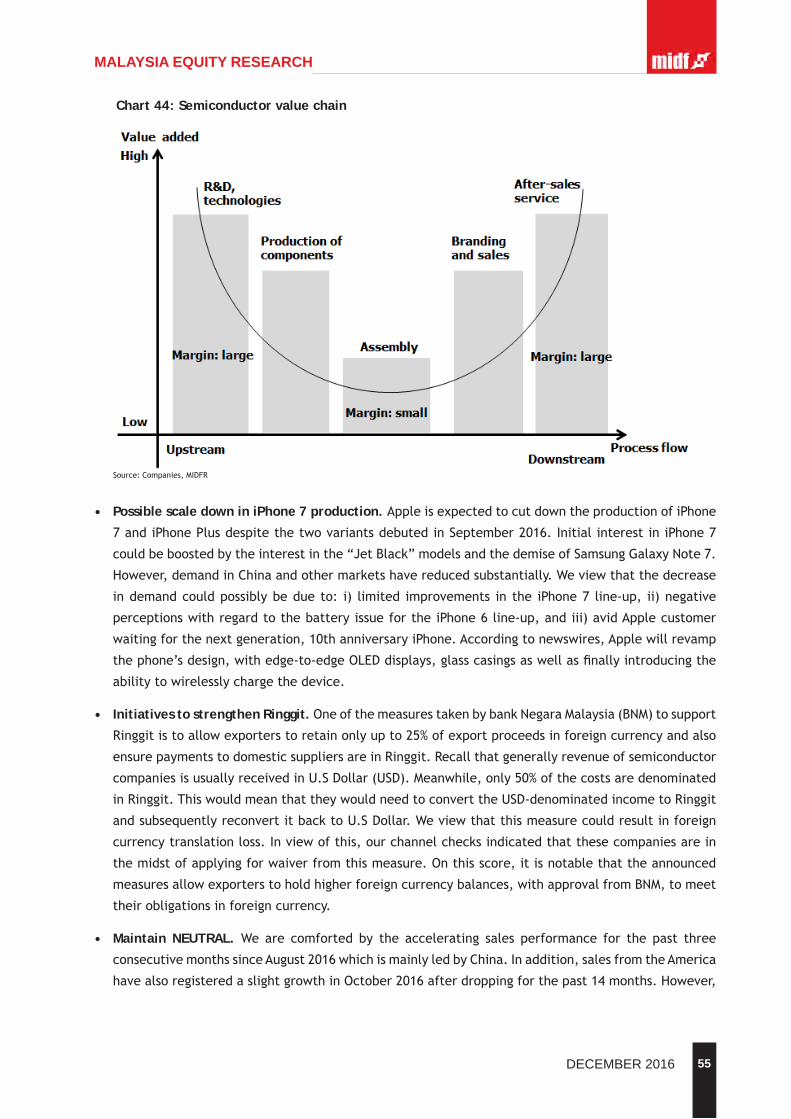
55DECEMBER 2016
MALAYSIA EQUITY RESEARCH
• Possible scale down in iPhone 7 production. AppleisexpectedtocutdowntheproductionofiPhone
7andiPhonePlusdespitethetwovariantsdebutedinSeptember2016.InitialinterestiniPhone7
couldbeboostedbytheinterestinthe“JetBlack”modelsandthedemiseofSamsungGalaxyNote7.
However,demandinChinaandothermarketshavereducedsubstantially.Weviewthatthedecrease
indemandcouldpossiblybedueto: i) limited improvements in the iPhone7 line-up, ii)negative
perceptionswithregardtothebatteryissuefortheiPhone6line-up,andiii)avidApplecustomer
waitingforthenextgeneration,10thanniversaryiPhone.Accordingtonewswires,Applewillrevamp
thephone’sdesign,withedge-to-edgeOLEDdisplays,glasscasingsaswellasfinallyintroducingthe
abilitytowirelesslychargethedevice.
• Initiatives to strengthen Ringgit. OneofthemeasurestakenbybankNegaraMalaysia(BNM)tosupport
Ringgitistoallowexporterstoretainonlyupto25%ofexportproceedsinforeigncurrencyandalso
ensurepaymentstodomesticsuppliersareinRinggit.Recallthatgenerallyrevenueofsemiconductor
companiesisusuallyreceivedinU.SDollar(USD).Meanwhile,only50%ofthecostsaredenominated
inRinggit.ThiswouldmeanthattheywouldneedtoconverttheUSD-denominatedincometoRinggit
andsubsequentlyreconvertitbacktoU.SDollar.Weviewthatthismeasurecouldresultinforeign
currencytranslationloss.Inviewofthis,ourchannelchecksindicatedthatthesecompaniesarein
themidstofapplyingforwaiverfromthismeasure.Onthisscore,itisnotablethattheannounced
measuresallowexporterstoholdhigherforeigncurrencybalances,withapprovalfromBNM,tomeet
theirobligationsinforeigncurrency.
• Maintain NEUTRAL. We are comforted by the accelerating sales performance for the past three
consecutivemonthssinceAugust2016whichismainlyledbyChina.Inaddition,salesfromtheAmerica
havealsoregisteredaslightgrowthinOctober2016afterdroppingforthepast14months.However,
Chart 44: Semiconductor value chain
Source:Companies,MIDFR
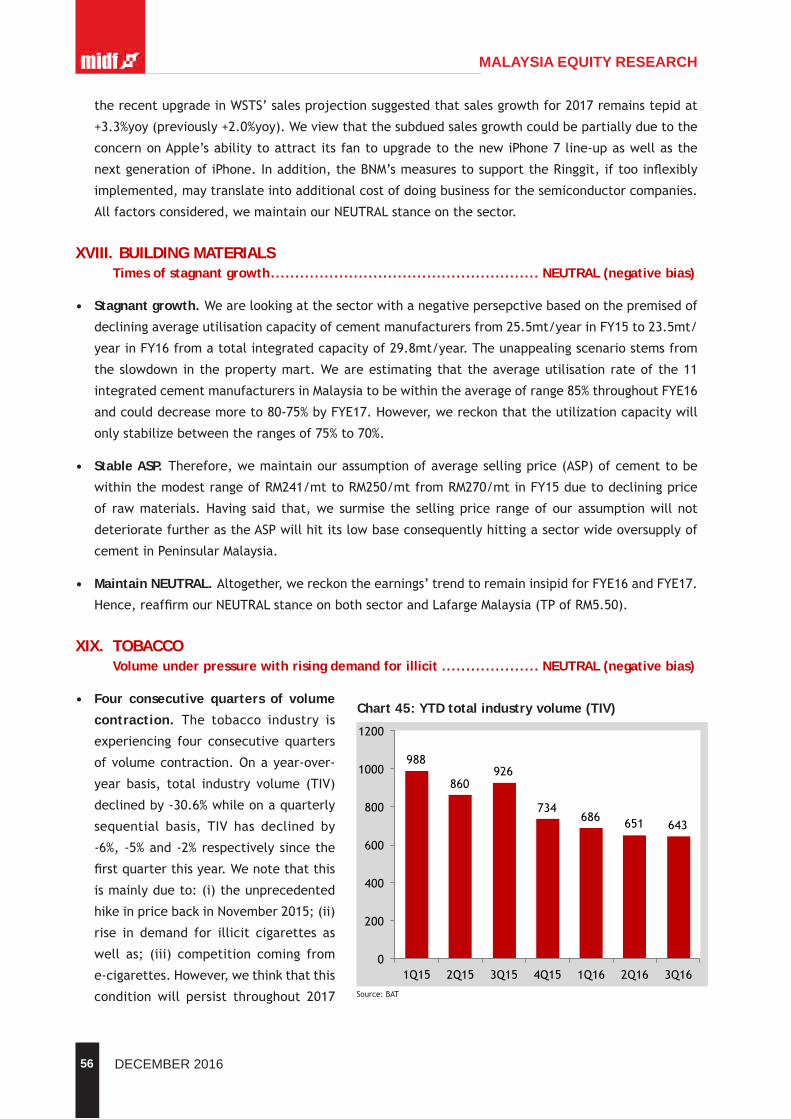
56 DECEMBER 2016
MALAYSIA EQUITY RESEARCH
therecentupgradeinWSTS’salesprojectionsuggestedthatsalesgrowthfor2017remainstepidat
+3.3%yoy(previously+2.0%yoy).Weviewthatthesubduedsalesgrowthcouldbepartiallyduetothe
concernonApple’sabilitytoattractitsfantoupgradetothenewiPhone7line-upaswellasthe
nextgenerationofiPhone.Inaddition,theBNM’smeasurestosupporttheRinggit,iftooinflexibly
implemented,maytranslateintoadditionalcostofdoingbusinessforthesemiconductorcompanies.
Allfactorsconsidered,wemaintainourNEUTRALstanceonthesector.
XVIII. BUILDING MATERIALSTimes of stagnant growth ....................................................... NEUTRAL (negative bias)
• Stagnant growth. Wearelookingatthesectorwithanegativepersepctivebasedonthepremisedof
decliningaverageutilisationcapacityofcementmanufacturersfrom25.5mt/yearinFY15to23.5mt/
yearinFY16fromatotalintegratedcapacityof29.8mt/year.Theunappealingscenariostemsfrom
theslowdown inthepropertymart.Weareestimatingthattheaverageutilisationrateofthe11
integratedcementmanufacturersinMalaysiatobewithintheaverageofrange85%throughoutFYE16
andcoulddecreasemoreto80-75%byFYE17.However,wereckonthattheutilizationcapacitywill
onlystabilizebetweentherangesof75%to70%.
• Stable ASP. Therefore,wemaintainourassumptionofaveragesellingprice(ASP)ofcementtobe
withinthemodestrangeofRM241/mttoRM250/mtfromRM270/mtinFY15duetodecliningprice
of rawmaterials.Having said that,we surmise the sellingprice rangeofourassumptionwillnot
deterioratefurtherastheASPwillhititslowbaseconsequentlyhittingasectorwideoversupplyof
cementinPeninsularMalaysia.
• Maintain NEUTRAL. Altogether,wereckontheearnings’trendtoremaininsipidforFYE16andFYE17.
Hence,reaffirmourNEUTRALstanceonbothsectorandLafargeMalaysia(TPofRM5.50).
XIX. TOBACCOVolume under pressure with rising demand for illicit .................... NEUTRAL (negative bias)
• Four consecutive quarters of volume
contraction. The tobacco industry is
experiencing four consecutive quarters
ofvolumecontraction.Onayear-over-
year basis, total industry volume (TIV)
declinedby-30.6%whileonaquarterly
sequential basis, TIV has declined by
-6%,-5%and-2%respectivelysincethe
firstquarterthisyear.Wenotethatthis
ismainlydueto:(i)theunprecedented
hikeinpricebackinNovember2015;(ii)
rise in demand for illicit cigarettes as
well as; (iii) competition coming from
e-cigarettes.However,wethinkthatthis
conditionwill persist throughout 2017
Chart 45: YTD total industry volume (TIV)
Source:BAT
988
860926
734686 651 643
0
200
400
600
800
1000
1200
1Q15 2Q15 3Q15 4Q15 1Q16 2Q16 3Q16
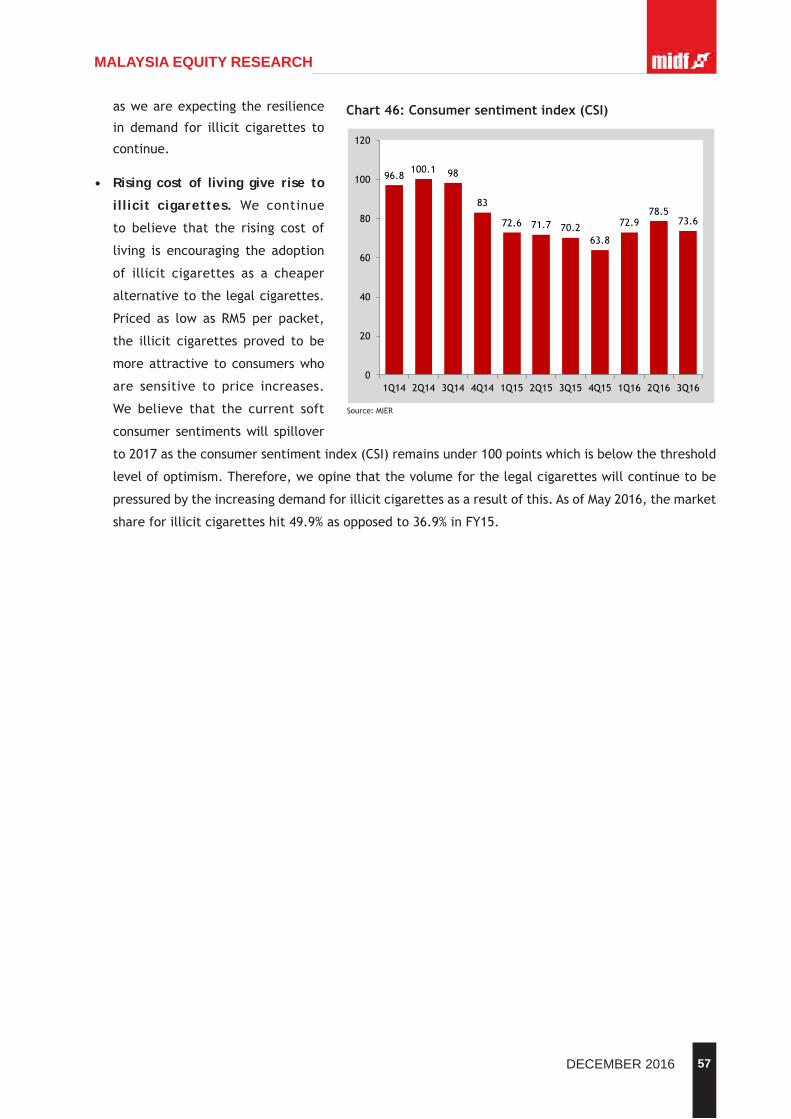
57DECEMBER 2016
MALAYSIA EQUITY RESEARCH
asweareexpectingtheresilience
in demand for illicit cigarettes to
continue.
• Rising cost of living give rise to
illicit cigarettes. We continue
to believe that the rising cost of
living is encouraging the adoption
of illicit cigarettes as a cheaper
alternativetothelegalcigarettes.
Priced as low as RM5 per packet,
the illicit cigarettes proved to be
moreattractive toconsumerswho
are sensitive to price increases.
We believe that the current soft
consumer sentimentswill spillover
to2017astheconsumersentimentindex(CSI)remainsunder100pointswhichisbelowthethreshold
levelofoptimism.Therefore,weopinethatthevolumeforthelegalcigaretteswillcontinuetobe
pressuredbytheincreasingdemandforillicitcigarettesasaresultofthis.AsofMay2016,themarket
shareforillicitcigaretteshit49.9%asopposedto36.9%inFY15.
Chart46:Consumersentimentindex(CSI)
Source:MIER
96.8100.1 98
83
72.6 71.7 70.263.8
72.978.5
73.6
0
20
40
60
80
100
120
1Q14 2Q14 3Q14 4Q14 1Q15 2Q15 3Q15 4Q15 1Q16 2Q16 3Q16
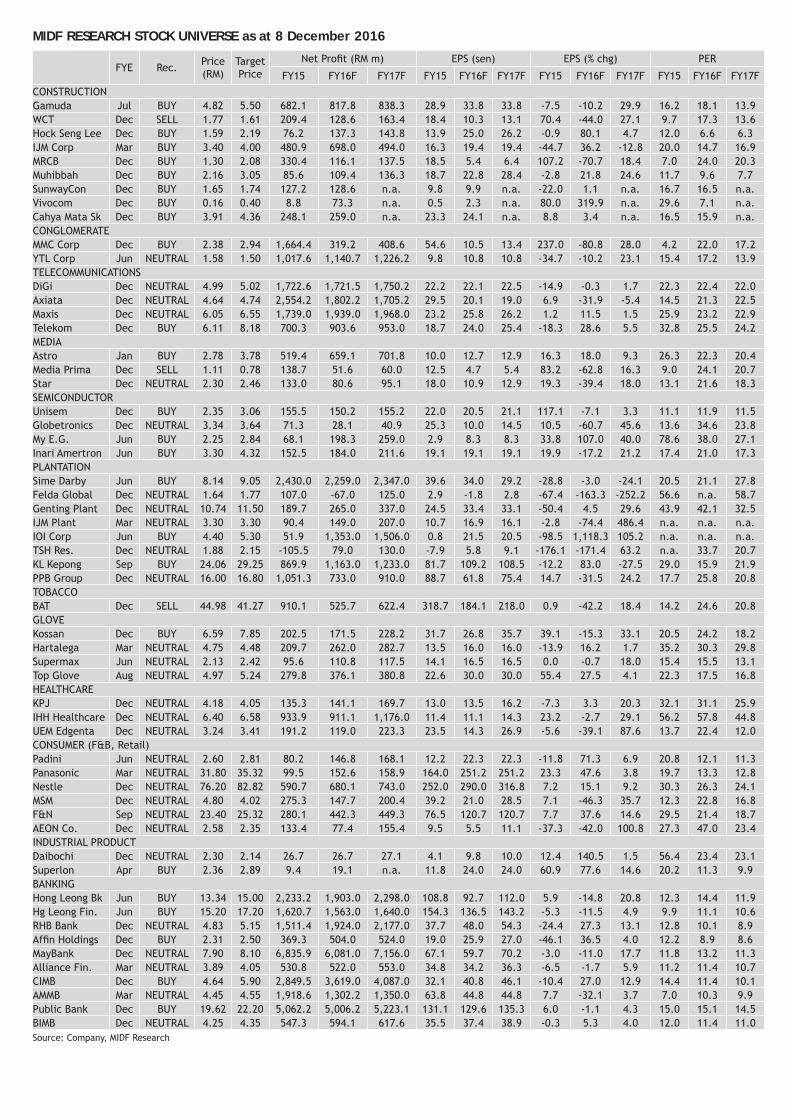
58 DECEMBER 2016
MALAYSIA EQUITY RESEARCH
MIDF RESEARCH STOCK UNIVERSE as at 8 December 2016
FYE Rec. Price(RM)
TargetPrice
NetProfit(RMm) EPS(sen) EPS(%chg) PER
FY15 FY16F FY17F FY15 FY16F FY17F FY15 FY16F FY17F FY15 FY16F FY17FCONSTRUCTIONGamuda Jul BUY 4.82 5.50 682.1 817.8 838.3 28.9 33.8 33.8 -7.5 -10.2 29.9 16.2 18.1 13.9WCT Dec SELL 1.77 1.61 209.4 128.6 163.4 18.4 10.3 13.1 70.4 -44.0 27.1 9.7 17.3 13.6HockSengLee Dec BUY 1.59 2.19 76.2 137.3 143.8 13.9 25.0 26.2 -0.9 80.1 4.7 12.0 6.6 6.3IJMCorp Mar BUY 3.40 4.00 480.9 698.0 494.0 16.3 19.4 19.4 -44.7 36.2 -12.8 20.0 14.7 16.9MRCB Dec BUY 1.30 2.08 330.4 116.1 137.5 18.5 5.4 6.4 107.2 -70.7 18.4 7.0 24.0 20.3Muhibbah Dec BUY 2.16 3.05 85.6 109.4 136.3 18.7 22.8 28.4 -2.8 21.8 24.6 11.7 9.6 7.7SunwayCon Dec BUY 1.65 1.74 127.2 128.6 n.a. 9.8 9.9 n.a. -22.0 1.1 n.a. 16.7 16.5 n.a.Vivocom Dec BUY 0.16 0.40 8.8 73.3 n.a. 0.5 2.3 n.a. 80.0 319.9 n.a. 29.6 7.1 n.a.CahyaMataSk Dec BUY 3.91 4.36 248.1 259.0 n.a. 23.3 24.1 n.a. 8.8 3.4 n.a. 16.5 15.9 n.a.CONGLOMERATEMMCCorp Dec BUY 2.38 2.94 1,664.4 319.2 408.6 54.6 10.5 13.4 237.0 -80.8 28.0 4.2 22.0 17.2YTLCorp Jun NEUTRAL 1.58 1.50 1,017.6 1,140.7 1,226.2 9.8 10.8 10.8 -34.7 -10.2 23.1 15.4 17.2 13.9TELECOMMUNICATIONSDiGi Dec NEUTRAL 4.99 5.02 1,722.6 1,721.5 1,750.2 22.2 22.1 22.5 -14.9 -0.3 1.7 22.3 22.4 22.0Axiata Dec NEUTRAL 4.64 4.74 2,554.2 1,802.2 1,705.2 29.5 20.1 19.0 6.9 -31.9 -5.4 14.5 21.3 22.5Maxis Dec NEUTRAL 6.05 6.55 1,739.0 1,939.0 1,968.0 23.2 25.8 26.2 1.2 11.5 1.5 25.9 23.2 22.9Telekom Dec BUY 6.11 8.18 700.3 903.6 953.0 18.7 24.0 25.4 -18.3 28.6 5.5 32.8 25.5 24.2MEDIAAstro Jan BUY 2.78 3.78 519.4 659.1 701.8 10.0 12.7 12.9 16.3 18.0 9.3 26.3 22.3 20.4MediaPrima Dec SELL 1.11 0.78 138.7 51.6 60.0 12.5 4.7 5.4 83.2 -62.8 16.3 9.0 24.1 20.7Star Dec NEUTRAL 2.30 2.46 133.0 80.6 95.1 18.0 10.9 12.9 19.3 -39.4 18.0 13.1 21.6 18.3SEMICONDUCTORUnisem Dec BUY 2.35 3.06 155.5 150.2 155.2 22.0 20.5 21.1 117.1 -7.1 3.3 11.1 11.9 11.5Globetronics Dec NEUTRAL 3.34 3.64 71.3 28.1 40.9 25.3 10.0 14.5 10.5 -60.7 45.6 13.6 34.6 23.8MyE.G. Jun BUY 2.25 2.84 68.1 198.3 259.0 2.9 8.3 8.3 33.8 107.0 40.0 78.6 38.0 27.1InariAmertron Jun BUY 3.30 4.32 152.5 184.0 211.6 19.1 19.1 19.1 19.9 -17.2 21.2 17.4 21.0 17.3PLANTATIONSimeDarby Jun BUY 8.14 9.05 2,430.0 2,259.0 2,347.0 39.6 34.0 29.2 -28.8 -3.0 -24.1 20.5 21.1 27.8FeldaGlobal Dec NEUTRAL 1.64 1.77 107.0 -67.0 125.0 2.9 -1.8 2.8 -67.4 -163.3 -252.2 56.6 n.a. 58.7GentingPlant Dec NEUTRAL 10.74 11.50 189.7 265.0 337.0 24.5 33.4 33.1 -50.4 4.5 29.6 43.9 42.1 32.5IJMPlant Mar NEUTRAL 3.30 3.30 90.4 149.0 207.0 10.7 16.9 16.1 -2.8 -74.4 486.4 n.a. n.a. n.a.IOICorp Jun BUY 4.40 5.30 51.9 1,353.0 1,506.0 0.8 21.5 20.5 -98.5 1,118.3 105.2 n.a. n.a. n.a.TSHRes. Dec NEUTRAL 1.88 2.15 -105.5 79.0 130.0 -7.9 5.8 9.1 -176.1 -171.4 63.2 n.a. 33.7 20.7KLKepong Sep BUY 24.06 29.25 869.9 1,163.0 1,233.0 81.7 109.2 108.5 -12.2 83.0 -27.5 29.0 15.9 21.9PPBGroup Dec NEUTRAL 16.00 16.80 1,051.3 733.0 910.0 88.7 61.8 75.4 14.7 -31.5 24.2 17.7 25.8 20.8TOBACCOBAT Dec SELL 44.98 41.27 910.1 525.7 622.4 318.7 184.1 218.0 0.9 -42.2 18.4 14.2 24.6 20.8GLOVEKossan Dec BUY 6.59 7.85 202.5 171.5 228.2 31.7 26.8 35.7 39.1 -15.3 33.1 20.5 24.2 18.2Hartalega Mar NEUTRAL 4.75 4.48 209.7 262.0 282.7 13.5 16.0 16.0 -13.9 16.2 1.7 35.2 30.3 29.8Supermax Jun NEUTRAL 2.13 2.42 95.6 110.8 117.5 14.1 16.5 16.5 0.0 -0.7 18.0 15.4 15.5 13.1TopGlove Aug NEUTRAL 4.97 5.24 279.8 376.1 380.8 22.6 30.0 30.0 55.4 27.5 4.1 22.3 17.5 16.8HEALTHCAREKPJ Dec NEUTRAL 4.18 4.05 135.3 141.1 169.7 13.0 13.5 16.2 -7.3 3.3 20.3 32.1 31.1 25.9IHHHealthcare Dec NEUTRAL 6.40 6.58 933.9 911.1 1,176.0 11.4 11.1 14.3 23.2 -2.7 29.1 56.2 57.8 44.8UEMEdgenta Dec NEUTRAL 3.24 3.41 191.2 119.0 223.3 23.5 14.3 26.9 -5.6 -39.1 87.6 13.7 22.4 12.0CONSUMER(F&B,Retail)Padini Jun NEUTRAL 2.60 2.81 80.2 146.8 168.1 12.2 22.3 22.3 -11.8 71.3 6.9 20.8 12.1 11.3Panasonic Mar NEUTRAL 31.80 35.32 99.5 152.6 158.9 164.0 251.2 251.2 23.3 47.6 3.8 19.7 13.3 12.8Nestle Dec NEUTRAL 76.20 82.82 590.7 680.1 743.0 252.0 290.0 316.8 7.2 15.1 9.2 30.3 26.3 24.1MSM Dec NEUTRAL 4.80 4.02 275.3 147.7 200.4 39.2 21.0 28.5 7.1 -46.3 35.7 12.3 22.8 16.8F&N Sep NEUTRAL 23.40 25.32 280.1 442.3 449.3 76.5 120.7 120.7 7.7 37.6 14.6 29.5 21.4 18.7AEONCo. Dec NEUTRAL 2.58 2.35 133.4 77.4 155.4 9.5 5.5 11.1 -37.3 -42.0 100.8 27.3 47.0 23.4INDUSTRIALPRODUCTDaibochi Dec NEUTRAL 2.30 2.14 26.7 26.7 27.1 4.1 9.8 10.0 12.4 140.5 1.5 56.4 23.4 23.1Superlon Apr BUY 2.36 2.89 9.4 19.1 n.a. 11.8 24.0 24.0 60.9 77.6 14.6 20.2 11.3 9.9BANKINGHongLeongBk Jun BUY 13.34 15.00 2,233.2 1,903.0 2,298.0 108.8 92.7 112.0 5.9 -14.8 20.8 12.3 14.4 11.9HgLeongFin. Jun BUY 15.20 17.20 1,620.7 1,563.0 1,640.0 154.3 136.5 143.2 -5.3 -11.5 4.9 9.9 11.1 10.6RHBBank Dec NEUTRAL 4.83 5.15 1,511.4 1,924.0 2,177.0 37.7 48.0 54.3 -24.4 27.3 13.1 12.8 10.1 8.9AffinHoldings Dec BUY 2.31 2.50 369.3 504.0 524.0 19.0 25.9 27.0 -46.1 36.5 4.0 12.2 8.9 8.6MayBank Dec NEUTRAL 7.90 8.10 6,835.9 6,081.0 7,156.0 67.1 59.7 70.2 -3.0 -11.0 17.7 11.8 13.2 11.3AllianceFin. Mar NEUTRAL 3.89 4.05 530.8 522.0 553.0 34.8 34.2 36.3 -6.5 -1.7 5.9 11.2 11.4 10.7CIMB Dec BUY 4.64 5.90 2,849.5 3,619.0 4,087.0 32.1 40.8 46.1 -10.4 27.0 12.9 14.4 11.4 10.1AMMB Mar NEUTRAL 4.45 4.55 1,918.6 1,302.2 1,350.0 63.8 44.8 44.8 7.7 -32.1 3.7 7.0 10.3 9.9PublicBank Dec BUY 19.62 22.20 5,062.2 5,006.2 5,223.1 131.1 129.6 135.3 6.0 -1.1 4.3 15.0 15.1 14.5BIMB Dec NEUTRAL 4.25 4.35 547.3 594.1 617.6 35.5 37.4 38.9 -0.3 5.3 4.0 12.0 11.4 11.0Source:Company,MIDFResearch
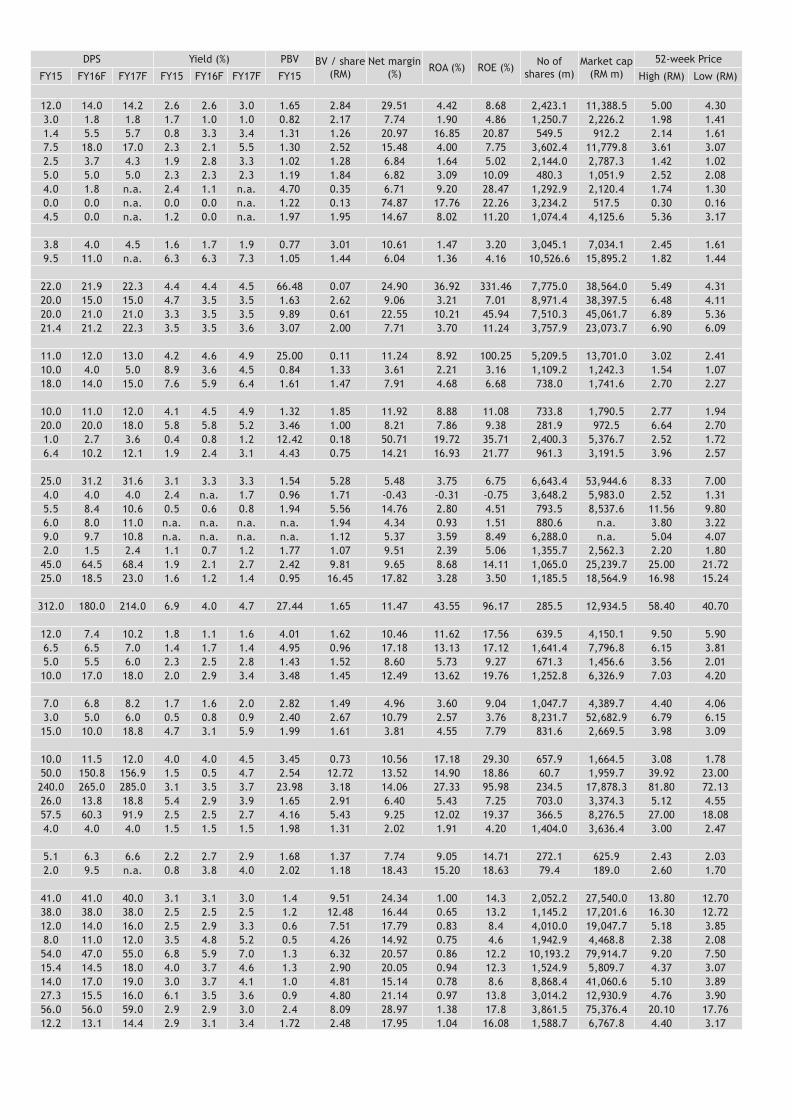
59DECEMBER 2016
MALAYSIA EQUITY RESEARCHDPS Yield(%) PBV BV/share(RM)
Netmargin(%) ROA(%) ROE(%) Noof
shares(m)Marketcap(RMm)
52-weekPrice
FY15 FY16F FY17F FY15 FY16F FY17F FY15 High(RM) Low(RM)
12.0 14.0 14.2 2.6 2.6 3.0 1.65 2.84 29.51 4.42 8.68 2,423.1 11,388.5 5.00 4.303.0 1.8 1.8 1.7 1.0 1.0 0.82 2.17 7.74 1.90 4.86 1,250.7 2,226.2 1.98 1.411.4 5.5 5.7 0.8 3.3 3.4 1.31 1.26 20.97 16.85 20.87 549.5 912.2 2.14 1.617.5 18.0 17.0 2.3 2.1 5.5 1.30 2.52 15.48 4.00 7.75 3,602.4 11,779.8 3.61 3.072.5 3.7 4.3 1.9 2.8 3.3 1.02 1.28 6.84 1.64 5.02 2,144.0 2,787.3 1.42 1.025.0 5.0 5.0 2.3 2.3 2.3 1.19 1.84 6.82 3.09 10.09 480.3 1,051.9 2.52 2.084.0 1.8 n.a. 2.4 1.1 n.a. 4.70 0.35 6.71 9.20 28.47 1,292.9 2,120.4 1.74 1.300.0 0.0 n.a. 0.0 0.0 n.a. 1.22 0.13 74.87 17.76 22.26 3,234.2 517.5 0.30 0.164.5 0.0 n.a. 1.2 0.0 n.a. 1.97 1.95 14.67 8.02 11.20 1,074.4 4,125.6 5.36 3.17
3.8 4.0 4.5 1.6 1.7 1.9 0.77 3.01 10.61 1.47 3.20 3,045.1 7,034.1 2.45 1.619.5 11.0 n.a. 6.3 6.3 7.3 1.05 1.44 6.04 1.36 4.16 10,526.6 15,895.2 1.82 1.44
22.0 21.9 22.3 4.4 4.4 4.5 66.48 0.07 24.90 36.92 331.46 7,775.0 38,564.0 5.49 4.3120.0 15.0 15.0 4.7 3.5 3.5 1.63 2.62 9.06 3.21 7.01 8,971.4 38,397.5 6.48 4.1120.0 21.0 21.0 3.3 3.5 3.5 9.89 0.61 22.55 10.21 45.94 7,510.3 45,061.7 6.89 5.3621.4 21.2 22.3 3.5 3.5 3.6 3.07 2.00 7.71 3.70 11.24 3,757.9 23,073.7 6.90 6.09
11.0 12.0 13.0 4.2 4.6 4.9 25.00 0.11 11.24 8.92 100.25 5,209.5 13,701.0 3.02 2.4110.0 4.0 5.0 8.9 3.6 4.5 0.84 1.33 3.61 2.21 3.16 1,109.2 1,242.3 1.54 1.0718.0 14.0 15.0 7.6 5.9 6.4 1.61 1.47 7.91 4.68 6.68 738.0 1,741.6 2.70 2.27
10.0 11.0 12.0 4.1 4.5 4.9 1.32 1.85 11.92 8.88 11.08 733.8 1,790.5 2.77 1.9420.0 20.0 18.0 5.8 5.8 5.2 3.46 1.00 8.21 7.86 9.38 281.9 972.5 6.64 2.701.0 2.7 3.6 0.4 0.8 1.2 12.42 0.18 50.71 19.72 35.71 2,400.3 5,376.7 2.52 1.726.4 10.2 12.1 1.9 2.4 3.1 4.43 0.75 14.21 16.93 21.77 961.3 3,191.5 3.96 2.57
25.0 31.2 31.6 3.1 3.3 3.3 1.54 5.28 5.48 3.75 6.75 6,643.4 53,944.6 8.33 7.004.0 4.0 4.0 2.4 n.a. 1.7 0.96 1.71 -0.43 -0.31 -0.75 3,648.2 5,983.0 2.52 1.315.5 8.4 10.6 0.5 0.6 0.8 1.94 5.56 14.76 2.80 4.51 793.5 8,537.6 11.56 9.806.0 8.0 11.0 n.a. n.a. n.a. n.a. 1.94 4.34 0.93 1.51 880.6 n.a. 3.80 3.229.0 9.7 10.8 n.a. n.a. n.a. n.a. 1.12 5.37 3.59 8.49 6,288.0 n.a. 5.04 4.072.0 1.5 2.4 1.1 0.7 1.2 1.77 1.07 9.51 2.39 5.06 1,355.7 2,562.3 2.20 1.8045.0 64.5 68.4 1.9 2.1 2.7 2.42 9.81 9.65 8.68 14.11 1,065.0 25,239.7 25.00 21.7225.0 18.5 23.0 1.6 1.2 1.4 0.95 16.45 17.82 3.28 3.50 1,185.5 18,564.9 16.98 15.24
312.0 180.0 214.0 6.9 4.0 4.7 27.44 1.65 11.47 43.55 96.17 285.5 12,934.5 58.40 40.70
12.0 7.4 10.2 1.8 1.1 1.6 4.01 1.62 10.46 11.62 17.56 639.5 4,150.1 9.50 5.906.5 6.5 7.0 1.4 1.7 1.4 4.95 0.96 17.18 13.13 17.12 1,641.4 7,796.8 6.15 3.815.0 5.5 6.0 2.3 2.5 2.8 1.43 1.52 8.60 5.73 9.27 671.3 1,456.6 3.56 2.0110.0 17.0 18.0 2.0 2.9 3.4 3.48 1.45 12.49 13.62 19.76 1,252.8 6,326.9 7.03 4.20
7.0 6.8 8.2 1.7 1.6 2.0 2.82 1.49 4.96 3.60 9.04 1,047.7 4,389.7 4.40 4.063.0 5.0 6.0 0.5 0.8 0.9 2.40 2.67 10.79 2.57 3.76 8,231.7 52,682.9 6.79 6.1515.0 10.0 18.8 4.7 3.1 5.9 1.99 1.61 3.81 4.55 7.79 831.6 2,669.5 3.98 3.09
10.0 11.5 12.0 4.0 4.0 4.5 3.45 0.73 10.56 17.18 29.30 657.9 1,664.5 3.08 1.7850.0 150.8 156.9 1.5 0.5 4.7 2.54 12.72 13.52 14.90 18.86 60.7 1,959.7 39.92 23.00240.0 265.0 285.0 3.1 3.5 3.7 23.98 3.18 14.06 27.33 95.98 234.5 17,878.3 81.80 72.1326.0 13.8 18.8 5.4 2.9 3.9 1.65 2.91 6.40 5.43 7.25 703.0 3,374.3 5.12 4.5557.5 60.3 91.9 2.5 2.5 2.7 4.16 5.43 9.25 12.02 19.37 366.5 8,276.5 27.00 18.084.0 4.0 4.0 1.5 1.5 1.5 1.98 1.31 2.02 1.91 4.20 1,404.0 3,636.4 3.00 2.47
5.1 6.3 6.6 2.2 2.7 2.9 1.68 1.37 7.74 9.05 14.71 272.1 625.9 2.43 2.032.0 9.5 n.a. 0.8 3.8 4.0 2.02 1.18 18.43 15.20 18.63 79.4 189.0 2.60 1.70
41.0 41.0 40.0 3.1 3.1 3.0 1.4 9.51 24.34 1.00 14.3 2,052.2 27,540.0 13.80 12.7038.0 38.0 38.0 2.5 2.5 2.5 1.2 12.48 16.44 0.65 13.2 1,145.2 17,201.6 16.30 12.7212.0 14.0 16.0 2.5 2.9 3.3 0.6 7.51 17.79 0.83 8.4 4,010.0 19,047.7 5.18 3.858.0 11.0 12.0 3.5 4.8 5.2 0.5 4.26 14.92 0.75 4.6 1,942.9 4,468.8 2.38 2.0854.0 47.0 55.0 6.8 5.9 7.0 1.3 6.32 20.57 0.86 12.2 10,193.2 79,914.7 9.20 7.5015.4 14.5 18.0 4.0 3.7 4.6 1.3 2.90 20.05 0.94 12.3 1,524.9 5,809.7 4.37 3.0714.0 17.0 19.0 3.0 3.7 4.1 1.0 4.81 15.14 0.78 8.6 8,868.4 41,060.6 5.10 3.8927.3 15.5 16.0 6.1 3.5 3.6 0.9 4.80 21.14 0.97 13.8 3,014.2 12,930.9 4.76 3.9056.0 56.0 59.0 2.9 2.9 3.0 2.4 8.09 28.97 1.38 17.8 3,861.5 75,376.4 20.10 17.7612.2 13.1 14.4 2.9 3.1 3.4 1.72 2.48 17.95 1.04 16.08 1,588.7 6,767.8 4.40 3.17
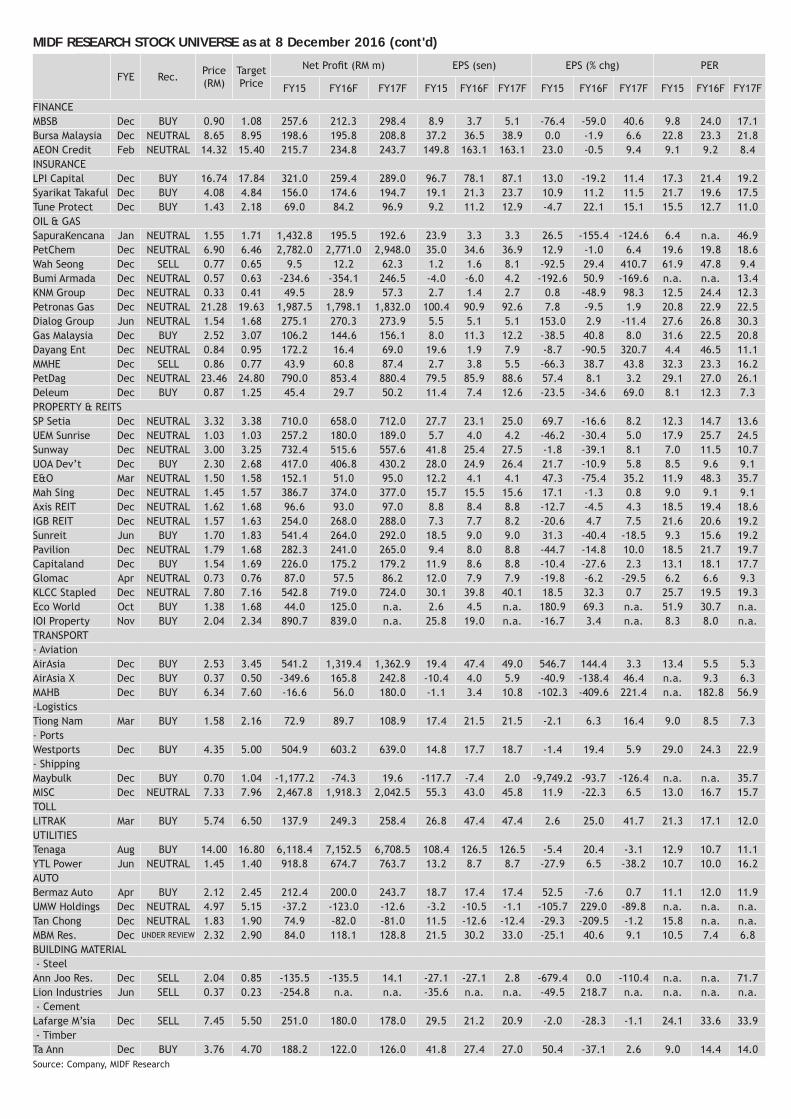
60 DECEMBER 2016
MALAYSIA EQUITY RESEARCHMIDF RESEARCH STOCK UNIVERSE as at 8 December 2016 (cont'd)
FYE Rec. Price(RM)
TargetPrice
NetProfit(RMm) EPS(sen) EPS(%chg) PER
FY15 FY16F FY17F FY15 FY16F FY17F FY15 FY16F FY17F FY15 FY16F FY17F
FINANCEMBSB Dec BUY 0.90 1.08 257.6 212.3 298.4 8.9 3.7 5.1 -76.4 -59.0 40.6 9.8 24.0 17.1BursaMalaysia Dec NEUTRAL 8.65 8.95 198.6 195.8 208.8 37.2 36.5 38.9 0.0 -1.9 6.6 22.8 23.3 21.8AEONCredit Feb NEUTRAL 14.32 15.40 215.7 234.8 243.7 149.8 163.1 163.1 23.0 -0.5 9.4 9.1 9.2 8.4INSURANCELPICapital Dec BUY 16.74 17.84 321.0 259.4 289.0 96.7 78.1 87.1 13.0 -19.2 11.4 17.3 21.4 19.2SyarikatTakaful Dec BUY 4.08 4.84 156.0 174.6 194.7 19.1 21.3 23.7 10.9 11.2 11.5 21.7 19.6 17.5TuneProtect Dec BUY 1.43 2.18 69.0 84.2 96.9 9.2 11.2 12.9 -4.7 22.1 15.1 15.5 12.7 11.0OIL&GASSapuraKencana Jan NEUTRAL 1.55 1.71 1,432.8 195.5 192.6 23.9 3.3 3.3 26.5 -155.4 -124.6 6.4 n.a. 46.9PetChem Dec NEUTRAL 6.90 6.46 2,782.0 2,771.0 2,948.0 35.0 34.6 36.9 12.9 -1.0 6.4 19.6 19.8 18.6WahSeong Dec SELL 0.77 0.65 9.5 12.2 62.3 1.2 1.6 8.1 -92.5 29.4 410.7 61.9 47.8 9.4BumiArmada Dec NEUTRAL 0.57 0.63 -234.6 -354.1 246.5 -4.0 -6.0 4.2 -192.6 50.9 -169.6 n.a. n.a. 13.4KNMGroup Dec NEUTRAL 0.33 0.41 49.5 28.9 57.3 2.7 1.4 2.7 0.8 -48.9 98.3 12.5 24.4 12.3PetronasGas Dec NEUTRAL 21.28 19.63 1,987.5 1,798.1 1,832.0 100.4 90.9 92.6 7.8 -9.5 1.9 20.8 22.9 22.5DialogGroup Jun NEUTRAL 1.54 1.68 275.1 270.3 273.9 5.5 5.1 5.1 153.0 2.9 -11.4 27.6 26.8 30.3GasMalaysia Dec BUY 2.52 3.07 106.2 144.6 156.1 8.0 11.3 12.2 -38.5 40.8 8.0 31.6 22.5 20.8DayangEnt Dec NEUTRAL 0.84 0.95 172.2 16.4 69.0 19.6 1.9 7.9 -8.7 -90.5 320.7 4.4 46.5 11.1MMHE Dec SELL 0.86 0.77 43.9 60.8 87.4 2.7 3.8 5.5 -66.3 38.7 43.8 32.3 23.3 16.2PetDag Dec NEUTRAL 23.46 24.80 790.0 853.4 880.4 79.5 85.9 88.6 57.4 8.1 3.2 29.1 27.0 26.1Deleum Dec BUY 0.87 1.25 45.4 29.7 50.2 11.4 7.4 12.6 -23.5 -34.6 69.0 8.1 12.3 7.3PROPERTY&REITSSPSetia Dec NEUTRAL 3.32 3.38 710.0 658.0 712.0 27.7 23.1 25.0 69.7 -16.6 8.2 12.3 14.7 13.6UEMSunrise Dec NEUTRAL 1.03 1.03 257.2 180.0 189.0 5.7 4.0 4.2 -46.2 -30.4 5.0 17.9 25.7 24.5Sunway Dec NEUTRAL 3.00 3.25 732.4 515.6 557.6 41.8 25.4 27.5 -1.8 -39.1 8.1 7.0 11.5 10.7UOADev’t Dec BUY 2.30 2.68 417.0 406.8 430.2 28.0 24.9 26.4 21.7 -10.9 5.8 8.5 9.6 9.1E&O Mar NEUTRAL 1.50 1.58 152.1 51.0 95.0 12.2 4.1 4.1 47.3 -75.4 35.2 11.9 48.3 35.7MahSing Dec NEUTRAL 1.45 1.57 386.7 374.0 377.0 15.7 15.5 15.6 17.1 -1.3 0.8 9.0 9.1 9.1AxisREIT Dec NEUTRAL 1.62 1.68 96.6 93.0 97.0 8.8 8.4 8.8 -12.7 -4.5 4.3 18.5 19.4 18.6IGBREIT Dec NEUTRAL 1.57 1.63 254.0 268.0 288.0 7.3 7.7 8.2 -20.6 4.7 7.5 21.6 20.6 19.2Sunreit Jun BUY 1.70 1.83 541.4 264.0 292.0 18.5 9.0 9.0 31.3 -40.4 -18.5 9.3 15.6 19.2Pavilion Dec NEUTRAL 1.79 1.68 282.3 241.0 265.0 9.4 8.0 8.8 -44.7 -14.8 10.0 18.5 21.7 19.7Capitaland Dec BUY 1.54 1.69 226.0 175.2 179.2 11.9 8.6 8.8 -10.4 -27.6 2.3 13.1 18.1 17.7Glomac Apr NEUTRAL 0.73 0.76 87.0 57.5 86.2 12.0 7.9 7.9 -19.8 -6.2 -29.5 6.2 6.6 9.3KLCCStapled Dec NEUTRAL 7.80 7.16 542.8 719.0 724.0 30.1 39.8 40.1 18.5 32.3 0.7 25.7 19.5 19.3EcoWorld Oct BUY 1.38 1.68 44.0 125.0 n.a. 2.6 4.5 n.a. 180.9 69.3 n.a. 51.9 30.7 n.a.IOIProperty Nov BUY 2.04 2.34 890.7 839.0 n.a. 25.8 19.0 n.a. -16.7 3.4 n.a. 8.3 8.0 n.a.TRANSPORT-AviationAirAsia Dec BUY 2.53 3.45 541.2 1,319.4 1,362.9 19.4 47.4 49.0 546.7 144.4 3.3 13.4 5.5 5.3AirAsiaX Dec BUY 0.37 0.50 -349.6 165.8 242.8 -10.4 4.0 5.9 -40.9 -138.4 46.4 n.a. 9.3 6.3MAHB Dec BUY 6.34 7.60 -16.6 56.0 180.0 -1.1 3.4 10.8 -102.3 -409.6 221.4 n.a. 182.8 56.9-LogisticsTiongNam Mar BUY 1.58 2.16 72.9 89.7 108.9 17.4 21.5 21.5 -2.1 6.3 16.4 9.0 8.5 7.3-PortsWestports Dec BUY 4.35 5.00 504.9 603.2 639.0 14.8 17.7 18.7 -1.4 19.4 5.9 29.0 24.3 22.9-ShippingMaybulk Dec BUY 0.70 1.04 -1,177.2 -74.3 19.6 -117.7 -7.4 2.0 -9,749.2 -93.7 -126.4 n.a. n.a. 35.7MISC Dec NEUTRAL 7.33 7.96 2,467.8 1,918.3 2,042.5 55.3 43.0 45.8 11.9 -22.3 6.5 13.0 16.7 15.7TOLLLITRAK Mar BUY 5.74 6.50 137.9 249.3 258.4 26.8 47.4 47.4 2.6 25.0 41.7 21.3 17.1 12.0UTILITIESTenaga Aug BUY 14.00 16.80 6,118.4 7,152.5 6,708.5 108.4 126.5 126.5 -5.4 20.4 -3.1 12.9 10.7 11.1YTLPower Jun NEUTRAL 1.45 1.40 918.8 674.7 763.7 13.2 8.7 8.7 -27.9 6.5 -38.2 10.7 10.0 16.2AUTOBermazAuto Apr BUY 2.12 2.45 212.4 200.0 243.7 18.7 17.4 17.4 52.5 -7.6 0.7 11.1 12.0 11.9UMWHoldings Dec NEUTRAL 4.97 5.15 -37.2 -123.0 -12.6 -3.2 -10.5 -1.1 -105.7 229.0 -89.8 n.a. n.a. n.a.TanChong Dec NEUTRAL 1.83 1.90 74.9 -82.0 -81.0 11.5 -12.6 -12.4 -29.3 -209.5 -1.2 15.8 n.a. n.a.MBMRes. Dec UNDERREVIEW 2.32 2.90 84.0 118.1 128.8 21.5 30.2 33.0 -25.1 40.6 9.1 10.5 7.4 6.8BUILDINGMATERIAL-SteelAnnJooRes. Dec SELL 2.04 0.85 -135.5 -135.5 14.1 -27.1 -27.1 2.8 -679.4 0.0 -110.4 n.a. n.a. 71.7LionIndustries Jun SELL 0.37 0.23 -254.8 n.a. n.a. -35.6 n.a. n.a. -49.5 218.7 n.a. n.a. n.a. n.a.-CementLafargeM’sia Dec SELL 7.45 5.50 251.0 180.0 178.0 29.5 21.2 20.9 -2.0 -28.3 -1.1 24.1 33.6 33.9-TimberTaAnn Dec BUY 3.76 4.70 188.2 122.0 126.0 41.8 27.4 27.0 50.4 -37.1 2.6 9.0 14.4 14.0Source:Company,MIDFResearch
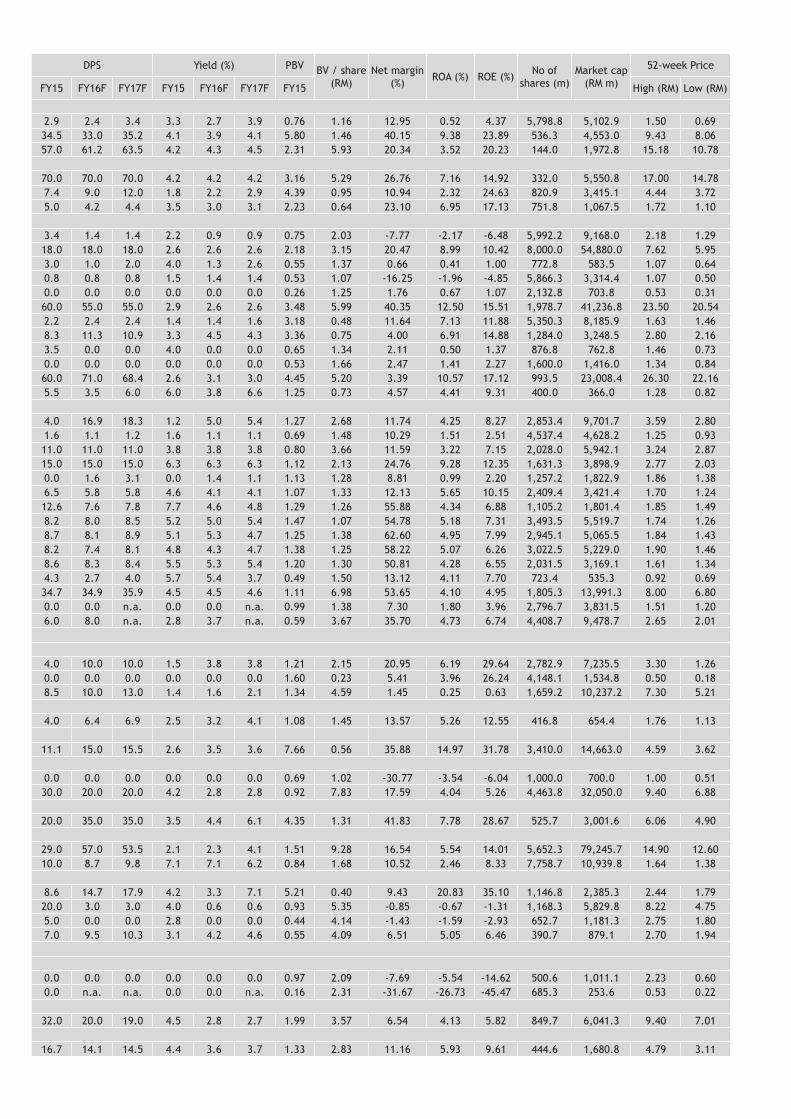
61DECEMBER 2016
MALAYSIA EQUITY RESEARCHDPS Yield(%) PBV BV/share(RM)
Netmargin(%) ROA(%) ROE(%) Noof
shares(m)Marketcap(RMm)
52-weekPrice
FY15 FY16F FY17F FY15 FY16F FY17F FY15 High(RM) Low(RM)
2.9 2.4 3.4 3.3 2.7 3.9 0.76 1.16 12.95 0.52 4.37 5,798.8 5,102.9 1.50 0.6934.5 33.0 35.2 4.1 3.9 4.1 5.80 1.46 40.15 9.38 23.89 536.3 4,553.0 9.43 8.0657.0 61.2 63.5 4.2 4.3 4.5 2.31 5.93 20.34 3.52 20.23 144.0 1,972.8 15.18 10.78
70.0 70.0 70.0 4.2 4.2 4.2 3.16 5.29 26.76 7.16 14.92 332.0 5,550.8 17.00 14.787.4 9.0 12.0 1.8 2.2 2.9 4.39 0.95 10.94 2.32 24.63 820.9 3,415.1 4.44 3.725.0 4.2 4.4 3.5 3.0 3.1 2.23 0.64 23.10 6.95 17.13 751.8 1,067.5 1.72 1.10
3.4 1.4 1.4 2.2 0.9 0.9 0.75 2.03 -7.77 -2.17 -6.48 5,992.2 9,168.0 2.18 1.2918.0 18.0 18.0 2.6 2.6 2.6 2.18 3.15 20.47 8.99 10.42 8,000.0 54,880.0 7.62 5.953.0 1.0 2.0 4.0 1.3 2.6 0.55 1.37 0.66 0.41 1.00 772.8 583.5 1.07 0.640.8 0.8 0.8 1.5 1.4 1.4 0.53 1.07 -16.25 -1.96 -4.85 5,866.3 3,314.4 1.07 0.500.0 0.0 0.0 0.0 0.0 0.0 0.26 1.25 1.76 0.67 1.07 2,132.8 703.8 0.53 0.3160.0 55.0 55.0 2.9 2.6 2.6 3.48 5.99 40.35 12.50 15.51 1,978.7 41,236.8 23.50 20.542.2 2.4 2.4 1.4 1.4 1.6 3.18 0.48 11.64 7.13 11.88 5,350.3 8,185.9 1.63 1.468.3 11.3 10.9 3.3 4.5 4.3 3.36 0.75 4.00 6.91 14.88 1,284.0 3,248.5 2.80 2.163.5 0.0 0.0 4.0 0.0 0.0 0.65 1.34 2.11 0.50 1.37 876.8 762.8 1.46 0.730.0 0.0 0.0 0.0 0.0 0.0 0.53 1.66 2.47 1.41 2.27 1,600.0 1,416.0 1.34 0.8460.0 71.0 68.4 2.6 3.1 3.0 4.45 5.20 3.39 10.57 17.12 993.5 23,008.4 26.30 22.165.5 3.5 6.0 6.0 3.8 6.6 1.25 0.73 4.57 4.41 9.31 400.0 366.0 1.28 0.82
4.0 16.9 18.3 1.2 5.0 5.4 1.27 2.68 11.74 4.25 8.27 2,853.4 9,701.7 3.59 2.801.6 1.1 1.2 1.6 1.1 1.1 0.69 1.48 10.29 1.51 2.51 4,537.4 4,628.2 1.25 0.9311.0 11.0 11.0 3.8 3.8 3.8 0.80 3.66 11.59 3.22 7.15 2,028.0 5,942.1 3.24 2.8715.0 15.0 15.0 6.3 6.3 6.3 1.12 2.13 24.76 9.28 12.35 1,631.3 3,898.9 2.77 2.030.0 1.6 3.1 0.0 1.4 1.1 1.13 1.28 8.81 0.99 2.20 1,257.2 1,822.9 1.86 1.386.5 5.8 5.8 4.6 4.1 4.1 1.07 1.33 12.13 5.65 10.15 2,409.4 3,421.4 1.70 1.2412.6 7.6 7.8 7.7 4.6 4.8 1.29 1.26 55.88 4.34 6.88 1,105.2 1,801.4 1.85 1.498.2 8.0 8.5 5.2 5.0 5.4 1.47 1.07 54.78 5.18 7.31 3,493.5 5,519.7 1.74 1.268.7 8.1 8.9 5.1 5.3 4.7 1.25 1.38 62.60 4.95 7.99 2,945.1 5,065.5 1.84 1.438.2 7.4 8.1 4.8 4.3 4.7 1.38 1.25 58.22 5.07 6.26 3,022.5 5,229.0 1.90 1.468.6 8.3 8.4 5.5 5.3 5.4 1.20 1.30 50.81 4.28 6.55 2,031.5 3,169.1 1.61 1.344.3 2.7 4.0 5.7 5.4 3.7 0.49 1.50 13.12 4.11 7.70 723.4 535.3 0.92 0.6934.7 34.9 35.9 4.5 4.5 4.6 1.11 6.98 53.65 4.10 4.95 1,805.3 13,991.3 8.00 6.800.0 0.0 n.a. 0.0 0.0 n.a. 0.99 1.38 7.30 1.80 3.96 2,796.7 3,831.5 1.51 1.206.0 8.0 n.a. 2.8 3.7 n.a. 0.59 3.67 35.70 4.73 6.74 4,408.7 9,478.7 2.65 2.01
4.0 10.0 10.0 1.5 3.8 3.8 1.21 2.15 20.95 6.19 29.64 2,782.9 7,235.5 3.30 1.260.0 0.0 0.0 0.0 0.0 0.0 1.60 0.23 5.41 3.96 26.24 4,148.1 1,534.8 0.50 0.188.5 10.0 13.0 1.4 1.6 2.1 1.34 4.59 1.45 0.25 0.63 1,659.2 10,237.2 7.30 5.21
4.0 6.4 6.9 2.5 3.2 4.1 1.08 1.45 13.57 5.26 12.55 416.8 654.4 1.76 1.13
11.1 15.0 15.5 2.6 3.5 3.6 7.66 0.56 35.88 14.97 31.78 3,410.0 14,663.0 4.59 3.62
0.0 0.0 0.0 0.0 0.0 0.0 0.69 1.02 -30.77 -3.54 -6.04 1,000.0 700.0 1.00 0.5130.0 20.0 20.0 4.2 2.8 2.8 0.92 7.83 17.59 4.04 5.26 4,463.8 32,050.0 9.40 6.88
20.0 35.0 35.0 3.5 4.4 6.1 4.35 1.31 41.83 7.78 28.67 525.7 3,001.6 6.06 4.90
29.0 57.0 53.5 2.1 2.3 4.1 1.51 9.28 16.54 5.54 14.01 5,652.3 79,245.7 14.90 12.6010.0 8.7 9.8 7.1 7.1 6.2 0.84 1.68 10.52 2.46 8.33 7,758.7 10,939.8 1.64 1.38
8.6 14.7 17.9 4.2 3.3 7.1 5.21 0.40 9.43 20.83 35.10 1,146.8 2,385.3 2.44 1.7920.0 3.0 3.0 4.0 0.6 0.6 0.93 5.35 -0.85 -0.67 -1.31 1,168.3 5,829.8 8.22 4.755.0 0.0 0.0 2.8 0.0 0.0 0.44 4.14 -1.43 -1.59 -2.93 652.7 1,181.3 2.75 1.807.0 9.5 10.3 3.1 4.2 4.6 0.55 4.09 6.51 5.05 6.46 390.7 879.1 2.70 1.94
0.0 0.0 0.0 0.0 0.0 0.0 0.97 2.09 -7.69 -5.54 -14.62 500.6 1,011.1 2.23 0.600.0 n.a. n.a. 0.0 0.0 n.a. 0.16 2.31 -31.67 -26.73 -45.47 685.3 253.6 0.53 0.22
32.0 20.0 19.0 4.5 2.8 2.7 1.99 3.57 6.54 4.13 5.82 849.7 6,041.3 9.40 7.01
16.7 14.1 14.5 4.4 3.6 3.7 1.33 2.83 11.16 5.93 9.61 444.6 1,680.8 4.79 3.11
62 DECEMBER 2016
MALAYSIA EQUITY RESEARCH
Research Zulkifli Hamzah .......................................................................................... [email protected] ..................... 03-21738390Head of MIDF ResearchMohd Redza Bin Abdul Rahman ....................................................................mohd.redza@midf.com.my ..................... 09-27721692Deputy Head of MIDF ResearchDr. Kamaruddin Mohd Nor ..............................................................................kamaruddin@midf.com.my ..................... 03-27721693Chief Economist of MIDF ResearchSyed Muhammed Kifni Syed Kamaruddin ..............................................................smkifni@midf.com.my ..................... 03-21738383Head of Strategy and Quantitative of MIDF Research Anuar Bin Che Wan .................................................................................... [email protected] ..................... 03-27721680Senior Quantitative AnalystKhairun ‘Adila Khazali................................................................................... [email protected] ..................... 03-27721655Quantitative Analyst Izzuddin Yusoff .....................................................................................................izzuddin@midf.com.my ..................... 03-27721670Economist (Economics)Aslam Ilman Zulkiflee .....................................................................................aslam.ilman@midf.com.my ..................... 03-27721669Economist (Economics)Imran Yassin Bin Md Yusof ...........................................................................imran.yassin@midf.com.my ..................... 03-21738395BanksAaron Tan Wei Min .............................................................................................aaron.tan@midf.com.my ..................... 03-27721650Oil & gas, Utility (Water)Alan Lim Seong Chun........................................................................................... [email protected] ..................... 03-21738464Plantation, Timber, PropertyHafriz Hezry Harihodin ................................................................................... [email protected] ..................... 03-21738392Automotive, Utility (Power)Tay Yow Ken .............................................................................................................tay.yk@midf.com.my ..................... 03-21738384Transport (Aviation, Shipping, Ports, Logistics)Noor Athila binti Mohd Razali ........................................................................... [email protected] ..................... 03-27721679Rubber Gloves, General Industries, Healthcare, Tobacco Martin Foo Chuan Loong ...................................................................................martin.foo@midf.com.my ..................... 03-21738354Telecommunications, Media, Technology Mohd Hafiz Hassan ........................................................................................ [email protected] ..................... 03-27721668Insurance, Non-bank FinancialsJessica Low Jze Tieng..................................................................................... [email protected] ..................... 03-21738391REITsAbdul Fadhli Zil Ikram Dzulkifly ...................................................................... [email protected] ..................... 03-21738463Construction, Building materialsNabil Fikri bin Zainoodin ............................................................................nabil.zainoodin@midf.com.my ..................... 03-21731663ConsumerNg Bei Shan .............................................................................................................ng.bs@midf.com.my ..................... 03-21738461Small cap
Sales and DistributionWan Ahmad Satria (Head) ................................................................................ [email protected] ..................... 03-21738728Henry Gan Yong Beng ........................................................................................henry.tan@midf.com.my ..................... 03-21738230Muhriz Nor Iskandar Mohamed Murad ...................................................................muhriz@midf.com.my ..................... 03-27721665Macy Hee Mei Yee................................................................................................ [email protected] ..................... 03-27721664
DealingKhairuddin bin Sani (Head) .............................................................................. [email protected] ..................... 03-21738361Khairi Shahrin Arief bin Baki ..................................................................................... [email protected] ..................... 03-21738386Khairul Anwar bin Abdullah .......................................................................... [email protected] ..................... 03-27721643Zainal Ariffin bin Yahya ...................................................................................zainal.ariffin@midf.com.my ..................... 03-21738468Shaiful Baharin bin Mohd Zain ............................................................. [email protected] ..................... 03-21738458Zarina binti Yusoff .................................................................................................. [email protected] ..................... 03-21738365Norlela binti Mokty ..................................................................................................norlela@midf.com.my ..................... 03-21738456Mohammad Taufiq bin Abdul Jalal ............................................................................ [email protected] ..................... 03-21738459Suzana binti Sultani ....................................................................................suzana.sultani@midf.com.my ..................... 03-21738445Ahmad Faizul bin Mohd Sharif ..................................................................... ahmad.faizul@midf,com.my ..................... 03-21738385Zuraimi bin Sanayan @ Abdul Salam .................................................................... [email protected] ..................... 03-21738363Dawne Chin Jing Li..........................................................................................dawne.chin@midf.com.my ..................... 03-21738460Nur Shamim binti Hashim ............................................................................... [email protected] ..................... 03-27721644Paul Chak Chee Yan ......................................................................................... [email protected] ..................... 03-27721690Ahmad Hafiz bin Rusli ................................................................................... [email protected] ..................... 03-21738364Elmy bin Sharudin .......................................................................................elmy.sharudin@midf.com.my ..................... 03-21738440Hanafi bin Husin ............................................................................................ [email protected] ..................... 03-27721689Mat Razi bin Daud ................................................................................................mat.razi@midf.com.my ..................... 03-21738359Nabil Fikri bin Noor Iskandar Hashim ..................................................................nabil.fikri@midf.com.my ..................... 03-21738457Norlia binti Mohd Ali .................................................................................... [email protected] ..................... 03-21738467
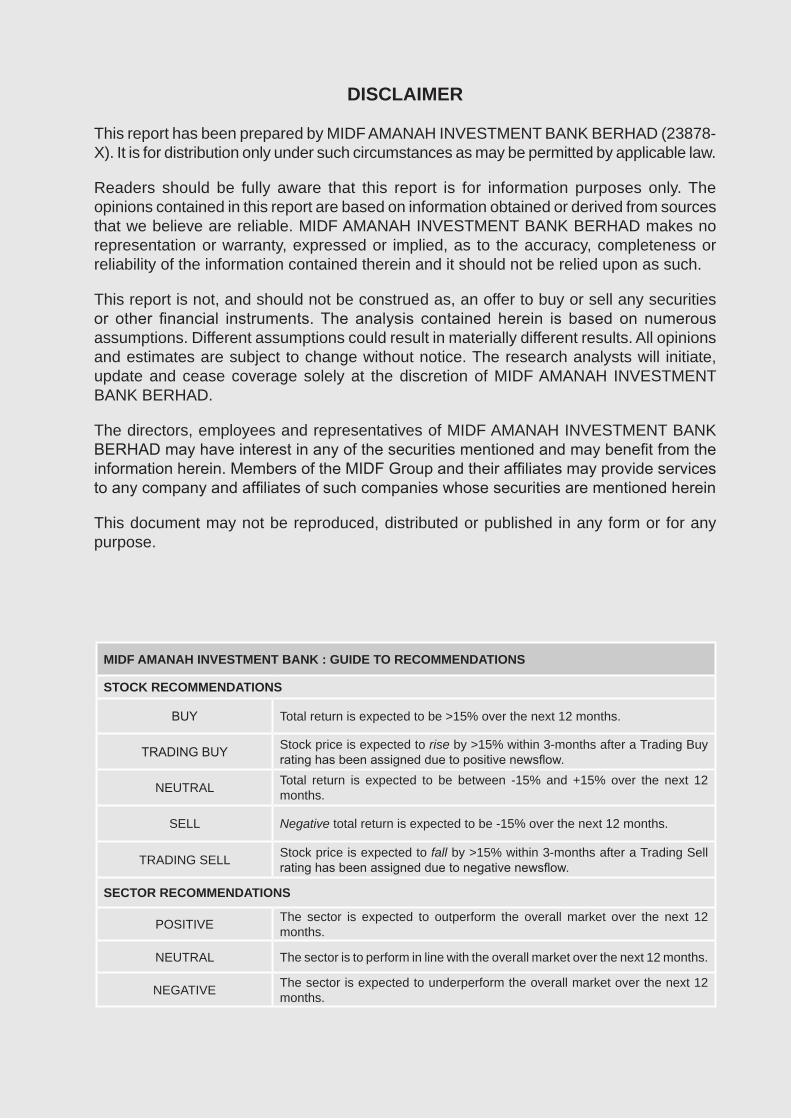
63DECEMBER 2016
MALAYSIA EQUITY RESEARCH
DISCLAIMER
This report has been prepared by MIDF AMANAH INVESTMENT BANK BERHAD (23878-X). It is for distribution only under such circumstances as may be permitted by applicable law.
Readers should be fully aware that this report is for information purposes only. The opinions contained in this report are based on information obtained or derived from sources that we believe are reliable. MIDF AMANAH INVESTMENT BANK BERHAD makes no representation or warranty, expressed or implied, as to the accuracy, completeness or reliability of the information contained therein and it should not be relied upon as such.
This report is not, and should not be construed as, an offer to buy or sell any securities or other financial instruments. The analysis contained herein is based on numerous assumptions. Different assumptions could result in materially different results. All opinions and estimates are subject to change without notice. The research analysts will initiate, update and cease coverage solely at the discretion of MIDF AMANAH INVESTMENT BANK BERHAD.
The directors, employees and representatives of MIDF AMANAH INVESTMENT BANK BERHAD may have interest in any of the securities mentioned and may benefit from the information herein. Members of the MIDF Group and their affiliates may provide services to any company and affiliates of such companies whose securities are mentioned herein
This document may not be reproduced, distributed or published in any form or for any purpose.
MIDF AMANAH INVESTMENT BANK : GUIDE TO RECOMMENDATIONS
STOCK RECOMMENDATIONS
BUY Total return is expected to be >15% over the next 12 months.
TRADING BUY Stock price is expected to rise by >15% within 3-months after a Trading Buy rating has been assigned due to positive newsflow.
NEUTRAL Total return is expected to be between -15% and +15% over the next 12 months.
SELL Negative total return is expected to be -15% over the next 12 months.
TRADING SELL Stock price is expected to fall by >15% within 3-months after a Trading Sell rating has been assigned due to negative newsflow.
SECTOR RECOMMENDATIONS
POSITIVE The sector is expected to outperform the overall market over the next 12 months.
NEUTRAL The sector is to perform in line with the overall market over the next 12 months.
NEGATIVE The sector is expected to underperform the overall market over the next 12 months.

64 DECEMBER 2016
MALAYSIA EQUITY RESEARCH
Business Address:11 & 12 th Floor, Menara MIDF, 82, Jalan Raja Chulan, 50200
Kuala Lumpur.Tel: 2173 8888Fax: 2173 8380
MIDF RESEARCH is part of MIDF Amanah Investment Bank Berhad (23878 - X)(Bank Pelaburan)
(A Participating Organisation of Bursa Malaysia Securities Berhad)