2017 - Drought · normal (1981-2010). Upper parts of Sindh and most of Balochistan experienced mild...
11
2017 Climate of Pakistan (2017) National Drought Monitoring Centre (NDMC) Headquarters Office, Sector H-8/2, Islamabad Tel : + (92-51) 9250598, Fax: + (92-51) 9250368, URL: http://www.pakmet.com.pk , Pakistan Meteorological Department
Transcript of 2017 - Drought · normal (1981-2010). Upper parts of Sindh and most of Balochistan experienced mild...
2017
Climate of Pakistan (2017)
National Drought Monitoring Centre (NDMC)
Headquarters Office, Sector H-8/2, Islamabad
Tel : + (92-51) 9250598, Fax: + (92-51) 9250368, URL: http://www.pakmet.com.pk,
Pakistan Meteorological Department
2
Climate of Pakistan in 2017
Prepared By
Ghazala Qaiser (Deputy Director)
National Drought Monitoring & Early Warning Centre, Pakistan Meteorological Department,
Islamabad
S.No. Contents Page No.
1 Introduction 3
2 Temperature 3
3 Rainfall 4
4 Extreme Events 6
5 Other Extreme Events of 2017 8
6 Drought Monitor 11

Climate of Pakistan in 201
1. Introduction Temperature and precipitation are two major elements which determine the climate of any region. Any persistent change in both or one with respect to the leads to the climate change of that region. in 2017 are listed below. 2. Temperature Average Monthly Temperatures of Pakistan for the year 201Monthly Normal Temperatures (1981
Figure 1: Departures of 201
Monthly mean temperatures of 201in February, April, May and Octobernormal while January, March, June monthly mean temperatures remain slightly below normal
3
Climate of Pakistan in 2017
Temperature and precipitation are two major elements which determine the climate of any change in both or one with respect to the long term mean or normal values
leads to the climate change of that region. Highlights of the analysis for the climate of Pakistan
es of Pakistan for the year 2017 are compared with Average Monthly Normal Temperatures (1981-2010) in figure 1.
Figure 1: Departures of 2017 mean monthly temperatures from Normal (1981
Monthly mean temperatures of 2017 were above the 1981-2010’s average normal temperaturesOctober. July, August and September temperatures were equal to June and December were near to Normal. Whereas in November
monthly mean temperatures remain slightly below normal (Fig. 1).
Temperature and precipitation are two major elements which determine the climate of any mean or normal values the climate of Pakistan
are compared with Average
(1981-2010)
normal temperatures temperatures were equal to
. Whereas in November

4
Annual Mean Temperatures (actual) for 2017 remained on higher side in most of the country
(Fig. 2). Whole Sindh remained above 250C, Punjab and major Portion of Baluchistan
experienced temperatures ranging from 240C - 270C or even higher. Only parts of extreme
Northern areas had temperatures ranging from 60C - 100C. Figure 3 above shows mean annual
temperature departures from Normal 1981 - 2010. The maximum difference of the mean annual
temperature from the normal was experienced in western parts of Pakistan including Quetta,
Bannu, Peshawar and Risalpur.
3. Rainfall In 2017, mostly districts of Balochistan and parts of Sindh suffered dryness due to well below normal rainfall. As shown in Figure 4, western parts of KP, most of Punjab, lower GB and AJK and coastal areas of Sind were near normal (1981-2010). Upper parts of Sindh and most of Balochistan experienced mild to moderate drought like conditions during the year 2017.
Figure 2: Spatial Distribution of Mean Annual Temperatures of Pakistan for 2017
Figure 3: Mean Annual Temperatures (2017) Difference from Normal
Figure 4: Percentage departure of 2017 Rainfall from Normal 1981-2010

Percentage area weighted departure of monthly rainfall of 2011981-2010 has been shown in figure 5Pakistan. The months of Februaryseen below normal precipitation. Amongst these dry months96% below normal rainfall. In the monthsnormal. January with 95% above normal precipitation was the wettestNovember also received well above normal rain (6 Major parts of Pakistan received heavy rainfall in the month of disturbance, peculiar of winter season.yet Jun received well above normal precipitation which Again the dry spell continued from July till October and again received below normal precipitation The country analysis shows well below normal rainfall (provinces of Balochistan and Sindh and Kashmir, Punjab and KPrespectively. Spatial distribution of total annual rain fall over 2017 depicts extreme rainfall over north Punjabeastern KP (the monsoon belt) (Fig.6). It is obvious from fig. months of January, June and NovemberBaluchistan received very little 100 mm which is leading to conditions in most of the areas.
Figure 5: Percentage Departures from Normal of
5
departure of monthly rainfall of 2017 from normal monthly rainfan figure 5. The analysis shows that 2017 was very
February, March, April, May, July, August, September. Amongst these dry months, October was the driest month withthe months of January, June and November rainfall
% above normal precipitation was the wettest month, yet Jun and November also received well above normal rain (62% and 48% respectively).
parts of Pakistan received heavy rainfall in the month of January due to western disturbance, peculiar of winter season. The monsoon season was going dry from preyet Jun received well above normal precipitation which provided some moistureAgain the dry spell continued from July till October and ended in November, however again received below normal precipitation.
The country analysis shows well below normal rainfall (-96.26%) during October Sindh experienced 100.0% below normal, whereasKP received -97.27%, -96.81% and -88.85%
of total annual rain fall over Pakistan for depicts extreme rainfall over north Punjab, AJK and
(the monsoon belt) which exceeded 1000mm ). It is obvious from fig. 5 that it happened in the
and November. Lower half of little rainfall ranging from 50 to
to meteorological drought
Figure 6: Spatial Distribution of Annual Rainfall over Pakistan for 2017
Figure 5: Percentage Departures from Normal of Rainfall 2017
from normal monthly rainfall of very dry year in
September, and December October was the driest month with
rainfall was above month, yet Jun and
January due to western season was going dry from pre-monsoon,
some moisture relief to the soil. ended in November, however December
96.26%) during October 2017. the whereas Gilgit-Baltistan
of normal rains
Figure 6: Spatial Distribution of Annual Total Rainfall over Pakistan for 2017
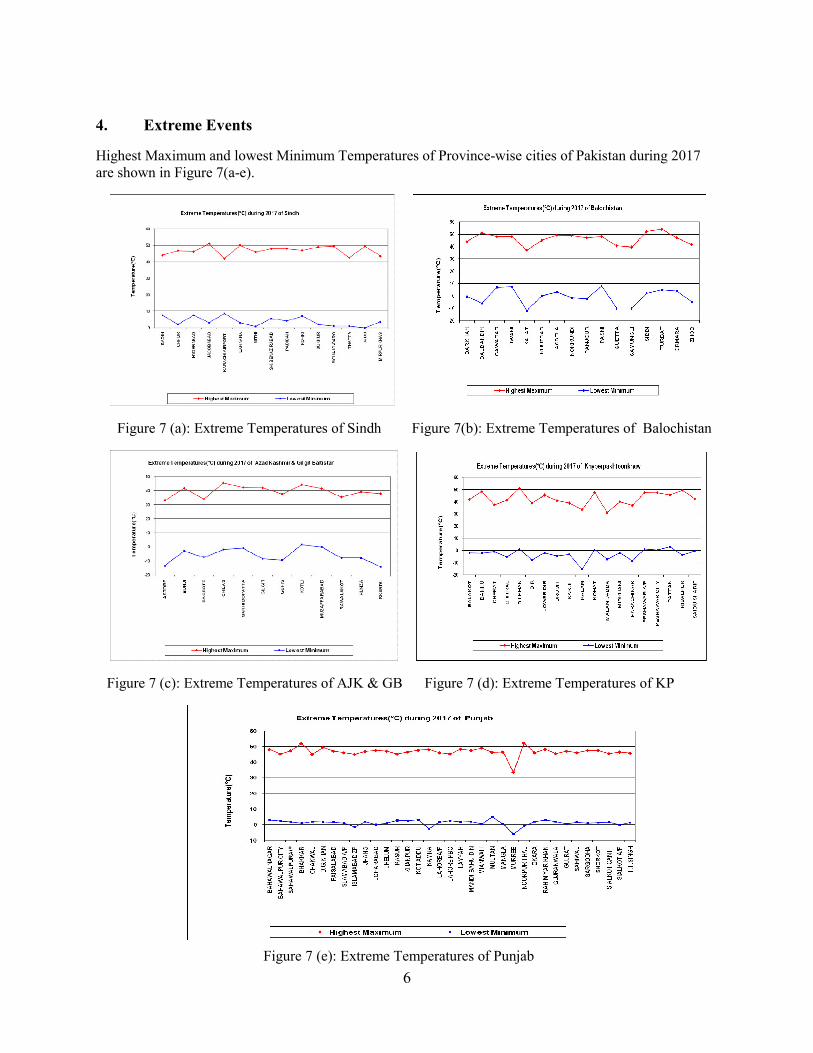
4. Extreme Events
Highest Maximum and lowest Minimum are shown in Figure 7(a-e).
Figure 7 (a): Extreme Temperatures of Sindh
Figure 7 (c): Extreme Temperatures of A
Figure 7 (e): Extreme Temperatures of Punjab
6
Highest Maximum and lowest Minimum Temperatures of Province-wise cities of Pakistan during 201
me Temperatures of Sindh Figure 7(b): Extreme Temperatures of
eratures of AJK & GB Figure 7 (d): Extreme Temperatures of KP
Figure 7 (e): Extreme Temperatures of Punjab
wise cities of Pakistan during 2017
e Temperatures of Balochistan
e Temperatures of KP

Highest daily rainfall in 2017 for different cities of e).
Figure 8 (a): Highest daily Rainfall
Figure 8 (c): Highest daily Rainfall of A
Figure 8 (e):
7
for different cities of Pakistan province-wise is given in
Highest daily Rainfall of Sindh Figure 8 (b): Highest daily Rainfall
Highest daily Rainfall of AJK & GB Figure 8 (d): Highest daily Rainfall of KP
Figure 8 (e): Highest daily Rainfall(mm) of Punjab
wise is given in figure 8(a-
Highest daily Rainfall of Balochistan
Highest daily Rainfall of KP
8
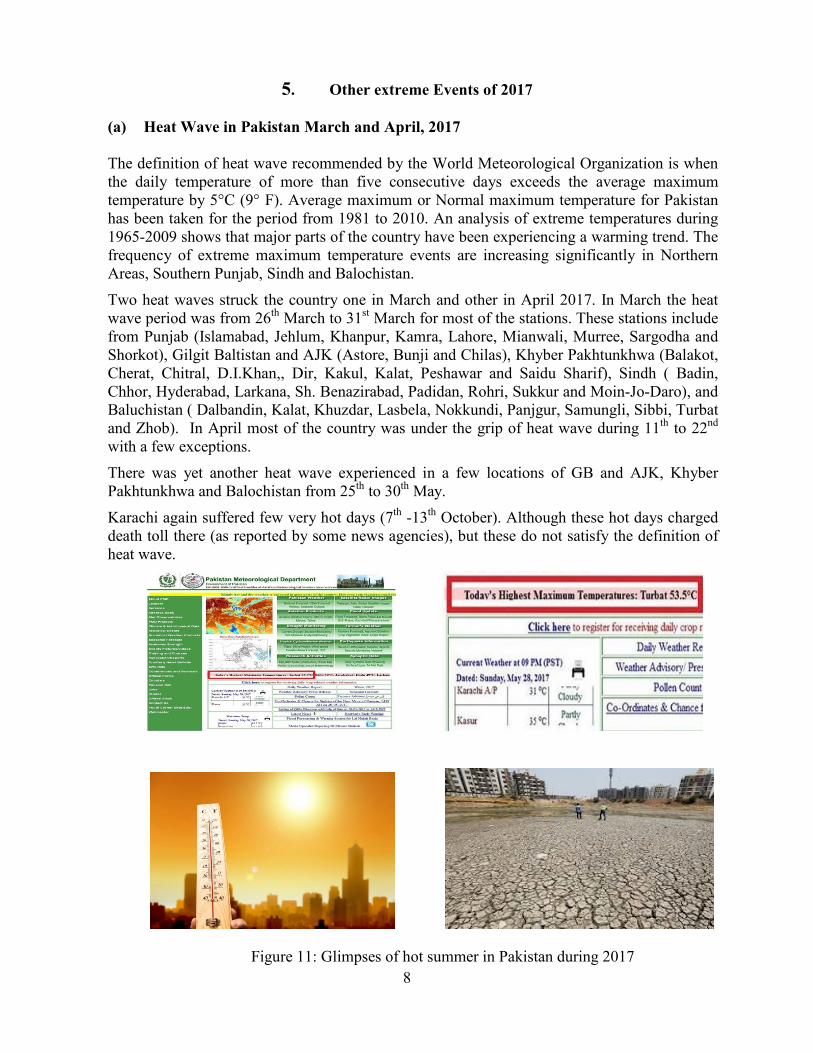
5. Other extreme Events of 2017
(a) Heat Wave in Pakistan March and April, 2017
The definition of heat wave recommended by the World Meteorological Organization is when the daily temperature of more than five consecutive days exceeds the average maximum temperature by 5°C (9° F). Average maximum or Normal maximum temperature for Pakistan has been taken for the period from 1981 to 2010. An analysis of extreme temperatures during 1965-2009 shows that major parts of the country have been experiencing a warming trend. The frequency of extreme maximum temperature events are increasing significantly in Northern Areas, Southern Punjab, Sindh and Balochistan.
Two heat waves struck the country one in March and other in April 2017. In March the heat wave period was from 26th March to 31st March for most of the stations. These stations include from Punjab (Islamabad, Jehlum, Khanpur, Kamra, Lahore, Mianwali, Murree, Sargodha and Shorkot), Gilgit Baltistan and AJK (Astore, Bunji and Chilas), Khyber Pakhtunkhwa (Balakot, Cherat, Chitral, D.I.Khan,, Dir, Kakul, Kalat, Peshawar and Saidu Sharif), Sindh ( Badin, Chhor, Hyderabad, Larkana, Sh. Benazirabad, Padidan, Rohri, Sukkur and Moin-Jo-Daro), and Baluchistan ( Dalbandin, Kalat, Khuzdar, Lasbela, Nokkundi, Panjgur, Samungli, Sibbi, Turbat and Zhob). In April most of the country was under the grip of heat wave during 11th to 22nd with a few exceptions.
There was yet another heat wave experienced in a few locations of GB and AJK, Khyber Pakhtunkhwa and Balochistan from 25th to 30th May.
Karachi again suffered few very hot days (7th -13th October). Although these hot days charged death toll there (as reported by some news agencies), but these do not satisfy the definition of heat wave.
Figure 11: Glimpses of hot summer in Pakistan during 2017

9
(b) Flash Flood / Flood in 2017
This year country received heavy rainfall in January (95.42% above normal). Other wet months were June and November while rest of the year experienced below normal precipitations. These extreme rainfall events in January caused flash flood and land slide in mountainous areas and generated flood like situation in a few districts of Balochistan, KP, GB and AJK. During June 2017, amount of rainfall was well above normal in Sindh (197.2 %), Balochistan (112.4%) and Punjab (54.40%) whereas it was below normal in Gilgit-Baltistan / Kashmir (-48.2%). Badin and Karachi (Sindh) received 58.4% and 48.1% above normal rainfall respectively. Barkhan and Khuzdar Districts (Balochistan) received 81.0% and 33.5% above normal rainfall in June 2017 respectively. This early monsoon rain again caused flooding in low lying areas of Sindh and Balochistan The whole country received well above normal rainfall (47.52%) during November. In Khyber Pakhtunkhwa a few stations received heavy downpour in a couple of days (15th to 16th November, 2017). These include Bannu 48 mm (+48.9%), Cherat 75 mm (+60.4%), Peshawar 69 mm (+55.2%), and Risalpur 52 mm (+38.4%).
Figure 12: Glimpse of flash flood/flooding in Pakistan during 2017

10
(c) Severe dust storm in Punjab, June 2017 A severe dust storm hit south-eastern Punjab (Bahawalnagar and associated districts) on June 08, 2017. Maximum wind speed of the storm was reported as 195 Km/h. News media reported 7 casualties along with 65 injured. (d) Flash Flood in Baluchistan, June 2017 In Lasbela district of Baluchistan a flash flooding was reported in Tehsil Hub on June 29, 2017. A death toll of 14 persons was reported by District Administration. (e) Torrential Rains/Urban Flooding in Sindh, June 2017 A few districts of Sindh experienced vey heavy rainfall during 24 hours period between 29th and 30th June. These include Diplo (70 mm), Badin (52 mm) and Karachi (62mm). Torrential rain reported at different locations of Karachi during the two days (48 hours) was: Faisal Base (71mm), Masroor (67 mm), Landhi (56 mm), Gulshan-e Hadeed (73 mm), North Karachi (95 mm), Nazimzbad (74mm), Saddar (59 mm) and University Road (39 mm).
Figure 14: Lasbela, Baluchistan
Figure 13: Dust Storm in Punjab
Figure 15: Urban Flooding, Karachi

11
6. Drought Monitor National Drought Monitoring Centre of PMD monitors drought events on fortnightly basis; according to in 2017 there were normal to slightly wet and mild drought conditions in most parts of Punjab, KP,GB & AJK. Whereas most of Balochistan alongwith adjoining southern parts of Sindh experienced mild moderate drought. Yet a little area including Pasni experienced severe drought conditions. Figure 16 below shows the drought conditions of whole Pakistan for 2017.
Figure 16: Drought analysis for Pakistan for the year 2017