Salem Municipal Airport - Phase II and Runway Needs Assessment

2017 Municipal State Aid Street
Needs Report
October 2017
Rail Grade Separation Project
Vicksburg Lane: City of Plymouth, MN
This document is made available electronically by the Minnesota Legislative Reference Library as part of an ongoing digital archiving project. http://www.leg.state.mn.us/lrl/lrl.asp


Before
City of Plymouth, MN Rail grade separation project
After

PREFACE
The 2017 Municipal State Aid Street Needs Report is presented to the Municipal Screening Board for use in making their annual construction (money) needs recommendation to the Commissioner of Transportation.
This submittal is required by MN. Statute 162.13 and is to be made to the Commissioner on or before November 1st of each year.
The construction (money) needs data contained in this book were compiled after Needs updates and traffic updates were submitted for each municipality. Construction Needs are calculated by applying the unit prices (as determined by the Municipal Screening Board at their spring meeting in June 2017) to the quantities in the appropriate urban ADT group. Explanations for Needs Calculations are in the resolutions of the Municipal Screening Board.
Population data is combined with the Commissioner's final construction (money) needs and the result will be used to determine the 2018 allocations which will be reported in the "2018 Municipal State Aid Apportionment Data" to be published in January.

January
February
July
March
April
May
June August
September
October
November
December CEAM
Conf.
March 1st Deadline for System Revision Requests
Request Pop. Estimates
Notify DSAE’s to schedule prescreening meetings
Fall Screening Board Mtg
Notify cities for Maintenance
requests
Notify cities to update certs.
Start preparing Fall book
FALL PRESCREENING BOARD MEETINGS
MSASMSASMSAS
CALENDARCALENDARCALENDAR
January book (on line)
Notify DSAE’s to schedule
prescreening meetings
NSS meeting
May 1st HARD deadline for system revisions, CC
resolutions & Needs Updates.
December 15th Maintenance Requests Due
January 15th deadline for Annual Certification
of Mileage
Request Storm Sewer letter/Bridge Data
SPRING PRESCREENING BOARD MEETINGS
Mail out Spring Books
Prepare NSS book
Start preparing Spring book
Mail out Fall books
City tasks
State Aid tasks
March 31st Deadline for
Needs Updates without any
System Revision Requests
Spring Screening Board Mtg
Start preparing Jan. book
Ongoing Processes
Highway User Tax Distribution Fund
NEEDS RESET 1) Back up current Needs 2) Reset 3) Notify cities to begin updating
Send Finance allotments

The State Aid Program Mission Study
Mission Statement: The purpose of the state-aid program is to provide resources, from the Highway Users Tax Distribution Fund, to assist local governments with the construction and maintenance of community-interest highways and streets on the state-aid system.
Program Goals: The goals of the state-aid program are to provide users of secondary highways and streets with:
Safe highways and streets; Adequate mobility and structural capacity on highways and streets; and An integrated transportation network.
Key Program Concepts:
Highways and streets of community interest are those highways and streets that function as an integrated network and provide more than only local access. Secondary highways and streets are those routes of community interest that are not on the Trunk Highway system. A community interest highway or street may be selected for the state-aid system if it:
A. Is projected to carry a relatively heavier traffic volume or is functionally classified as collector or arterial B. Connects towns, communities, shipping points, and markets within a county or in adjacent counties; provides access to rural churches, schools, community meeting halls, industrial areas, state institutions, and recreational areas; serves as a principal rural mail route and school bus route; or connects the points of major traffic interest, parks, parkways, or recreational areas within an urban municipality. C. Provides an integrated and coordinated highway and street system affording, within practical limits, a state-aid highway network consistent with projected traffic demands. The function of a road may change over time requiring periodic revisions to the state-aid highway and street network.
State-aid funds are the funds collected by the state according to the constitution and law, distributed from the Highway Users Tax Distribution Fund, apportioned among the counties and cities, and used by the counties and cities for aid in the construction, improvement and maintenance of county state-aid highways and municipal state-aid streets. The Needs component of the distribution formula estimates the relative cost to build county highways or build and maintain city streets designated as state-aid routes.

Maps of Districts and Urban Municipalities .............................................................................. 2-3
2017 Municipal Screening Board ............................................................................................. 4
2017 Subcommittees .............................................................................................................. 5
Past Municipal Screening Board Representatives ................................................................... 6-7
Minutes of the 2017 Spring Screening Board Meeting..............................................................8-11
Population Data: Notes & Map .................................................................................................12-13
2018 Population Summary .......................................................................................................14-16
Map: Percentage Change in Population for State Aid Cities, 2010 to 2016 ……………………17
MSAS Population Allocations ..................................................................................................18-21
Mileage, Needs, and Apportionment ........................................................................................22-23
Apportionment Per $1,000 Needs: Chart ……………………………………………………….. 25
Itemized Tabulation of Needs & pocket insert...........................................................................26
Map: Needs Costs per Mile ……………………………………………………………………………27
Comparison of Needs Between 2016 and 2017....................................................................... 28
Map: Population per Needs Mile …………………………………………………………………… 29
2017 Mileage Report & pocket insert........................................................................................ 30
MSAS Needs Mileage Comparison………………………………………………………………… 31
2017 Construction Needs & 2018 Construction Needs Allocations / explanation ...................32
Phase In (Restriction) / Steps for computing ............................................................................33-34
Restricted Needs Calculations .................................................................................................35-39
Maps: Restricted Cities, 2014 - 2017…………………………………………………………………40-43
ADJUSTMENTS TO THE RESTRICTED CONSTRUCTION NEEDS 44
Excess Unencumbered Construction Fund Balance Adjustment..............................................45
Excess Balance Adjustment Redistributed as Low Balance Incentive......................................46-49
Right of Way Adjustments ........................................................................................................50-53
After the Fact Retaining Wall Adjustment ................................................................................ 54
After the Fact Railroad Crossing & Railroad Bridge Over MSAS Adjustment ..........................55
2017 Adjusted Restricted Construction Needs ....................................................................... 56-59
Construction Needs Recommendation (Letter to the Commissioner)……………………………60
Adjusted Construction Needs Recommendations ....................................................................61-62
Tentative 2018 Estimated Construction Needs Allocations ..................................................... 63-65
Comparison of 2017 to 2018 Construction Needs Allocations..................................................66-68
Tentative 2018 Total Allocations ..............................................................................................69-71
Comparison of the 2017 Total Allocations to the 2018 Tentative Total Allocations ……………72-74
Tentative 2018 Allocation Rankings .........................................................................................75-78
OTHER TOPICS 79
Certification of MSAS System as complete...............................................................................80-81
History of the Administrative and Research Accounts.............................................................. 82
State Aid Advance Guidelines ..................................................................................................83-85
County Highway Turnback Policy ............................................................................................ 86-87
Current Resolutions of the Municipal Screening Board ........................................................... 88-98
TABLE OF CONTENTS

State of Minnesota Metro District & Urban Municipalities (Population over 5000) 35 Metro East Cities 49 Metro West Cities
N. Branch
Wyoming
St. Francis
Oak Grove
E. Bethel
Ramsey Ham Lake
Andover
Anoka
Coon Rapids
Blaine
Lino Lakes
Circle Pines
Columbia Heights
Fridley
Spring Lake Park
Forest Lake
Hugo
Mahtomedi
Lake Elmo
Oakdale
Woodbury
St. Paul Park
Cottage Grove
Stillwater
Burnsville
Eagan
Mendota Heights
W. St. Paul
S. St. Paul
Apple Valley
Lakeville
Farmington
Hastings
Inver Grove Heights
Rosemount Jordan
Shakopee
Belle Plaine
Savage
Prior Lake
Chanhassen
Chaska
Waconia
Victoria Eden Prairie
Minneapolis
Bloomington
Richfield Edina
Hopkins Minnetonka Shorewood
Minnetrista
Mound
St. Louis Park
Orono
Medina
Corcoran
Rogers
Brooklyn Park
Brooklyn Center
Maple Grove
Champlin
Dayton
Plymouth
Golden Valley
New Hope
Robbinsdale Crystal
Mounds View
New Brighton
Roseville
Little Canada
Falcon Heights
St. Paul
Arden Hills
White Bear Lake
Vadnais Heights
N. St. Paul
Maplewood
Shoreview
Metro West
Metro East
Updated 12/9/14
Chisago City
St. Anthony
2
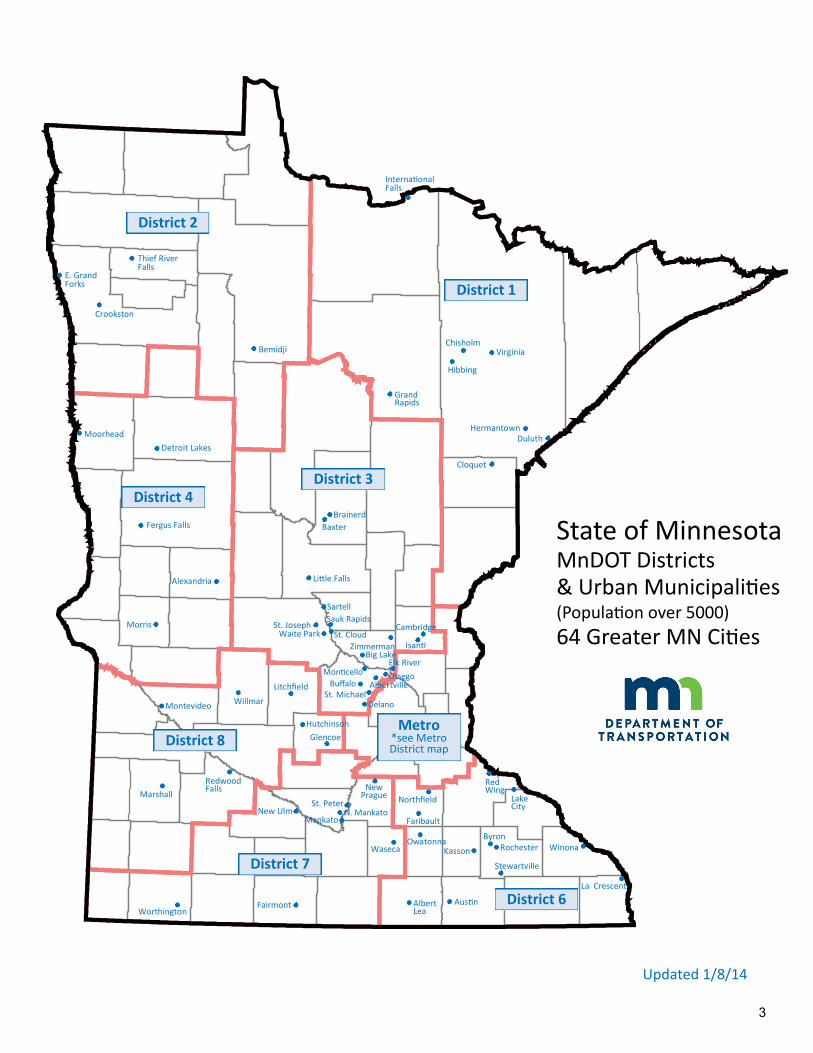
State of Minnesota MnDOT Districts & Urban Municipalities (Population over 5000)
64 Greater MN Cities
International Falls
Virginia Chisholm
Hibbing
Hermantown Duluth
Grand Rapids
Bemidji
Thief River Falls
Crookston
E. Grand Forks
Cloquet
Moorhead
Detroit Lakes
Fergus Falls
Morris
Alexandria
Brainerd
Baxter
Little Falls
Worthington
Marshall
Redwood Falls
Montevideo Willmar
Hutchinson
Glencoe
Litchfield
Fairmont Albert Lea
Austin
La Crescent
Winona
Lake City
Red Wing
Northfield
Faribault
Stewartville
Rochester Byron
Kasson Owatonna
Waseca
Mankato N. Mankato
St. Peter New Ulm
New Prague
St. Joseph Waite Park
Sartell
Sauk Rapids Cambridge
Isanti Zimmerman
Elk River
St. Cloud
Big Lake
Monticello
Buffalo
Delano
Albertville Otsego
St. Michael
District 1
District 2
District 3 District 4
District 8
District 7
District 6
Metro *see Metro District map
Updated 1/8/14
3

04-Aug-17
Chair Marc Culver Roseville (651) 792-7041 Vice Chair Glenn Olson Marshall (507) 537-6774 Secretary John Gorder Eagan (651) 675-5645
District Years Served Representative City Phone 1 2017-2019 Matt Wegwerth Grand Rapids (218) 326-7625
2 2015-2017 Craig Gray Bemidji (218) 333-1851
3 2015-2017 Justin Femrite Elk River (763) 635-1051
4 2016-2018 Jeff Kuhn Morris (320) 762-8149
Metro-West 2016-2018 Steve Lillehaug Shakopee (952) 233-9361
6 2016-2018 Jay Owens Red Wing (651) 385-3625
7 2017-2019 Mark DuChene Waseca (507) 835-9716
8 2015-2017 Sean Christensen Willmar (320) 214-5169
Metro-East 2017-2019 VACANT VACANT (651) xxx-xxxx
Cities Permanent Cindy Voigt Duluth (218) 730-5200
of the Permanent Don Elwood Minneapolis (612) 673-3622
First Permanent Richard Freese Rochester (507) 328-2426
Class Permanent Paul Kurtz Saint Paul (651) 266-6203
District Year Beginning City Phone 1 2020 Caleb Peterson Cloquet (218) 879-6758
2 2018 Rich Clauson Crookston (218) 281-6522
3 2018 Adam Nafstad Albertville (763) 497-3384
4 2019 Brian Yavarow Fergus Falls (218) 332-5413
Metro-West 2019 Chad Milner Edina (952) 826-0318
6 2019 Kyle Skov Owatonna (507) 444-4350
7 2020 Chris Cavett New Prague (507) 388-1989
8 2018 Andy Kehren Redwood Falls (507) 794-5541
Metro-East 2020 Tom Wesolowski Shoreview (651) 490-4652
Alternates
2017 MUNICIPAL SCREENING BOARD
Officers
Members
N:\MSAS\Books\2017 October Book\Screening Board Members 2017.xlsx
4

Rich Clauson Steve BotCrookston St. Michael(218) 281-6522 (763) 497-2041Expires after 2017 Expires after 2017
Jon Pratt Klayton EcklesDetroit Lakes Woodbury(218) 847-5607 (651) 714-3593 Expires after 2018 Expires after 2018
Jeff Johnson Jeff JohnsonMankato Mankato(507) 387-8640 (507) 387-8640Expires after 2019 Expires after 2019
2017 SUBCOMMITTEES
Needs Study SubcommitteeUnencumbered Construction Funds
Subcommittee
The Screening Board Chair appoints one city Engineer, who has served on the Screening Board, to serve a three year term on the Needs Study Subcommittee.
The past Chair of the Screening Board is appointed to serve a three year term on the Unencumbered Construction Fund Subcommittee.
N:\MSAS\Books\2017 October Book\Subcommittee Members 2017.xlsx
5

08-A
ug-1
7
DIS
TR
ICT
DIS
TR
ICT
DIS
TR
ICT
DIS
TR
ICT
ME
TR
OD
IST
RIC
TD
IST
RIC
TD
IST
RIC
TM
ET
RO
YE
AR
12
34
WE
ST
67
8E
AS
T19
92P
RU
SA
KK
ILD
AH
LW
ILL
IAM
SO
NR
EIM
ER
EA
ST
LIN
GP
UT
NA
MM
CC
LU
RG
SW
AN
SO
NH
AID
ER
M
oo
rhea
dO
wat
on
na
1993
PR
US
AK
KIL
DA
HL
WIL
LIA
MS
ON
RE
IME
RA
ND
ER
SO
NP
UT
NA
MS
AF
FE
RT
SW
AN
SO
NB
AC
HM
EIE
RP
rio
r L
ake
Man
kato
Oak
dal
e19
94P
RU
SA
KB
OE
LL
KR
EK
LA
UR
EIM
ER
AN
DE
RS
ON
PU
TN
AM
SA
FF
ER
TV
ICT
OR
BA
CH
ME
IER
Bem
idji
Bu
ffal
o
M
arsh
all
1995
HA
LT
ER
SA
ND
ER
SK
RE
KL
AU
NA
NS
EN
AN
DE
RS
ON
MA
LIN
SA
FF
ER
TR
OD
EB
ER
GB
AC
HM
EIE
RG
ran
d R
apid
sE
. Gr.
Fo
rks
Det
. Lak
esW
ino
na
Hu
tch
inso
n19
96H
AL
TE
RS
AN
DE
RS
KR
EK
LA
UN
AN
SE
NB
ITT
LE
MA
LIN
RE
AD
RO
DE
BE
RG
JES
SU
P
Ch
amp
lin
Fai
rmo
nt
W
oo
db
ury
1997
HA
LT
ER
KIL
DA
HL
WO
TZ
KA
NA
NS
EN
BIT
TL
EM
AL
INR
EA
DS
AR
FF
JES
SU
PC
roo
ksto
nS
arte
ll,W
aite
Par
k
L
itch
fiel
d
1998
SA
LO
KIL
DA
HL
WO
TZ
KA
SC
HO
ON
HO
VE
NB
ITT
LE
OL
SO
NR
EA
DS
AR
FF
JES
SU
PH
erm
anto
wn
Ale
xan
dri
a
Alb
ert
Lea
19
99S
AL
OK
ILD
AH
LW
OT
ZK
AS
CH
OO
NH
OV
EN
GU
ST
AF
SO
NO
LS
ON
KO
EH
LE
RS
AR
FF
BU
RC
HM
inn
eto
nka
New
Ulm
Wh
ite
Bea
r L
k20
00S
AL
OM
ET
SO
KO
SH
AK
SC
HO
ON
HO
VE
NG
US
TA
FS
ON
OL
SO
NK
OE
HL
ER
OD
EN
SB
UR
CH
Bem
idji
Ots
ego
Will
mar
2001
SA
LO
SA
ND
ER
SK
OS
HA
KE
DW
AR
DS
PE
DE
RS
ON
MU
RR
AY
KO
EH
LE
RO
DE
NS
BU
RC
HE
. Gr.
Fo
rks
Fer
gu
s F
alls
Blo
om
ing
ton
Far
ibau
lt
2002
SU
IHK
ON
EN
SA
ND
ER
SW
EIS
SE
DW
AR
DS
PE
DE
RS
ON
MU
RR
AY
LO
OS
EO
DE
NS
AH
LH
ibb
ing
M
on
tice
lloS
t. P
eter
Map
lew
oo
d20
03S
UIH
KO
NE
NK
ILD
AH
LW
EIS
SE
DW
AR
DS
PE
DE
RS
ON
MU
RR
AY
LO
OS
EB
ER
RY
MA
NA
HL
Cro
oks
ton
Mo
nte
vid
eo20
04S
UIH
KO
NE
NK
ILD
AH
LW
EIS
SK
UH
NG
RA
YJO
HN
SO
NL
OO
SE
BE
RR
YM
AN
AH
LM
orr
isA
no
kaO
wat
on
na
2005
PA
GE
LK
ILD
AH
LW
EIS
SK
UH
NG
RA
YJO
HN
SO
NS
AL
SB
UR
YB
ER
RY
MA
NB
LO
OM
Gra
nd
Rap
ids
Was
eca
Ro
sevi
lle20
06P
AG
EL
FR
EE
BU
RG
MA
UE
RK
UH
NG
RA
YJO
HN
SO
NS
AL
SB
UR
YO
LS
ON
BL
OO
MB
emid
jiE
lk R
iver
Mar
shal
l20
07P
AG
EL
FR
EE
BU
RG
MA
UE
RZ
IMM
ER
MA
NH
AU
KA
AS
/KE
EL
YG
EH
LE
R-H
ES
SS
AL
SB
UR
YO
LS
ON
BL
OO
MM
oo
rhea
dF
rid
ley/
Bla
ine
No
rth
fiel
d20
08P
RU
SA
KG
RA
YM
AU
ER
ZIM
ME
RM
AN
KE
EL
YG
EH
LE
R-H
ES
SS
AF
FE
RT
OL
SO
NM
AT
TH
YS
Clo
qu
etB
emid
jiB
lain
eM
anka
toE
agan
2009
PR
US
AK
BO
PP
RE
BO
TZ
IMM
ER
MA
NK
EE
LY
GE
HL
ER
-HE
SS
RIP
PK
EE
XN
ER
MA
TT
HY
SE
Gra
nd
Fo
rks
St.
Mic
hae
lN
o M
anka
toH
utc
hin
son
2010
PR
US
AK
BO
PP
RE
BO
TS
CH
OO
NH
OV
EN
MA
TH
ISE
NS
TR
AU
SS
RIP
PK
EE
XN
ER
MA
TT
HY
SA
lexa
nd
ria
Cry
stal
Ste
war
tvill
e20
11S
AL
OB
OP
PR
EB
OT
SC
HO
ON
HO
VE
NM
AT
HIS
EN
ST
RA
US
SN
EM
ME
RS
EX
NE
RG
RA
HA
MH
erm
anto
wn
Fai
rmo
nt
Vad
nai
s H
ts.
2012
SA
LO
KIL
DA
HL
DE
WO
LF
SC
HO
ON
HO
VE
NM
AT
HIS
EN
ST
RA
US
SN
EM
ME
RS
RO
DE
BE
RG
GR
AH
AM
Th
Riv
er F
alls
Bu
ffal
oG
len
coe
2013
SA
LO
KIL
DA
HL
DE
WO
LF
JON
PR
AT
TR
OD
RU
ES
TE
VE
LA
NG
NE
MM
ER
SR
OD
EB
ER
GG
RA
HA
MD
etro
it L
akes
Ed
en P
rair
ieA
ust
in20
14JE
SS
E S
TO
RY
RIC
H C
LA
US
ON
DE
WO
LF
JON
PR
AT
TR
OD
RU
ES
TE
VE
LA
NG
JEF
F J
OH
NS
ON
RO
DE
BE
RG
K. E
CK
LE
SH
ibb
ing
Cro
oks
ton
Bu
ffal
oD
etro
it L
akes
Ed
en P
rair
ieA
ust
inM
anka
toG
len
coe
Wo
od
bu
ry20
15JE
SS
E S
TO
RY
CR
AIG
GR
AY
JUS
TIN
FE
MR
ITE
JON
PR
AT
TR
OD
RU
ES
TE
VE
LA
NG
JEF
F J
OH
NS
ON
S. C
HR
IST
EN
SE
NK
. EC
KL
ES
Hib
bin
gB
emid
jiE
lk R
iver
Det
roit
Lak
esE
den
Pra
irie
Au
stin
Man
kato
Will
mar
Wo
od
bu
ry20
16JE
SS
E S
TO
RY
CR
AIG
GR
AY
JUS
TIN
FE
MR
ITE
JEF
F K
UH
NS
TE
VE
LIL
LE
HA
UG
JAY
OW
EN
SJE
FF
JO
HN
SO
NS
. CH
RIS
TE
NS
EN
K. E
CK
LE
SH
ibb
ing
Bem
idji
Elk
Riv
erM
orr
isB
roo
klyn
Cen
ter
Red
Win
gM
anka
toW
illm
arW
oo
db
ury
2017
MA
TT
WE
GW
ER
TH
CR
AIG
GR
AY
JUS
TIN
FE
MR
ITE
JEF
F K
UH
NS
TE
VE
LIL
LE
HA
UG
JAY
OW
EN
SM
AR
K D
uC
HE
NE
S. C
HR
IST
EN
SE
NM
. TH
OM
PS
ON
Gra
nd
Rap
ids
Bem
idji
Elk
Riv
erM
orr
isS
hak
op
eeR
ed W
ing
Man
kato
Will
mar
Map
lew
oo
d
MU
NIC
IPA
L S
CR
EE
NIN
G B
OA
RD
RE
PR
ES
EN
TA
TIV
ES
Dis
tric
ts
N:\M
SA
S\B
ooks
\201
7 O
ctob
er B
ook\
Pas
t Scr
eeni
ng B
oard
Mem
bers
.xls
x
6
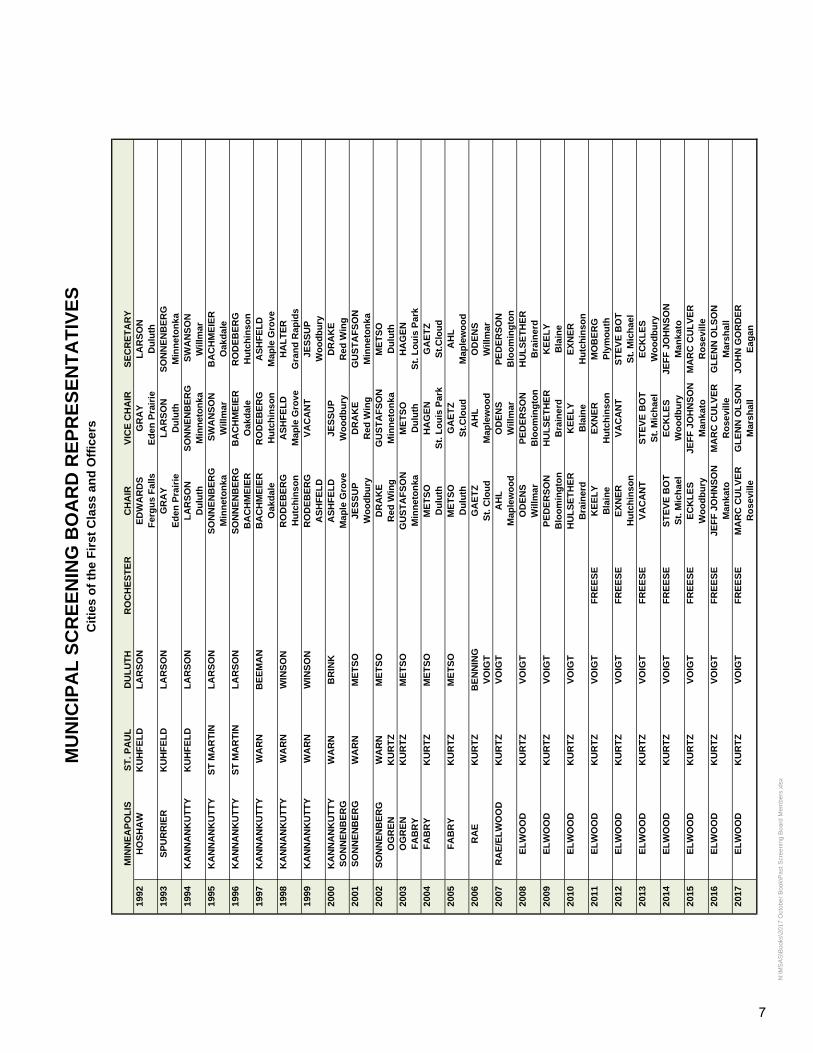
MIN
NE
AP
OL
ISS
T. P
AU
LD
UL
UT
HR
OC
HE
ST
ER
CH
AIR
VIC
E C
HA
IRS
EC
RE
TA
RY
1992
HO
SH
AW
KU
HF
EL
DL
AR
SO
NE
DW
AR
DS
GR
AY
LA
RS
ON
Fer
gu
s F
alls
Ed
en P
rair
ieD
ulu
th19
93S
PU
RR
IER
KU
HF
EL
DL
AR
SO
NG
RA
YL
AR
SO
NS
ON
NE
NB
ER
G
Ed
en P
rair
ieD
ulu
thM
inn
eto
nka
1994
KA
NN
AN
KU
TT
YK
UH
FE
LD
LA
RS
ON
LA
RS
ON
SO
NN
EN
BE
RG
SW
AN
SO
ND
ulu
thM
inn
eto
nka
Will
mar
1995
KA
NN
AN
KU
TT
YS
T M
AR
TIN
LA
RS
ON
SO
NN
EN
BE
RG
SW
AN
SO
NB
AC
HM
EIE
RM
inn
eto
nka
Will
mar
Oak
dal
e19
96K
AN
NA
NK
UT
TY
ST
MA
RT
INL
AR
SO
NS
ON
NE
NB
ER
GB
AC
HM
EIE
RR
OD
EB
ER
GB
AC
HM
EIE
RO
akd
ale
Hu
tch
inso
n19
97K
AN
NA
NK
UT
TY
WA
RN
BE
EM
AN
BA
CH
ME
IER
RO
DE
BE
RG
AS
HF
EL
DO
akd
ale
Hu
tch
inso
nM
aple
Gro
ve19
98K
AN
NA
NK
UT
TY
WA
RN
WIN
SO
NR
OD
EB
ER
GA
SH
FE
LD
HA
LT
ER
Hu
tch
inso
nM
aple
Gro
veG
ran
d R
apid
s19
99K
AN
NA
NK
UT
TY
WA
RN
WIN
SO
NR
OD
EB
ER
GV
AC
AN
TJE
SS
UP
AS
HF
EL
DW
oo
db
ury
2000
KA
NN
AN
KU
TT
YW
AR
NB
RIN
KA
SH
FE
LD
JES
SU
PD
RA
KE
SO
NN
EN
BE
RG
Map
le G
rove
Wo
od
bu
ryR
ed W
ing
2001
SO
NN
EN
BE
RG
WA
RN
ME
TS
OJE
SS
UP
DR
AK
EG
US
TA
FS
ON
Wo
od
bu
ryR
ed W
ing
Min
net
on
ka20
02S
ON
NE
NB
ER
G
WA
RN
ME
TS
OD
RA
KE
GU
ST
AF
SO
NM
ET
SO
OG
RE
NK
UR
TZ
Red
Win
gM
inn
eto
nka
Du
luth
2003
OG
RE
NK
UR
TZ
ME
TS
OG
US
TA
FS
ON
ME
TS
OH
AG
EN
FA
BR
YM
inn
eto
nka
Du
luth
St.
Lo
uis
Par
k20
04F
AB
RY
KU
RT
ZM
ET
SO
ME
TS
OH
AG
EN
GA
ET
ZD
ulu
thS
t. L
ou
is P
ark
St.
Clo
ud
2005
FA
BR
YK
UR
TZ
ME
TS
OM
ET
SO
GA
ET
ZA
HL
Du
luth
St.
Clo
ud
Map
lew
oo
d20
06R
AE
KU
RT
ZB
EN
NIN
GG
AE
TZ
AH
LO
DE
NS
VO
IGT
St.
Clo
ud
Map
lew
oo
dW
illm
ar20
07R
AE
/EL
WO
OD
KU
RT
ZV
OIG
TA
HL
OD
EN
SP
ED
ER
SO
NM
aple
wo
od
Will
mar
Blo
om
ing
ton
2008
EL
WO
OD
KU
RT
ZV
OIG
TO
DE
NS
PE
DE
RS
ON
HU
LS
ET
HE
RW
illm
arB
loo
min
gto
nB
rain
erd
2009
EL
WO
OD
KU
RT
ZV
OIG
TP
ED
ER
SO
NH
UL
SE
TH
ER
KE
EL
YB
loo
min
gto
nB
rain
erd
Bla
ine
2010
EL
WO
OD
KU
RT
ZV
OIG
TH
UL
SE
TH
ER
KE
EL
YE
XN
ER
Bra
iner
dB
lain
eH
utc
hin
son
2011
EL
WO
OD
KU
RT
ZV
OIG
TF
RE
ES
EK
EE
LY
EX
NE
RM
OB
ER
GB
lain
eH
utc
hin
son
Ply
mo
uth
2012
EL
WO
OD
KU
RT
ZV
OIG
TF
RE
ES
EE
XN
ER
VA
CA
NT
ST
EV
E B
OT
Hu
tch
inso
nS
t. M
ich
ael
2013
EL
WO
OD
KU
RT
ZV
OIG
TF
RE
ES
EV
AC
AN
TS
TE
VE
BO
TE
CK
LE
SS
t. M
ich
ael
Wo
od
bu
ry20
14E
LW
OO
DK
UR
TZ
VO
IGT
FR
EE
SE
ST
EV
E B
OT
EC
KL
ES
JEF
F J
OH
NS
ON
St.
Mic
hae
lW
oo
db
ury
Man
kato
2015
EL
WO
OD
KU
RT
ZV
OIG
TF
RE
ES
EE
CK
LE
SJE
FF
JO
HN
SO
NM
AR
C C
UL
VE
RW
oo
db
ury
Man
kato
Ro
sevi
lle20
16E
LW
OO
DK
UR
TZ
VO
IGT
FR
EE
SE
JEF
F J
OH
NS
ON
MA
RC
CU
LV
ER
GL
EN
N O
LS
ON
Man
kato
Ro
sevi
lleM
arsh
all
2017
EL
WO
OD
KU
RT
ZV
OIG
TF
RE
ES
EM
AR
C C
UL
VE
RG
LE
NN
OL
SO
NJO
HN
GO
RD
ER
Ro
sevi
lleM
arsh
all
Eag
an
MU
NIC
IPA
L S
CR
EE
NIN
G B
OA
RD
RE
PR
ES
EN
TA
TIV
ES
Cit
ies
of
the
Fir
st C
lass
an
d O
ffic
ers
N:\M
SA
S\B
ooks
\201
7 O
ctob
er B
ook\
Pas
t Scr
eeni
ng B
oard
Mem
bers
.xls
x
7
8

9

10
11
N:\MSAS\Books\2017 October book\Pop notes for 2017.docx
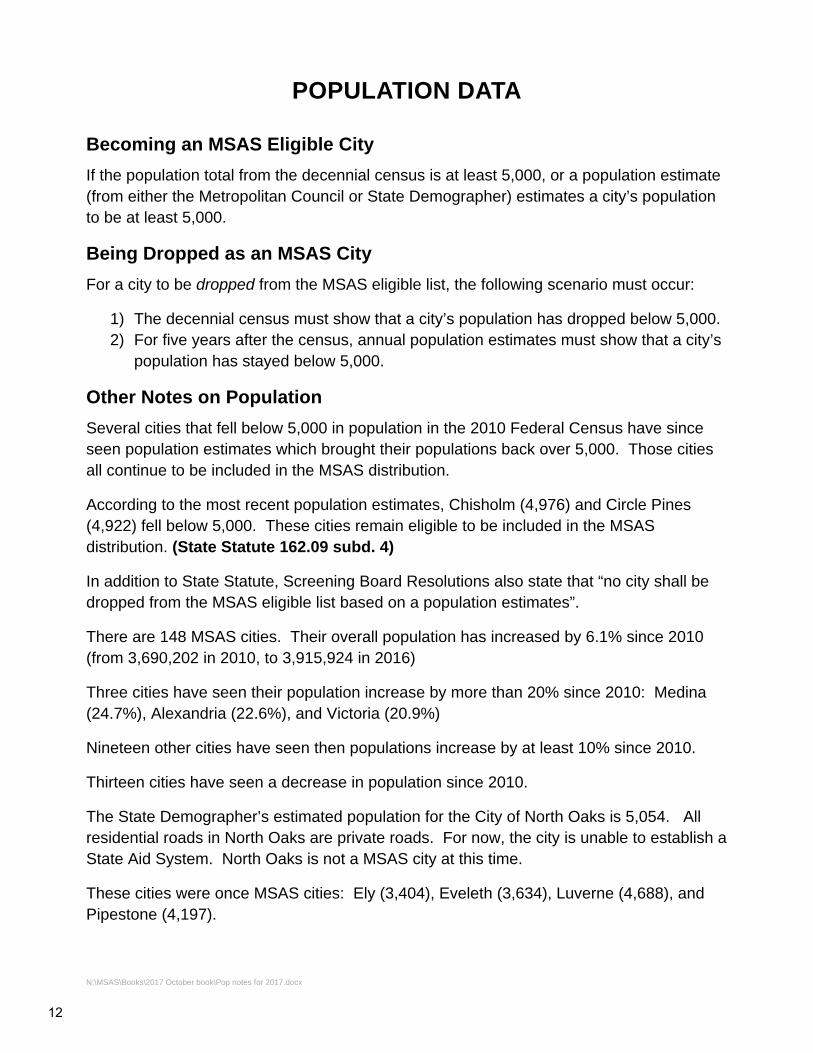
POPULATION DATA
Becoming an MSAS Eligible City
If the population total from the decennial census is at least 5,000, or a population estimate (from either the Metropolitan Council or State Demographer) estimates a city’s population to be at least 5,000.
Being Dropped as an MSAS City
For a city to be dropped from the MSAS eligible list, the following scenario must occur:
1) The decennial census must show that a city’s population has dropped below 5,000. 2) For five years after the census, annual population estimates must show that a city’s
population has stayed below 5,000.
Other Notes on Population
Several cities that fell below 5,000 in population in the 2010 Federal Census have since seen population estimates which brought their populations back over 5,000. Those cities all continue to be included in the MSAS distribution.
According to the most recent population estimates, Chisholm (4,976) and Circle Pines (4,922) fell below 5,000. These cities remain eligible to be included in the MSAS distribution. (State Statute 162.09 subd. 4)
In addition to State Statute, Screening Board Resolutions also state that “no city shall be dropped from the MSAS eligible list based on a population estimates”.
There are 148 MSAS cities. Their overall population has increased by 6.1% since 2010 (from 3,690,202 in 2010, to 3,915,924 in 2016)
Three cities have seen their population increase by more than 20% since 2010: Medina (24.7%), Alexandria (22.6%), and Victoria (20.9%)
Nineteen other cities have seen then populations increase by at least 10% since 2010.
Thirteen cities have seen a decrease in population since 2010.
The State Demographer’s estimated population for the City of North Oaks is 5,054. All residential roads in North Oaks are private roads. For now, the city is unable to establish a State Aid System. North Oaks is not a MSAS city at this time.
These cities were once MSAS cities: Ely (3,404), Eveleth (3,634), Luverne (4,688), and Pipestone (4,197).
12

KOOCHICHING
MARSHALL
Stewartville
SAINT LOUIS
LAKE
CASS
ITASCA
POLK
BELTRAMI
PINE
AITKIN
COOK
CLAY
ROSEAU
OTTER TAIL
BECKER
TODD
STEARNS
LYON
POPE
KITTSON
SWIFT
RICE
MORRISON
RENVILLE
HUBBARD
WILKIN
NORMAN
CARLTON
MARTINMOWER
CROW WING
NOBLES
MURRAY
FILLMORE
ROCK
WRIGHT
SIBLEY
GRANT
REDWOOD
LAKE OF THE WOODS
BROWN
MEEKER
JACKSON
CLEARWATER
GOODHUE
KANDIYOHI
WINONA
DOUGLAS
DAKOTA
OLMSTED
FREEBORN
FARIBAULT
ISANTI
STEVENS
LINCOLN
BLUE EARTH
WADENA
MCLEOD
DODGESTEELE
MILLE LACS
HOUSTON
TRAVERSE
KANABEC
SCOTT
CHIPPEWA
WABASHA
LAC QUI PARLE
WASECA
BENTON
MAHNOMEN
LE SUEUR
BIG STONE
NICOLLET
CHISAGO
CARVER
PENNINGTON
COTTONWOOD
RED LAKE
PIPESTONE
YELLOWMEDICINE
SHERBURNE
WATONWAN
Hibbing
Duluth
Rochester
Cloquet
Red Wing
St. Cloud
Winona
Baxter
Hermantown
Virginia
NorthBranch
Moorhead
Mankato
Fairmont Austin
Willmar
GrandRapids
Bemidji
Faribault
Alexandria
AlbertLea
Owatonna
Brainerd
Buffalo
Fergus Falls
Sartell
Marshall
DetroitLakes
NewUlm
BigLake
Monticello
Isanti
Morris
Little Falls
Waite Park
Northfield
Worthington
Waseca
St. Peter
Cambridge
Delano
Litchfield
BellePlaine
Chisholm
SaukRapids
Crookston
Byron
Jordan
Montevideo
Kasson
NorthMankato
St. Joseph
RedwoodFalls
InternationalFalls
East Grand Forks
ThiefRiverFalls
Zimmerman
La Crescent
Waconia
New Prague
Hutchinson
Lake City
Glencoe
Lino Lakes
Mahtomedi
St. Paul
HugoBlaine
Eagan
Elk River
MplsOrono
Otsego
Lakeville
East Bethel
Andover
Corcoran
Medina
Ramsey
Plymouth
Ham Lake
Dayton
Woodbury
Oak Grove
St. Michael
Rosemount
Forest Lake
Bloomington
Shakopee
EdenPrairie
Edina
MapleGrove
Minnetrista
Burnsville
CottageGroveChaska
Minnetonka
Lake Elmo
Savage
St. Francis
Wyoming
Chanhassen
CoonRapids
BrooklynPark
PriorLake
Becker
Frid.
MaplewoodRoseville
Buffalo
AppleValley
Oakdale
Farmington
Hastings
Victoria
Shoreview
RogersAnoka
Champlin
Stillwater
Richfield
St. LouisPark
GV
NorthOaks
Mound
MendotaHgts
Hopkins
IGH
ChisagoCity
AHCrystalDelano
Waconia
WBLBC NB
VHNewHope
Jordan
Albertville
SSPWSP
LC
MV
St. Paul Park
Robbins-dale NSP
CH
St.Anthony
CirclePines
FalconHgts
SLP
Norwood Young America
INSET
Legend
7000 to 1500015000 to 2500025000 to 40000
Data Source: MN State Demographer's Office(2016 estimates were released July 2017)http://www.dot.state.mn.us/information/disclaimer.htmlMnDOT's Disclaimer on Maps and Related Data can be found @
State Demographer Population Estimates, 2016
80000 or more
(51)(29)(18)
(8)40000 to 6000060000 to 80000
(6)(10)
5000 to 7000 (27)
13

Difference
Population Population between % Change used for to be used Populations in Population
2010 2017 for 2018 used for 2017 fromMunicipality Census Allocation Allocation & 2018 Allocation 2010 to 2016Albert Lea 18,016 18,016 18,045 18,045 29 0.2%Albertville 7,044 7,317 7,370 7,370 53 4.6%Alexandria 11,074 13,340 13,575 13,575 235 22.6%Andover 30,598 31,704 32,335 32,335 631 5.7%Anoka 17,142 17,665 17,995 17,995 330 5.0%Apple Valley 49,084 50,161 51,338 51,338 1,177 4.6%Arden Hills 9,552 9,847 9,966 9,966 119 4.3%Austin 24,721 25,111 25,104 25,104 (7) 1.5%Baxter 7,610 8,065 8,318 8,318 253 9.3%Belle Plaine 6,661 6,742 6,901 6,901 159 3.6%Bemidji 13,431 14,969 15,119 15,119 150 12.6%Big Lake 10,060 10,671 10,918 10,918 247 8.5%Blaine 57,186 63,180 64,188 64,188 1,008 12.2%Bloomington 82,893 87,224 88,299 88,299 1,075 6.5%Brainerd 13,590 13,673 13,679 13,679 6 0.7%Brooklyn Center 30,104 30,864 31,231 31,231 367 3.7%Brooklyn Park 75,781 80,215 80,450 80,450 235 6.2%Buffalo 15,453 16,035 16,119 16,119 84 4.3%Burnsville 60,306 61,908 61,849 61,849 (59) 2.6%Byron 4,952 5,404 5,498 5,498 94 11.0%Cambridge 8,111 8,496 8,749 8,749 253 7.9%Champlin 23,089 23,089 23,343 23,343 254 1.1%Chanhassen 22,952 25,194 25,448 25,448 254 10.9%Chaska 23,770 25,607 26,439 26,439 832 11.2%Chisago City 4,967 5,156 5,272 5,272 116 6.1%Chisholm 4,976 5,006 4,968 5,000 (6) -0.2%Circle Pines 4,922 5,000 4,909 5,000 0 -0.3%Cloquet 12,124 12,271 12,301 12,301 30 1.5%Columbia Heights 19,496 19,995 20,158 20,158 163 3.4%Coon Rapids 61,476 62,527 62,726 62,726 199 2.0%Corcoran 5,379 5,475 5,498 5,498 23 2.2%Cottage Grove 34,589 35,596 35,939 35,939 343 3.9%Crookston 7,891 7,954 7,945 7,945 (9) 0.7%Crystal 22,151 22,852 22,855 22,855 3 3.2%Dayton 4,743 5,059 5,167 5,167 108 8.9%Delano 5,464 5,864 5,947 5,947 83 8.8%Detroit Lakes 8,571 9,290 9,380 9,380 90 9.4%Duluth 86,265 86,597 86,859 86,859 262 0.7%Eagan 64,206 67,509 68,223 68,223 714 6.3%East Bethel 11,626 11,761 11,788 11,788 27 1.4%East Grand Forks 8,601 8,774 8,843 8,843 69 2.8%Eden Prairie 60,797 63,187 63,163 63,163 (24) 3.9%Edina 47,941 50,766 51,804 51,804 1,038 8.1%Elk River 22,974 23,987 24,368 24,368 381 6.1%Fairmont 10,666 10,666 10,353 10,666 0 -2.9%Falcon Heights 5,321 5,384 5,418 5,418 34 1.8%Faribault 23,352 23,700 23,718 23,718 18 1.6%
2016 Population Estimates (Released July 2017)
2018 POPULATION SUMMARYThe populations used for 2018 Allocations are based on the 2010 Federal Census
or the most recent State Demographer estimates, whichever are greater
N:\MSAS\Books\2017 October Book\Population Spreadsheets for 2018.xlsx14

Difference
Population Population between % Change used for to be used Populations in Population
2010 2017 for 2018 used for 2017 fromMunicipality Census Allocation Allocation & 2018 Allocation 2010 to 2016
2016 Population Estimates (Released July 2017)
Farmington 21,086 22,451 22,343 22,343 (108) 6.0%Fergus Falls 13,140 13,545 13,652 13,652 107 3.9%Forest Lake 18,375 20,261 20,344 20,344 83 10.7%Fridley 27,208 28,547 28,631 28,631 84 5.2%Glencoe 5,631 5,631 5,521 5,631 0 -2.0%Golden Valley 20,371 21,571 21,556 21,556 (15) 5.8%Grand Rapids 10,869 11,281 11,435 11,435 154 5.2%Ham Lake 15,296 15,773 15,891 15,891 118 3.9%Hastings 22,172 22,687 22,400 22,400 (287) 1.0%Hermantown 9,414 9,720 9,507 9,507 (213) 1.0%Hibbing 16,361 16,361 16,265 16,361 0 -0.6%Hopkins 17,591 19,227 19,000 19,000 (227) 8.0%Hugo 13,332 14,352 14,605 14,605 253 9.5%Hutchinson 14,180 14,180 14,146 14,180 0 -0.2%International Falls 6,424 6,424 6,204 6,424 0 -3.4%Inver Grove Heights 33,880 35,071 34,999 34,999 (72) 3.3%Isanti 5,251 5,497 5,614 5,614 117 6.9%Jordan 5,470 6,150 6,213 6,213 63 13.6%Kasson 5,931 6,192 6,298 6,298 106 6.2%LaCrescent 4,883 5,164 5,174 5,174 10 6.0%Lake City 5,063 5,102 5,129 5,129 27 1.3%Lake Elmo 8,069 8,643 8,748 8,748 105 8.4%Lakeville 55,954 59,991 60,965 60,965 974 9.0%Lino Lakes 20,216 20,519 20,803 20,803 284 2.9%Litchfield 6,726 6,761 6,736 6,736 (25) 0.1%Little Canada 9,773 9,941 10,101 10,101 160 3.4%Little Falls 8,347 8,825 8,890 8,890 65 6.5%Mahtomedi 7,676 7,845 8,030 8,030 185 4.6%Mankato 39,313 41,876 42,803 42,803 927 8.9%Maple Grove 61,567 65,155 66,401 66,401 1,246 7.9%Maplewood 38,018 39,742 40,243 40,243 501 5.9%Marshall 13,680 13,793 13,799 13,799 6 0.9%Medina 4,916 5,967 6,131 6,131 164 24.7%Mendota Heights 11,071 11,105 11,283 11,283 178 1.9%Minneapolis 382,578 412,517 419,952 419,952 7,435 9.8%Minnetonka 49,734 51,647 52,741 52,741 1,094 6.0%Minnetrista 6,384 7,029 7,238 7,238 209 13.4%Montevideo 5,383 5,383 5,337 5,383 0 -0.9%Monticello 12,759 13,311 13,409 13,409 98 5.1%Moorhead 38,065 41,901 42,581 42,581 680 11.9%Morris 5,286 5,418 5,442 5,442 24 3.0%Mound 9,052 9,209 9,371 9,371 162 3.5%Mounds View 12,155 13,007 13,161 13,161 154 8.3%New Brighton 21,456 22,170 22,618 22,618 448 5.4%New Hope 20,339 21,225 21,600 21,600 375 6.2%New Prague 7,321 7,508 7,585 7,585 77 3.6%New Ulm 13,522 13,583 13,539 13,539 (44) 0.1%North Branch 10,125 10,330 10,469 10,469 139 3.4%North Mankato 13,394 13,689 13,813 13,813 124 3.1%North St. Paul 11,460 12,104 12,069 12,069 (35) 5.3%Northfield 20,007 20,320 20,355 20,355 35 1.7%Oak Grove 8,031 8,313 8,360 8,360 47 4.1%
N:\MSAS\Books\2017 October Book\Population Spreadsheets for 2018.xlsx 15

Difference
Population Population between % Change used for to be used Populations in Population
2010 2017 for 2018 used for 2017 fromMunicipality Census Allocation Allocation & 2018 Allocation 2010 to 2016
2016 Population Estimates (Released July 2017)
Oakdale 27,378 28,172 27,937 27,937 (235) 2.0%Orono 7,437 7,474 7,691 7,691 217 3.4%Otsego 13,571 15,472 16,019 16,019 547 18.0%Owatonna 25,599 25,782 25,862 25,862 80 1.0%Plymouth 70,576 74,592 75,452 75,452 860 6.9%Prior Lake 22,796 25,049 25,520 25,520 471 11.9%Ramsey 23,668 25,362 26,251 26,251 889 10.9%Red Wing 16,459 16,534 16,545 16,545 11 0.5%Redwood Falls 5,256 5,256 5,211 5,256 0 -0.9%Richfield 35,228 36,557 36,338 36,338 (219) 3.2%Robbinsdale 13,953 14,757 14,704 14,704 (53) 5.4%Rochester 106,750 111,907 113,331 113,331 1,424 6.2%Rogers 11,197 12,381 12,539 12,539 158 12.0%Rosemount 21,874 23,042 23,559 23,559 517 7.7%Roseville 33,660 35,244 35,836 35,836 592 6.5%Sartell 15,887 17,209 17,582 17,582 373 10.7%Sauk Rapids 12,773 13,410 13,631 13,631 221 6.7%Savage 26,911 30,024 30,285 30,285 261 12.5%Shakopee 37,076 40,254 40,643 40,643 389 9.6%Shoreview 25,043 26,092 26,366 26,366 274 5.3%Shorewood 7,307 7,458 7,496 7,496 38 2.6%South St. Paul 20,160 20,351 20,407 20,407 56 1.2%Spring Lake Park 6,412 6,513 6,406 6,412 (101) -0.1%St. Anthony 8,226 9,277 9,234 9,234 (43) 12.3%St. Cloud 65,842 67,012 67,344 67,344 332 2.3%St. Francis 7,218 7,327 7,400 7,400 73 2.5%St. Joseph 6,534 6,772 6,739 6,739 (33) 3.1%St. Louis Park 45,250 48,354 48,927 48,927 573 8.1%St. Michael 16,399 17,081 17,174 17,174 93 4.7%St. Paul 285,068 300,353 304,442 304,442 4,089 6.8%St. Paul Park 5,279 5,441 5,519 5,519 78 4.5%St. Peter 11,196 11,784 11,807 11,807 23 5.5%Stewartville 5,916 6,252 6,269 6,269 17 6.0%Stillwater 18,225 19,754 19,693 19,693 (61) 8.1%Thief River Falls 8,573 8,765 8,845 8,845 80 3.2%Vadnais Heights 12,302 12,490 12,910 12,910 420 4.9%Victoria 7,379 8,775 8,920 8,920 145 20.9%Virginia 8,712 8,712 8,515 8,712 0 -2.3%Waconia 10,697 11,752 12,166 12,166 414 13.7%Waite Park 6,715 7,605 7,639 7,639 34 13.8%Waseca 9,412 9,412 9,124 9,412 0 -3.1%West St. Paul 19,540 20,222 20,886 20,886 664 6.9%White Bear Lake 23,797 24,811 25,001 25,001 190 5.1%Willmar 19,610 19,848 19,891 19,891 43 1.4%Winona 27,614 27,614 27,478 27,614 0 -0.5%Woodbury 61,961 66,974 68,349 68,349 1,375 10.3%Worthington 12,764 13,208 13,288 13,288 80 4.1%Wyoming 7,791 7,877 7,906 7,906 29 1.5%Zimmerman 5,228 5,335 5,469 5,469 134 4.6%
Total 3,690,202 3,874,586 3,915,924 3,917,538 42,952 6.1%
N:\MSAS\Books\2017 October Book\Population Spreadsheets for 2018.xlsx16

KOOCHICHING
MARSHALL
Stewartville
SAINT LOUIS
LAKE
CASS
ITASCA
POLK
BELTRAMI
PINE
AITKIN
COOK
CLAY
ROSEAU
OTTER TAIL
BECKER
TODD
STEARNS
LYON
POPE
KITTSON
SWIFT
RICE
MORRISON
RENVILLE
HUBBARD
WILKIN
NORMAN
CARLTON
MARTINMOWER
CROW WING
NOBLES
MURRAY
FILLMORE
ROCK
WRIGHT
SIBLEY
GRANT
REDWOOD
LAKE OF THE WOODS
BROWN
MEEKER
JACKSON
CLEARWATER
GOODHUE
KANDIYOHI
WINONA
DOUGLAS
DAKOTA
OLMSTED
FREEBORN
FARIBAULT
ISANTI
STEVENS
LINCOLN
BLUE EARTH
WADENA
MCLEOD
DODGESTEELE
MILLE LACS
HOUSTON
TRAVERSE
KANABEC
SCOTT
CHIPPEWA
WABASHA
LAC QUI PARLE
WASECA
BENTON
MAHNOMEN
LE SUEUR
BIG STONE
NICOLLET
CHISAGO
CARVER
PENNINGTON
COTTONWOOD
RED LAKE
PIPESTONE
YELLOWMEDICINE
SHERBURNE
WATONWAN
Hibbing
Duluth
Rochester
Cloquet
Red Wing
St. Cloud
Winona
Baxter
Hermantown
Virginia
NorthBranch
Moorhead
Mankato
Fairmont Austin
Willmar
GrandRapids
Bemidji
Faribault
Alexandria
AlbertLea
Owatonna
Brainerd
Buffalo
Fergus Falls
Sartell
Marshall
DetroitLakes
NewUlm
BigLake
Monticello
Isanti
Morris
Little Falls
Waite Park
Northfield
Worthington
Waseca
St. Peter
Cambridge
Delano
Litchfield
BellePlaine
Chisholm
SaukRapids
Crookston
Byron
Jordan
Montevideo
Kasson
NorthMankato
St. Joseph
RedwoodFalls
InternationalFalls
East Grand Forks
ThiefRiverFalls
Zimmerman
La Crescent
Waconia
New Prague
Hutchinson
Lake City
Glencoe
Lino Lakes
Mahtomedi
St. Paul
HugoBlaine
Eagan
Elk River
MplsOrono
Otsego
Lakeville
East Bethel
Andover
Corcoran
Medina
Ramsey
Plymouth
Ham Lake
Dayton
Woodbury
Oak Grove
St. Michael
Rosemount
Forest Lake
Bloomington
Shakopee
Eden Prairie
Edina
MapleGrove
Minnetrista
Burnsville
CottageGroveChaska
Minnetonka
Lake Elmo
Savage
St. Francis
Wyoming
Chanhassen
CoonRapids
BrooklynPark
PriorLake
Becker
Frid.
MaplewoodRoseville
Buffalo
AppleValley
Oakdale
Farmington
Hastings
Victoria
Shoreview
RogersAnoka
Champlin
Stillwater
Richfield
St. LouisPark
GV
NorthOaks
Mound
MendotaHgts
Hopkins
IGH
ChisagoCity
AHCrystalDelano
Waconia
WBLBC NB
VHNewHope
Jordan
Albertville
SSPWSP
LC
MV
St. Paul Park
Robbins-dale NSP
CH
St.Anthony
CirclePines
FalconHgts
SLP
Norwood Young America
INSET
Legend
0.0% or less0.1 to 2.0%2.2 to 4.1%
Data Source: MN State Demographer's Officehttp://www.dot.state.mn.us/information/disclaimer.htmlMnDOT's Disclaimer on Maps and Related Data can be found @
Percentage Change in Populationfor State Aid Cities, 2010 - 2016 - State Growth is 4.2%
- all State Aid Cities is 6.1%
10.0% or more
(13)(25)(28)(26)4.3 to 6.0%
6.1 to 9.8%(23)(34)
17

N:\MSAS\Books\2017 October Book\Tentative 2018 MSAS Population Allocations.docx
MSAS POPULATION ALLOCATIONS
For each MSAS city, the 2010 Federal Census, or the State Demographer’s 2016 population estimate (which were released in July 2017), will be used to allocate 50% of the funds for the 2018 apportionment. The greater of the two figures will be used.
Fifty percent of the total sum is distributed on a prorated share that each city’s population bears to the total population. Using the 2017 population apportionment distribution amount of $86,609,182, each city will earn approximately $22.11 per capita in apportionment. This projection will be revised when the actual revenue for the 2018 apportionment becomes available.
Any adjustments made to the 2016 population estimates (which will be released in December of 2017) will be presented in the January booklet. These changes could include population adjustments due to annexations, detachments, or any other minor revisions made by the State Demographer.
MunicipalityAlbert Lea 18,016 18,045 0.2 $402,714 $398,940 ($3,774) (0.9)Albertville 7,317 7,370 0.7 163,558 162,936 (622) (0.4)Alexandria 13,340 13,575 1.8 298,191 300,117 1,926 0.6Andover 31,704 32,335 2.0 708,684 714,864 6,180 0.9Anoka 17,665 17,995 1.9 394,868 397,835 2,967 0.8Apple Valley 50,161 51,338 2.3 1,121,256 1,134,984 13,728 1.2Arden Hills 9,847 9,966 1.2 220,111 220,329 218 0.1Austin 25,111 25,104 0.0 561,310 555,001 (6,309) (1.1)Baxter 8,065 8,318 3.1 180,278 183,895 3,617 2.0Belle Plaine 6,742 6,901 2.4 150,705 152,568 1,863 1.2Bemidji 14,969 15,119 1.0 334,604 334,252 (352) (0.1)Big Lake 10,671 10,918 2.3 238,530 241,376 2,846 1.2Blaine 63,180 64,188 1.6 1,412,272 1,419,072 6,800 0.5Bloomington 87,224 88,299 1.2 1,949,731 1,952,120 2,389 0.1Brainerd 13,673 13,679 0.0 305,635 302,416 (3,219) (1.1)Brooklyn Center 30,864 31,231 1.2 689,907 690,457 550 0.1Brooklyn Park 80,215 80,450 0.3 1,793,058 1,778,594 (14,464) (0.8)Buffalo 16,035 16,119 0.5 358,433 356,360 (2,073) (0.6)Burnsville 61,908 61,849 (0.1) 1,383,838 1,367,362 (16,476) (1.2)Byron 5,404 5,498 1.7 120,796 121,550 754 0.6Cambridge 8,496 8,749 3.0 189,912 193,423 3,511 1.8Champlin 23,089 23,343 1.1 516,112 516,069 (43) 0.0Chanhassen 25,194 25,448 1.0 563,165 562,606 (559) (0.1)Chaska 25,607 26,439 3.2 572,397 584,515 12,118 2.1Chisago City 5,156 5,272 2.2 115,253 116,554 1,301 1.1
Allocation % Change
TENTATIVE 2018 POPULATION ALLOCATIONSoverall population change for allocation puposes is 1.1%
Population Used for
2017
Population to be used
for 2018Population % Change
2017 Population Allocations
2018 Population Allocations
Difference Between last
two Allocations
18
N:\MSAS\Books\2017 October Book\Tentative 2018 MSAS Population Allocations.docx
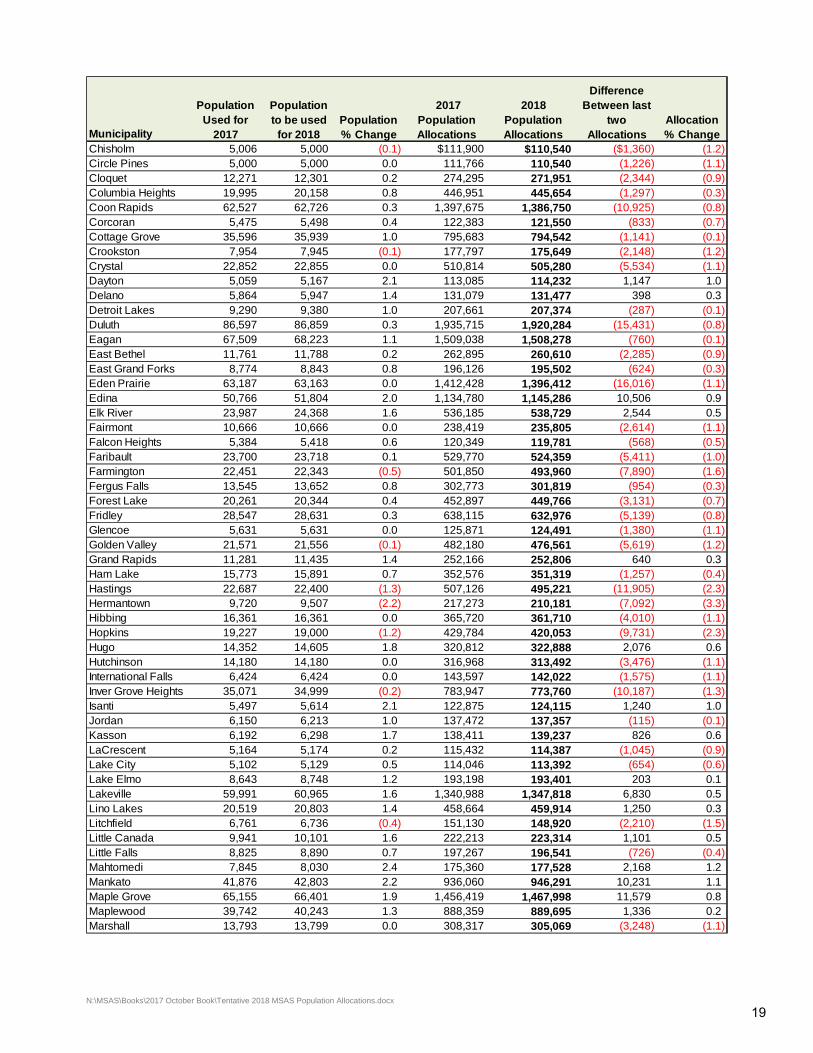
MunicipalityChisholm 5,006 5,000 (0.1) $111,900 $110,540 ($1,360) (1.2)Circle Pines 5,000 5,000 0.0 111,766 110,540 (1,226) (1.1)Cloquet 12,271 12,301 0.2 274,295 271,951 (2,344) (0.9)Columbia Heights 19,995 20,158 0.8 446,951 445,654 (1,297) (0.3)Coon Rapids 62,527 62,726 0.3 1,397,675 1,386,750 (10,925) (0.8)Corcoran 5,475 5,498 0.4 122,383 121,550 (833) (0.7)Cottage Grove 35,596 35,939 1.0 795,683 794,542 (1,141) (0.1)Crookston 7,954 7,945 (0.1) 177,797 175,649 (2,148) (1.2)Crystal 22,852 22,855 0.0 510,814 505,280 (5,534) (1.1)Dayton 5,059 5,167 2.1 113,085 114,232 1,147 1.0Delano 5,864 5,947 1.4 131,079 131,477 398 0.3Detroit Lakes 9,290 9,380 1.0 207,661 207,374 (287) (0.1)Duluth 86,597 86,859 0.3 1,935,715 1,920,284 (15,431) (0.8)Eagan 67,509 68,223 1.1 1,509,038 1,508,278 (760) (0.1)East Bethel 11,761 11,788 0.2 262,895 260,610 (2,285) (0.9)East Grand Forks 8,774 8,843 0.8 196,126 195,502 (624) (0.3)Eden Prairie 63,187 63,163 0.0 1,412,428 1,396,412 (16,016) (1.1)Edina 50,766 51,804 2.0 1,134,780 1,145,286 10,506 0.9Elk River 23,987 24,368 1.6 536,185 538,729 2,544 0.5Fairmont 10,666 10,666 0.0 238,419 235,805 (2,614) (1.1)Falcon Heights 5,384 5,418 0.6 120,349 119,781 (568) (0.5)Faribault 23,700 23,718 0.1 529,770 524,359 (5,411) (1.0)Farmington 22,451 22,343 (0.5) 501,850 493,960 (7,890) (1.6)Fergus Falls 13,545 13,652 0.8 302,773 301,819 (954) (0.3)Forest Lake 20,261 20,344 0.4 452,897 449,766 (3,131) (0.7)Fridley 28,547 28,631 0.3 638,115 632,976 (5,139) (0.8)Glencoe 5,631 5,631 0.0 125,871 124,491 (1,380) (1.1)Golden Valley 21,571 21,556 (0.1) 482,180 476,561 (5,619) (1.2)Grand Rapids 11,281 11,435 1.4 252,166 252,806 640 0.3Ham Lake 15,773 15,891 0.7 352,576 351,319 (1,257) (0.4)Hastings 22,687 22,400 (1.3) 507,126 495,221 (11,905) (2.3)Hermantown 9,720 9,507 (2.2) 217,273 210,181 (7,092) (3.3)Hibbing 16,361 16,361 0.0 365,720 361,710 (4,010) (1.1)Hopkins 19,227 19,000 (1.2) 429,784 420,053 (9,731) (2.3)Hugo 14,352 14,605 1.8 320,812 322,888 2,076 0.6Hutchinson 14,180 14,180 0.0 316,968 313,492 (3,476) (1.1)International Falls 6,424 6,424 0.0 143,597 142,022 (1,575) (1.1)Inver Grove Heights 35,071 34,999 (0.2) 783,947 773,760 (10,187) (1.3)Isanti 5,497 5,614 2.1 122,875 124,115 1,240 1.0Jordan 6,150 6,213 1.0 137,472 137,357 (115) (0.1)Kasson 6,192 6,298 1.7 138,411 139,237 826 0.6LaCrescent 5,164 5,174 0.2 115,432 114,387 (1,045) (0.9)Lake City 5,102 5,129 0.5 114,046 113,392 (654) (0.6)Lake Elmo 8,643 8,748 1.2 193,198 193,401 203 0.1Lakeville 59,991 60,965 1.6 1,340,988 1,347,818 6,830 0.5Lino Lakes 20,519 20,803 1.4 458,664 459,914 1,250 0.3Litchfield 6,761 6,736 (0.4) 151,130 148,920 (2,210) (1.5)Little Canada 9,941 10,101 1.6 222,213 223,314 1,101 0.5Little Falls 8,825 8,890 0.7 197,267 196,541 (726) (0.4)Mahtomedi 7,845 8,030 2.4 175,360 177,528 2,168 1.2Mankato 41,876 42,803 2.2 936,060 946,291 10,231 1.1Maple Grove 65,155 66,401 1.9 1,456,419 1,467,998 11,579 0.8Maplewood 39,742 40,243 1.3 888,359 889,695 1,336 0.2Marshall 13,793 13,799 0.0 308,317 305,069 (3,248) (1.1)
Allocation % Change
Population Used for
2017
Population to be used
for 2018Population % Change
2017 Population Allocations
2018 Population Allocations
Difference Between last
two Allocations
19

N:\MSAS\Books\2017 October Book\Tentative 2018 MSAS Population Allocations.docx
MunicipalityMedina 5,967 6,131 2.7 $133,381 $135,545 $2,164 1.6Mendota Heights 11,105 11,283 1.6 248,232 249,445 1,213 0.5Minneapolis 412,517 419,952 1.8 9,221,052 9,284,326 63,274 0.7Minnetonka 51,647 52,741 2.1 1,154,473 1,166,001 11,528 1.0Minnetrista 7,029 7,238 3.0 157,120 160,018 2,898 1.8Montevideo 5,383 5,383 0.0 120,327 119,008 (1,319) (1.1)Monticello 13,311 13,409 0.7 297,543 296,447 (1,096) (0.4)Moorhead 41,901 42,581 1.6 936,619 941,383 4,764 0.5Morris 5,418 5,442 0.4 121,109 120,312 (797) (0.7)Mound 9,209 9,371 1.8 205,850 207,175 1,325 0.6Mounds View 13,007 13,161 1.2 290,747 290,964 217 0.1New Brighton 22,170 22,618 2.0 495,569 500,040 4,471 0.9New Hope 21,225 21,600 1.8 474,445 477,534 3,089 0.7New Prague 7,508 7,585 1.0 167,827 167,690 (137) (0.1)New Ulm 13,583 13,539 (0.3) 303,623 299,321 (4,302) (1.4)North Branch 10,330 10,469 1.3 230,908 231,449 541 0.2North Mankato 13,689 13,813 0.9 305,992 305,379 (613) (0.2)North St. Paul 12,104 12,069 (0.3) 270,562 266,822 (3,740) (1.4)Northfield 20,320 20,355 0.2 454,216 450,010 (4,206) (0.9)Oak Grove 8,313 8,360 0.6 185,822 184,823 (999) (0.5)Oakdale 28,172 27,937 (0.8) 629,733 617,633 (12,100) (1.9)Orono 7,474 7,691 2.9 167,067 170,033 2,966 1.8Otsego 15,472 16,019 3.5 345,848 354,149 8,301 2.4Owatonna 25,782 25,862 0.3 576,309 571,759 (4,550) (0.8)Plymouth 74,592 75,452 1.2 1,667,366 1,668,098 732 0.0Prior Lake 25,049 25,520 1.9 559,924 564,198 4,274 0.8Ramsey 25,362 26,251 3.5 566,920 580,359 13,439 2.4Red Wing 16,534 16,545 0.1 369,587 365,778 (3,809) (1.0)Redwood Falls 5,256 5,256 0.0 117,488 116,200 (1,288) (1.1)Richfield 36,557 36,338 (0.6) 817,164 803,363 (13,801) (1.7)Robbinsdale 14,757 14,704 (0.4) 329,865 325,077 (4,788) (1.5)Rochester 111,907 113,331 1.3 2,501,473 2,505,529 4,056 0.2Rogers 12,381 12,539 1.3 276,754 277,213 459 0.2Rosemount 23,042 23,559 2.2 515,061 520,844 5,783 1.1Roseville 35,244 35,836 1.7 787,814 792,265 4,451 0.6Sartell 17,209 17,582 2.2 384,675 388,704 4,029 1.0Sauk Rapids 13,410 13,631 1.6 299,756 301,355 1,599 0.5Savage 30,024 30,285 0.9 671,131 669,543 (1,588) (0.2)Shakopee 40,254 40,643 1.0 899,803 898,538 (1,265) (0.1)Shoreview 26,092 26,366 1.1 583,238 582,901 (337) (0.1)Shorewood 7,458 7,496 0.5 166,710 165,722 (988) (0.6)South St. Paul 20,351 20,407 0.3 454,909 451,159 (3,750) (0.8)Spring Lake Park 6,513 6,412 (1.6) 145,586 141,757 (3,829) (2.6)St. Anthony 9,277 9,234 (0.5) 207,370 204,146 (3,224) (1.6)St. Cloud 67,012 67,344 0.5 1,497,929 1,488,845 (9,084) (0.6)St. Francis 7,327 7,400 1.0 163,781 163,600 (181) (0.1)St. Joseph 6,772 6,739 (0.5) 151,375 148,986 (2,389) (1.6)St. Louis Park 48,354 48,927 1.2 1,080,864 1,081,681 817 0.1St. Michael 17,081 17,174 0.5 381,814 379,684 (2,130) (0.6)St. Paul 300,353 304,442 1.4 6,713,834 6,730,623 16,789 0.3St. Paul Park 5,441 5,519 1.4 121,623 122,014 391 0.3St. Peter 11,784 11,807 0.2 263,409 261,030 (2,379) (0.9)Stewartville 6,252 6,269 0.3 139,752 138,595 (1,157) (0.8)Stillwater 19,754 19,693 (0.3) 441,564 435,374 (6,190) (1.4)Thief River Falls 8,765 8,845 0.9 195,925 195,546 (379) (0.2)
Allocation % Change
Population Used for
2017
Population to be used
for 2018Population % Change
2017 Population Allocations
2018 Population Allocations
Difference Between last
two Allocations
20

N:\MSAS\Books\2017 October Book\Tentative 2018 MSAS Population Allocations.docx
MunicipalityVadnais Heights 12,490 12,910 3.4 $279,191 $285,415 $6,224 2.2Victoria 8,775 8,920 1.7 196,149 197,204 1,055 0.5Virginia 8,712 8,712 0.0 194,741 192,605 (2,136) (1.1)Waconia 11,752 12,166 3.5 262,694 268,967 6,273 2.4Waite Park 7,605 7,639 0.4 169,996 168,884 (1,112) (0.7)Waseca 9,412 9,412 0.0 210,388 208,081 (2,307) (1.1)West St. Paul 20,222 20,886 3.3 452,025 461,749 9,724 2.2White Bear Lake 24,811 25,001 0.8 554,604 552,724 (1,880) (0.3)Willmar 19,848 19,891 0.2 443,665 439,752 (3,913) (0.9)Winona 27,614 27,614 0.0 617,260 610,492 (6,768) (1.1)Woodbury 66,974 68,349 2.1 1,497,080 1,511,064 13,984 0.9Worthington 13,208 13,288 0.6 295,241 293,773 (1,468) (0.5)Wyoming 7,877 7,906 0.4 176,077 174,787 (1,290) (0.7)Zimmerman 5,335 5,469 2.5 119,255 120,910 1,655 1.4
Total 3,874,586 3,917,538 1.1 $86,609,182 $86,609,182 $0
A city's Population Allocation equals total population apportionment divided by the total population times the city's population.
2017 $86,609,182 Equals $22.35 Per person3,874,586
2018 $86,609,182 Equals $22.11 Per person3,917,538 $86,609,182
The population increase from 2017 and 2018 for allocation purposes is 42,952 (1.1% increase overall)
62 Cities Increased their population allocation.86 Cities Decreased their population allocation.
Allocation % Change
Population Used for
2017
Population to be used
for 2018Population % Change
2017 Population Allocations
2018 Population Allocations
Difference Between last
two Allocations
21
N:\MSAS\Books\2017 October Book\Mileage,Needs and Apportionment.docx
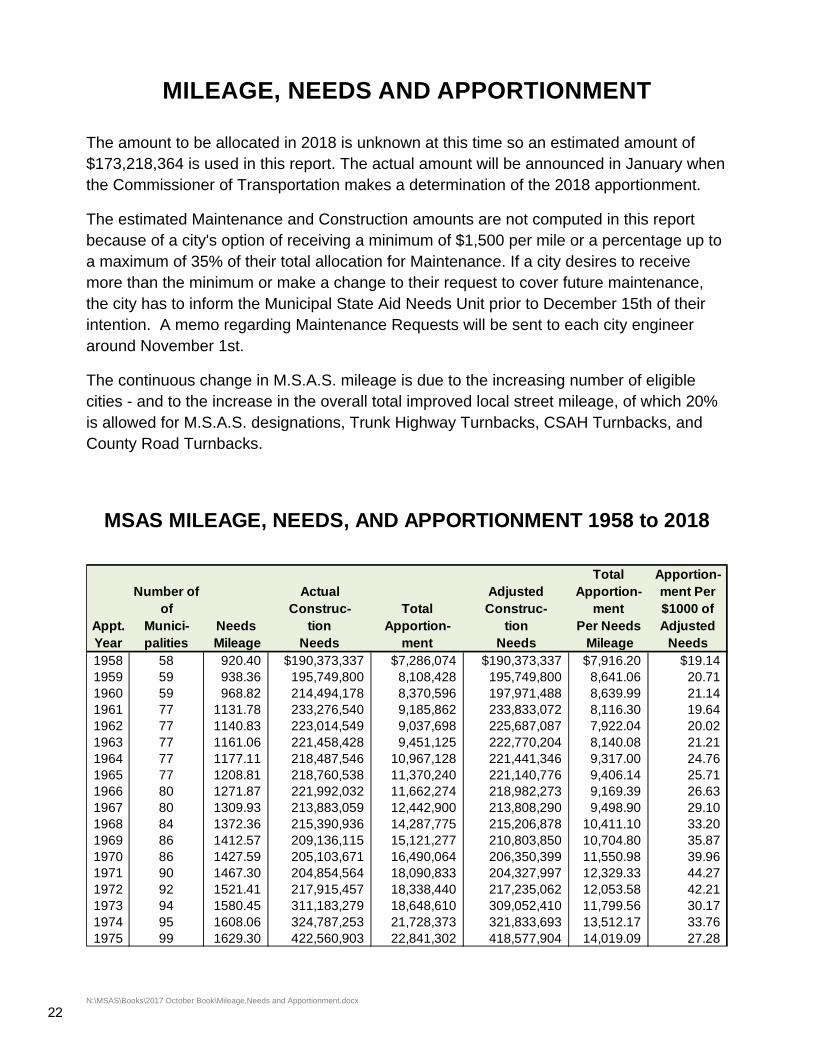
MILEAGE, NEEDS AND APPORTIONMENT
The amount to be allocated in 2018 is unknown at this time so an estimated amount of $173,218,364 is used in this report. The actual amount will be announced in January when the Commissioner of Transportation makes a determination of the 2018 apportionment.
The estimated Maintenance and Construction amounts are not computed in this report because of a city's option of receiving a minimum of $1,500 per mile or a percentage up to a maximum of 35% of their total allocation for Maintenance. If a city desires to receive more than the minimum or make a change to their request to cover future maintenance, the city has to inform the Municipal State Aid Needs Unit prior to December 15th of their intention. A memo regarding Maintenance Requests will be sent to each city engineer around November 1st.
The continuous change in M.S.A.S. mileage is due to the increasing number of eligible cities - and to the increase in the overall total improved local street mileage, of which 20% is allowed for M.S.A.S. designations, Trunk Highway Turnbacks, CSAH Turnbacks, and County Road Turnbacks.
16-Aug-17
Total Apportion-Number of Actual Adjusted Apportion- ment Per
of Construc- Total Construc- ment $1000 ofAppt. Munici- Needs tion Apportion- tion Per Needs AdjustedYear palities Mileage Needs ment Needs Mileage Needs1958 58 920.40 $190,373,337 $7,286,074 $190,373,337 $7,916.20 $19.141959 59 938.36 195,749,800 8,108,428 195,749,800 8,641.06 20.711960 59 968.82 214,494,178 8,370,596 197,971,488 8,639.99 21.141961 77 1131.78 233,276,540 9,185,862 233,833,072 8,116.30 19.641962 77 1140.83 223,014,549 9,037,698 225,687,087 7,922.04 20.021963 77 1161.06 221,458,428 9,451,125 222,770,204 8,140.08 21.211964 77 1177.11 218,487,546 10,967,128 221,441,346 9,317.00 24.761965 77 1208.81 218,760,538 11,370,240 221,140,776 9,406.14 25.711966 80 1271.87 221,992,032 11,662,274 218,982,273 9,169.39 26.631967 80 1309.93 213,883,059 12,442,900 213,808,290 9,498.90 29.101968 84 1372.36 215,390,936 14,287,775 215,206,878 10,411.10 33.201969 86 1412.57 209,136,115 15,121,277 210,803,850 10,704.80 35.871970 86 1427.59 205,103,671 16,490,064 206,350,399 11,550.98 39.961971 90 1467.30 204,854,564 18,090,833 204,327,997 12,329.33 44.271972 92 1521.41 217,915,457 18,338,440 217,235,062 12,053.58 42.211973 94 1580.45 311,183,279 18,648,610 309,052,410 11,799.56 30.171974 95 1608.06 324,787,253 21,728,373 321,833,693 13,512.17 33.761975 99 1629.30 422,560,903 22,841,302 418,577,904 14,019.09 27.28
MSAS MILEAGE, NEEDS, AND APPORTIONMENT 1958 to 2018
22
N:\MSAS\Books\2017 October Book\Mileage,Needs and Apportionment.docx
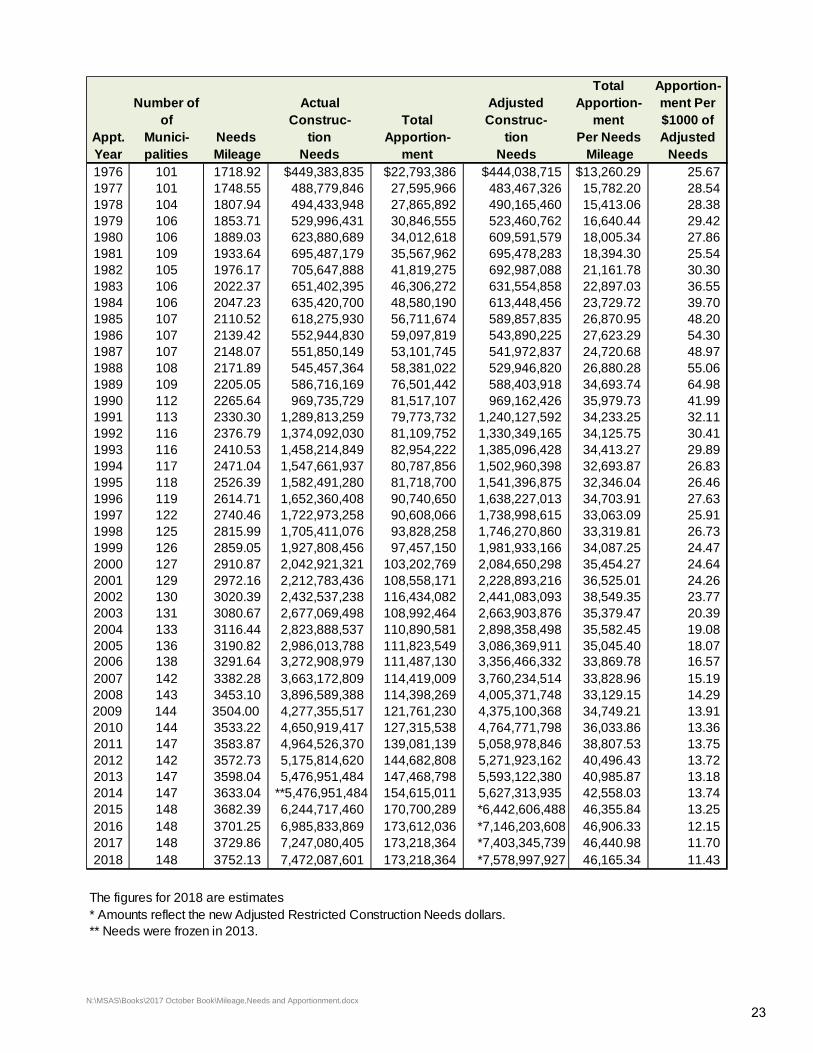
Total Apportion-Number of Actual Adjusted Apportion- ment Per
of Construc- Total Construc- ment $1000 ofAppt. Munici- Needs tion Apportion- tion Per Needs AdjustedYear palities Mileage Needs ment Needs Mileage Needs1976 101 1718.92 $449,383,835 $22,793,386 $444,038,715 $13,260.29 25.671977 101 1748.55 488,779,846 27,595,966 483,467,326 15,782.20 28.541978 104 1807.94 494,433,948 27,865,892 490,165,460 15,413.06 28.381979 106 1853.71 529,996,431 30,846,555 523,460,762 16,640.44 29.421980 106 1889.03 623,880,689 34,012,618 609,591,579 18,005.34 27.861981 109 1933.64 695,487,179 35,567,962 695,478,283 18,394.30 25.541982 105 1976.17 705,647,888 41,819,275 692,987,088 21,161.78 30.301983 106 2022.37 651,402,395 46,306,272 631,554,858 22,897.03 36.551984 106 2047.23 635,420,700 48,580,190 613,448,456 23,729.72 39.701985 107 2110.52 618,275,930 56,711,674 589,857,835 26,870.95 48.201986 107 2139.42 552,944,830 59,097,819 543,890,225 27,623.29 54.301987 107 2148.07 551,850,149 53,101,745 541,972,837 24,720.68 48.971988 108 2171.89 545,457,364 58,381,022 529,946,820 26,880.28 55.061989 109 2205.05 586,716,169 76,501,442 588,403,918 34,693.74 64.981990 112 2265.64 969,735,729 81,517,107 969,162,426 35,979.73 41.991991 113 2330.30 1,289,813,259 79,773,732 1,240,127,592 34,233.25 32.111992 116 2376.79 1,374,092,030 81,109,752 1,330,349,165 34,125.75 30.411993 116 2410.53 1,458,214,849 82,954,222 1,385,096,428 34,413.27 29.891994 117 2471.04 1,547,661,937 80,787,856 1,502,960,398 32,693.87 26.831995 118 2526.39 1,582,491,280 81,718,700 1,541,396,875 32,346.04 26.461996 119 2614.71 1,652,360,408 90,740,650 1,638,227,013 34,703.91 27.631997 122 2740.46 1,722,973,258 90,608,066 1,738,998,615 33,063.09 25.911998 125 2815.99 1,705,411,076 93,828,258 1,746,270,860 33,319.81 26.731999 126 2859.05 1,927,808,456 97,457,150 1,981,933,166 34,087.25 24.472000 127 2910.87 2,042,921,321 103,202,769 2,084,650,298 35,454.27 24.642001 129 2972.16 2,212,783,436 108,558,171 2,228,893,216 36,525.01 24.262002 130 3020.39 2,432,537,238 116,434,082 2,441,083,093 38,549.35 23.772003 131 3080.67 2,677,069,498 108,992,464 2,663,903,876 35,379.47 20.392004 133 3116.44 2,823,888,537 110,890,581 2,898,358,498 35,582.45 19.082005 136 3190.82 2,986,013,788 111,823,549 3,086,369,911 35,045.40 18.072006 138 3291.64 3,272,908,979 111,487,130 3,356,466,332 33,869.78 16.572007 142 3382.28 3,663,172,809 114,419,009 3,760,234,514 33,828.96 15.192008 143 3453.10 3,896,589,388 114,398,269 4,005,371,748 33,129.15 14.292009 144 3504.00 4,277,355,517 121,761,230 4,375,100,368 34,749.21 13.912010 144 3533.22 4,650,919,417 127,315,538 4,764,771,798 36,033.86 13.362011 147 3583.87 4,964,526,370 139,081,139 5,058,978,846 38,807.53 13.752012 142 3572.73 5,175,814,620 144,682,808 5,271,923,162 40,496.43 13.722013 147 3598.04 5,476,951,484 147,468,798 5,593,122,380 40,985.87 13.182014 147 3633.04 **5,476,951,484 154,615,011 5,627,313,935 42,558.03 13.742015 148 3682.39 6,244,717,460 170,700,289 *6,442,606,488 46,355.84 13.252016 148 3701.25 6,985,833,869 173,612,036 *7,146,203,608 46,906.33 12.152017 148 3729.86 7,247,080,405 173,218,364 *7,403,345,739 46,440.98 11.702018 148 3752.13 7,472,087,601 173,218,364 *7,578,997,927 46,165.34 11.43
The figures for 2018 are estimates* Amounts reflect the new Adjusted Restricted Construction Needs dollars.** Needs were frozen in 2013.
23

24
OCTOBER 2017 BOOK\APPORTIONMENT PER $1000 OF NEEDS GRAPH.XLS 8/28/2017
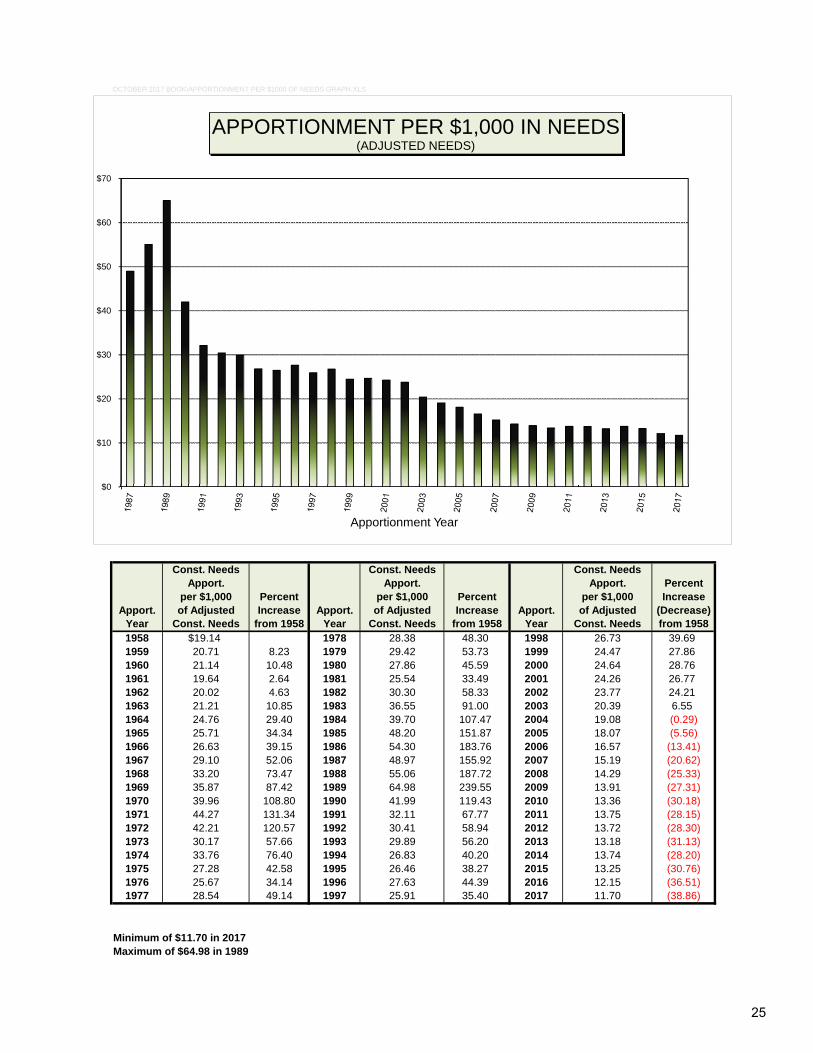
Const. Needs Const. Needs Const. NeedsApport. Apport. Apport. Percent
per $1,000 Percent per $1,000 Percent per $1,000 IncreaseApport. of Adjusted Increase Apport. of Adjusted Increase Apport. of Adjusted (Decrease)
Year Const. Needs from 1958 Year Const. Needs from 1958 Year Const. Needs from 19581958 $19.14 1978 28.38 48.30 1998 26.73 39.691959 20.71 8.23 1979 29.42 53.73 1999 24.47 27.861960 21.14 10.48 1980 27.86 45.59 2000 24.64 28.761961 19.64 2.64 1981 25.54 33.49 2001 24.26 26.771962 20.02 4.63 1982 30.30 58.33 2002 23.77 24.211963 21.21 10.85 1983 36.55 91.00 2003 20.39 6.551964 24.76 29.40 1984 39.70 107.47 2004 19.08 (0.29)1965 25.71 34.34 1985 48.20 151.87 2005 18.07 (5.56)1966 26.63 39.15 1986 54.30 183.76 2006 16.57 (13.41)1967 29.10 52.06 1987 48.97 155.92 2007 15.19 (20.62)1968 33.20 73.47 1988 55.06 187.72 2008 14.29 (25.33)1969 35.87 87.42 1989 64.98 239.55 2009 13.91 (27.31)1970 39.96 108.80 1990 41.99 119.43 2010 13.36 (30.18)1971 44.27 131.34 1991 32.11 67.77 2011 13.75 (28.15)1972 42.21 120.57 1992 30.41 58.94 2012 13.72 (28.30)1973 30.17 57.66 1993 29.89 56.20 2013 13.18 (31.13)1974 33.76 76.40 1994 26.83 40.20 2014 13.74 (28.20)1975 27.28 42.58 1995 26.46 38.27 2015 13.25 (30.76)1976 25.67 34.14 1996 27.63 44.39 2016 12.15 (36.51)1977 28.54 49.14 1997 25.91 35.40 2017 11.70 (38.86)
Minimum of $11.70 in 2017Maximum of $64.98 in 1989
$0
$10
$20
$30
$40
$50
$60
$70
Apportionment Year
APPORTIONMENT PER $1,000 IN NEEDS(ADJUSTED NEEDS)
25
N:\MSAS\Books\2017 October Book\Itemized Tabulation of Needs 2017.docx
2017 ITEMIZED TABULATION OF NEEDS
The 2017 money needs saw an increase over the last year. This increase is due to Needs updates, new designations, added mileage, changing AADT, and an increase in unit costs. (See Screening Board Resolutions for the unit prices used in the 2017 needs computation.)
The “2017 itemized tabulation of Needs” insert shows all construction items in the Municipal State Aid Needs Study. (‘After the fact’ items are discussed later on in this report). This tabulation is provided to give each municipality the opportunity to compare their needs of the individual construction items to that of other cities.
The overall average cost per mile is $1,991,420 (up from $1,942,736 last year). Corcoran has the lowest cost per mile with $1,252,490 while Minneapolis has the highest cost with $2,750,242 per mile.
The five cities with the highest cost per mile are listed alphabetically as follows: Bloomington, Minneapolis, Moorhead, Rochester, and Saint Paul.
The five cities with the lowest cost per mile are listed alphabetically as follows: Corcoran, East Bethel, Ham Lake, Minnetrista and Zimmerman.
26

KOOCHICHING
MARSHALL
Stewartville
SAINT LOUIS
LAKE
CASS
ITASCA
POLK
BELTRAMI
PINE
AITKIN
COOK
CLAY
ROSEAU
OTTER TAIL
BECKER
TODD
STEARNS
LYON
POPE
KITTSON
SWIFT
RICE
MORRISON
RENVILLE
HUBBARD
WILKIN
NORMAN
CARLTON
MARTINMOWER
CROW WING
NOBLES
MURRAY
FILLMORE
ROCK
WRIGHT
SIBLEY
GRANT
REDWOOD
LAKE OF THE WOODS
BROWN
MEEKER
JACKSON
CLEARWATER
GOODHUE
KANDIYOHI
WINONA
DOUGLAS
DAKOTA
OLMSTED
FREEBORN
FARIBAULT
ISANTI
STEVENS
LINCOLN
BLUE EARTH
WADENA
MCLEOD
DODGESTEELE
MILLE LACS
HOUSTON
TRAVERSE
KANABEC
SCOTT
CHIPPEWA
WABASHA
LAC QUI PARLE
WASECA
BENTON
MAHNOMEN
LE SUEUR
BIG STONE
NICOLLET
CHISAGO
CARVER
PENNINGTON
COTTONWOOD
RED LAKE
PIPESTONE
YELLOWMEDICINE
SHERBURNE
WATONWAN
Hibbing
Duluth
Rochester
Cloquet
Red Wing
St. Cloud
Winona
Baxter
Hermantown
Virginia
NorthBranch
Moorhead
Mankato
Fairmont Austin
Willmar
GrandRapids
Bemidji
Faribault
Alexandria
AlbertLea
Owatonna
Brainerd
Buffalo
Fergus Falls
Sartell
Marshall
DetroitLakes
NewUlm
BigLake
Monticello
Isanti
Morris
Little Falls
Waite Park
Northfield
Worthington
Waseca
St. Peter
Cambridge
Delano
Litchfield
BellePlaine
Chisholm
SaukRapids
Crookston
Byron
Jordan
Montevideo
Kasson
NorthMankato
St. Joseph
RedwoodFalls
InternationalFalls
East Grand Forks
ThiefRiverFalls
Zimmerman
La Crescent
Waconia
New Prague
Hutchinson
Lake City
Glencoe
Lino Lakes
Mahtomedi
St. Paul
HugoBlaine
Eagan
Elk River
MplsOrono
Otsego
Lakeville
East Bethel
Andover
Corcoran
Medina
Ramsey
Plymouth
Ham Lake
Dayton
Woodbury
Oak Grove
St. Michael
Rosemount
Forest Lake
Bloomington
Shakopee
Eden Prairie
Edina
MapleGrove
Minnetrista
Burnsville
CottageGroveChaska
Minnetonka
Lake Elmo
Savage
St. Francis
Wyoming
Chanhassen
CoonRapids
BrooklynPark
PriorLake
Becker
Frid.
MaplewoodRoseville
Buffalo
AppleValley
Oakdale
Farmington
Hastings
Victoria
Shoreview
RogersAnoka
Champlin
Stillwater
Richfield
St. LouisPark
GV
NorthOaks
Mound
MendotaHgts
Hopkins
IGH
ChisagoCity
AHCrystalDelano
Waconia
WBLBC NB
VHNewHope
Jordan
Albertville
SSPWSP
LC
MV
St. Paul Park
Robbins-dale NSP
CHSt.
Anthony
CirclePines
FalconHgts
SLP
Norwood Young America
INSET
Source: State Aid.http://www.dot.state.mn.us/information/disclaimer.htmlMnDOT's Disclaimer on Maps and Related Data can be found @
Needs Costs per Milefor State Aid Cities, 2017
State Avg is $1,991,420
$1,991,420 to $2,047,884
(17)(62)(30)
(8)(23)
(8)$2,077,987 to $2,262,529$2,297,558 to $2,750,242
$1,832,379 to $1,985,487$1,497,718 to $1,815,288$1,252,490 to $1,475,669
Legend
27

2016 2017 Difference % increase
$689,546,028 $720,388,539 $30,842,511 4.5
647,114,331 662,939,922 15,825,591 2.4
947,357,502 992,656,813 45,299,311 4.8
1,233,623,602 1,289,820,693 56,197,091 4.6
591,547,857 618,230,336 26,682,479 4.5
807,134,599 887,252,025 80,117,426 9.9
283,781,253 296,375,625 12,594,372 4.4
372,907,000 374,947,000 2,040,000 0.5
367,217,630 282,051,060 (85,166,570) (23.2)
1,306,850,603 1,347,425,588 40,574,985 3.1
Total Unadjusted Money Needs $7,247,080,405 $7,472,087,601 $225,007,196 3.1
Total Needs Miles 3,729.07 3,752.13 23.06 0.6
ATF Right of Way $93,387,244 $88,307,252 ($5,079,992) (5.4)
ATF Retaining Wall 3,685,030 3,896,419 211,389 5.7
ATF RR Crossing 1,080,911 1,706,696 625,785 57.9
ATF Bridge over MSAS Route 378,684 378,684 0 0.0
N:\MSAS\Book\2017 October Book\Comparison of Needs 2016 and 2017.xls
Bituminous Surface
Needs Item
Curb and Gutter
Sidewalk Construction
Engineering
Structures
Street Lighting
Traffic Signals
COMPARISON OF NEEDS BETWEEN 2016 and 20172017 Needs are computed for the January 2018 distribution
Grading/Excavation
Total Storm Sewer
Gravel Base
28
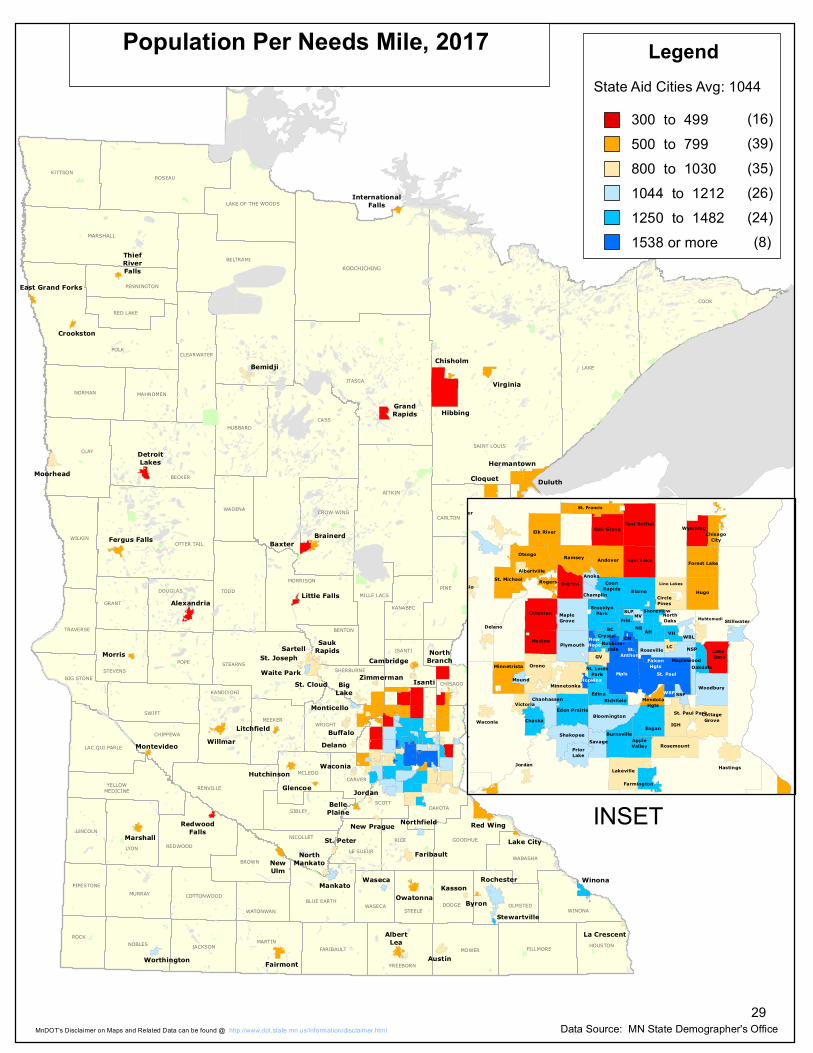
KOOCHICHING
MARSHALL
Stewartville
SAINT LOUIS
LAKE
CASS
ITASCA
POLK
BELTRAMI
PINE
AITKIN
COOK
CLAY
ROSEAU
OTTER TAIL
BECKER
TODD
STEARNS
LYON
POPE
KITTSON
SWIFT
RICE
MORRISON
RENVILLE
HUBBARD
WILKIN
NORMAN
CARLTON
MARTINMOWER
CROW WING
NOBLES
MURRAY
FILLMORE
ROCK
WRIGHT
SIBLEY
GRANT
REDWOOD
LAKE OF THE WOODS
BROWN
MEEKER
JACKSON
CLEARWATER
GOODHUE
KANDIYOHI
WINONA
DOUGLAS
DAKOTA
OLMSTED
FREEBORN
FARIBAULT
ISANTI
STEVENS
LINCOLN
BLUE EARTH
WADENA
MCLEOD
DODGESTEELE
MILLE LACS
HOUSTON
TRAVERSE
KANABEC
SCOTT
CHIPPEWA
WABASHA
LAC QUI PARLE
WASECA
BENTON
MAHNOMEN
LE SUEUR
BIG STONE
NICOLLET
CHISAGO
CARVER
PENNINGTON
COTTONWOOD
RED LAKE
PIPESTONE
YELLOWMEDICINE
SHERBURNE
WATONWAN
Hibbing
Duluth
Rochester
Cloquet
Red Wing
St. Cloud
Winona
Baxter
Hermantown
Virginia
NorthBranch
Moorhead
Mankato
Fairmont Austin
Willmar
GrandRapids
Bemidji
Faribault
Alexandria
AlbertLea
Owatonna
Brainerd
Buffalo
Fergus Falls
Sartell
Marshall
DetroitLakes
NewUlm
BigLake
Monticello
Isanti
Morris
Little Falls
Waite Park
Northfield
Worthington
Waseca
St. Peter
Cambridge
Delano
Litchfield
BellePlaine
Chisholm
SaukRapids
Crookston
Byron
Jordan
Montevideo
Kasson
NorthMankato
St. Joseph
RedwoodFalls
InternationalFalls
East Grand Forks
ThiefRiverFalls
Zimmerman
La Crescent
Waconia
New Prague
Hutchinson
Lake City
Glencoe
Lino Lakes
Mahtomedi
St. Paul
HugoBlaine
Eagan
Elk River
MplsOrono
Otsego
Lakeville
East Bethel
Andover
Corcoran
Medina
Ramsey
Plymouth
Ham Lake
Dayton
Woodbury
Oak Grove
St. Michael
Rosemount
Forest Lake
Bloomington
Shakopee
Eden Prairie
Edina
MapleGrove
Minnetrista
Burnsville
CottageGroveChaska
Minnetonka
Lake Elmo
Savage
St. Francis
Wyoming
Chanhassen
CoonRapids
BrooklynPark
PriorLake
Becker
Frid.
MaplewoodRoseville
Buffalo
AppleValley
Oakdale
Farmington
Hastings
Victoria
Shoreview
RogersAnoka
Champlin
Stillwater
Richfield
St. LouisPark
GV
NorthOaks
Mound
MendotaHgts
Hopkins
IGH
ChisagoCity
AHCrystalDelano
Waconia
WBLBC NB
VHNewHope
Jordan
Albertville
SSPWSP
LC
MV
St. Paul Park
Robbins-dale NSP
CH
St.Anthony
CirclePines
FalconHgts
SLP
Norwood Young America
INSET
Legend
300 to 499500 to 799800 to 1030
Data Source: MN State Demographer's Officehttp://www.dot.state.mn.us/information/disclaimer.htmlMnDOT's Disclaimer on Maps and Related Data can be found @
Population Per Needs Mile, 2017State Aid Cities Avg: 1044
1538 or more
(16)(39)(35)(26)1044 to 1212
1250 to 1482(8)
(24)
29

N:\MSAS\Books\2017 October Book\MileageReport2017notes.docx
2017 MILEAGE REPORT
The 2017 Mileage Report shows all categories of mileage used in the Municipal State Aid Needs Study. This report is provided to give each city the opportunity to view their mileage for the various categories.
The 2017 Total System Length reflects an increase due to overall growth and to new MSAS designations.
‘Total System Length’ & ‘Total Needs Length’ are slightly different in this report. Among the reasons these categories differ are designations Outside City Limits and MSB approved One Way Mileage.
Total Needs Length for all cities is 3,752.13 miles.
Total System Length for all cities is 3,758.33 miles.
The information on the Mileage Report may also be helpful as you fill out your 2017 Annual Certification of Mileage form (which is due in January 2018). Unless your city has had a system revision since June, we expect that your “Total Needs Length” from this Mileage Report will match line 13 of the Certification of Mileage. Should there be a discrepancy, we ask that you provide an explanation on the backside of your Annual Certification of Mileage Form.
If a city has a system revision that occurred after your Needs were submitted by the spring deadline and gets approved by the Commissioner before December 31st, those revisions can also be included on your 2017 certification (submitted in January of 2018).
30

Cit
y
2016
MS
AS
N
eed
s M
ileag
e
2017
MS
AS
N
eed
s M
ileag
e
Dif
fere
nce
in
Mile
age
Cit
y
2016
MS
AS
N
eed
s M
ileag
e
2017
MS
AS
N
eed
s M
ileag
e
Dif
fere
nce
in
Mile
age
Cit
y
2016
MS
AS
N
eed
s M
ileag
e
2017
MS
AS
N
eed
s M
ileag
e
Dif
fere
nce
in
Mile
age
ALB
ER
T L
EA
24.3
124
.31
FR
IDLE
Y22
.90
22.9
0O
RO
NO
9.45
9.45
ALB
ER
TV
ILLE
7.51
7.51
GLE
NC
OE
8.39
8.39
OT
SE
GO
23.7
223
.72
ALE
XA
ND
RIA
33.2
933
.29
GO
LDE
N V
ALL
EY
23.7
423
.74
OW
AT
ON
NA
34.6
434
.64
AN
DO
VE
R43
.29
43.4
80.
19G
RA
ND
RA
PID
S25
.68
26.3
20.
64P
LYM
OU
TH
64.0
465
.31
1.27
AN
OK
A15
.42
15.4
2H
AM
LA
KE
33.7
433
.73
(0.0
1)P
RIO
R L
AK
E21
.67
21.6
3(0
.04)
AP
PLE
VA
LLE
Y37
.31
37.3
30.
02H
AS
TIN
GS
22.6
122
.61
RA
MS
EY
37.8
637
.86
AR
DE
N H
ILLS
7.53
7.53
HE
RM
AN
TO
WN
18.6
518
.65
RE
D W
ING
24.8
724
.87
AU
ST
IN30
.21
30.2
1H
IBB
ING
54.1
954
.19
RE
DW
OO
D F
ALL
S10
.52
10.5
2B
AX
TE
R17
.12
17.1
2H
OP
KIN
S9.
999.
99R
ICH
FIE
LD24
.67
24.6
7B
ELL
E P
LAIN
E8.
958.
95H
UG
O21
.19
21.1
9R
OB
BIN
SD
ALE
10.0
510
.05
BE
MID
JI18
.72
18.7
2H
UT
CH
INS
ON
18.4
919
.52
1.03
RO
CH
ES
TE
R10
3.91
108.
014.
10B
IG L
AK
E11
.48
11.4
8IN
TE
RN
AT
ION
AL
FA
LLS
8.08
8.08
RO
GE
RS
21.3
721
.37
BLA
INE
50.1
850
.36
0.18
INV
ER
GR
OV
E H
EIG
HT
S34
.13
34.7
10.
58R
OS
EM
OU
NT
29.1
529
.385
0.23
5B
LOO
MIN
GT
ON
76.1
276
.12
ISA
NT
I6.
896.
89R
OS
EV
ILLE
30.9
631
.55
0.59
BR
AIN
ER
D19
.16
19.1
6JO
RD
AN
6.09
6.08
(0.0
1)S
AR
TE
LL18
.52
18.5
2B
RO
OK
LYN
CE
NT
ER
21.3
421
.34
KA
SS
ON
6.30
6.30
SA
UK
RA
PID
S14
.21
14.2
1B
RO
OK
LYN
PA
RK
60.1
460
.71
0.57
LA C
RE
SC
EN
T5.
845.
84S
AV
AG
E27
.24
27.2
70.
03B
UF
FA
LO17
.19
17.2
40.
05LA
KE
CIT
Y8.
398.
39S
HA
KO
PE
E37
.49
38.8
81.
39B
UR
NS
VIL
LE44
.77
44.7
7LA
KE
ELM
O16
.30
18.1
21.
82S
HO
RE
VIE
W19
.69
19.6
9B
YR
ON
5.60
7.59
1.99
LAK
EV
ILLE
66.6
668
.33
1.67
SH
OR
EW
OO
D9.
209.
20C
AM
BR
IDG
E16
.37
16.9
30.
56LI
NO
LA
KE
S23
.84
23.8
4S
OU
TH
ST
PA
UL
17.4
617
.46
CH
AM
PLI
N20
.07
20.0
7LI
TC
HF
IELD
8.77
8.77
SP
RIN
G L
AK
E P
AR
K5.
825.
82C
HA
NH
AS
SE
N22
.76
22.7
6LI
TT
LE C
AN
AD
A11
.35
11.3
5S
T A
NT
HO
NY
5.95
5.95
CH
AS
KA
20.9
520
.95
LIT
TLE
FA
LLS
21.7
521
.75
ST
CLO
UD
64.3
065
.90
1.60
CH
ISA
GO
CIT
Y8.
108.
54M
AH
TO
ME
DI
9.56
9.56
ST
FR
AN
CIS
13.4
513
.45
CH
ISH
OLM
8.41
8.41
MA
NK
AT
O39
.62
39.6
650.
045
ST
JO
SE
PH
6.66
6.66
CIR
CLE
PIN
ES
3.60
3.60
MA
PLE
GR
OV
E57
.10
58.1
71.
07S
T L
OU
IS P
AR
K33
.02
33.0
2C
LOQ
UE
T22
.35
22.7
50.
40M
AP
LEW
OO
D36
.68
36.6
8S
T M
ICH
AE
L22
.75
22.9
10.
16C
OLU
MB
IA H
EIG
HT
S12
.50
12.5
0M
AR
SH
ALL
18.7
818
.78
ST
PA
UL
164.
7316
4.73
CO
ON
RA
PID
S43
.23
43.2
3M
ED
INA
12.5
912
.59
ST
PA
UL
PA
RK
6.06
5.94
(0.1
2)C
OR
CO
RA
N15
.53
15.5
3M
EN
DO
TA
HE
IGH
TS
15.1
715
.17
ST
PE
TE
R14
.63
14.7
40.
11C
OT
TA
GE
GR
OV
E35
.31
35.3
1M
INN
EA
PO
LIS
206.
8220
6.82
ST
EW
AR
TV
ILLE
4.71
4.71
CR
OO
KS
TO
N11
.58
11.5
8M
INN
ET
ON
KA
51.1
951
.19
ST
ILLW
AT
ER
18.2
518
.25
CR
YS
TA
L17
.47
17.4
7M
INN
ET
RIS
TA
12.9
812
.98
TH
IEF
RIV
ER
FA
LLS
16.1
516
.23
0.08
DA
YT
ON
10.6
210
.62
MO
NT
EV
IDE
O8.
838.
980.
15V
AD
NA
IS H
EIG
HT
S9.
179.
17D
ELA
NO
6.21
6.21
MO
NT
ICE
LLO
12.1
912
.19
VIC
TO
RIA
7.43
8.77
1.34
DE
TR
OIT
LA
KE
S24
.52
24.5
2M
OO
RH
EA
D48
.01
48.0
1V
IRG
INIA
17.1
416
.36
(0.7
8)D
ULU
TH
116.
7111
6.71
MO
RR
IS9.
189.
18W
AC
ON
IA12
.32
14.0
61.
74E
AG
AN
49.0
349
.03
MO
UN
D7.
947.
94W
AIT
E P
AR
K7.
027.
02E
AS
T B
ET
HE
L28
.84
28.8
4M
OU
ND
S V
IEW
10.8
610
.86
WA
SE
CA
7.71
7.71
EA
ST
GR
AN
D F
OR
KS
16.9
916
.99
NE
W B
RIG
HT
ON
15.2
215
.27
0.05
WE
ST
ST
PA
UL
13.5
813
.58
ED
EN
PR
AIR
IE48
.54
48.5
4N
EW
HO
PE
12.8
612
.86
WH
ITE
BE
AR
LA
KE
21.0
220
.94
(0.0
8)E
DIN
A40
.85
40.8
5N
EW
PR
AG
UE
7.76
7.76
WIL
LMA
R27
.87
27.8
7E
LK R
IVE
R38
.27
38.2
7N
EW
ULM
18.0
118
.01
WIN
ON
A21
.86
21.8
6F
AIR
MO
NT
20.1
220
.12
NO
RT
H B
RA
NC
H27
.81
27.8
1W
OO
DB
UR
Y57
.52
57.5
2F
ALC
ON
HE
IGH
TS
3.29
3.29
NO
RT
H M
AN
KA
TO
15.7
715
.77
WO
RT
HIN
GT
ON
11.7
911
.79
FA
RIB
AU
LT24
.07
24.0
7N
OR
TH
ST
PA
UL
11.3
411
.34
WY
OM
ING
15.9
215
.92
FA
RM
ING
TO
N16
.69
16.6
9N
OR
TH
FIE
LD17
.06
17.0
6Z
IMM
ER
MA
N6.
516.
51F
ER
GU
S F
ALL
S26
.18
26.1
8O
AK
GR
OV
E25
.73
25.7
3
FO
RE
ST
LA
KE
33.8
333
.83
OA
KD
ALE
19.3
919
.39
To
tal
3,72
9.07
3,75
2.13
22.6
2
N:\M
SA
S\B
OO
KS
\201
7 O
CT
OB
ER
BO
OK
\NE
ED
S M
ILE
AG
E C
OM
PA
RIS
ON
201
7.X
LS
MS
AS
NE
ED
S M
ILE
AG
E C
OM
PA
RIS
ON
from
201
6 to
201
7
31

N:\MSAS\Books\2017 October Book\Const Needs Apport (Tent) 2018.docx
2017 CONSTRUCTION NEEDS & 2018 CONSTRUCTION NEEDS ALLOCATIONS
50% of the total apportionment is determined on a prorated share that each city's construction needs bears to the total of all construction needs. The construction needs shown in this report are computed from annual Needs Updates submitted by each city. Before determining each city’s allocation, the following Municipal Screening Board mandated adjustments are applied to the “unadjusted” construction needs.
- Phase In (or “Restriction”: Determine which cities will have a restriction applied to their unadjusted construction Needs)
- Excess Unencumbered Construction Fund Balance Adjustment
- Low Balance Incentive
- After the Fact Right of Way Adjustment
- After the Fact Retaining Wall Adjustment
- After the Fact Railroad Crossing Adjustment
- After the Fact Railroad Bridge over MSAS Adjustment
- Excess Maintenance Account (none for 2017)
- Trunk Highway Turnback Maintenance (none for 2017)
By applying these adjustments and the restriction, the “Adjusted Restricted Construction Needs” are calculated for each city. These are the Needs used to determine Construction Needs Allocations. The actual amount of the road user fund for distribution to the Municipal State Aid Account will not be available until January 2018. The allocations in this book are based on a projected money needs apportionment of $86,609,182.
The data on the following pages are for the Screening Board's use in determining the Tentative 2017 Construction Needs. These tabulations show the impact of the individual adjustments and the tentative allocations to each city.
Step one is applying the Restriction.
32

PHASE IN (RESTRICTION) Unrestricted Cities in the Metro
Year One (2014)
Year Four (2017)
Year Four (2017)
33

N:\MSAS\Books\2017 October Book\Phase In Steps.docx
STEPS TO COMPUTE PHASE IN (RESTRICTION)
- Compare this years Unadjusted Needs to last years Restricted Needs.
- Find the Statewide Percent of Change between the two.
- Determine each individual city’s Percent of Change from last years Restricted Needs to this years Unadjusted Needs.
- If an individual city’s change is more than 5 Percentage Points less than the Statewide Average Percent of Change, increase this year’s Unadjusted Needs to 5 Percentage Points less than the Statewide Average Percent of Change to calculate its Restricted Needs.
- If an individual city’s Percent of Change is more than 10 Percentage Points greater than the Statewide Average Percent of Change, decrease this year’s Unadjusted Needs to 10 Percentage Points more than the Statewide Average Percent of Change to calculate its Restricted Needs.
- If an individual city’s Percent of Change is between 5 Percentage Points less and 10 Percentage Points more than the Statewide Average Percent of Change, use the Unadjusted Needs as its Restricted Needs.
- Apply adjustments to the Restricted Needs.
34

29C
ities
rec
eive
d th
e Lo
wer
Res
tric
tion
20C
ities
rec
eive
d th
e U
pper
Res
tric
tion
99C
ities
rec
eive
d N
o R
estr
ictio
nN
:\MS
AS
\Boo
ks\2
015
Oct
ober
Boo
k\T
enat
iveA
djus
ted
Con
stru
ctio
n N
eeds
201
5 (O
ld B
ook
File
A &
B).
xls
Alb
ert L
ea
$46,
171,
239
$46,
727,
783
1.21
$0$0
$46,
727,
783
$46,
727,
783
Alb
ertv
ille
13,3
38,6
1813
,590
,010
1.88
00
13,5
90,0
1013
,590
,010
Ale
xand
ria59
,677
,837
62,2
32,7
604.
280
062
,232
,760
62,2
32,7
60A
ndov
er66
,747
,496
65,1
20,7
78(2
.44)
00
65,1
20,7
7865
,120
,778
Ano
ka30
,514
,892
30,3
69,7
88(0
.48)
00
30,3
69,7
8830
,369
,788
App
le V
alle
y75
,849
,518
79,1
10,3
194.
300
079
,110
,319
79,1
10,3
19A
rden
Hill
s11
,284
,196
11,7
30,6
033.
960
011
,730
,603
11,7
30,6
03A
ustin
63,5
98,0
7963
,678
,547
0.13
00
63,6
78,5
4763
,678
,547
Bax
ter
30,2
44,4
9631
,539
,595
4.28
00
31,5
39,5
9531
,539
,595
Bel
le P
lain
e14
,806
,081
15,8
24,4
836.
880
015
,824
,483
15,8
24,4
83B
emid
ji33
,806
,993
37,1
68,3
209.
940
037
,168
,320
37,1
68,3
20B
ig L
ake
16,3
54,0
7917
,456
,205
6.74
00
17,4
56,2
0517
,456
,205
Bla
ine
76,5
42,3
6897
,446
,521
27.3
10
85,9
49,4
260
85,9
49,4
26B
loom
ingt
on17
4,61
7,23
317
9,27
6,80
12.
670
017
9,27
6,80
117
9,27
6,80
1B
rain
erd
38,3
75,8
4138
,298
,195
(0.2
0)0
038
,298
,195
38,2
98,1
95B
rook
lyn
Cen
ter
30,0
66,9
4045
,934
,764
52.7
70
33,7
62,1
670
33,7
62,1
67B
rook
lyn
Par
k88
,602
,955
121,
311,
115
36.9
20
99,4
92,2
580
99,4
92,2
58B
uffa
lo33
,088
,364
31,2
70,1
66(5
.49)
32,1
91,6
700
032
,191
,670
Bur
nsvi
lle10
0,89
2,59
910
0,18
1,12
8(0
.71)
00
100,
181,
128
100,
181,
128
Byr
on8,
686,
539
12,8
24,5
2647
.64
09,
754,
115
09,
754,
115
Cam
brid
ge23
,959
,818
33,2
98,6
3138
.98
026
,904
,480
026
,904
,480
Cha
mpl
in37
,574
,448
39,0
11,0
453.
820
039
,011
,045
39,0
11,0
45C
hanh
asse
n41
,115
,058
45,9
01,6
8411
.64
00
45,9
01,6
8445
,901
,684
Res
tric
ted
N
eed
s F
or
Jan
. 20
18
Dis
trib
uti
on
RE
ST
RIC
TE
D N
EE
DS
(P
HA
SE
IN)
for
2018
Ban
dwid
th is
- 5
.00%
and
+ 1
0.00
% fr
om th
e S
tate
wid
e A
vera
ge P
erce
nt o
f Cha
nge.
Sta
te A
vera
ge P
erce
nt o
f Cha
nge
is 2
.29%
. T
here
fore
the
curr
ent U
nadj
uste
d N
eeds
fo
r ea
ch c
ity m
ust h
ave
a P
erce
ntag
e C
hang
e at
leas
t -2
.71%
, but
not
mor
e th
an 1
2.29
% fr
om th
e R
estr
icte
d N
eeds
from
Jan
uary
201
6. O
ther
wis
e th
e re
stric
tion
is a
pplie
d.
Un
adju
sted
C
on
stru
ctio
n
Nee
ds
for
Jan
. 20
18 D
istr
ibu
tio
n
Per
cen
t o
f C
han
ge
fro
m J
an.
2017
to
Oct
. 20
18
Lo
wer
R
estr
icti
on
(-2.
71%
)
Up
per
R
estr
icti
on
(+
12.2
9%)
No
Res
tric
tio
n
Res
tric
ted
Nee
ds
for
Jan
. 201
7 D
istr
ibu
tio
n
35

Res
tric
ted
N
eed
s F
or
Jan
. 20
18
Dis
trib
uti
on
Un
adju
sted
C
on
stru
ctio
n
Nee
ds
for
Jan
. 20
18 D
istr
ibu
tio
n
Per
cen
t o
f C
han
ge
fro
m J
an.
2017
to
Oct
. 20
18
Lo
wer
R
estr
icti
on
(-2.
71%
)
Up
per
R
estr
icti
on
(+
12.2
9%)
No
Res
tric
tio
n
Res
tric
ted
Nee
ds
for
Jan
. 201
7 D
istr
ibu
tio
nC
hask
a$3
9,29
4,34
8$4
0,13
6,29
32.
14$0
$0$4
0,13
6,29
3$4
0,13
6,29
3C
hisa
go C
ity11
,901
,759
13,0
12,3
169.
330
013
,012
,316
13,0
12,3
16C
hish
olm
14,3
17,4
7313
,256
,328
(7.4
1)13
,929
,469
00
13,9
29,4
69C
ircle
Pin
es5,
413,
158
5,64
5,26
34.
290
05,
645,
263
5,64
5,26
3C
loqu
et35
,601
,610
37,4
45,8
715.
180
037
,445
,871
37,4
45,8
71C
olum
bia
Hei
ghts
23
,621
,459
21,7
88,4
80(7
.76)
22,9
81,3
170
022
,981
,317
Coo
n R
apid
s92
,826
,714
94,6
81,7
392.
000
094
,681
,739
94,6
81,7
39C
orco
ran
20,6
82,4
4019
,451
,163
(5.9
5)20
,121
,945
00
20,1
21,9
45C
otta
ge G
rove
63,6
83,1
1366
,255
,184
4.04
00
66,2
55,1
8466
,255
,184
Cro
okst
on30
,520
,057
24,0
63,0
95(2
1.16
)29
,692
,963
00
29,6
92,9
63C
ryst
al26
,987
,842
28,8
87,1
077.
040
028
,887
,107
28,8
87,1
07D
ayto
n12
,472
,812
14,4
01,0
4615
.46
014
,005
,720
014
,005
,720
Del
ano
13,5
35,4
4410
,434
,575
(22.
91)
13,1
68,6
330
013
,168
,633
Det
roit
Lake
s39
,271
,722
43,7
88,6
0311
.50
00
43,7
88,6
0343
,788
,603
Dul
uth
280,
735,
927
246,
536,
766
(12.
18)
273,
127,
983
00
273,
127,
983
Eag
an11
1,08
7,46
410
3,84
3,88
0(6
.52)
108,
076,
993
00
108,
076,
993
Eas
t Bet
hel
42,0
64,1
2237
,004
,922
(12.
03)
40,9
24,1
840
040
,924
,184
Eas
t Gra
nd F
orks
37,5
70,3
6536
,329
,527
(3.3
0)36
,552
,208
00
36,5
52,2
08E
den
Pra
irie
104,
633,
102
107,
913,
860
3.14
00
107,
913,
860
107,
913,
860
Edi
na89
,283
,910
93,8
55,2
545.
120
093
,855
,254
93,8
55,2
54E
lk R
iver
71
,480
,110
73,6
70,1
713.
060
073
,670
,171
73,6
70,1
71F
airm
ont
37,0
53,7
6638
,102
,674
2.83
00
38,1
02,6
7438
,102
,674
Fal
con
Hei
ghts
5,18
0,04
65,
398,
624
4.22
00
5,39
8,62
45,
398,
624
Far
ibau
lt52
,570
,907
52,1
71,3
32(0
.76)
00
52,1
71,3
3252
,171
,332
Far
min
gton
29,9
37,7
7728
,965
,972
(3.2
5)29
,126
,463
00
29,1
26,4
63F
ergu
s F
alls
57,6
43,7
1857
,612
,941
(0.0
5)0
057
,612
,941
57,6
12,9
41F
ores
t Lak
e61
,966
,433
54,6
85,6
19(1
1.75
)60
,287
,143
00
60,2
87,1
43F
ridle
y38
,831
,511
39,5
93,4
901.
960
039
,593
,490
39,5
93,4
90G
lenc
oe13
,552
,406
13,5
61,6
950.
070
013
,561
,695
13,5
61,6
95G
olde
n V
alle
y47
,118
,074
48,6
16,7
553.
180
048
,616
,755
48,6
16,7
55G
rand
Rap
ids
55,3
44,8
4845
,446
,866
(17.
88)
53,8
45,0
030
053
,845
,003
Ham
Lak
e43
,646
,780
45,4
47,0
754.
120
045
,447
,075
45,4
47,0
75H
astin
gs
26,9
86,8
5944
,193
,189
63.7
60
30,3
03,5
440
30,3
03,5
44
36

Res
tric
ted
N
eed
s F
or
Jan
. 20
18
Dis
trib
uti
on
Un
adju
sted
C
on
stru
ctio
n
Nee
ds
for
Jan
. 20
18 D
istr
ibu
tio
n
Per
cen
t o
f C
han
ge
fro
m J
an.
2017
to
Oct
. 20
18
Lo
wer
R
estr
icti
on
(-2.
71%
)
Up
per
R
estr
icti
on
(+
12.2
9%)
No
Res
tric
tio
n
Res
tric
ted
Nee
ds
for
Jan
. 201
7 D
istr
ibu
tio
nH
erm
anto
wn
$34,
110,
262
$33,
535,
750
(1.6
8)$0
$0$3
3,53
5,75
0$3
3,53
5,75
0H
ibbi
ng79
,357
,974
82,7
17,9
944.
230
082
,717
,994
82,7
17,9
94H
opki
ns
21,3
31,2
7922
,031
,057
3.28
00
22,0
31,0
5722
,031
,057
Hug
o31
,276
,879
32,6
10,6
484.
260
032
,610
,648
32,6
10,6
48H
utch
inso
n35
,635
,423
40,8
49,9
7314
.63
040
,015
,016
040
,015
,016
Inte
rnat
iona
l Fal
ls11
,254
,244
11,6
60,7
473.
610
011
,660
,747
11,6
60,7
47In
ver
Gro
ve H
eigh
ts61
,974
,530
57,8
80,4
97(6
.61)
60,2
95,0
210
060
,295
,021
Isan
ti9,
575,
800
9,90
5,09
93.
440
09,
905,
099
9,90
5,09
9Jo
rdan
11,7
71,6
2410
,345
,089
(12.
12)
11,4
52,6
130
011
,452
,613
Kas
son
10,0
79,3
0310
,296
,471
2.15
00
10,2
96,4
7110
,296
,471
La C
resc
ent
9,24
2,95
78,
334,
112
(9.8
3)8,
992,
472
00
8,99
2,47
2La
ke C
ity11
,872
,457
12,3
80,8
674.
280
012
,380
,867
12,3
80,8
67La
ke E
lmo
25,5
01,4
4328
,952
,643
13.5
30
28,6
35,5
700
28,6
35,5
70La
kevi
lle11
5,13
1,47
812
6,42
3,21
99.
810
012
6,42
3,21
912
6,42
3,21
9Li
no L
akes
42,8
67,9
6634
,417
,908
(19.
71)
41,7
06,2
440
041
,706
,244
Litc
hfie
ld16
,350
,013
13,4
70,4
57(1
7.61
)15
,906
,928
00
15,9
06,9
28Li
ttle
Can
ada
18,7
91,1
9519
,567
,624
4.13
00
19,5
67,6
2419
,567
,624
Littl
e F
alls
33,0
78,3
6134
,488
,061
4.26
00
34,4
88,0
6134
,488
,061
Mah
tom
edi
11,6
85,1
5914
,699
,256
25.7
90
13,1
21,2
650
13,1
21,2
65M
anka
to88
,991
,834
92,0
25,4
653.
410
092
,025
,465
92,0
25,4
65M
aple
Gro
ve11
4,98
3,95
811
7,30
8,25
62.
020
011
7,30
8,25
611
7,30
8,25
6M
aple
woo
d 69
,055
,301
69,2
50,1
250.
280
069
,250
,125
69,2
50,1
25M
arsh
all
34,5
25,0
4535
,318
,979
2.30
00
35,3
18,9
7935
,318
,979
Med
ina
13,0
49,9
2817
,665
,582
35.3
70
14,6
53,7
640
14,6
53,7
64M
endo
ta H
eigh
ts25
,421
,627
25,6
72,1
850.
990
025
,672
,185
25,6
72,1
85M
inne
apol
is
575,
257,
853
568,
805,
116
(1.1
2)0
056
8,80
5,11
656
8,80
5,11
6M
inne
tonk
a94
,827
,062
96,7
91,2
862.
070
096
,791
,286
96,7
91,2
86M
inne
tris
ta21
,271
,130
16,2
79,0
25(2
3.47
)20
,694
,682
00
20,6
94,6
82M
onte
vide
o13
,554
,888
14,1
52,7
654.
410
014
,152
,765
14,1
52,7
65M
ontic
ello
20,7
02,6
9623
,045
,948
11.3
20
023
,045
,948
23,0
45,9
48M
oorh
ead
123,
018,
800
120,
647,
905
(1.9
3)0
012
0,64
7,90
512
0,64
7,90
5M
orris
14,2
01,5
9014
,818
,340
4.34
00
14,8
18,3
4014
,818
,340
Mou
nd15
,892
,672
12,7
13,3
72(2
0.00
)15
,461
,980
00
15,4
61,9
80
37

Res
tric
ted
N
eed
s F
or
Jan
. 20
18
Dis
trib
uti
on
Un
adju
sted
C
on
stru
ctio
n
Nee
ds
for
Jan
. 20
18 D
istr
ibu
tio
n
Per
cen
t o
f C
han
ge
fro
m J
an.
2017
to
Oct
. 20
18
Lo
wer
R
estr
icti
on
(-2.
71%
)
Up
per
R
estr
icti
on
(+
12.2
9%)
No
Res
tric
tio
n
Res
tric
ted
Nee
ds
for
Jan
. 201
7 D
istr
ibu
tio
nM
ound
s V
iew
$16,
540,
887
$17,
254,
956
4.32
$0$0
$17,
254,
956
$17,
254,
956
New
Brig
hton
25,6
42,9
7224
,892
,993
(2.9
2)24
,948
,048
00
24,9
48,0
48N
ew H
ope
24,7
40,6
6925
,802
,589
4.29
00
25,8
02,5
8925
,802
,589
New
Pra
gue
10,6
85,6
7611
,318
,220
5.92
00
11,3
18,2
2011
,318
,220
New
Ulm
35,1
15,7
1832
,031
,617
(8.7
8)34
,164
,082
00
34,1
64,0
82N
orth
Bra
nch
46,3
31,0
9039
,565
,542
(14.
60)
45,0
75,5
180
045
,075
,518
Nor
th M
anka
to30
,274
,962
31,5
72,9
814.
290
031
,572
,981
31,5
72,9
81N
orth
St.
Pau
l20
,163
,158
18,8
94,5
36(6
.29)
19,6
16,7
370
019
,616
,737
Nor
thfie
ld30
,286
,596
30,7
38,4
171.
490
030
,738
,417
30,7
38,4
17O
ak G
rove
37,2
23,9
5236
,345
,317
(2.3
6)0
036
,345
,317
36,3
45,3
17O
akda
le25
,850
,381
39,5
41,3
5752
.96
029
,027
,393
029
,027
,393
Oro
no15
,853
,168
17,4
14,9
719.
850
017
,414
,971
17,4
14,9
71O
tseg
o37
,103
,424
37,4
33,7
570.
890
037
,433
,757
37,4
33,7
57O
wat
onna
65,9
99,1
6667
,811
,102
2.75
00
67,8
11,1
0267
,811
,102
Ply
mou
th13
0,07
2,20
814
0,60
1,39
18.
090
014
0,60
1,39
114
0,60
1,39
1P
rior
Lake
33,5
38,4
5734
,930
,729
4.15
00
34,9
30,7
2934
,930
,729
Ram
sey
53,8
35,7
2855
,801
,555
3.65
00
55,8
01,5
5555
,801
,555
Red
Win
g46
,336
,378
47,4
92,3
612.
490
047
,492
,361
47,4
92,3
61R
edw
ood
Fal
ls15
,591
,921
15,9
31,5
092.
180
015
,931
,509
15,9
31,5
09R
ichf
ield
50,8
52,1
5653
,012
,754
4.25
00
53,0
12,7
5453
,012
,754
Rob
bins
dale
18,4
25,7
0818
,895
,108
2.55
00
18,8
95,1
0818
,895
,108
Roc
hest
er
250,
746,
821
271,
150,
298
8.14
00
271,
150,
298
271,
150,
298
Rog
ers
37,5
30,7
0239
,157
,930
4.34
00
39,1
57,9
3039
,157
,930
Ros
emou
nt49
,723
,426
48,5
22,6
08(2
.41)
00
48,5
22,6
0848
,522
,608
Ros
evill
e49
,110
,901
52,1
86,2
436.
260
052
,186
,243
52,1
86,2
43S
arte
ll34
,783
,329
36,1
36,8
673.
890
036
,136
,867
36,1
36,8
67S
auk
Rap
ids
30,1
93,7
4031
,888
,289
5.61
00
31,8
88,2
8931
,888
,289
Sav
age
44,9
24,6
2349
,502
,903
10.1
90
049
,502
,903
49,5
02,9
03S
hako
pee
64,0
70,6
3973
,573
,097
14.8
30
71,9
44,9
210
71,9
44,9
21S
hore
view
32,4
41,8
0633
,844
,374
4.32
00
33,8
44,3
7433
,844
,374
Sho
rew
ood
15,2
47,8
8015
,913
,983
4.37
00
15,9
13,9
8315
,913
,983
Sou
th S
t. P
aul
29,2
38,8
7630
,368
,536
3.86
00
30,3
68,5
3630
,368
,536
Spr
ing
Lake
Par
k8,
078,
874
10,4
92,6
5729
.88
09,
071,
767
09,
071,
767
38

Res
tric
ted
N
eed
s F
or
Jan
. 20
18
Dis
trib
uti
on
Un
adju
sted
C
on
stru
ctio
n
Nee
ds
for
Jan
. 20
18 D
istr
ibu
tio
n
Per
cen
t o
f C
han
ge
fro
m J
an.
2017
to
Oct
. 20
18
Lo
wer
R
estr
icti
on
(-2.
71%
)
Up
per
R
estr
icti
on
(+
12.2
9%)
No
Res
tric
tio
n
Res
tric
ted
Nee
ds
for
Jan
. 201
7 D
istr
ibu
tio
nS
t. A
ntho
ny$1
2,60
0,52
7$1
2,80
5,48
81.
63$0
$0$1
2,80
5,48
8$1
2,80
5,48
8S
t. C
loud
143,
188,
238
149,
100,
630
4.13
00
149,
100,
630
149,
100,
630
St.
Fra
ncis
25,5
43,2
0520
,295
,087
(20.
55)
24,8
50,9
840
024
,850
,984
St.
Jose
ph4,
141,
687
10,5
48,2
3515
4.68
04,
650,
701
04,
650,
701
St.
Loui
s P
ark
73,8
61,6
9176
,493
,541
3.56
00
76,4
93,5
4176
,493
,541
St.
Mic
hael
48,1
58,8
6636
,386
,940
(24.
44)
46,8
53,7
600
046
,853
,760
St.
Pau
l46
2,68
5,92
145
0,89
2,77
5(2
.55)
00
450,
892,
775
450,
892,
775
St.
Pau
l Par
k10
,689
,364
11,3
51,2
976.
190
011
,351
,297
11,3
51,2
97S
t. P
eter
28,3
51,6
5025
,858
,949
(8.7
9)27
,583
,321
00
27,5
83,3
21S
tew
artv
ille
6,56
4,63
36,
845,
140
4.27
00
6,84
5,14
06,
845,
140
Stil
lwat
er31
,733
,856
33,0
65,9
364.
200
033
,065
,936
33,0
65,9
36T
hief
Riv
er F
alls
40,5
90,5
7331
,362
,700
(22.
73)
39,4
90,5
690
039
,490
,569
Vad
nais
Hei
ghts
14,8
18,4
5015
,963
,859
7.73
00
15,9
63,8
5915
,963
,859
Vic
toria
10,4
14,0
6513
,305
,619
27.7
70
11,6
93,9
530
11,6
93,9
53V
irgin
ia29
,019
,504
30,9
91,7
836.
800
030
,991
,783
30,9
91,7
83W
acon
ia21
,011
,426
26,1
17,0
5724
.30
023
,593
,730
023
,593
,730
Wai
te P
ark
11,6
24,8
3714
,999
,023
29.0
30
13,0
53,5
300
13,0
53,5
30W
asec
a12
,770
,524
12,9
40,4
941.
330
012
,940
,494
12,9
40,4
94W
est S
t. P
aul
22,5
43,1
6925
,608
,106
13.6
00
25,3
13,7
250
25,3
13,7
25W
hite
Bea
r La
ke30
,912
,499
36,8
34,3
2419
.16
034
,711
,645
034
,711
,645
Will
mar
58,3
07,6
8158
,183
,047
(0.2
1)0
058
,183
,047
58,1
83,0
47W
inon
a46
,276
,872
47,8
65,2
393.
430
047
,865
,239
47,8
65,2
39W
oodb
ury
120,
679,
687
125,
065,
235
3.63
00
125,
065,
235
125,
065,
235
Wor
thin
gton
20,3
82,7
9921
,083
,004
3.44
00
21,0
83,0
0421
,083
,004
Wyo
min
g23
,911
,049
24,9
33,7
994.
280
024
,933
,799
24,9
33,7
99Z
imm
erm
an9,
098,
609
8,60
5,48
4(5
.42)
8,85
2,03
70
08,
852,
037
To
tal
$7,3
04,8
13,8
70$7
,472
,087
,601
2.29
%$1
,179
,970
,973
$619
,658
,691
$5,6
85,0
79,2
13$7
,484
,708
,876
2920
99no
te:
was
6,3
40,7
05,6
48 in
Jan
15 b
ook
167,
273,
731
4.98
7,48
4,70
8,87
6no
te:
was
6,3
40,7
05,6
48 in
Jan
15 b
ook
04.
977,
472,
087,
601
MS
AS
\Boo
ks\2
017
Oct
ober
Boo
k\T
ent A
djus
ted
Con
stru
ctio
n N
eeds
201
7 (O
ld B
ook
File
A&
B)(
Pha
seIn
Cal
cs).
xls
39
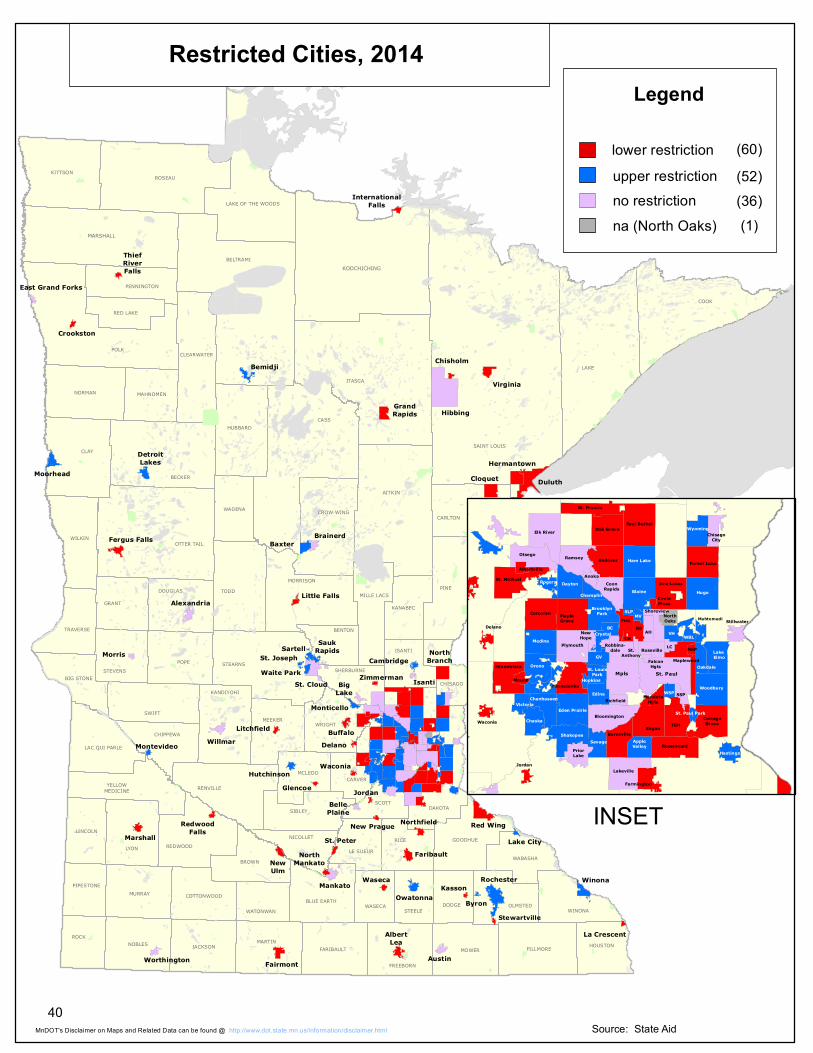
KOOCHICHING
MARSHALL
Stewartville
SAINT LOUIS
LAKE
CASS
ITASCA
POLK
BELTRAMI
PINE
AITKIN
COOK
CLAY
ROSEAU
OTTER TAIL
BECKER
TODD
STEARNS
LYON
POPE
KITTSON
SWIFT
RICE
MORRISON
RENVILLE
HUBBARD
WILKIN
NORMAN
CARLTON
MARTINMOWER
CROW WING
NOBLES
MURRAY
FILLMORE
ROCK
WRIGHT
SIBLEY
GRANT
REDWOOD
LAKE OF THE WOODS
BROWN
MEEKER
JACKSON
CLEARWATER
GOODHUE
KANDIYOHI
WINONA
DOUGLAS
DAKOTA
OLMSTED
FREEBORN
FARIBAULT
ISANTI
STEVENS
LINCOLN
BLUE EARTH
WADENA
MCLEOD
DODGESTEELE
MILLE LACS
HOUSTON
TRAVERSE
KANABEC
SCOTT
CHIPPEWA
WABASHA
LAC QUI PARLE
WASECA
BENTON
MAHNOMEN
LE SUEUR
BIG STONE
NICOLLET
CHISAGO
CARVER
PENNINGTON
COTTONWOOD
RED LAKE
PIPESTONE
YELLOWMEDICINE
SHERBURNE
WATONWAN
Hibbing
Duluth
Rochester
Cloquet
Red Wing
St. Cloud
Winona
Baxter
Hermantown
Virginia
NorthBranch
Moorhead
Mankato
Fairmont Austin
Willmar
GrandRapids
Bemidji
Faribault
Alexandria
AlbertLea
Owatonna
Brainerd
Buffalo
Fergus Falls
Sartell
Marshall
DetroitLakes
NewUlm
BigLake
Monticello
Isanti
Morris
Little Falls
Waite Park
Northfield
Worthington
Waseca
St. Peter
Cambridge
Delano
Litchfield
BellePlaine
Chisholm
SaukRapids
Crookston
Byron
Jordan
Montevideo
Kasson
NorthMankato
St. Joseph
RedwoodFalls
InternationalFalls
East Grand Forks
ThiefRiverFalls
Zimmerman
La Crescent
Waconia
New Prague
Hutchinson
Lake City
Glencoe
Lino Lakes
Mahtomedi
St. Paul
HugoBlaine
Eagan
Elk River
MplsOrono
Otsego
Lakeville
East Bethel
Andover
Corcoran
Medina
Ramsey
Plymouth
Ham Lake
Dayton
Woodbury
Oak Grove
St. Michael
Rosemount
Forest Lake
Bloomington
Shakopee
Eden Prairie
Edina
MapleGrove
Minnetrista
Burnsville
CottageGroveChaska
Minnetonka
Lake Elmo
Savage
St. Francis
Wyoming
Chanhassen
CoonRapids
BrooklynPark
PriorLake
Becker
Frid.
MaplewoodRoseville
Buffalo
AppleValley
Oakdale
Farmington
Hastings
Victoria
Shoreview
RogersAnoka
Champlin
Stillwater
Richfield
St. LouisPark
GV
NorthOaks
Mound
MendotaHgts
Hopkins
IGH
ChisagoCity
AHCrystalDelano
Waconia
WBLBC NB
VHNewHope
Jordan
Albertville
SSPWSP
LC
MV
St. Paul Park
Robbins-dale NSP
CH
St.Anthony
CirclePines
FalconHgts
SLP
Norwood Young America
INSET
Legend
lower restrictionupper restrictionno restriction
Source: State Aidhttp://www.dot.state.mn.us/information/disclaimer.htmlMnDOT's Disclaimer on Maps and Related Data can be found @
Restricted Cities, 2014
na (North Oaks)
(60)(52)(36)(1)
40

KOOCHICHING
MARSHALL
Stewartville
SAINT LOUIS
LAKE
CASS
ITASCA
POLK
BELTRAMI
PINE
AITKIN
COOK
CLAY
ROSEAU
OTTER TAIL
BECKER
TODD
STEARNS
LYON
POPE
KITTSON
SWIFT
RICE
MORRISON
RENVILLE
HUBBARD
WILKIN
NORMAN
CARLTON
MARTINMOWER
CROW WING
NOBLES
MURRAY
FILLMORE
ROCK
WRIGHT
SIBLEY
GRANT
REDWOOD
LAKE OF THE WOODS
BROWN
MEEKER
JACKSON
CLEARWATER
GOODHUE
KANDIYOHI
WINONA
DOUGLAS
DAKOTA
OLMSTED
FREEBORN
FARIBAULT
ISANTI
STEVENS
LINCOLN
BLUE EARTH
WADENA
MCLEOD
DODGESTEELE
MILLE LACS
HOUSTON
TRAVERSE
KANABEC
SCOTT
CHIPPEWA
WABASHA
LAC QUI PARLE
WASECA
BENTON
MAHNOMEN
LE SUEUR
BIG STONE
NICOLLET
CHISAGO
CARVER
PENNINGTON
COTTONWOOD
RED LAKE
PIPESTONE
YELLOWMEDICINE
SHERBURNE
WATONWAN
Hibbing
Duluth
Rochester
Cloquet
Red Wing
St. Cloud
Winona
Baxter
Hermantown
Virginia
NorthBranch
Moorhead
Mankato
Fairmont Austin
Willmar
GrandRapids
Bemidji
Faribault
Alexandria
AlbertLea
Owatonna
Brainerd
Buffalo
Fergus Falls
Sartell
Marshall
DetroitLakes
NewUlm
BigLake
Monticello
Isanti
Morris
Little Falls
Waite Park
Northfield
Worthington
Waseca
St. Peter
Cambridge
Delano
Litchfield
BellePlaine
Chisholm
SaukRapids
Crookston
Byron
Jordan
Montevideo
Kasson
NorthMankato
St. Joseph
RedwoodFalls
InternationalFalls
East Grand Forks
ThiefRiverFalls
Zimmerman
La Crescent
Waconia
New Prague
Hutchinson
Lake City
Glencoe
Lino Lakes
Mahtomedi
St. Paul
HugoBlaine
Eagan
Elk River
MplsOrono
Otsego
Lakeville
East Bethel
Andover
Corcoran
Medina
Ramsey
Plymouth
Ham Lake
Dayton
Woodbury
Oak Grove
St. Michael
Rosemount
Forest Lake
Bloomington
Shakopee
Eden Prairie
Edina
MapleGrove
Minnetrista
Burnsville
CottageGroveChaska
Minnetonka
Lake Elmo
Savage
St. Francis
Wyoming
Chanhassen
CoonRapids
BrooklynPark
PriorLake
Becker
Frid.
MaplewoodRoseville
Buffalo
AppleValley
Oakdale
Farmington
Hastings
Victoria
Shoreview
RogersAnoka
Champlin
Stillwater
Richfield
St. LouisPark
GV
NorthOaks
Mound
MendotaHgts
Hopkins
IGH
ChisagoCity
AHCrystalDelano
Waconia
WBLBC NB
VHNewHope
Jordan
Albertville
SSPWSP
LC
MV
St. Paul Park
Robbins-dale NSP
CH
St.Anthony
CirclePines
FalconHgts
SLP
Norwood Young America
INSET
Legend
lower restrictionupper restrictionno restriction
Source: State Aidhttp://www.dot.state.mn.us/information/disclaimer.htmlMnDOT's Disclaimer on Maps and Related Data can be found @
Restricted Cities, 2015
na (North Oaks)
(49)(39)(60)(1)
41

KOOCHICHING
MARSHALL
Stewartville
SAINT LOUIS
LAKE
CASS
ITASCA
POLK
BELTRAMI
PINE
AITKIN
COOK
CLAY
ROSEAU
OTTER TAIL
BECKER
TODD
STEARNS
LYON
POPE
KITTSON
SWIFT
RICE
MORRISON
RENVILLE
HUBBARD
WILKIN
NORMAN
CARLTON
MARTINMOWER
CROW WING
NOBLES
MURRAY
FILLMORE
ROCK
WRIGHT
SIBLEY
GRANT
REDWOOD
LAKE OF THE WOODS
BROWN
MEEKER
JACKSON
CLEARWATER
GOODHUE
KANDIYOHI
WINONA
DOUGLAS
DAKOTA
OLMSTED
FREEBORN
FARIBAULT
ISANTI
STEVENS
LINCOLN
BLUE EARTH
WADENA
MCLEOD
DODGESTEELE
MILLE LACS
HOUSTON
TRAVERSE
KANABEC
SCOTT
CHIPPEWA
WABASHA
LAC QUI PARLE
WASECA
BENTON
MAHNOMEN
LE SUEUR
BIG STONE
NICOLLET
CHISAGO
CARVER
PENNINGTON
COTTONWOOD
RED LAKE
PIPESTONE
YELLOWMEDICINE
SHERBURNE
WATONWAN
Hibbing
Duluth
Rochester
Cloquet
Red Wing
St. Cloud
Winona
Baxter
Hermantown
Virginia
NorthBranch
Moorhead
Mankato
Fairmont Austin
Willmar
GrandRapids
Bemidji
Faribault
Alexandria
AlbertLea
Owatonna
Brainerd
Buffalo
Fergus Falls
Sartell
Marshall
DetroitLakes
NewUlm
BigLake
Monticello
Isanti
Morris
Little Falls
Waite Park
Northfield
Worthington
Waseca
St. Peter
Cambridge
Delano
Litchfield
BellePlaine
Chisholm
SaukRapids
Crookston
Byron
Jordan
Montevideo
Kasson
NorthMankato
St. Joseph
RedwoodFalls
InternationalFalls
East Grand Forks
ThiefRiverFalls
Zimmerman
La Crescent
Waconia
New Prague
Hutchinson
Lake City
Glencoe
Lino Lakes
Mahtomedi
St. Paul
HugoBlaine
Eagan
Elk River
MplsOrono
Otsego
Lakeville
East Bethel
Andover
Corcoran
Medina
Ramsey
Plymouth
Ham Lake
Dayton
Woodbury
Oak Grove
St. Michael
Rosemount
Forest Lake
Bloomington
Shakopee
Eden Prairie
Edina
MapleGrove
Minnetrista
Burnsville
CottageGroveChaska
Minnetonka
Lake Elmo
Savage
St. Francis
Wyoming
Chanhassen
CoonRapids
BrooklynPark
PriorLake
Becker
Frid.
MaplewoodRoseville
Buffalo
AppleValley
Oakdale
Farmington
Hastings
Victoria
Shoreview
RogersAnoka
Champlin
Stillwater
Richfield
St. LouisPark
GV
NorthOaks
Mound
MendotaHgts
Hopkins
IGH
ChisagoCity
AHCrystalDelano
Waconia
WBLBC NB
VHNewHope
Jordan
Albertville
SSPWSP
LC
MV
St. Paul Park
Robbins-dale NSP
CH
St.Anthony
CirclePines
FalconHgts
SLP
Norwood Young America
INSET
Legend
lower restrictionupper restrictionno restriction
Source: State Aidhttp://www.dot.state.mn.us/information/disclaimer.htmlMnDOT's Disclaimer on Maps and Related Data can be found @
Restricted Cities, 2016
na (North Oaks)
(41)(29)(78)(1)
42

KOOCHICHING
MARSHALL
Stewartville
SAINT LOUIS
LAKE
CASS
ITASCA
POLK
BELTRAMI
PINE
AITKIN
COOK
CLAY
ROSEAU
OTTER TAIL
BECKER
TODD
STEARNS
LYON
POPE
KITTSON
SWIFT
RICE
MORRISON
RENVILLE
HUBBARD
WILKIN
NORMAN
CARLTON
MARTINMOWER
CROW WING
NOBLES
MURRAY
FILLMORE
ROCK
WRIGHT
SIBLEY
GRANT
REDWOOD
LAKE OF THE WOODS
BROWN
MEEKER
JACKSON
CLEARWATER
GOODHUE
KANDIYOHI
WINONA
DOUGLAS
DAKOTA
OLMSTED
FREEBORN
FARIBAULT
ISANTI
STEVENS
LINCOLN
BLUE EARTH
WADENA
MCLEOD
DODGESTEELE
MILLE LACS
HOUSTON
TRAVERSE
KANABEC
SCOTT
CHIPPEWA
WABASHA
LAC QUI PARLE
WASECA
BENTON
MAHNOMEN
LE SUEUR
BIG STONE
NICOLLET
CHISAGO
CARVER
PENNINGTON
COTTONWOOD
RED LAKE
PIPESTONE
YELLOWMEDICINE
SHERBURNE
WATONWAN
Hibbing
Duluth
Rochester
Cloquet
Red Wing
St. Cloud
Winona
Baxter
Hermantown
Virginia
NorthBranch
Moorhead
Mankato
Fairmont Austin
Willmar
GrandRapids
Bemidji
Faribault
Alexandria
AlbertLea
Owatonna
Brainerd
Buffalo
Fergus Falls
Sartell
Marshall
DetroitLakes
NewUlm
BigLake
Monticello
Isanti
Morris
Little Falls
Waite Park
Northfield
Worthington
Waseca
St. Peter
Cambridge
Delano
Litchfield
BellePlaine
Chisholm
SaukRapids
Crookston
Byron
Jordan
Montevideo
Kasson
NorthMankato
St. Joseph
RedwoodFalls
InternationalFalls
East Grand Forks
ThiefRiverFalls
Zimmerman
La Crescent
Waconia
New Prague
Hutchinson
Lake City
Glencoe
Lino Lakes
Mahtomedi
St. Paul
HugoBlaine
Eagan
Elk River
MplsOrono
Otsego
Lakeville
East Bethel
Andover
Corcoran
Medina
Ramsey
Plymouth
Ham Lake
Dayton
Woodbury
Oak Grove
St. Michael
Rosemount
Forest Lake
Bloomington
Shakopee
Eden Prairie
Edina
MapleGrove
Minnetrista
Burnsville
CottageGroveChaska
Minnetonka
Lake Elmo
Savage
St. Francis
Wyoming
Chanhassen
CoonRapids
BrooklynPark
PriorLake
Becker
Frid.
MaplewoodRoseville
Buffalo
AppleValley
Oakdale
Farmington
Hastings
Victoria
Shoreview
RogersAnoka
Champlin
Stillwater
Richfield
St. LouisPark
GV
NorthOaks
Mound
MendotaHgts
Hopkins
IGH
ChisagoCity
AHCrystal
Delano
Waconia
WBLBC NB
VHNewHope
Jordan
Albertville
SSPWSP
LC
MV
St. Paul Park
Robbins-dale NSP
CH
St.Anthony
CirclePines
FalconHgts
SLP
Norwood Young America
INSET
Legend
lower restrictionupper restrictionno restriction
Source: State Aidhttp://www.dot.state.mn.us/information/disclaimer.htmlMnDOT's Disclaimer on Maps and Related Data can be found @
Restricted Cities, 2017
na (North Oaks)
(29)(20)(99)(1)
43

Adjustments to the Restricted Construction
Needs
44
N:MSAS\Books\2017October Book\Excess to Low Balance Explanation.docx
EXCESS UNENCUMBERED CONSTRUCTION FUND BALANCE ADJUSTMENT
Screening Board Resolution states:
That the December 31 construction fund balance will be compared to the annual construction allotment from January of the same year. If the December 31 construction fund balance exceeds 3 times the January construction allotment and $1,500,000, the first year adjustment to the Needs will be 1 times the December 31 construction fund balance. In each consecutive year the December 31 construction fund balance exceeds 3 times the January construction allotment and $1,500,000, the adjustment to the Needs will be increased to 2, 3, 4, etc. times the December 31 construction fund balance until such time the Construction Needs are reduced to zero. If the December 31 construction fund balance drops below 3 times the January construction allotment and subsequently increases to over 3 times, the multipliers shall start over with one.
LOW BALANCE INCENTIVE
Screening Board Resolution states:
That the amount of the Excess Unencumbered Construction Fund Balance Adjustment shall be redistributed to the Construction Needs of all municipalities whose December 31 construction fund balance is less than one times their January construction allotment of the same year. This redistribution shall be based on a city’s prorated share of its Unadjusted Construction Needs to the total Unadjusted Construction Needs of all participating cities times the total Excess Balance Adjustment.
The August 15, 2017 balance is used for this estimate. The final adjustment will be made using the December 31, 2017 construction fund balances.
45

N:\M
SA
S\B
OO
KS
\201
5 O
CT
OB
ER
BO
OK
\TE
NA
TIV
E A
DJU
ST
ED
CO
NS
TR
UC
TIO
N N
EE
DS
201
5 (O
LD B
OO
K F
ILE
A &
B).
XLS
X
as o
f 8/
15/2
017
Alb
ert L
ea$7
07,7
32$1
,766
,986
2.49
7
Alb
ertv
ille
308,
337
623,
230
2.02
1
Ale
xand
ria75
0,88
6(1
,561
,216
)(2
.079
)$6
2,23
2,76
00.
0166
$474
,194
And
over
1,11
7,54
2(8
17,7
65)
(0.7
32)
65,1
20,7
780.
0173
496,
200
Ano
ka56
3,98
0(7
57,3
22)
(1.3
43)
30,3
69,7
880.
0081
231,
408
App
le V
alle
y1,
507,
779
2,37
2,10
71.
573
Ard
en H
ills
264,
124
(318
,240
)(1
.205
)11
,730
,603
0.00
3189
,384
Aus
tin1,
210,
322
2,35
6,58
61.
947
Bax
ter
404,
682
914,
917
2.26
1
Bel
le P
lain
e28
5,85
90
0.00
015
,824
,483
0.00
4212
0,57
8
Bem
idji
548,
068
289,
817
0.52
937
,168
,320
0.00
9928
3,21
1
Big
Lak
e29
3,02
6(6
2,36
6)(0
.213
)17
,456
,205
0.00
4613
3,01
1
Bla
ine
1,77
6,96
73,
311,
822
1.86
4
Blo
omin
gton
2,63
1,50
98,
147,
330
3.09
620
181
(8,1
47,3
30)
Bra
iner
d74
4,29
5(1
,079
,049
)(1
.450
)
38
,298
,195
0.01
0229
1,82
0
Bro
okly
n C
ente
r88
1,77
010
1,22
40.
115
33,7
62,1
670.
0090
257,
257
Bro
okly
n P
ark
2,09
9,67
863
4,84
70.
302
99,4
92,2
580.
0265
758,
100
Buf
falo
578,
025
(853
,872
)(1
.477
)
32
,191
,670
0.00
8624
5,29
0
Bur
nsvi
lle1,
923,
412
40,7
190.
021
100,
181,
128
0.02
6776
3,34
9
Byr
on16
6,81
332
6,17
01.
955
Cam
brid
ge42
3,04
70
0.00
026
,904
,480
0.00
7220
5,00
4
Cha
mpl
in71
7,42
21,
252,
086
1.74
5
Cha
nhas
sen
783,
241
215,
135
0.27
5
45
,901
,684
0.01
2234
9,75
6
Cha
ska
774,
184
00.
000
40,1
36,2
930.
0107
305,
826
Chi
sago
City
190,
901
107,
339
0.56
213
,012
,316
0.00
3599
,150
Chi
shol
m20
9,59
054
,363
0.25
9
13
,929
,469
0.00
3710
6,13
8
Circ
le P
ines
146,
831
126,
363
0.86
15,
645,
263
0.00
1543
,015
Clo
quet
449,
104
110,
556
0.24
637
,445
,871
0.01
0028
5,32
6
Col
umbi
a H
eigh
ts54
2,53
937
5,22
60.
692
22,9
81,3
170.
0061
175,
110
Coo
n R
apid
s2,
268,
613
(3,5
34,9
66)
(1.5
58)
94,6
81,7
390.
0252
721,
445
Cor
cora
n23
6,82
11,
621,
180
6.84
620
181
(1,6
21,1
80)
Cot
tage
Gro
ve1,
503,
461
00.
000
66,2
55,1
840.
0176
504,
844
Cro
okst
on40
1,22
261
8,71
21.
542
Cry
stal
620,
356
00.
000
28,8
87,1
070.
0077
220,
111
Day
ton
194,
250
716,
082
3.68
6N
o A
djus
tmen
t / b
alan
ce u
nder
1.5
mill
ion
no c
ities
had
this
adj
ustm
ent i
n 20
15, 2
016,
or
2017
Res
tric
ted
Nee
ds
for
2018
D
istr
ibu
tio
n
Lo
w
Bal
ance
In
cen
tive
F
acto
rL
ow
Bal
ance
In
cen
tive
EX
CE
SS
BA
LA
NC
E A
DJU
ST
ME
NT
RE
DIS
TR
IBU
TE
D A
S L
OW
BA
LA
NC
E IN
CE
NT
IVE
Mu
nic
ipal
ity
Jan
uar
y 20
17
Co
nst
ruct
ion
A
llotm
ent
Un
encu
mb
ered
B
alan
ce
Ava
ilab
le
(90&
90p
acc
t)
Rat
io b
et.
Bal
ance
&
Cit
y's
2016
C
on
stru
ctio
n
Allo
tmen
t
Fir
st Y
ear
of
Exc
ess
Bal
ance
A
dju
stm
ent
Mu
ltip
lier
Exc
ess
Bal
ance
A
dju
stm
ent
46

as o
f 8/
15/2
017
Res
tric
ted
Nee
ds
for
2018
D
istr
ibu
tio
n
Lo
w
Bal
ance
In
cen
tive
F
acto
rL
ow
Bal
ance
In
cen
tive
M
un
icip
alit
y
Jan
uar
y 20
17
Co
nst
ruct
ion
A
llotm
ent
Un
encu
mb
ered
B
alan
ce
Ava
ilab
le
(90&
90p
acc
t)
Rat
io b
et.
Bal
ance
&
Cit
y's
2016
C
on
stru
ctio
n
Allo
tmen
t
Fir
st Y
ear
of
Exc
ess
Bal
ance
A
dju
stm
ent
Mu
ltip
lier
Exc
ess
Bal
ance
A
dju
stm
ent
Del
ano
$211
,373
$00.
000
$13,
168,
633
0.00
35$1
00,3
41
Det
roit
Lake
s50
0,88
5(6
78,7
03)
(1.3
55)
43,7
88,6
030.
0117
333,
655
Dul
uth
3,72
4,63
64,
830,
918
1.29
7
Eag
an2,
683,
678
(3,1
80,0
00)
(1.1
85)
108,
076,
993
0.02
8882
3,51
3
Eas
t Bet
hel
567,
365
00.
000
40,9
24,1
840.
0109
311,
829
Eas
t Gra
nd F
orks
370,
911
262,
904
0.70
936
,552
,208
0.00
9727
8,51
6
Ede
n P
rairi
e2,
141,
707
9,45
8,38
54.
416
2018
1(9
,458
,385
)
Edi
na1,
635,
943
1,34
4,38
50.
822
93,8
55,2
540.
0250
715,
148
Elk
Riv
er1,
050,
066
1,67
3,34
21.
594
Fai
rmon
t64
2,03
298
0,62
41.
527
Fal
con
Hei
ghts
117,
630
364,
678
3.10
0N
o A
djus
tmen
t / b
alan
ce u
nder
1.5
mill
ion
Far
ibau
lt86
2,14
71,
119,
187
1.29
8
Far
min
gton
639,
151
00.
000
29,1
26,4
630.
0078
221,
934
Fer
gus
Fal
ls73
9,23
71,
153,
232
1.56
0
For
est L
ake
883,
682
1,13
2,44
21.
282
Frid
ley
710,
156
521,
405
0.73
439
,593
,490
0.01
0530
1,69
0
Gle
ncoe
199,
633
380,
644
1.90
7
Gol
den
Val
ley
710,
617
2,14
6,60
03.
021
2018
1(2
,146
,600
)
Gra
nd R
apid
s62
3,36
474
0,78
81.
188
Ham
Lak
e65
4,72
039
8,46
70.
609
45,4
47,0
750.
0121
346,
292
Has
tings
617,
208
830,
175
1.34
5
Her
man
tow
n55
3,52
653
3,64
70.
964
33,5
35,7
500.
0089
255,
532
Hib
bing
903,
603
(321
,745
)(0
.356
)82
,717
,994
0.02
2063
0,28
5
Hop
kins
509,
563
(69,
555)
(0.1
36)
22,0
31,0
570.
0059
167,
870
Hug
o51
5,12
60
0.00
032
,610
,648
0.00
8724
8,48
3
Hut
chin
son
706,
119
1,88
9,46
42.
676
Inte
rnat
iona
l Fal
ls26
3,13
779
9,66
93.
039
No
Adj
ustm
ent /
bal
ance
und
er 1
.5 m
illio
n
Inve
r G
rove
Hei
ghts
1,14
0,10
52,
626,
777
2.30
4
Isan
ti17
6,20
3(2
07,5
56)
(1.1
78)
9,90
5,09
90.
0026
75,4
74
Jord
an20
6,42
3(3
36,6
98)
(1.6
31)
11,4
52,6
130.
0030
87,2
65
Kas
son
192,
556
1,11
3,71
65.
784
No
Adj
ustm
ent /
bal
ance
und
er 1
.5 m
illio
n
LaC
resc
ent
215,
196
215,
196
1.00
0
Lake
City
189,
800
(256
,809
)(1
.353
)12
,380
,867
0.00
3394
,338
Lake
Elm
o36
8,64
852
1,38
31.
414
Lake
ville
2,34
4,51
5(6
25,7
19)
(0.2
67)
126,
423,
219
0.03
3796
3,30
5
Lino
Lak
es72
3,41
30
0.00
041
,706
,244
0.01
1131
7,78
8
Litc
hfie
ld25
6,80
21,
493,
235
5.81
5N
o A
djus
tmen
t / b
alan
ce u
nder
1.5
mill
ion
Littl
e C
anad
a33
1,59
0(6
18,0
92)
(1.8
64)
19,5
67,6
240.
0052
149,
099
Littl
e F
alls
567,
801
767,
774
1.35
2
47
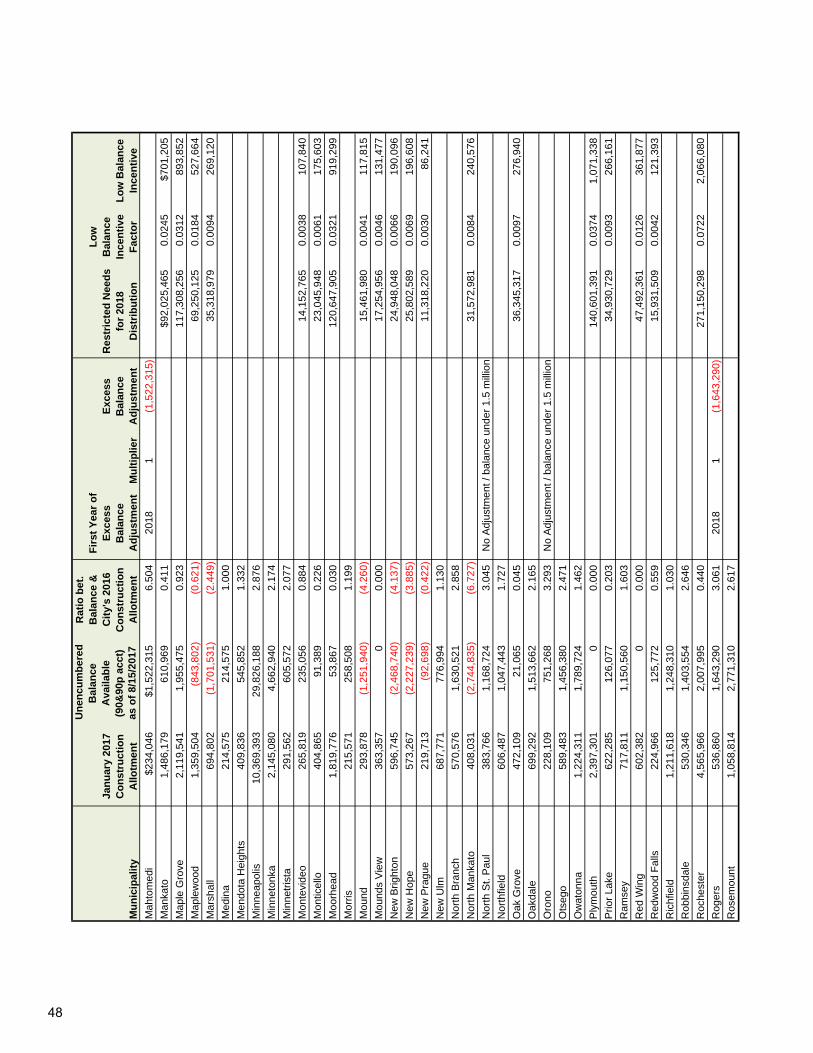
as o
f 8/
15/2
017
Res
tric
ted
Nee
ds
for
2018
D
istr
ibu
tio
n
Lo
w
Bal
ance
In
cen
tive
F
acto
rL
ow
Bal
ance
In
cen
tive
M
un
icip
alit
y
Jan
uar
y 20
17
Co
nst
ruct
ion
A
llotm
ent
Un
encu
mb
ered
B
alan
ce
Ava
ilab
le
(90&
90p
acc
t)
Rat
io b
et.
Bal
ance
&
Cit
y's
2016
C
on
stru
ctio
n
Allo
tmen
t
Fir
st Y
ear
of
Exc
ess
Bal
ance
A
dju
stm
ent
Mu
ltip
lier
Exc
ess
Bal
ance
A
dju
stm
ent
Mah
tom
edi
$234
,046
$1,5
22,3
156.
504
2018
1(1
,522
,315
)
Man
kato
1,48
6,17
961
0,96
90.
411
$92,
025,
465
0.02
45$7
01,2
05
Map
le G
rove
2,11
9,54
11,
955,
475
0.92
311
7,30
8,25
60.
0312
893,
852
Map
lew
ood
1,35
9,50
4(8
43,8
02)
(0.6
21)
69,2
50,1
250.
0184
527,
664
Mar
shal
l69
4,80
2(1
,701
,531
)(2
.449
)35
,318
,979
0.00
9426
9,12
0
Med
ina
214,
575
214,
575
1.00
0
Men
dota
Hei
ghts
409,
836
545,
852
1.33
2
Min
neap
olis
10,3
69,3
9329
,826
,188
2.87
6
Min
neto
nka
2,14
5,08
04,
662,
940
2.17
4
Min
netr
ista
291,
562
605,
572
2.07
7
Mon
tevi
deo
265,
819
235,
056
0.88
414
,152
,765
0.00
3810
7,84
0
Mon
ticel
lo40
4,86
591
,389
0.22
6
23
,045
,948
0.00
6117
5,60
3
Moo
rhea
d1,
819,
776
53,8
670.
030
120,
647,
905
0.03
2191
9,29
9
Mor
ris21
5,57
125
8,50
81.
199
Mou
nd29
3,87
8(1
,251
,940
)(4
.260
)15
,461
,980
0.00
4111
7,81
5
Mou
nds
Vie
w36
3,35
70
0.00
0
17
,254
,956
0.00
4613
1,47
7
New
Brig
hton
596,
745
(2,4
68,7
40)
(4.1
37)
24,9
48,0
480.
0066
190,
096
New
Hop
e57
3,26
7(2
,227
,239
)(3
.885
)25
,802
,589
0.00
6919
6,60
8
New
Pra
gue
219,
713
(92,
698)
(0.4
22)
11,3
18,2
200.
0030
86,2
41
New
Ulm
687,
771
776,
994
1.13
0
Nor
th B
ranc
h57
0,57
61,
630,
521
2.85
8
Nor
th M
anka
to40
8,03
1(2
,744
,835
)(6
.727
)31
,572
,981
0.00
8424
0,57
6
Nor
th S
t. P
aul
383,
766
1,16
8,72
43.
045
No
Adj
ustm
ent /
bal
ance
und
er 1
.5 m
illio
n
Nor
thfie
ld60
6,48
71,
047,
443
1.72
7
Oak
Gro
ve47
2,10
921
,065
0.04
536
,345
,317
0.00
9727
6,94
0
Oak
dale
699,
292
1,51
3,66
22.
165
Oro
no22
8,10
975
1,26
83.
293
No
Adj
ustm
ent /
bal
ance
und
er 1
.5 m
illio
n
Ots
ego
589,
483
1,45
6,38
02.
471
Ow
aton
na1,
224,
311
1,78
9,72
41.
462
Ply
mou
th2,
397,
301
00.
000
140,
601,
391
0.03
741,
071,
338
Prio
r La
ke62
2,28
512
6,07
70.
203
34,9
30,7
290.
0093
266,
161
Ram
sey
717,
811
1,15
0,56
01.
603
Red
Win
g60
2,38
20
0.00
047
,492
,361
0.01
2636
1,87
7
Red
woo
d F
alls
224,
966
125,
772
0.55
915
,931
,509
0.00
4212
1,39
3
Ric
hfie
ld1,
211,
618
1,24
8,31
01.
030
Rob
bins
dale
530,
346
1,40
3,55
42.
646
Roc
hest
er4,
565,
966
2,00
7,99
50.
440
271,
150,
298
0.07
222,
066,
080
Rog
ers
536,
860
1,64
3,29
03.
061
2018
1(1
,643
,290
)
Ros
emou
nt1,
058,
814
2,77
1,31
02.
617
48

as o
f 8/
15/2
017
Res
tric
ted
Nee
ds
for
2018
D
istr
ibu
tio
n
Lo
w
Bal
ance
In
cen
tive
F
acto
rL
ow
Bal
ance
In
cen
tive
M
un
icip
alit
y
Jan
uar
y 20
17
Co
nst
ruct
ion
A
llotm
ent
Un
encu
mb
ered
B
alan
ce
Ava
ilab
le
(90&
90p
acc
t)
Rat
io b
et.
Bal
ance
&
Cit
y's
2016
C
on
stru
ctio
n
Allo
tmen
t
Fir
st Y
ear
of
Exc
ess
Bal
ance
A
dju
stm
ent
Mu
ltip
lier
Exc
ess
Bal
ance
A
dju
stm
ent
Ros
evill
e$1
,022
,209
$383
,462
0.37
5$5
2,18
6,24
30.
0139
397,
643
Sar
tell
769,
320
(1,8
25,7
77)
(2.3
73)
$36,
136,
867
0.00
96$2
75,3
52
Sau
k R
apid
s63
6,55
7(2
37,8
10)
(0.3
74)
$31,
888,
289
0.00
8524
2,97
9
Sav
age
1,16
4,24
31,
234,
194
1.06
0
Sha
kope
e1,
072,
240
19,5
930.
018
71,9
44,9
210.
0192
548,
198
Sho
revi
ew72
2,25
10
0.00
033
,844
,374
0.00
9025
7,88
3
Sho
rew
ood
260,
602
563,
244
2.16
1
Sou
th S
aint
Pau
l59
7,81
12,
309,
548
3.86
320
181
(2,3
09,5
48)
Spr
ing
Lake
Par
k18
0,09
70
0.00
09,
071,
767
0.00
2469
,124
St.
Ant
hony
266,
122
(952
,234
)(3
.578
)12
,805
,488
0.00
3497
,574
St C
loud
2,38
3,10
52,
126,
770
0.89
214
9,10
0,63
00.
0397
1,13
6,10
0
St F
ranc
is34
7,08
31,
186,
779
3.41
9N
o A
djus
tmen
t / b
alan
ce u
nder
1.5
mill
ion
St J
osep
h14
9,88
325
3,75
81.
693
St L
ouis
Par
k1,
264,
408
(861
,260
)(0
.681
)76
,493
,541
0.02
0458
2,85
7
St M
icha
el70
9,05
181
5,90
81.
151
St P
aul
8,61
7,06
815
,328
,693
1.77
9
St P
aul P
ark
185,
578
501,
668
2.70
3
St P
eter
484,
386
258,
744
0.53
427
,583
,321
0.00
7321
0,17
6
Ste
war
tvill
e16
2,43
2(2
15,5
03)
(1.3
27)
6,84
5,14
00.
0018
52,1
58
Stil
lwat
er60
9,70
11,
090,
148
1.78
8
Thi
ef R
iver
Fal
ls50
1,59
257
,789
0.11
539
,490
,569
0.01
0530
0,90
6
Vad
nais
Hei
ghts
294,
324
283,
285
0.96
215
,963
,859
0.00
4312
1,64
0
Vic
toria
238,
516
238,
517
1.00
0
Virg
inia
400,
672
929,
229
2.31
9
Wac
onia
490,
239
492,
996
1.00
6
Wai
te P
ark
308,
561
134,
522
0.43
613
,053
,530
0.00
3599
,464
Was
eca
271,
711
607,
725
2.23
7
Wes
t St P
aul
536,
880
96,8
800.
180
25,3
13,7
250.
0067
192,
883
Whi
te B
ear
Lake
687,
272
00.
000
34,7
11,6
450.
0092
264,
492
Will
mar
844,
515
403,
670
0.47
858
,183
,047
0.01
5544
3,33
7
Win
ona
869,
187
1,27
6,49
21.
469
Woo
dbur
y2,
238,
944
00.
000
125,
065,
235
0.03
3395
2,95
8
Wor
thin
gton
433,
698
1,76
7,59
34.
076
2018
1(1
,767
,593
)
Wyo
min
g43
2,35
172
6,67
81.
681
Zim
mer
man
217,
334
(360
,116
)(1
.657
)8,
852,
037
0.00
2467
,450
To
tal
$131
,462
,391
$126
,621
,920
($28
,616
,241
)$3
,755
,567
,147
1.00
00$2
8,61
6,24
1
N:\M
SA
S\B
ooks
\201
7 O
ctob
er B
ook\
Adj
uste
d C
onst
ruct
ion
Nee
ds 2
017
(Old
Boo
k F
ile A
& B
).xl
sx
49

(see Screening Board resolution on After the Fact Right-of-Way Adjustment)
06-Sep-17
Total New TotalRight-of-Way Right-of-Way Right-of-Way Right-of-WayExpenditures Expenditures Expenditures = Expenditures
for 2017 + for 2018 + Expired for 2018Municipality Allocations Allocation in 2017 AllocationsAlbert LeaAlbertvilleAlexandria $367,593 $367,593Andover 1,016 1,016AnokaApple Valley 126,066 (103,229) 22,837Arden HillsAustinBaxter 468,225 468,225Belle Plaine 1,224,822 1,224,822Bemidji 56,122 (56,122)Big LakeBlaine 5,237,117 (4,505) 5,232,612Bloomington * 4,728,335 overpayment expired 444,538 5,172,873Brainerd 1,269,506 1,269,506Brooklyn CenterBrooklyn Park * 47,446 (2,569) 44,877Buffalo 1,550,985 1,550,985BurnsvilleByronCambridgeChamplin 62,348 62,348ChanhassenChaskaChisago CityChisholmCircle Pines 82,365 82,365CloquetColumbia HeightsCoon Rapids 2,469,664 2,469,664CorcoranCottage Grove 492,450 492,450CrookstonCrystal DaytonDelanoDetroit Lakes 51,476 51,476Duluth 2,564,618 2,564,618Eagan 4,526,826 (190,644) 4,336,182East Bethel 128,055 128,055East Grand Forks 141,624 141,624Eden Prairie 445,608 445,608Edina 138,273 (109,707) 28,566Elk River 2,341,754 2,341,754FairmontFalcon HeightsFaribault 387,986 (273,000) 114,986Farmington
NEEDS ADJUSTMENT FOR RIGHT-OF WAY-ACQUISITION
50

Total New TotalRight-of-Way Right-of-Way Right-of-Way Right-of-WayExpenditures Expenditures Expenditures = Expenditures
for 2017 + for 2018 + Expired for 2018Municipality Allocations Allocation in 2017 Allocations
Fergus Falls $318,549 $318,549Forest Lake 14,872 (8,033) 6,839FridleyGlencoeGolden ValleyGrand Rapids 2,386,592 2,386,592Ham Lake 820,610 (25,728) 794,882HastingsHermantown 177,124 (2,465) 174,659HibbingHopkinsHugoHutchinsonInternational FallsInver Grove Heights 776,192 776,192IsantiJordanKassonLa Crescent 25,000 25,000Lake City 7,000 7,000Lake ElmoLakeville 1,015,804 1,015,804Lino Lakes 360,549 360,549LitchfieldLittle CanadaLittle Falls 1,333,864 1,333,864MahtomediMankato 347,928 overpayment expired 12,427 360,355Maple Grove 2,052,966 (242,962) 1,810,004Maplewood 5,279,548 5,279,548Marshall 302,397 302,397MedinaMendota Heights 61,140 61,140Minneapolis 181,087 181,087Minnetonka 172,463 (172,463)Minnetrista 145,293 145,293Montevideo 13,949 13,949MonticelloMoorhead ** 3,922,661 358,287 4,280,948Morris 10,500 (10,500)Mound Mounds ViewNew BrightonNew HopeNew Prague 6,287 6,287New UlmNorth Branch 38,362 38,362North Mankato 64,226 64,226North St. Paul 448,302 448,302NorthfieldOak Grove 699,809 699,809OakdaleOronoOtsego 518,832 518,832
51
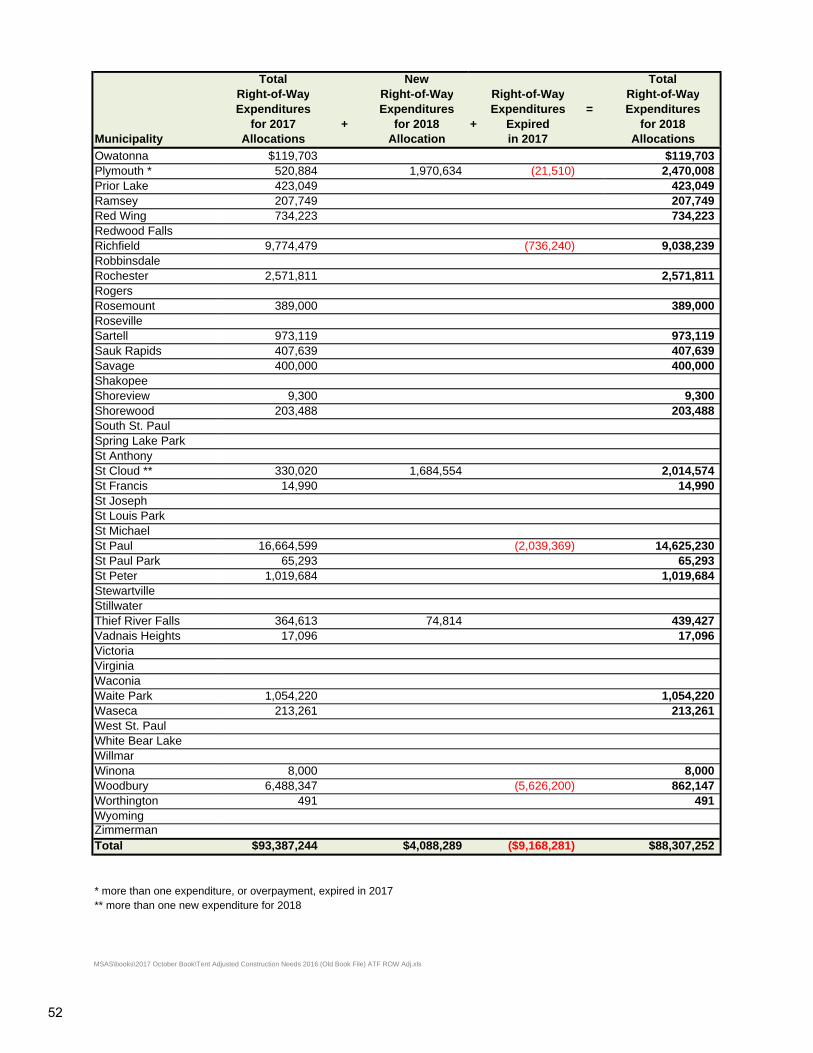
Total New TotalRight-of-Way Right-of-Way Right-of-Way Right-of-WayExpenditures Expenditures Expenditures = Expenditures
for 2017 + for 2018 + Expired for 2018Municipality Allocations Allocation in 2017 Allocations
Owatonna $119,703 $119,703Plymouth * 520,884 1,970,634 (21,510) 2,470,008Prior Lake 423,049 423,049Ramsey 207,749 207,749Red Wing 734,223 734,223Redwood FallsRichfield 9,774,479 (736,240) 9,038,239RobbinsdaleRochester 2,571,811 2,571,811RogersRosemount 389,000 389,000RosevilleSartell 973,119 973,119Sauk Rapids 407,639 407,639Savage 400,000 400,000ShakopeeShoreview 9,300 9,300Shorewood 203,488 203,488South St. PaulSpring Lake ParkSt AnthonySt Cloud ** 330,020 1,684,554 2,014,574St Francis 14,990 14,990St JosephSt Louis ParkSt MichaelSt Paul 16,664,599 (2,039,369) 14,625,230St Paul Park 65,293 65,293St Peter 1,019,684 1,019,684StewartvilleStillwaterThief River Falls 364,613 74,814 439,427Vadnais Heights 17,096 17,096VictoriaVirginiaWaconiaWaite Park 1,054,220 1,054,220Waseca 213,261 213,261West St. PaulWhite Bear LakeWillmarWinona 8,000 8,000Woodbury 6,488,347 (5,626,200) 862,147Worthington 491 491WyomingZimmermanTotal $93,387,244 $4,088,289 ($9,168,281) $88,307,252
* more than one expenditure, or overpayment, expired in 2017** more than one new expenditure for 2018
MSAS\books\2017 October Book\Tent Adjusted Construction Needs 2016 (Old Book File) ATF ROW Adj.xls
52

MUNICIPALITY PROJECT AMOUNT
Moorhead 144-128-030 $24,100Moorhead 144-138-040 29,450Moorhead 144-118-060 1,632Moorhead 144-136-014 56,564Moorhead 144-136-014 246,541
Plymouth 155-153-003 1,970,634
St. Cloud 162-151-001 1,279,842St. Cloud 162-151-002 404,712
Thief River Falls 170-115-012 74,814
TOTAL $4,088,289
MUNICIPALITY PROJECT AMOUNT
Apple Valley 186-111-002 $103,229
Bemidji 105-129-001 56,122
Blaine 106-107-003 4,505
Bloomington 107-131-023 47,069Bloomington 107-132-016 17,816Bloomington overpayment (142,000)Bloomington 107-385-010 615,096Bloomington overpayment (1,421,121)Bloomington 107-399-027 2,898,631Bloomington 107-415-008 44,199Bloomington overpayment (1,237,600)Bloomington overpayment (1,266,628)
Brooklyn Park 110-124-003 928Brooklyn Park 110-124-004 1,641
Eagan 195-120-002 190,644
Edina 120-136-013 109,707
Faribault 125-137-001 273,000
Forest Lake 214-102-002 8,033
Ham Lake 197-105-003 25,728
Hermantown 202-101-005 2,465
Mankato overpayment (12,427)
Maple Grove 189-106-xxx 242,962
Minnetonka 142-153-004 172,463
Morris 190-116-001 10,500
Plymouth 155-158-004 12,910Plymouth 155-158-005 8,600
Richfield 157-361-023 736,240
St. Paul 164-267-002 2,039,369
Woodbury 170-112-007 5,626,200
TOTAL $9,168,281
NEW RIGHT-OF-WAY ADJUSTMENTS FOR 2018 DISTRIBUTION
EXPIRED RIGHT-OF-WAY ADJUSTMENTS, 2017
53

Municipality
Retaining Wall Expenditures
for 2017 Allocations
New Retaining Wall
Expenditures for 2018
Retaining Wall Expenditures
Expired in 2017
Total Retaining Wall Adjustment
for 2018 Allocations
Albert Lea $67,342 $0 $0 $67,342Alexandria 25,633 0 0 25,633Andover 20,197 0 0 20,197Bloomington 55,013 0 0 55,013Brainerd 188,352 0 0 188,352Buffalo 61,252 0 0 61,252Cambridge 0 28,020 0 28,020Cloquet 0 81,498 0 81,498Crystal 42,510 0 0 42,510Duluth 594,891 0 0 594,891Fergus Falls 110,360 0 0 110,360Grand Rapids 207,986 28,890 0 236,876Inver Grove Heights 179,003 0 0 179,003Kasson 35,640 0 0 35,640La Crescent 8,624 0 0 8,624Lakeville 118,042 0 0 118,042Marshall 514,325 0 0 514,325Minnetonka 37,913 0 0 37,913Moorhead 359,937 0 0 359,937Mounds View 13,419 0 0 13,419New Hope 32,400 0 0 32,400Oakdale 20,658 0 0 20,658Plymouth 64,144 0 0 64,144Red Wing 539,025 0 0 539,025Roseville 34,400 72,981 0 107,381Sartell 6,000 0 0 6,000St. Paul 51,542 0 0 51,542Thief River Falls 296,422 0 0 296,422Total $3,685,030 $211,389 $0 $3,896,419
Municipality
Cambridge 218-120-002 $28,020 $28,020Cloquet 112-145-001 $81,498 81,498Grand Rapids 129-119-008 28,890 28,890Roseville 160-251-003 72,981 72,981Total $28,020 $183,369 $211,389
AFTER THE FACT RETAINING WALL ADJUSTMENT(see Screening Board resolution on After the Fact Retaining Wall Adjustment)
Project or Route Local Amount SA Amount Total Adjustment
NEW PROJECT LISTING OF RETAINING WALL CONSTRUCTIONPayment requested in 2017
N:\MSAS\Books\2017 October Book\Tent Adjusted Construction Needs 2017 (Old Book File).xlsx54

Municipality
Buffalo $528,566 $528,566
Cambridge $234,357 $234,357
Fergus Falls $299,555 $299,555
New Ulm $18,433 $18,433
Moorhead $258,980 $258,980
Moorhead $366,805 $366,805
Total $1,080,911 $625,785 NA $1,706,696
RR Bridge over MSAS Route Rehabilitation
RR Bridge over MSAS Route Construction/Reconstruction
(One city has this adjustment)
Municipality
Thief River Falls $378,684Construction/
Reconstruction $378,684Total $378,684 $378,684
AFTER THE FACT RAILROAD CROSSING ADJUSTMENT
Previous Eligible Railroad Crossing
Expenditures
2017 Eliglble Railroad Crossing
Expenditures
Expired Railroad Crossing
Expenditures
Total Railroad Crossing
Adjustment for 2018 Apportionment
Type of Construction
Any Railroad Crossing improvements shall not be included in the Needs Calculations until the project has been completed and the actual cost established. At that time a Construction Needs adjustment shall be made by annually adding the local cost (which is the total cost less county or trunk highway participation) to the annual Construction Needs for a 15 year period. Only State Aid eligible items are allowed to be included in this adjustment, and all Railroad Crossing Needs adjustments must be input by the city and approved by the District State Aid Engineer.
Any structure that has been rehabilitated (Minnesota Administrative Rules, CHAPTER 8820, 8820.0200 DEFINITIONS, Subp. 8. Bridge rehabilitation) shall not be included in the Needs calculations until the rehabilitation project has been completed and the actual cost established. At that time a Construction Needs adjustment shall be made by annually adding the local cost (which is the total cost less county or trunk highway participation) for a 15-year period. Only State Aid eligible items are allowed to be included in this adjustment and all structure rehabilitation Needs adjustments must be input by the city and approved by the DSAE.
Any structure that has been constructed/reconstructed (Minnesota Administrative Rules, CHAPTER 8820, 8820.0200 DEFINITIONS, Subp. 31. Reconstruction) shall not be included in the Needs calculations until the project has been completed and the actual cost established. At that time a Construction Needs adjustment shall be made by annually adding the local cost (which is the total cost less county or trunk highway participation) for a 35-year period. Only State Aid eligible items are allowed to be included in this adjustment and all structure construction/reconstruction Needs adjustments must be input by the city and approved by the District State Aid Engineer
Previous Eligible Railroad Bridge over MSAS Expenditures
AFTER THE FACT RAILROAD BRIDGE OVER MSAS ADJUSTMENT
2017 Eliglble Railroad Bridge
over MSAS Expenditures
Expired Railroad
Bridge over MSAS
Expenditures
Total Railroad Bridge over MSAS
Adjustment for 2018 Apportionment
N:\MSAS\Books\2017 October Book\RR Bridge & RR Cross Adj.xlsx
55

N:\
MS
AS
\BO
OK
S\2
015
OC
TO
BE
R B
OO
K\T
EN
AT
IVE
AD
JUS
TE
D C
ON
ST
RU
CT
ION
NE
ED
S 2
015
(Old
Boo
k F
ile)
.XL
S
(+)
(+)
(+
)(+
)
Ad
just
ed
Res
tric
ted
To
tal
Co
nst
ruct
ion
Mu
nic
ipal
ity
Ad
just
men
tsN
eed
sA
lber
t Lea
$4
6,72
7,78
3$6
7,34
2$6
7,34
2$4
6,79
5,12
5A
lber
tvill
e13
,590
,010
013
,590
,010
Ale
xand
ria62
,232
,760
$474
,194
$367
,593
25,6
3386
7,42
063
,100
,180
And
over
65,1
20,7
7849
6,20
01,
016
20,1
9751
7,41
365
,638
,191
Ano
ka30
,369
,788
231,
408
231,
408
30,6
01,1
96A
pple
Val
ley
79,1
10,3
1922
,837
22,8
3779
,133
,156
Ard
en H
ills
11,7
30,6
0389
,384
89,3
8411
,819
,987
Aus
tin63
,678
,547
063
,678
,547
Bax
ter
31,5
39,5
9546
8,22
546
8,22
532
,007
,820
Bel
le P
lain
e15
,824
,483
120,
578
1,22
4,82
21,
345,
400
17,1
69,8
83B
emid
ji37
,168
,320
283,
211
283,
211
37,4
51,5
31B
ig L
ake
17,4
56,2
0513
3,01
113
3,01
117
,589
,216
Bla
ine
85,9
49,4
265,
232,
612
5,23
2,61
291
,182
,038
Blo
omin
gton
179,
276,
801
(8,1
47,3
30)
5,17
2,87
355
,013
(2,9
19,4
44)
176,
357,
357
Bra
iner
d38
,298
,195
291,
820
1,26
9,50
618
8,35
21,
749,
678
40,0
47,8
73B
rook
lyn
Cen
ter
33,7
62,1
6725
7,25
725
7,25
734
,019
,424
Bro
okly
n P
ark
99,4
92,2
5875
8,10
044
,877
802,
977
100,
295,
235
Buf
falo
32,1
91,6
7024
5,29
01,
550,
985
61,2
52$5
28,5
662,
386,
093
34,5
77,7
63B
urns
ville
100,
181,
128
763,
349
763,
349
100,
944,
477
Byr
on9,
754,
115
09,
754,
115
Cam
brid
ge26
,904
,480
205,
004
28,0
2023
4,35
746
7,38
127
,371
,860
Cha
mpl
in39
,011
,045
62,3
4862
,348
39,0
73,3
93C
hanh
asse
n45
,901
,684
349,
756
349,
756
46,2
51,4
40C
hask
a40
,136
,293
305,
826
305,
826
40,4
42,1
19C
hisa
go C
ity13
,012
,316
99,1
5099
,150
13,1
11,4
66C
hish
olm
13,9
29,4
6910
6,13
810
6,13
814
,035
,608
Circ
le P
ines
5,64
5,26
343
,015
82,3
6512
5,38
05,
770,
643
Clo
quet
37,4
45,8
7128
5,32
681
,498
366,
824
37,8
12,6
95C
olum
bia
Hei
ghts
22
,981
,317
175,
110
175,
110
23,1
56,4
27C
oon
Rap
ids
94,6
81,7
3972
1,44
52,
469,
664
3,19
1,10
997
,872
,848
Cor
cora
n20
,121
,945
(1,6
21,1
80)
(1,6
21,1
80)
18,5
00,7
65C
otta
ge G
rove
66,2
55,1
8450
4,84
449
2,45
099
7,29
467
,252
,478
Cro
okst
on29
,692
,963
029
,692
,963
Cry
stal
28,8
87,1
0722
0,11
142
,510
262,
621
29,1
49,7
28D
ayto
n14
,005
,720
014
,005
,720
Del
ano
13,1
68,6
3310
0,34
110
0,34
113
,268
,974
Det
roit
Lake
s43
,788
,603
333,
655
51,4
7638
5,13
144
,173
,734
Dul
uth
273,
127,
983
2,56
4,61
859
4,89
13,
159,
509
276,
287,
492
Eag
an10
8,07
6,99
382
3,51
34,
336,
182
5,15
9,69
511
3,23
6,68
8
Aft
er t
he
Fac
t R
etai
nin
g W
all
Ad
just
men
t
Aft
er t
he
Fac
t R
ailr
oad
Cro
ssin
g
Ad
just
men
t
201
7 A
DJU
ST
ED
/ R
ES
TR
ICT
ED
CO
NS
TR
UC
TIO
N N
EE
DS
for
Janu
ary
2018
app
ortio
nmen
t
Res
tric
ted
(P
has
e in
) N
eed
s fo
r Ja
n. 2
018
Dis
trib
uti
on
Aft
er t
he
Fac
t R
ailr
oad
B
rid
ge
ove
r M
SA
S R
ou
te
Aft
er t
he
Fac
t R
igh
t o
f W
ay
Ad
just
men
t
Exc
ess
Bal
ance
A
dju
stm
ent
red
istr
ibu
ted
as
Lo
w
Bal
ance
Ince
nti
ve
56

(+)
(+)
(+
)(+
)
Ad
just
ed
Res
tric
ted
To
tal
Co
nst
ruct
ion
Mu
nic
ipal
ity
Ad
just
men
tsN
eed
s
Aft
er t
he
Fac
t R
etai
nin
g W
all
Ad
just
men
t
Aft
er t
he
Fac
t R
ailr
oad
Cro
ssin
g
Ad
just
men
t
Res
tric
ted
(P
has
e in
) N
eed
s fo
r Ja
n. 2
018
Dis
trib
uti
on
Aft
er t
he
Fac
t R
ailr
oad
B
rid
ge
ove
r M
SA
S R
ou
te
Aft
er t
he
Fac
t R
igh
t o
f W
ay
Ad
just
men
t
Exc
ess
Bal
ance
A
dju
stm
ent
red
istr
ibu
ted
as
Lo
w
Bal
ance
Ince
nti
veE
ast B
ethe
l$4
0,92
4,18
4$3
11,8
29$1
28,0
55$4
39,8
84$4
1,36
4,06
9E
ast G
rand
For
ks36
,552
,208
$278
,516
141,
624
420,
140
36,9
72,3
48E
den
Pra
irie
107,
913,
860
(9,4
58,3
85)
445,
608
(9,0
12,7
77)
98,9
01,0
83E
dina
93,8
55,2
5471
5,14
828
,566
743,
714
94,5
98,9
68E
lk R
iver
73
,670
,171
2,34
1,75
42,
341,
754
76,0
11,9
25F
airm
ont
38,1
02,6
740
38,1
02,6
74F
alco
n H
eigh
ts5,
398,
624
05,
398,
624
Far
ibau
lt52
,171
,332
114,
986
114,
986
52,2
86,3
18F
arm
ingt
on29
,126
,463
221,
934
221,
934
29,3
48,3
98F
ergu
s F
alls
57,6
12,9
4131
8,54
9$1
10,3
60$2
99,5
5572
8,46
458
,341
,405
For
est L
ake
60,2
87,1
436,
839
6,83
960
,293
,982
Frid
ley
39,5
93,4
9030
1,69
030
1,69
039
,895
,180
Gle
ncoe
13,5
61,6
950
13,5
61,6
95G
olde
n V
alle
y48
,616
,755
(2,1
46,6
00)
(2,1
46,6
00)
46,4
70,1
55G
rand
Rap
ids
53,8
45,0
032,
386,
592
$236
,876
2,62
3,46
856
,468
,471
Ham
Lak
e45
,447
,075
346,
292
794,
882
1,14
1,17
446
,588
,249
Has
tings
30
,303
,544
030
,303
,544
Her
man
tow
n33
,535
,750
255,
532
174,
659
430,
191
33,9
65,9
41H
ibbi
ng82
,717
,994
630,
285
630,
285
83,3
48,2
79H
opki
ns
22,0
31,0
5716
7,87
016
7,87
022
,198
,927
Hug
o32
,610
,648
248,
483
248,
483
32,8
59,1
31H
utch
inso
n40
,015
,016
040
,015
,016
Inte
rnat
iona
l Fal
ls11
,660
,747
011
,660
,747
Inve
r G
rove
Hei
ghts
60,2
95,0
2177
6,19
2$1
79,0
0395
5,19
561
,250
,216
Isan
ti9,
905,
099
75,4
7475
,474
9,98
0,57
3Jo
rdan
11,4
52,6
1387
,265
87,2
6511
,539
,879
Kas
son
10,2
96,4
7135
,640
35,6
4010
,332
,111
La C
resc
ent
8,99
2,47
225
,000
8,62
433
,624
9,02
6,09
6La
ke C
ity12
,380
,867
94,3
387,
000
101,
338
12,4
82,2
05La
ke E
lmo
28,6
35,5
700
28,6
35,5
70La
kevi
lle12
6,42
3,21
996
3,30
51,
015,
804
118,
042
2,09
7,15
112
8,52
0,37
0Li
no L
akes
41,7
06,2
4431
7,78
836
0,54
967
8,33
742
,384
,581
Litc
hfie
ld15
,906
,928
015
,906
,928
Littl
e C
anad
a19
,567
,624
149,
099
149,
099
19,7
16,7
23Li
ttle
Fal
ls34
,488
,061
1,33
3,86
41,
333,
864
35,8
21,9
25M
ahto
med
i13
,121
,265
(1,5
22,3
15)
(1,5
22,3
15)
11,5
98,9
50M
anka
to92
,025
,465
701,
205
360,
355
1,06
1,56
093
,087
,025
Map
le G
rove
117,
308,
256
893,
852
1,81
0,00
42,
703,
856
120,
012,
112
Map
lew
ood
69,2
50,1
2552
7,66
45,
279,
548
5,80
7,21
275
,057
,337
Mar
shal
l35
,318
,979
269,
120
302,
397
514,
325
1,08
5,84
236
,404
,821
Med
ina
14,6
53,7
640
14,6
53,7
64M
endo
ta H
eigh
ts25
,672
,185
61,1
4061
,140
25,7
33,3
25M
inne
apol
is
568,
805,
116
181,
087
181,
087
568,
986,
203
Min
neto
nka
96,7
91,2
8637
,913
37,9
1396
,829
,199
Min
netr
ista
20,6
94,6
8214
5,29
314
5,29
320
,839
,975
57

(+)
(+)
(+
)(+
)
Ad
just
ed
Res
tric
ted
To
tal
Co
nst
ruct
ion
Mu
nic
ipal
ity
Ad
just
men
tsN
eed
s
Aft
er t
he
Fac
t R
etai
nin
g W
all
Ad
just
men
t
Aft
er t
he
Fac
t R
ailr
oad
Cro
ssin
g
Ad
just
men
t
Res
tric
ted
(P
has
e in
) N
eed
s fo
r Ja
n. 2
018
Dis
trib
uti
on
Aft
er t
he
Fac
t R
ailr
oad
B
rid
ge
ove
r M
SA
S R
ou
te
Aft
er t
he
Fac
t R
igh
t o
f W
ay
Ad
just
men
t
Exc
ess
Bal
ance
A
dju
stm
ent
red
istr
ibu
ted
as
Lo
w
Bal
ance
Ince
nti
veM
onte
vide
o$1
4,15
2,76
510
7,84
0$1
3,94
9$1
21,7
89$1
4,27
4,55
4M
ontic
ello
23,0
45,9
48$1
75,6
0317
5,60
323
,221
,551
Moo
rhea
d12
0,64
7,90
591
9,29
94,
280,
948
$359
,937
$625
,785
6,18
5,96
912
6,83
3,87
4M
orris
14,8
18,3
400
14,8
18,3
40M
ound
15,4
61,9
8011
7,81
511
7,81
515
,579
,796
Mou
nds
Vie
w17
,254
,956
131,
477
13,4
1914
4,89
617
,399
,852
New
Brig
hton
24,9
48,0
4819
0,09
619
0,09
625
,138
,144
New
Hop
e 25
,802
,589
196,
608
32,4
0022
9,00
826
,031
,597
New
Pra
gue
11,3
18,2
2086
,241
6,28
792
,528
11,4
10,7
48N
ew U
lm34
,164
,082
18,4
3318
,433
34,1
82,5
15N
orth
Bra
nch
45,0
75,5
1838
,362
38,3
6245
,113
,880
Nor
th M
anka
to31
,572
,981
240,
576
64,2
2630
4,80
231
,877
,783
Nor
th S
t. P
aul
19,6
16,7
3744
8,30
244
8,30
220
,065
,039
Nor
thfie
ld30
,738
,417
030
,738
,417
Oak
Gro
ve36
,345
,317
276,
940
699,
809
976,
749
37,3
22,0
66O
akda
le29
,027
,393
20,6
5820
,658
29,0
48,0
51O
rono
17,4
14,9
710
17,4
14,9
71O
tseg
o37
,433
,757
518,
832
518,
832
37,9
52,5
89O
wat
onna
67,8
11,1
0211
9,70
311
9,70
367
,930
,805
Ply
mou
th14
0,60
1,39
11,
071,
338
2,47
0,00
864
,144
3,60
5,49
114
4,20
6,88
2P
rior
Lake
34,9
30,7
2926
6,16
142
3,04
968
9,21
035
,619
,939
Ram
sey
55,8
01,5
5520
7,74
920
7,74
956
,009
,304
Red
Win
g47
,492
,361
361,
877
734,
223
539,
025
1,63
5,12
549
,127
,486
Red
woo
d F
alls
15,9
31,5
0912
1,39
312
1,39
316
,052
,902
Ric
hfie
ld53
,012
,754
9,03
8,23
99,
038,
239
62,0
50,9
93R
obbi
nsda
le18
,895
,108
018
,895
,108
Roc
hest
er
271,
150,
298
2,06
6,08
02,
571,
811
4,63
7,89
127
5,78
8,18
9R
oger
s39
,157
,930
(1,6
43,2
90)
(1,6
43,2
90)
37,5
14,6
40R
osem
ount
48,5
22,6
0838
9,00
038
9,00
048
,911
,608
Ros
evill
e52
,186
,243
397,
643
107,
381
505,
024
52,6
91,2
67S
arte
ll36
,136
,867
275,
352
973,
119
6,00
01,
254,
471
37,3
91,3
38S
auk
Rap
ids
31,8
88,2
8924
2,97
940
7,63
965
0,61
832
,538
,907
Sav
age
49,5
02,9
0340
0,00
040
0,00
049
,902
,903
Sha
kope
e71
,944
,921
548,
198
548,
198
72,4
93,1
19S
hore
view
33,8
44,3
7425
7,88
39,
300
267,
183
34,1
11,5
57S
hore
woo
d15
,913
,983
203,
488
203,
488
16,1
17,4
71S
outh
St.
Pau
l30
,368
,536
(2,3
09,5
48)
(2,3
09,5
48)
28,0
58,9
88S
prin
g La
ke P
ark
9,07
1,76
769
,124
69,1
249,
140,
891
St.
Ant
hony
12,8
05,4
8897
,574
97,5
7412
,903
,062
St.
Clo
ud14
9,10
0,63
01,
136,
100
2,01
4,57
43,
150,
674
152,
251,
304
St.
Fra
ncis
24,8
50,9
8414
,990
14,9
9024
,865
,974
St.
Jose
ph4,
650,
701
04,
650,
701
St.
Loui
s P
ark
76,4
93,5
4158
2,85
758
2,85
777
,076
,398
St.
Mic
hael
46,8
53,7
600
46,8
53,7
60S
t. P
aul
450,
892,
775
14,6
25,2
3051
,542
14,6
76,7
7246
5,56
9,54
7S
t. P
aul P
ark
11,3
51,2
9765
,293
65,2
9311
,416
,590
58

(+)
(+)
(+
)(+
)
Ad
just
ed
Res
tric
ted
To
tal
Co
nst
ruct
ion
Mu
nic
ipal
ity
Ad
just
men
tsN
eed
s
Aft
er t
he
Fac
t R
etai
nin
g W
all
Ad
just
men
t
Aft
er t
he
Fac
t R
ailr
oad
Cro
ssin
g
Ad
just
men
t
Res
tric
ted
(P
has
e in
) N
eed
s fo
r Ja
n. 2
018
Dis
trib
uti
on
Aft
er t
he
Fac
t R
ailr
oad
B
rid
ge
ove
r M
SA
S R
ou
te
Aft
er t
he
Fac
t R
igh
t o
f W
ay
Ad
just
men
t
Exc
ess
Bal
ance
A
dju
stm
ent
red
istr
ibu
ted
as
Lo
w
Bal
ance
Ince
nti
veS
t. P
eter
$27,
583,
321
$210
,176
$1,0
19,6
84$1
,229
,860
$28,
813,
181
Ste
war
tvill
e6,
845,
140
52,1
5852
,158
6,89
7,29
8S
tillw
ater
33,0
65,9
360
33,0
65,9
36T
hief
Riv
er F
alls
39,4
90,5
6930
0,90
6$3
78,6
8443
9,42
7$2
96,4
221,
415,
439
40,9
06,0
08V
adna
is H
eigh
ts15
,963
,859
121,
640
17,0
9613
8,73
616
,102
,595
Vic
toria
11,6
93,9
530
11,6
93,9
53V
irgin
ia30
,991
,783
030
,991
,783
Wac
onia
23,5
93,7
300
23,5
93,7
30W
aite
Par
k13
,053
,530
99,4
641,
054,
220
1,15
3,68
414
,207
,213
Was
eca
12,9
40,4
9421
3,26
121
3,26
113
,153
,755
Wes
t St.
Pau
l25
,313
,725
192,
883
192,
883
25,5
06,6
07W
hite
Bea
r La
ke34
,711
,645
264,
492
264,
492
34,9
76,1
37W
illm
ar58
,183
,047
443,
337
443,
337
58,6
26,3
84W
inon
a47
,865
,239
8,00
08,
000
47,8
73,2
39W
oodb
ury
125,
065,
235
952,
958
862,
147
1,81
5,10
512
6,88
0,34
0W
orth
ingt
on21
,083
,004
(1,7
67,5
93)
491
(1,7
67,1
02)
19,3
15,9
02W
yom
ing
24,9
33,7
990
24,9
33,7
99Z
imm
erm
an8,
852,
037
67,4
5067
,450
8,91
9,48
7S
tate
To
tal
$7,4
84,7
08,8
76($
0)$3
78,6
84$8
8,30
7,25
2$3
,896
,419
$1,7
06,6
96$9
4,28
9,05
1$7
,578
,997
,927
N: M
SA
S/B
ooks
/201
7 O
ctob
er B
ook/
Adj
uste
d C
onst
ruct
ion
Nee
ds 2
017
(Old
Boo
k F
ile A
&B
).xl
s
59

State Aid for Local Transportation
395 John Ireland Blvd., MS 500 St. Paul, MN 55155
An equal opportunity employer
October 25, 2017 Charlie Zelle, Commissioner Mail Stop 100 395 John Ireland Blvd. St. Paul, MN 55155 Dear Commissioner Zelle: We, the undersigned, as members of the 2017 Municipal Screening Board, having reviewed all information available in relation to the 25 year money needs of the Municipal State Aid Street System do hereby submit our findings as required by Minnesota Statutes. We recommend that these findings be modified as required by Screening Board Resolutions, and that any new municipalities that become eligible for State Aid by special census, incorporation, annexation or population estimates have their mileage and resulting money needs established and included in our findings. This Board, therefore, recommends that the money needs, as listed on the attached, be modified as required and used as the basis for apportioning to the urban municipalities the 2018 Apportionment Sum as provided by Minnesota Statutes, Chapter 162.13, Subdivision 1.
Marc Culver Roseville
Chair
Glenn Olson Marshall
Vice Chair
John Gorder Eagan
Secretary
Matt Wegwerth Grand Rapids
District 1
Craig Gray Bemidji
District 2
Justin Femrite Elk River District 3
Jeff Kuhn Morris
District 4
Steve Lillehaug Shakopee
Metro West
Jay Owens Red Wing District 6
Mark DuChene Waseca
District 7
Sean Christensen Willmar District 8
Tom Wesolowski Shoreview Metro East
Cindy Voigt Duluth
Don Elwood Minneapolis
Paul Kurtz Saint Paul
Richard Freese Rochester
60
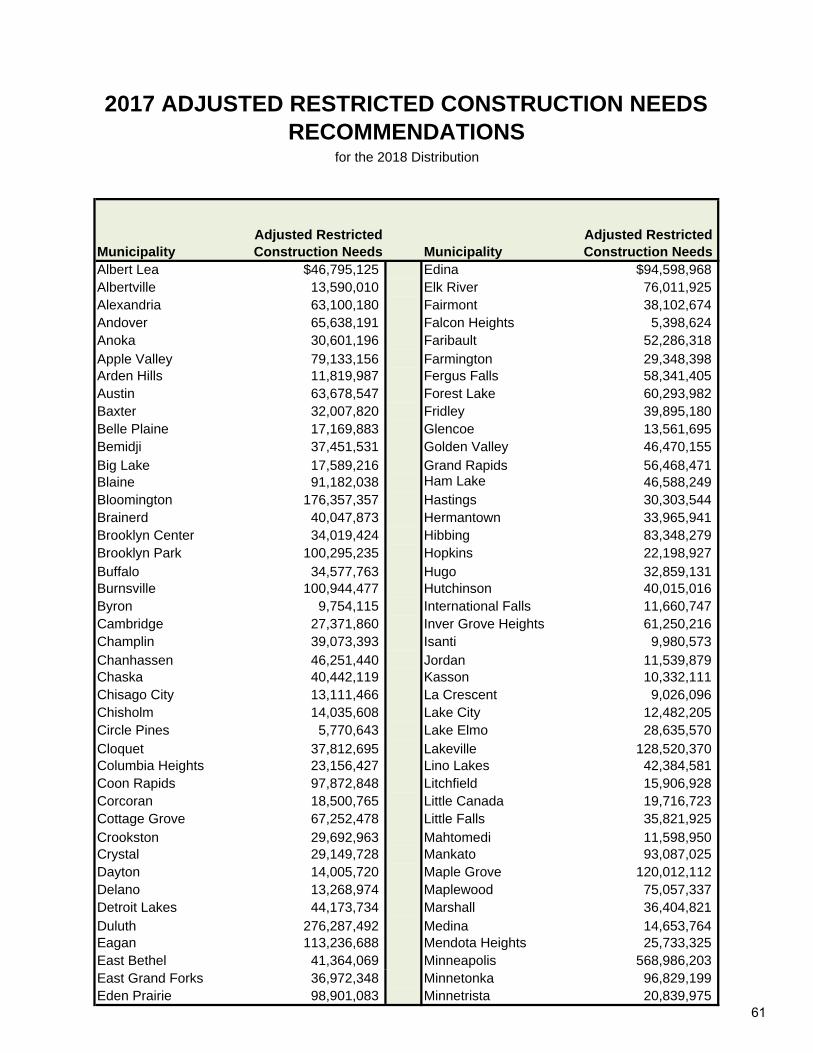
Albert Lea $46,795,125 Edina $94,598,968Albertville 13,590,010 Elk River 76,011,925Alexandria 63,100,180 Fairmont 38,102,674Andover 65,638,191 Falcon Heights 5,398,624Anoka 30,601,196 Faribault 52,286,318Apple Valley 79,133,156 Farmington 29,348,398Arden Hills 11,819,987 Fergus Falls 58,341,405Austin 63,678,547 Forest Lake 60,293,982Baxter 32,007,820 Fridley 39,895,180Belle Plaine 17,169,883 Glencoe 13,561,695Bemidji 37,451,531 Golden Valley 46,470,155Big Lake 17,589,216 Grand Rapids 56,468,471Blaine 91,182,038 Ham Lake 46,588,249Bloomington 176,357,357 Hastings 30,303,544Brainerd 40,047,873 Hermantown 33,965,941Brooklyn Center 34,019,424 Hibbing 83,348,279Brooklyn Park 100,295,235 Hopkins 22,198,927Buffalo 34,577,763 Hugo 32,859,131Burnsville 100,944,477 Hutchinson 40,015,016Byron 9,754,115 International Falls 11,660,747Cambridge 27,371,860 Inver Grove Heights 61,250,216Champlin 39,073,393 Isanti 9,980,573Chanhassen 46,251,440 Jordan 11,539,879Chaska 40,442,119 Kasson 10,332,111Chisago City 13,111,466 La Crescent 9,026,096Chisholm 14,035,608 Lake City 12,482,205Circle Pines 5,770,643 Lake Elmo 28,635,570Cloquet 37,812,695 Lakeville 128,520,370Columbia Heights 23,156,427 Lino Lakes 42,384,581Coon Rapids 97,872,848 Litchfield 15,906,928Corcoran 18,500,765 Little Canada 19,716,723Cottage Grove 67,252,478 Little Falls 35,821,925Crookston 29,692,963 Mahtomedi 11,598,950Crystal 29,149,728 Mankato 93,087,025Dayton 14,005,720 Maple Grove 120,012,112Delano 13,268,974 Maplewood 75,057,337Detroit Lakes 44,173,734 Marshall 36,404,821Duluth 276,287,492 Medina 14,653,764Eagan 113,236,688 Mendota Heights 25,733,325East Bethel 41,364,069 Minneapolis 568,986,203East Grand Forks 36,972,348 Minnetonka 96,829,199Eden Prairie 98,901,083 Minnetrista 20,839,975
2017 ADJUSTED RESTRICTED CONSTRUCTION NEEDS RECOMMENDATIONS
for the 2018 Distribution
Adjusted Restricted Construction Needs
Adjusted Restricted Construction NeedsMunicipality Municipality
61

Adjusted Restricted Construction Needs
Adjusted Restricted Construction NeedsMunicipality Municipality
Montevideo $14,274,554 Savage $49,902,903Monticello 23,221,551 Shakopee 72,493,119Moorhead 126,833,874 Shoreview 34,111,557Morris 14,818,340 Shorewood 16,117,471Mound 15,579,796 South St. Paul 28,058,988Mounds View 17,399,852 Spring Lake Park 9,140,891New Brighton 25,138,144 St. Anthony 12,903,062New Hope 26,031,597 St. Cloud 152,251,304New Prague 11,410,748 St. Francis 24,865,974New Ulm 34,182,515 St. Joseph 4,650,701North Branch 45,113,880 St. Louis Park 77,076,398North Mankato 31,877,783 St. Michael 46,853,760North St. Paul 20,065,039 St. Paul 465,569,547Northfield 30,738,417 St. Paul Park 11,416,590Oak Grove 37,322,066 St. Peter 28,813,181Oakdale 29,048,051 Stewartville 6,897,298Orono 17,414,971 Stillwater 33,065,936Otsego 37,952,589 Thief River Falls 40,906,008Owatonna 67,930,805 Vadnais Heights 16,102,595Plymouth 144,206,882 Victoria 11,693,953Prior Lake 35,619,939 Virginia 30,991,783Ramsey 56,009,304 Waconia 23,593,730Red Wing 49,127,486 Waite Park 14,207,213Redwood Falls 16,052,902 Waseca 13,153,755Richfield 62,050,993 West St. Paul 25,506,607Robbinsdale 18,895,108 White Bear Lake 34,976,137Rochester 275,788,189 Willmar 58,626,384Rogers 37,514,640 Winona 47,873,239Rosemount 48,911,608 Woodbury 126,880,340Roseville 52,691,267 Worthington 19,315,902Sartell 37,391,338 Wyoming 24,933,799Sauk Rapids 32,538,907 Zimmerman 8,919,487
State Total $7,578,997,927
N:\MSAS\Books\2017 October Book\Adj Rest Constr Needs 2017 (Old Book File A & B).xls
62

THTurnback %
Construction Main- OfNeeds tenance Total
Municipality Allocations Allowance Dist.Albert Lea $46,795,125 $534,752 $534,752 0.617Albertville 13,590,010 155,300 155,300 0.179Alexandria 63,100,180 721,079 721,079 0.833Andover 65,638,191 750,082 750,082 0.866Anoka 30,601,196 349,696 349,696 0.404Apple Valley 79,133,156 904,296 904,296 1.044Arden Hills 11,819,987 135,073 135,073 0.156Austin 63,678,547 727,688 727,688 0.840Baxter 32,007,820 365,770 365,770 0.422Belle Plaine 17,169,883 196,209 196,209 0.227Bemidji 37,451,531 427,978 427,978 0.494Big Lake 17,589,216 201,001 201,001 0.232Blaine 91,182,038 1,041,985 1,041,985 1.203Bloomington 176,357,357 2,015,328 2,015,328 2.327Brainerd 40,047,873 457,648 457,648 0.528Brooklyn Center 34,019,424 388,758 388,758 0.449Brooklyn Park 100,295,235 1,146,126 1,146,126 1.323Buffalo 34,577,763 395,138 395,138 0.456Burnsville 100,944,477 1,153,545 1,153,545 1.332Byron 9,754,115 111,465 111,465 0.129Cambridge 27,371,860 312,793 312,793 0.361Champlin 39,073,393 446,512 446,512 0.516Chanhassen 46,251,440 528,539 528,539 0.610Chaska 40,442,119 462,153 462,153 0.534Chisago City 13,111,466 149,832 149,832 0.173Chisholm 14,035,608 160,392 160,392 0.185Circle Pines 5,770,643 65,944 65,944 0.076Cloquet 37,812,695 432,105 432,105 0.499Columbia Heights 23,156,427 264,621 264,621 0.306Coon Rapids 97,872,848 1,118,444 1,118,444 1.291Corcoran 18,500,765 211,418 211,418 0.244Cottage Grove 67,252,478 768,529 768,529 0.887Crookston 29,692,963 339,317 339,317 0.392Crystal 29,149,728 333,109 333,109 0.385Dayton 14,005,720 160,051 160,051 0.185Delano 13,268,974 151,632 151,632 0.175Detroit Lakes 44,173,734 504,796 504,796 0.583Duluth 276,287,492 3,157,282 3,157,282 3.645Eagan 113,236,688 1,294,015 1,294,015 1.494East Bethel 41,364,069 472,689 472,689 0.546East Grand Forks 36,972,348 422,502 422,502 0.488Eden Prairie 98,901,083 1,130,195 1,130,195 1.305Edina 94,598,968 1,081,032 1,081,032 1.248Elk River 76,011,925 868,628 868,628 1.003Fairmont 38,102,674 435,419 435,419 0.503Falcon Heights 5,398,624 61,693 61,693 0.071Faribault 52,286,318 597,503 597,503 0.690Farmington 29,348,398 335,380 335,380 0.387
TENTATIVE 2018 CONSTRUCTION NEEDS ALLOCATIONS Needs Value: $1,000 in Construction Needs = approximately $11.43 in apportionment
The following table shows each municipality's tenative Money Needs Allocation based on a projected apportionment amount ($86,609,182). The actual amount of the Road User Fund for distribution to the Municipal State Aid account will not be available until January, 2018. This summary provides data and shows the impact of the Restriction and Adjustments to each municipality for the Board's use in establishing the 2018 Money Needs Apportionment Determination.
Adjusted Restricted
Construction Needs
2018 Construction
Needs Allocations
63

THTurnback %
Construction Main- OfNeeds tenance Total
Municipality Allocations Allowance Dist.
Adjusted Restricted
Construction Needs
2018 Construction
Needs Allocations
Fergus Falls $58,341,405 $666,698 $666,698 0.770Forest Lake 60,293,982 689,011 689,011 0.796Fridley 39,895,180 455,903 455,903 0.526Glencoe 13,561,695 154,977 154,977 0.179Golden Valley 46,470,155 531,039 531,039 0.613Grand Rapids 56,468,471 645,295 645,295 0.745Ham Lake 46,588,249 532,388 532,388 0.615Hastings 30,303,544 346,294 346,294 0.400Hermantown 33,965,941 388,147 388,147 0.448Hibbing 83,348,279 952,464 952,464 1.100Hopkins 22,198,927 253,679 253,679 0.293Hugo 32,859,131 375,499 375,499 0.434Hutchinson 40,015,016 457,273 457,273 0.528International Falls 11,660,747 133,253 133,253 0.154Inver Grove Heights 61,250,216 699,938 699,938 0.808Isanti 9,980,573 114,053 114,053 0.132Jordan 11,539,879 131,872 131,872 0.152Kasson 10,332,111 118,070 118,070 0.136La Crescent 9,026,096 103,146 103,146 0.119Lake City 12,482,205 142,641 142,641 0.165Lake Elmo 28,635,570 327,234 327,234 0.378Lakeville 128,520,370 1,468,670 1,468,670 1.696Lino Lakes 42,384,581 484,351 484,351 0.559Litchfield 15,906,928 181,777 181,777 0.210Little Canada 19,716,723 225,313 225,313 0.260Little Falls 35,821,925 409,356 409,356 0.473Mahtomedi 11,598,950 132,547 132,547 0.153Mankato 93,087,025 1,063,754 1,063,754 1.228Maple Grove 120,012,112 1,371,441 1,371,441 1.583Maplewood 75,057,337 857,720 857,720 0.990Marshall 36,404,821 416,017 416,017 0.480Medina 14,653,764 167,456 167,456 0.193Mendota Heights 25,733,325 294,068 294,068 0.340Minneapolis 568,986,203 6,502,104 6,502,104 7.507Minnetonka 96,829,199 1,106,518 1,106,518 1.278Minnetrista 20,839,975 238,149 238,149 0.275Montevideo 14,274,554 163,123 163,123 0.188Monticello 23,221,551 265,365 265,365 0.306Moorhead 126,833,874 1,449,397 1,449,397 1.673Morris 14,818,340 169,337 169,337 0.196Mound 15,579,796 178,038 178,038 0.206Mounds View 17,399,852 198,837 198,837 0.230New Brighton 25,138,144 287,267 287,267 0.332New Hope 26,031,597 297,477 297,477 0.343New Prague 11,410,748 130,397 130,397 0.151New Ulm 34,182,515 390,622 390,622 0.451North Branch 45,113,880 515,540 515,540 0.595North Mankato 31,877,783 364,284 364,284 0.421North St. Paul 20,065,039 229,294 229,294 0.265Northfield 30,738,417 351,264 351,264 0.406Oak Grove 37,322,066 426,499 426,499 0.492Oakdale 29,048,051 331,947 331,947 0.383Orono 17,414,971 199,010 199,010 0.230Otsego 37,952,589 433,704 433,704 0.501Owatonna 67,930,805 776,281 776,281 0.896Plymouth 144,206,882 1,647,928 1,647,928 1.903Prior Lake 35,619,939 407,048 407,048 0.470Ramsey 56,009,304 640,048 640,048 0.739
64

THTurnback %
Construction Main- OfNeeds tenance Total
Municipality Allocations Allowance Dist.
Adjusted Restricted
Construction Needs
2018 Construction
Needs Allocations
Red Wing $49,127,486 $561,406 $561,406 0.648Redwood Falls 16,052,902 183,445 183,445 0.212Richfield 62,050,993 709,089 709,089 0.819Robbinsdale 18,895,108 215,924 215,924 0.249Rochester 275,788,189 3,151,576 3,151,576 3.639Rogers 37,514,640 428,699 428,699 0.495Rosemount 48,911,608 558,939 558,939 0.645Roseville 52,691,267 602,131 602,131 0.695Sartell 37,391,338 427,290 427,290 0.493Sauk Rapids 32,538,907 371,839 371,839 0.429Savage 49,902,903 570,267 570,267 0.658Shakopee 72,493,119 828,417 828,417 0.957Shoreview 34,111,557 389,811 389,811 0.450Shorewood 16,117,471 184,183 184,183 0.213South St. Paul 28,058,988 320,645 320,645 0.370Spring Lake Park 9,140,891 104,458 104,458 0.121St. Anthony 12,903,062 147,450 147,450 0.170St. Cloud 152,251,304 1,739,855 1,739,855 2.009St. Francis 24,865,974 284,157 284,157 0.328St. Joseph 4,650,701 53,146 53,146 0.061St. Louis Park 77,076,398 880,792 880,792 1.017St. Michael 46,853,760 535,422 535,422 0.618St. Paul 465,569,547 5,320,307 5,320,307 6.143St. Paul Park 11,416,590 130,463 130,463 0.151St. Peter 28,813,181 329,263 329,263 0.380Stewartville 6,897,298 78,819 78,819 0.091Stillwater 33,065,936 377,862 377,862 0.436Thief River Falls 40,906,008 467,454 467,454 0.540Vadnais Heights 16,102,595 184,013 184,013 0.212Victoria 11,693,953 133,633 133,633 0.154Virginia 30,991,783 354,159 354,159 0.409Waconia 23,593,730 269,618 269,618 0.311Waite Park 14,207,213 162,353 162,353 0.187Waseca 13,153,755 150,315 150,315 0.174West St. Paul 25,506,607 291,477 291,477 0.337White Bear Lake 34,976,137 399,691 399,691 0.461Willmar 58,626,384 669,954 669,954 0.774Winona 47,873,239 547,073 547,073 0.632Woodbury 126,880,340 1,449,928 1,449,928 1.674Worthington 19,315,902 220,733 220,733 0.255Wyoming 24,933,799 284,933 284,933 0.329Zimmerman 8,919,487 101,929 101,929 0.118State Total $7,578,997,927 $86,609,182 $0 $86,609,182 100.0000 Total Money Needs Apportionment = $86,609,182Total Construction Needs = $7,578,997,927Prorate based on $86,609,182 / $7,578,997,927 = 0.011427524
Construction Needs Allocation = 0.011427524 x Adjusted Restricted Construction Needs + THTB Maintenance Allowance
NOTE: Last year's Total "Adjusted Restricted Construction Needs" were $7,403,345,739
N:\MSAS\Books\2017 October Book\Adjusted Construction Needs 2017 (Old Book File A & B).xls 86,609,182 100.0000
65

23-Aug-17
2017 2018 Construction Construction %
Needs Needs Increase IncreaseMunicipality Allocations Allocations (Decrease) (Decrease)Albert Lea $540,929 $534,752 ($6,177) (1.1)Albertville 156,044 155,300 (744) (0.5)Alexandria 702,990 721,079 18,089 2.6Andover 781,372 750,082 (31,290) (4.0)Anoka 357,106 349,696 (7,410) (2.1)Apple Valley 889,116 904,296 15,180 1.7Arden Hills 132,055 135,073 3,018 2.3Austin 744,012 727,688 (16,324) (2.2)Baxter 359,298 365,770 6,472 1.8Belle Plaine 187,599 196,209 8,610 4.6Bemidji 396,153 427,978 31,825 8.0Big Lake 191,386 201,001 9,615 5.0Blaine 957,017 1,041,985 84,968 8.9Bloomington 2,098,745 2,015,328 (83,417) (4.0)Brainerd 466,155 457,648 (8,507) (1.8)Brooklyn Center 351,863 388,758 36,895 10.5Brooklyn Park 1,037,446 1,146,126 108,680 10.5Buffalo 412,267 395,138 (17,129) (4.2)Burnsville 1,180,712 1,153,545 (27,167) (2.3)Byron 101,621 111,465 9,844 9.7Cambridge 283,135 312,793 29,658 10.5Champlin 440,451 446,512 6,061 1.4Chanhassen 481,156 528,539 47,383 9.8Chaska 459,849 462,153 2,304 0.5Chisago City 139,282 149,832 10,550 7.6Chisholm 167,553 160,392 (7,161) (4.3)Circle Pines 64,290 65,944 1,654 2.6Cloquet 416,634 432,105 15,471 3.7Columbia Heights 276,434 264,621 (11,813) (4.3)Coon Rapids 1,115,212 1,118,444 3,232 0.3Corcoran 241,957 211,418 (30,539) (12.6)Cottage Grove 751,023 768,529 17,506 2.3Crookston 357,166 339,317 (17,849) (5.0)Crystal 316,327 333,109 16,782 5.3Dayton 145,915 160,051 14,136 9.7Delano 158,401 151,632 (6,769) (4.3)Detroit Lakes 460,186 504,796 44,610 9.7Duluth 3,322,321 3,157,282 (165,039) (5.0)Eagan 1,352,977 1,294,015 (58,962) (4.4)East Bethel 493,592 472,689 (20,903) (4.2)East Grand Forks 441,330 422,502 (18,828) (4.3)Eden Prairie 1,229,279 1,130,195 (99,084) (8.1)Edina 1,046,477 1,081,032 34,555 3.3Elk River 863,903 868,628 4,725 0.5Fairmont 433,628 435,419 1,791 0.4Falcon Heights 60,620 61,693 1,073 1.8Faribault 619,759 597,503 (22,256) (3.6)Farmington 350,352 335,380 (14,972) (4.3)
COMPARISON OF 2017 to 2018CONSTRUCTION NEEDS ALLOCATIONS
66

2017 2018 Construction Construction %
Needs Needs Increase IncreaseMunicipality Allocations Allocations (Decrease) (Decrease)Fergus Falls $682,876 $666,698 ($16,178) (2.4)Forest Lake 725,346 689,011 (36,335) (5.0)Fridley 454,432 455,903 1,471 0.3Glencoe 158,545 154,977 (3,568) (2.3)Golden Valley 551,218 531,039 (20,179) (3.7)Grand Rapids 678,035 645,295 (32,740) (4.8)Ham Lake 520,384 532,388 12,004 2.3Hastings 315,818 346,294 30,476 9.6Hermantown 401,253 388,147 (13,106) (3.3)Hibbing 928,700 952,464 23,764 2.6Hopkins 249,633 253,679 4,046 1.6Hugo 366,023 375,499 9,476 2.6Hutchinson 416,886 457,273 40,387 9.7International Falls 131,660 133,253 1,593 1.2Inver Grove Heights 736,193 699,938 (36,255) (4.9)Isanti 112,062 114,053 1,991 1.8Jordan 137,759 131,872 (5,887) (4.3)Kasson 118,331 118,070 (261) (0.2)La Crescent 108,524 103,146 (5,378) (5.0)Lake City 139,021 142,641 3,620 2.6Lake Elmo 298,333 327,234 28,901 9.7Lakeville 1,360,610 1,468,670 108,060 7.9Lino Lakes 505,887 484,351 (21,536) (4.3)Litchfield 191,273 181,777 (9,496) (5.0)Little Canada 219,907 225,313 5,406 2.5Little Falls 402,709 409,356 6,647 1.7Mahtomedi 136,701 132,547 (4,154) (3.0)Mankato 1,045,512 1,063,754 18,242 1.7Maple Grove 1,369,636 1,371,441 1,805 0.1Maplewood 869,895 857,720 (12,175) (1.4)Marshall 413,590 416,017 2,427 0.6Medina 152,719 167,456 14,737 9.6Mendota Heights 298,216 294,068 (4,148) (1.4)Minneapolis 6,731,861 6,502,104 (229,757) (3.4)Minnetonka 1,111,810 1,106,518 (5,292) (0.5)Minnetrista 231,629 238,149 6,520 2.8Montevideo 158,737 163,123 4,386 2.8Monticello 242,277 265,365 23,088 9.5Moorhead 1,489,749 1,449,397 (40,352) (2.7)Morris 166,319 169,337 3,018 1.8Mound 185,987 178,038 (7,949) (4.3)Mounds View 193,729 198,837 5,108 2.6New Brighton 300,091 287,267 (12,824) (4.3)New Hope 289,911 297,477 7,566 2.6New Prague 125,124 130,397 5,273 4.2New Ulm 411,163 390,622 (20,541) (5.0)North Branch 542,460 515,540 (26,920) (5.0)North Mankato 355,049 364,284 9,235 2.6North Saint Paul 241,126 229,294 (11,832) (4.9)Northfield 354,434 351,264 (3,170) (0.9)Oak Grove 443,657 426,499 (17,158) (3.9)Oakdale 302,656 331,947 29,291 9.7Orono 185,461 199,010 13,549 7.3
67

2017 2018 Construction Construction %
Needs Needs Increase IncreaseMunicipality Allocations Allocations (Decrease) (Decrease)Otsego $440,130 $433,704 ($6,426) (1.5)Owatonna 773,502 776,281 2,779 0.4Plymouth 1,529,036 1,647,928 118,892 7.8Prior Lake 397,438 407,048 9,610 2.4Ramsey 632,236 640,048 7,812 1.2Red Wing 557,154 561,406 4,252 0.8Redwood Falls 182,467 183,445 978 0.5Richfield 709,454 709,089 (365) (0.1)Robbinsdale 215,556 215,924 368 0.2Rochester 2,964,493 3,151,576 187,083 6.3Rogers 439,059 428,699 (10,360) (2.4)Rosemount 586,248 558,939 (27,309) (4.7)Roseville 575,131 602,131 27,000 4.7Sartell 418,512 427,290 8,778 2.1Sauk Rapids 358,116 371,839 13,723 3.8Savage 530,237 570,267 40,030 7.5Shakopee 749,797 828,417 78,620 10.5Shoreview 379,764 389,811 10,047 2.6Shorewood 180,760 184,183 3,423 1.9South Saint Paul 342,173 320,645 (21,528) (6.3)Spring Lake Park 94,544 104,458 9,914 10.5Saint Anthony 147,460 147,450 (10) (0.0)Saint Cloud 1,679,545 1,739,855 60,310 3.6Saint Francis 298,996 284,157 (14,839) (5.0)Saint Joseph 48,469 53,146 4,677 9.6Saint Louis Park 864,379 880,792 16,413 1.9Saint Michael 563,587 535,422 (28,165) (5.0)Saint Paul 5,608,359 5,320,307 (288,052) (5.1)Saint Paul Park 125,815 130,463 4,648 3.7Saint Peter 343,719 329,263 (14,456) (4.2)Stewartville 76,824 78,819 1,995 2.6Stillwater 371,371 377,862 6,491 1.7Thief River Falls 487,181 467,454 (19,727) (4.0)Vadnais Heights 173,615 184,013 10,398 6.0Victoria 121,872 133,633 11,761 9.7Virginia 339,489 354,159 14,670 4.3Waconia 245,890 269,618 23,728 9.6Waite Park 148,375 162,353 13,978 9.4Waseca 151,893 150,315 (1,578) (1.0)West St. Paul 263,815 291,477 27,662 10.5White Bear Lake 361,759 399,691 37,932 10.5Willmar 682,355 669,954 (12,401) (1.8)Winona 541,656 547,073 5,417 1.0Woodbury 1,488,179 1,449,928 (38,251) (2.6)Worthington 238,457 220,733 (17,724) (7.4)Wyoming 279,824 284,933 5,109 1.8Zimmerman 106,479 101,929 (4,550) (4.3)TOTAL $86,609,182 $86,609,182 $0 0.000
8662
N:\MSAS\BOOK\2017 October BOOK\Adjusted Constr Needs 2017 (Old Book File A&B).XLSX
Cities Decreased Their Constuction Needs Allocation Cities Increased Their Constuction Needs Allocation
68

23-Aug-17
MunicipalityAlbert Lea $398,940 $534,752 $933,692 0.5390Albertville 162,936 155,300 318,236 0.1837Alexandria 300,117 721,079 1,021,196 0.5895Andover 714,864 750,082 1,464,946 0.8457Anoka 397,835 349,696 747,531 0.4316Apple Valley 1,134,984 904,296 2,039,280 1.1773Arden Hills 220,329 135,073 355,402 0.2052Austin 555,001 727,688 1,282,689 0.7405Baxter 183,895 365,770 549,665 0.3173Belle Plaine 152,568 196,209 348,777 0.2014Bemidji 334,252 427,978 762,230 0.4400Big Lake 241,376 201,001 442,377 0.2554Blaine 1,419,072 1,041,985 2,461,057 1.4208Bloomington 1,952,120 2,015,328 3,967,448 2.2904Brainerd 302,416 457,648 760,064 0.4388Brooklyn Center 690,457 388,758 1,079,215 0.6230Brooklyn Park 1,778,594 1,146,126 2,924,720 1.6885Buffalo 356,360 395,138 751,498 0.4338Burnsville 1,367,362 1,153,545 2,520,907 1.4553Byron 121,550 111,465 233,015 0.1345Cambridge 193,423 312,793 506,216 0.2922Champlin 516,069 446,512 962,581 0.5557Chanhassen 562,606 528,539 1,091,145 0.6299Chaska 584,515 462,153 1,046,668 0.6042Chisago City 116,554 149,832 266,386 0.1538Chisholm 110,540 160,392 270,932 0.1564Circle Pines 110,540 65,944 176,484 0.1019Cloquet 271,951 432,105 704,056 0.4065Columbia Heights 445,654 264,621 710,275 0.4100Coon Rapids 1,386,750 1,118,444 2,505,194 1.4463Corcoran 121,550 211,418 332,968 0.1922Cottage Grove 794,542 768,529 1,563,071 0.9024Crookston 175,649 339,317 514,966 0.2973Crystal 505,280 333,109 838,389 0.4840Dayton 114,232 160,051 274,283 0.1583Delano 131,477 151,632 283,109 0.1634Detroit Lakes 207,374 504,796 712,170 0.4111Duluth 1,920,284 3,157,282 5,077,566 2.9313Eagan 1,508,278 1,294,015 2,802,293 1.6178East Bethel 260,610 472,689 733,299 0.4233East Grand Forks 195,502 422,502 618,004 0.3568Eden Prairie 1,396,412 1,130,195 2,526,607 1.4586Edina 1,145,286 1,081,032 2,226,318 1.2853Elk River 538,729 868,628 1,407,357 0.8125Fairmont 235,805 435,419 671,224 0.3875
TENTATIVE 2018 MSAS TOTAL ALLOCATIONSThe tentative allocations are for informational purposes only. The actual revenue will be announced
2018 Construction Needs Allocations
2018 Total Allocations
in January 2018 when the Commissioner of Transportation determines the annual allotments.
2018 Population Allocations
Distribution Percentage
69

Municipality2018 Construction Needs Allocations
2018 Total Allocations
2018 Population Allocations
Distribution Percentage
Falcon Heights $119,781 $61,693 $181,474 0.1048Faribault 524,359 597,503 1,121,862 0.6477Farmington 493,960 335,380 829,340 0.4788Fergus Falls 301,819 666,698 968,517 0.5591Forest Lake 449,766 689,011 1,138,777 0.6574Fridley 632,976 455,903 1,088,879 0.6286Glencoe 124,491 154,977 279,468 0.1613Golden Valley 476,561 531,039 1,007,600 0.5817Grand Rapids 252,806 645,295 898,101 0.5185Ham Lake 351,319 532,388 883,707 0.5102Hastings 495,221 346,294 841,515 0.4858Hermantown 210,181 388,147 598,328 0.3454Hibbing 361,710 952,464 1,314,174 0.7587Hopkins 420,053 253,679 673,732 0.3889Hugo 322,888 375,499 698,387 0.4032Hutchinson 313,492 457,273 770,765 0.4450International Falls 142,022 133,253 275,275 0.1589Inver Grove Heights 773,760 699,938 1,473,698 0.8508Isanti 124,115 114,053 238,168 0.1375Jordan 137,357 131,872 269,229 0.1554Kasson 139,237 118,070 257,307 0.1485La Crescent 114,387 103,146 217,533 0.1256Lake City 113,392 142,641 256,033 0.1478Lake Elmo 193,401 327,234 520,635 0.3006Lakeville 1,347,818 1,468,670 2,816,488 1.6260Lino Lakes 459,914 484,351 944,265 0.5451Litchfield 148,920 181,777 330,697 0.1909Little Canada 223,314 225,313 448,627 0.2590Little Falls 196,541 409,356 605,897 0.3498Mahtomedi 177,528 132,547 310,075 0.1790Mankato 946,291 1,063,754 2,010,045 1.1604Maple Grove 1,467,998 1,371,441 2,839,439 1.6392Maplewood 889,695 857,720 1,747,415 1.0088Marshall 305,069 416,017 721,086 0.4163Medina 135,545 167,456 303,001 0.1749Mendota Heights 249,445 294,068 543,513 0.3138Minneapolis 9,284,326 6,502,104 15,786,430 9.1136Minnetonka 1,166,001 1,106,518 2,272,519 1.3119Minnetrista 160,018 238,149 398,167 0.2299Montevideo 119,008 163,123 282,131 0.1629Monticello 296,447 265,365 561,812 0.3243Moorhead 941,383 1,449,397 2,390,780 1.3802Morris 120,312 169,337 289,649 0.1672Mound 207,175 178,038 385,213 0.2224Mounds View 290,964 198,837 489,801 0.2828New Brighton 500,040 287,267 787,307 0.4545New Hope 477,534 297,477 775,011 0.4474New Prague 167,690 130,397 298,087 0.1721New Ulm 299,321 390,622 689,943 0.3983North Branch 231,449 515,540 746,989 0.4312North Mankato 305,379 364,284 669,663 0.3866North St. Paul 266,822 229,294 496,116 0.2864
70

Municipality2018 Construction Needs Allocations
2018 Total Allocations
2018 Population Allocations
Distribution Percentage
Northfield $450,010 $351,264 $801,274 0.4626Oak Grove 184,823 426,499 611,322 0.3529Oakdale 617,633 331,947 949,580 0.5482Orono 170,033 199,010 369,043 0.2131Otsego 354,149 433,704 787,853 0.4548Owatonna 571,759 776,281 1,348,040 0.7782Plymouth 1,668,098 1,647,928 3,316,026 1.9144Prior Lake 564,198 407,048 971,246 0.5607Ramsey 580,359 640,048 1,220,407 0.7045Red Wing 365,778 561,406 927,184 0.5353Redwood Falls 116,200 183,445 299,645 0.1730Richfield 803,363 709,089 1,512,452 0.8731Robbinsdale 325,077 215,924 541,001 0.3123Rochester 2,505,529 3,151,576 5,657,105 3.2659Rogers 277,213 428,699 705,912 0.4075Rosemount 520,844 558,939 1,079,783 0.6234Roseville 792,265 602,131 1,394,396 0.8050Sartell 388,704 427,290 815,994 0.4711Sauk Rapids 301,355 371,839 673,194 0.3886Savage 669,543 570,267 1,239,810 0.7157Shakopee 898,538 828,417 1,726,955 0.9970Shoreview 582,901 389,811 972,712 0.5616Shorewood 165,722 184,183 349,905 0.2020South St. Paul 451,159 320,645 771,804 0.4456Spring Lake Park 141,757 104,458 246,215 0.1421St. Anthony 204,146 147,450 351,596 0.2030St. Cloud 1,488,845 1,739,855 3,228,700 1.8639St. Francis 163,600 284,157 447,757 0.2585St. Joseph 148,986 53,146 202,132 0.1167St. Louis Park 1,081,681 880,792 1,962,473 1.1329St. Michael 379,684 535,422 915,106 0.5283St. Paul 6,730,623 5,320,307 12,050,930 6.9571St. Paul Park 122,014 130,463 252,477 0.1458St. Peter 261,030 329,263 590,293 0.3408Stewartville 138,595 78,819 217,414 0.1255Stillwater 435,374 377,862 813,236 0.4695Thief River Falls 195,546 467,454 663,000 0.3828Vadnais Heights 285,415 184,013 469,428 0.2710Victoria 197,204 133,633 330,837 0.1910Virginia 192,605 354,159 546,764 0.3157Waconia 268,967 269,618 538,585 0.3109Waite Park 168,884 162,353 331,237 0.1912Waseca 208,081 150,315 358,396 0.2069West St. Paul 461,749 291,477 753,226 0.4348White Bear Lake 552,724 399,691 952,415 0.5498Willmar 439,752 669,954 1,109,706 0.6406Winona 610,492 547,073 1,157,565 0.6683Woodbury 1,511,064 1,449,928 2,960,992 1.7094Worthington 293,773 220,733 514,506 0.2970Wyoming 174,787 284,933 459,720 0.2654Zimmerman 120,910 101,929 222,839 0.1286Total $86,609,182 $86,609,182 $173,218,364 100.0000N/MSAS/Books/2017 October Book/Adjusted Construction Needs 2017 (Old Book File A & B).xlsx
71

8/23/2017
Increase %2017 Total 2018 Total (Decrease) Increase
Municipality Allocations Allocations Amount (Decrease)
Albert Lea $943,643 $933,692 ($9,951) (1.1)Albertville 319,602 318,236 (1,366) (0.4)Alexandria 1,001,181 1,021,196 20,015 2.0Andover 1,490,056 1,464,946 (25,110) (1.7)Anoka 751,974 747,531 (4,443) (0.6)Apple Valley 2,010,372 2,039,280 28,908 1.4Arden Hills 352,166 355,402 3,236 0.9Austin 1,305,322 1,282,689 (22,633) (1.7)Baxter 539,576 549,665 10,089 1.9Belle Plaine 338,304 348,777 10,473 3.1Bemidji 730,757 762,230 31,473 4.3Big Lake 429,916 442,377 12,461 2.9Blaine 2,369,289 2,461,057 91,768 3.9Bloomington 4,048,476 3,967,448 (81,028) (2.0)Brainerd 771,790 760,064 (11,726) (1.5)Brooklyn Center 1,041,770 1,079,215 37,445 3.6Brooklyn Park 2,830,504 2,924,720 94,216 3.3Buffalo 770,700 751,498 (19,202) (2.5)Burnsville 2,564,550 2,520,907 (43,643) (1.7)Byron 222,417 233,015 10,598 4.8Cambridge 473,047 506,216 33,169 7.0Champlin 956,563 962,581 6,018 0.6Chanhassen 1,044,321 1,091,145 46,824 4.5Chaska 1,032,246 1,046,668 14,422 1.4Chisago City 254,535 266,386 11,851 4.7Chisholm 279,453 270,932 (8,521) (3.0)Circle Pines 176,056 176,484 428 0.2Cloquet 690,929 704,056 13,127 1.9Columbia Heights 723,385 710,275 (13,110) (1.8)Coon Rapids 2,512,887 2,505,194 (7,693) (0.3)Corcoran 364,340 332,968 (31,372) (8.6)Cottage Grove 1,546,706 1,563,071 16,365 1.1Crookston 534,963 514,966 (19,997) (3.7)Crystal 827,141 838,389 11,248 1.4Dayton 259,000 274,283 15,283 5.9Delano 289,480 283,109 (6,371) (2.2)Detroit Lakes 667,847 712,170 44,323 6.6Duluth 5,258,036 5,077,566 (180,470) (3.4)Eagan 2,862,015 2,802,293 (59,722) (2.1)East Bethel 756,487 733,299 (23,188) (3.1)East Grand Forks 637,456 618,004 (19,452) (3.1)Eden Prairie 2,641,707 2,526,607 (115,100) (4.4)Edina 2,181,257 2,226,318 45,061 2.1Elk River 1,400,088 1,407,357 7,269 0.5Fairmont 672,047 671,224 (823) (0.1)Falcon Heights 180,969 181,474 505 0.3Faribault 1,149,529 1,121,862 (27,667) (2.4)Farmington 852,202 829,340 (22,862) (2.7)
COMPARISON OF THE 2017 AND2018 TOTAL ALLOCATIONS
72

Increase %2017 Total 2018 Total (Decrease) Increase
Municipality Allocations Allocations Amount (Decrease)Fergus Falls $985,649 $968,517 ($17,132) (1.7)Forest Lake 1,178,243 1,138,777 (39,466) (3.3)Fridley 1,092,547 1,088,879 (3,668) (0.3)Glencoe 284,416 279,468 (4,948) (1.7)Golden Valley 1,033,398 1,007,600 (25,798) (2.5)Grand Rapids 930,201 898,101 (32,100) (3.5)Ham Lake 872,960 883,707 10,747 1.2Hastings 822,944 841,515 18,571 2.3Hermantown 618,526 598,328 (20,198) (3.3)Hibbing 1,294,420 1,314,174 19,754 1.5Hopkins 679,417 673,732 (5,685) (0.8)Hugo 686,835 698,387 11,552 1.7Hutchinson 733,854 770,765 36,911 5.0International Falls 275,257 275,275 18 0.0Inver Grove Heights 1,520,140 1,473,698 (46,442) (3.1)Isanti 234,937 238,168 3,231 1.4Jordan 275,231 269,229 (6,002) (2.2)Kasson 256,742 257,307 565 0.2La Crescent 223,956 217,533 (6,423) (2.9)Lake City 253,067 256,033 2,966 1.2Lake Elmo 491,531 520,635 29,104 5.9Lakeville 2,701,598 2,816,488 114,890 4.3Lino Lakes 964,551 944,265 (20,286) (2.1)Litchfield 342,403 330,697 (11,706) (3.4)Little Canada 442,120 448,627 6,507 1.5Little Falls 599,976 605,897 5,921 1.0Mahtomedi 312,061 310,075 (1,986) (0.6)Mankato 1,981,572 2,010,045 28,473 1.4Maple Grove 2,826,055 2,839,439 13,384 0.5Maplewood 1,758,254 1,747,415 (10,839) (0.6)Marshall 721,907 721,086 (821) (0.1)Medina 286,100 303,001 16,901 5.9Mendota Heights 546,448 543,513 (2,935) (0.5)Minneapolis 15,952,913 15,786,430 (166,483) (1.0)Minnetonka 2,266,283 2,272,519 6,236 0.3Minnetrista 388,749 398,167 9,418 2.4Montevideo 279,064 282,131 3,067 1.1Monticello 539,820 561,812 21,992 4.1Moorhead 2,426,368 2,390,780 (35,588) (1.5)Morris 287,428 289,649 2,221 0.8Mound 391,837 385,213 (6,624) (1.7)Mounds View 484,476 489,801 5,325 1.1New Brighton 795,660 787,307 (8,353) (1.0)New Hope 764,356 775,011 10,655 1.4New Prague 292,951 298,087 5,136 1.8New Ulm 714,786 689,943 (24,843) (3.5)North Branch 773,368 746,989 (26,379) (3.4)North Mankato 661,041 669,663 8,622 1.3North St. Paul 511,688 496,116 (15,572) (3.0)Northfield 808,650 801,274 (7,376) (0.9)Oak Grove 629,479 611,322 (18,157) (2.9)Oakdale 932,389 949,580 17,191 1.8Orono 352,528 369,043 16,515 4.7
73

Increase %2017 Total 2018 Total (Decrease) Increase
Municipality Allocations Allocations Amount (Decrease)Otsego $785,978 $787,853 $1,875 0.2Owatonna 1,349,811 1,348,040 (1,771) (0.1)Plymouth 3,196,402 3,316,026 119,624 3.7Prior Lake 957,362 971,246 13,884 1.5Ramsey 1,199,156 1,220,407 21,251 1.8Red Wing 926,741 927,184 443 0.0Redwood Falls 299,955 299,645 (310) (0.1)Richfield 1,526,618 1,512,452 (14,166) (0.9)Robbinsdale 545,421 541,001 (4,420) (0.8)Rochester 5,465,966 5,657,105 191,139 3.5Rogers 715,813 705,912 (9,901) (1.4)Rosemount 1,101,309 1,079,783 (21,526) (2.0)Roseville 1,362,945 1,394,396 31,451 2.3Sartell 803,187 815,994 12,807 1.6Sauk Rapids 657,872 673,194 15,322 2.3Savage 1,201,368 1,239,810 38,442 3.2Shakopee 1,649,600 1,726,955 77,355 4.7Shoreview 963,002 972,712 9,710 1.0Shorewood 347,470 349,905 2,435 0.7South St. Paul 797,082 771,804 (25,278) (3.2)Spring Lake Park 240,130 246,215 6,085 2.5St. Anthony 354,830 351,596 (3,234) (0.9)St. Cloud 3,177,474 3,228,700 51,226 1.6St. Francis 462,777 447,757 (15,020) (3.2)St. Joseph 199,844 202,132 2,288 1.1St. Louis Park 1,945,243 1,962,473 17,230 0.9St. Michael 945,401 915,106 (30,295) (3.2)St. Paul 12,322,193 12,050,930 (271,263) (2.2)St. Paul Park 247,438 252,477 5,039 2.0St. Peter 607,128 590,293 (16,835) (2.8)Stewartville 216,576 217,414 838 0.4Stillwater 812,935 813,236 301 0.0Thief River Falls 683,106 663,000 (20,106) (2.9)Vadnais Heights 452,806 469,428 16,622 3.7Victoria 318,021 330,837 12,816 4.0Virginia 534,230 546,764 12,534 2.3Waconia 508,584 538,585 30,001 5.9Waite Park 318,371 331,237 12,866 4.0Waseca 362,281 358,396 (3,885) (1.1)West St. Paul 715,840 753,226 37,386 5.2White Bear Lake 916,363 952,415 36,052 3.9Willmar 1,126,020 1,109,706 (16,314) (1.4)Winona 1,158,916 1,157,565 (1,351) (0.1)Woodbury 2,985,259 2,960,992 (24,267) (0.8)Worthington 533,698 514,506 (19,192) (3.6)Wyoming 455,901 459,720 3,819 0.8Zimmerman 225,734 222,839 (2,895) (1.3)Total $173,218,364 $173,218,364 $0 0.000
8068
N:\MSAS\Books\2017 October Book\Adjusted Construction Needs 2017 (Old Book File A & B).xls
Cities Decreased Their Total AllocationCities Increased Their Total Allocation
74
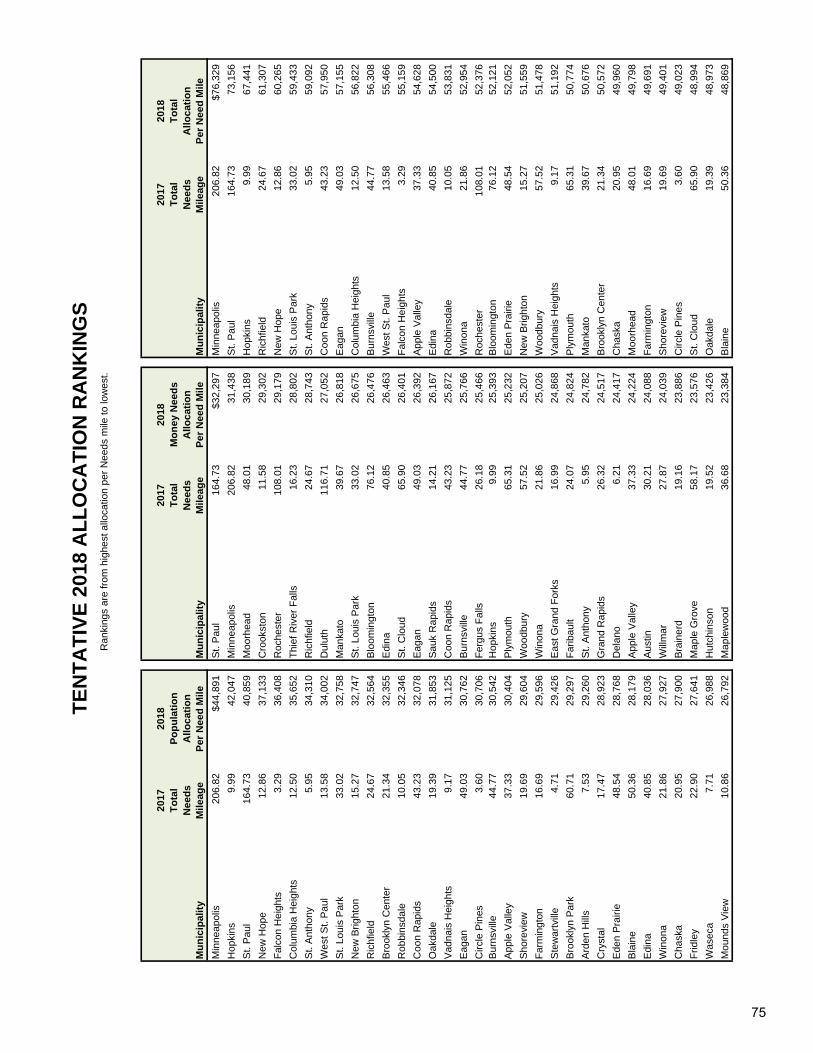
20
1720
18
20
1720
18
20
1720
18T
ota
lP
op
ula
tio
nT
ota
lM
on
ey N
eed
sT
ota
lT
ota
lN
eed
sA
lloca
tio
nN
eed
sA
lloca
tio
nN
eed
sA
lloca
tio
nM
un
icip
alit
yM
ileag
eP
er N
eed
Mile
Mu
nic
ipal
ity
Mile
age
Per
Nee
d M
ileM
un
icip
alit
yM
ileag
eP
er N
eed
Mile
Min
neap
olis
206.
82
$4
4,89
1S
t. P
aul
164.
73$3
2,29
7M
inne
apol
is20
6.82
$76,
329
Hop
kins
9.99
42
,047
Min
neap
olis
206.
8231
,438
St.
Pau
l16
4.73
73,1
56
St.
Pau
l16
4.73
40,8
59M
oorh
ead
48.0
130
,189
Hop
kins
9.99
67,4
41
New
Hop
e12
.86
37,1
33C
rook
ston
11.5
829
,302
Ric
hfie
ld24
.67
61,3
07
Fal
con
Hei
ghts
3.29
36
,408
Roc
hest
er10
8.01
29,1
79N
ew H
ope
12.8
660
,265
Col
umbi
a H
eigh
ts12
.50
35,6
52T
hief
Riv
er F
alls
16.2
328
,802
St.
Loui
s P
ark
33.0
259
,433
St.
Ant
hony
5.95
34
,310
Ric
hfie
ld24
.67
28,7
43S
t. A
ntho
ny5.
9559
,092
Wes
t St.
Pau
l13
.58
34,0
02D
ulut
h11
6.71
27,0
52C
oon
Rap
ids
43.2
357
,950
St.
Loui
s P
ark
33.0
2
32
,758
Man
kato
39.6
726
,818
Eag
an49
.03
57,1
55
New
Brig
hton
15.2
7
32
,747
St.
Loui
s P
ark
33.0
226
,675
Col
umbi
a H
eigh
ts12
.50
56,8
22
Ric
hfie
ld24
.67
32,5
64B
loom
ingt
on76
.12
26,4
76B
urns
ville
44.7
756
,308
Bro
okly
n C
ente
r21
.34
32,3
55E
dina
40.8
526
,463
Wes
t St.
Pau
l13
.58
55,4
66
Rob
bins
dale
10.0
5
32
,346
St.
Clo
ud65
.90
26,4
01F
alco
n H
eigh
ts3.
2955
,159
Coo
n R
apid
s43
.23
32,0
78E
agan
49.0
326
,392
App
le V
alle
y37
.33
54,6
28
Oak
dale
19.3
9
31
,853
Sau
k R
apid
s14
.21
26,1
67E
dina
40.8
554
,500
Vad
nais
Hei
ghts
9.17
31
,125
Coo
n R
apid
s43
.23
25,8
72R
obbi
nsda
le10
.05
53,8
31
Eag
an49
.03
30,7
62B
urns
ville
44.7
725
,766
Win
ona
21.8
652
,954
Circ
le P
ines
3.60
30
,706
Fer
gus
Fal
ls26
.18
25,4
66R
oche
ster
108.
0152
,376
Bur
nsvi
lle44
.77
30,5
42H
opki
ns9.
9925
,393
Blo
omin
gton
76.1
252
,121
App
le V
alle
y37
.33
30,4
04P
lym
outh
65.3
125
,232
Ede
n P
rairi
e48
.54
52,0
52
Sho
revi
ew19
.69
29,6
04W
oodb
ury
57.5
225
,207
New
Brig
hton
15.2
751
,559
Far
min
gton
16.6
9
29
,596
Win
ona
21.8
625
,026
Woo
dbur
y57
.52
51,4
78
Ste
war
tvill
e4.
71
29,4
26E
ast G
rand
For
ks16
.99
24,8
68V
adna
is H
eigh
ts9.
1751
,192
Bro
okly
n P
ark
60.7
1
29
,297
Far
ibau
lt24
.07
24,8
24P
lym
outh
65.3
150
,774
Ard
en H
ills
7.53
29
,260
St.
Ant
hony
5.95
24,7
82M
anka
to39
.67
50,6
76
Cry
stal
17.4
7
28
,923
Gra
nd R
apid
s26
.32
24,5
17B
rook
lyn
Cen
ter
21.3
450
,572
Ede
n P
rairi
e48
.54
28,7
68D
elan
o6.
2124
,417
Cha
ska
20.9
549
,960
Bla
ine
50.3
6
28
,179
App
le V
alle
y37
.33
24,2
24M
oorh
ead
48.0
149
,798
Edi
na40
.85
28,0
36A
ustin
30.2
124
,088
Far
min
gton
16.6
949
,691
Win
ona
21.8
6
27
,927
Will
mar
27.8
724
,039
Sho
revi
ew19
.69
49,4
01
Cha
ska
20.9
5
27
,900
Bra
iner
d19
.16
23,8
86C
ircle
Pin
es3.
6049
,023
Frid
ley
22.9
0
27
,641
Map
le G
rove
58.1
723
,576
St.
Clo
ud65
.90
48,9
94
Was
eca
7.71
26
,988
Hut
chin
son
19.5
223
,426
Oak
dale
19.3
948
,973
Mou
nds
Vie
w10
.86
26,7
92M
aple
woo
d36
.68
23,3
84B
lain
e50
.36
48,8
69
TE
NT
AT
IVE
201
8 A
LL
OC
AT
ION
RA
NK
ING
SR
anki
ngs
are
from
hig
hest
allo
catio
n pe
r N
eeds
mile
to lo
wes
t.
75
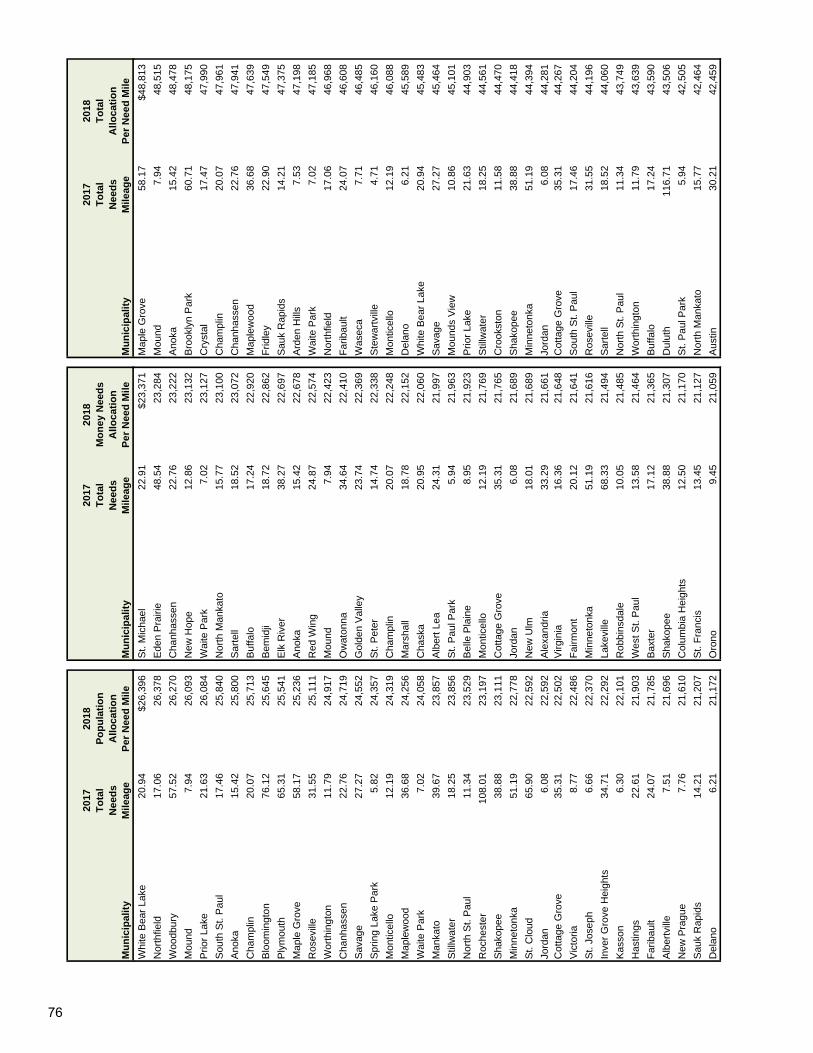
20
1720
18
20
1720
18
20
1720
18T
ota
lP
op
ula
tio
nT
ota
lM
on
ey N
eed
sT
ota
lT
ota
lN
eed
sA
lloca
tio
nN
eed
sA
lloca
tio
nN
eed
sA
lloca
tio
nM
un
icip
alit
yM
ileag
eP
er N
eed
Mile
Mu
nic
ipal
ity
Mile
age
Per
Nee
d M
ileM
un
icip
alit
yM
ileag
eP
er N
eed
Mile
Whi
te B
ear
Lake
20.9
4
$2
6,39
6S
t. M
icha
el22
.91
$23,
371
Map
le G
rove
58.1
7$4
8,81
3
Nor
thfie
ld17
.06
26,3
78E
den
Pra
irie
48.5
423
,284
Mou
nd7.
9448
,515
Woo
dbur
y57
.52
26,2
70C
hanh
asse
n22
.76
23,2
22A
noka
15.4
248
,478
Mou
nd7.
94
26,0
93N
ew H
ope
12.8
623
,132
Bro
okly
n P
ark
60.7
148
,175
Prio
r La
ke21
.63
26,0
84W
aite
Par
k7.
0223
,127
Cry
stal
17.4
747
,990
Sou
th S
t. P
aul
17.4
6
25
,840
Nor
th M
anka
to15
.77
23,1
00C
ham
plin
20.0
747
,961
Ano
ka15
.42
25,8
00S
arte
ll18
.52
23,0
72C
hanh
asse
n22
.76
47,9
41
Cha
mpl
in20
.07
25,7
13B
uffa
lo17
.24
22,9
20M
aple
woo
d36
.68
47,6
39
Blo
omin
gton
76.1
2
25
,645
Bem
idji
18.7
222
,862
Frid
ley
22.9
047
,549
Ply
mou
th65
.31
25,5
41E
lk R
iver
38.2
722
,697
Sau
k R
apid
s14
.21
47,3
75
Map
le G
rove
58.1
7
25
,236
Ano
ka15
.42
22,6
78A
rden
Hill
s7.
5347
,198
Ros
evill
e31
.55
25,1
11R
ed W
ing
24.8
722
,574
Wai
te P
ark
7.02
47,1
85
Wor
thin
gton
11.7
9
24
,917
Mou
nd7.
9422
,423
Nor
thfie
ld17
.06
46,9
68
Cha
nhas
sen
22.7
6
24
,719
Ow
aton
na34
.64
22,4
10F
arib
ault
24.0
746
,608
Sav
age
27.2
7
24
,552
Gol
den
Val
ley
23.7
422
,369
Was
eca
7.71
46,4
85
Spr
ing
Lake
Par
k5.
82
24,3
57S
t. P
eter
14.7
422
,338
Ste
war
tvill
e4.
7146
,160
Mon
ticel
lo12
.19
24,3
19C
ham
plin
20.0
722
,248
Mon
ticel
lo12
.19
46,0
88
Map
lew
ood
36.6
8
24
,256
Mar
shal
l18
.78
22,1
52D
elan
o6.
2145
,589
Wai
te P
ark
7.02
24
,058
Cha
ska
20.9
522
,060
Whi
te B
ear
Lake
20.9
445
,483
Man
kato
39.6
7
23
,857
Alb
ert L
ea24
.31
21,9
97S
avag
e27
.27
45,4
64
Stil
lwat
er18
.25
23,8
56S
t. P
aul P
ark
5.94
21,9
63M
ound
s V
iew
10.8
645
,101
Nor
th S
t. P
aul
11.3
4
23
,529
Bel
le P
lain
e8.
9521
,923
Prio
r La
ke21
.63
44,9
03
Roc
hest
er10
8.01
23,1
97M
ontic
ello
12.1
921
,769
Stil
lwat
er18
.25
44,5
61
Sha
kope
e38
.88
23,1
11C
otta
ge G
rove
35.3
121
,765
Cro
okst
on11
.58
44,4
70
Min
neto
nka
51.1
9
22
,778
Jord
an6.
0821
,689
Sha
kope
e38
.88
44,4
18
St.
Clo
ud65
.90
22,5
92N
ew U
lm18
.01
21,6
89M
inne
tonk
a51
.19
44,3
94
Jord
an6.
08
22,5
92A
lexa
ndria
33.2
921
,661
Jord
an6.
0844
,281
Cot
tage
Gro
ve35
.31
22,5
02V
irgin
ia16
.36
21,6
48C
otta
ge G
rove
35.3
144
,267
Vic
toria
8.77
22
,486
Fai
rmon
t20
.12
21,6
41S
outh
St.
Pau
l17
.46
44,2
04
St.
Jose
ph6.
66
22,3
70M
inne
tonk
a51
.19
21,6
16R
osev
ille
31.5
544
,196
Inve
r G
rove
Hei
ghts
34.7
1
22
,292
Lake
ville
68.3
321
,494
Sar
tell
18.5
244
,060
Kas
son
6.30
22
,101
Rob
bins
dale
10.0
521
,485
Nor
th S
t. P
aul
11.3
443
,749
Has
tings
22.6
1
21
,903
Wes
t St.
Pau
l13
.58
21,4
64W
orth
ingt
on11
.79
43,6
39
Far
ibau
lt24
.07
21,7
85B
axte
r17
.12
21,3
65B
uffa
lo17
.24
43,5
90
Alb
ertv
ille
7.51
21
,696
Sha
kope
e38
.88
21,3
07D
ulut
h11
6.71
43,5
06
New
Pra
gue
7.76
21
,610
Col
umbi
a H
eigh
ts12
.50
21,1
70S
t. P
aul P
ark
5.94
42,5
05
Sau
k R
apid
s14
.21
21,2
07S
t. F
ranc
is13
.45
21,1
27N
orth
Man
kato
15.7
742
,464
Del
ano
6.21
21
,172
Oro
no9.
4521
,059
Aus
tin30
.21
42,4
59
76

20
1720
18
20
1720
18
20
1720
18T
ota
lP
op
ula
tio
nT
ota
lM
on
ey N
eed
sT
ota
lT
ota
lN
eed
sA
lloca
tio
nN
eed
sA
lloca
tio
nN
eed
sA
lloca
tio
nM
un
icip
alit
yM
ileag
eP
er N
eed
Mile
Mu
nic
ipal
ity
Mile
age
Per
Nee
d M
ileM
un
icip
alit
yM
ileag
eP
er N
eed
Mile
Big
Lak
e11
.48
$21,
026
Sav
age
27.2
7$2
0,91
2In
ver
Gro
ve H
eigh
ts34
.71
$42,
457
Sar
tell
18.5
2
20
,988
Her
man
tow
n18
.65
20,8
12G
olde
n V
alle
y23
.74
42,4
43
Buf
falo
17.2
4
20
,671
Litc
hfie
ld8.
7720
,727
Alb
ertv
ille
7.51
42,3
75
St.
Pau
l Par
k5.
94
20,5
41S
tillw
ater
18.2
520
,705
Spr
ing
Lake
Par
k5.
8242
,305
Gol
den
Val
ley
23.7
4
20
,074
Bla
ine
50.3
620
,691
Lake
ville
68.3
341
,219
Lake
ville
68.3
3
19
,725
Alb
ertv
ille
7.51
20,6
79T
hief
Riv
er F
alls
16.2
340
,850
Littl
e C
anad
a11
.35
19,6
75N
orth
field
17.0
620
,590
Kas
son
6.30
40,8
42
Moo
rhea
d48
.01
19,6
08D
etro
it La
kes
24.5
220
,587
Bem
idji
18.7
240
,717
LaC
resc
ent
5.84
19
,587
For
est L
ake
33.8
320
,367
St.
Pet
er14
.74
40,0
47
Nor
th M
anka
to15
.77
19,3
65Li
no L
akes
23.8
420
,317
St.
Mic
hael
22.9
139
,944
Lino
Lak
es23
.84
19,2
92N
orth
St.
Pau
l11
.34
20,2
20W
illm
ar27
.87
39,8
17
Wac
onia
14.0
6
19
,130
Inve
r G
rove
Hei
ghts
34.7
120
,165
Bra
iner
d19
.16
39,6
69
Zim
mer
man
6.51
18
,573
Far
min
gton
16.6
920
,095
Lino
Lak
es23
.84
39,6
08
Mah
tom
edi
9.56
18
,570
Vad
nais
Hei
ghts
9.17
20,0
67Li
ttle
Can
ada
11.3
539
,527
Aus
tin30
.21
18,3
71R
oger
s21
.37
20,0
61H
utch
inso
n19
.52
39,4
86
Isan
ti6.
89
18,0
14S
hore
woo
d9.
2020
,020
Oro
no9.
4539
,052
Sho
rew
ood
9.20
18
,013
Frid
ley
22.9
019
,908
Bel
le P
lain
e8.
9538
,969
Oro
no9.
45
17,9
93Li
ttle
Can
ada
11.3
519
,851
Ow
aton
na34
.64
38,9
16
Bem
idji
18.7
2
17
,855
Sho
revi
ew19
.69
19,7
97B
ig L
ake
11.4
838
,535
Ros
emou
nt29
.39
17,7
25W
asec
a7.
7119
,496
New
Pra
gue
7.76
38,4
13
St.
Pet
er14
.74
17,7
09M
endo
ta H
eigh
ts15
.17
19,3
85A
lber
t Lea
24.3
138
,408
Inte
rnat
iona
l Fal
ls8.
08
17,5
77W
acon
ia14
.06
19,1
76M
arsh
all
18.7
838
,396
Bel
le P
lain
e8.
95
17,0
47W
hite
Bea
r La
ke20
.94
19,0
87N
ew U
lm18
.01
38,3
09
Litc
hfie
ld8.
77
16,9
81R
osev
ille
31.5
519
,085
Wac
onia
14.0
638
,306
New
Ulm
18.0
1
16
,620
Chi
shol
m8.
4119
,072
Sho
rew
ood
9.20
38,0
33
St.
Mic
hael
22.9
1
16
,573
Cry
stal
17.4
719
,067
Vic
toria
8.77
37,7
24
Ow
aton
na34
.64
16,5
06R
osem
ount
29.3
919
,021
Litc
hfie
ld8.
7737
,708
Dul
uth
116.
71
16
,453
Clo
quet
22.7
518
,994
Red
Win
g24
.87
37,2
81
Men
dota
Hei
ghts
15.1
7
16
,443
Bro
okly
n P
ark
60.7
118
,879
La C
resc
ent
5.84
37,2
49
And
over
43.4
8
16
,441
Littl
e F
alls
21.7
518
,821
Has
tings
22.6
137
,219
Alb
ert L
ea24
.31
16,4
11P
rior
Lake
21.6
318
,819
Fer
gus
Fal
ls26
.18
36,9
95
Mar
shal
l18
.78
16,2
44N
ew B
right
on15
.27
18,8
13E
lk R
iver
38.2
736
,774
Hut
chin
son
19.5
2
16
,060
Fal
con
Hei
ghts
3.29
18,7
52R
osem
ount
29.3
936
,746
Byr
on7.
59
16,0
14K
asso
n6.
3018
,741
Eas
t Gra
nd F
orks
16.9
936
,375
Bra
iner
d19
.16
15,7
84W
orth
ingt
on11
.79
18,7
22M
endo
ta H
eigh
ts15
.17
35,8
28
Will
mar
27.8
7
15
,779
Nor
th B
ranc
h27
.81
18,5
38Is
anti
6.89
34,5
67
Ram
sey
37.8
6
15
,329
Cam
brid
ge16
.93
18,4
76Z
imm
erm
an6.
5134
,230
Hug
o21
.19
15,2
38G
lenc
oe8.
3918
,472
Gra
nd R
apid
s26
.32
34,1
22
Cro
okst
on11
.58
15,1
68M
orris
9.18
18,4
46In
tern
atio
nal F
alls
8.08
34,0
69
77

20
1720
18
20
1720
18
20
1720
18T
ota
lP
op
ula
tio
nT
ota
lM
on
ey N
eed
sT
ota
lT
ota
lN
eed
sA
lloca
tio
nN
eed
sA
lloca
tio
nN
eed
sA
lloca
tio
nM
un
icip
alit
yM
ileag
eP
er N
eed
Mile
Mu
nic
ipal
ity
Mile
age
Per
Nee
d M
ileM
un
icip
alit
yM
ileag
eP
er N
eed
Mile
Ots
ego
23.7
2
$1
4,93
0S
outh
St.
Pau
l17
.46
$18,
365
And
over
43.4
8$3
3,69
2
Gle
ncoe
8.39
14
,838
Min
netr
ista
12.9
818
,347
For
est L
ake
33.8
333
,662
Red
Win
g24
.87
14,7
08C
ircle
Pin
es3.
6018
,318
Virg
inia
16.3
633
,421
Elk
Riv
er38
.27
14,0
77M
ound
s V
iew
10.8
618
,309
Fai
rmon
t20
.12
33,3
61
Chi
sago
City
8.54
13
,648
Ots
ego
23.7
218
,284
Gle
ncoe
8.39
33,3
10
Lake
City
8.39
13
,515
Bro
okly
n C
ente
r21
.34
18,2
17S
t. F
ranc
is13
.45
33,2
90
For
est L
ake
33.8
3
13
,295
Mon
tevi
deo
8.98
18,1
65O
tseg
o23
.72
33,2
15
Mon
tevi
deo
8.98
13
,253
Lake
Elm
o18
.12
18,0
59R
oger
s21
.37
33,0
33
Chi
shol
m8.
41
13,1
44S
prin
g La
ke P
ark
5.82
17,9
48H
ugo
21.1
932
,958
Mor
ris9.
18
13,1
06A
rden
Hill
s7.
5317
,938
Mah
tom
edi
9.56
32,4
35
Rog
ers
21.3
7
12
,972
Wyo
min
g15
.92
17,8
98R
amse
y37
.86
32,2
35
Min
netr
ista
12.9
8
12
,328
Hug
o21
.19
17,7
21C
hish
olm
8.41
32,2
15
St.
Fra
ncis
13.4
5
12
,164
La C
resc
ent
5.84
17,6
62B
axte
r17
.12
32,1
07
Thi
ef R
iver
Fal
ls16
.23
12,0
48H
ibbi
ng54
.19
17,5
76H
erm
anto
wn
18.6
532
,082
Clo
quet
22.7
5
11
,954
Chi
sago
City
8.54
17,5
45M
orris
9.18
31,5
52
Virg
inia
16.3
6
11
,773
Big
Lak
e11
.48
17,5
09M
onte
vide
o8.
9831
,418
Fai
rmon
t20
.12
11,7
20R
edw
ood
Fal
ls10
.52
17,4
38C
hisa
go C
ity8.
5431
,193
Fer
gus
Fal
ls26
.18
11,5
29A
ndov
er43
.48
17,2
51C
loqu
et22
.75
30,9
48
Eas
t Gra
nd F
orks
16.9
9
11
,507
Oak
dale
19.3
917
,119
Byr
on7.
5930
,700
Cam
brid
ge16
.93
11,4
25La
ke C
ity8.
3917
,001
Ale
xand
ria33
.29
30,6
76
Her
man
tow
n18
.65
11,2
70R
amse
y37
.86
16,9
06M
inne
tris
ta12
.98
30,6
75
Red
woo
d F
alls
10.5
2
11
,046
New
Pra
gue
7.76
16,8
04La
ke C
ity8.
3930
,516
Wyo
min
g15
.92
10,9
79S
tew
artv
ille
4.71
16,7
34S
t. Jo
seph
6.66
30,3
50
Med
ina
12.5
9
10
,766
Oak
Gro
ve25
.73
16,5
76C
ambr
idge
16.9
329
,901
Day
ton
10.6
2
10
,756
Isan
ti6.
8916
,553
Det
roit
Lake
s24
.52
29,0
44
Bax
ter
17.1
2
10
,742
Inte
rnat
iona
l Fal
ls8.
0816
,492
Wyo
min
g15
.92
28,8
77
Lake
Elm
o18
.12
10,6
73E
ast B
ethe
l28
.84
16,3
90La
ke E
lmo
18.1
228
,733
Ham
Lak
e33
.73
10,4
16H
am L
ake
33.7
315
,784
Red
woo
d F
alls
10.5
228
,483
Gra
nd R
apid
s26
.32
9,60
5Z
imm
erm
an6.
5115
,657
Littl
e F
alls
21.7
527
,857
Eas
t Bet
hel
28.8
4
9,
036
Has
tings
22.6
115
,316
Nor
th B
ranc
h27
.81
26,8
60
Littl
e F
alls
21.7
5
9,
036
Vic
toria
8.77
15,2
38H
am L
ake
33.7
326
,199
Ale
xand
ria33
.29
9,01
5D
ayto
n10
.62
15,0
71D
ayto
n10
.62
25,8
27
Det
roit
Lake
s24
.52
8,45
7B
yron
7.59
14,6
86E
ast B
ethe
l28
.84
25,4
26
Nor
th B
ranc
h27
.81
8,32
3M
ahto
med
i9.
5613
,865
Hib
bing
54.1
924
,251
Cor
cora
n15
.53
7,82
7C
orco
ran
15.5
313
,614
Med
ina
12.5
924
,067
Oak
Gro
ve25
.73
7,18
3M
edin
a12
.59
13,3
01O
ak G
rove
25.7
323
,759
Hib
bing
54.1
9
6,
675
St.
Jose
ph6.
667,
980
Cor
cora
n15
.53
21,4
40
To
tal
$20,
991
$21,
016
$42,
007
MS
AS
\Boo
ks\2
017
Oct
ober
Boo
k\T
enta
tive
2018
Allo
catio
n R
anki
ngs
78

79

CERTIFICATION OF MSAS SYSTEM AS COMPLETE
A Certification of a Municipal State Aid Street System may occur when a City certifies to the Commissioner of Transportation that its state aid routes are improved to state aid standards or have no other needs beyond additional surfacing or shouldering needs as identified in the annual State Aid Needs Report. This authority exists under Minnesota Rules 8820.1800 subpart 2, which reads in part:
When the county board or governing body of an urban municipality desires to use a part of its state aid allocation on local roads or streets not on an approved state aid system, it shall certify to the commissioner that its state aid routes are improved to state aid standards or are in an adequate condition that does not have needs other than additional surfacing or shouldering needs identified in its respective state aid needs report. That portion of the county or city apportionment attributable to needs must not be used on the local system.
When a system is certified as complete, the certification shall be good for two years. The dollar amount eligible for use on local streets will be based on the population portion of the annual construction allocation. The beginning construction account figure for this calculation shall be the amount of the current year’s construction account which is not generated by construction needs. The dollar amount eligible to be spent on local street systems is determined as follows:
Determine what percentage the population allocation is of the total allocation. This percent is then multiplied times the construction allotment. This is the amount of the construction allotment that is generated by the population allocation. Only the construction allotment is used because the city has already received its maintenance allotment.
Population Allocation / Total Allocation * Construction Allotment = Local Amount Available. (see allocation into 90p account on next page) The following five cities are Certified Complete: Columbia Heights, Crookston, Falcon Heights, Fridley, and South St. Paul.
N:\MSAS\Books 2017 January book\Certification of MSAS System as Complete 2016.docx
80
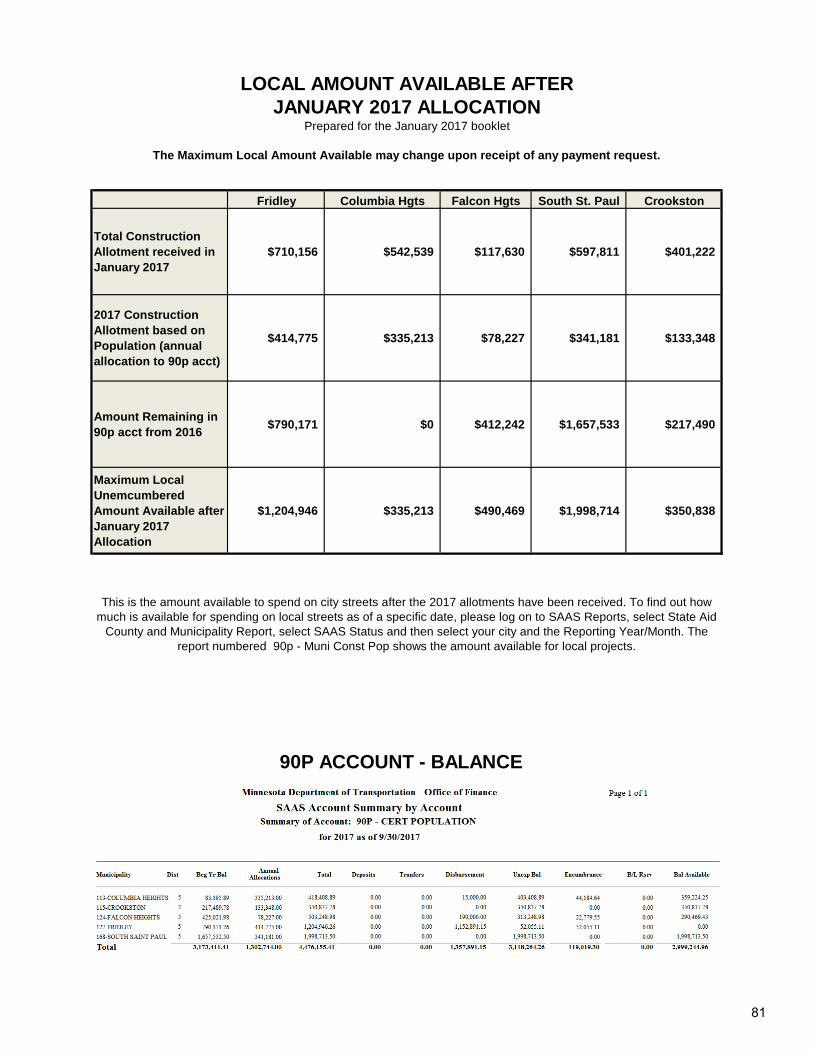
Fridley Columbia Hgts Falcon Hgts South St. Paul Crookston
Total Construction Allotment received in January 2017
$710,156 $542,539 $117,630 $597,811 $401,222
2017 Construction Allotment based on Population (annual allocation to 90p acct)
$414,775 $335,213 $78,227 $341,181 $133,348
Amount Remaining in 90p acct from 2016
$790,171 $0 $412,242 $1,657,533 $217,490
Maximum Local Unemcumbered Amount Available after January 2017 Allocation
$1,204,946 $335,213 $490,469 $1,998,714 $350,838
90P ACCOUNT - BALANCE
n:/msas/books/2017 January book/Certified Complete for January 2017 book.xlsx
LOCAL AMOUNT AVAILABLE AFTERJANUARY 2017 ALLOCATION
Prepared for the January 2017 booklet
The Maximum Local Amount Available may change upon receipt of any payment request.
This is the amount available to spend on city streets after the 2017 allotments have been received. To find out how much is available for spending on local streets as of a specific date, please log on to SAAS Reports, select State Aid
County and Municipality Report, select SAAS Status and then select your city and the Reporting Year/Month. The report numbered 90p - Muni Const Pop shows the amount available for local projects.
81

January Year End January Year EndAllotment Balance Spent Allotment Balance Spent
1958 $113,220 $48,310 $64,910 2011 $2,858,585 $762,419 $2,096,1661970 252,736 147,968 104,768 2012 3,014,118 1,029,649 1,984,4691980 521,544 171,544 350,000 2013 3,125,654 888,606 2,237,0481990 1,248,109 218,586 1,029,523 2014 3,235,357 880,506 2,354,8512000 1,583,411 1,230,268 353,143 2015 3,413,892 1,045,899 2,367,9932008 1,750,808 29,487 1,721,321 2016 3,548,041 1,171,781 2,376,2602009 1,866,306 95,764 1,770,542 2017 3,551,7012010 2,614,101 680,404 1,933,697
Each year the Screening Board, provided for in section 162.13, Subdivision 3, may recommend to the commissioner asum of money that the commissioner shall set aside from the municipal state aid street fund and credit to a researchaccount. The amount so recommended shall not exceed 1/2 of 1% of the preceding apportionment. Any balanceremaining in the research account at the end of each year from sum set aside for the year immediately previous, shall be transferred to the MSAS fund.
Be it resolved that an amount of $866,092 (not to exceed 1/2 of 1% of the 2017 MSAS Apportionment sum of $173,218,364) shall be set aside from the 2018 Apportionment fund and be credited to the research account.
Year Allotment Spent Year Allotment Spent
1958 $0 $0 2011 $636,577 $636,5771970 37,803 2,151 2012 695,405 695,4051980 77,116 40,764 2013 723,414 723,4141990 191,254 150,294 2014 746,853 746,8532000 487,286 487,286 2015 773,075 773,0752008 572,095 572,095 2016 853,501 853,5012009 571,991 571,991 2017 868,060 868,0602010 608,806 608,806 2018 866,092
N:MSAS/BOOKS/2016 OCTOBER BOOK/Past History of Administrative & Research Accounts 2016.xlsx
HISTORY OF THE RESEARCH ACCOUNT
HISTORY OF ADMINISTRATIVE ACCOUNT
2% OF THE TOTAL FUNDS AVAILABLE ARE SET ASIDE FOR THE ADMINISTRATION OF STATE AID. THE ACCOUNT IS USED FOR EXPENSES OF SCREENING BOARD MEETINGS, VARIANCE MEETINGS, PRINTING OF
STATE AID MATERIALS, ETC.
Year Year
The unexpended balance of the administration account at the end of the year is transferred back to the MSAS fund and redistributed the following year.
82

8/28/2014 1
MUNICIPAL STATE AID CONSTUCTION ACCOUNT
ADVANCE GUIDELINES
ADVANCE STATUS IS CURRENTLY CODE GREEN
State Aid Advances
M.S. 162.14, Subd 6 provides for municipalities to make advances from future year’s allocations
for the purpose of expediting construction. This process not only helps reduce the construction
cash balance, but also allows municipalities to fund projects that may have been delayed due to
funding shortages.
The formula used to determine if advances will be available is based on the current construction
cash balance, expenditures trends, repayments and the $20,000,000 recommended threshold in
MSAS construction. The threshold can be administratively adjusted by the Chief Financial
Officer and reported to the Screening Board at the next Screening Board meeting.
The process used for advancing is dependent on the code levels which are listed below. Code
levels for the current year can be obtained from the SAF website -
http://www.dot.state.mn.us/safinance/advances.html.
State Aid Advance Code Levels
Guidelines for advances are determined by the following codes.
General Guidelines for State Aid & Federal Aid Advance Construction
If a City requests an advance on future allotments they need to submit an Advance Resolution
authorizing the advance by the board. This will “earmark” the funding for that City, but it will
Code RED - SEVERE – Construction cash balance too low. NO MORE
ADVANCES - NO EXCEPTIONS
Code YELLOW - GUARDED – Construction cash balance low; balances
reviewed monthly. Advancing money may not meet the anticipated needs.
Priority system will be used. Resolution required. Reserve option is
available only prior to bid advertisement.
SEVERE
LOW Code GREEN - LOW – Construction cash balance at acceptable level to
approve anticipated advances. Advances approved on first-come, first-
serve basis while funds are available. Resolution required. High priority
projects are reserved; others optional.
GUARDED
83

8/28/2014 2
NOT hold the funds. Advanced funds will be paid out on a first come first serve basis as the
construction accounts are spent down to zero. The correct resolution must be used for each
advance type and there is a sample resolution for each on the State Aid Finance webpage.
Requests are good only for the year requested (cannot be summited for multiple years) and
void at 12/31 of that year.
Advances are not limited to the projects listed on the resolution. Project payments are processed
in the order received by SAF until the maximum advance amount is reached. Advances are
repaid from next year’s allocation until fully repaid.
Advance funding is not guaranteed. If the City finds they need a guarantee that the funds will be
held specifically for them they can submit a “Request to Reserve Funds” to ensure funds will be
available for their project. Once approved, a signed copy will be returned to the County.
Requests are good only for the year requested (cannot be summited for multiple years) and
void at 12/31 of that year.
Sample Advance Resolutions and a - Request to Reserve Funds can be obtained from SAF
website - http://www.dot.state.mn.us/safinance/formsandresolutions.html.
E-mail completed forms to Sandra Martinez in State Aid Finance and your DSAE for review.
Priority System
A Priority System will be required if the construction cash balances drop below an acceptable
level which is Code Yellow. This process starts in early October proceeding the advance year.
Each city will be required to submit projects to their DSAE for prioritization within the district.
The DSAE will submit the prioritized list to SALT for final prioritization.
Requests should include a negative impact statement if project had to be delayed or advance
funding was not available. In addition, include the significance of the project.
Priority projects include, but are not limited to projects where agreements have mandated the
city's participation, or projects with advanced federal aid. Small over-runs and funding shortfalls
may be funded, but require State Aid approval.
Advance Limitations
Statutory - None
Ref. M.S.162.14, Subd 6.
State Aid Rules - None
Ref. State Aid Rules 8820.1500, Subp 10& 10b.
State Aid Guidelines
Advance is limited to five times the municipalities’ last construction allotment or $4,000,000,
whichever is less. Advance amount will be reduced by any similar outstanding obligations
and/or bond principle payments due. The limit can be administratively adjusted by the Chief
Financial Officer.
84

8/28/2014 3
Limitation may be exceeded due to federal aid advance construction projects programmed by the
ATP in the STIP where State Aid funds are used in lieu of federal funds. Repayment will be
made at the time federal funds are converted. Should federal funds fail to be programmed, or the
project (or a portion of the project) be declared federally ineligible, the local agency is required to
pay back the advance under a payment plan mutually agreed to between State Aid and the
Municipality.
85

January 3, 2003
COUNTY HIGHWAY TURNBACK POLICY
Definitions:
County Highway – Either a County State Aid Highway or a County Road
County Highway Turnback- A CSAH or a County Road which has been released by the county and designated as an MSAS roadway. A designation request must be approved and a Commissioner’s Order written. A County Highway Turnback may be either County Road (CR) Turnback or a County State Aid (CSAH) Turnback. (See Minnesota Statute 162.09 Subdivision 1). A County Highway Turnback designation has to stay with the County Highway turned back and is not transferable to any other roadways. Basic Mileage- Total improved mileage of local streets, county roads and county road turnbacks. Frontage roads which are not designated trunk highway, trunk highway turnback or on the County State Aid Highway System shall be considered in the computation of the basic street mileage. A city is allowed to designate 20% of this mileage as MSAS. (See Screening Board Resolutions in the back of the most current booklet).
MILEAGE CONSIDERATIONS
County State Aid Highway Turnbacks
A CSAH Turnback is not included in a city’s basic mileage, which means it is not included in the computation for a city’s 20% allowable mileage. However, a city may draw Construction Needs and generate allocation on 100% of the length of the CSAH Turnback
County Road Turnbacks A County Road Turnback is included in a city’s basic mileage, so it is included in the computation for a city’s 20% allowable mileage. A city may also draw Construction Needs and generate allocation on 100% of the length of the County Road Turnback.
Jurisdictional Exchanges County Road for MSAS Only the extra mileage a city receives in an exchange between a County Road and an MSAS route will be considered as a County Road Turnback. If the mileage of a jurisdictional exchange is even, the County Road will not be considered as a County Road Turnback. If a city receives less mileage in a jurisdictional exchange, the County Road will not be considered as a County Road Turnback.
86

CSAH for MSAS Only the extra mileage a city receives in an exchange between a CSAH and an MSAS route will be considered as a CSAH Turnback. If the mileage of a jurisdictional exchange is even, the CSAH will not be considered as a CSAH Turnback. If a city receives less mileage in a jurisdictional exchange, the CSAH will not be considered as a CSAH Turnback NOTE: When a city receives less mileage in a CSAH exchange it will have less mileage to designate within its 20% mileage limitation and may have to revoke mileage the following year when it computes its allowable mileage. Explanation: After this exchange is completed, a city will have more CSAH mileage and less MSAS mileage than before the exchange. The new CSAH mileage was included in the city’s basic mileage when it was MSAS (before the exchange) but is not included when it is CSAH (after the exchange). So, after the jurisdictional exchange the city will have less basic mileage and 20% of that mileage will be a smaller number. If a city has more mileage designated than the new, lower 20% allowable mileage, the city will be over designated and be required to revoke some mileage. If a revocation is necessary, it will not have to be done until the following year after a city computes its new allowable mileage. MSAS designation on a County Road County Roads can be designated as MSAS. If a County Road which is designated as MSAS is turned back to the city, it will not be considered as County Road Turnback.
MISCELLANEOUS A CSAH which was previously designated as Trunk Highway turnback on the CSAH system and is turned back to the city will lose all status as a TH turnback and only be considered as CSAH Turnback. A city that had previously been over 5,000 population, lost its eligibility for an MSAS system and regained it shall revoke all streets designated as CSAH at the time of eligibility loss and consider them for MSAS designation. These roads will not be eligible for consideration as CSAH turnback designation. In a city that becomes eligible for MSAS designation for the first time all CSAH routes which serve only a municipal function and have both termini within or at the municipal boundary, should be revoked as CSAH and considered for MSAS designation. These roads will not be eligible for consideration as CSAH turnbacks. For MSAS purposes, a County or CSAH that has been released to a city cannot be local road for more than two years and still be considered a turnback.
N:\MSAS\Books\2012 October book\COUNTY HIGHWAY TURNBACK POLICY.docx
87

CURRENT RESOLUTIONS OF THE
MUNICIPAL SCREENING BOARD
October 2017
Bolded wording (except headings) are revisions since the last publication of the Resolutions
BE IT RESOLVED: ADMINISTRATION
Appointments to Screening Board - Oct. 1961 (Revised June 1981, May 2011)
The Commissioner of Mn/DOT will annually be requested to appoint three (3) new members, upon recommendation of the City Engineers Association of Minnesota, to serve three (3) year terms as voting members of the Municipal Screening Board. These appointees are selected from the MnDOT State Aid Districts as they exist in 2010, together with one representative from each of the four (4) cities of the first class.
Screening Board Chair, Vice Chair and Secretary- June 1987 (Revised June, 2002)
The Chair Vice Chair, and Secretary, nominated annually at the annual meeting of the City Engineers Association of Minnesota and subsequently appointed by the Commissioner of the Minnesota Department of Transportation will not have a vote in matters before the Screening Board unless they are also the duly appointed Screening Board Representative of a construction District or of a City of the first class.
Appointment to the Needs Study Subcommittee - June 1987 (Revised June 1993)
The Screening Board Chair will annually appoint one city engineer, who has served on the Screening Board, to serve a three year term on the Needs Study Subcommittee. The appointment will be made at the annual winter meeting of the City's Engineers Association. The appointed subcommittee person will serve as chair of the subcommittee in the third year of the appointment. Appointment to Unencumbered Construction Funds Subcommittee – (Revised June 1979, May 2014) The Screening Board past Chair will be appointed to serve a minimum three-year term on the Unencumbered Construction Fund Subcommittee. This appointment will continue to maintain an experienced group to follow a program of accomplishments. The most senior member will serve as chair of the subcommittee.
88
Appearance Screening Board - Oct. 1962 (Revised Oct. 1982)
Any individual or delegation having items of concern regarding the study of State Aid Needs or State Aid Apportionment amounts, and wishing to have consideration given to these items, will send such request in writing to the State Aid Engineer. The State Aid Engineer with concurrence of the Chair of the Screening Board will determine which requests are to be referred to the Screening Board for their consideration. This resolution does not abrogate the right of the Screening Board to call any person or persons before the Board for discussion purposes. Screening Board Meeting Dates and Locations - June 1996 The Screening Board Chair, with the assistance of the State Aid Engineer, will determine the dates and locations for Screening Board meetings. Research Account - Oct. 1961 An annual resolution be considered for setting aside up to ½ of 1% of the previous years’ Apportionment fund for the Research Account to continue municipal street research activity. Population Apportionment - October 1994, 1996 Beginning with calendar year 1996, the MSAS population apportionment will be determined using the latest available federal census or population estimates of the State Demographer and/or the Metropolitan Council. However, no population will be decreased below that of the latest available federal census, and no city will be dropped from the MSAS eligible list based on population estimates. Improper Needs Report - Oct. 1961
The State Aid Engineer and the District State Aid Engineer (DSAE) are requested to recommend an adjustment of the Needs reporting whenever there is a reason to believe that said reports have deviated from accepted standards and to submit their recommendations to the Screening Board, with a copy to the municipality involved, or its engineer.
New Cities Needs - Oct. 1983 (Revised June 2005, May 2014) Any new city having determined its eligible mileage, but has not submitted its Needs to the DSAE by December 1, will have its Needs based upon zero ADT assigned to the eligible mileage until the DSAE approves the traffic counts. Certified Complete Cities – May 2014 (Revised October 2014) State Aid Operational Rule 8820.18 subp.2 allows cities to spend the population based portion of their Construction Allotment on non MSAS city streets if its MSAS system has been Certified Complete. At the city’s request, the District State Aid Engineer will review the MSAS system in that city and if the system has been completely built, may certify it complete for a period of two years. The same proportion of a city’s total allocation based on population will be used to compute the population portion of its Construction Allotment.
89

If a payment request for a project on the MSAS system is greater than the amount available in the Needs based account, the remainder will come from the population based account, thereby reducing the amount available for non MSAS city streets. A city may carry over any remaining amount in its population based account from year to year. However if a payment request for a project on a non MSAS city street is greater than the amount available in the population based account, the population based account will be reduced to zero and the city will be responsible for the remaining amount. Construction Needs Components – May 2014 For Construction Needs purposes, all roadways on the MSAS system will be considered as being built to Urban standards. All segments on the MSAS system will generate continuous Construction Needs on the following items: Excavation/Grading Gravel Base Bituminous Curb and Gutter Construction Sidewalk Construction Storm Sewer Construction Street Lighting Traffic Signals Engineering Structures Unit Price Study- Oct. 2006 (Revised May, 2014) The Needs Study Subcommittee will annually review the Unit Prices for the Needs components used in the Needs Study. The Subcommittee will make its recommendation to the Municipal Screening board at its annual spring meeting. The Unit Price Study go to a 3 year (or triennial) cycle with the Unit Prices for the two ‘off years’ to be set using the Engineering News Record construction cost index on all items where a Unit Price is not estimated and provided by other MnDOT offices. The Screening Board may request a Unit Price Study on individual items in the ‘off years’ if it is deemed necessary. Unit Costs – May 2014, (Revised January 2015, May 2015) The quantities which the Unit Costs for Excavation/Grading, Gravel Base, and Bituminous are based upon will be determined by using the roadway cross sections and structural sections in each of the ADT groups as determined by the Municipal Screening Board and shown in the following table ‘MSAS Urban ADT Groups for Needs Purposes’.
90
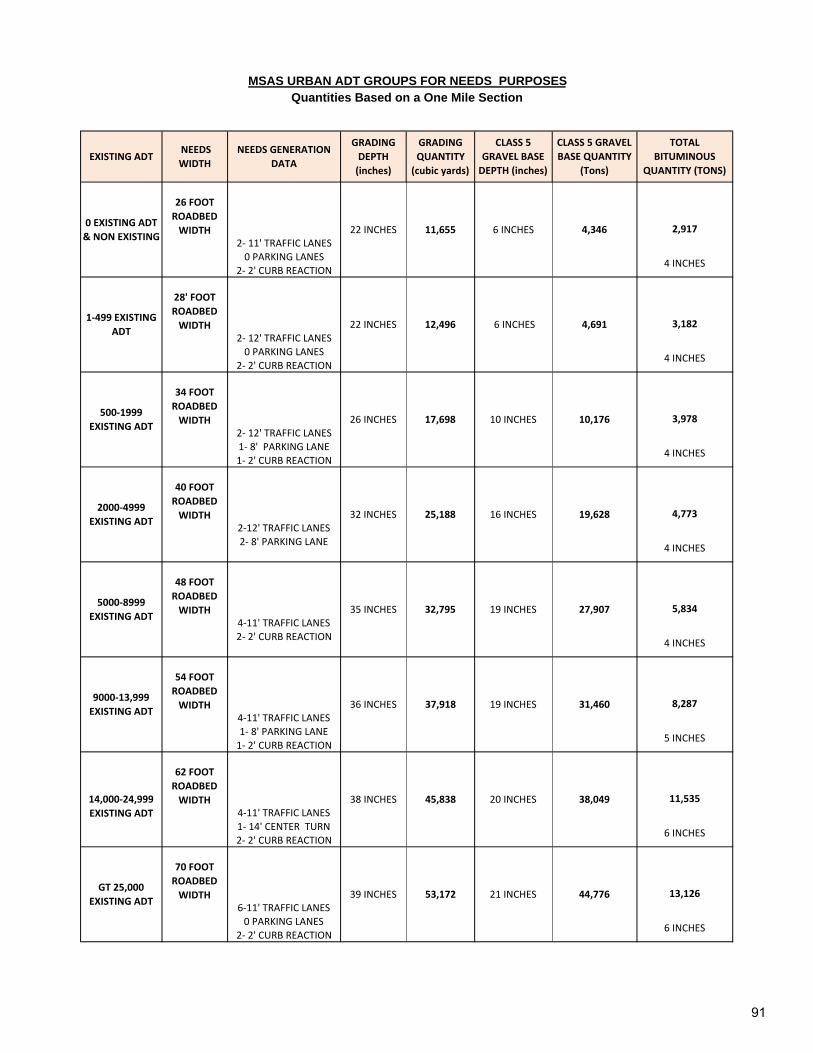
26 FOOT
ROADBED
WIDTH 2,917
2‐ 11' TRAFFIC LANES0 PARKING LANES
2‐ 2' CURB REACTION
28' FOOT
ROADBED
WIDTH 3,182
2‐ 12' TRAFFIC LANES0 PARKING LANES
2‐ 2' CURB REACTION
34 FOOT
ROADBED
WIDTH 3,978
2‐ 12' TRAFFIC LANES1‐ 8' PARKING LANE1‐ 2' CURB REACTION
40 FOOT
ROADBED
WIDTH 4,773
2‐12' TRAFFIC LANES2‐ 8' PARKING LANE
48 FOOT
ROADBED
WIDTH 5,834
4‐11' TRAFFIC LANES2‐ 2' CURB REACTION
54 FOOT
ROADBED
WIDTH 8,287
4‐11' TRAFFIC LANES1‐ 8' PARKING LANE1‐ 2' CURB REACTION
62 FOOT
ROADBED
WIDTH 11,535
4‐11' TRAFFIC LANES1‐ 14' CENTER TURN2‐ 2' CURB REACTION
70 FOOT
ROADBED
WIDTH 13,126
6‐11' TRAFFIC LANES0 PARKING LANES
2‐ 2' CURB REACTION
4,346
4 INCHES
CLASS 5
GRAVEL BASE
DEPTH (inches)
CLASS 5 GRAVEL
BASE QUANTITY
(Tons)
TOTAL
BITUMINOUS
QUANTITY (TONS)
GT 25,000
EXISTING ADT39 INCHES 53,172 21 INCHES 44,776
6 INCHES
5 INCHES
38 INCHES 45,838 20 INCHES 38,049
9000‐13,999
EXISTING ADT36 INCHES 37,918 19 INCHES
14,000‐24,999
EXISTING ADT
6 INCHES
4 INCHES
5000‐8999
EXISTING ADT35 INCHES 32,795 19 INCHES 27,907
4 INCHES
2000‐4999
EXISTING ADT32 INCHES 25,188 16 INCHES 19,628
31,460
500‐1999
EXISTING ADT26 INCHES 17,698 10 INCHES 10,176
4 INCHES
1‐499 EXISTING
ADT22 INCHES 12,496 6 INCHES 4,691
4 INCHES
MSAS URBAN ADT GROUPS FOR NEEDS PURPOSESQuantities Based on a One Mile Section
0 EXISTING ADT
& NON EXISTING22 INCHES 11,655 6 INCHES
EXISTING ADT NEEDS
WIDTH
NEEDS GENERATION
DATA
GRADING
DEPTH
(inches)
GRADING
QUANTITY
(cubic yards)
91
The quantity used for Curb and Gutter Construction will be determined by multiplying the segment length times two if it is an undivided roadway and by four if it is divided. This quantity will then be multiplied by the Municipal Screening Board approved Unit Price to determine the Curb and Gutter Construction Needs. The quantity used for Sidewalk Construction will be determined by multiplying the segment length times 26,400 (a five foot wide sidewalk on one side of a mile of roadway) in the lower two ADT groups (less than 500 ADT) and by 52,800 (two five foot wide sidewalks on a mile of roadway) in the upper ADT groups. This quantity will then be multiplied by the Municipal Screening Board approved Unit Price to determine the Sidewalk Construction Needs. The Unit Cost per mile of Storm Sewer for the highest MSAS Urban ADT Group for Needs Purposes will be based on the average costs of all Storm Sewer Construction on the MSAS system in the previous year. To determine the Unit Cost for the highest ADT Group, average costs for Complete Storm Sewer projects and Partial Storm Sewer projects will be provided to State Aid by the MnDOT Hydraulics Office and then added together and divided by two to calculate a statewide average Unit Cost for all Storm Sewer Construction. The Unit Cost per mile for Storm Sewer Construction will be calculated for the highest MSAS Urban ADT Group and be prorated downward for the other ADT Groups. This proration has been determined based upon an engineering study requested by the Municipal Screening Board in 2011 and will be the basis for the Needs calculations. The Unit Cost for Street Lighting will be determined by multiplying the Unit Price per mile by the segment length. This Unit Cost will remain at $100,000 per mile. The Municipal Screening Board may request a study on this item on any year if it is deemed necessary. The Unit Cost for Traffic Signals will be determined by the recommendation by the SALT Program Support Engineer and approved by the MSB. The Unit Cost for traffic signals will be based on a cost per signal leg, and for Needs purposes a signal leg will be defined as ¼ of the signal cost. Only signal legs on designated MSAS routes will be included in the Needs study. Stand-alone pedestrian crossing signals will not be included in the Needs study. The area in square feet used for Structure Needs (Bridges and Box Culverts) will be determined by multiplying the centerline length of the bridge, or the culvert width of the box culvert, times the Needs Width from the appropriate MSAS Urban ADT Group. This quantity will then be multiplied by the Municipal Screening Board Unit Price to determine the Structure Needs. The Unit Price for Structures will be determined by using one-half of the approved unit cost provided by the MnDOT State Aid Bridge Office. The Unit Cost for Engineering will be determined by adding together all other Unit Costs and multiplying them by the MSB approved percentage. The result is added to the other Unit Costs.
92

Mileage - Feb. 1959 (Revised Oct. 1994. 1998)
The maximum mileage for Municipal State Aid Street designation will be 20 percent of the municipality's basic mileage - which is comprised of the total improved mileage of local streets, county roads and county road turnbacks.
Nov. 1965 – (Revised 1969, October 1993, October 1994, June 1996, October 1998, May 2014)
Needs ItemGrading (Excavation) Cu. Yd. $7.65 $7.95 $7.95Aggregate Base Ton 14.30 14.90 14.90All Bituminous Ton 66.80 69.60 69.60
Sidewalk Construction Sq. Ft. 4.35 4.75 4.75Curb and Gutter Construction Lin.Ft. 14.00 14.55 14.55
Traffic Signals Per Sig 188,700 195,000 195,000Street Lighting Mile 100,000 100,000 100,000Engineering Percent 22 22 22
All Structures (includes both bridges and box culverts)Sq. Ft. 120.00 90.00 90.00
Storm Sewer (based on ADT) Per Mile 0 ADT & Non Existing 153,600 156,500 156,500 1-499 156,500 159,500 159,500 500-1,999 165,300 168,400 168,400 2,000-4,999 174,000 177,300 177,300 5,000-8,999 185,700 189,200 189,200 9,000-13,999 194,500 198,100 198,100 14,000-24,999 206,100 210,000 210,000 25,000 and over 217,800 221,900 221,900
Municipal Screening Board Approved Prices
for the 2017 Distribution
2017 UNIT PRICE RECOMMENDATIONSfor the January 2018 distribution
Needs Study Subcommittee Recommended Prices for 2018
Distribution
Municipal Screening Board Approved Prices
for the 2018 Distribution
93

That the maximum mileage for State Aid designation may be exceeded to designate trunk highway turnbacks released to the Municipality after July 1, 1965. The maximum mileage for State Aid designation may also be exceeded to designate both County Road and County State Aid Highways released to the Municipality after May 11th, 1994. Nov. 1965 (Revised 1972, Oct. 1993, 1995, 1998) The maximum mileage for Municipal State Aid Street designation will be based on the Annual Certification of Mileage current as of December 31st of the preceding year. Submittal of a supplementary certification during the year will not be permitted. Frontage roads not designated Trunk Highway, Trunk Highway Turnback or County State Aid Highways will be considered in the computation of the basic street mileage. The total mileage of local streets, county roads and county road turnbacks on corporate limits will be included in the municipality's basic street mileage. Any State Aid Street that is on the boundary of two adjoining urban municipalities will be considered as one-half mileage for each municipality. All mileage on the MSAS system will accrue Needs in accordance with current rules and resolutions. Oct. 1961 (Revised May 1980, Oct. 1982, Oct. 1983, June 1993, June 2003) All requests for revisions to the Municipal State Aid System must be received by the District State Aid Engineer by March first to be included in that years Needs Study. If a system revision has been requested, a City Council resolution approving the system revisions and the Needs Study reporting data must be received by May first, to be included in the current year's Needs Study. If no system revisions are requested, the District State Aid Engineer must receive the Normal Needs Updates by March 31st to be included in that years’ Needs Study. One Way Street Mileage - June 1983 (Revised Oct. 1984, Oct. 1993, June 1994, Oct. 1997) Any one-way streets added to the Municipal State Aid Street system must be reviewed by the Needs Study Sub-Committee, and approved by the Screening Board before any one-way street can be treated as one-half mileage in the Needs Study. All Municipal Screening Board approved one-way streets be treated as one-half of the mileage and allow one-half complete Needs. When Trunk Highway or County Highway Turnback is used as part of a one-way pair, mileage for certification shall only be included as Trunk Highway or County Turnback mileage and not as approved one-way mileage. Needs Adjustments Phase In (Restriction) May 2014 The method of computing Needs is to be phased in over a period of seven years. This seven year period will begin with the January 2015 allocation and go through the January 2021 allocation. The phase in will be reviewed annually by the Municipal Screening Board to determine if the Phase In period should be revised. During the seven year period the phase in is being applied, a city’s Restricted Needs will be computed using the following steps:
94
1) Compare the current years Unadjusted Needs to the previous years Restricted Needs. In the first year of the phase in, the current years Unadjusted Needs will be compared to the previous years Unadjusted Needs.
2) Compute the Statewide Average Percent of Change between the two totals. 3) Determine each individual city’s Percent of Change between last years Restricted Needs 4) and this years Unadjusted Needs. 5) If an individual city’s Percent of Change is greater than 5 Percentage Points less than the
Statewide Average Percent of Change, increase this year’s Unadjusted Needs to 5 Percentage Points less than the Statewide Average Percent of Change.
6) If an individual city’s Percent of Change is greater than 10 Percentage Points more than the Statewide Average Percent of Change, decrease this year’s Unadjusted Needs to 10 Percentage Points more than the Statewide Average Percent of Change.
7) If an individual city’s Percent of Change is between 5 Percentage Points less and 10 Percentage Points more than the Statewide Average Percent of Change, no restriction is made and the current year’s Unadjusted Needs will be used as its Restricted Needs.
All Needs adjustments will be applied to the city’s Restricted Needs. In the event that an MSAS route earning “After the Fact” Needs is removed from the MSAS system, the “After the Fact” Needs will then be removed from the Needs Study, except if transferred to another state system. No adjustment will be required on Needs earned prior to the revocation. Excess Unencumbered Construction Fund Balance Adjustment – Oct. 2002, (Revised Jan. 2010, May 2014) State Aid Payment Requests received before December 1st by the District State Aid Engineer for payment will be considered as being encumbered and the construction balances will be so adjusted. The December 31 construction fund balance will be compared to the annual construction allotment from January of the same year. If the December 31 construction fund balance exceeds 3 times the January construction allotment and $1,500,000, the negative adjustment to the Needs will be 1 times the December 31 construction fund balance. In each consecutive year the December 31 construction fund balance exceeds 3 times the January construction allotment and $1,500,000, the negative adjustment to the Needs will be increased to 2, 3, 4, etc. times the December 31 construction fund balance until such time the Construction Needs are adjusted to zero. If the December 31 construction fund balance drops below 3 times the January construction allotment and subsequently increases to over 3 times, the multipliers will start over with one. Low Balance Incentive – Oct. 2003 (Revised May, 2014) The amount of the Excess Unencumbered Construction Fund Balance Adjustment will be redistributed as a positive adjustment to the Construction Needs of all municipalities whose December 31st construction fund balance is less than 1 times their January construction allotment of the same year. This redistribution will be based on a city’s prorated share of its Unadjusted Construction Needs to the total Unadjusted Construction Needs of all participating
95
cities times the total Excess Balance Adjustment. After the Fact Right of Way Adjustment - Oct. 1965 (Revised June 1986, 2000, May 2014) Right of Way Needs will not be included in the Needs calculations until the right of way is acquired and the actual cost established. At that time a Construction Needs adjustment will be made by annually adding the local cost (which is the total cost less county or trunk highway participation) for a 15-year period. Only right of way acquisition costs that are eligible for State-Aid funding will be included in the right-of-way Construction Needs adjustment. This Directive is to exclude all Federal or State grants. When "After the Fact" Needs are requested for right-of-way projects that have been funded with local funds, but qualify for State Aid reimbursement, documentation (copies of warrants and description of acquisition) must be submitted to the District State Aid Engineer. The City Engineer will input the data into the Needs Update program and the data will be approved by the DSAE.
After the Fact Railroad Bridge over MSAS Route Adjustment – May 2014
RR Bridge over MSAS Route Rehabilitation Any structure that has been rehabilitated (Minnesota Administrative Rules, CHAPTER 8820, 8820.0200 DEFINITIONS, Subp. 8. Bridge rehabilitation) will not be included in the Needs calculations until the rehabilitation project has been completed and the actual cost established. At that time a Construction Needs adjustment will be made by annually adding the local cost (which is the total cost less county or trunk highway participation) for a 15-year period. Only State Aid eligible items are allowed to be included in this adjustment and all structure rehabilitation Needs adjustments must be input by the city and approved by the DSAE. RR Bridge over MSAS Route Construction/Reconstruction Any structure that has been constructed/reconstructed (Minnesota Administrative Rules, CHAPTER 8820, 8820.0200 DEFINITIONS, Subp. 31. Reconstruction) will not be included in the Needs calculations until the project has been completed and the actual cost established. At that time a Construction Needs adjustment will be made by annually adding the local cost (which is the total cost less county or trunk highway participation) for a 35-year period. Only State Aid eligible items are allowed to be included in this adjustment and all structure construction/reconstruction Needs adjustments must be input by the city and approved by the District State Aid Engineer.
After the Fact Railroad Crossing Adjustment
Any Railroad Crossing improvements will not be included in the Needs Calculations until the project has been completed and the actual cost established. At that time a Construction Needs adjustment will be made by annually adding the local cost (which is the total cost less county or trunk highway participation) to the annual Construction Needs for a 15 year period. Only State Aid eligible items are allowed to be included in this adjustment, and all Railroad Crossing Needs adjustments must be input by the city and approved by the District State Aid Engineer.
96
Excess Maintenance Account – June 2006 Any city which requests an annual Maintenance Allocation of more than 35% of their Total Allocation, is granted a variance by the Variance Committee, and subsequently receives the increased Maintenance Allocation will receive a negative Needs adjustment equal to the amount of money over and above the 35% amount transferred from the city’s Construction Account to its Maintenance Account. The Needs adjustment will be calculated for an accumulative period of twenty years, and applied as a single one-year (one time) deduction each year the city receives the maintenance allocation. After the Fact Retaining Wall Adjustment Oct. 2006 (Revised May 2014) Retaining wall Needs will not be included in the Needs study until such time that the retaining wall has been constructed and the actual cost established. At that time a Needs adjustment will be made by annually adding the local cost (which is the total cost less county or trunk highway participation) for a 15 year period. Documentation of the construction of the retaining wall, including eligible costs, must be submitted to your District State Aid Engineer by July 1 to be included in that years Needs study. After the Fact needs on retaining walls will begin effective for all projects awarded after January 1, 2006. All Retaining Wall adjustments must be input by the city and approved by the District State Aid Engineer. Trunk Highway Turnback - Oct. 1967 (Revised June 1989, May 2014) Any trunk highway turnback which reverts directly to the municipality and becomes part of the Municipal State Aid Street system will not have its Construction Needs considered in the Construction Needs apportionment determination as long as the former trunk highway is fully eligible for 100 percent construction payment from the Municipal Turnback Account. During this time of eligibility, financial aid for the additional maintenance obligation, to the municipality imposed by the turnback will be computed on the basis of the current year's apportionment data and will be accomplished in the following manner. The initial turnback maintenance adjustment when for less than 12 full months will provide partial maintenance cost reimbursement by adding said initial adjustment to the Construction Needs which will produce approximately 1/12 of $7,200 per mile in apportionment funds for each month or part of a month that the municipality had maintenance responsibility during the initial year. To provide an advance payment for the coming year's additional maintenance obligation, a Needs adjustment per mile will be added to the annual Construction Needs. This Needs adjustment per mile will produce sufficient apportionment funds so that at least $7,200 in apportionment will be earned for each mile of trunk highway turnback on Municipal State Aid Street System. Trunk Highway Turnback adjustments will terminate at the end of the calendar year during which a construction contract has been awarded that fulfills the Municipal Turnback Account Payment provisions.
97

TRAFFIC - June 1971 (Revised May 2014) Beginning in 1965 and for all future Municipal State Aid Street Needs Studies, the Needs Study procedure will utilize traffic data developed according the Traffic Forecasting and Analysis web site at http://www.dot.state.mn.us/traffic/data/coll-methods.html#TCS Traffic Counting - Sept. 1973 (Revised June 1987, 1997, 1999, Oct. 2014) Traffic data for State Aid Needs Studies will be developed as follows:
1) The municipalities in the metropolitan area cooperate with the State by agreeing to participate in counting traffic every two or four years at the discretion of the city.
2) The cities in the outstate area may have their traffic counted and maps prepared by State forces every four years, or may elect to continue the present procedure of taking their own counts and have state forces prepare the maps.
3) Any city may count traffic with their own forces every two years at their discretion and expense, unless the municipality has made arrangements with the Mn/DOT district to do the count.
4) On new MSAS routes, the ADT will be determined by the City with the concurrence of the District State Aid Engineer until such time the roadway is counted in the standard MnDOT count rotation.
98

2017 Item By Item Tabulation Of NeedsCITY MUNICIPALITY GRADING / STORM GRAVEL BITUMINOUS CURB & SIDEWALK SIGNALS LIGHTING STRUCTURES ENGINEERING TOTAL TOTAL NEEDS COST MUNICIPALITY
NUMBER EXCAVATION SEWER BASE SURFACE GUTTER NEEDS MILEAGE PER MILE 101 ALBERT LEA $4,503,756 $4,268,078 $6,145,910 $7,882,648 $3,931,847 $5,953,992 $1,121,250 $2,431,000 $2,062,980 $8,426,322 $46,727,783 24.31 $1,922,163 ALBERT LEA242 ALBERTVILLE 1,432,262 1,322,284 2,017,030 2,437,316 1,198,453 1,883,508 97,500 751,000 0 2,450,657 13,590,010 7.51 1,809,589 ALBERTVILLE102 ALEXANDRIA 6,531,312 5,904,203 9,241,850 11,182,850 5,234,797 8,349,132 1,170,000 3,329,000 67,320 11,222,296 62,232,760 33.29 1,869,413 ALEXANDRIA198 ANDOVER 6,177,683 7,272,249 7,042,474 11,786,333 6,998,664 8,331,576 926,250 4,348,000 494,460 11,743,089 65,120,778 43.48 1,497,718 ANDOVER103 ANOKA 2,719,414 2,687,458 3,494,894 5,197,494 2,462,974 3,546,312 828,750 1,542,000 2,413,980 5,476,512 30,369,788 15.42 1,969,506 ANOKA186 APPLE VALLEY 8,389,236 6,815,782 12,357,873 14,973,428 6,096,748 8,919,702 3,558,750 3,733,000 0 14,265,800 79,110,319 37.33 2,119,216 APPLE VALLEY187 ARDEN HILLS 1,121,224 1,269,782 1,331,454 2,095,542 1,180,016 1,598,850 195,000 753,000 70,380 2,115,355 11,730,603 7.53 1,557,849 ARDEN HILLS104 AUSTIN 5,703,105 5,321,913 7,826,471 10,121,630 4,858,350 7,264,422 2,535,000 3,021,000 5,543,640 11,483,016 63,678,547 30.21 2,107,863 AUSTIN230 BAXTER 3,341,466 3,031,219 4,687,428 5,873,167 2,797,930 3,970,164 438,750 1,712,000 0 5,687,471 31,539,595 17.12 1,842,266 BAXTER239 BELLE PLAINE 1,513,250 1,539,953 1,987,144 2,681,675 1,375,151 2,018,940 0 895,000 959,774 2,853,596 15,824,483 8.95 1,768,099 BELLE PLAINE105 BEMIDJI 3,587,544 3,312,088 4,934,949 6,359,287 2,876,292 4,557,036 1,072,500 1,872,000 1,894,140 6,702,484 37,168,320 18.72 1,985,487 BEMIDJI232 BIG LAKE 1,666,463 1,934,739 1,897,992 3,187,709 1,763,880 2,612,082 97,500 1,148,000 0 3,147,840 17,456,205 11.48 1,520,575 BIG LAKE106 BLAINE 10,031,234 8,953,570 14,253,342 17,310,499 9,374,064 11,600,754 2,583,750 5,036,000 730,980 17,572,328 97,446,521 50.36 1,934,998 BLAINE107 BLOOMINGTON 18,020,811 14,088,168 26,894,267 32,339,156 14,916,159 18,934,146 10,993,125 7,612,000 3,150,360 32,328,609 179,276,801 76.12 2,355,187 BLOOMINGTON108 BRAINERD 3,416,238 3,341,029 4,523,271 6,155,566 3,094,471 4,454,208 877,500 1,916,000 3,613,680 6,906,232 38,298,195 19.16 1,998,862 BRAINERD109 BROOKLYN CENTER 4,555,158 3,857,643 6,631,001 7,818,876 3,867,319 5,320,722 2,023,125 2,134,000 1,443,600 8,283,320 45,934,764 21.34 2,152,519 BROOKLYN CENTER110 BROOKLYN PARK 12,689,652 10,910,137 18,480,193 21,435,561 10,096,210 15,190,956 4,411,875 6,071,000 149,760 21,875,771 121,311,115 60.71 1,998,206 BROOKLYN PARK213 BUFFALO 3,248,352 3,034,649 4,501,529 5,589,939 2,770,273 4,323,792 438,750 1,724,000 0 5,638,882 31,270,166 17.24 1,813,815 BUFFALO179 BURNSVILLE 10,440,824 8,254,924 15,523,808 18,694,339 8,475,222 11,228,316 5,021,250 4,477,000 0 18,065,445 100,181,128 44.77 2,237,684 BURNSVILLE249 BYRON 1,287,771 1,313,278 1,655,279 2,319,680 1,224,576 1,903,572 48,750 759,000 0 2,312,620 12,824,526 7.59 1,689,661 BYRON218 CAMBRIDGE 3,240,575 2,991,202 4,512,867 5,558,245 2,621,236 4,136,946 731,250 1,693,000 1,808,640 6,004,670 33,298,631 16.93 1,966,842 CAMBRIDGE193 CHAMPLIN 3,871,988 3,545,629 5,411,551 6,781,017 3,701,380 4,740,120 1,121,250 2,007,000 796,334 7,034,776 39,011,045 20.07 1,943,749 CHAMPLIN194 CHANHASSEN 4,652,038 4,060,304 6,763,770 7,900,993 3,851,958 5,656,794 1,486,875 2,276,000 975,600 8,277,352 45,901,684 22.76 2,016,770 CHANHASSEN196 CHASKA 3,929,263 3,678,340 5,445,731 6,811,999 3,277,311 4,896,870 999,375 2,095,000 1,764,720 7,237,684 40,136,293 20.95 1,915,814 CHASKA252 CHISAGO CITY 1,279,958 1,441,696 1,528,514 2,386,380 1,312,153 1,765,632 97,500 854,000 0 2,346,483 13,012,316 8.54 1,523,690 CHISAGO CITY111 CHISHOLM 1,225,594 1,421,317 1,382,609 2,359,974 1,292,178 2,051,544 243,750 841,000 47,880 2,390,482 13,256,328 8.41 1,576,258 CHISHOLM244 CIRCLE PINES 516,661 605,160 584,774 990,038 559,278 816,354 195,000 360,000 0 1,017,998 5,645,263 3.60 1,568,129 CIRCLE PINES112 CLOQUET 3,557,515 3,876,009 4,337,480 6,577,422 3,575,385 5,102,526 780,000 2,275,000 612,000 6,752,534 37,445,871 22.75 1,645,972 CLOQUET113 COLUMBIA HEIGHTS 2,176,293 2,176,272 2,806,241 3,971,587 1,926,743 3,064,776 487,500 1,250,000 0 3,929,068 21,788,480 12.50 1,743,078 COLUMBIA HEIGHTS114 COON RAPIDS 9,407,044 7,851,487 13,628,922 16,784,362 7,278,306 10,702,890 3,851,250 4,323,000 3,780,720 17,073,758 94,681,739 43.23 2,190,186 COON RAPIDS215 CORCORAN 1,737,236 2,516,180 1,485,173 3,683,124 2,386,152 2,454,078 48,750 1,553,000 79,884 3,507,586 19,451,163 15.53 1,252,490 CORCORAN180 COTTAGE GROVE 6,792,112 6,245,418 9,312,372 12,305,683 6,362,561 8,179,842 1,267,500 3,531,000 311,040 11,947,656 66,255,184 35.31 1,876,386 COTTAGE GROVE115 CROOKSTON 1,930,260 1,996,687 2,454,799 3,495,751 1,779,237 2,827,770 243,750 1,158,000 3,837,600 4,339,241 24,063,095 11.58 2,077,987 CROOKSTON116 CRYSTAL 2,745,550 2,989,221 3,233,608 5,412,199 2,801,003 4,115,628 633,750 1,747,000 0 5,209,148 28,887,107 17.47 1,653,526 CRYSTAL229 DAYTON 1,328,188 1,743,607 1,334,587 2,661,568 1,740,831 1,835,856 97,500 1,062,000 0 2,596,909 14,401,046 10.62 1,356,031 DAYTON247 DELANO 918,736 1,047,697 1,075,966 1,731,219 954,156 1,317,954 195,000 621,000 691,200 1,881,647 10,434,575 6.21 1,680,286 DELANO117 DETROIT LAKES 4,312,441 4,268,963 5,661,950 7,748,534 3,767,448 6,056,820 877,500 2,452,000 746,640 7,896,307 43,788,603 24.52 1,785,832 DETROIT LAKES118 DULUTH 23,421,707 20,813,922 33,075,526 41,321,024 18,396,267 28,517,214 15,746,250 11,671,000 9,116,406 44,457,450 246,536,766 116.71 2,112,388 DULUTH195 EAGAN 11,131,471 8,974,921 16,672,703 18,870,935 8,257,049 12,057,210 2,730,000 4,903,000 1,520,640 18,725,951 103,843,880 49.03 2,117,966 EAGAN203 EAST BETHEL 3,321,786 4,688,829 2,967,904 6,941,422 4,431,205 5,066,160 0 2,884,000 30,600 6,673,016 37,004,922 28.84 1,283,111 EAST BETHEL119 EAST GRAND FORKS 2,917,219 2,941,847 3,775,549 5,319,524 2,610,481 3,841,002 585,000 1,699,000 6,088,680 6,551,225 36,329,527 16.99 2,138,289 EAST GRAND FORKS181 EDEN PRAIRIE 11,285,055 8,942,465 16,816,169 19,935,829 8,768,693 11,959,398 4,411,875 4,854,000 1,480,500 19,459,876 107,913,860 48.54 2,223,194 EDEN PRAIRIE120 EDINA 9,443,662 7,510,606 14,163,835 16,313,536 6,883,431 10,245,180 4,582,500 4,085,000 3,702,780 16,924,724 93,855,254 40.85 2,297,558 EDINA204 ELK RIVER 7,379,807 6,772,003 10,237,556 12,966,695 6,425,563 9,159,216 1,608,750 3,827,000 2,008,800 13,284,781 73,670,171 38.27 1,925,011 ELK RIVER123 FAIRMONT 3,782,418 3,532,284 5,283,734 6,465,910 3,106,765 4,834,170 1,072,500 2,012,000 1,141,920 6,870,973 38,102,674 20.12 1,893,771 FAIRMONT124 FALCON HEIGHTS 500,002 557,452 598,827 932,052 505,503 709,764 292,500 329,000 0 973,524 5,398,624 3.29 1,640,919 FALCON HEIGHTS125 FARIBAULT 4,905,391 4,306,617 7,028,817 8,393,280 3,698,310 6,036,756 780,000 2,407,000 5,207,220 9,407,941 52,171,332 24.07 2,167,484 FARIBAULT212 FARMINGTON 2,895,353 2,884,681 3,851,161 5,081,293 2,685,770 3,524,994 48,750 1,669,000 1,101,600 5,223,370 28,965,972 16.69 1,735,529 FARMINGTON126 FERGUS FALLS 5,328,141 4,686,395 7,552,423 9,377,353 4,211,484 6,395,400 1,803,750 2,618,000 5,250,780 10,389,215 57,612,941 26.18 2,200,647 FERGUS FALLS214 FOREST LAKE 5,403,299 5,779,951 6,696,800 9,977,209 5,331,589 7,423,680 828,750 3,383,000 0 9,861,341 54,685,619 33.83 1,616,483 FOREST LAKE127 FRIDLEY 3,976,589 3,964,432 5,267,529 7,055,346 3,785,888 5,138,892 975,000 2,290,000 0 7,139,814 39,593,490 22.90 1,728,973 FRIDLEY226 GLENCOE 1,374,042 1,440,910 1,732,363 2,497,021 1,289,107 1,943,700 0 839,000 0 2,445,552 13,561,695 8.39 1,616,412 GLENCOE128 GOLDEN VALLEY 4,753,644 4,230,835 6,751,128 8,214,251 3,918,027 5,920,134 2,730,000 2,374,000 957,780 8,766,956 48,616,755 23.74 2,047,884 GOLDEN VALLEY129 GRAND RAPIDS 4,283,271 4,519,424 5,332,039 7,926,544 4,044,011 6,256,206 975,000 2,632,000 1,283,040 8,195,331 45,446,866 26.32 1,726,705 GRAND RAPIDS197 HAM LAKE 4,110,493 5,528,525 3,940,278 8,396,240 5,187,150 6,367,812 146,250 3,373,000 201,960 8,195,367 45,447,075 33.73 1,347,378 HAM LAKE130 HASTINGS 4,534,566 4,031,110 6,451,510 7,791,017 3,473,978 5,600,364 682,500 2,261,000 1,397,880 7,969,264 44,193,189 22.61 1,954,586 HASTINGS202 HERMANTOWN 3,491,603 3,275,777 4,838,880 6,003,117 2,865,536 4,516,908 487,500 1,865,000 144,000 6,047,429 33,535,750 18.65 1,798,164 HERMANTOWN131 HIBBING 8,051,441 9,152,078 9,435,492 15,166,546 8,349,230 11,412,654 780,000 5,419,000 35,190 14,916,363 82,717,994 54.19 1,526,444 HIBBING132 HOPKINS 2,157,605 1,806,060 3,202,720 3,591,268 1,534,943 2,475,396 2,291,250 999,000 0 3,972,815 22,031,057 9.99 2,205,311 HOPKINS224 HUGO 3,088,596 3,572,142 3,537,447 5,889,784 3,501,636 4,707,516 292,500 2,119,000 21,420 5,880,607 32,610,648 21.19 1,538,964 HUGO133 HUTCHINSON 3,778,018 3,452,567 5,291,229 6,578,914 3,011,496 4,866,774 536,250 1,952,000 4,016,340 7,366,385 40,849,973 19.52 2,092,724 HUTCHINSON134 INTERNATIONAL FALLS 1,040,178 1,339,045 1,038,931 2,102,463 1,241,469 1,695,408 292,500 808,000 0 2,102,753 11,660,747 8.08 1,443,162 INTERNATIONAL FALLS178 INVER GROVE HEIGHTS 5,836,963 5,664,326 7,770,030 10,553,257 5,652,708 7,600,494 1,121,250 3,244,000 0 10,437,469 57,880,497 34.71 1,667,545 INVER GROVE HEIGHTS245 ISANTI 918,644 1,148,081 951,770 1,831,705 1,058,632 1,521,102 0 689,000 0 1,786,165 9,905,099 6.89 1,437,605 ISANTI246 JORDAN 972,800 1,038,408 1,217,158 1,773,660 934,179 1,388,178 0 608,000 547,200 1,865,506 10,345,089 6.08 1,701,495 JORDAN240 KASSON 974,836 1,068,772 1,195,780 1,793,026 967,982 1,359,336 0 630,000 450,000 1,856,739 10,296,471 6.30 1,634,360 KASSON236 LA CRESCENT 769,048 971,619 784,464 1,543,221 897,301 1,281,588 0 584,000 0 1,502,871 8,334,112 5.84 1,427,074 LA CRESCENT234 LAKE CITY 1,153,596 1,402,552 1,245,880 2,258,586 1,289,104 1,813,284 146,250 839,000 0 2,232,615 12,380,867 8.39 1,475,669 LAKE CITY206 LAKE ELMO 2,794,622 3,089,191 3,315,656 5,251,507 2,834,807 4,401,540 48,750 1,812,000 183,600 5,220,970 28,952,643 18.12 1,597,828 LAKE ELMO188 LAKEVILLE 13,264,303 12,092,409 18,691,340 22,586,636 11,293,125 16,448,718 2,242,500 6,833,000 173,560 22,797,628 126,423,219 68.33 1,850,186 LAKEVILLE210 LINO LAKES 3,175,741 3,966,802 3,315,556 6,302,966 3,699,844 5,171,496 195,000 2,384,000 0 6,206,503 34,417,908 23.84 1,443,704 LINO LAKES135 LITCHFIELD 1,239,539 1,475,177 1,357,944 2,417,566 1,347,492 2,082,894 243,750 877,000 0 2,429,095 13,470,457 8.77 1,535,970 LITCHFIELD200 LITTLE CANADA 1,971,868 1,967,945 2,601,806 3,494,194 1,743,903 2,751,276 292,500 1,135,000 80,546 3,528,586 19,567,624 11.35 1,724,020 LITTLE CANADA136 LITTLE FALLS 3,368,859 3,700,697 4,060,734 6,290,844 3,380,254 4,707,516 585,000 2,175,000 0 6,219,157 34,488,061 21.75 1,585,658 LITTLE FALLS219 MAHTOMEDI 1,400,359 1,614,347 1,600,962 2,674,247 1,573,357 2,131,800 97,500 956,000 0 2,650,684 14,699,256 9.56 1,537,579 MAHTOMEDI137 MANKATO 9,380,841 7,348,834 13,896,049 17,047,822 6,767,431 9,855,186 5,411,250 3,966,500 1,756,800 16,594,752 92,025,465 39.67 2,319,775 MANKATO189 MAPLE GROVE 11,874,516 10,401,344 16,808,083 21,338,290 10,506,445 13,229,700 4,826,250 5,817,000 1,352,682 21,153,946 117,308,256 58.17 2,016,645 MAPLE GROVE138 MAPLEWOOD 6,857,634 6,449,859 9,433,143 11,879,060 6,127,481 9,066,420 1,365,000 3,668,000 1,915,798 12,487,730 69,250,125 36.68 1,887,953 MAPLEWOOD139 MARSHALL 3,382,064 3,269,358 4,618,465 5,863,700 3,329,547 4,602,180 536,250 1,878,000 1,470,420 6,368,995 35,318,979 18.78 1,880,670 MARSHALL250 MEDINA 1,602,599 2,080,310 1,594,993 3,237,939 1,934,428 2,575,716 195,000 1,259,000 0 3,185,597 17,665,582 12.59 1,403,144 MEDINA140 MENDOTA HEIGHTS 2,567,626 2,617,004 3,337,432 4,587,729 2,396,908 3,629,076 390,000 1,517,000 0 4,629,410 25,672,185 15.17 1,692,300 MENDOTA HEIGHTS141 MINNEAPOLIS 47,504,714 37,997,283 70,841,690 82,382,337 33,003,617 51,694,896 73,076,250 20,682,000 49,050,918 102,571,411 568,805,116 206.82 2,750,242 MINNEAPOLIS142 MINNETONKA 9,939,633 9,061,682 13,938,340 17,241,395 8,151,027 12,473,538 3,412,500 5,119,000 0 17,454,171 96,791,286 51.19 1,890,824 MINNETONKA243 MINNETRISTA 1,440,838 2,102,884 1,206,368 3,077,415 1,994,351 2,086,656 48,750 1,298,000 88,200 2,935,563 16,279,025 12.98 1,254,162 MINNETRISTA143 MONTEVIDEO 1,361,960 1,524,069 1,611,536 2,559,795 1,379,758 2,119,260 146,250 898,000 0 2,552,137 14,152,765 8.98 1,576,032 MONTEVIDEO222 MONTICELLO 2,470,723 2,178,094 3,547,855 4,153,307 1,912,919 2,969,472 438,750 1,219,000 0 4,155,828 23,045,948 12.19 1,890,562 MONTICELLO144 MOORHEAD 10,078,017 8,654,280 14,267,255 18,549,685 8,983,796 11,702,328 5,070,000 4,801,000 16,785,360 21,756,184 120,647,905 48.01 2,512,974 MOORHEAD190 MORRIS 1,448,238 1,566,738 1,777,600 2,671,067 1,435,074 2,183,214 146,250 918,000 0 2,672,159 14,818,340 9.18 1,614,198 MORRIS145 MOUND 1,272,971 1,355,519 1,601,213 2,312,747 1,219,961 1,766,886 97,500 794,000 0 2,292,575 12,713,372 7.94 1,601,180 MOUND146 MOUNDS VIEW 1,641,716 1,841,733 1,939,447 3,086,919 1,687,056 2,519,286 341,250 1,086,000 0 3,111,549 17,254,956 10.86 1,588,854 MOUNDS VIEW147 NEW BRIGHTON 2,435,824 2,604,368 3,035,021 4,487,722 2,346,206 3,331,878 511,875 1,527,000 124,200 4,488,899 24,892,993 15.27 1,630,189 NEW BRIGHTON182 NEW HOPE 2,718,510 2,316,134 3,966,455 4,652,659 1,975,915 3,210,240 1,023,750 1,286,000 0 4,652,926 25,802,589 12.86 2,006,422 NEW HOPE237 NEW PRAGUE 1,064,781 1,296,752 1,147,900 2,086,017 1,192,312 1,682,868 0 776,000 30,600 2,040,990 11,318,220 7.76 1,458,534 NEW PRAGUE148 NEW ULM 3,042,133 3,107,154 3,941,300 5,448,015 3,000,752 4,382,730 292,500 1,801,000 1,239,840 5,776,193 32,031,617 18.01 1,778,546 NEW ULM225 NORTH BRANCH 3,728,220 4,621,719 3,979,300 7,316,722 4,371,282 5,448,630 97,500 2,781,000 86,400 7,134,769 39,565,542 27.81 1,422,709 NORTH BRANCH150 NORTH MANKATO 3,299,029 2,842,451 4,665,057 6,029,189 2,618,164 3,873,606 975,000 1,577,000 0 5,693,485 31,572,981 15.77 2,002,091 NORTH MANKATO151 NORTH ST PAUL 1,872,728 1,948,050 2,389,623 3,378,094 1,765,412 2,560,668 438,750 1,134,000 0 3,407,211 18,894,536 11.34 1,666,185 NORTH ST PAUL149 NORTHFIELD 3,040,283 2,972,500 4,054,793 5,395,155 2,956,192 4,007,784 0 1,706,000 1,062,720 5,542,990 30,738,417 17.06 1,801,783 NORTHFIELD223 OAK GROVE 3,422,298 4,271,590 3,618,345 6,742,277 3,953,364 5,210,370 0 2,573,000 0 6,554,073 36,345,317 25.73 1,412,566 OAK GROVE185 OAKDALE 4,312,413 3,529,526 6,465,920 7,164,836 3,063,741 4,863,012 1,072,500 1,939,000 0 7,130,409 39,541,357 19.39 2,039,265 OAKDALE152 ORONO 1,623,288 1,637,478 2,112,279 2,902,897 1,465,803 2,370,060 195,000 945,000 1,022,760 3,140,406 17,414,971 9.45 1,842,854 ORONO217 OTSEGO 3,717,128 4,035,966 4,581,787 6,825,208 3,644,530 5,263,038 243,750 2,372,000 0 6,750,350 37,433,757 23.72 1,578,152 OTSEGO153 OWATONNA 6,828,611 6,155,131 9,549,723 12,160,944 5,322,357 8,643,822 1,267,500 3,464,000 2,190,780 12,228,234 67,811,102 34.64 1,957,595 OWATONNA155 PLYMOUTH 14,824,237 11,968,488 21,911,152 26,150,629 11,102,604 16,044,930 1,852,500 6,531,000 4,861,501 25,354,350 140,601,391 65.31 2,152,831 PLYMOUTH201 PRIOR LAKE 3,275,779 3,664,757 3,900,671 6,127,129 3,747,472 4,962,078 682,500 2,163,000 108,360 6,298,983 34,930,729 21.63 1,614,920 PRIOR LAKE199 RAMSEY 5,134,929 6,294,688 5,589,181 9,979,150 5,853,990 7,592,970 828,750 3,786,000 679,320 10,062,577 55,801,555 37.86 1,473,892 RAMSEY156 RED WING 4,748,297 4,388,945 6,592,930 8,282,601 4,065,521 6,135,822 438,750 2,487,000 1,788,300 8,564,195 47,492,361 24.87 1,909,624 RED WING207 REDWOOD FALLS 1,387,527 1,747,809 1,433,752 2,764,889 1,633,282 2,252,184 97,500 1,052,000 689,670 2,872,896 15,931,509 10.52 1,514,402 REDWOOD FALLS157 RICHFIELD 5,204,361 4,452,875 7,421,856 9,384,914 4,678,584 6,187,236 3,656,250 2,467,000 0 9,559,678 53,012,754 24.67 2,148,875 RICHFIELD158 ROBBINSDALE 1,770,987 1,748,684 2,332,371 3,195,540 1,604,081 2,402,664 755,625 1,005,000 672,840 3,407,316 18,895,108 10.05 1,880,110 ROBBINSDALE159 ROCHESTER 25,249,064 19,948,001 37,284,960 45,778,432 19,275,144 26,505,798 15,892,500 10,801,000 21,519,442 48,895,957 271,150,298 108.01 2,510,418 ROCHESTER238 ROGERS 4,004,497 3,761,321 5,475,922 7,068,502 3,693,696 5,321,976 633,750 2,137,000 0 7,061,266 39,157,930 21.37 1,832,379 ROGERS208 ROSEMOUNT 4,864,789 5,044,998 6,241,091 8,734,817 4,634,790 6,118,893 438,750 2,938,500 756,000 8,749,980 48,522,608 29.39 1,650,990 ROSEMOUNT160 ROSEVILLE 5,010,831 5,388,063 6,182,760 9,248,479 4,945,932 7,196,706 1,560,000 3,155,000 87,840 9,410,632 52,186,243 31.55 1,654,081 ROSEVILLE220 SARTELL 3,818,936 3,317,811 5,514,676 6,558,276 3,183,585 4,619,736 438,750 1,852,000 316,613 6,516,484 36,136,867 18.52 1,951,235 SARTELL191 SAUK RAPIDS 2,584,999 2,488,469 3,451,866 4,682,931 2,455,293 3,563,868 780,000 1,421,000 4,709,520 5,750,343 31,888,289 14.21 2,244,074 SAUK RAPIDS211 SAVAGE 5,055,043 4,775,971 6,988,634 8,691,853 4,406,624 6,435,528 487,500 2,727,000 1,008,000 8,926,750 49,502,903 27.27 1,815,288 SAVAGE166 SHAKOPEE 7,735,038 6,923,209 10,840,807 13,767,921 6,281,135 9,451,398 1,023,750 3,888,000 394,560 13,267,279 73,573,097 38.88 1,892,312 SHAKOPEE167 SHOREVIEW 3,330,737 3,395,800 4,329,227 5,948,937 3,214,315 4,748,898 804,375 1,969,000 0 6,103,085 33,844,374 19.69 1,718,861 SHOREVIEW216 SHOREWOOD 1,625,506 1,598,764 2,177,967 2,854,839 1,413,562 2,307,360 146,250 920,000 0 2,869,735 15,913,983 9.20 1,729,781 SHOREWOOD168 SOUTH ST PAUL 3,074,404 3,039,222 4,054,535 5,484,776 2,682,695 4,331,316 438,750 1,746,000 40,545 5,476,293 30,368,536 17.46 1,739,321 SOUTH ST PAUL183 SPRING LAKE PARK 1,124,924 1,029,466 1,581,319 1,918,187 904,985 1,459,656 0 582,000 0 1,892,120 10,492,657 5.82 1,802,862 SPRING LAKE PARK161 ST ANTHONY 1,236,274 1,066,833 1,797,491 2,105,665 961,837 1,428,306 609,375 595,000 695,520 2,309,187 12,805,488 5.95 2,152,183 ST ANTHONY162 ST CLOUD 14,413,708 11,982,759 20,696,878 26,640,150 11,529,751 15,590,982 8,263,125 6,590,000 6,506,280 26,886,997 149,100,630 65.90 2,262,529 ST CLOUD235 ST FRANCIS 1,958,704 2,270,325 2,219,554 3,756,790 2,066,567 3,018,378 0 1,345,000 0 3,659,769 20,295,087 13.45 1,508,928 ST FRANCIS233 ST JOSEPH 1,046,403 1,134,470 1,260,355 2,030,208 1,023,290 1,290,366 195,000 666,000 0 1,902,143 10,548,235 6.66 1,583,819 ST JOSEPH163 ST LOUIS PARK 7,682,532 6,088,782 11,345,008 13,985,205 5,794,066 8,193,636 5,240,625 3,302,000 1,067,760 13,793,927 76,493,541 33.02 2,316,582 ST LOUIS PARK227 ST MICHAEL 3,422,856 3,880,586 3,988,210 6,483,058 3,994,850 5,423,550 341,250 2,291,000 0 6,561,580 36,386,940 22.91 1,588,256 ST MICHAEL164 ST PAUL 37,243,027 30,151,960 54,790,194 66,670,963 27,754,967 40,628,346 33,564,375 16,473,000 62,307,405 81,308,538 450,892,775 164.73 2,737,162 ST PAUL184 ST PAUL PARK 980,311 1,019,075 1,259,269 1,761,277 912,672 1,359,336 0 594,000 1,418,400 2,046,957 11,351,297 5.94 1,910,993 ST PAUL PARK165 ST PETER 2,679,308 2,577,270 3,603,517 4,805,520 2,264,772 3,596,472 195,000 1,474,000 0 4,663,090 25,858,949 14.74 1,754,338 ST PETER228 STEWARTVILLE 627,740 783,693 656,334 1,245,114 723,682 1,005,708 97,500 471,000 0 1,234,369 6,845,140 4.71 1,453,321 STEWARTVILLE169 STILLWATER 3,348,553 3,203,638 4,461,703 6,115,282 3,059,130 4,382,730 633,750 1,825,000 73,440 5,962,710 33,065,936 18.25 1,811,832 STILLWATER170 THIEF RIVER FALLS 2,785,134 2,809,462 3,633,890 4,967,810 2,502,929 3,902,448 877,500 1,623,000 2,604,960 5,655,567 31,362,700 16.23 1,932,391 THIEF RIVER FALLS209 VADNAIS HEIGHTS 1,607,422 1,589,497 2,152,448 2,820,298 1,408,949 2,199,516 390,000 917,000 0 2,878,729 15,963,859 9.17 1,740,879 VADNAIS HEIGHTS241 VICTORIA 1,219,526 1,465,553 1,348,408 2,357,882 1,347,492 1,892,286 97,500 877,000 300,600 2,399,372 13,305,619 8.77 1,517,174 VICTORIA171 VIRGINIA 3,392,015 2,935,679 4,931,574 5,670,217 2,513,684 4,019,070 97,500 1,636,000 207,360 5,588,684 30,991,783 16.36 1,894,363 VIRGINIA231 WACONIA 2,690,178 2,486,322 3,702,750 4,757,740 2,160,291 3,429,690 731,250 1,406,000 43,200 4,709,636 26,117,057 14.06 1,857,543 WACONIA221 WAITE PARK 1,553,639 1,281,566 2,243,565 2,822,907 1,118,557 1,621,422 950,625 702,000 0 2,704,742 14,999,023 7.02 2,136,613 WAITE PARK172 WASECA 1,296,857 1,329,870 1,671,699 2,330,525 1,184,622 1,924,890 97,500 771,000 0 2,333,531 12,940,494 7.71 1,678,404 WASECA173 WEST ST PAUL 2,677,101 2,408,919 3,820,147 4,518,288 2,192,555 3,405,864 609,375 1,358,000 0 4,617,857 25,608,106 13.58 1,885,722 WEST ST PAUL174 WHITE BEAR LAKE 3,754,167 3,647,513 5,064,683 6,609,700 3,217,385 4,975,872 828,750 2,094,000 0 6,642,254 36,834,324 20.94 1,759,041 WHITE BEAR LAKE175 WILLMAR 5,423,215 4,892,796 7,478,349 9,935,837 4,773,843 6,722,694 1,706,250 2,748,000 4,010,040 10,492,023 58,183,047 27.87 2,087,659 WILLMAR176 WINONA 5,078,686 4,026,044 7,603,206 8,832,775 3,526,221 5,412,264 1,755,000 2,186,000 813,600 8,631,443 47,865,239 21.86 2,189,627 WINONA192 WOODBURY 12,949,684 10,519,542 19,055,362 23,026,119 10,638,584 14,235,408 4,728,750 5,752,000 1,607,040 22,552,746 125,065,235 57.52 2,174,291 WOODBURY177 WORTHINGTON 2,119,904 2,060,446 2,836,076 3,730,329 1,811,512 2,953,170 195,000 1,179,000 395,712 3,801,855 21,083,004 11.79 1,788,211 WORTHINGTON248 WYOMING 2,481,801 2,704,921 3,057,568 4,556,663 2,446,076 3,452,262 146,250 1,592,000 0 4,496,258 24,933,799 15.92 1,566,193 WYOMING251 ZIMMERMAN 770,831 1,063,711 707,223 1,599,849 1,050,952 1,210,110 0 651,000 0 1,551,808 8,605,484 6.51 1,321,887 ZIMMERMAN
TOTAL $720,388,539 $662,939,922 $992,656,813 $1,289,820,693 $618,230,336 $887,252,025 $296,375,625 $374,947,000 $282,051,060 $1,347,425,588 $7,472,087,601 3,752.13 $1,991,426 TOTAL
Percent of Total Needs - 2017 9.64% 8.87% 13.28% 17.26% 8.27% 11.87% 3.97% 5.02% 3.77% 18.03%

2017 Mileage ReportTOTAL NEEDS TOTAL NEEDS TOTAL LENGTH
TOTAL LENGTH LENGTH CODED LENGTH OF OF THTB TRUNK HIGHWAY TRUNK IMPROVED UNIMPROVED NON-EXISTING TOTAL TOTALCITY OUTSIDE THE AS COMMON MSB APPROVED ELIGIBLE FOR TURNBACK CSAH COUNTY ROAD HIGHWAY NEEDS NEEDS NEEDS NEEDS SYSTEM
NUMBER MUNICIPALITY CITY LIMITS BOUNDARY DESGN. ONE WAY MILEAGE THTB FUNDING (Non Eligible for THTB funding) TURNBACK TURNBACK TURNBACK MILEAGE MILEAGE MILEAGE LENGTH LENGTH MUNICIPALITY101 ALBERT LEA 1.00 0.28 0.90 1.00 24.31 24.31 24.31 ALBERT LEA242 ALBERTVILLE 0.90 7.51 7.51 7.51 ALBERTVILLE102 ALEXANDRIA 0.60 4.80 7.06 0.60 33.29 33.29 33.29 ALEXANDRIA198 ANDOVER 0.04 1.71 1.80 33.54 9.98 43.48 43.52 ANDOVER103 ANOKA 1.07 1.18 1.07 15.42 15.42 15.42 ANOKA186 APPLE VALLEY 0.82 35.09 2.24 37.33 37.33 APPLE VALLEY187 ARDEN HILLS 0.13 1.78 0.24 6.92 0.61 7.53 7.53 ARDEN HILLS104 AUSTIN 4.72 4.72 29.88 0.33 30.21 30.21 AUSTIN230 BAXTER 16.22 0.90 17.12 17.12 BAXTER239 BELLE PLAINE 8.43 0.52 8.95 8.95 BELLE PLAINE105 BEMIDJI 1.46 18.72 18.72 18.72 BEMIDJI232 BIG LAKE 11.30 0.18 11.48 11.48 BIG LAKE106 BLAINE 0.17 2.37 45.95 4.41 50.36 50.36 BLAINE107 BLOOMINGTON 0.65 1.54 0.58 1.54 76.12 76.12 76.12 BLOOMINGTON108 BRAINERD 2.48 2.48 18.33 0.83 19.16 19.16 BRAINERD109 BROOKLYN CENTER 0.94 0.52 0.52 21.34 21.34 21.34 BROOKLYN CENTER110 BROOKLYN PARK 2.87 4.48 1.00 4.48 60.43 0.28 60.71 60.71 BROOKLYN PARK213 BUFFALO 0.09 1.16 1.46 17.33 17.24 17.33 BUFFALO179 BURNSVILLE 44.77 44.77 44.77 BURNSVILLE249 BYRON 1.99 7.59 7.59 7.59 BYRON218 CAMBRIDGE 3.83 1.20 0.49 3.83 16.68 0.25 16.93 16.93 CAMBRIDGE193 CHAMPLIN 2.06 0.70 0.14 0.70 19.77 0.30 20.07 20.07 CHAMPLIN194 CHANHASSEN 0.50 0.60 0.60 22.35 0.41 22.76 22.76 CHANHASSEN196 CHASKA 0.11 2.40 19.71 1.24 20.95 20.95 CHASKA252 CHISAGO CITY 8.54 8.54 8.54 CHISAGO CITY111 CHISHOLM 0.72 0.72 8.32 0.09 8.41 8.41 CHISHOLM244 CIRCLE PINES 3.24 0.36 3.60 3.60 CIRCLE PINES112 CLOQUET 1.75 1.75 22.59 0.16 22.75 22.75 CLOQUET113 COLUMBIA HEIGHTS 1.58 0.88 12.50 12.50 12.50 COLUMBIA HEIGHTS114 COON RAPIDS 0.64 1.44 0.75 1.44 43.23 43.23 43.23 COON RAPIDS215 CORCORAN 0.51 15.08 0.45 15.53 15.53 CORCORAN180 COTTAGE GROVE 1.25 28.83 1.09 5.39 35.31 35.31 COTTAGE GROVE115 CROOKSTON 1.58 1.58 11.58 11.58 11.58 CROOKSTON116 CRYSTAL 1.72 17.47 17.47 17.47 CRYSTAL229 DAYTON 9.60 1.02 10.62 10.62 DAYTON247 DELANO 6.21 6.21 6.21 DELANO117 DETROIT LAKES 2.11 5.57 3.28 2.11 24.52 24.52 24.52 DETROIT LAKES118 DULUTH 28.00 0.06 28.00 116.71 116.71 116.71 DULUTH195 EAGAN 0.42 0.37 0.25 0.37 47.98 1.05 49.03 49.03 EAGAN203 EAST BETHEL 2.16 23.67 5.17 28.84 28.84 EAST BETHEL119 EAST GRAND FORKS 2.27 4.16 2.27 16.99 16.99 16.99 EAST GRAND FORKS181 EDEN PRAIRIE 0.78 2.14 2.14 48.54 48.54 48.54 EDEN PRAIRIE120 EDINA 1.02 40.85 40.85 40.85 EDINA204 ELK RIVER 0.40 1.24 0.25 3.61 1.24 36.94 1.33 38.27 38.27 ELK RIVER123 FAIRMONT 5.87 5.87 20.01 0.11 20.12 20.12 FAIRMONT124 FALCON HEIGHTS 0.88 0.50 0.25 3.29 3.29 3.29 FALCON HEIGHTS125 FARIBAULT 0.32 0.77 0.77 24.39 24.07 24.39 FARIBAULT212 FARMINGTON 0.24 12.66 4.03 16.69 16.69 FARMINGTON126 FERGUS FALLS 8.03 8.03 26.18 26.18 26.18 FERGUS FALLS214 FOREST LAKE 8.51 32.97 0.86 33.83 33.83 FOREST LAKE127 FRIDLEY 0.61 22.90 22.90 22.90 FRIDLEY226 GLENCOE 0.74 8.25 0.14 8.39 8.39 GLENCOE128 GOLDEN VALLEY 23.74 23.74 23.74 GOLDEN VALLEY129 GRAND RAPIDS 7.07 25.68 0.64 26.32 26.32 GRAND RAPIDS197 HAM LAKE 1.64 0.97 26.13 2.52 5.08 33.73 33.73 HAM LAKE130 HASTINGS 2.46 2.46 22.61 22.61 22.61 HASTINGS202 HERMANTOWN 0.24 2.91 18.57 0.08 18.65 18.65 HERMANTOWN131 HIBBING 5.11 5.11 53.50 0.69 54.19 54.19 HIBBING132 HOPKINS 0.44 0.35 9.92 0.07 9.99 9.99 HOPKINS224 HUGO 0.34 20.96 0.23 21.19 21.19 HUGO133 HUTCHINSON 0.21 2.77 3.03 0.21 19.52 19.52 19.52 HUTCHINSON134 INTERNATIONAL FALLS 8.08 8.08 8.08 INTERNATIONAL FALLS178 INVER GROVE HEIGHTS 0.32 3.57 1.08 33.95 0.76 34.71 34.71 INVER GROVE HEIGHTS245 ISANTI 6.83 0.06 6.89 6.89 ISANTI246 JORDAN 6.06 0.02 6.08 6.08 JORDAN240 KASSON 6.03 0.13 0.14 6.30 6.30 KASSON236 LA CRESCENT 5.84 5.84 5.84 LA CRESCENT234 LAKE CITY 0.44 8.39 8.39 8.39 LAKE CITY206 LAKE ELMO 0.04 2.15 17.88 0.24 18.12 18.12 LAKE ELMO188 LAKEVILLE 2.53 7.29 65.11 1.07 2.15 68.33 68.33 LAKEVILLE210 LINO LAKES 0.38 0.28 0.34 0.98 0.28 22.01 1.83 23.84 23.84 LINO LAKES135 LITCHFIELD 8.77 8.77 8.77 LITCHFIELD200 LITTLE CANADA 0.40 1.03 4.03 11.35 11.35 11.35 LITTLE CANADA136 LITTLE FALLS 2.63 1.99 2.63 21.45 0.15 0.15 21.75 21.75 LITTLE FALLS219 MAHTOMEDI 0.99 0.69 9.56 9.56 9.56 MAHTOMEDI137 MANKATO 0.64 0.795 6.39 1.98 6.39 40.00 0.64 0.46 39.67 41.10 MANKATO189 MAPLE GROVE 1.00 0.50 0.50 50.84 7.33 58.17 58.17 MAPLE GROVE138 MAPLEWOOD 1.59 7.95 3.37 36.68 36.68 36.68 MAPLEWOOD139 MARSHALL 1.42 3.55 1.42 18.07 0.71 18.78 18.78 MARSHALL250 MEDINA 0.94 11.59 1.00 12.59 12.59 MEDINA140 MENDOTA HEIGHTS 0.17 0.23 0.65 0.23 15.34 15.17 15.34 MENDOTA HEIGHTS141 MINNEAPOLIS 1.82 8.98 9.67 8.98 206.03 0.79 206.82 206.82 MINNEAPOLIS142 MINNETONKA 2.04 51.16 0.03 51.19 51.19 MINNETONKA243 MINNETRISTA 0.41 13.39 12.98 13.39 MINNETRISTA143 MONTEVIDEO 0.16 9.14 8.98 9.14 MONTEVIDEO222 MONTICELLO 0.50 0.74 11.97 0.22 12.19 12.19 MONTICELLO144 MOORHEAD 2.10 2.99 7.49 2.99 50.11 48.01 50.11 MOORHEAD190 MORRIS 1.80 9.18 9.18 9.18 MORRIS145 MOUND 7.71 0.23 7.94 7.94 MOUND146 MOUNDS VIEW 0.24 1.23 2.10 10.86 10.86 10.86 MOUNDS VIEW147 NEW BRIGHTON 0.38 0.73 0.38 12.98 2.29 15.27 15.27 NEW BRIGHTON182 NEW HOPE 1.53 12.86 12.86 12.86 NEW HOPE237 NEW PRAGUE 7.62 0.14 7.76 7.76 NEW PRAGUE148 NEW ULM 0.58 0.58 18.01 18.01 18.01 NEW ULM225 NORTH BRANCH 0.70 4.52 27.18 0.63 27.81 27.81 NORTH BRANCH150 NORTH MANKATO 1.79 0.22 1.79 15.77 15.77 15.77 NORTH MANKATO151 NORTH ST PAUL 1.25 2.73 11.22 0.12 11.34 11.34 NORTH ST PAUL149 NORTHFIELD 0.80 1.29 0.80 16.53 0.53 17.06 17.06 NORTHFIELD223 OAK GROVE 1.97 1.55 23.32 2.41 25.73 25.73 OAK GROVE185 OAKDALE 0.04 0.60 0.60 19.39 19.39 19.39 OAKDALE152 ORONO 0.41 9.45 9.45 9.45 ORONO217 OTSEGO 1.15 22.62 1.10 23.72 23.72 OTSEGO153 OWATONNA 7.91 1.31 34.64 34.64 34.64 OWATONNA155 PLYMOUTH 1.51 1.76 65.31 65.31 65.31 PLYMOUTH201 PRIOR LAKE 0.21 0.23 1.20 0.61 20.26 1.58 21.63 21.84 PRIOR LAKE199 RAMSEY 0.40 1.99 32.36 5.50 37.86 37.86 RAMSEY156 RED WING 0.50 24.26 0.61 24.87 24.87 RED WING207 REDWOOD FALLS 2.02 0.33 9.93 0.59 10.52 10.52 REDWOOD FALLS157 RICHFIELD 24.67 24.67 24.67 RICHFIELD158 ROBBINSDALE 0.54 0.55 0.55 10.05 10.05 10.05 ROBBINSDALE159 ROCHESTER 0.45 5.54 5.53 3.60 5.54 107.14 1.32 108.01 108.46 ROCHESTER238 ROGERS 1.83 21.07 0.30 21.37 21.37 ROGERS208 ROSEMOUNT 0.175 0.01 6.36 28.64 0.75 29.39 29.39 ROSEMOUNT160 ROSEVILLE 1.02 3.77 3.94 31.51 0.04 31.55 31.55 ROSEVILLE220 SARTELL 1.86 18.52 18.52 18.52 SARTELL191 SAUK RAPIDS 1.02 0.39 1.02 14.21 14.21 14.21 SAUK RAPIDS211 SAVAGE 1.82 2.06 25.15 2.12 27.27 27.27 SAVAGE166 SHAKOPEE 0.23 0.92 3.15 3.01 0.92 37.25 1.63 38.88 38.88 SHAKOPEE167 SHOREVIEW 0.25 3.95 0.76 18.58 1.11 19.69 19.69 SHOREVIEW216 SHOREWOOD 0.69 9.20 9.20 9.20 SHOREWOOD168 SOUTH ST PAUL 0.07 0.80 1.60 0.18 0.80 17.46 17.46 17.46 SOUTH ST PAUL183 SPRING LAKE PARK 0.12 0.29 5.82 5.82 5.82 SPRING LAKE PARK161 ST ANTHONY 0.65 0.45 5.95 5.95 5.95 ST ANTHONY162 ST CLOUD 0.19 4.32 3.40 1.60 4.32 59.25 1.06 5.59 65.90 65.90 ST CLOUD235 ST FRANCIS 0.24 1.22 13.27 0.18 13.45 13.45 ST FRANCIS233 ST JOSEPH 0.92 0.21 6.16 0.50 6.66 6.66 ST JOSEPH163 ST LOUIS PARK 0.39 3.54 32.86 0.16 33.02 33.02 ST LOUIS PARK227 ST MICHAEL 0.50 0.25 0.18 0.55 23.27 0.14 22.91 23.41 ST MICHAEL164 ST PAUL 1.21 7.07 3.45 7.07 161.39 3.34 164.73 164.73 ST PAUL184 ST PAUL PARK 0.20 5.94 5.94 5.94 ST PAUL PARK165 ST PETER 2.12 1.56 2.12 14.44 0.30 14.74 14.74 ST PETER228 STEWARTVILLE 4.49 0.22 4.71 4.71 STEWARTVILLE169 STILLWATER 17.73 0.52 18.25 18.25 STILLWATER170 THIEF RIVER FALLS 2.26 0.78 16.10 0.13 16.23 16.23 THIEF RIVER FALLS209 VADNAIS HEIGHTS 0.57 0.59 8.90 0.27 9.17 9.17 VADNAIS HEIGHTS241 VICTORIA 7.52 1.25 8.77 8.77 VICTORIA171 VIRGINIA 4.14 1.82 4.14 16.36 16.36 16.36 VIRGINIA231 WACONIA 0.30 4.35 14.27 0.09 14.06 14.36 WACONIA221 WAITE PARK 0.19 0.51 0.51 7.02 7.02 7.02 WAITE PARK172 WASECA 7.71 7.71 7.71 WASECA173 WEST ST PAUL 0.96 0.98 0.23 13.58 13.58 13.58 WEST ST PAUL174 WHITE BEAR LAKE 0.01 1.98 1.09 20.95 20.94 20.95 WHITE BEAR LAKE175 WILLMAR 6.74 0.94 6.74 27.48 0.39 27.87 27.87 WILLMAR176 WINONA 21.30 0.56 21.86 21.86 WINONA192 WOODBURY 56.41 1.11 57.52 57.52 WOODBURY177 WORTHINGTON 0.45 0.65 0.45 11.79 11.79 11.79 WORTHINGTON248 WYOMING 2.36 15.70 0.22 15.92 15.92 WYOMING251 ZIMMERMAN 5.65 0.20 0.66 6.51 6.51 ZIMMERMAN
TOTAL 3.30 48.225 2.895 0.00 146.75 136.36 122.50 146.75 3647.52 8.41 102.40 3752.13 3758.33 TOTAL