austintexas.gov2017 MotoGP Economic Impact: MERP | 9 2017 MotoGP ECONOMIC IMPACT AE estimated the...
55
Transcript of austintexas.gov2017 MotoGP Economic Impact: MERP | 9 2017 MotoGP ECONOMIC IMPACT AE estimated the...


2017 MotoGP ECONOMIC IMPACT ESTIMATES:MAJOR EVENTS REIMBURSEMENT PROGRAM
January 23, 2017
Prepared for: Circuit Events Local Organizing Committee 100 Congress Avenue, Suite 1300 Austin, Texas 78701-2744
CIRCUIT OF THE AMERICAS

2017 MotoGP Economic Impact: MERP | 2
TABLE OF CONTENTS
Executive Summary…………………….……………………......................................................................................... 5
2017 MotoGP Economic Impact.................................................................................................................. 8
2017 MotoGP Detailed Economic Impact................................................................................................... 14
Methodology…………………………………………………………………………………………………………………………………………. 17
Exhibits……….................................................................................................................................................. 20

2017 MotoGP Economic Impact: MERP | 3
TABLE OF CONTENTS (Exhibits)
Exhibit
Approved Tax Rates……………………………………………………………………............................................................. A
Implan Accounting of Wholesale Sales of Alcohol Sales……....................................................................... B
Certified Attendance……………………………………………………………………............................................................. C
Master Tables & Input Calculations............................................................................................................. D
IMPLAN Multipliers………………………………………………………………………………………………………………………………… E

2017 MotoGP Economic Impact: MERP | 4
TABLE OF CONTENTS (Tables)
Table 1 – 2017 MotoGP Estimated Expenditures and Effects 5
Table 2 – 2017 Estimated Out-of-state Attendance 5
Table 3 – 2017 Estimated Total Daily Attendance 5
Table 4 – 2017 Estimated Daily Attendee Expenditures 6
Table 5 – MERP Tax Categories and Rates (2016) 7
Table 6 – IMPLAN Multipliers 7
Table 7 – 2017 MotoGP Estimated Total Expenditures 8
Table 8 – 2017 MotoGP Estimated Direct Incremental Tax Receipt Increase by Category 9
Table 9 – 2017 MotoGP Estimated Indirect Incremental Tax Receipt Increases 10
Table 10 – 2017 MotoGP Estimated Induced Incremental Tax Receipt Increases 11
Table 11 – 2017 MotoGP Estimated Incremental Tax Receipt Increases by Category 12
Table 12 – 2017 MotoGP Total Incremental Tax Gain 13
Table 13 – 2017 Estimated Sales and Use Expenditures 14
Table 14– 2017 Detailed Attendee Expenditures Estimates 14
Table 15 – 2017 Estimated Sales and Use Direct Tax Impacts 14
Table 16 – 2017 Estimated Hotel Occupancy Direct Tax Effect 15
Table 17 – 2017 Estimated Mixed Beverage Direct Tax Effects 15
Table 18 – 2017 Estimated Title 5, Alcoholic Beverage Code Direct Tax Effect 16
Table 19 – 2017 Estimated Rental Vehicle Direct Tax Effect 16
Table 20 – 2017 Estimated Hotel and Rental Car Expenditures 17
Table 21 – 2017 Estimated Daily Attendee Expenditures 17
Table 22 – Indirect and Induced Expenditure Calculations Based on IMPLAN Multipliers 19

2017 MotoGP Economic Impact: MERP | 5
EXECUTIVE SUMMARY
Introduction
MotoGP is the longest running motorsport championship in the world, it was
first held in 1949. Since then it has continued to captivate fans with thrilling
motorcycle road races. Despite MotoGP’s long history, the first MotoGP in
the America’s as held in 2013 in Austin, Texas. Since 2013, MotoGP has
become an annual event in Austin.
The event also has a broad international reach, in 2016 the Grand Prix held
18 circuits in 15 countries. The preliminary schedule for the 2017 MotoGP
bills 18 circuits in 13 countries. Circuit of the Americas (COTA) in Austin,
Texas will host the 2017 MotoGP, which will be the fifth year that COTA is
hosting the Grand Prix.
MotoGP’s international and national appeal attracts a vibrant crowd to Texas
for the event. These out-of-state (OOS) and out-of-country visitors increase
economic activity in Austin as part of their attendance. Attendees spend
money on lodging, food and beverages, entertainment and retail both on-
and off-site. Additionally, COTA spends significant capital to program the
event.
Attendee spending and presentation costs are critical drivers of the events’
economic impact. In 2017, it is estimated that 27,681 OOS fans will travel to
Austin to watch the MotoGP Championship. The combined expenditures of
OOS fan spending and COTA presentation costs are estimated to have a
direct impact of $88.5M on the local economy, and generate a total of
$169.6M in direct, indirect, and induced expenditures that would not have
occurred if MotoGP were no held at the Circuit of the Americas.
2017 MotoGP Estimated Expenditures and Effects
Direct Indirect Induced Total
Expenditures $88,517,255 $31,523,076 $49,520,391 $169,560,722
Tax Effects $3,990,544 $396,255 $691,843 $5,078,642
Table 1: Estimated 2017 expenditures and effects
Sources: AE,COTA, IMPLAN, Texas Comptroller of Public Accounts
Table 2 Estimated Out-of-state Attendance: Total attendance and OOS attendance estimates based on 2016 certified numbers (see Exhibit C)
2017 Estimated Total Attendance
Total Attendance Cert. OOS Fans On-Site OOS Fans
40,768 68% 27,681
Table 3 Estimated Out-of-state Attendance: Daily attendances is estimated to evenly distributed among all three days
2017 Estimated Out-of-State Daily Attendance
Friday Saturday SundayEstimated Unique OOS Visitor Days
28,235 28,235 28,235 84,705

2017 MotoGP Economic Impact: MERP | 6
EXECUTIVE SUMMARY
The Model
In addition to estimated attendance, an equally important piece of data used
to estimate the 2017 MotoGP’s tax impacts was spending data from an
attendee survey that was circulated to MotoGP ticket purchasers following
the 2014 MotoGP event. The online survey was circulated via email by
COTA and received over 570 responses. The 2014 survey represents the
most recent data available and should be regarded with a high degree of
confidence as attendee demographics and event programming have not
changed significantly.
It collected information on OOS, out-of-area (but still Texas), and out-of-
country attendees’ spending patterns and average length of stay in Austin
for the event. OOS attendees average length of stay in Austin was 3.06
days. The survey informed the projected expenditures. Each category of
average daily spending was multiplied by the certified number of unique
OOS attendee days to derive the estimated direct impacts (See Table 1, p.
5). Additionally, COTA’s presentation costs were included in the model to
reflect tax impact of those expenditures on Texas’s economy.
The estimated direct expenditure calculations were sorted into a specific,
applicable tax category and its impact was multiplied by its respective tax
rate (see Table 5, p. 7). These calculations became the estimated direct tax
impacts for the 2017 MotoGP.
Indirect and induced impacts were generated based on sector specific
multipliers from IMPLAN (see Table 6, p. 7). Texas’ general tourism
multiplier is 1.81, however an itemized analysis of the event’s different
expenditure categories produced an event specific multiplier of 1.952.
The event specific multiplier is a more accurate depiction of MotoGP’s
impact on the State of Texas. It also indicates that attendees spend more
than the average Texas tourist. Due to the different spending patterns of
MotoGP attendees, it would be imprudent to apply the general tourism
multiplier to the OOS attendees.
Sources: AE, COTA
2017 Estimated Daily Attendee Expenditures per Person
Expenditure Type Average Spent/Day
Hotel $156
Rental Car $61
Mixed Beverage $52
Beer & Wine $64
Food & Non-alcoholic beverages $129
Other Retail $63
Merchandise $98
Other entertainment $140
Total $763
Table 4 Estimated Daily Expenditures: Average daily spending of OOS attendees per person

2017 MotoGP Economic Impact: MERP | 7
EXECUTIVE SUMMARY
The Model
The estimated tax impacts for indirect and induced were calculated with a
Retail Ratio and All Other Spending ratio. These ratios were developed
because MotoGP attendees do not follow the spending patterns of a typical
Texan. Thus the assumption that only 20% of all indirect and induced
spending would be subject to sales and use taxes is not well suited for these
circumstances. An analysis of attendees’ primary spending categories and
their corresponding impacts on other sectors in the economy was used to
develop the spending taxing ratios for indirect and induced taxes. Retail
spending is the highest expenditure category and 57% of retail spending in
Texas is subject to sales and use taxes. The Retail Ratio and All Other
Spending ratio ensures the tax estimates catch additional tax revenue
incurred due to retail spending in the secondary effects of MotoGP.
The Retail Ratio is the percent of spending that was spent on retail in the
indirect and induced impacts, 2% and 8% respectively. This meant that fifty-
seven percent of 2% of indirect impacts and 8% of the induced impacts
could be taxed at the sales and use tax rate of 6.25%. For the All Other
Spending Ratio, 20% of the indirect and induced impacts were taxed at
6.25%. This level of detail helps ensure that the following report contains
accurate estimates of the direct, indirect, and induced impacts from OOS
spending at the 2017 MotoGP.
In sum, as a result of MotoGP related spending from OOS attendees, the
event will generate impressive tax impacts to state and local economies.
The following presents a detailed analysis of the estimated tax impacts of
the 2017 MotoGP Red Bull Grand Prix of the Americas, held at COTA in
Austin, Texas from April 21-23, 2017.Sources: AE, COTA, Texas Comptroller of Public Accounts
Table 5 2016 Tax Rates: Approved MERP taxes and their 2016 tax rates
MERP Tax Categories and Rates (2016)
Category State Tax Rate
Hotel Occupancy 6%
Sales and Use 6.25%
Car Rental 10% (under 30-days)
Mixed Beverages6.7% - Gross receipts8.25% - Sales Tax
Table 6 IMPLAN Multipliers: Sector specific multipliers
IMPLAN Multipliers
Tax Category Direct Indirect Induced Total
Sales & Use* 1.0000 0.5058 0.4816 1.9875
Rental Car 1.0000 0.3759 0.3209 1.6968
Hotel 1.0000 0.4162 0.3880 1.8042
Title 5, ABC 1.0000 0.3809 0.7539 2.1348
Mix Beverage 1.0000 0.3809 0.7539 2.1348
OverallMultiplier
1.0000 0.4119 0.4505 1.9516
* - For this table the average of the sales & use multipliers is displayed

2017 MotoGP Economic Impact: MERP | 8
2017 MotoGP ECONOMIC IMPACT
Based on the online attendee survey, it is estimated that OOS attendees will spend $75.5 million in Texas because of the 2017 MotoGP at COTA. Table 7,
demonstrates that the total spending at the event should be approximately $169.6 million, this includes direct, indirect and induced effects.
2017 Total Estimated Impacts to Texas
2017 MotoGP Estimated Total Expenditures†
Direct Expenditures Indirect Expenditures Induced Expenditures Total Expenditures
Sales & Use* $75,457,207 $27,505,501 $41,864,149 $144,826,857
Rental Car $1,064,763 $303,319 $353,725 $1,721,806
Hotel $5,792,881 $1,907,435 $2,431,407 $10,131,722
Title 5, ABC $3,860,184 $1,124,510 $3,031,629 $8,016,323
Mixed Beverage $2,342,220 $682,312 $1,839,482 $4,864,014
Total $88,517,255 $31,523,076 $49,520,391 $169,560,722
Table 7: Estimated direct, indirect and induced expenditures used to estimate incremental tax receipt increases due to 2017 event
Sources: AE, COTA, IMPLAN
† - Summations may not be exact due to rounding
* - Expenditures includes air travel, however, air travel is not included in the direct impact’s tax effects

2017 MotoGP Economic Impact: MERP | 9
2017 MotoGP ECONOMIC IMPACT
AE estimated the direct tax gains to the State of Texas for the 2017 MotoGP based on MERP qualified expenditures by OOS attendees and presentation
costs. This is the one-for-one tax gain the State will see based on the projected spending increase in Texas due to the event. As seen in Table 8, the estimated
direct expenditures from OOS attendees and presentation costs will add almost $4 million in tax gains to the State. Estimates indicated that sales & use
expenditures will be the most impactful, they should account for 78% or $3.1 million of the tax gains, and approximately $75.5 million in direct
expenditures.
2017 Estimated Direct Tax Gain to the State of Texas
2017 MotoGP Estimated Direct Incremental Tax Receipt Increases by Category
Expenditure State Tax Rate Tax Effect
Sales and Use* $75,457,207 6.25% $3,114,391
Rental Car $1,064,763 10% $106,476
Hotel $5,792,881 6% $347,573
Title 5, ABC $3,860,184 6.1% $235,471
Mixed Beverage (Gross Receipts) $425,858 6.7% $28,532
Mixed Beverage (Individual Beverage) $1,916,361 8.25% $158,100
Total $88,517,255 - $3,990,544
Table 8: Estimated direct incremental tax receipt increase by tax category and effect type for 2017
Sources: AE, COTA, IMPLAN* - Expenditures includes air travel, air travel is not included in direct impacts tax effects

2017 MotoGP Economic Impact: MERP | 10
2017 MotoGP ECONOMIC IMPACT
The 2017 MotoGP will also have indirect tax impacts, these capture the benefits to vendors that support or supply MotoGP, as well as retail stores. Increased
direct spending generates increases in revenues for local businesses; those vendors, stores and businesses may need to grow employment and/or payroll to
accommodate the changes. As seen in Table 9, the estimated indirect tax increases due to MotoGP should bring $396,255 in taxes into the State of Texas for
the 2017 event.
2017 Estimated Indirect Tax Gain to the State of Texas
Table 9: Estimated indirect incremental tax receipt increases for each tax category for 2017
Sources: AE, COTA, IMPLAN
* - See Methodology for more retail and all other spending ratio tax effects
2017 MotoGP Estimated Indirect Incremental Tax Receipt Increases†
Retail Ratio Tax Effect* All Other Spending Ratio Tax Effect* Total Indirect Tax Effect
Sales & Use $18,918 $325,259 $344,177
Rental Car $216 $3,716 $3,932
Hotel $1,359 $23,366 $24,725
Title 5, ABC $801 $13,775 $14,576
Mixed Beverage $486 $8,358 $8,844
Total $21,781 $374,475 $396,255
† - Summations may not be exact due to rounding

2017 MotoGP Economic Impact: MERP | 11
2017 MotoGP ECONOMIC IMPACT
Induced tax effects are those that impact Texans at the household level, due to the projected increase in spending from the 2017 MotoGP. As seen in Table
10, Sales and Use had the most dramatic tax impact to the State with an increase of close to $582,000. Overall, the event is projected to increase induced tax
revenue to the State by $691,843.
2017 Estimated Induced Tax Gain to the State of Texas
Table 10: Estimated induced incremental tax receipt increases due for 2017
Sources: AE, COTA, IMPLAN* - See Methodology for more retail and all other spending ratio tax effects
2017 MotoGP Estimated Induced Incremental Tax Receipt Increases†
Retail Ratio Tax Effect* All Other Spending Ratio Tax Effect* Total Induced Tax Effect
Sales & Use $115,584 $466,392 $581,976
Rental Car $1,008 $4,068 $5,076
Hotel $6,930 $27,961 $34,891
Title 5, ABC $8,640 $34,864 $43,504
Mixed Beverage $5,243 $21,154 $26,397
Total $137,404 $554,439 $691,843
† - Summations may not be exact due to rounding

2017 MotoGP Economic Impact: MERP | 12
2017 MotoGP ECONOMIC IMPACT
The total estimated tax benefit for the 2017 MotoGP is made up of the estimated OOS attendee expenditures, and event presentation expenditures. In 2017,
the State of Texas is projected to receive approximately $5.1 million in total tax receipts from the MotoGP, as demonstrated in Table 11. The total tax
impacts will come from the direct, indirect and induced tax effects created by the estimated $88.5 million in OOS attendee spending and COTA presentation
costs associated with the event.
2017 MotoGP Estimated Total Tax Gain to the State of Texas
2017 MotoGP Estimated Incremental Tax Receipt Increases by Category†
Direct Tax Effect Indirect Tax Effect Induced Tax Effect Total Tax Effect
Sales & Use $3,114,391 $344,177 $581,976 $4,040,544
Rental Car $106,476 $3,932 $5,076 $115,484
Hotel $347,573 $24,725 $34,891 $407,189
Title 5, ABC $235,471 $14,576 $43,504 $293,552
Mixed Beverage $186,632 $8,844 $26,397 $221,873
Total $3,990,544 $396,255 $691,843 $5,078,642
Table 11: Estimated incremental tax gains to the State for 2017
Sources: AE, COTA, IMPLAN
† - Summations may not be exact due to rounding

2017 MotoGP Economic Impact: MERP | 13
2017 MotoGP ECONOMIC IMPACT
MERP enables incremental tax increases from statutorily approved taxes (Table 5, pg. 7), which are attributable to the event, to be deposited into a trust fund
to reimburse a local government or local organizing committee for certain eligible costs associated with conducting the event. In order to qualify for
reimbursement, the beneficiary of the trust fund provide a local match based on the incremental tax revenues generated by the event. The match is $1 for
each $6.25 the state contributes to the fund. Using that formula, the local match is $812,583 ($5,078,542 / 6.25).
Based on the total incremental tax gain to the State of Texas, Circuit Events Local Organizing Committee requests that the Office of the Governor
certify a deposit of $5,891,225 into a MERP account established for the 2017 MotoGP.
2017 MotGP Estimated Total Tax Gain to the State of Texas
Sources: AE, COTA, IMPLAN
2017 MotoGP Total Incremental Tax Gain
Total Tax Effect
Sales & Use $4,040,544
Rental Car $115,484
Hotel $407,189
Title 5, ABC $293,552
Mixed Beverage $221,873
Total Incremental Tax Gain to Texas $5,078,642
Local Match $812,583
Total Incremental Tax Gain $5,891,225
Table 12: 2017 MotoGP Total Incremental Tax Gain

2017 MotoGP Economic Impact: MERP | 14
2017 MotoGP DETAILED ECONOMIC IMPACT
2017 Estimate Direct Tax Impacts
2017 Estimated Sales and Use Expenditures
Expenditure Category Amount
OOS Attendee $38,665,521
Presentation Costs $11,164,733
Total $49,830,254
Table 13: Estimated total expenditures of OOS spending and event presentation costs for 2017
2017 Estimated Sales and Use Direct Tax Impacts
Expenditure Amount Tax Rate Tax Effect
Direct $49,830,254 6.25% $3,114,391
Sales & Use Tax
Sales and use tax is estimated to be the most impactful of all the taxes
generated due to the 2017 MotoGP. On- and off-site attendee expenditures
were included in the direct expenditure estimates. Table 13 is the total
estimated direct expenditures from OOS attendees and presentation costs.
Table 14 contains the estimated direct incremental tax receipt increases in
sales and use taxes due to the 2017 MotoGP. Lastly, Table 15 details total
OOS attendee expenditure estimates by type.
Table 15: Estimated detailed sales and use tax impacts from 2017
Sources: AE, COTA, IMPLAN
2017 Detailed Attendee Expenditure Estimates*
Expenditure Type Amount
Apparel $8,212,371
Fan Merchandise $4,181,822
Other Retail $1,343,516
Other Entertainment $11,752,328
Food & Non-alcoholic beverages $11,128,265
Taxis $2,047,219
Total $38,665,521
Table 14: Estimated total OOS attendee expenditures for 2017
* - Attendees provided information about airfare expenditures, these are not reflected in the direct effects, but are carried through in the indirect and induced effects

2017 MotoGP Economic Impact: MERP | 15
2017 MotoGP DETAILED ECONOMIC IMPACT
Hotel Occupancy Tax
The hotel occupancy tax is projected to have the second largest tax impact
for Texas during the 2017 MotoGP weekend. Driving this is that an estimated
82% of OOS attendees will spend an average of 3.06 days in a hotel for the
event.
Both state and local governments apply hotel occupancy taxes to lodging.
For the purpose of this report, however, only the state rate of 6% was applied
to calculate the direct, indirect and induced tax effects. Table 16 estimates
the direct tax receipts increase to the State for the 2017 MotoGP.
Mixed Alcoholic Beverages Tax
Mixed alcoholic beverages taxes are distributed differently than other taxes.
First there is 6.7% gross receipt tax on all mixed beverages sales. Effective
in 2014, there is also a 8.25% tax on individual mixed alcoholic beverages.
Table 17 calculates the estimated direct tax effects of both tax rates on the
state’s economy for the 2017 event.
2017 Estimate Direct Tax Impacts
Table 17: Estimated tax effects of OOS mixed beverage gross tax receipt and individual mixed beverage tax impacts for 2017
2017 Estimated Mixed Beverage Direct Tax Effects
Tax Type Amount Tax Rate Tax Effect
Gross Receipt* $425,858 6.7% $28,532
IndividualBeverage
$1,916,361 8.25% $158,100
Total $2,342,220 - $186,632
Sources: AE, COTA, IMPLAN
Table 16: Estimated OOS hotel occupancy direct tax effects for 2017
2017 Estimated Hotel Occupancy Direct Tax Effect
Expenditure Amount Tax Rate Tax Effect
Direct $5,792,881 6.0% $347,573
* - The average markup on mixed beverages is 450%, to generate the grossreceipts for mixed beverage purchases, the individual beverage tax wasdecreased by 450%. The tax effects were captured by applying the gross receipttax rate to the gross receipts expenditure.

2017 MotoGP Economic Impact: MERP | 16
Title 5, Alcoholic Beverage Code Tax
Title 5 of the Alcoholic Beverage Code establishes a tax by volume for non-
mixed alcoholic beverages, such as beer, wine, champagne, and malt
liquors*. The precise amount of alcohol by volume sold by vendors to OOS
attendees during the 2017 MotoGP would be extremely difficult to estimate
since it would require a high level of coordination with vendors to understand
the quantity of eligible beverages sold throughout the city, the corresponding
alcohol by volume, and whether or not the beverage was purchased by an
OOS attendee of a MERP eligible event. Off-site bars and restaurants do not
maintain records with such a high degree of detail.
Due to the high degree of difficulty and complexity involved in calculating
Title 5 taxes, a surrogate rate of 6.1% is used. This rate is based on the
comptroller’s review of numerous historical MERP studies. Due to the
comptroller’s continued recognition of and compliance with this rate, it is
assumed to be a good approximation to derive Title 5 tax estimates. As seen
in Table 18, this report uses the approximated tax rate to estimate the tax
increase from beer and wine sales for the 2017 MotoGP.
Rental Car Tax
An estimated 39% of OOS visitors will rent a car while visiting Texas for the
2017 MotoGP for an average of 3.06 days. The Texas Tax Code Section
152.026 establishes a tax rate of 10% for car rentals that last less than 30-
days. The direct expenditure estimates were developed based on from the
surveys relative to average rental rates, average rental length, number of
people per car (see Exhibit E for full calculation). The 10% rate was applied
to the direct expenditures, as seen in Table 19, to calculate the estimated
direct expenditure tax effects from the 2017 MotoGP.
2017 MotoGP DETAILED ECONOMIC IMPACT
2017 Estimate Direct Tax Impacts
Table 18: Estimated direct OOS tax impacts from beer and wine purchases for the 2017
2017 Estimated Title 5, Alcoholic Beverage Code Direct Tax Effect
Expenditure Amount Tax Rate Tax Effect
Direct $3,860,184 6.1% $235,471
* - See appendix for specific taxes by volumeSources: AE, COTA, IMPLAN
Table 19: Estimated direct OOS tax impacts on rental vehicles for 2017
2017 Estimated Rental Vehicle Direct Tax Effect
Expenditure Amount Tax Rate Tax Effect
Direct $1,064,763 10% $106,476

2017 MotoGP Economic Impact: MERP | 17
METHODOLOGY
Out-of-State Spending
Attendee Spending
General spending patterns by out-of-state attendees were based on an
online survey of MotoGP ticket holders and attendees conducted by COTA
for the 2014 event (See Table 23). Overall, the survey inquired about:
attendee’s primary residence (from Texas or OOS)
travel patterns
car rental expenditures
group/party size
hotel stays
average daily expenditures on merchandise at COTA
average daily expenditures on other retail
average daily expenditures on food & non-alcoholic beverages
average daily expenditures on mixed drinks
Average daily expenditures on beer and wine
Based on survey responses, daily spending is applied on a per capita basis
based by type of expenditure. Total expenditures were calculated based on
the per capita expenditure for each attendee that participated in the
expenditure type. Table 20 and Table 21 show the spending patterns for
OOS attendees.
2017 Estimated Hotel and Rental Car Expenditures
Expenditure TypeAvg.
Spent/day%
ParticipationAvg. days
Hotel $156 82% 3.06
Car Rental $61 39% 3.08
2017 Estimated Daily Attendee Expenditures
Expenditure Type Average Spent/Day
Mixed Beverage $52
Beer & Wine $64
Food & Non-alcoholic beverages $129
Other Retail $63
Merchandise $98
Other Entertainment $140
Table 20: Attendee spending patterns on hotels and rental cars
Table 21: Daily attendee expenditures for 2017
Sources: AE, COTA

2017 MotoGP Economic Impact: MERP | 18
METHODOLOGY
Out-of-state Spending
Presentation Costs
The presentation costs for the 2017 MotoGP are also included in the impact
estimates, but only those costs that fall within the purview of the statute (see
Exhibit E). Presentation costs were placed under the sales and use tax
category since the event is considered an amusement service by the tax
code, and therefore it is the most appropriate tax category.
The 2017 model utilizes financial information provided to AE from COTA on
the costs associated with the event. Each cost was assigned to an IMPLAN
industry category based on the expenditure type. By categorizing each
expenditure into its specific type, IMPLAN then uses an industry specific
multiplier to provide an accurate picture of the expenditures’ effects on Texas’
economy.
Below are the categories of expenditures associated with presenting the
2017 MotoGP:
Advertising and related services
Legal and permitting fees
Facilities support services
AE extracted the multipliers for indirect and induced effects from the IMPLAN
model and then applied each multiplier to the direct expenditures to calculate
the respective indirect and induced expenditures (see Table 22 on the
following page).
After careful analysis, it was determined that the indirect and induced tax
effects from the sales and use tax category would have the largest impact by
a substantial margin. Due to this, AE chose to limit the indirect and induced
tax impact to the sales and use category. The sales and use tax covers both
retail/sales services and entertainment services.
In order to conduct this analysis, AE identified the most impactful sector of
the 2017 MotoGP, which was retail. The impact of the total spent during the
event was analyzed and it was determined that 2% of indirect spending goes
back into retail (retail ratio) and 98% flows to all other sectors of the economy
(all other), for induced spending the ratios are 8% retail and 92% all other
spending. Of the retail ratio spending, 57% of its indirect and induced
spending is subject to the sales and use tax rate (6.25%). Only 20% of the all
other ratio indirect and induced spending is subject to the sales and use tax
rate. This formula yielded the incremental sales and use tax receipt increase
attributable to the indirect and induced effects of the MotoGP.
By way of example, if there is a $1 million indirect impact, 2% will be spent
on retail ($20,000). Of that $20,000, 57% will be subject to sales taxes
($11,400). The sales tax rate of 6.25% can then be applied to get the total
incremental tax gain from the indirect impact ($11,400 x 0.0625 = $712.50).
Indirect and Induced Effects

2017 MotoGP Economic Impact: MERP | 19
METHODOLOGY
Indirect and Induced Effects
Indirect and Induced Expenditure Calculations Based on Implan Multipliers
Direct Expenditures
IndirectMultiplier
Indirect Expenditure
Induced Multiplier
Induced Expenditures
Total Expenditures
Sales & Use $75,457,207 0.5058* $27,505,501 0.4816* $41,864,149 $144,826,857
Rental Car $1,064,763 0.3759 $303,319 0.3209 $353,725 $1,721,806
Hotel $5,792,881 0.4162 $1,907,435 0.3880 $2,431,407 $10,131,722
Title 5, ABC $3,860,184 0.3809 $1,124,510 0.7539 $3,031,629 $8,016,323
Mixed Beverage $2,342,220 0.3809 $682,312 0.7539 $1,839,482 $4,864,014
Total $88,517,255 - $31,523,076 - $49,520,391 $169,560,722
Overall Multiplier 1.0 0.4119 0.5397 1.9516
Table 22: Indirect and induced expenditure calculations based on IMPLAN multipliers
* - this is an average of each multiplier in the Sales & Use Category, a full list of the multiplies in each category can be found in Exhibit F

2017 MotoGP Economic Impact: MERP | 20
EXHIBIT A
Tax Categories and Rates
MERP Tax Categories and Rates (2016)
Category Expenditure type Tax Rate
Hotel Occupancy Hotel 6%
Sales and UseGeneral merchandise; clothing; other entertainment; food and non-alcoholic beverages
6.25%
Car Rental Rental Cars 10% (under 30-days)
Mixed Beverages Mixed beverages6.7% - Mixed Beverage Gross receipts8.25% - Mixed Beverage Sales Tax
Title 5, ABC Tax Beer & Wine 6.1%
Sources: Texas Comptroller of Public Accounts

2017 MotoGP Economic Impact: MERP | 21
EXHIBIT B
Accounting of Wholesale Sales of Alcoholic Beverages
*
* - given this difference, AE elected to
use 450% as the given mark up for
mixed beverages
Mixed Drinks: Gross Receipt Total
Tabulation
Total Mixed Drink Spending $1,916,361
Average Mark Up 450%
Total Gross Receipt Expenditure $425,858

2017 MotoGP Economic Impact: MERP | 22
EXHIBIT C
Certified Attendance

2017 MotoGP Economic Impact: MERP | 23
EXHIBIT D
Suite Attendance

2017 MotoGP Economic Impact: MERP | 24
Estimated Out-of-State (OOS) Attendance
2016 Cert. Attendance
Source
Total 3-Day Attendance 109,000 Exhibit C
Final Day Attendance 40,768 Exhibit C
OOS Fans 67.9% Exhibit C
Average Length of Stay 3.06
Total Unique OOS Fan Days 84,705 Exhibit C
Attendance
Master Tables & Input Calculations
EXHIBIT E

2017 MotoGP Economic Impact: MERP | 25
Since the projected total number of visitor person days is project to be the same as 2016 (84,705), general fan person days is the difference
between total OOS person days and Suite person days (4,717).
Suite person days are calculated on p. 26
Visitor Person Days
OOS Visitor Person Days by Type
Visitor Person Days
Total OOS Attendance in Austin 84,705
Suite Visitor Days 760
Total General 83,945
EXHIBIT E

2017 MotoGP Economic Impact: MERP | 26
OOS Suite Visitor Person Days
Tabulation Source
Suite Attendance 540 Exhibit D
% of OOS Attendees 46% Exhibit D
Total OOS Suite Attendance 248
Average Length of Stay 3.06 Online Survey
Total OOS Visitor Person Days 760
Visitor Person Days
EXHIBIT E

2017 MotoGP Economic Impact: MERP | 27
OOS Hotel Expenditures General
Tabulation Source
Estimated Attendance (Sunday) 40,768 Exhibit C
% of OOS Attendees 67.9% Exhibit C
% OOS Fans Renting Hotel Room 82.0% Online Survey
Average Length of Stay in Austin 3.06 Online Survey
Total Persons in Hotel Rooms 69,458
People per Hotel Room 1.94 Online Survey
Total Hotel Room Rentals 35,675
Average Daily Price of Hotel Room $156 Table 22
Total Hotel Room Expenditure $5,573,541
Hotel
EXHIBIT E

2017 MotoGP Economic Impact: MERP | 28
OOS Suite Hotel Expenditures
Tabulation Source
Total OOS Visitor Person Days 760
People Per Hotel Room 1.94 Assumed to be the same as general attendance
Total Hotel Room Rentals 392
Average Daily Price of Hotel Room $665 See Below
Total Hotel Room Expenditure $260,547
Hotel
EXHIBIT E
As of 12/5/2016 the following rates were listed for suites during the weekend of the 2017 MotoGP:
Average Suite Night Price/person
Average Suite Night Cost Source
Van Zandt $2,500 http://www.hotelvanzandt.com/
Stephen F. Austin $448 http://austin.intercontinental.com/
The W $1,766 http://www.whotelaustin.com/
The Omni $447https://www.omnihotels.com/hotels/austin-
downtown
People Per Hotel Room 1.94 Assumed to be the same as general attendance
Average suite night $1,290
Average per person $665
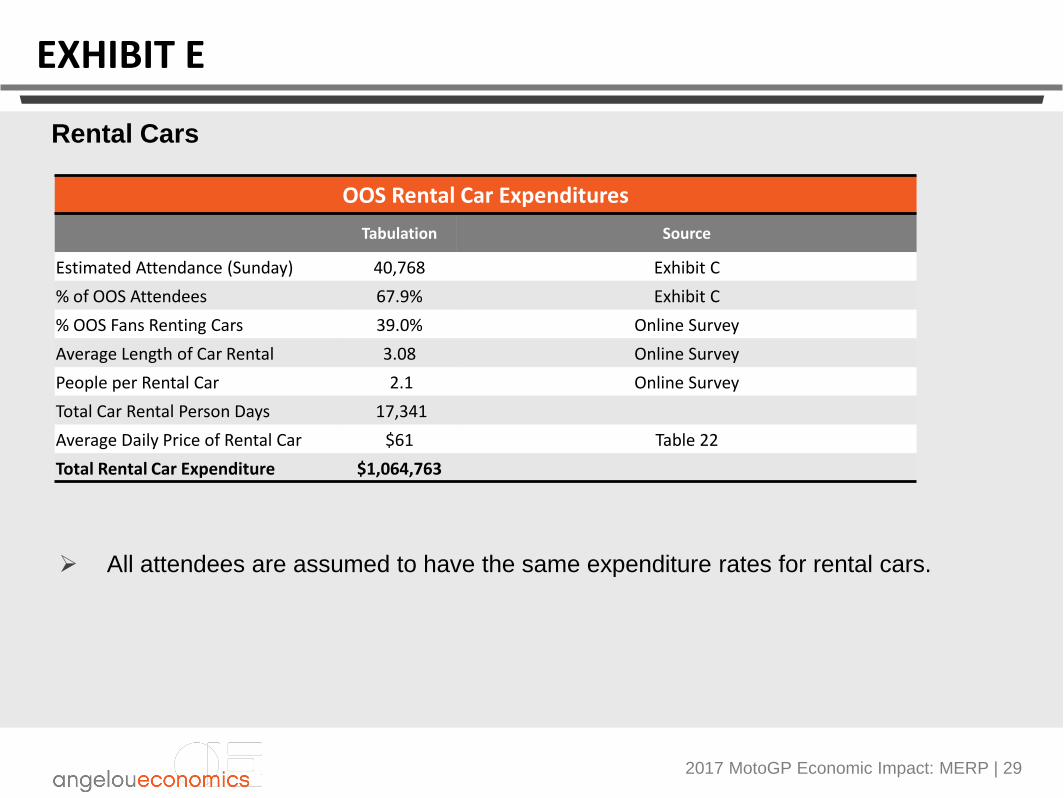
2017 MotoGP Economic Impact: MERP | 29
OOS Rental Car Expenditures
Tabulation Source
Estimated Attendance (Sunday) 40,768 Exhibit C
% of OOS Attendees 67.9% Exhibit C
% OOS Fans Renting Cars 39.0% Online Survey
Average Length of Car Rental 3.08 Online Survey
People per Rental Car 2.1 Online Survey
Total Car Rental Person Days 17,341
Average Daily Price of Rental Car $61 Table 22
Total Rental Car Expenditure $1,064,763
Rental Cars
All attendees are assumed to have the same expenditure rates for rental cars.
EXHIBIT E

2017 MotoGP Economic Impact: MERP | 30
Travel to Austin
OOS Air Travel Expenditures
Tabulation Source
Estimated Attendance (Sunday) 40,768 Exhibit C
% of OOS Attendees 68% Exhibit C
% OOS Fans Who Flew 100% Online Survey
Total OOS Fans Who Flew 27,681
Average Cost of One Way Plane Ticket $463 Online Survey
Total Air Travel Expenditures $25,626,953
EXHIBIT E
For the purpose of tax calculations, the $25.6 million was excluded from direct impacts.
However, this amount was carried over to indirect and induced impacts.

2017 MotoGP Economic Impact: MERP | 31
Other Daily Expenditures
OOS General Fan Other Daily Expenditures
Average Daily Spend
Estimated OOS
Attendance
Total Expenditure
Source for Average Daily Spend
Food & Non-Alcoholic Beverages $129
40,768
$10,900,008 Table 23
Mixed Drinks* $52 $1,808,239 Table 23
Beer & Wine† $64 $3,736,610 Table 23
Event Merchandise $98 $8,264,953 Table 23
Retail $63 $5,310,650 Table 23
Entertainment Outside COTA $140 $11,823,967 Table 23
Total $546 $41,844,428
EXHIBIT E
† - 69% of survey respondents indicated they consume beer or wine during the event (on and off-site)
* - 41% of survey respondents indicated they consumed mixed drinks during the event (on and off-site)

2017 MotoGP Economic Impact: MERP | 32
Other Daily Expenditures
OOS Suite Other Daily Expenditures at COTA
Average Daily Spend
Suite OOS Person Days
Total Expenditure
Source
Food & Non-Alcoholic Beverages $258 760 $196,198
Assumed to be two times the daily expenditure of general fans
Mixed Drinks $104 760 $79,385
Beer & Wine $128 760 $97,476
Event Merchandise $196 760 $148,768
Total $686 $521,827
OOS Suite Other Daily Expenditures Outside COTA
Average Daily Spend
Suite OOS Person Days
Total Expenditure
Source
Food & Non-Alcoholic Beverages $129 760 $98,099
Assumed to same as general fan expenditures
Mixed Drinks $52 760 $39,693
Beer & Wine $64 760 $48,738
Retail $126 760 $95,591
Total $371 $282,121
EXHIBIT E

2017 MotoGP Economic Impact: MERP | 33
OOS Total Expenditures by Fan Type
General Fan Expenditures Suite Fan Expenditure Total Expenditures
Hotel $5,532,333 $260,547 5,792,881
Rental Car $1,064,763 - 1,064,763
Air Travel to Austin $25,626,953 - 25,626,953
Food & Non-Alcoholic Beverages $10,833,968 $294,297 11,128,265
Mixed Drinks $1,797,284 $119,078 1,916,361
Beer & Wine $3,713,971 $146,214 3,860,184
Event Merchandise $8,214,877 $148,768 8,363,645
Retail $5,278,474 $95,591 5,374,065
Entertainment Outside COTA $11,752,328 - 11,752,328
Transportation $2,047,219 - 2,047,219
Wholesale Alcohol Purchases $425,858
Total $76,288,028 $1,064,494 $77,352,522
Totals
EXHIBIT E
Total MERP Qualified Spending from 2017 MotoGP
Totals
Total Attendee Spending $77,352,522
COTA Presentation Costs $11,164,733
Total $88,517,255

2017 MotoGP Economic Impact: MERP | 34
EXHIBIT F
IMPLAN: Multipliers
Model MultipliersIMPLAN Code Description Direct Effects Indirect Effects Induced Effects Total
403 Apparel 1.00 0.4288 0.3829 1.8117
404 MotoGP Merch 1.00 0.3838 0.5071 1.8909
405 Other Retail 1.00 0.3805 0.4368 1.9909
412 Taxis 1.00 0.5755 0.5248 2.1002
442 Rental Car 1.00 0.3759 0.3209 1.6968
466 Air Travel to Austin 1.00 0.5638 0.4620 2.0258
490 Race Operations 1.00 0.8261 0.4332 2.2593
496 Other Entertainment 1.00 0.4637 0.4176 1.8813
501 Food and Bev 1.00 0.4085 0.5313 1.9398
499 Hotel 1.00 0.4162 0.3880 1.8043
503 Mixed Beverages 1.00 0.3809 0.7539 2.1348
503 Mixed Beverage Gross Receipts 1.00 0.3809 0.7539 2.1348
503 Beer and Wine 1.00 0.3809 0.7539 2.1348
402 Gasoline 1.00 0.3880 0.5136 1.9016