
2017 Investor Day - Centene Corporation · PDF fileCENTENE - JUNE 2017 INVESTOR DAY 20...
129
2017 Investor Day June 16, 2017 SSID: Centene Corp Password: welcome2017
Transcript of 2017 Investor Day - Centene Corporation · PDF fileCENTENE - JUNE 2017 INVESTOR DAY 20...

2017 Investor DayJune 16, 2017
SSID: Centene Corp Password: welcome2017

2CENTENE - JUNE 2017 INVESTOR DAY
IntroductionEdmund E. Kroll, SVP, Finance and Investor Relations

3CENTENE - JUNE 2017 INVESTOR DAY
Forward-Looking StatementsThe company and its representatives may from time to time make written and oral forward-looking statements within the meaning of the Private Securities Litigation Reform Act(“PSLRA”) of 1995, including statements in this and other presentations, press releases, filings with the Securities and Exchange Commission (“SEC”), reports to stockholders and inmeetings with investors and analysts. In particular, the information provided in this presentation may contain certain forward-looking statements with respect to the financialcondition, results of operations and business of Centene and certain plans and objectives of Centene with respect thereto, including but not limited to the expected benefits of theacquisition of Health Net, Inc. These forward-looking statements can be identified by the fact that they do not relate only to historical or current facts. Without limiting the foregoing,forward-looking statements often use words such as “anticipate”, "seek", “target”, “expect”, “estimate”, “intend”, “plan”, “goal”, “believe”, “hope”, “aim”, “continue”, “will”, “may”,"can", “would”, “could” or “should” or other words of similar meaning or the negative thereof. We intend such forward-looking statements to be covered by the safe-harbor provisionsfor forward-looking statements contained in PSLRA. A number of factors, variables or events could cause actual plans and results to differ materially from those expressed or implied inforward-looking statements. Such factors include, but are not limited to, Centene’s ability to accurately predict and effectively manage health benefits and other operating expensesand reserves; competition; membership and revenue declines or unexpected trends; changes in healthcare practices, new technologies, and advances in medicine; increased health carecosts; changes in economic, political or market conditions; changes in federal or state laws or regulations, including changes with respect to government health care programs as wellas changes with respect to the Patient Protection and Affordable Care Act and the Health Care and Education Affordability Reconciliation Act and any regulations enacted thereunderthat may result from changing political conditions; rate cuts or other payment reductions or delays by governmental payors and other risks and uncertainties affecting Centene’sgovernment businesses; Centene’s ability to adequately price products on federally facilitated and state based Health Insurance Marketplaces; tax matters; disasters or majorepidemics; the outcome of legal and regulatory proceedings; changes in expected contract start dates; provider, state, federal and other contract changes and timing of regulatoryapproval of contracts; the expiration, suspension or termination of Centene’s contracts with federal or state governments (including but not limited to Medicaid, Medicare, andTRICARE); challenges to Centene's contract awards; cyber-attacks or other privacy or data security incidents; the possibility that the expected synergies and value creation fromacquired businesses, including, without limitation, the Health Net acquisition, will not be realized, or will not be realized within the expected time period, including, but not limited to, asa result of conditions, terms, obligations or restrictions imposed by regulators in connection with their approval of, or consent to, the acquisition; the exertion of management’s timeand Centene’s resources, and other expenses incurred and business changes required in connection with complying with the undertakings in connection with certain regulatoryapprovals; disruption from the acquisition making it more difficult to maintain business and operational relationships; the risk that unexpected costs will be incurred in connection with,among other things, the acquisition and/or the integration; changes in expected closing dates, estimated purchase price and accretion for acquisitions; the risk that acquired businesseswill not be integrated successfully; Centene's ability to maintain or achieve improvement in the Centers for Medicare and Medicaid Services (CMS) Star ratings and other quality scoresthat impact revenue; availability of debt and equity financing, on terms that are favorable to Centene; inflation; foreign currency fluctuations; and risks and uncertainties discussed inthe reports that Centene has filed with the SEC. These forward-looking statements reflect Centene’s current views with respect to future events and are based on numerous assumptionsand assessments made by Centene in light of its experience and perception of historical trends, current conditions, business strategies, operating environments, future developmentsand other factors it believes appropriate. By their nature, forward-looking statements involve known and unknown risks and uncertainties and are subject to change because they relateto events and depend on circumstances that will occur in the future. The factors described in the context of such forward-looking statements in this presentation could cause Centene’splans with respect to the Health Net acquisition, actual results, performance or achievements, industry results and developments to differ materially from those expressed in or impliedby such forward-looking statements. Although it is currently believed that the expectations reflected in such forward-looking statements are reasonable, no assurance can be given thatsuch expectations will prove to have been correct and persons reading this presentation are therefore cautioned not to place undue reliance on these forward-looking statements whichspeak only as of the date of this presentation. Centene does not assume any obligation to update the information contained in this presentation (whether as a result of newinformation, future events or otherwise), except as required by applicable law. This list of important factors is not intended to be exhaustive. We discuss certain of these matters morefully, as well as certain other risk factors that may affect Centene's business operations, financial condition and results of operations, in Centene's filings with the SEC, including theannual reports on Form 10-K, quarterly reports on Form 10-Q and current reports on Form 8-K.

4CENTENE - JUNE 2017 INVESTOR DAY
Earnings Guidance PolicyOur Company’s policy is, “that the Company undertakes no obligation to update its earningsguidance, other than as part of its quarterly or yearly earnings disclosure, and that silence onguidance by the Company or Company officials should not be interpreted that guidance has or hasnot changed. In any event, no updated guidance would ever be given that is not previously orsimultaneously disclosed in an SEC filing or other broad non-exclusionary means.”
“Further, it is Company policy to generally not hold discussions with investors commencing twoweeks prior to earnings release.”

5CENTENE - JUNE 2017 INVESTOR DAY
Strategic OverviewMichael F. Neidorff, Chairman, President & CEO

6CENTENE - JUNE 2017 INVESTOR DAY
EPS
HBR
$ 69% increaseTotal Revenues
51% increaseAdjusted Diluted
110 bps improvementHealth Benefits Ratio
Q1 2017 Financials(year-over-year)
EPS
$ 42% increaseTotal Revenues
40% increaseAdjusted Diluted
2017 5-Year CAGR(based on the mid-point of 2017 guidance )

7CENTENE - JUNE 2017 INVESTOR DAY
30,900 employees
WHO WE ARE
St. Louisbased company founded in Milwaukee in 1984
WHAT WE DO
28 stateswith government sponsored healthcare programs
12.1 million members
~300 product / market solutions
Serving ~900,000 individuals
$46-46.8B
2 international markets
2017 revenue guidance
EnvolveFederalServices
Commercial(Marketplace)
MedicareComplexCareMedicaid
*Including 3 implementation markets

8CENTENE - JUNE 2017 INVESTOR DAY
Continued Operational Success
2017 - #662016 - #1242015 - #1862014 - #2512013 - #3032012 - #4532011 - #493
9CENTENE - JUNE 2017 INVESTOR DAY
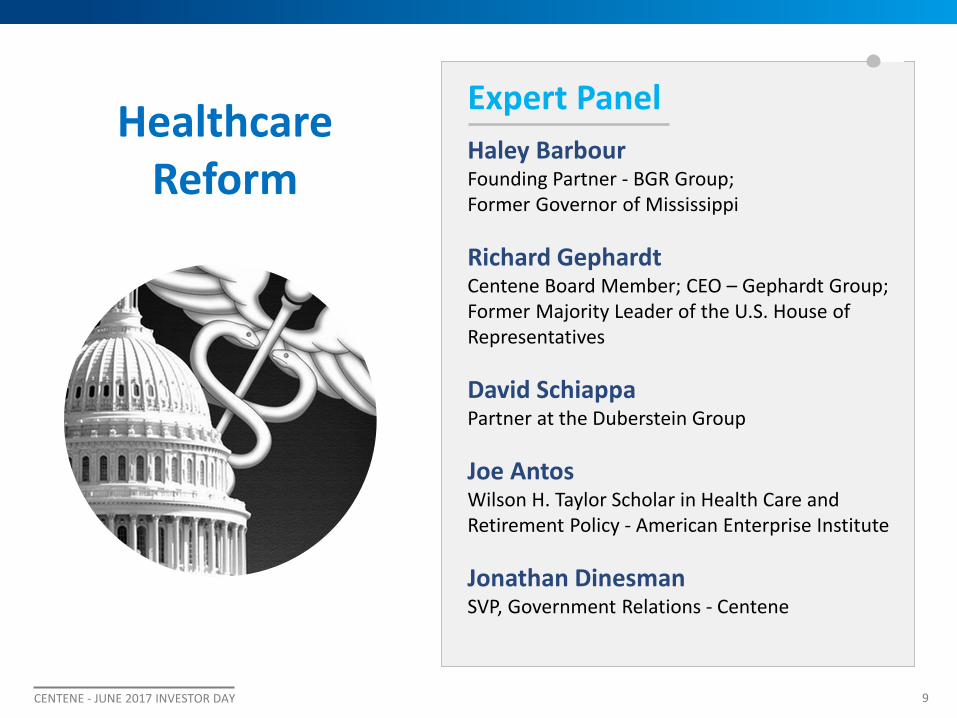
HealthcareReform
Haley BarbourFounding Partner - BGR Group;Former Governor of Mississippi
Richard GephardtCentene Board Member; CEO – Gephardt Group; Former Majority Leader of the U.S. House of Representatives
David SchiappaPartner at the Duberstein Group
Joe AntosWilson H. Taylor Scholar in Health Care and Retirement Policy - American Enterprise Institute
Jonathan DinesmanSVP, Government Relations - Centene
Expert Panel

10CENTENE - JUNE 2017 INVESTOR DAY
Focused on Vulnerable and Low Income Populations
118M
318M US Population
Medicare and Medicaid Population
Population Demographics
60% below 400% FPL
76% below 400% FPL
* Source: U.S. Census Bureau | Current Population Survey (CPS) | Last Revised: March, 2016
11CENTENE - JUNE 2017 INVESTOR DAY
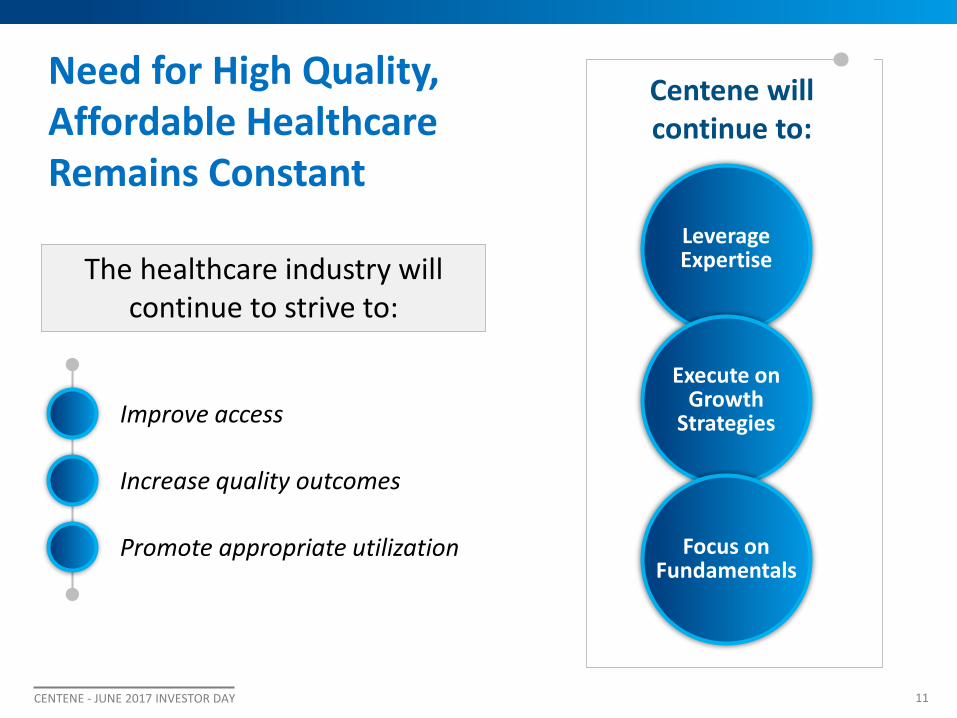
Need for High Quality, Affordable Healthcare Remains Constant
The healthcare industry will continue to strive to:
Improve access
Promote appropriate utilization
Increase quality outcomes
LeverageExpertise
Execute onGrowth
Strategies
Focus onFundamentals
Centene will continue to:

12CENTENE - JUNE 2017 INVESTOR DAY
Value Based Provider Partnerships
Analytics Infrastructure
Integrated Solutions
Business Operations
Multi-product Portfolio Business Model
CA Market Update
Partnering with State Governments
Product Leadership
Product Updates and Growth Pipeline
International

13CENTENE - JUNE 2017 INVESTOR DAY
Value Based Provider Partnerships
Analytics Infrastructure
Integrated Solutions
Business Operations
Multi-product Portfolio Business Model
CA Market Update
Partnering with State Governments
Product Leadership
Product Updates and Growth Pipeline
International
Leveraging our business model:
15 subsidiaries exceeding $1B in revenue

14CENTENE - JUNE 2017 INVESTOR DAY
Value Based Provider Partnerships
Analytics Infrastructure
Integrated Solutions
Business Operations
Partnering with State Governments
CA Market Update
Product Leadership
Product Updates and Growth Pipeline
International

15CENTENE - JUNE 2017 INVESTOR DAY
Value Based Provider Partnerships
Analytics Infrastructure
Integrated Solutions
Business Operations
CA Market Update
Product Leadership
Product Updates and Growth Pipeline
InternationalIntegration of HNT is on track
or ahead of schedule

16CENTENE - JUNE 2017 INVESTOR DAY
Analytics Infrastructure
Integrated Solutions
Business Operations
Value Based Provider Partnerships
Product Leadership
Product Updates and Growth Pipeline
International
Furthering our value based partnerships with providers
JV owned health plan with North Carolina Medical Society and the
North Carolina Community Health Center Association

17CENTENE - JUNE 2017 INVESTOR DAY
Analytics Infrastructure
Business Operations
Integrated Solutions
Product Leadership
Product Updates and Growth Pipeline
International

18CENTENE - JUNE 2017 INVESTOR DAY
Business Operations
Analytics Infrastructure
Product Leadership
Product Updates and Growth Pipeline
InternationalData
AnalysisData
IntegrationData
CaptureFaster:
HealthInterventionsPerformance
ImprovedQuality
ReducedCosts
Results in:

19CENTENE - JUNE 2017 INVESTOR DAY
Business Operations
Product Leadership
Product Updates and Growth Pipeline
International
MarketplaceFederalServicesMLTSS
MedicaidManaged
Care
National Leading Products
20CENTENE - JUNE 2017 INVESTOR DAY
Business Operations
Product Updates and Growth Pipeline
International
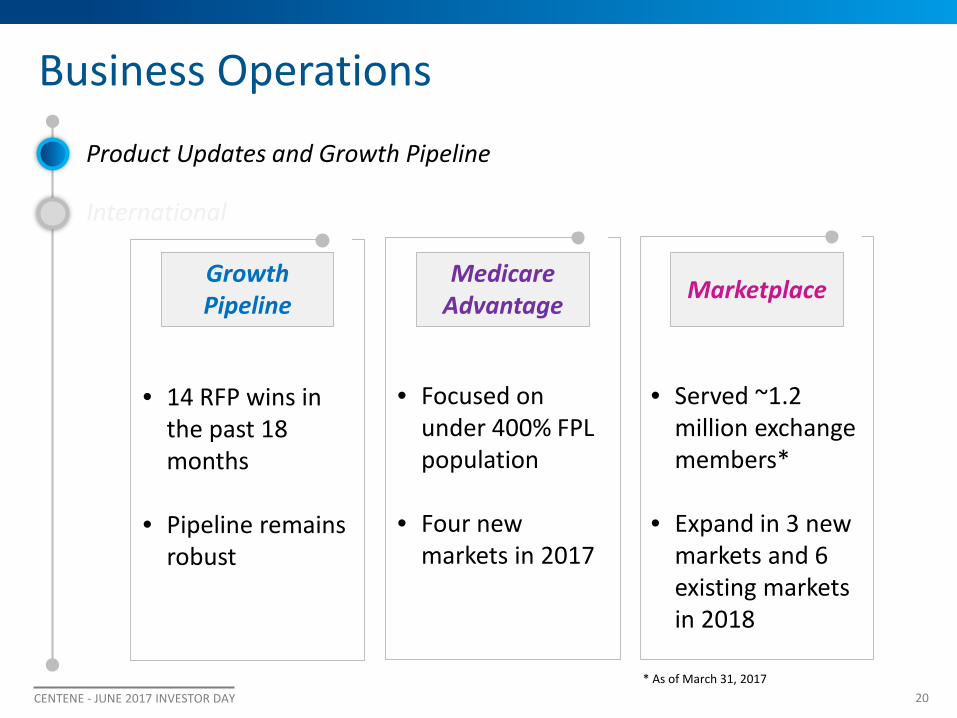
GrowthPipeline
• 14 RFP wins in the past 18 months
• Pipeline remains robust
MedicareAdvantage
• Focused on under 400% FPL population
• Four new markets in 2017
Marketplace
• Served ~1.2 million exchange members*
• Expand in 3 new markets and 6 existing markets in 2018
* As of March 31, 2017

21CENTENE - JUNE 2017 INVESTOR DAY
Business Operations
International
World Economic Forum

22CENTENE - JUNE 2017 INVESTOR DAY
Poised for Continued Growth
2012
$46.4 billion
Today
2017 mid-point revenue guidance$8 billionRevenue:
2814States:Including 3 implementation markets
$13.6 billion$1.4 billionMarket Cap.:
30,9006,800Employees:
12 million2 millionMembers:
as of June 15, 2017
as of March 31, 2017
as of March 31, 2017
as of June 30, 2012
23CENTENE - JUNE 2017 INVESTOR DAY
Finance UpdateJeffrey Schwaneke – EVP, CFO & Treasurer

24CENTENE - JUNE 2017 INVESTOR DAY
1 Represents a non-GAAP measure. See Appendix A for reconciliation of non-GAAP measures.
(CONTINUING OPERATIONS)
Diluted EPS of $3.41
Total Revenues of $40.6 billionFortune 500 #66 + 78%
+ 18%
Revenues
Added 6.3 million members between years + 124%Membership
Diluted EPS
Adjusted Diluted EPS of $4.43 + 41%Adjusted Diluted EPS1
Health Benefits Ratio of 86.5%HBR 240 bps improvement
2016 Performance

25CENTENE - JUNE 2017 INVESTOR DAY
Diluted EPS of $0.79
Total Revenues of $11.7 billion + 69%
+ $0.91
Revenues
Added 605K members between years + 5%Membership
Diluted EPS
Adjusted Diluted EPS of $1.12 + 51%Adjusted Diluted EPS1
Health Benefits Ratio of 87.6%HBR 110 bps improvement
Q1 2017 Performance
1 Represents a non-GAAP measure. See Appendix A for reconciliation of non-GAAP measures.

26CENTENE - JUNE 2017 INVESTOR DAY
$ 42%Total Revenues1
EPS 40%Adj. Diluted EPS2
CNC 42%Stock Price3
Delivering ShareholderValue
5 Year Compound Annual Growth Rates2012-2017(F), excluding stock price
1 Based upon 2017 guidance midpoint.2 Represents a non-GAAP measure using the guidance midpoint. See Appendix A for reconciliation of non-GAAP measures. The 5 year GAAP diluted EPS CAGR is 37% using the guidance midpoint. 3 5 year stock price CAGR as of June 13, 2017.

27CENTENE - JUNE 2017 INVESTOR DAY
Source: SEC filings and Yahoo!Finance 2017 analyst estimates. Peer group includes Aetna, Anthem, Cigna, Humana, Molina, United and WellCare.
7% 8% 8%11%
13%
18%
27%
42%
CNC
Total Revenues CAGR vs. Peers5 YEAR CAGR, 2012-2017(F)

28CENTENE - JUNE 2017 INVESTOR DAY
$1.47
$2.31 $3.14
$4.43
2013 2014 2015 2016 2017 (F)
CNC 5 Year CAGR +40%2
Guidance Range
$4.50 – $4.90
Adjusted Diluted Earnings Per Share1(FROM CONTINUING OPERATIONS)
1 Represents a non-GAAP measure. See Appendix A for reconciliation of non-GAAP measures.2 Based on 2017 guidance range mid-point.
29CENTENE - JUNE 2017 INVESTOR DAY
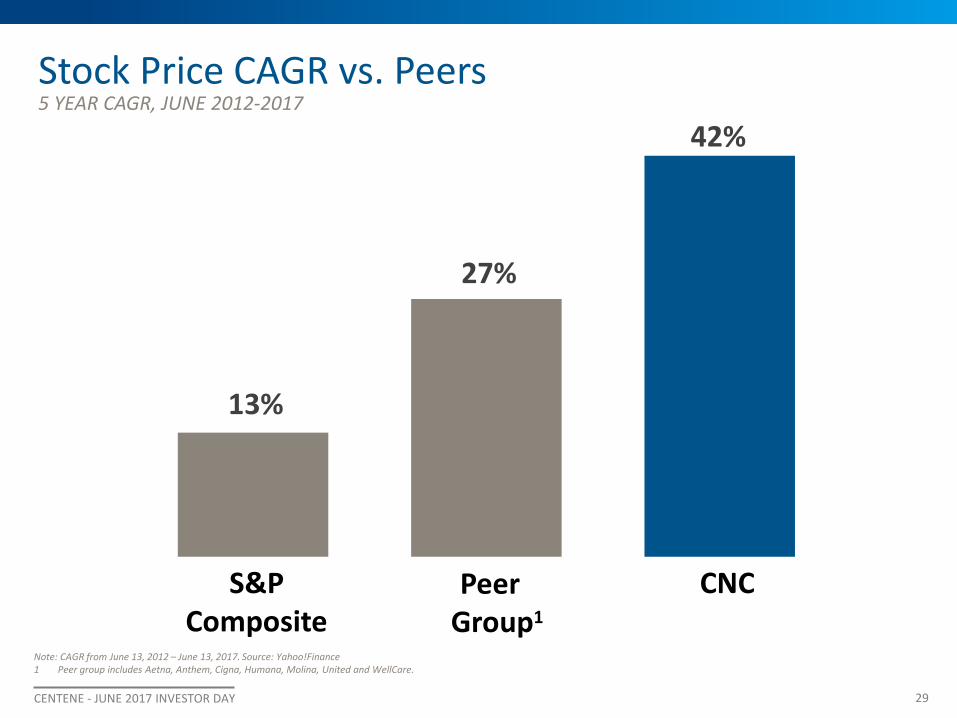
Note: CAGR from June 13, 2012 – June 13, 2017. Source: Yahoo!Finance1 Peer group includes Aetna, Anthem, Cigna, Humana, Molina, United and WellCare.
13%
27%
42%
Stock Price CAGR vs. Peers
S&P Composite
PeerGroup1
CNC
5 YEAR CAGR, JUNE 2012-2017

30CENTENE - JUNE 2017 INVESTOR DAY
2.6 2.94.1
5.1
11.4
$8.1 $10.9
$16.6
$22.8
$40.6
2012 2013 2014 2015 2016 2017(F)
Membership
Total Revenues
Guidance Mid-point
$46.4
Total Revenues/Membership Growth($ IN BILLIONS, MEMBERSHIP IN MILLIONS)

31CENTENE - JUNE 2017 INVESTOR DAY
-
500
1,000
1,500
2,000
2014 2015 2016 Q1 2017
Large/Small Group &Individual Off-Exchange
Health InsuranceMarketplace
Commercial Membership
Key Drivers:• Health Net acquisition• Growth in Health Insurance
Marketplace• Reached over 1 million
exchange members in Q1 2017
Commercial Expansion Driving Growth(MEMBERSHIP IN THOUSANDS)
●
●
●
States with large/small group & individual off-exchange membership●

32CENTENE - JUNE 2017 INVESTOR DAY
2,000
4,000
6,000
8,000
2014 2015 2016 Q1 2017
Medicaid Membership
Key Drivers:• Health Net acquisition• Product and market growth• Medicaid expansion
Medicaid Driving Growth(MEMBERSHIP IN THOUSANDS)
States with business implementation in process

33CENTENE - JUNE 2017 INVESTOR DAY
2015: $22.8 Billion 2016: $40.6 Billion 2017(F): $46.4 Billion1
88.9%
86.5%8.3%
9.2%
2015 2016 2017(F)
HBR
Adj. SG&A2
1
Commercial and Medicare growth driving changes in
HBR & SG&A
Diversifying Revenues
Medicaid Medicare/Duals CommercialSpecialty/Government
2 Adjusted SG&A expense excludes certain items. See Appendix A for reconciliation of non-GAAP measures. 2017(F) excludes Health Net acquisition related expenses of $5 - $8 million and the Penn Treaty assessment expense of $47 million.
84%
2% 4%
10%
72%
13%9%
6%68%
17%
9%6%
1 Midpoint of guidance range.

34CENTENE - JUNE 2017 INVESTOR DAY
TANF, CHIP & Foster Care
64%
Commercial 17%
Other7%
Medicare/Duals3%ABD 8%
LTC 1%
TANF, CHIP, Foster CareAvg. PMPM $200–$600
CommercialAvg. PMPM $375
DualsAvg. PMPM $2,250
Long-Term CareAvg. PMPM $3,600
At-Risk Membership Characteristics
Other/Service
Lower HBR
ABDAvg. PMPM $900
Higher HBR
MedicareAvg. PMPM $1,000

35CENTENE - JUNE 2017 INVESTOR DAY
As of Q1 2017
Membership Revenue
Medicaid:
TANF, CHIP & Foster Care 61% 39%
ABD & LTC 9% 29%
Behavioral Health 5% 2%
Commercial 20% 19%
Medicare & Duals 3% 10%
Correctional 2% 1%
100% 100%
At-Risk Membership and Premium Revenue

36CENTENE - JUNE 2017 INVESTOR DAY
December 31, 2015
December 31, 2016
March 31,2017
Cash and investments $3,978 $9,118 $10,340
Total assets 7,339 20,197 21,362
Debt:
Senior notes, at par 925 4,600 4,600
Revolving credit agreement 225 100 100
Mortgage notes 67 64 63
Other debt & cap. leases 4 (109) (116)
Total debt 1,221 4,655 4,647
Total stockholders’ equity 2,168 5,909 6,084
Debt to capital ratio, excl. non recoursedebt
34.7% 43.7% 43.0%
Balance Sheet($ IN MILLIONS)
Reduced leverage by 130 basis points subsequent to the acquisition of Health Net

37CENTENE - JUNE 2017 INVESTOR DAY
Q12016
Q22016
Q32016
Q42016
Q12017
42.0%
42.5%
43.0%
43.5%
44.0%
44.5%
45.0%Strategically manage our
balance sheet
Debt to capital ratio expected to be in low 40%’s by Q4 2017Note: excludes non-recourse mortgage note
Leverage
Continue to reduce our debt-to-capital ratio
Aligning financial statement exposure through interest
rate swaps

38CENTENE - JUNE 2017 INVESTOR DAY
Balance March 31, 2017
March 31, 2017Effective
Interest Rate1
$1,400 million 5.625% Senior Notes, due February 2021 $1,400 5.47%
$1,000 million 4.75% Senior Notes, due May 2022 $1,008 3.98%
$1,000 million 6.125% Senior Notes, due February 2024 $1,000 5.48%
$1,200 million 4.75% Senior Notes, due January 2025 $1,200 4.10%
Revolving credit agreement $100 4.50%
Total Debt/ Weighted average rate $4,708 4.78%
1 Including impact of any interest rate swaps.
Senior Notes and Revolver
Centene’s S&P rating upgraded to ‘BB+’ from ‘BB’ in May 2017
($ IN MILLIONS)

39CENTENE - JUNE 2017 INVESTOR DAY
$6.0B$4.3B
Investment PortfolioQ1 2017
$2.7B$2.0B
Total DebtQ1 2017
Swapped Floating Rate Debt at 1 or 3
month LIBOR
Floating rate debt expense offset by
short-term investment income
Cash & Investments highly correlated to
LIBOR rate
Impact of Short-Term Interest Rates

40CENTENE - JUNE 2017 INVESTOR DAY
Estimated Impact of Change in 3-Month LIBORAs of March 31, 2017.
($7 )($14)
($20)($27)
$11
$22
$32
$43
Interest Expense Interest Income
+$4
+$8
+$12
+$16
Annual Net Favorable Pre-tax Impact
Impact of Short-Term Interest Rates
+75 bps+50 bps+25 bps +100 bps
($ IN MILLIONS)

41CENTENE - JUNE 2017 INVESTOR DAY
32.7% 36.7% 34.9% 36.7%
0.3%0.4%
2.1%3.3%9.9%
11.5% 14.8%
2014 2015 2016 2017(F)
Nondeductible Compensation
ACA Health Insurer Fee
All Other Income Tax
42.9%
51.8%48.6%
39-41%
2017 nondeductible compensation represents approx. $38M or $0.211 per diluted share of income tax expense.
Effective Tax Rate
1 Based on 2017 guidance range mid-point.

42CENTENE - JUNE 2017 INVESTOR DAY
Timeline – uncertain based on current
environment
Immediate tax deduction for capital
expenditures
Corporate tax rate from 35% to
15%-20%
Potential implications of proposed tax reform
Eliminate net interest expense
deduction
Proposed Income Tax Reform

43CENTENE - JUNE 2017 INVESTOR DAY
Effective TaxRate
CorporateTax Rate
Net InterestAddback
CompensationDeductions
Annualized RateOutlook with
Proposed Reforms
Tax ReformHealthcare
Reform
39-41%
Potential Implications of Tax & Healthcare Reform
18-25%
(15-20%)+2% (3%)
In addition, we would benefit from a one-time deferred rate change of ~15% in the year tax reform is enacted (>$100 million after tax).

44CENTENE - JUNE 2017 INVESTOR DAY
$792
$1,534 $129
$270
2015 2016 2017 (F)
HIF Impact$1,804
$921Guidance
Range $1,800 to
$2,000
Adjusted EBITDA1
1 Represents a non-GAAP measure. See Appendix A for reconciliation of non-GAAP measures.2 Based on 2017 guidance range mid-point.
YOY Increase 45% 96% 5%2
Adj. EBITDA as % of Revenue 4.0% 4.4% 4.1%2
($ IN MILLIONS)
45CENTENE - JUNE 2017 INVESTOR DAY
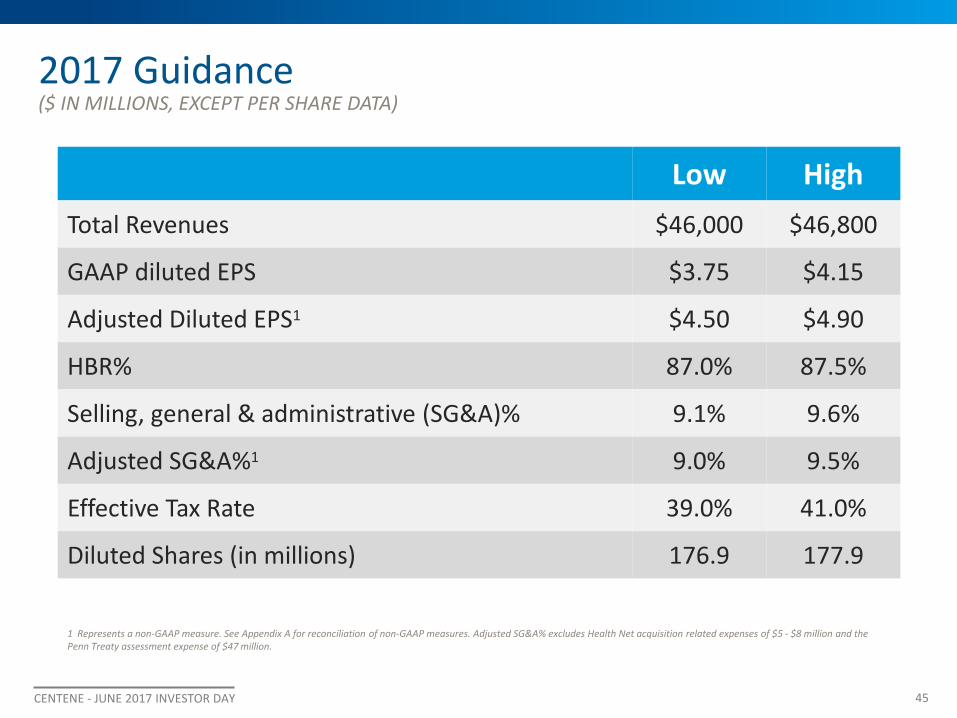
Low HighTotal Revenues $46,000 $46,800
GAAP diluted EPS $3.75 $4.15
Adjusted Diluted EPS1 $4.50 $4.90
HBR% 87.0% 87.5%
Selling, general & administrative (SG&A)% 9.1% 9.6%
Adjusted SG&A%1 9.0% 9.5%
Effective Tax Rate 39.0% 41.0%
Diluted Shares (in millions) 176.9 177.9
1 Represents a non-GAAP measure. See Appendix A for reconciliation of non-GAAP measures. Adjusted SG&A% excludes Health Net acquisition related expenses of $5 - $8 million and the Penn Treaty assessment expense of $47 million.
2017 Guidance($ IN MILLIONS, EXCEPT PER SHARE DATA)

46CENTENE - JUNE 2017 INVESTOR DAY
Update: Markets Christopher Bowers, EVP - Markets

47CENTENE - JUNE 2017 INVESTOR DAY
State Health Plan Membership Growth
0.0
1.0
2.0
3.0
4.0
5.0
6.0
3.7M
0.5M<15k0.1M
4.4M
(in m
illio
ns)
Total Membership(as of 1/1/16)
*excludes Correctional, Behavioral Health, Federal Services, ASO and Envolve membership
Medicaid Complex Care Commercial Medicare

48CENTENE - JUNE 2017 INVESTOR DAY
State Health Plan Membership Growth
0.0
1.0
2.0
3.0
4.0
5.0
6.0
7.0
Medicaid Complex Care Commercial Medicare
5.7M,~50%
0.8M,~60%
0.3M,~2,600%
1.9M,~1,800%
Total Membership(as of 3/31/17)
8.7M, ~100%
(in m
illio
ns)
*excludes Correctional, Behavioral Health, Federal Services, ASO and Envolve membership

49CENTENE - JUNE 2017 INVESTOR DAY
Increasing Scale and Diversification
HEALTH PLANS BY PREMIUM SIZE
12
1
10
12
Under $1 billion Over $1 billion
2017(P)
2012

50CENTENE - JUNE 2017 INVESTOR DAY
Key Membership Drivers in 2017
12/31/16 2017(P)
Marketplace
New States (NE, NV)
ExistingMarket
Expansions
OrganicGrowth
2017 Growth Areas
~9%
*excludes Correctional, Behavioral Health, Federal Services, ASO and Envolve membership

51CENTENE - JUNE 2017 INVESTOR DAY
2017 Market Updates
State Start Date Product Mix
EstimatedMarket Size
Numberof Plans Membership
NE 1/1/17 All populations(acute only –LTSS & I/DD)
228,000 3 plans 79k*
MO 5/1/17 Medicaid 737,500 3 plans 280k**
NV 7/1/17 TANF, CHIP, Medicaid Expansion 425,000 4 plans ~35k**
*as of March 31, 2017**Estimates

52CENTENE - JUNE 2017 INVESTOR DAY 52
ManagingMarket Level
Trends

53CENTENE - JUNE 2017 INVESTOR DAY
Centene Playbook to Offset Trends
Trends
HBRInitiatives
PaymentIntegrity
Public PolicyEngagement
QualityManagement
RiskAdjustment
Actuarial Coordination

54CENTENE - JUNE 2017 INVESTOR DAY
Centene Medicaid Rate Experience
2014 2015 2016
Est. Cost Trend 1.5%-2.5%
Net Rate Increase 0-1%
Health Benefits Ratio Consistent HBR performance
Playbook strategies maintain HBR levels despite increasing trends

55CENTENE - JUNE 2017 INVESTOR DAY
Plan Example - Large Traditional Medicaid Product
Strategies to Offset to Medical Trend
• ED utilization reduction of ~5% (onsite ED Diversion)
• Improved Rx utilization by 12% to mitigate inflationary pressures
• Incremental payment integrity strategies

56CENTENE - JUNE 2017 INVESTOR DAY
Continue to Generate Strong Growth Through:
• Expansion and retention of existing business
• Acquisition of new business
• Broader product penetration
Managing and offsetting rate pressures and cost trends through our
comprehensive playbook of Health Plan tools and strategies

57CENTENE - JUNE 2017 INVESTOR DAY
Business Unit UpdateSteven Sell, CEO & Plan President - CA Market

58CENTENE - JUNE 2017 INVESTOR DAY
California: Progress Update
Improved financial performance
Improved operational performance
Well positioned for the future
15 Months after the Merger Close

59CENTENE - JUNE 2017 INVESTOR DAY
A Large Market….• 39M Californians• Over 27M in risk-based care models*
In All Segments….• Medicaid, Medicare, Duals• Employer Group, Individual• Military, Correctional• Specialty
With Strong Stakeholder Alignment.• Physicians, Medical Groups, Hospitals• CDI, DMHC, DHCS, CMS, CovCA• Brokers, GA’s and Consultants
California: Market Overview
* Does not include self-insured population (approx. 6M) or Medicare FFS population (approx. 3.5M)

60CENTENE - JUNE 2017 INVESTOR DAY
Improved Financial Performance
• No Premium Deficiency Reserves taken for 2017
• On track to meet all merger-related synergy targets
• Successfully managing Medicaid Expansion rates
• Expertise in managing heavily capitated population
• Applying rigor to management of Fee For Service costs
Leveraging Best of Both Model
Financial Performance

61CENTENE - JUNE 2017 INVESTOR DAY
Operational Performance
• Processing improvements
• Medical cost reduction initiatives
• Expanded fraud, waste & abuse capability
• Enhanced case management
• Insourcing care management to Centene systems & processes
• Concurrent review
Medical Management
Claims Management

62CENTENE - JUNE 2017 INVESTOR DAY
Operational Performance cont’d
• Improved Covered CA Net Promoter Score
• Positive member satisfaction trend
• Network is stable
• Maintaining low medical cost trend
• Improved management of FFS providers
• Risk Adjustment improvements
Provider Engagement
Quality & Customer Experience

63CENTENE - JUNE 2017 INVESTOR DAY
California Market Culture
Local Accountability and Control
Employee Engagement and Development
Performance Orientation

64CENTENE - JUNE 2017 INVESTOR DAY
• Medicaid
• Duals/MMP
• Correctional Health
Well Positioned for the Future
Medicaid Plan with ~2M lives and 19%
market share
Market share statewide with
~3M lives
#1 11%
Power of MCO Portfolio
A Market Leader
12% Market Share in Sacramento
29% Market Share in the Central Valley
18% Market Share in Los Angeles County
*as of March 31, 2017

65CENTENE - JUNE 2017 INVESTOR DAY
Update: Products Jesse Hunter, EVP - Products

66CENTENE - JUNE 2017 INVESTOR DAY
Product Focus
National Product Leadership
Multi-Product Strategy
Marketplace Update
Medicare Update

67CENTENE - JUNE 2017 INVESTOR DAY
Product Focus
National Product Leadership
Multi-Product Strategy
Marketplace Update
Medicare Update

68CENTENE - JUNE 2017 INVESTOR DAY
Product Objective
EnvolveHealth
FederalServices
Commercial(Marketplace)
Medicare
ComplexCare
Medicaid
Market leading products focused on
government sponsored healthcare
programs

69CENTENE - JUNE 2017 INVESTOR DAY
Demonstrating Product Leadership
1st or 2nd in Membership
NationalMarket leadingposition across
Products
1987
2007
2008
2013
2014
2017
1984

70CENTENE - JUNE 2017 INVESTOR DAY 70
AHIPProduct Thought Leadership
MHPA
MACPAC
MLTSS
AMSUS
ECHBC
National MLTSS Health Plan Association
Medicaid and CHIP Payment and Access Commission
Association of Military Surgeons of the United States
America’s Health Insurance Plans
Medicaid Health Plans of America
Envolve Center for Health Behavior Change

71CENTENE - JUNE 2017 INVESTOR DAY
Product Focus
National Product Leadership
Multi-Product Strategy
Marketplace Update
Medicare Update

72CENTENE - JUNE 2017 INVESTOR DAY
Multi-Product Strategy
Medicaid
Medicare & Duals
MSO
Correctional Marketplace

73CENTENE - JUNE 2017 INVESTOR DAY
Product Focus
National Product Leadership
Multi-Product Strategy
Marketplace Update
Medicare Update

74CENTENE - JUNE 2017 INVESTOR DAY
Membership Demographics
93%
7%
2015* 2016 2017
93%
* 2015 does not include Health Net
7% 9%
91%
78%
22%
2015* 2016 2017
85%
12% 8%
90%
3% 2%
Subsidized
Unsubsidized
Premium Subsidies
Silver
Bronze
Gold & Platinum
Metal Tier

75CENTENE - JUNE 2017 INVESTOR DAY 75
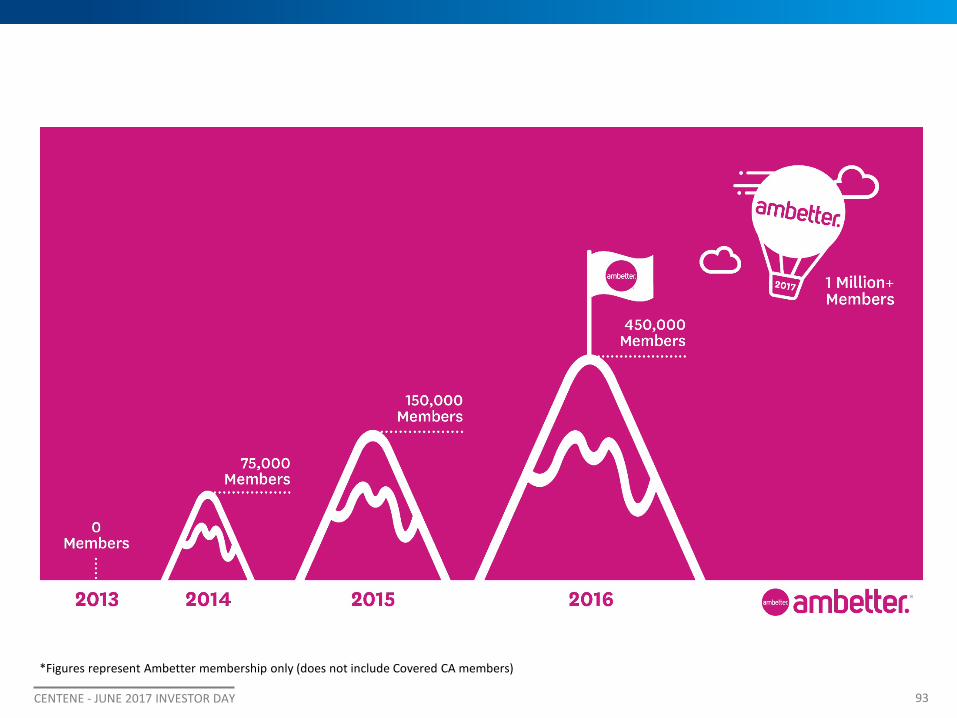
Peak Membership
2014 76,000
2015 167,000
2016 683,000
2017 1,200,000
2017 Marketplace Footprint
Centene State
Centene HIM Membership
#1 National Carrieron Marketplace

76CENTENE - JUNE 2017 INVESTOR DAY
Carrier Exit Case Study – Broward County, FL
Carrier’s market exit resulted in a large number of auto-assignments, including 18,000 members assigned to Ambetter
Premium Subsidy
CostSharing
Reduction
Total Enrollees
Members Auto Assigned to Ambetter 83.6% 70.0% 18,114
Auto Assignments that Effectuated with Ambetter 95.1% 84.9% 6,564
All New Ambetter Members 92.9% 79.8% 55,202

77CENTENE - JUNE 2017 INVESTOR DAY
Path to 2018
5/1 - 6/21Initial State Filings
5/1 - 8/16DOI Reviews, Negotiations and Revisions
May Dec.Nov.Oct.Sept.Aug.Jul.Jun.
8/1 - 8/16Rate Finalization by DOIs and Handoff to CMS
8/20Court Date for CSRs
9/16 - 9/27FFM QHP certification signing
10/12Feds FFM QHP certification signing
11/1 – 12/15Open Enrollment
2 0 1 7

78CENTENE - JUNE 2017 INVESTOR DAY
• 2018 “business as usual” approach based on ACA• Plan design and pricing reflect market variability and need for flexibility
• Pursue strategic expansion and membership growth• Strive to maintain our price advantage• Deliver targeted profit margin
Centene State
Centene HIM Membership
New HIM Markets in 2018
HIM Expansion Markets
2018 Marketplace Positioning

79CENTENE - JUNE 2017 INVESTOR DAY
Product Focus
National Product Leadership
Multi-Product Strategy
Marketplace Update
Medicare Update

80CENTENE - JUNE 2017 INVESTOR DAY
2017 Medicare Profile Products
MA /MAPD
D-SNP
I-SNP
80
• Membership: 328,000 (March 31, 2017)
• $3B Medicare Platform (2016)
• Multi-product
• Multi-state
• 4 Star Parent Organization Rating
Centene State
Centene Medicare Market
MMP
C-SNP
Med. Supp.
EGWP

81CENTENE - JUNE 2017 INVESTOR DAY
Medicare Strategy
Geography Beneficiary Plan Design
Focus onCNC Markets
Focus onindividuals
under 400% FPL
Creating lowor no cost
premium plans
82CENTENE - JUNE 2017 INVESTOR DAY
Operationalizing Strategies and Insights
Test and Learn Model
• Brand: New national brand
• Network: Expand non-Medicaid provider network & increase focus on value based purchasing
• Sales and Marketing: Targeted broker relationships and community depth

83CENTENE - JUNE 2017 INVESTOR DAY
2018 OutlookFocused Growth Strategy
• Submitted 11 new market LOIs originally and plan to enter six new markets
• Launch two D-SNP focused markets
• Additional growth investment in new 2017 markets
• Launch targeted 2018 markets that align with network, plan design, and sales opportunity
Medicare to represent 20%+ of total Centene growth
Longer-term Expectations:

84CENTENE - JUNE 2017 INVESTOR DAY
Industry Leading Multi-Product Portfolio
Ability to leverage multi-product portfolio
Demonstrated commitment to national product leadership
Focused on diversified growth across government healthcare landscape

85CENTENE - JUNE 2017 INVESTOR DAY
Value in ExperienceC. David Minifie, Chief Experience Officer & EVP

86CENTENE - JUNE 2017 INVESTOR DAY
Transforming the Health of the Community, One Person at a Time
OUR PURPOSE | why we do what we do
OUR BRAND PILLARS | How we go about doing it
Focus on the Individual
WholeHealth
Active LocalInvolvement

87CENTENE - JUNE 2017 INVESTOR DAY
Focus on the IndividualWhat are the challenges our consumers face on the road to better health?
KNOWN & UNKNOWN
PRESENT & FUTURE
DIRECT & INDIRECT

88CENTENE - JUNE 2017 INVESTOR DAY
MEMBERS AND THEIR FAMILIES, PROVIDERS & CAREGIVERSan expansive consumer ecosystem, includes

89CENTENE - JUNE 2017 INVESTOR DAY
Changing Landscape
HISTORICAL BUSINESS CONSUMER REALITY
• Auto-assignment• State Government• Product• Transaction
• Consumer Choice• Individual Consumer• People• Engagement
Satisfaction drives results
More Likely to Renew
More Likely to Recommend
More Likely to Forgive
More Likely to Try a New Offering
92%
88%
67%
57%

90CENTENE - JUNE 2017 INVESTOR DAY

91CENTENE - JUNE 2017 INVESTOR DAY
Learning More About Our Consumers
Sophisticated Segmentation Research Detailed Mapping & Targeting
TO WHERE THEY AREFROM WHO THEY ARE

92CENTENE - JUNE 2017 INVESTOR DAY
Local Still Matters
93CENTENE - JUNE 2017 INVESTOR DAY
*Figures represent Ambetter membership only (does not include Covered CA members)

94CENTENE - JUNE 2017 INVESTOR DAY
Adults 65+Includes those who are
about to “age-in,” as well as switchers.

95CENTENE - JUNE 2017 INVESTOR DAY
• Brand matters; hard to break in with well-entrenched competitors
• Overall Medicare-eligible carrier switching is small in any one year (about 6%)
• Major switch triggers are: bad customer experience, PCP falling out of plan, Rx price changes
• Age-ins shop for: brand, price/cost, doctor, formulary• Providers can be very influential, as can brokers/agents
The Consumer: Highlights

96CENTENE - JUNE 2017 INVESTOR DAY
Emotional Journey to Get to a Medicare Plan Decision
“Do I qualify for Medicare?”“What does MA cover?”
“Do I need other coverage?”
“What are my options?”“What plan is best for me?”
“How do I enroll?”
Most feel confusion, uncertainty & anxiety
Our goal: guided, confident & relieved
97CENTENE - JUNE 2017 INVESTOR DAY

98CENTENE - JUNE 2017 INVESTOR DAY
• The name Allwell is simple, clear and easy to understand.
• Individuals feel that the name conveys the concepts of “good health and being taken care of.”
• Tested well against competitor brands already in market.
CONSISTENTLY PERFORMED WELL IN RESEARCH AMONG MEDICARE ELIGIBLES
Medicare consumers prefer a brand with a local extension, with 61% of consumers preferring a local brand name.

99CENTENE - JUNE 2017 INVESTOR DAY
Local, flexible and scalable brand architecture
Trusted, local partner for all Texans and their community
Covers full range of government-sponsored Medicaid & Children’s Health Insurance Plans (CHIP)
STATE-BASED MARKET BRAND
PRODUCT BRAND FOR MARKETPLACE
PRODUCT BRAND FOR MEDICARE
EXTENSIONS FOR CONSUMER CATAGORIES

100CENTENE - JUNE 2017 INVESTOR DAY
Transforming the Health of the Community, One Person at a Time
OUR PURPOSE | why we do what we do
OUR BRAND PILLARS | How we go about doing it
Focus on the Individual
WholeHealth
Active LocalInvolvement

101CENTENE - JUNE 2017 INVESTOR DAY
Question and Answer

Break
SSID: Centene Corp Password: welcome2017
2017 Investor Day

103CENTENE - JUNE 2017 INVESTOR DAY
Growth and DiversificationCynthia Brinkley, EVP - Global Corporate Development

104CENTENE - JUNE 2017 INVESTOR DAY 104
$677BAddressable Markets Pipeline $798B
$100B
$9B
$105B
$175B
Correctional Healthcare
Health Insurance Marketplace
Federal Services
Medicaid
Medicare
International*Data based on Congressional Budget Office projections and Company estimates for FY 2019
$1.86 trillion*

105CENTENE - JUNE 2017 INVESTOR DAY 105
Correctional Healthcare
Health Insurance Marketplace
Federal Services
Medicaid
Medicare
International
$249 billion
TargetedPipeline

106CENTENE - JUNE 2017 INVESTOR DAY
2018 Revenue Visibility
2017P 2018P
• HIM and Medicare Market Expansions
• Full Year of MO & NV• PA Go-live• IL, MS, MA
Reprocurements• New Envolve Contracts • HIF Return
• CA In-Home Support Services (IHSS) carve-out
GROWTH DRIVERS
$50B+
$46.4B
2018P
$51B+
*2017 mid-point of guidance range

107CENTENE - JUNE 2017 INVESTOR DAY
Growth Verticals
Existing Markets
New Markets
Specialty Products
Medicare Advantage
M&A

108CENTENE - JUNE 2017 INVESTOR DAY
Growth Verticals
Existing Markets
New Markets
Specialty Products
Medicare Advantage
M&A

109CENTENE - JUNE 2017 INVESTOR DAY
2017 Success
North Central Region Integrated Physical and Behavioral Health
• Awarded May 22nd ; Go-Live January 1, 2018

110CENTENE - JUNE 2017 INVESTOR DAY
Existing Market - Pending Announcements
MississippiCAN Reprocurement
RFP submitted Apr. 7th
MassHealth Reprocurement
RFP submitted Apr. 13th
ICP & Family Health Plan Reprocurement
RFP submitted May 15th

111CENTENE - JUNE 2017 INVESTOR DAY
Existing Market - Reprocurements
CHIP Rural Service Area ReprocurementRFP due July 2017
Go-Live September 2018
STAR+PLUS ReprocurementRFP anticipated August 2017
Go-Live February 2019
STAR and CHIP ReprocurementRFP anticipated in 2018Go-Live January 2020
Statewide Medicaid Managed Care and Long Term Care Reprocurement
RFP anticipated last week of JuneGo-Live January 2019
Acute Care ReprocurementRFP expected early November 2017
Go-Live October 2018
KanCare ReprocurementRFP anticipated late 2017
Go-Live January 2019

112CENTENE - JUNE 2017 INVESTOR DAY
Existing Markets HIM Membership Growth (Peak)
112
Centene State
Centene HIM Market (2018)
New HIM Market (2018)
HIM Expansion Market (2018)
Centene Medicare Market (2017)
2015
167,000
2016
683,000
2017
1,200,000
328,000Medicare &
Duals Members
(Q1 2017)

113CENTENE - JUNE 2017 INVESTOR DAY
Growth Verticals
Existing Markets
New Markets
Specialty Products
Medicare Advantage
M&A

114CENTENE - JUNE 2017 INVESTOR DAY
New Markets
Heritage Health
Went live 1/1/17
Managed Care Program
7/1/17 go-live
Community HealthChoicesPhased in from
1/1/18 to 1/1/19
HealthChoices1/1/18 go-live

115CENTENE - JUNE 2017 INVESTOR DAY
Growth Verticals
Existing Markets
New Markets
Specialty Products
Medicare Advantage
M&A

116CENTENE - JUNE 2017 INVESTOR DAY
Specialty Products
Addressing market needs and driving external
revenue growth via an integrated platform that leverages the strength of
Centene’s specialty solutions
REPRESENTATIVE CLIENTS
Population health technology, risk stratification, care coordination and project management support
Presenter
Presentation Notes
Aon Hewitt Care management, behavioral health, pharmacy benefit and health & wellness services Texas Association of Community Health Centers Nurse Advice Line services for 1.2 million Texans offered through a group purchasing arrangement with TACHC. Maryland Physicians Care Comprehensive backroom supports and services for health plan serving 185,000 Medicaid members.
117CENTENE - JUNE 2017 INVESTOR DAY
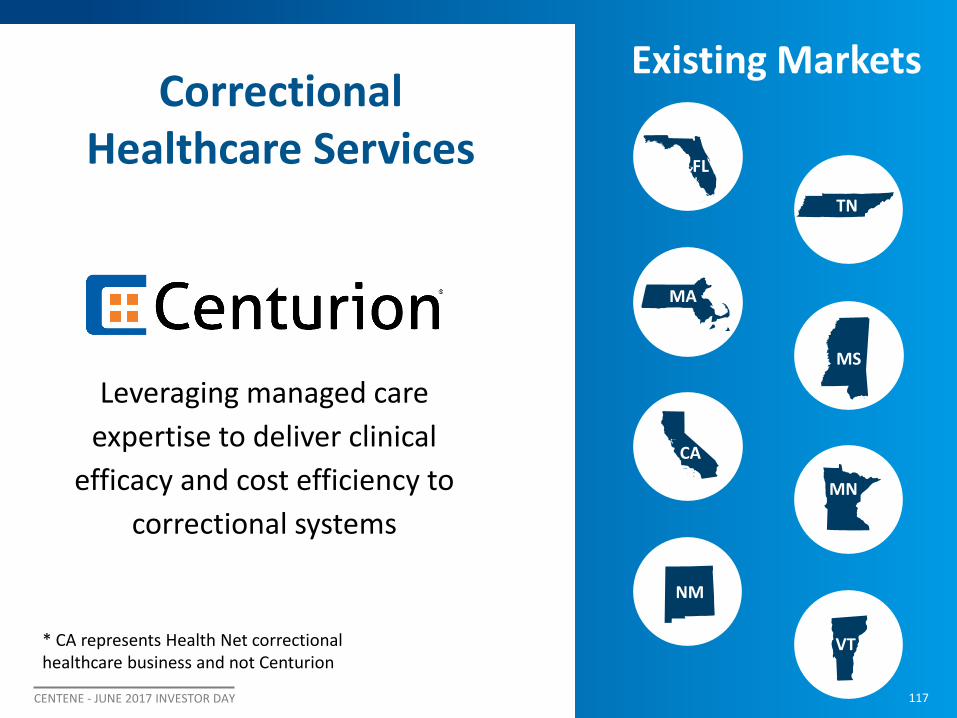
Correctional Healthcare Services
Existing Markets
117
Leveraging managed care expertise to deliver clinical
efficacy and cost efficiency to correctional systems
* CA represents Health Net correctional healthcare business and not Centurion
NM
MS
MN
MA
VT
TN
CA
FL

118CENTENE - JUNE 2017 INVESTOR DAY
Growth Verticals
Existing Markets
New Markets
Specialty Products
Medicare Advantage
M&A

119CENTENE - JUNE 2017 INVESTOR DAY
Medicare Advantage
GROWTH STRATEGY
• Targeting low-income enrollees <400% FPL
• Building upon the strength of Centene’s local approach
• Leveraging parent organization’s 4-Star rating
• Entering new markets
• Expansion in current markets

120CENTENE - JUNE 2017 INVESTOR DAY
Growth Verticals
Existing Markets
New Markets
Specialty Products
Medicare Advantage
M&A

121CENTENE - JUNE 2017 INVESTOR DAY
M&A Strategic Objectives
CAPABILITYM&A targets that add capabilities for existing service offerings
SCALEAdd scale to existing operations and increase our geographic footprint
VALUECREATION
Generating appropriate returns on our investments for our shareholders
CONSISTENT CRITERIA & FINANCIAL DISCIPLINE

122CENTENE - JUNE 2017 INVESTOR DAY
In Summary…
Scale Momentum RobustPipeline
WE ARE A GROWTH COMPANY
123CENTENE - JUNE 2017 INVESTOR DAY
Healthcare Policy UpdatePanel Discussion

124CENTENE - JUNE 2017 INVESTOR DAY
Healthcare Policy Update
Haley Barbour, Founding Partner - BGR Group;Former Governor of Mississippi
Richard GephardtCentene Board Member; CEO – Gephardt Group; Former Majority Leader of the U.S. House of Representatives
David SchiappaPartner at the Duberstein Group
Joe AntosWilson H. Taylor Scholar in Health Care and Retirement Policy –American Enterprise Institute
Jonathan DinesmanSVP, Government Relations - Centene

125CENTENE - JUNE 2017 INVESTOR DAY
Question and Answer

126CENTENE - JUNE 2017 INVESTOR DAY
Finance Update: Appendix A

127CENTENE - JUNE 2017 INVESTOR DAY
Reconciliation of GAAP Earnings from Continuing Operations to Adjusted Diluted EPS:2012 2013 2014 2015 2016 Q1 2016 Q1 2017
GAAP Earnings from continuing operations 89$ 161$ 268$ 356$ 559$ (15)$ 139$ Amortization of acquired intangible assets 5 6 16 24 147 9 40 Health Net acquisition related expenses - - - 27 234 189 5 California minimum medical loss ratio change - - - - (195) - - Charitable contribution - - - - 50 - - Debt extinguishment - - - - 11 - - Penn Treaty assessment expense - - - - - - 47 Income tax effects of adjustments (2) (2) (6) (20) (79) (87) (34)
Adjusted Earnings from Continuing Operations 92$ 165$ 278$ 387$ 727$ 96$ 197$ Diluted shares outstanding (in thousands) 107,429 112,494 120,360 123,066 163,975 129,531 175,836
GAAP diluted EPS from Continuing Operations 0.83$ 1.43$ 2.23$ 2.89$ 3.41$ (0.12)$ 0.79$ Adjusted Diluted EPS 1 0.86$ 1.47$ 2.31$ 3.14$ 4.43$ 0.74$ 1.12$
Reconciliation of GAAP diluted EPS to Adjusted Diluted EPS:
GAAP diluted EPSAmortization of acquired intangible assets 2
Health Net acquisition related expenses 3
Penn Treaty assessment expense 4
Adjusted Diluted EPS 1
$0.54 - $0.58 $0.02 - $0.03
$0.17 $4.50 - $4.90
$3.75 - $4.15
Annual Guidance December 31, 2017
Included in this presentation is Adjusted Diluted EPS. Management believes that this non-GAAP financial measure provides information that is useful to investors in understanding period-over-period operating results and enhances the ability of investors to analyze Centene’s business trends and performance. This non-GAAP financial measure should not be considered in isolation, or as a substitute for the corresponding GAAP financial measure and may not be comparable to similar measures used by other companies. A reconciliation of this non-GAAP financial measure with the most directly comparable financial measure calculated in accordance with GAAP follows:
1 Adjusted Diluted EPS is defined as GAAP diluted net earnings from continuing operations before amortization of acquired intangible assets, Health Net acquisition related expenses, and the tax impact of such adjustments, calculated on a per share basis. In 2016, Adjusted Diluted EPS excludes debt extinguishment costs and the impact associated with the retroactive change in the minimum MLR calculation and associated charitable contribution. In Q1 2017, Adjusted Diluted EPS excludes the Penn Treaty assessment expense. We believe these adjustments are not indicative of future performance.
2 The amortization of acquired intangible assets per diluted share presented are net of the income tax benefit estimated to be $0.31 to $0.35 for the year ended December 31, 2017.
3 The Health Net acquisition related expenses per diluted share presented are net of the income tax benefit estimated to be $0.01 to $0.02 for the year ended December 31, 2017.
4 The Penn Treaty assessment expense per diluted share is net of the estimated income tax benefit of $0.09 for the year ended December 31, 2017.
Reconciliation of Non-GAAP Measures($ IN MILLIONS, EXCEPT PER SHARE DATA)
128CENTENE - JUNE 2017 INVESTOR DAY
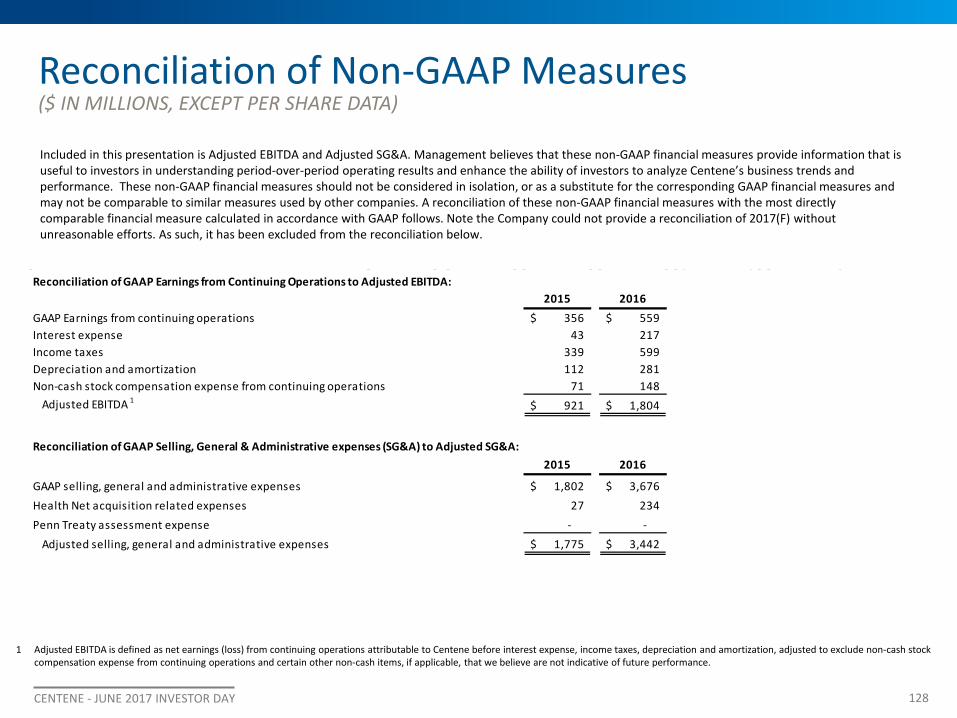
Reconciliation of GAAP Earnings from Continuing Operations to Adjusted EBITDA:2015 2016
GAAP Earnings from continuing operations 356$ 559$ Interest expense 43 217 Income taxes 339 599 Depreciation and amortization 112 281 Non-cash stock compensation expense from continuing operations 71 148 Adjusted EBITDA 1 921$ 1,804$
Reconciliation of GAAP Selling, General & Administrative expenses (SG&A) to Adjusted SG&A:2015 2016
GAAP selling, general and administrative expenses 1,802$ 3,676$ Health Net acquisition related expenses 27 234 Penn Treaty assessment expense - - Adjusted selling, general and administrative expenses 1,775$ 3,442$
Included in this presentation is Adjusted EBITDA and Adjusted SG&A. Management believes that these non-GAAP financial measures provide information that is useful to investors in understanding period-over-period operating results and enhance the ability of investors to analyze Centene’s business trends and performance. These non-GAAP financial measures should not be considered in isolation, or as a substitute for the corresponding GAAP financial measures and may not be comparable to similar measures used by other companies. A reconciliation of these non-GAAP financial measures with the most directly comparable financial measure calculated in accordance with GAAP follows. Note the Company could not provide a reconciliation of 2017(F) without unreasonable efforts. As such, it has been excluded from the reconciliation below.
1 Adjusted EBITDA is defined as net earnings (loss) from continuing operations attributable to Centene before interest expense, income taxes, depreciation and amortization, adjusted to exclude non-cash stock compensation expense from continuing operations and certain other non-cash items, if applicable, that we believe are not indicative of future performance.
Reconciliation of Non-GAAP Measures($ IN MILLIONS, EXCEPT PER SHARE DATA)

Thank You!
SSID: Centene Corp Password: welcome2017
2017 Investor Day


