2017 FULL YEAR RESULTS - ophir-energy.com · •Transaction with Chevron agreed in Myanmar which...
27
2017 FULL YEAR RESULTS 7 March 2018
Transcript of 2017 FULL YEAR RESULTS - ophir-energy.com · •Transaction with Chevron agreed in Myanmar which...

2017 FULL YEAR RESULTS7 March 2018
DISCLAIMER
THIS DOCUMENT IS CONFIDENTIALThis document has been prepared and issued by and is the sole responsibility of Ophir Energy plc (the “Company”) and its subsidiaries for selected recipients. It comprises the written materials for a presentation to investors and/or industry professionals concerning the Company’s business activities. By attending this presentation and/or accepting a copy of this document, you agree to be bound by the following conditions and will be taken to have represented, warranted and undertaken that you have agreed to the following conditions. This presentation is strictly confidential and may not be copied, published, distributed or transmitted. If you do not accept these conditions, you should immediately destroy, delete or return this document.The document is being supplied to you solely for your information and for use at the Company’s presentation to investors and/or industry professionals concerning the Company’s bus iness activities. It is not an offer or invitation to subscribe for or purchase any securities and nothing contained herein shall form the basis of any contract or commitment whatsoever. This presentation does not constitute or form part of any offer or invitation to sell or issue, or any solicitation of any offer to purchase or subscribe for, any shares in the Company in any jurisdiction nor shall it or any part of it nor the fact of i ts distribution form the basis of, or be relied on in connection with, any contract commitment or investment decision in relation thereto nor does it constitute a recommendation regarding the securities of the Company. This presentation is for informational purposes only and may not be used for any other purposes.The distribution of this presentation in jurisdictions other than the United Kingdom may be restricted by law and therefore p ersons into whose possession this presentation comes should inform themselves about and observe such restrictions. Any failure to comply with these restrictions may constitute a violation of securities laws of any such jurisdictions.
This presentation and any materials distributed in connection with this presentation may include certain forward-looking statements, beliefs or opinions, including, without limitation, statements with respect to the Company’s business, financial condition, results of operations, plans, objectives and estimates, including, among others, resource estimates. These statements, which contain the words “anticipate”, “believe”, “intend”, “estimate”, “expect” and words of similar meaning, reflect the Directors’ beliefs and expectations and involve a number of risks and uncertainties because they relate to events and depend on circumstances that will occur in the future. No representation is made that any of these statements or forecasts will come to pass or that any forecast results will be achieved. There are a number of known and unknown risks, uncertainties and other factors that could cause actual results, performance and developments of the Company or industry results to differ materially from those expressed or implied by such forward looking statements, therefore, undue rel iance should not be placed on forward looking s tatements. Past performance of the Company cannot be relied on as a guide to future performance. Forward-looking statements speak only as at the date of this presentation and the Company expressly disclaims any obligations or undertaking to release any update of, or revisions to, any forward-looking s tatements in this presentation, whether as a result of new information or future events. No statement in this presentation i s intended to be a profit forecast or should be interpreted to mean that future earnings per share of the Company will necessarily match or exceed its historical published earnings per share. As a result, you are cautioned not to place any undue reliance on such forward-looking s tatements.Certa in data in this presentation was obtained from various external data sources, and the Company has not verified such data with independent sources. Accordingly, no representation or warranty, express or implied, is made and no reliance should be placed, on the fairness, accuracy, correctness, completeness or reliability of that data, and such data involves risks and uncertainties and is subject to change based on various factors.No rel iance may be placed for any purposes whatsoever on the information contained in this presentation or on its completeness. The Company and i ts members, directors, officers and employees are under no obligation to update or keep current information contained in this presentation, to correct any inaccuracies which may become apparent, or to publicly
announce the result of any revision to the statements made herein except where they would be required to do so under applicable law, and any opinions expressed in them are subject to change without notice, whether as a result of new information or future events. No representation or warranty, express or implied, is given by the Company or any of its subsidiaries undertakings or affiliates or directors, officers or any other person as to the fairness, accuracy, correctness, completeness or reliability of the information or opinions contained in this presentation, nor have they independently verified such information, and any reliance you place thereon will be at your sole risk. Without prejudice to the foregoing, no liability whatsoever (in negligence or otherwise) for any loss howsoever arising, directly or indirectly, from any use of this presentation or its contents or otherwise arising in connection therewith is accepted by any such person in relation to such information.
2017 Full year results presentation Slide 2

Progressed project in 2017, project financing remains key to FID
FORTUNA STATUS
A number of materialmilestones were
completed in 2017
Frustrating not to have yetsecured project financing
and reached FID
Project economics are excellent and FID willunlock material value
Progressing project fundingsolution
2017 Full year results presentation Slide 3

Drilled Ayame-1X well in CDI
Signed Block 5 in Mexico and awarded Block 24 in
Equatorial Guinea
$250m Reserve based lending
facility (plus $100m accordion) secured
FID in May 2017 Project commences
with infill drilling in 2H 2018
Price agreed subject to final approval
in 1H 2018
Financing is remaining
workstream
3 wells successfully completed in
2H 2017
DELIVERY OF 2017 OBJECTIVES
2017 Full year results presentation Slide 4
COMPLETE BUALUANG IN-FILL DRILLING
PROGRAMME
COMPLETE KERENDAN GAS PRICE
RENEGOTIATION
FID PHASE IVOF BUALUANG DEVELOPMENT
FID ON FORTUNA FLNG PROJECT
REFINANCE /RESTRUCTURE
DEBT PORTFOLIO
CAPTURE HIGHQUALITY EXPLORATION
ACREAGE
RESTART OPERATED EXPLORATION PROGRAMME
Key:
Completed Pending

Underlines performance of underlying portfolio
ILLUSTRATIVE NAV GROWTH DURING 2017
2017 Full year results presentation Slide 5
100
2.3
2.7
6.7
6.6
81.7
1.6
713.8
86.9
50
60
70
80
90
100
No
rma
ised
NA
V In
dex
NAV per share increased by 6.4% in 2017 driven by:
• Asset performance; unlocking incremental value from producing fields
• Increased cost control
• Disciplined capital allocation
• Exploration a cost centre; materially reduced from 2018 onwards

2P reserves growth, 1bn boe of 2C resource
RESERVES AND RESOURCES
43.949.4
4.3
9.8
--
5.0
10.0
15.0
20.0
25.0
30.0
35.0
40.0
45.0
50.0
55.0
2016YE 2017 Production Revisions 2017YE
MM
bo
e
2016-2017 YE 2P Reserves Waterfall
0.00x
5.00x
10.00x
15.00x
20.00x
25.00xPeer comparison 2C:2P1
1 Peer group: Lundin, AkerBP, Tullow, Premier, Soco, Enquest, Genel, Faroe, Seplat, Cairn
Increased 2P reserves
• 2P reserves up 13% year on year to 49.4 MMboe (y/e 2016 43.8 MMboe)
• Reserves replacement ratio of 228%
• Reserves/Production ratio of 12 underpins strong production and cash flow in the medium term
1bn boe of discovered resource
• Largest relative 2C resource inventory relative to peer group
• Latent value which carries commercial risk but well defined technically
2017 Full year results presentation Slide 6

0
2
4
6
8
10
12
14
Jan-17 Mar-17 May-17 Jul-17 Sep-17 Nov-17 Jan-18
Kerendan Actual SPH Actual Bualuang Actual
RELIABLE PRODUCTION BASE
2017 Full year results presentation Slide 7
Group
• Production averaged 11,700 boepd in 2017
• Uptime of 99%
Bualuang
• Averaged 8,300 bopd
• Infill drilling programme completed
• Water handling capacity increased to 75,000 bpd
Kerendan
• Averaged 2,200 boepd
• Successful ramp up to full DCQ
Sinphuhorm
• Averaged 1,200 boepd
• Variable nominations from offtaker
• Domestic production periodically displaced by spot LNG imports
Ophir Energy Net Production by Field Working Interest Basis (Mboe/d)

0
30,000
2018 2019 2020 2021 2022
Fortuna 2P Kerendan Phases 2 & 3
Bualuang Phase 5 Kerendan 2P
Bualuang 2P Sinphuhorm 2P
Reinvestment opportunities in key assets
STRONG PRODUCTION GROWTH FROM OPERATED ASSETS
2017 Full year results presentation Slide 8
Material Growth 2017-2022
• Potential for additional cash from monetisation of residual20% interest in Tanzania
Key Milestones
Fortuna FID
Bualuang Phase IV
Kerendan additional Gas Sales Agreement
boepd
BUALUANG: CASE STUDY OF VALUE CREATION
2017 Full year results presentation Slide 9
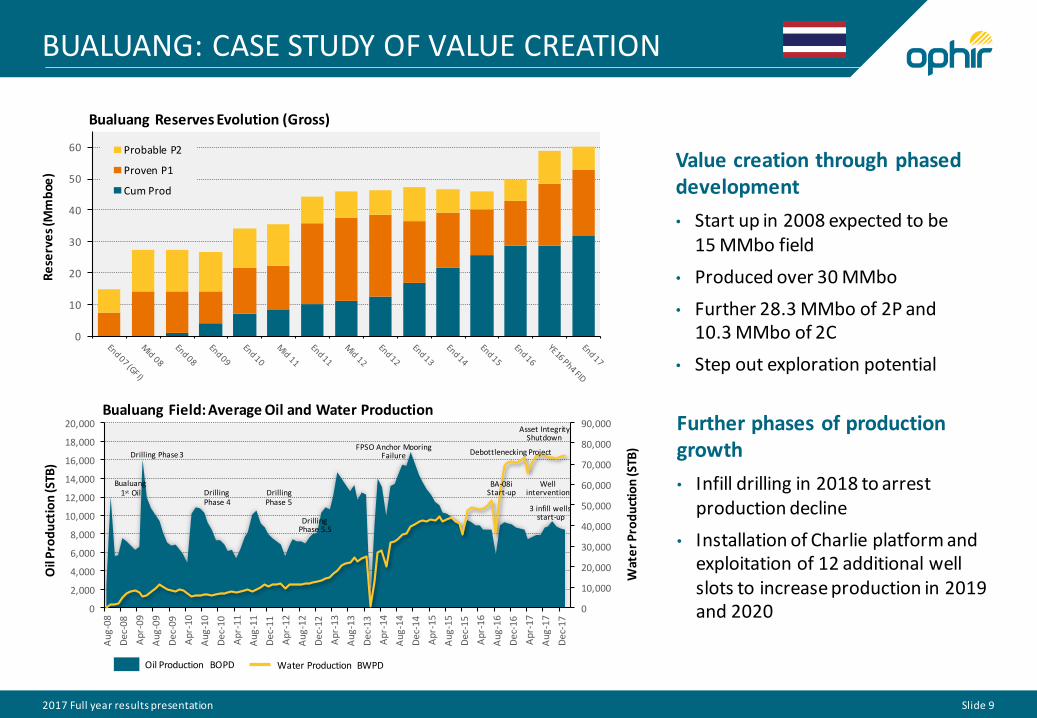
Value creation through phased development
• Start up in 2008 expected to be15 MMbo field
• Produced over 30 MMbo
• Further 28.3 MMbo of 2P and10.3 MMbo of 2C
• Step out exploration potential
Further phases of production growth
• Infill drilling in 2018 to arrest production decline
• Installation of Charlie platform and exploitation of 12 additional well slots to increase production in 2019 and 2020
0
10
20
30
40
50
60
Re
serv
es
(Mm
boe
)
Bualuang Reserves Evolution (Gross)
Probable P2
Proven P1
Cum Prod
0
10,000
20,000
30,000
40,000
50,000
60,000
70,000
80,000
90,000
0
2,000
4,000
6,000
8,000
10,000
12,000
14,000
16,000
18,000
20,000
Au
g-0
8
Dec
-08
Ap
r-09
Au
g-0
9
Dec
-09
Ap
r-10
Au
g-1
0
Dec
-10
Ap
r-11
Au
g-1
1
Dec
-11
Ap
r-12
Au
g-1
2
Dec
-12
Ap
r-13
Au
g-1
3
Dec
-13
Ap
r-14
Au
g-1
4
Dec
-14
Ap
r-1
5
Au
g-1
5
Dec
-15
Ap
r-1
6
Au
g-1
6
Dec
-16
Ap
r-1
7
Au
g-1
7
Dec
-17
Wat
er
Pro
du
ctio
n (S
TB)
Oil
Pro
du
ctio
n (S
TB)
Bualuang Field: Average Oil and Water Production
Bualuang1st Oil
Drilling Phase 3
Drilling Phase 4
Drilling Phase 5
Drilling Phase 5.5
FPSO Anchor Mooring Failure
BA-08i Start-up
Debottlenecking Project
Asset IntegrityShutdown
Well intervention
3 infill wells start-up
Oil Production BOPD Water Production BWPD

KERENDAN: FOCUSED ON SELLING MORE GAS
2017 Full year results presentation Slide 10
• Steady production from phase 1
• Gas price renegotiation closed out- Price of $5.65 per mmbtu agreed in principle
• 3D survey has confirmed potential of the field, and identified further upside
• Two further phases of gas commercialisation- Aiming to sign a second GSA for phase 2 in 2018
- Aim to complete a tender for phase 3 sales
• Potential to grow production from 3,500 boepd to over 14,000 boepd (gross)
• Step out oil and gas exploration potential

Focus on Infrastructure Led Exploration (ILEX)
REFOCUSED EXPLORATION
2017 Full year results presentation Slide 11
• Infrastructure led on Bualuang and Kerendan
• Exploration acreage in EG next to producing oil fields, farm-out ongoing
• Counter-cyclically built biggest acreage position in Mexican offshore of any listed independent player
• Transaction with Chevron agreed in Myanmar which will result in equity in Block A-5 and access to infrastructure
• Exited 8 deepwater licences in past 12 months

FINANCIAL UPDATE
Tony Rouse, CFO

FULL YEAR FINANCIAL SUMMARY
2017 Full year results presentation Slide 13
Units FY 2017 FY 2016 COMMENTS
NET SOURCES OF FUNDS:
Revenue $’millions 188.5 107.2 Bualuang $52/bbl (FY16: $38) and Kerendan $5.30/Mscf (FY16: N/A)
Kerendan Take-or-Pay $’millions - 16.5 Accrued Kerendan Take-or-Pay Revenues Nil (FY16 $16.5m)
Cost of production (operating expenses,
royalty and inventories)$’millions (70.0) (42.7) Unit opex $12.8/boe (FY16: $13.4/boe)
Investment Income $’millions 4.2 4.4 Net income from Sinphuhorm $4m (FY16: $4m)
Current income Tax Charge $’millions (32.6) (23.7) Bualuang investment in Phase 4 development reducing taxation charge
Net funds flow from production $ ‘millions 90.1 61.7 Income from production $21/boe (FY16: $16/boe) reflects higher prices
NET USES OF FUNDS:
Capex (less disposals) $’millions 101.1 155.6 Exploration $41m (FY16: $76) and asset monetisation $60m (FY16: $80)
Net administration cost $’millions 11.3 13.4 Further lowering of cost base - gross reduction of 60% in three years
Net Finance Costs $’millions 13.2 14.3 Further reducing negative cash carrying costs
Net uses of funds $’millions 125.6 183.3 Further reducing cash outlay
FINANCING:
Closing Net Cash $’millions 117.1 160.1 Net cash outlay $43m (FY16: $195m)
Closing Borrowings $’millions 106.7 200.3 Continued deleveraging with RBL repayment $94m in 2017
Undrawn Facilities $’millions 203.5 10.3 RBL refinanced in 2017 - $203.5m undrawn
Closing Gross Liquidity $’millions 427.3 370.7 Total liquidity with undrawn RBL $427m (YE16: $371m)

Costs, debt, capex falling; cash flow increasing
STRONG FINANCIAL CONTROL
2017 Full year results presentation
$31m
$13m$11m
$0
$5
$10
$15
$20
$25
$30
$35
$40
2015 2016 2017
Net G&A costs ($ million)
$113m
$62m
$90m
$0
$20
$40
$60
$80
$100
$120
2015 2016 2017
Funds flow from production ($ million)
Mill
ion
$355m
$160m
$117m
$0
$50
$100
$150
$200
$250
$300
$350
$400
2015 2016 2017
Net cash ($ million)
Mill
ion
Slide 14
$206m
$156m
$101m
$0
$50
$100
$150
$200
$250
2015 2016 2017
Capex ($ million)
Exploration
Mill
ion
Mill
ion

Maintaining capacity for discretionary investment
2018 GUIDANCE
2017 Full year results presentation Slide 15
Production: 11,500 boepd
• Bualuang 8,500 bopd, Kerendan 2,000 boepd
Funds flow from production: $90 million
• Bualuang $84 million, Kerendan $6 million
2018 Hedging Programme
• Purchased swap at average of $59/bbl for 3,200 bpd
• Purchased call at average of $68/bbl for 3,200 bpd
Capital expenditure: $150 million
• Fortuna FID: $55 million
• Bualuang Phase IV: $40 million
• Mexico exploration: $15 million
• Kerendan civil works & water wells: $10 million
Net cash
• Expect to end year in net cash position
Gross liquidity of $320 million
Net Operating Cash Flow 44%
Operating Costs 28%
Royalty 7%
Taxation 17%
Administration 4%
OPERATING CASH FLOW
CAPITAL EXPENDITURE
Exploration 23%
Pre-development 3%
Production 37%
Investment Fortuna 37%

Strong balance sheet, low cost sustainable production and limited commitments
FULLY FUNDED FIVE YEAR BUSINESS PLAN
Significant cash position & liquidity• Closing net cash $117 million; Liquidity $427 million
• Low liquidity and gearing ratios with loan to value
• Refinanced Reserves Based Lending Facility into new seven year $250 million facility (with $100 million accordion)
• Planned 2018 refinance of Nordic bond
Robust operating cash flow from high margin assets• Solid production base generating c. $100 million cash flow p.a
going forward
• Fortuna on-steam early-2022 providing long-term sustainable cash flow
Funded work programme for next few years• Committed spend of only $75 million (Mexico, Indonesia
and Malaysia)
• Investment to maximise cash flow from producing assets
• $150 million investment into Fortuna over three years from FID
• Remaining discretionary funds allocated to highest returning opportunities (E&A, P&D, share buy-back)
2017 Full year results presentation
2018-2021 Sources and uses of funds
Slide 16
Year-end 2017 Liquidity
Operating Cash Flow (Existing Portfolio)
Debt Service
Commitments
Fortuna
P&D
Discretionary
$0.0bn
$1.0bn
Sources Uses
EXPLORATION
Oliver QuinnDirector – Exploration & Africa

REFOCUSED EXPLORATION PORTFOLIO
2017 Full year results presentation Slide 18
Deepwater exploration:• 3 blocks awarded in
licence rounds 2016-18
• Drilling from 4Q 18/1Q 19
Infrastructure led exploration• Step out exploration
around Bualuang
Deepwater exploration:• Cross-assignment with Chevron
(subject to government approval)
• 45% interest in blocks AD-03 and A-5
• Potential drilling in 2019
Infrastructure led exploration• EG24: exploration licence
awarded in 2017
• Farm-out ongoing
• Adjacent to producing oil fields
Infrastructureled exploration• Step out exploration
around Kerendan
Deepwater exploration• West Papua/Aru
• Drill or drop decision in1H 2018

MEXICO:LEADING POSITION IN A WORLD CLASS BASIN
2017 Full year results presentation Slide 19
• Mexico open to foreign investment for first time in 75 years
• Ophir has non-operated positions in three licences, Blocks 5, 10 and 12
• Opportunity to access a proven, underexplored hydrocarbon province
• Ophir’s interest in Mexico is equivalent to over 300 US GOM blocks (average US GOM block is 25km2)
• Among independents, Ophir holds the second largest position and the largest of any international E&P
-- 2,000 4,000 6,000 8,000 10,000

Block – 5 Overview
MEXICO
2017 Full year results presentation Slide 20
A
A’
Blk - 5OPHIR 23.3%
Zama Discovery
Rnd 2.4 Blk 29 award
Regional seismic tie from Zama discovery into Block 5
• Large block located in heart of Sureste Basin play fairways
• Zama discovery (30km south) proves working petroleum system
• Numerous salt related structural traps being identified
• Trap scale potential 100 - 350 MMbo range
• Seismic interpretation and regional geosocial work ongoing
• Operator preparing for 2019 drilling

Block - 24
EQUATORIAL GUINEA
2017 Full year results presentation Slide 21
A
A’
EG-24OPHIR
80or40%
Blk WKosmos
EG-21Kosmos
Blk SKosmos
Okume
Ceiba
Hyper-extended Continental Crust
Upper Cretaceous Sand fairways form structural closures
over Kribi High
Mature Oil Source Rocks
Position of Okume/Ceiba
Complex
Updip stratigraphic trapping potential
A A’
-2sec
-4sec
-6sec
EG-24
~5km
• New PSC ratified and farm-out near completion
• 3 Year Initial Term with Seismic Acquisition Commitment
• Both structural and stratigraphic traps within Upper Cretaceous fairway
• Proven oil up-dip in Okume/Ceiba Complex
• Block area 3500km2
• Water depth 2000 – 3000m
• Seismic acquisition planning well advanced
• Prospectivity scale200-400 MMbo
• Option to drill in Second Term

B8/38 Bualuang North Lead
THAILAND
2017 Full year results presentation Slide 22
• New seismic has uplifted both imaging and depth solutions
• Northern end of Bualuang Field potentially shallower
• OWCs spill northward into the North Bualuang closure
• Significant low risk upside resource potential if part of main field
• Evaluating merits of drilling in upcoming well campaign
• Being evaluated at 2018 drilling option
• Potential addition to Phase IV development
Kerendan Gas Field
B8/38 OPHIR100%
Bualuang Oil Field
Bualuang North Prospect
Revised depth solution has
potential to bring
North Bualuang into main field closure above
OWC
T2.6 Depth Map Original Velocity Solution
T2.6 Depth Map Revised Velocity Solution
T2.6 Reservoir
Closure above OWC
T2.6 Reservoir
Closure above OWC with revised
velocity model
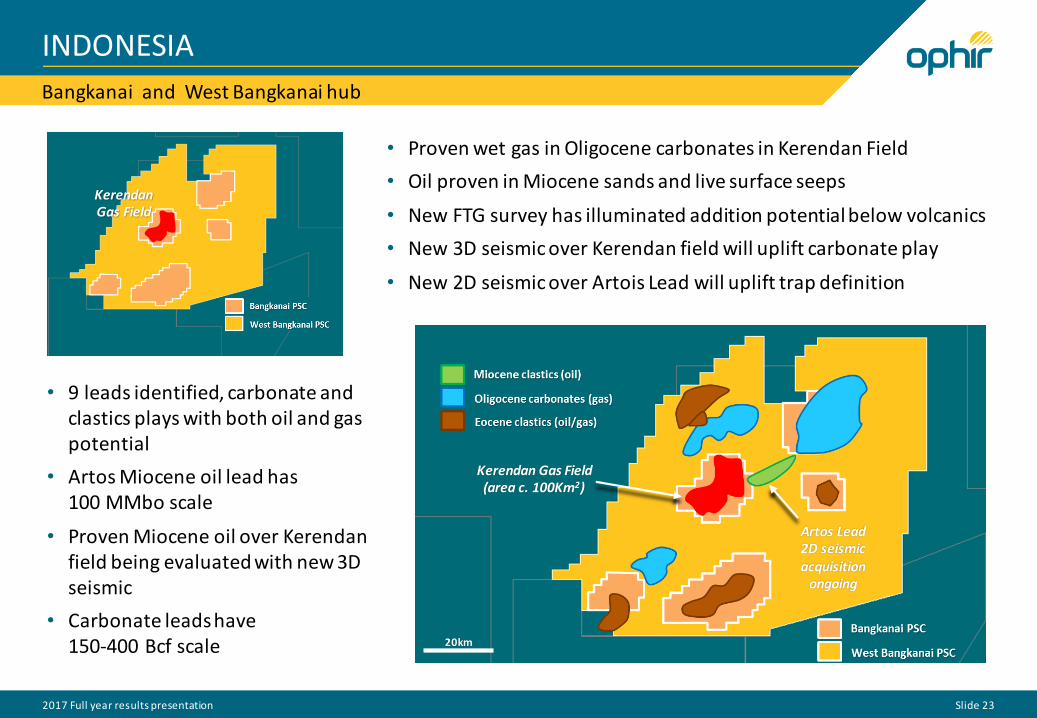
Bangkanai and West Bangkanai hub
INDONESIA
2017 Full year results presentation Slide 23
• Proven wet gas in Oligocene carbonates in Kerendan Field
• Oil proven in Miocene sands and live surface seeps
• New FTG survey has illuminated addition potential below volcanics
• New 3D seismic over Kerendan field will uplift carbonate play
• New 2D seismic over Artois Lead will uplift trap definition
• 9 leads identified, carbonate and clastics plays with both oil and gas potential
• Artos Miocene oil lead has100 MMbo scale
• Proven Miocene oil over Kerendan field being evaluated with new 3D seismic
• Carbonate leads have150-400 Bcf scale 20km
Kerendan Gas Field(area c. 100Km2)
Artos Lead2D seismic acquisition
ongoing
Kerendan Gas Field

OUTLOOK
Nick CooperCEO
2017 Full year results presentation Slide 24
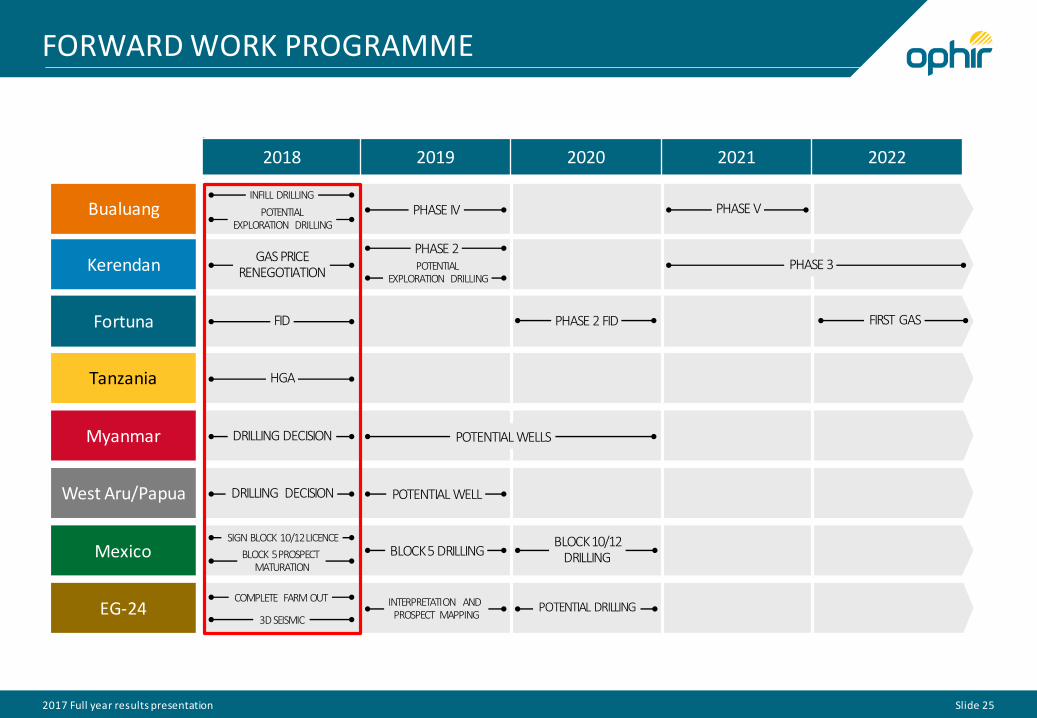
FORWARD WORK PROGRAMME
2017 Full year results presentation Slide 25
2018 2019 2020 2021 2022
Bualuang
Kerendan
Fortuna
Tanzania
Myanmar
West Aru/Papua
Mexico
EG-24
POTENTIALEXPLORATION DRILLING
PHASE IV
GAS PRICERENEGOTIATION
PHASE 2
FID
HGA
DRILLING DECISION
DRILLING DECISION
SIGN BLOCK 10/12 LICENCE
BLOCK 5 PROSPECT MATURATION
COMPLETE FARM OUT
3D SEISMIC
INTERPRETATION AND PROSPECT MAPPING
POTENTIAL WELLS
POTENTIAL WELL
BLOCK 5 DRILLING
POTENTIAL DRILLING
BLOCK 10/12DRILLING
PHASE V
PHASE 3
FIRST GASPHASE 2 FID
INFILL DRILLING
POTENTIALEXPLORATION DRILLING
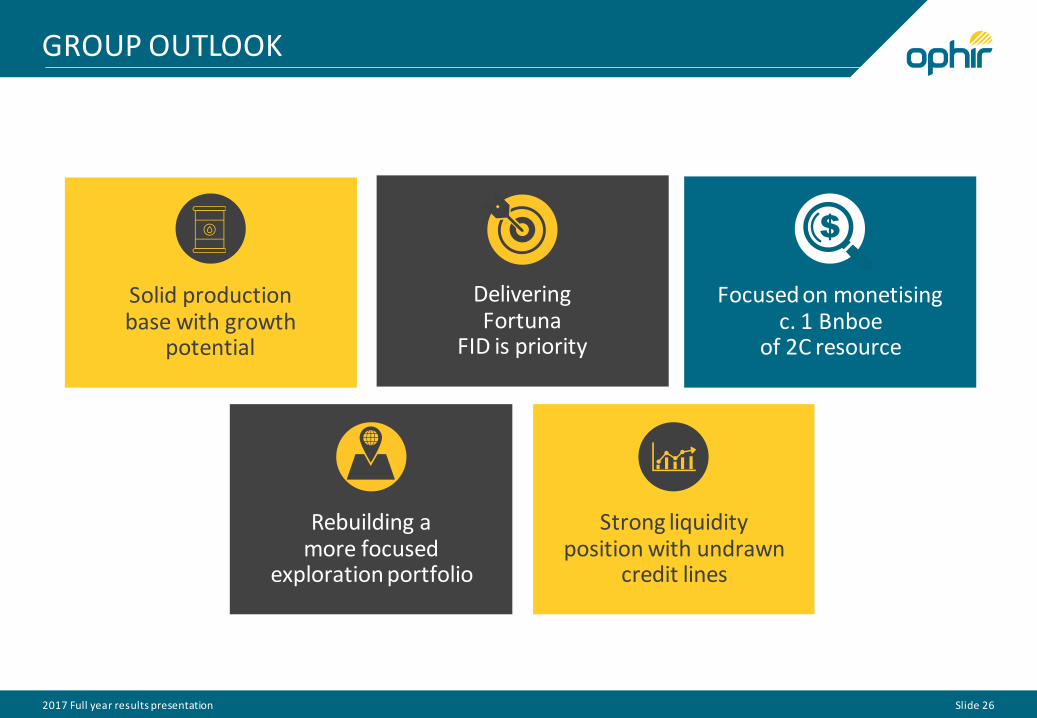
GROUP OUTLOOK
2017 Full year results presentation Slide 26
Strong liquidity position with undrawn
credit lines
Solid productionbase with growth
potential
Rebuilding a more focused
exploration portfolio
Delivering Fortuna
FID is priority
Focused on monetising c. 1 Bnboe
of 2C resource

For further information contact:
Head of IR and Corporate [email protected]
Geoff Callow
Level 4123 Victoria StreetLondon SW1E 6DEUNITED KINGDOM
Tel: +44 (0)29 7811 2400Fax: +44 (0)20 7811 2421