2017 Edelman Trust Barometer - Singapore
42
2017 Edelman Trust Barometer Singapore Launch 1
-
Upload
edelman-apacmea -
Category
Marketing
-
view
93 -
download
1
Transcript of 2017 Edelman Trust Barometer - Singapore
2017 Edelman
Trust BarometerSingapore Launch
1


Informed
Public
9 years in 20+ markets
Represents 13% of total global population
500 respondents in U.S. and China; 200 in all other countries
Must meet 4 criteria:
Ages 25-64
College educated
In top 25% of household income per age group in each country
Report significant media consumption and engagement in business news
General Online
Population
6 years in 25+ markets
Ages 18+
1,150 respondents per country
All slides show General Online Population unless otherwise noted
2017 Edelman Trust Barometer
Methodology
28-country global data margin of error: General Population +/-0.6% (N=32,200), Informed Public +/- 1.2% (N=6,200), Mass Population +/- 0.6% (26,000+). Country-
specific data margin of error: General Population +/- 2.9 ( N=1,150), Informed Public +/- 6.9% (N = min 200, varies by country), China and U.S. +/- 4.4% (N=500),
Mass Population +/- 3.0 to 3.6 (N =min 740, varies by country), half sample Global General Online Population +/- 0.8 (N=16,100).
3
17 years of data
33,000+ respondents total
All fieldwork was conducted
between October 13th and
November 16th, 2016
Online Survey in
28 Countries
Mass
Population
All population not including Informed Public
Represents 87% of total global population
71
60
41
40
35
30
51
38
17
24
30
19
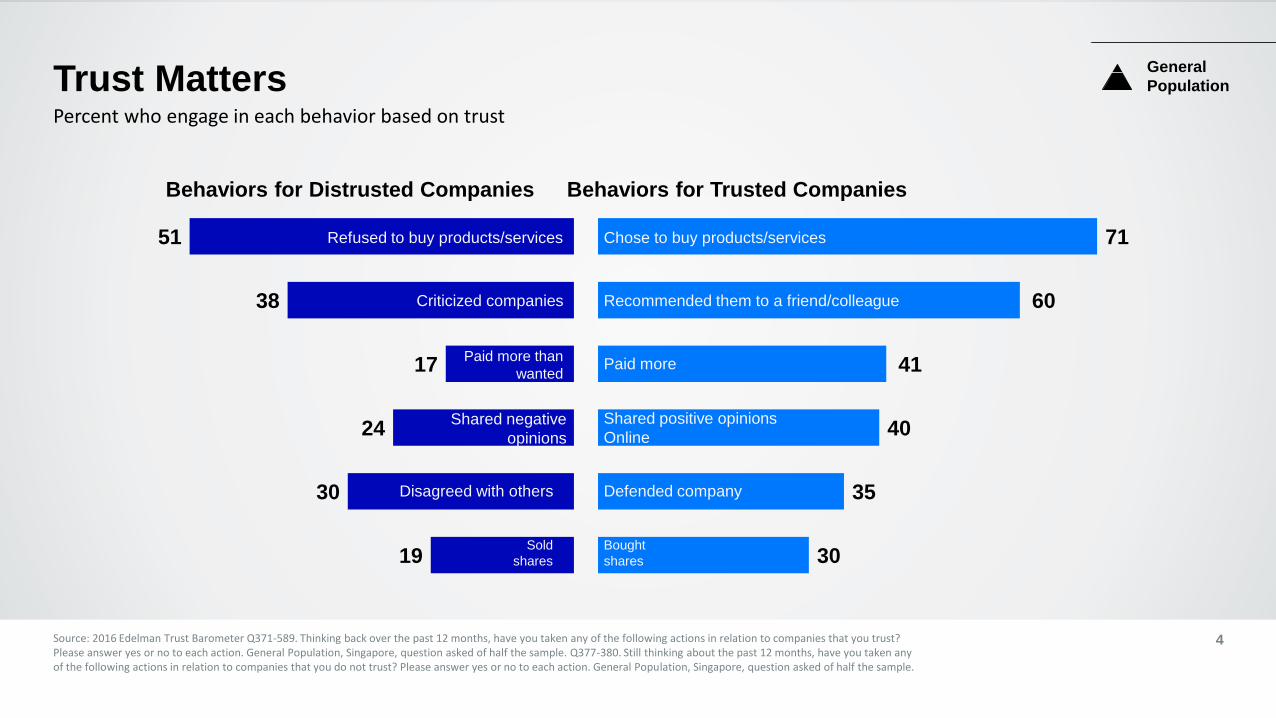
Trust Matters
Source: 2016 Edelman Trust Barometer Q371-589. Thinking back over the past 12 months, have you taken any of the following actions in relation to companies that you trust? Please answer yes or no to each action. General Population, Singapore, question asked of half the sample. Q377-380. Still thinking about the past 12 months, have you taken any of the following actions in relation to companies that you do not trust? Please answer yes or no to each action. General Population, Singapore, question asked of half the sample.
4
Percent who engage in each behavior based on trust
Behaviors for Distrusted Companies Behaviors for Trusted Companies
Refused to buy products/services
Criticized companies
Shared negative
opinions
Disagreed with others
Paid more than
wanted
Sold
shares
Chose to buy products/services
Recommended them to a friend/colleague
Shared positive opinions
Online
Defended company
Paid more
Bought
shares
General
Population
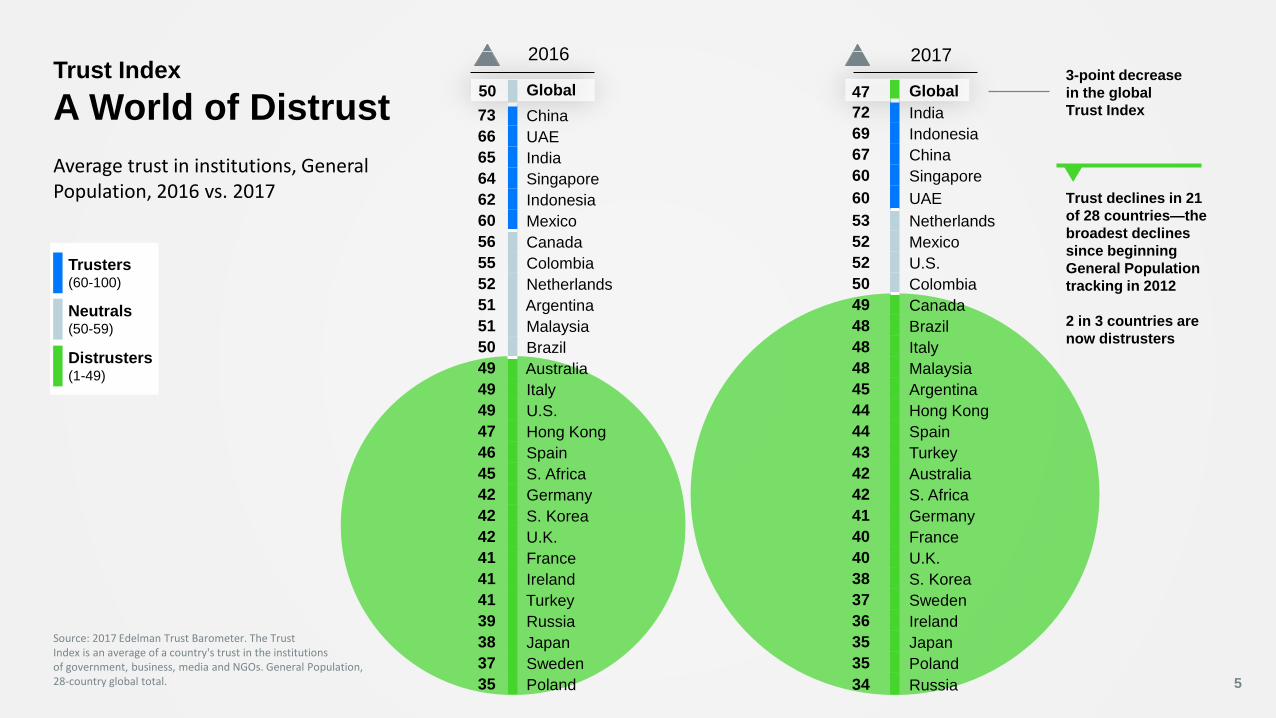
Trust Index
A World of Distrust
Average trust in institutions, General Population, 2016 vs. 2017
5
47 Global
72 India
69 Indonesia
67 China
60 Singapore
60 UAE
53 Netherlands
52 Mexico
52 U.S.
50 Colombia
49 Canada
48 Brazil
48 Italy
48 Malaysia
45 Argentina
44 Hong Kong
44 Spain
43 Turkey
42 Australia
42 S. Africa
41 Germany
40 France
40 U.K.
38 S. Korea
37 Sweden
36 Ireland
35 Japan
35 Poland
34 Russia
2016 2017
50 Global
73 China
66 UAE
65 India
64 Singapore
62 Indonesia
60 Mexico
56 Canada
55 Colombia
52 Netherlands
51 Argentina
51 Malaysia
50 Brazil
49 Australia
49 Italy
49 U.S.
47 Hong Kong
46 Spain
45 S. Africa
42 Germany
42 S. Korea
42 U.K.
41 France
41 Ireland
41 Turkey
39 Russia
38 Japan
37 Sweden
35 Poland
Trusters(60-100)
Neutrals(50-59)
Distrusters (1-49)
Source: 2017 Edelman Trust Barometer. The TrustIndex is an average of a country's trust in the institutionsof government, business, media and NGOs. General Population,28-country global total.
3-point decrease
in the global
Trust Index
Trust declines in 21
of 28 countries—the
broadest declines
since beginning
General Population
tracking in 2012
2 in 3 countries are
now distrusters

45 Global
70 India
67 Indonesia
62 China
59 Singapore
59 UAE
52 Netherlands
50 Colombia
50 Mexico
47 Brazil
47 Canada
47 Italy
47 Malaysia
47 U.S.
45 Argentina
42 Hong Kong
41 S. Africa
41 Spain
41 Turkey
40 Australia
39 Germany
38 France
37 U.K.
36 S. Korea
36 Sweden
35 Ireland
34 Japan
34 Poland
31 Russia
Trust Index
Mass Population Left BehindAverage trust in institutions,
Informed Public vs. Mass Population
The Mass Population
distrusts
their institutions in
20 of 28 countries
Source: 2017 Edelman Trust Barometer.
The Trust Index is an average of a country’s trust in the
institutions of government, business, media and NGOs.
Informed Public and Mass Population, 28-country global
total.
MassPopulation
InformedPublic
6
60 Global
80 India
79 China
78 Indonesia
77 UAE
71 Singapore
68 U.S.
62 Canada
62 Netherlands
61 Italy
61 Mexico
57 Malaysia
57 Spain
56 France
56 U.K.
55 Colombia
54 Australia
54 Germany
53 Hong Kong
51 Argentina
51 Brazil
50 S. Korea
50 Turkey
49 Japan
49 S. Africa
47 Sweden
45 Russia
44 Ireland
43 Poland
Trusters (60-100)
Neutrals (50-59)
Distrusters (1-49)
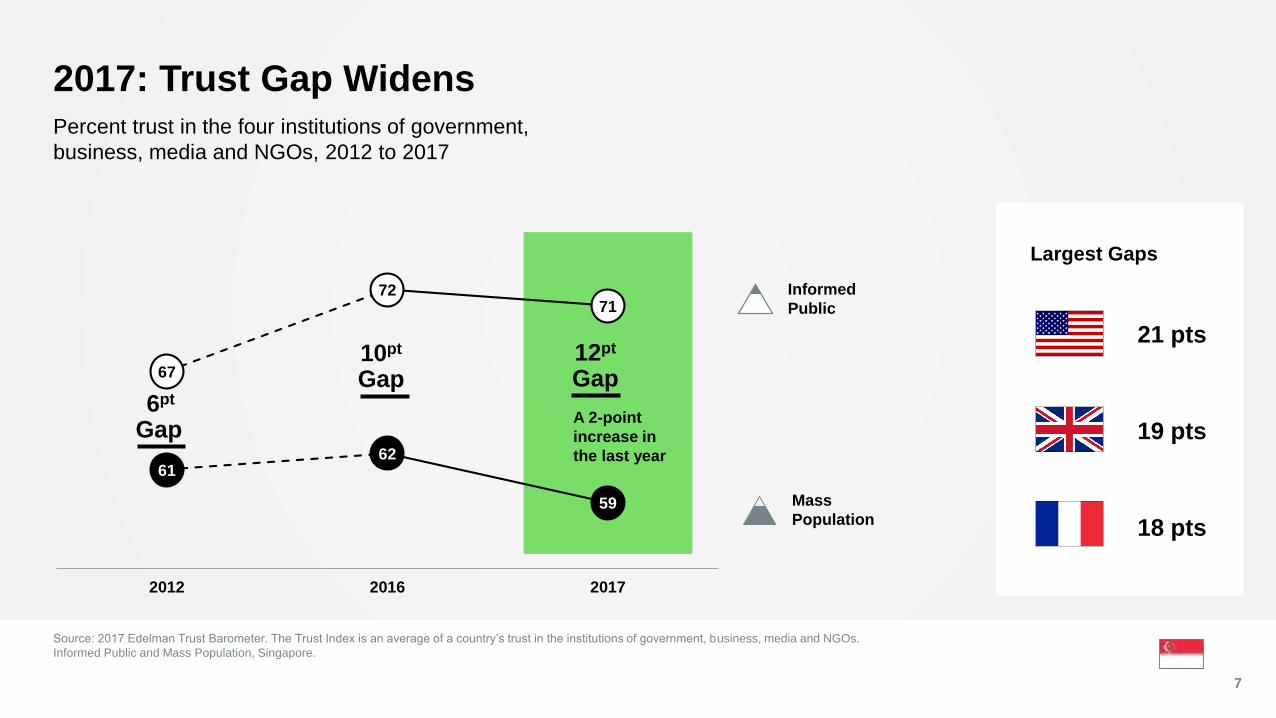
2017: Trust Gap Widens
Source: 2017 Edelman Trust Barometer. The Trust Index is an average of a country’s trust in the institutions of government, business, media and NGOs.
Informed Public and Mass Population, Singapore.
7
Percent trust in the four institutions of government,
business, media and NGOs, 2012 to 2017
21 pts
19 pts
18 pts
67
7271
6162
59
2012 2016 2017
Informed
Public
12pt
Gap6pt
GapA 2-point
increase in
the last year
10pt
Gap
Largest Gaps
Mass
Population
Trust in Crisis
How much do you
trust each institution
to do what is right?
43 43
2529
31 31 32 32 32 33 33
39 40 4042 42 42
44 44 45 4547 47 48 48
54 54
65 66 67
Glo
ba
l 2
8
GD
P 5
Turk
ey
Ire
land
Po
land
Russia
Au
str
alia
Ja
pa
n
U.K
.
Fra
nce
Sw
ede
n
S. A
fric
a
Arg
en
tin
a
S. K
ore
a
Ge
rma
ny
Ho
ng
Ko
ng
Ma
laysia
Sp
ain
UA
E
Ca
na
da
Co
lom
bia
Me
xic
o
U.S
.
Bra
zil
Ita
ly
Ne
the
rla
nd
s
Sin
ga
po
re
Ch
ina
India
Indo
ne
sia
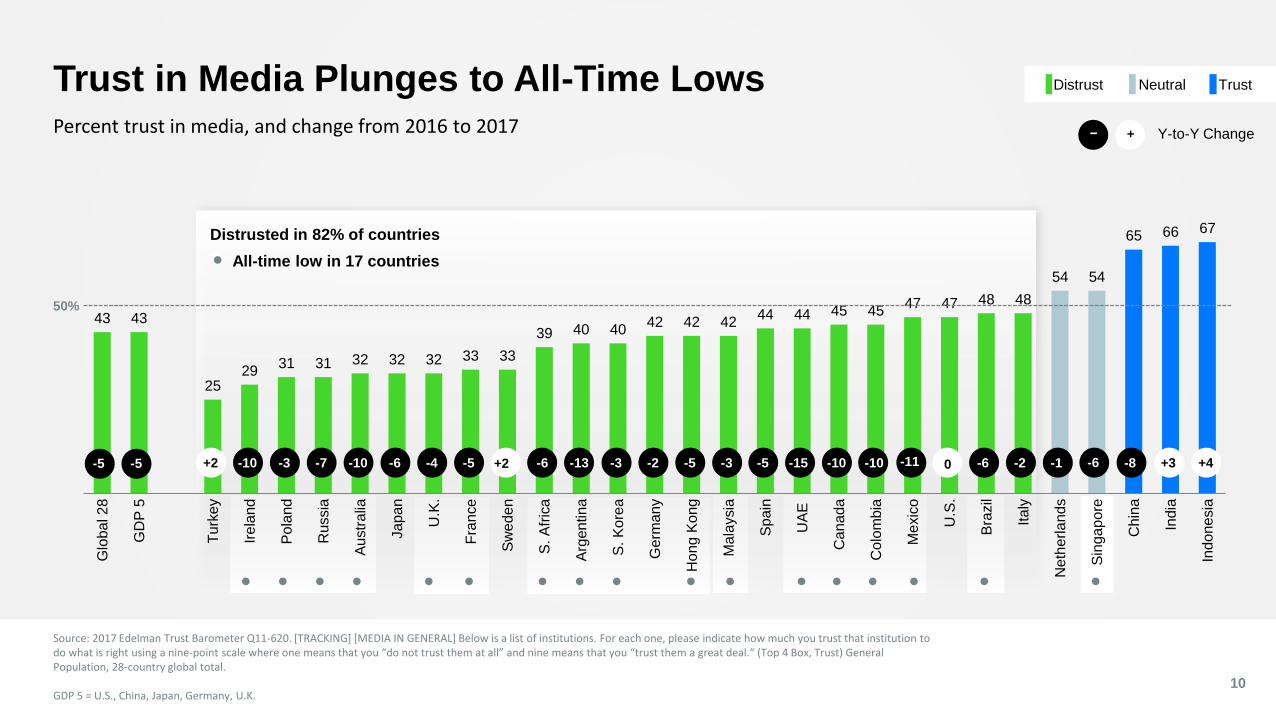
Trust in Media Plunges to All-Time Lows
Source: 2017 Edelman Trust Barometer Q11-620. [TRACKING] [MEDIA IN GENERAL] Below is a list of institutions. For each one, please indicate how much you trust that institution to do what is right using a nine-point scale where one means that you “do not trust them at all” and nine means that you “trust them a great deal.“ (Top 4 Box, Trust) General Population, 28-country global total.
GDP 5 = U.S., China, Japan, Germany, U.K. 10
Percent trust in media, and change from 2016 to 2017
Distrusted in 82% of countries
50%
All-time low in 17 countries
-5 -11 +3 +4+2 -8-6-1-2-60-10-10-15-5-3-6 -13 -3 -2 -5-10 -6 -4 +2-10 -3 -7-5 -5
Y-to-Y Change+−
NeutralDistrust Trust

Distrusted in 75% of countries
Trust in Government Further Evaporates
Source: 2017 Edelman Trust Barometer Q11-620. [TRACKING] [GOVERNMENT IN GENERAL] Below is a list of institutions. For each one, please indicate how much you trust that institution to do what is right using a nine-point scale where one means that you “do not trust them at all” and nine means that you “trust them a great deal.“ (Top 4 Box, Trust) General Population, 28-country global total.
GDP 5 = U.S., China, Japan, Germany, U.K. 11
Percent trust in government, and change from 2016 to 2017
Declines in 14 countries
50%
41
47
15
2024 24 25 25
2831 32 32 33
36 37 37 37 3840
43 44 4547
51 51
6971
75 75 76
Glo
ba
l 2
8
GD
P 5
S. A
fric
a
Po
land
Bra
zil
Me
xic
o
Fra
nce
Sp
ain
S. K
ore
a
Ita
ly
Colo
mb
ia
Ire
land
Arg
en
tin
a
U.K
.
Au
str
alia
Ja
pa
n
Ma
laysia
Ge
rma
ny
Ho
ng
Ko
ng
Ca
na
da
Ru
ssia
Sw
ede
n
U.S
.
Ne
the
rla
nd
s
Turk
ey
Sin
ga
po
re
Indo
ne
sia
India
UA
E
Ch
ina
0 +8 +2 +9 +13 +100+700+1+1+3+1+1 -1 -7 -2 -2 -1 -5 -10 -9 -5 -5 -3-1 -8 -8-1
Y-to-Y Change+−
NeutralDistrust Trust
53
47
2123
31
3943
46 4648
52 53 54 55 5658 58 58 59 59 59 60 60 60 61 61
64 64
71 71
Glo
ba
l 2
8
GD
P 5
Russia
Sw
ede
n
Ja
pa
n
Ge
rma
ny
Ire
land
Ne
the
rla
nd
s
U.K
.
Po
land
Au
str
alia
Turk
ey
Fra
nce
UA
E
S. K
ore
a
Ma
laysia
S. A
fric
a
U.S
.
Ca
na
da
Ho
ng
Ko
ng
Ita
ly
Bra
zil
Co
lom
bia
Sp
ain
Ch
ina
Sin
ga
po
re
Arg
en
tin
a
Indo
ne
sia
India
Me
xic
o
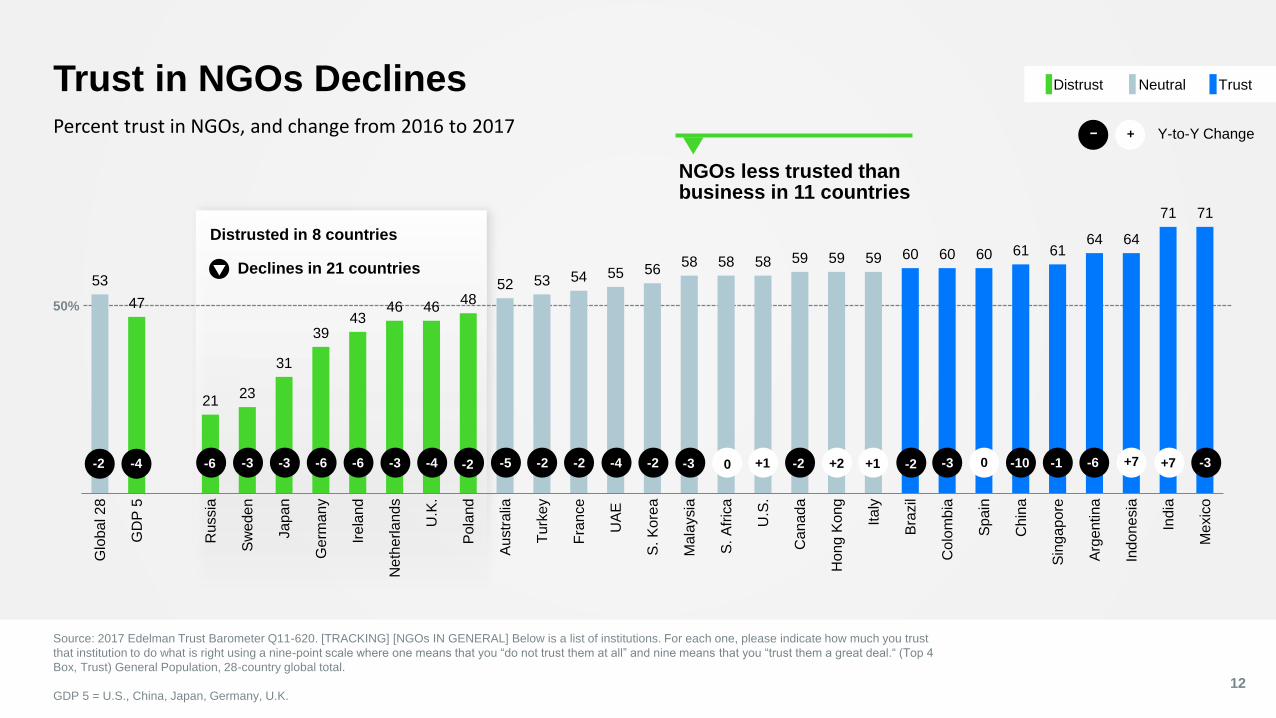
Trust in NGOs Declines
Source: 2017 Edelman Trust Barometer Q11-620. [TRACKING] [NGOs IN GENERAL] Below is a list of institutions. For each one, please indicate how much you trust
that institution to do what is right using a nine-point scale where one means that you “do not trust them at all” and nine means that you “trust them a great deal.“ (Top 4
Box, Trust) General Population, 28-country global total.
GDP 5 = U.S., China, Japan, Germany, U.K. 12
Percent trust in NGOs, and change from 2016 to 2017
Distrusted in 8 countries
50%
-2 +7 -3-6 +7-6-1-100-3+1+2-2+10-2 -2 -4 -2 -3-6 -3 -4 -5-3 -3 -6-2 -4 -2
Declines in 21 countries
Y-to-Y Change+−
NeutralDistrust Trust
NGOs less trusted than business in 11 countries
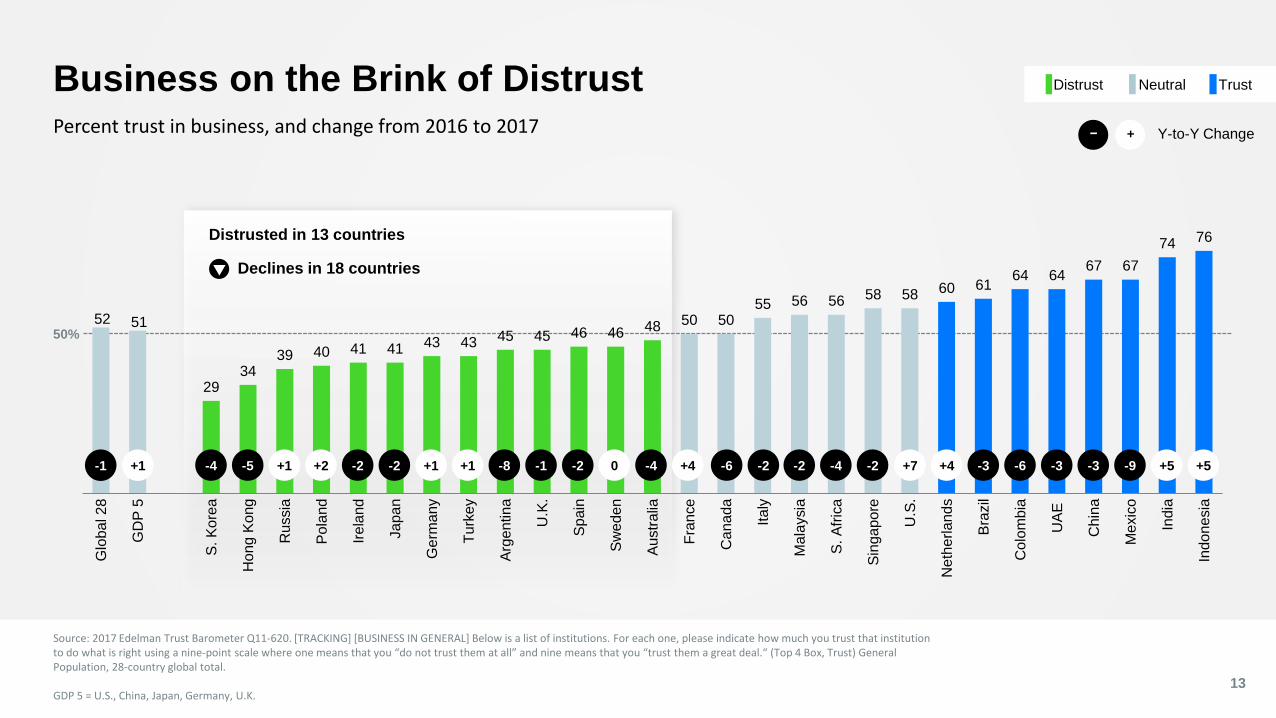
Business on the Brink of Distrust
Source: 2017 Edelman Trust Barometer Q11-620. [TRACKING] [BUSINESS IN GENERAL] Below is a list of institutions. For each one, please indicate how much you trust that institution to do what is right using a nine-point scale where one means that you “do not trust them at all” and nine means that you “trust them a great deal.“ (Top 4 Box, Trust) General Population, 28-country global total.
GDP 5 = U.S., China, Japan, Germany, U.K. 13
Percent trust in business, and change from 2016 to 2017
Distrusted in 13 countries
50%52 51
2934
39 40 41 41 43 43 45 45 46 46 48 50 5055 56 56 58 58 60 61
64 6467 67
74 76
Glo
ba
l 2
8
GD
P 5
S. K
ore
a
Ho
ng
Ko
ng
Ru
ssia
Po
land
Ire
land
Ja
pa
n
Ge
rma
ny
Turk
ey
Arg
en
tin
a
U.K
.
Sp
ain
Sw
ede
n
Au
str
alia
Fra
nce
Ca
na
da
Ita
ly
Ma
laysia
S. A
fric
a
Sin
ga
po
re
U.S
.
Ne
the
rla
nd
s
Bra
zil
Co
lom
bia
UA
E
Ch
ina
Me
xic
o
India
Indo
ne
sia
-4 +4 -2 -2 -4 -2 +7 +4 -3 -6 -3 -3 -9 +5 +5-4 -5-1 0-8 -1 -2+1-2 -2 +1+1 +2 -6+1
Declines in 18 countries
Y-to-Y Change+−
NeutralDistrust Trust
The SystemIs Broken

Without Trust,
Belief in the System Fails
15
How true are each of the following?
Sense of Injustice
Desire for Change
Need forceful reformers to bring change
Lack of Confidence
No confidence in current leaders
Lack of Hope
Hard work not rewarded, children will not have a better life, country not moving in right direction
System biased in favor of elites, elites
indifferent to the people, getting richer than
they deserve
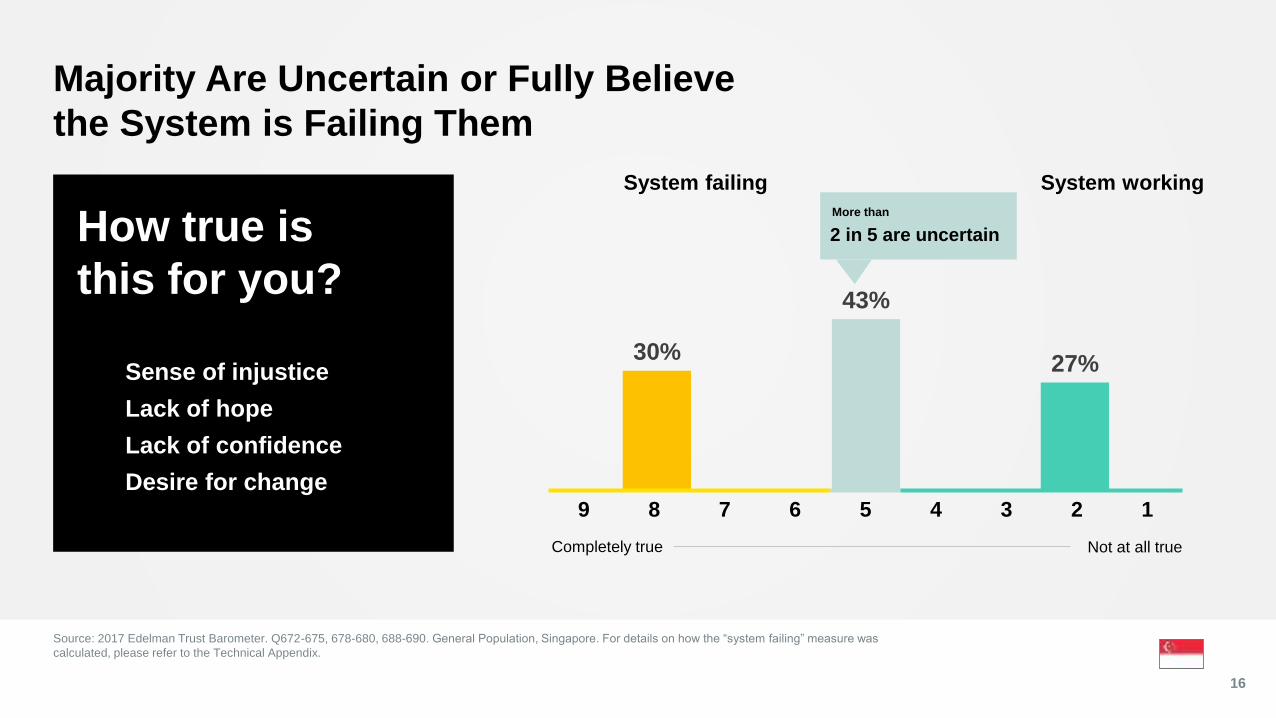
How true is
this for you?
Sense of injustice
Lack of hope
Lack of confidence
Desire for change
30%
43%
27%
Majority Are Uncertain or Fully Believe
the System is Failing Them
Source: 2017 Edelman Trust Barometer. Q672-675, 678-680, 688-690. General Population, Singapore. For details on how the “system failing” measure was
calculated, please refer to the Technical Appendix.
16
Not at all true
9 8 7 6 5 4 3 2 1
2 in 5 are uncertain
Completely true
System failing System working
More than
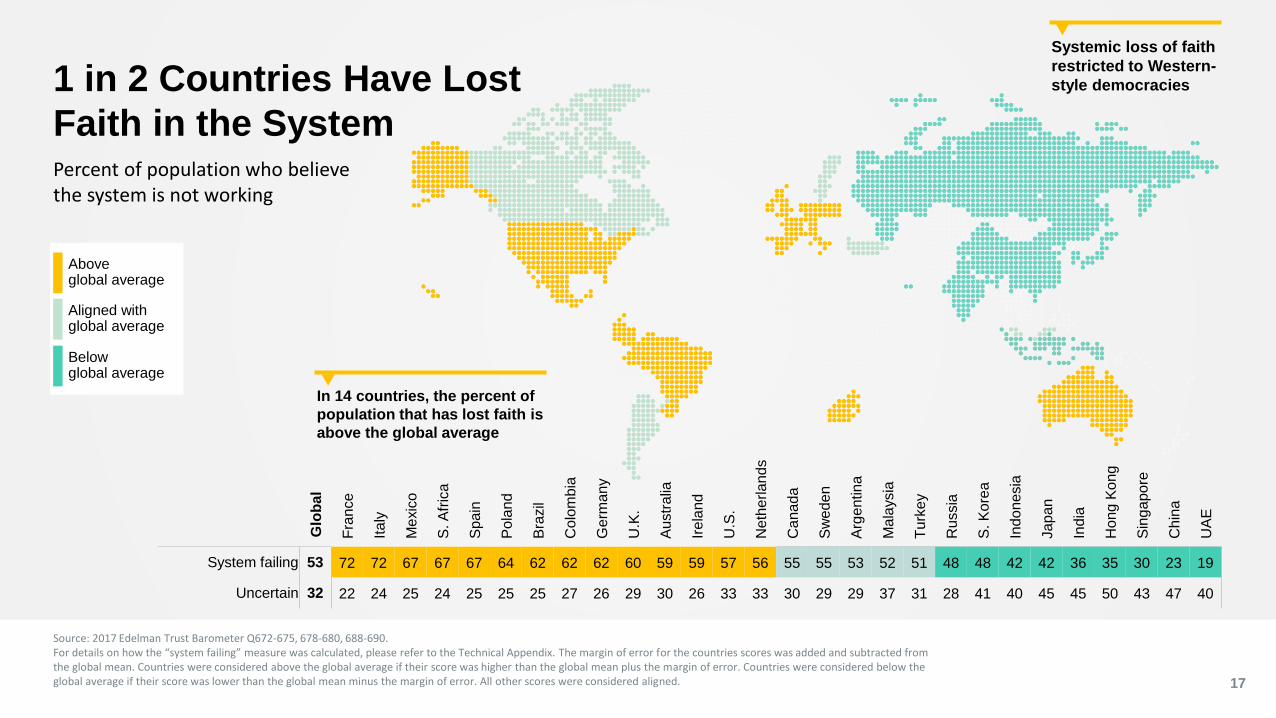
Source: 2017 Edelman Trust Barometer Q672-675, 678-680, 688-690. For details on how the “system failing” measure was calculated, please refer to the Technical Appendix. The margin of error for the countries scores was added and subtracted from the global mean. Countries were considered above the global average if their score was higher than the global mean plus the margin of error. Countries were considered below the global average if their score was lower than the global mean minus the margin of error. All other scores were considered aligned. 17
Glo
ba
l
Fra
nce
Ita
ly
Me
xic
o
S. A
fric
a
Sp
ain
Po
land
Bra
zil
Co
lom
bia
Ge
rma
ny
U.K
.
Au
str
alia
Ire
land
U.S
.
Ne
the
rla
nd
s
Ca
na
da
Sw
ede
n
Arg
entin
a
Ma
laysia
Tu
rke
y
Ru
ssia
S. K
ore
a
Indo
ne
sia
Ja
pa
n
India
Ho
ng
Ko
ng
Sin
ga
po
re
Ch
ina
UA
E
System failing 53 72 72 67 67 67 64 62 62 62 60 59 59 57 56 55 55 53 52 51 48 48 42 42 36 35 30 23 19
Uncertain 32 22 24 25 24 25 25 25 27 26 29 30 26 33 33 30 29 29 37 31 28 41 40 45 45 50 43 47 40
In 14 countries, the percent of
population that has lost faith is
above the global average
Systemic loss of faith
restricted to Western-
style democracies1 in 2 Countries Have Lost
Faith in the SystemPercent of population who believethe system is not working
Above global average
Aligned withglobal average
Belowglobal average
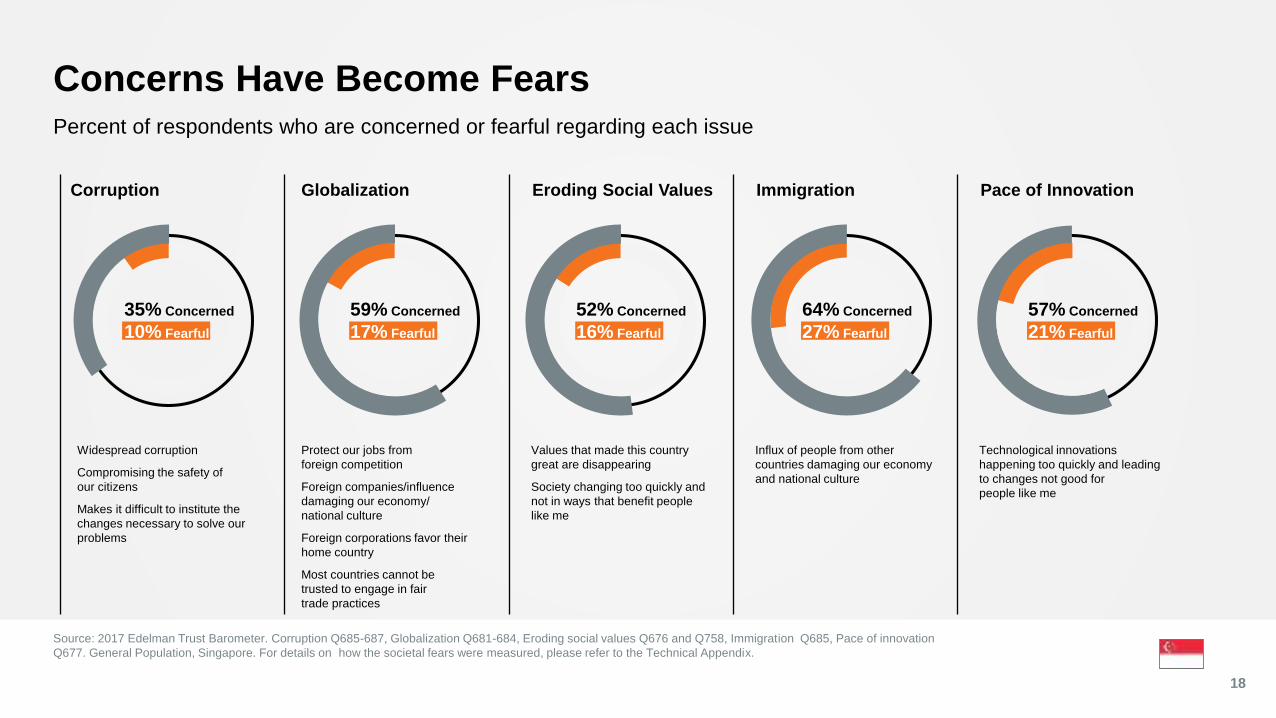
Corruption Globalization Eroding Social Values Immigration Pace of Innovation
Widespread corruption
Compromising the safety of
our citizens
Makes it difficult to institute the
changes necessary to solve our
problems
Protect our jobs from
foreign competition
Foreign companies/influence
damaging our economy/
national culture
Foreign corporations favor their
home country
Most countries cannot be
trusted to engage in fair
trade practices
Values that made this country
great are disappearing
Society changing too quickly and
not in ways that benefit people
like me
Influx of people from other
countries damaging our economy
and national culture
Technological innovations
happening too quickly and leading
to changes not good for
people like me
Concerns Have Become Fears
Source: 2017 Edelman Trust Barometer. Corruption Q685-687, Globalization Q681-684, Eroding social values Q676 and Q758, Immigration Q685, Pace of innovation
Q677. General Population, Singapore. For details on how the societal fears were measured, please refer to the Technical Appendix.
18
Percent of respondents who are concerned or fearful regarding each issue
35% Concerned
10% Fearful
64% Concerned
27% Fearful
52% Concerned
16% Fearful
59% Concerned
17% Fearful
57% Concerned
21% Fearful
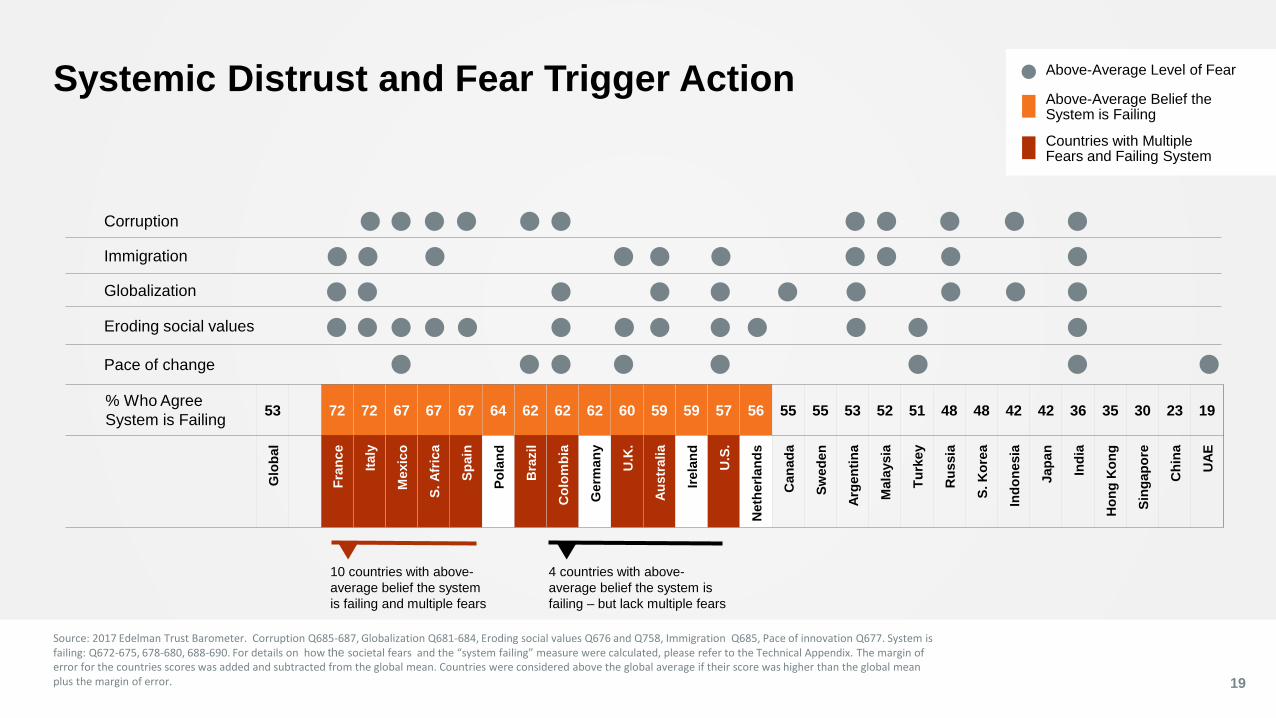
Systemic Distrust and Fear Trigger Action
Source: 2017 Edelman Trust Barometer. Corruption Q685-687, Globalization Q681-684, Eroding social values Q676 and Q758, Immigration Q685, Pace of innovation Q677. System is failing: Q672-675, 678-680, 688-690. For details on how the societal fears and the “system failing” measure were calculated, please refer to the Technical Appendix. The margin of error for the countries scores was added and subtracted from the global mean. Countries were considered above the global average if their score was higher than the global mean plus the margin of error. 19
% Who Agree
System is Failing53 72 72 67 67 67 64 62 62 62 60 59 59 57 56 55 55 53 52 51 48 48 42 42 36 35 30 23 19
Glo
bal
Fra
nce
Italy
Mexic
o
S. A
fric
a
Sp
ain
Po
lan
d
Bra
zil
Co
lom
bia
Germ
an
y
U.K
.
Au
str
alia
Irela
nd
U.S
.
Neth
erl
an
ds
Can
ad
a
Sw
ed
en
Arg
en
tin
a
Mala
ysia
Tu
rkey
Ru
ssia
S. K
ore
a
Ind
on
esia
Jap
an
Ind
ia
Ho
ng
Ko
ng
Sin
gap
ore
Ch
ina
UA
E
Above-Average Level of Fear
Above-Average Belief the System is Failing
Countries with Multiple Fears and Failing System
10 countries with above-
average belief the system
is failing and multiple fears
4 countries with above-
average belief the system is
failing – but lack multiple fears
Corruption
Immigration
Globalization
Eroding social values
Pace of change
11
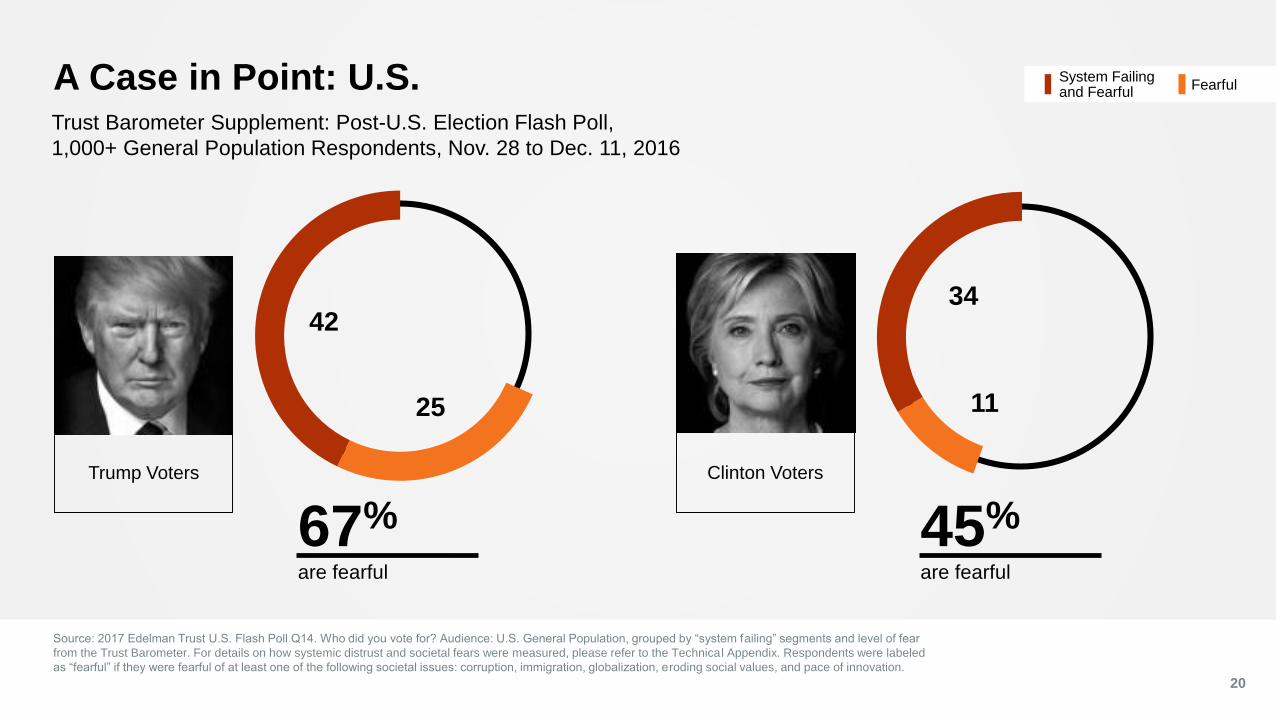
34
A Case in Point: U.S.
20
Trust Barometer Supplement: Post-U.S. Election Flash Poll,
1,000+ General Population Respondents, Nov. 28 to Dec. 11, 2016
Trump Voters Clinton Voters
25
42
67%
are fearful
45%
are fearful
Source: 2017 Edelman Trust U.S. Flash Poll Q14. Who did you vote for? Audience: U.S. General Population, grouped by “system failing” segments and level of fear
from the Trust Barometer. For details on how systemic distrust and societal fears were measured, please refer to the Technical Appendix. Respondents were labeled
as “fearful” if they were fearful of at least one of the following societal issues: corruption, immigration, globalization, eroding social values, and pace of innovation.
System Failingand Fearful
Fearful
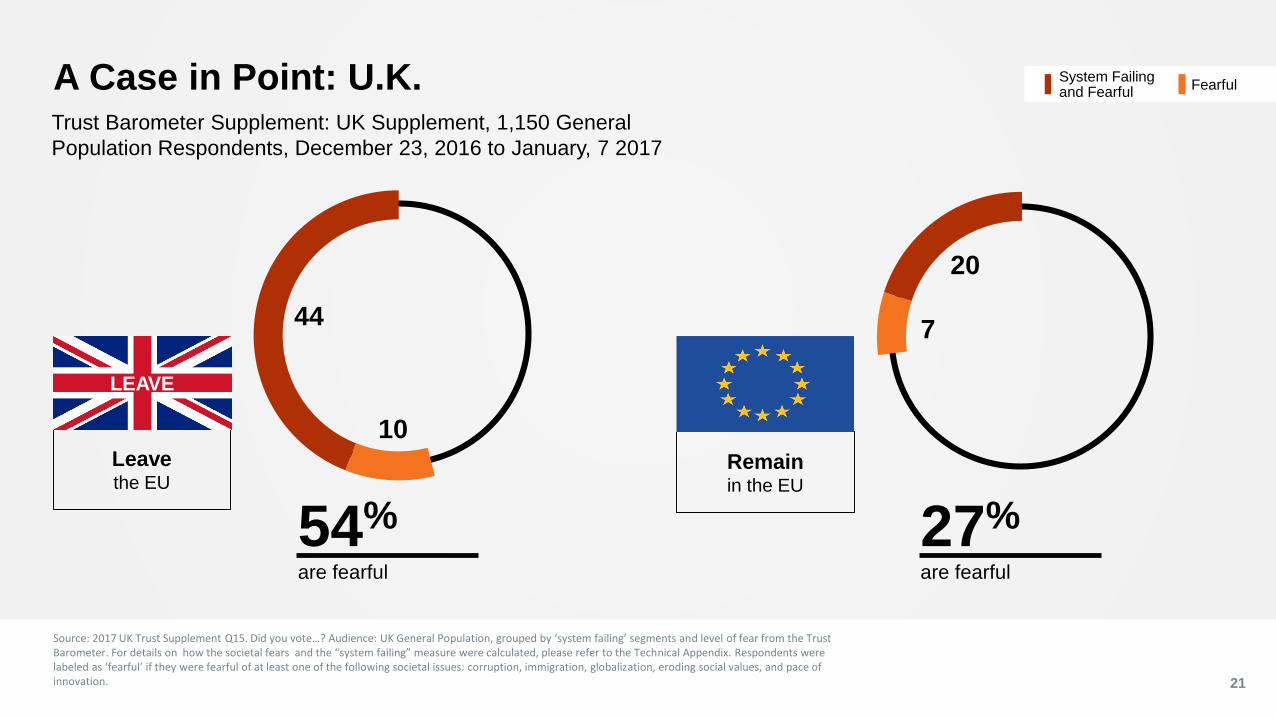
7
20
A Case in Point: U.K.
21
Trust Barometer Supplement: UK Supplement, 1,150 General
Population Respondents, December 23, 2016 to January, 7 2017
Leavethe EU
Remainin the EU
54%
are fearful
27%
are fearful
Source: 2017 UK Trust Supplement Q15. Did you vote…? Audience: UK General Population, grouped by ‘system failing’ segments and level of fear from the Trust Barometer. For details on how the societal fears and the “system failing” measure were calculated, please refer to the Technical Appendix. Respondents were labeled as ‘fearful’ if they were fearful of at least one of the following societal issues: corruption, immigration, globalization, eroding social values, and pace of innovation.
System Failingand Fearful
Fearful
LEAVE
10
44
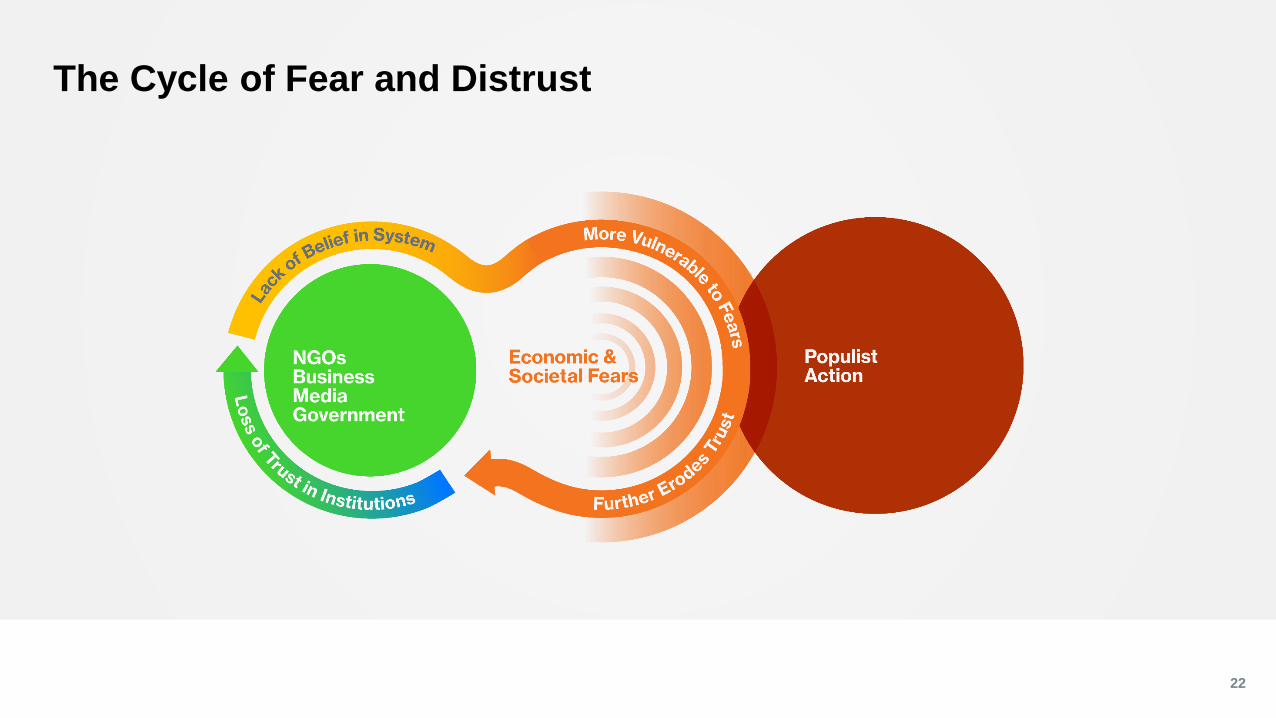
The Cycle of Fear and Distrust
22

Business Must Act
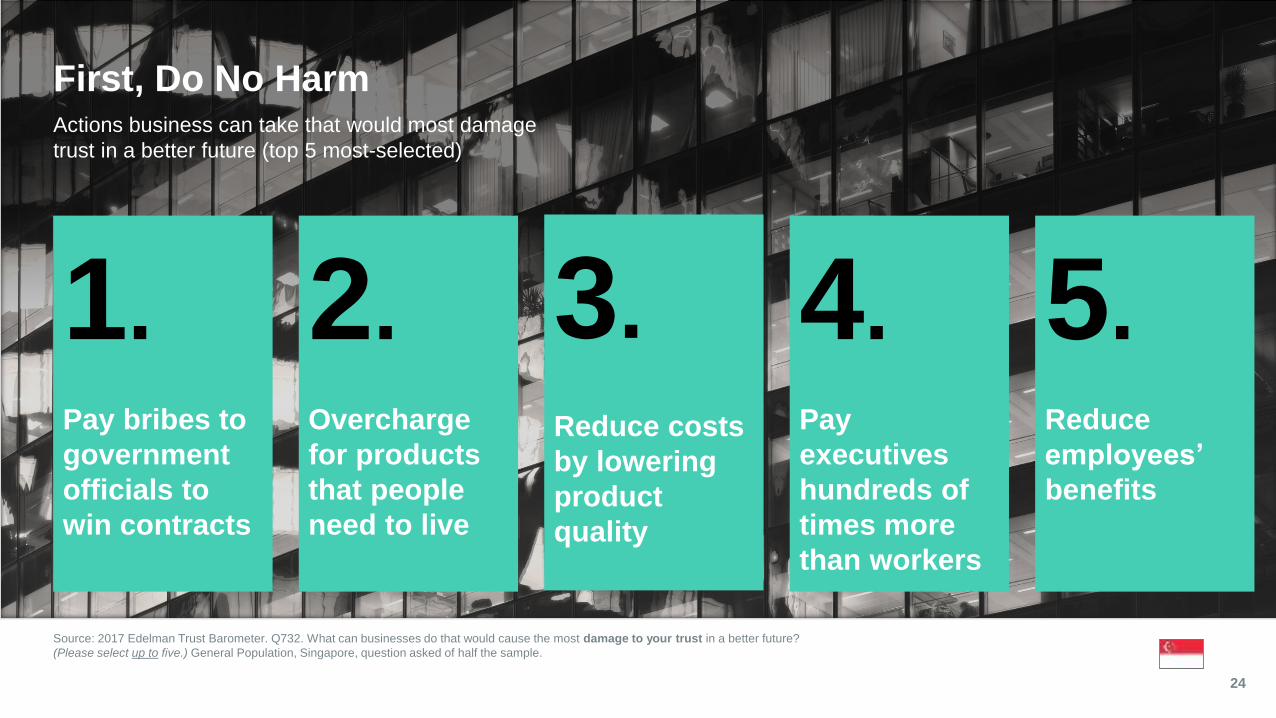
Source: 2017 Edelman Trust Barometer. Q732. What can businesses do that would cause the most damage to your trust in a better future?
(Please select up to five.) General Population, Singapore, question asked of half the sample.
24
First, Do No HarmActions business can take that would most damage
trust in a better future (top 5 most-selected)
1.Pay bribes to
government
officials to
win contracts
2. Overcharge
for products
that people
need to live
3.Reduce costs
by lowering
product
quality
4.Pay
executives
hundreds of
times more
than workers
5. Reduce
employees’
benefits

25
Business Expected
to Lead
Source: 2017 Edelman Trust Barometer. Q249-757. Please indicate how much you agree or disagree with the following statements? (Top 4 Box, Agree). General
Population, Singapore, question asked of half the sample.
.
76% agree
“A company can take specific
actions that both increase
profits and improve the economic
and social conditions in the
community where it operates.”

When the System is Failing,
Companies Must Do More
Source: 2017 Edelman Trust Barometer. Q80-639. How important is each of the following attributes to building your TRUST in a company? Use a 9-point scale
where one means that attribute is “not at all important to building your trust” and nine means it is “extremely important to building your trust” in a company. (Top 2
Box, Importance) Data displayed is mean Top 2 Box rating for the listed items. Items were included if they were considered important by 50% or more of those
who believe the system is failing. General Population, Singapore, and cut by “the system is failing segments”. 26
Percent who rate each attribute as important in building trust in a company
(top 5 most important shown)
46
46
48
49
49
55
58
58
58
58
Listens to customer needs andfeedback
Offers high quality products orservices
Has ethical business practices
Takes responsible actions toaddress an issue or a crisis
Treats employees well
Among those who have
lost faith in the system,
expectations are higher
across the board
On average
+10 pts
higher expectations
System Failing
General Population

Business Plays a Role in Fueling Societal Fears
Source: 2017 Edelman Trust Barometer Q693-762. Some people say they worry about many things while others say they have few concerns. We are interested in
what you worry about. Specifically, how much do you worry about each of the following? Please indicate your answer using a nine point scale where one means “I do
not worry about this at all” and nine means “I am extremely worried about this”. (Top 4 Box, Worried) Q709-718. For each of the statements below, please indicate
how much you agree or disagree. (Top 4 Box, Agree) General Population, Singapore. Q349-671. For the statements below, please think about the pace of
development and change and select the response that most accurately represents your opinion. (Top 4 Box, Too Fast) General Population, Singapore, question asked
of half the sample.
27
Global population worries about
losing their jobs due to:
42% globalization
is taking us in the
wrong direction
70% the pace of change
in business and industry is
too fast
60%
64%
64%
67%
69%
Automation
Jobs moving to cheaper markets
Lack of training/skills
Foreign competitors
Immigrants who work for less

Support for Anti-Business Policies
Source: 2017 Edelman Trust Barometer. Q709-718 For each of the statements below, please indicate how much you agree or disagree. (Top 4 Box, Agree) General
Population, Singapore.
28
Nearly 2in5 agree 71% agree 68% agree
Protectionism Slower Growth
“The government should protect our jobs and local industries, even if it means that our economy grows more slowly.”
“We need to prioritize the interests of our country over those of the rest of the world.”
“We should not enter into free trade agreements because they hurt our country’s workers.”
Protectionism
37
18
23 23 24 25 26 27 27 27 28 28 2831
3436
3840 40
42 43 4448 48
51 5255
61
70
Glo
ba
l2
8-C
oun
try
Ja
pa
n
Fra
nce
Po
land
S. K
ore
a
Ca
na
da
Au
str
alia
Ho
ng
Ko
ng
Ire
land
Ne
the
rla
nd
s
Ge
rma
ny
Ita
ly
U.K
.
Sw
ede
n
Russia
Sin
ga
po
re
U.S
.
Ma
laysia
Sp
ain
Arg
en
tin
a
Turk
ey
Ch
ina
Bra
zil
Co
lom
bia
Indo
ne
sia
S. A
fric
a
UA
E
Me
xic
o
India
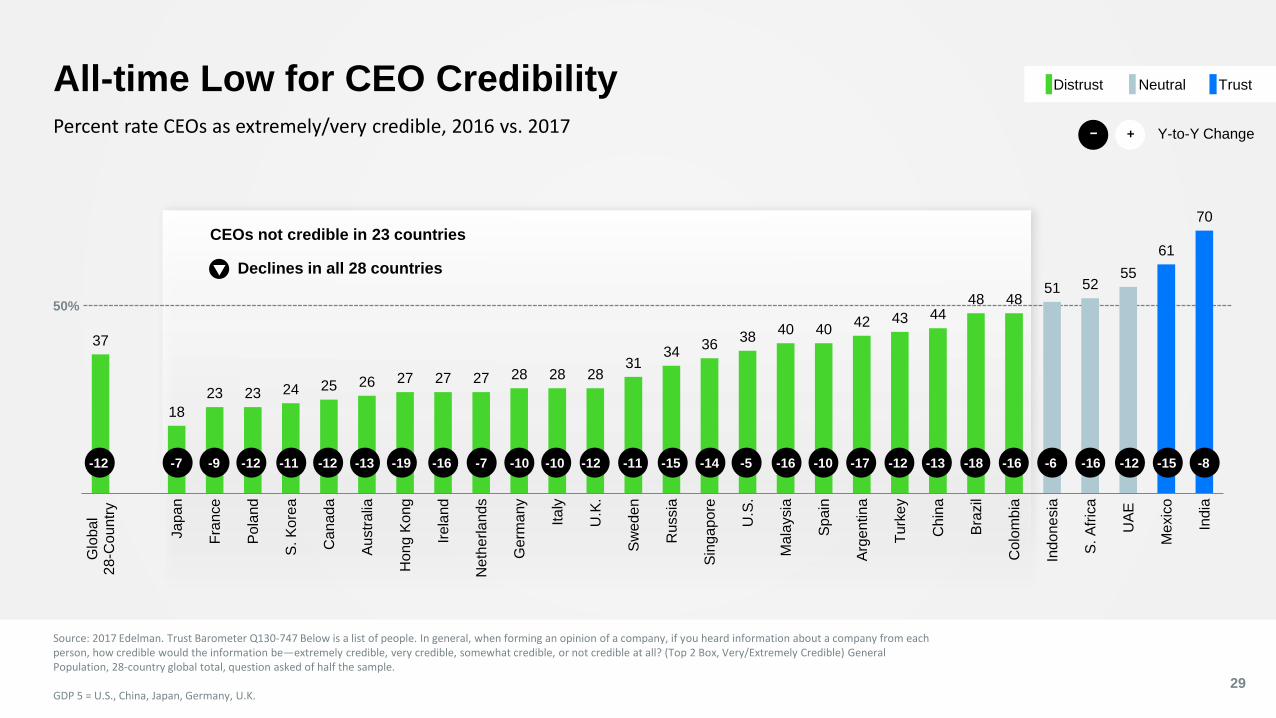
All-time Low for CEO Credibility
Source: 2017 Edelman. Trust Barometer Q130-747 Below is a list of people. In general, when forming an opinion of a company, if you heard information about a company from each person, how credible would the information be—extremely credible, very credible, somewhat credible, or not credible at all? (Top 2 Box, Very/Extremely Credible) General Population, 28-country global total, question asked of half the sample.
GDP 5 = U.S., China, Japan, Germany, U.K. 29
Percent rate CEOs as extremely/very credible, 2016 vs. 2017
CEOs not credible in 23 countries
50%
-12 -15 -8-7 -12-16-6-16-18-13-17-10-16-5-14-10 -10 -12 -11 -15-12 -13 -19 -7-9 -12 -11-12 -16
Declines in all 28 countries
Y-to-Y Change+−
NeutralDistrust Trust
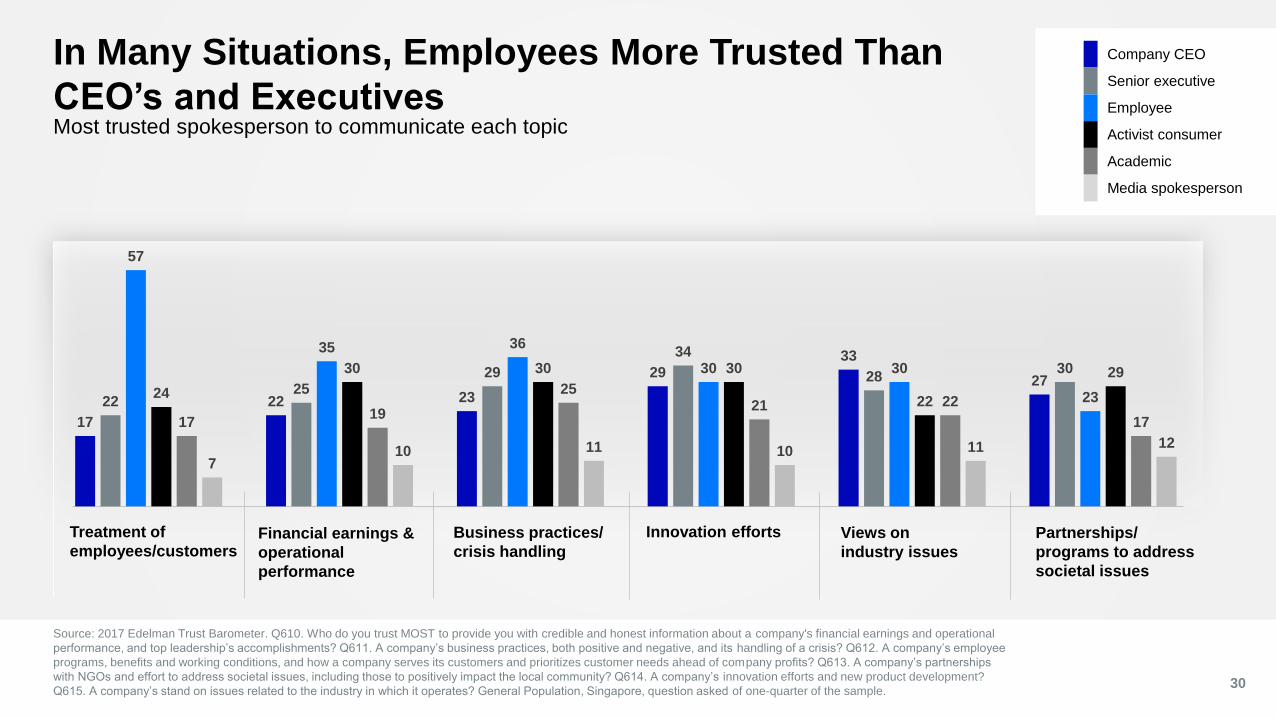
Partnerships/
programs to address
societal issues
Business practices/
crisis handlingFinancial earnings &
operational
performance
In Many Situations, Employees More Trusted Than
CEO’s and Executives
Source: 2017 Edelman Trust Barometer. Q610. Who do you trust MOST to provide you with credible and honest information about a company's financial earnings and operational
performance, and top leadership’s accomplishments? Q611. A company’s business practices, both positive and negative, and its handling of a crisis? Q612. A company’s employee
programs, benefits and working conditions, and how a company serves its customers and prioritizes customer needs ahead of company profits? Q613. A company’s partnerships
with NGOs and effort to address societal issues, including those to positively impact the local community? Q614. A company’s innovation efforts and new product development?
Q615. A company’s stand on issues related to the industry in which it operates? General Population, Singapore, question asked of one-quarter of the sample.30
Most trusted spokesperson to communicate each topic
Innovation effortsTreatment of
employees/customersViews on
industry issues
Company CEO
Senior executive
Employee
Activist consumer
Academic
Media spokesperson
17
22 23
2933
27
2225
29
34
2830
57
35 36
30 30
2324
30 30 30
22
29
1719
2521 22
17
710 11 10 11 12
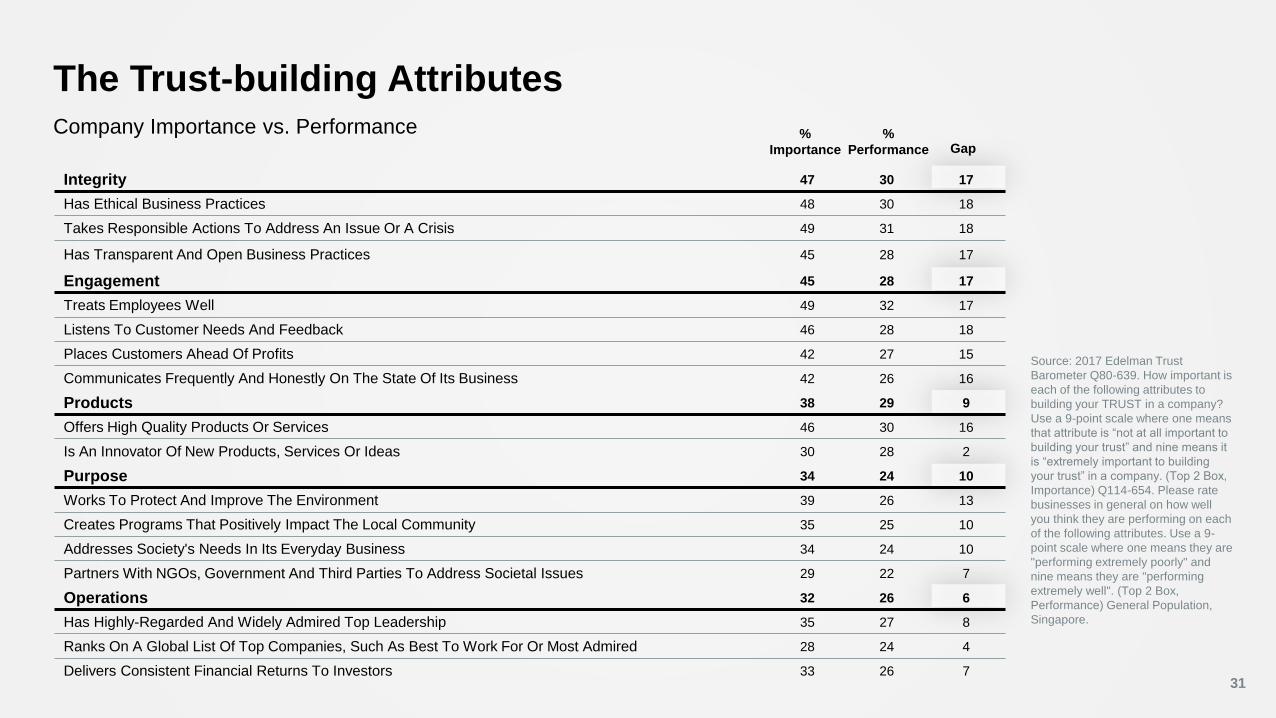
Integrity 47 30 17
Has Ethical Business Practices 48 30 18
Takes Responsible Actions To Address An Issue Or A Crisis 49 31 18
Has Transparent And Open Business Practices 45 28 17
Engagement 45 28 17
Treats Employees Well 49 32 17
Listens To Customer Needs And Feedback 46 28 18
Places Customers Ahead Of Profits 42 27 15
Communicates Frequently And Honestly On The State Of Its Business 42 26 16
Products 38 29 9
Offers High Quality Products Or Services 46 30 16
Is An Innovator Of New Products, Services Or Ideas 30 28 2
Purpose 34 24 10
Works To Protect And Improve The Environment 39 26 13
Creates Programs That Positively Impact The Local Community 35 25 10
Addresses Society's Needs In Its Everyday Business 34 24 10
Partners With NGOs, Government And Third Parties To Address Societal Issues 29 22 7
Operations 32 26 6
Has Highly-Regarded And Widely Admired Top Leadership 35 27 8
Ranks On A Global List Of Top Companies, Such As Best To Work For Or Most Admired 28 24 4
Delivers Consistent Financial Returns To Investors 33 26 7
The Trust-building AttributesCompany Importance vs. Performance %
Performance
%
Importance Gap
31
Source: 2017 Edelman Trust
Barometer Q80-639. How important is
each of the following attributes to
building your TRUST in a company?
Use a 9-point scale where one means
that attribute is “not at all important to
building your trust” and nine means it
is “extremely important to building
your trust” in a company. (Top 2 Box,
Importance) Q114-654. Please rate
businesses in general on how well
you think they are performing on each
of the following attributes. Use a 9-
point scale where one means they are
"performing extremely poorly" and
nine means they are "performing
extremely well". (Top 2 Box,
Performance) General Population,
Singapore.

Additional Dimensions that Inform Business TrustCompany Importance vs. Performance %
Performance
%
Importance Gap
32
Source: 2017 Edelman Trust
Barometer Q80-639. How important is
each of the following attributes to
building your TRUST in a company?
Use a 9-point scale where one means
that attribute is “not at all important to
building your trust” and nine means it
is “extremely important to building
your trust” in a company. (Top 2 Box,
Importance) Q114-654. Please rate
businesses in general on how well
you think they are performing on each
of the following attributes. Use a 9-
point scale where one means they are
"performing extremely poorly" and
nine means they are "performing
extremely well". (Top 2 Box,
Performance) General Population,
Singapore.
Employee Empowerment 29 22 7
Empowers its employees to make decisions 31 24 7
Regular employees have a lot of influence in how the company is run 26 19 7
Supports employees joining worker’s/trade unions or other organizations that represent their interests 31 22 9
Diversity 29 22 7
Has a lot of ethnic diversity within its management team 30 22 8
Has a lot of gender diversity within its management team 27 21 6
Has a lot of diversity when it comes to attitudes, values and points of view within its management team 32 23 9
Citizenship 33 25 8
It creates many new jobs 31 26 5
The profits it makes in this country stay in this country 28 22 6
Pays its fair share of taxes 40 28 12
Leadership 32 23 9
The CEO gets personally involved in societal issues 33 24 9
The CEO is compensated based on the ability to produce sustainable, long-term growth 35 25 10
I know who the CEO is and what he or she stands for 28 20 8
Relationship Building 33 23 10
Invites the public to contribute to and help shape their products, services or policies 32 24 8
Has a public image or heritage that I can appreciate and relate to 33 23 10
Actively encourages and facilitates conversations and interactions with the public 33 22 11

The EchoChamber
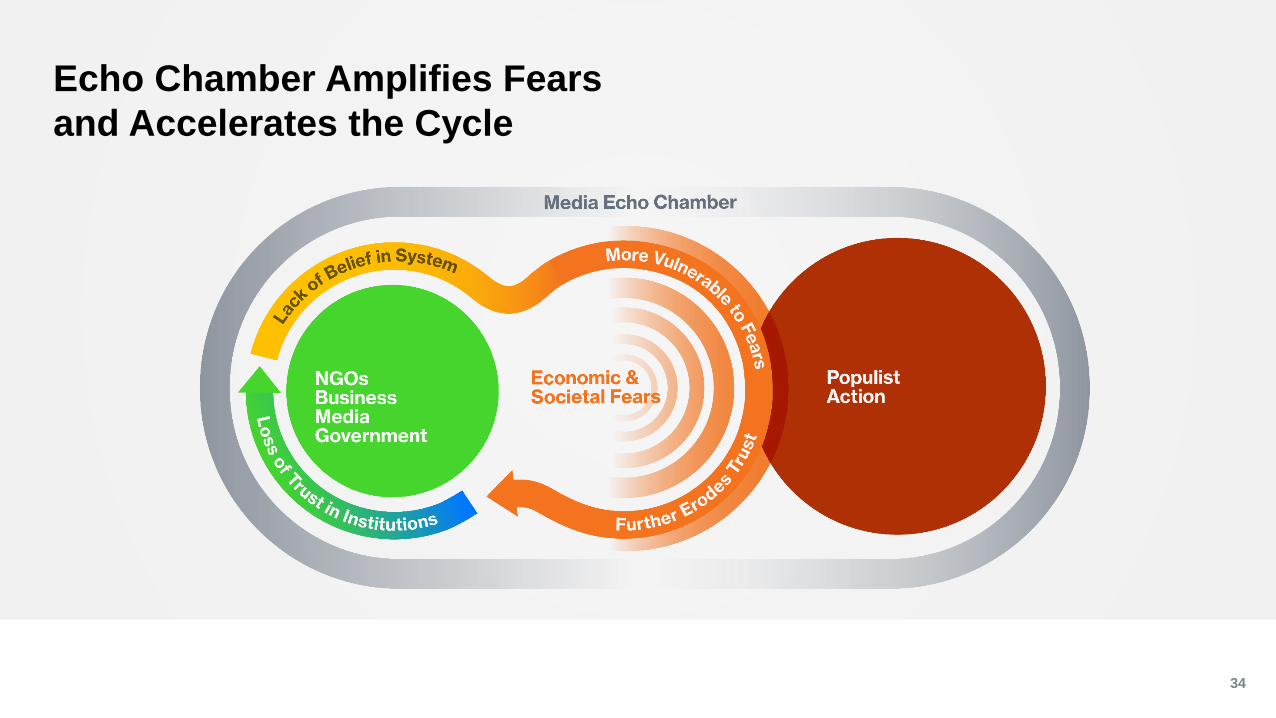
Echo Chamber Amplifies Fears
and Accelerates the Cycle
34
35
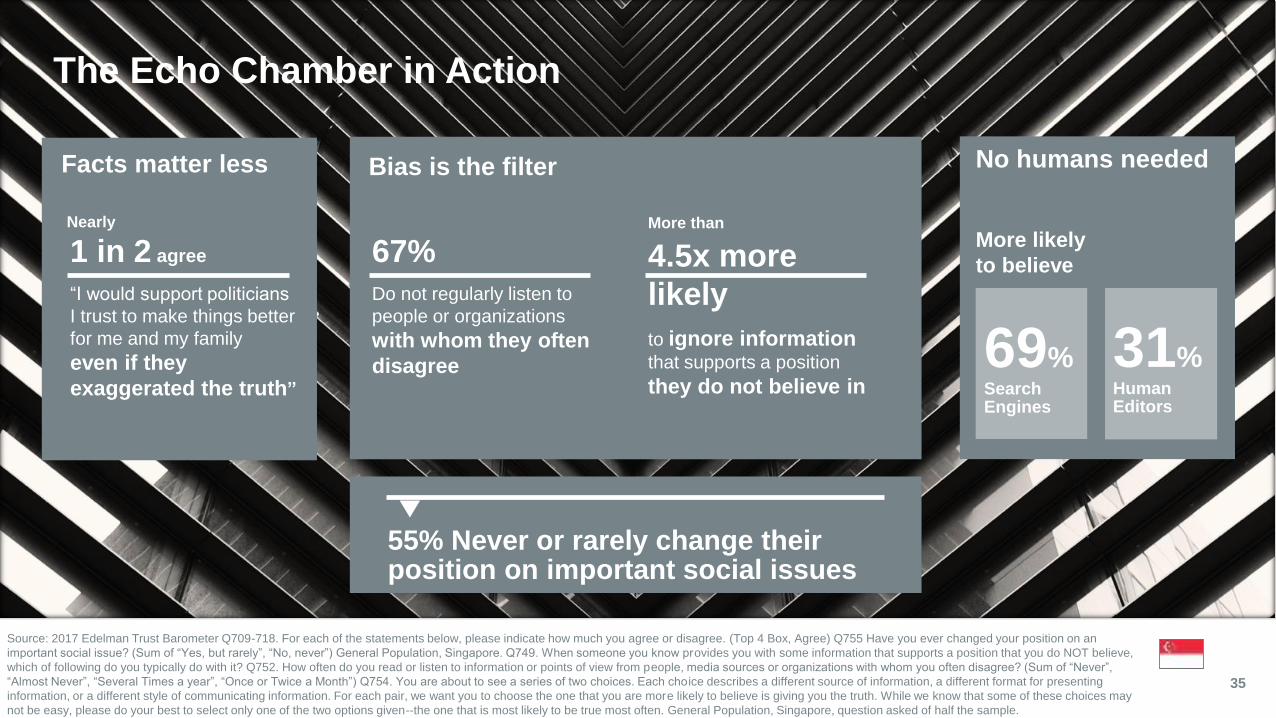
The Echo Chamber in Action
Facts matter less Bias is the filter No humans needed
1 in 2 agree
“I would support politicians
I trust to make things better
for me and my family
even if they
exaggerated the truth”
67%
Do not regularly listen to
people or organizations
with whom they often
disagree
More than
4.5x more
likely
to ignore information that supports a position
they do not believe in
More likely
to believe
69%Search Engines
31%Human Editors
53%55% Never or rarely change their position on important social issues
Source: 2017 Edelman Trust Barometer Q709-718. For each of the statements below, please indicate how much you agree or disagree. (Top 4 Box, Agree) Q755 Have you ever changed your position on an
important social issue? (Sum of “Yes, but rarely”, “No, never”) General Population, Singapore. Q749. When someone you know provides you with some information that supports a position that you do NOT believe,
which of following do you typically do with it? Q752. How often do you read or listen to information or points of view from people, media sources or organizations with whom you often disagree? (Sum of “Never”,
“Almost Never”, “Several Times a year”, “Once or Twice a Month”) Q754. You are about to see a series of two choices. Each cho ice describes a different source of information, a different format for presenting
information, or a different style of communicating information. For each pair, we want you to choose the one that you are more likely to believe is giving you the truth. While we know that some of these choices may
not be easy, please do your best to select only one of the two options given--the one that is most likely to be true most often. General Population, Singapore, question asked of half the sample.
Nearly
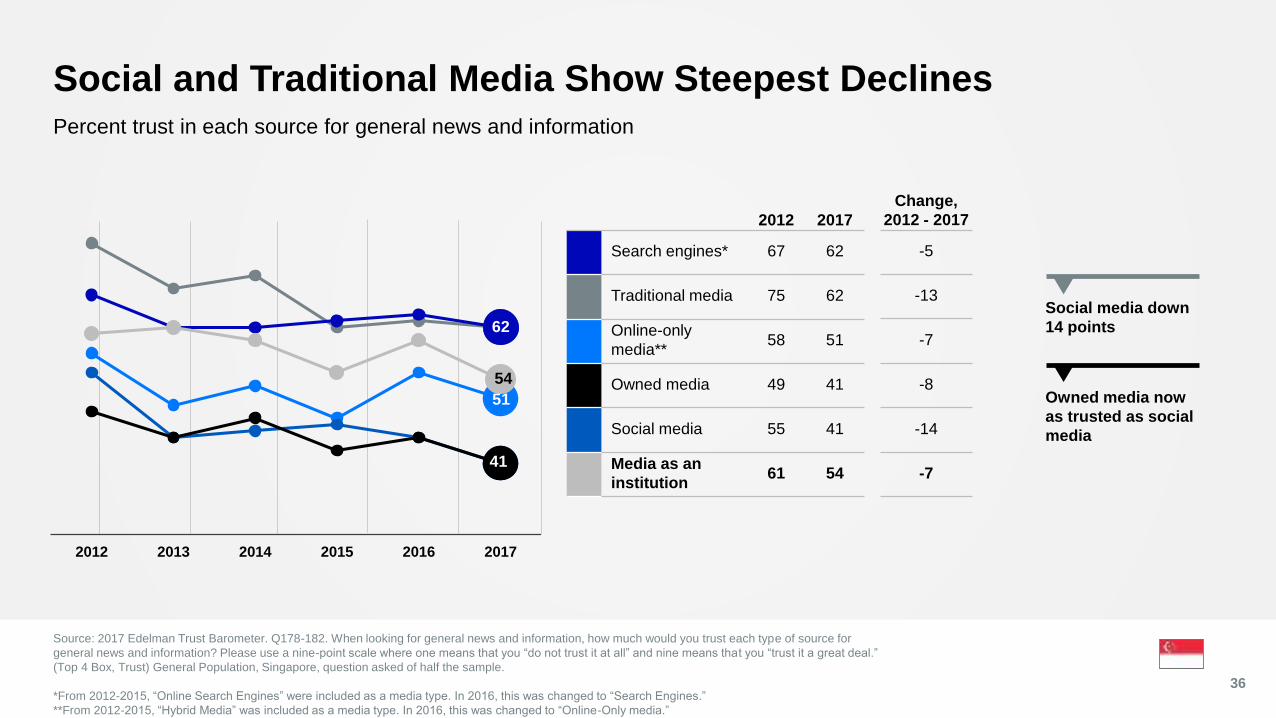
2012 2017
Search engines* 67 62
Traditional media 75 62
Online-only
media**58 51
Owned media 49 41
Social media 55 41
Media as an
institution61 54
Social and Traditional Media Show Steepest Declines
Source: 2017 Edelman Trust Barometer. Q178-182. When looking for general news and information, how much would you trust each type of source for
general news and information? Please use a nine-point scale where one means that you “do not trust it at all” and nine means that you “trust it a great deal.”
(Top 4 Box, Trust) General Population, Singapore, question asked of half the sample.
*From 2012-2015, “Online Search Engines” were included as a media type. In 2016, this was changed to “Search Engines.”
**From 2012-2015, “Hybrid Media” was included as a media type. In 2016, this was changed to “Online-Only media.”
Percent trust in each source for general news and information
36
Change,
2012 - 2017
-5
-13
-7
-8
-14
-7
Owned media now
as trusted as social
media
Social media down
14 points62
51
41
54
2012 2013 2014 2015 2016 2017
Source: 2017 Edelman Trust Barometer Q754. You are about to see a series of two choices. Each choice describes a different source of information, a different format
for presenting information, or a different style of communicating information. For each pair, we want you to choose the one that you are more likely to believe is giving
you the truth. While we know that some of these choices may not be easy, please do your best to select only one of the two options given--the one that is most likely to
be true most often. General Population, Singapore, choices shown to half the sample. 37
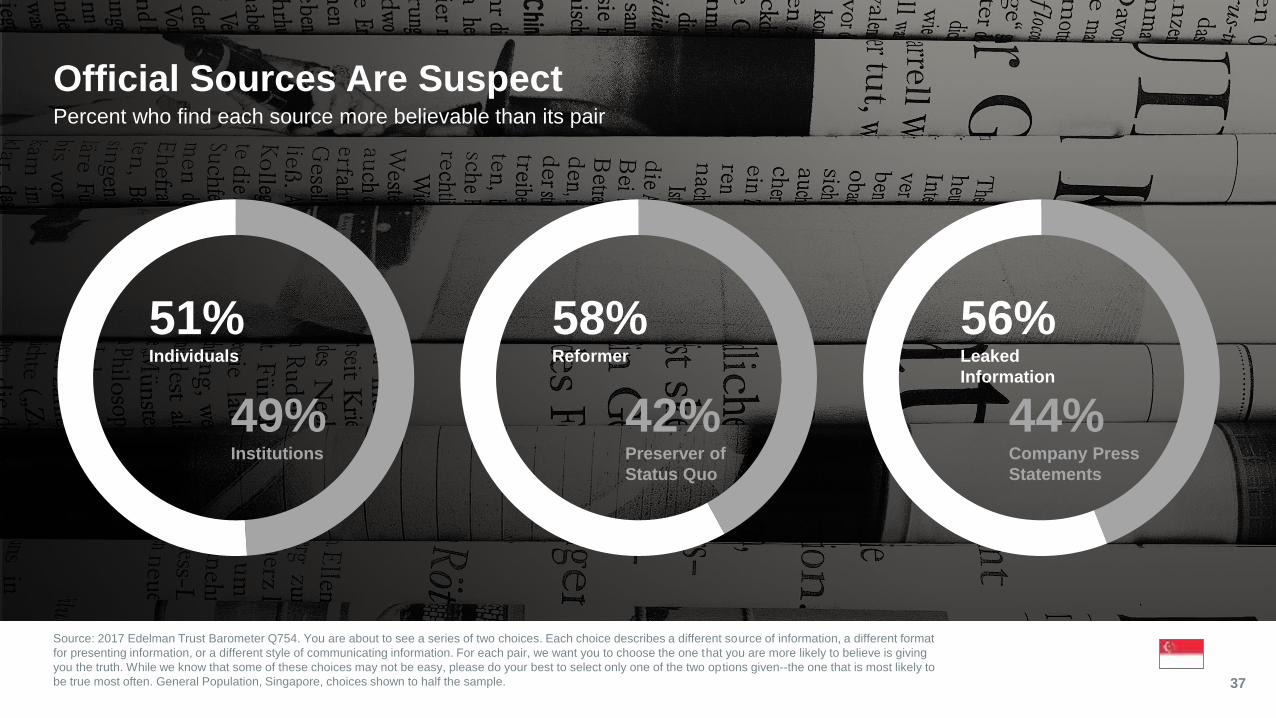
Official Sources Are SuspectPercent who find each source more believable than its pair
51% Individuals
49% Institutions
58% Reformer
42% Preserver of
Status Quo
56% Leaked
Information
44% Company Press
Statements
1
55 5551
45 43 43 4136
33
Acad
em
ice
xpe
rt
Te
chn
ical
expe
rt
A p
ers
on lik
eyo
urs
elf
Gove
rnm
en
to
ffic
ial/
reg
ula
tor
Em
plo
ye
e
NG
Ore
pre
se
nta
tive
Fin
ancia
lin
du
str
ya
na
lyst
CE
O
Boa
rd o
fd
ire
cto
rs
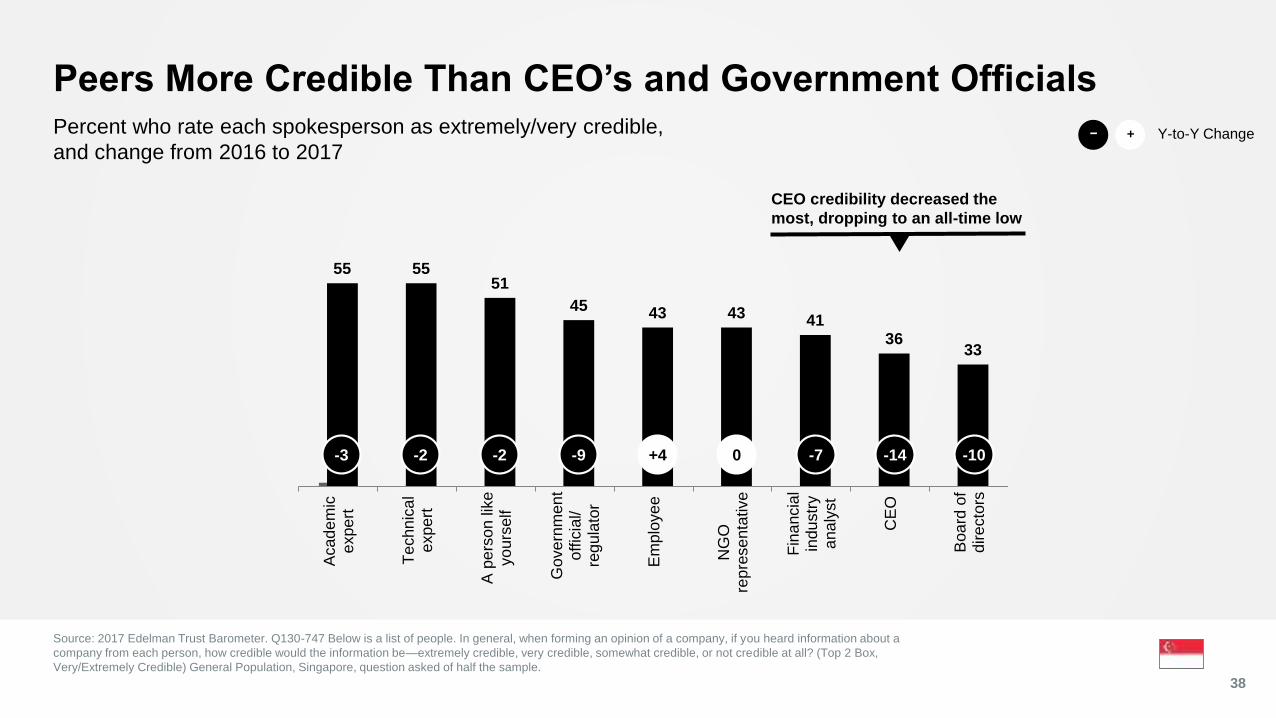
Peers More Credible Than CEO’s and Government Officials
Source: 2017 Edelman Trust Barometer. Q130-747 Below is a list of people. In general, when forming an opinion of a company, if you heard information about a
company from each person, how credible would the information be—extremely credible, very credible, somewhat credible, or not credible at all? (Top 2 Box,
Very/Extremely Credible) General Population, Singapore, question asked of half the sample.
38
Percent who rate each spokesperson as extremely/very credible,
and change from 2016 to 2017
CEO credibility decreased the
most, dropping to an all-time low
-3 -2 -2 -9 +4 0 -7 -14 -10
Y-to-Y Change+−
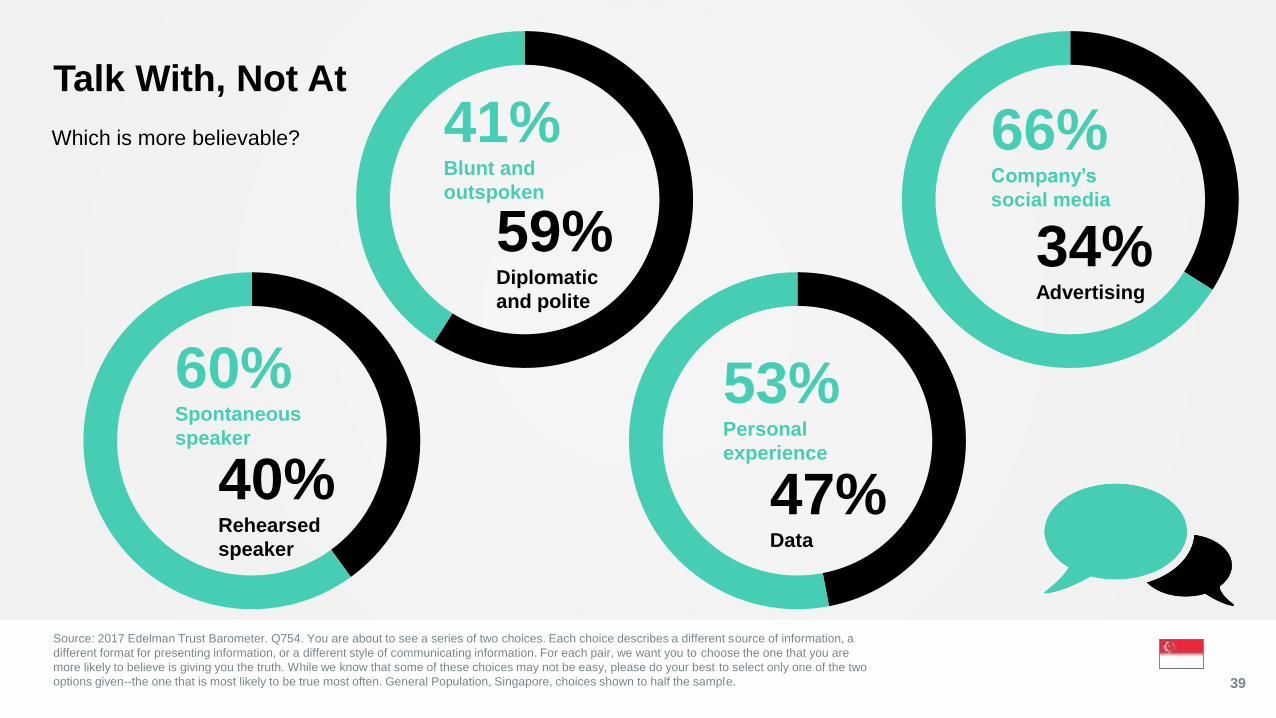
Which is more believable?
Talk With, Not At
39
Source: 2017 Edelman Trust Barometer. Q754. You are about to see a series of two choices. Each choice describes a different source of information, a
different format for presenting information, or a different style of communicating information. For each pair, we want you to choose the one that you are
more likely to believe is giving you the truth. While we know that some of these choices may not be easy, please do your best to select only one of the two
options given--the one that is most likely to be true most often. General Population, Singapore, choices shown to half the sample.
53% Personal
experience
47% Data
60% Spontaneous
speaker
40% Rehearsed
speaker
41% Blunt and
outspoken
59% Diplomatic
and polite
66% Company’s
social media
34% Advertising
With the People,Not For the People
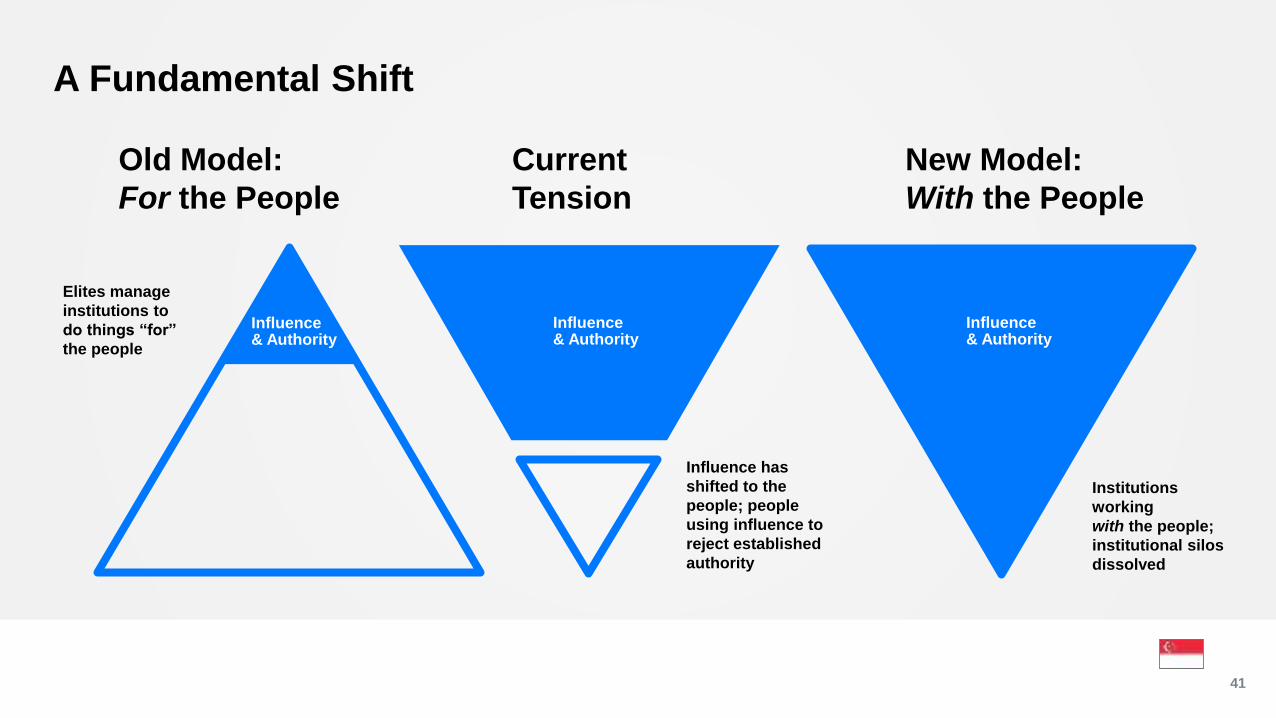
A Fundamental Shift
41
Current
Tension
Old Model:
For the People
New Model:
With the People
Elites manage
institutions to
do things “for”
the people
Influence has
shifted to the
people; people
using influence to
reject established
authority
Institutions
working
with the people;
institutional silos
dissolved
Influence & Authority
Influence & Authority
Influence & Authority
Thank You
1