2017 Economic and Workforce Development Program...
120
Economic and Workforce Development Program ANNUAL REPORT 2017 California Community Colleges Chancellor’s Office | Eloy Ortiz Oakley, Chancellor Workforce and Economic Development Division | Van Ton-Quinlivan, Vice Chancellor
Transcript of 2017 Economic and Workforce Development Program...

Economic and Workforce Development Program
ANNUAL REPORT
2017California Community Colleges Chancellor’s Office | Eloy Ortiz Oakley, Chancellor
Workforce and Economic Development Division | Van Ton-Quinlivan, Vice Chancellor

Economic and Workforce Development Program Annual Report // Page 2
Front Cover Photo Credits: (left
to right, top to bottom) De Anza
College, American River College,
West Hills College Coalinga, Santa
Rosa Junior College, San Diego
Continuing Education, Crafton Hills
College, Diablo Valley College, San
Diego Mesa College

Economic and Workforce Development Program Annual Report // Page 3

Economic and Workforce Development Program Annual Report // Page 4
MESSAGE FROM OUR CHANCELLOR

March 1, 2017
The Honorable Edmund G. Brown, Jr. Governor of California State Capitol Sacramento, CA 95814
Dear Governor Brown:
I present to you the California Community Colleges Economic and Workforce Development Program Annual Report for 2015-16.
The Economic and Workforce Development program is an incubator of educational and workforce innovation for the Golden State. Specifically, it invests in the development, execution and distribution of world-class skills training to Californians seeking to be work-ready employees in the California businesses that need them to thrive. The program is a critical conduit that combines the unique assets of local academia, industry and other stakeholders to create opportunities and enable social mobility for Californians. Moreover, Economic and Workforce Development funds, when braided with funds from other sources like the federal Carl D. Perkins Career and Technical Education Act and the state Career Technical Education Pathways Act (SB1070, 2012), can empower tremendous growth for the state.
This report highlights our efforts in building a strong workforce through the state’s seven macroeconomic regions and 10 targeted economic sectors and industries.
If you have any questions regarding this annual report, please contact Workforce and Economic Development Division Vice Chancellor Van Ton-Quinlivan at 916-327-5492 or [email protected].
Thank you for your interest in the California Community Colleges Economic and Workforce Development Program.
Sincerely,
Eloy Ortiz Oakley Chancellor
California Community Colleges
ChanCellor’s offiCe State of California
1102 Q Street, Suite 4400 | Sacramento, California 95811-6539t: 916.322.4005 | f: 916.322.4783
CaliforniaCommunityColleges.cccco.edu
eloy ortiz oakley
Chancellor

Economic and Workforce Development Program Annual Report // Page 6
EXECUTIVE SUMMARY
Economic and Workforce Development Program Annual Report // Page 7
EXECUTIVE SUMMARY
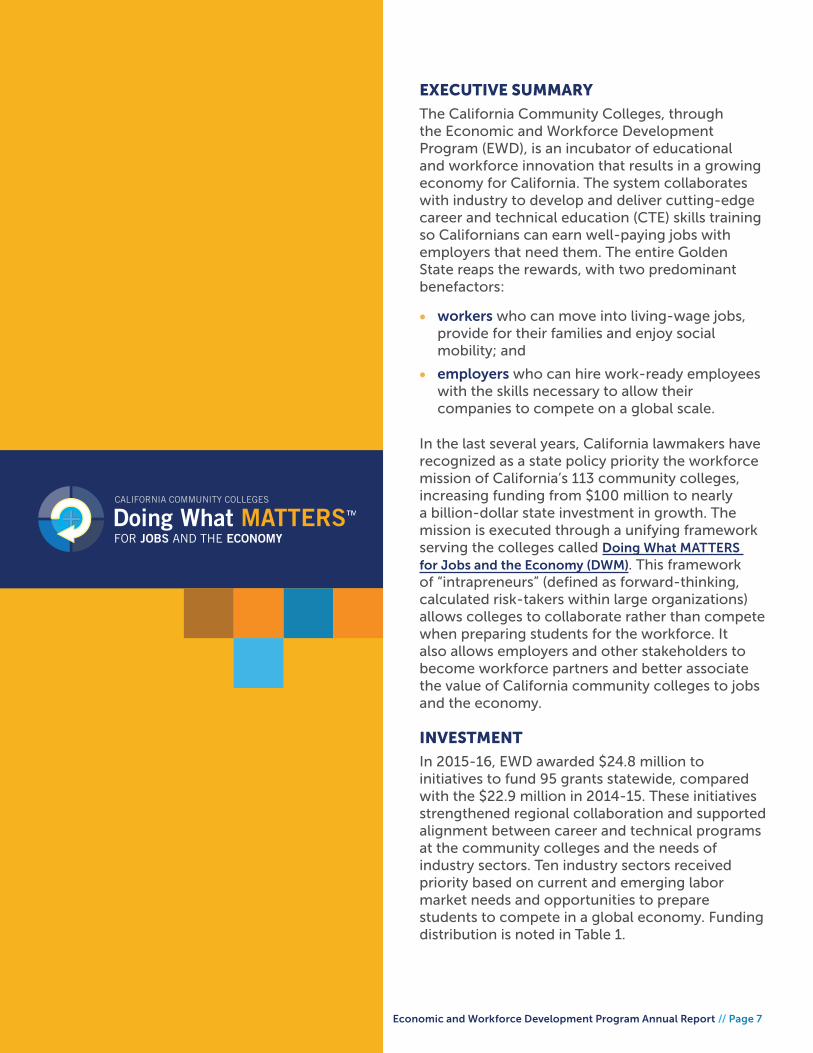
The California Community Colleges, through the Economic and Workforce Development Program (EWD), is an incubator of educational and workforce innovation that results in a growing economy for California. The system collaborates with industry to develop and deliver cutting-edge career and technical education (CTE) skills training so Californians can earn well-paying jobs with employers that need them. The entire Golden State reaps the rewards, with two predominant benefactors:
• workers who can move into living-wage jobs, provide for their families and enjoy social mobility; and
• employers who can hire work-ready employees with the skills necessary to allow their companies to compete on a global scale.
In the last several years, California lawmakers have recognized as a state policy priority the workforce mission of California’s 113 community colleges, increasing funding from $100 million to nearly a billion-dollar state investment in growth. The mission is executed through a unifying framework serving the colleges called Doing What MATTERS for Jobs and the Economy (DWM). This framework of “intrapreneurs” (defined as forward-thinking, calculated risk-takers within large organizations) allows colleges to collaborate rather than compete when preparing students for the workforce. It also allows employers and other stakeholders to become workforce partners and better associate the value of California community colleges to jobs and the economy.
INVESTMENT
In 2015-16, EWD awarded $24.8 million to initiatives to fund 95 grants statewide, compared with the $22.9 million in 2014-15. These initiatives strengthened regional collaboration and supported alignment between career and technical programs at the community colleges and the needs of industry sectors. Ten industry sectors received priority based on current and emerging labor market needs and opportunities to prepare students to compete in a global economy. Funding distribution is noted in Table 1.

Economic and Workforce Development Program Annual Report // Page 8
OUTCOMES
The DWM strategy of increasing outreach to employers within regions and priority industry sectors has contributed to continuing momentum in EWD’s program, student and employer outcomes. Likewise, EWD investments, when braided with funds from other sources like the federal Carl D. Perkins Career and Technical Education Act and the state Career Technical Education Pathways Act (SB1070, 2012), have yielded impressive results, including:
• 61,056 students served
• 19,624 employees served
• 55,521 total people trained (as of December 2016)
• 3,114 students enrolled in work-based learning (i.e., internships and apprenticeships)
• 19,233 completions of workshops and training
• 1,433 students placed in jobs
• 9,414 employees retaining jobs
• 12,159 businesses served
• 1,584 people hired by businesses served by EWD
• 149 new products and services created by businesses across California with the support of EWD services
Please refer to Exhibit 7 for more information.
STRONG WORKFORCE PROGRAM
An addition to the EWD portfolio is the Strong Workforce Program, a bold step to create one million more middle-skilled workers. At the recommendation of the California Community Colleges Board of Governors, the governor and Legislature in June 2016 approved the Strong Workforce Program, adding a new annual recurring investment of $200 million to spur career technical education (CTE) in California’s community colleges.
Grouped into seven areas targeting student success, career pathways, workforce data and outcomes, curriculum, CTE faculty, regional coordination and funding, this leading-edge state economic development program is driven
by “more and better” CTE. The “more” pertains to increasing the number of students enrolled in programs leading to high-demand, high-wage jobs. The “better” aligns with strategies to improve program quality, as evidenced by students completing or transferring programs, becoming employed or improving their earnings.
WIOA STATE PLAN
To implement changes in federal law, the California Workforce Development Board (CWDB)—the state’s lead workforce development policy agency—developed a Workforce Innovation and Opportunity Act (WIOA) State Plan to operationalize recommendations from the WIOA Implementation Work Group, co-chaired by California Community Colleges Vice Chancellor Van Ton-Quinlivan and CWDB Executive Director Tim Rainey. Based upon this group’s efforts, the State Plan provides strategies to develop multi-agency metrics and the creation of a cross-agency data system that fosters regional collaboration and alignment of workforce and education systems. Regions drive most of this work, but the state also has key roles to play. These include working with the regions to forge a shared vision, as well as coordinating the activities of state institutions to support that vision and removing barriers to implementation. Elements within the Strong Workforce Program build from this existing body of work.
In conclusion, EWD’s role as an incubator of educational and workforce innovation, with its strategic initiatives and partnerships, is yielding measurable benefits to students, employers and California’s economy.
Photo Credit: Norco College
Economic and Workforce Development Program Annual Report // Page 9
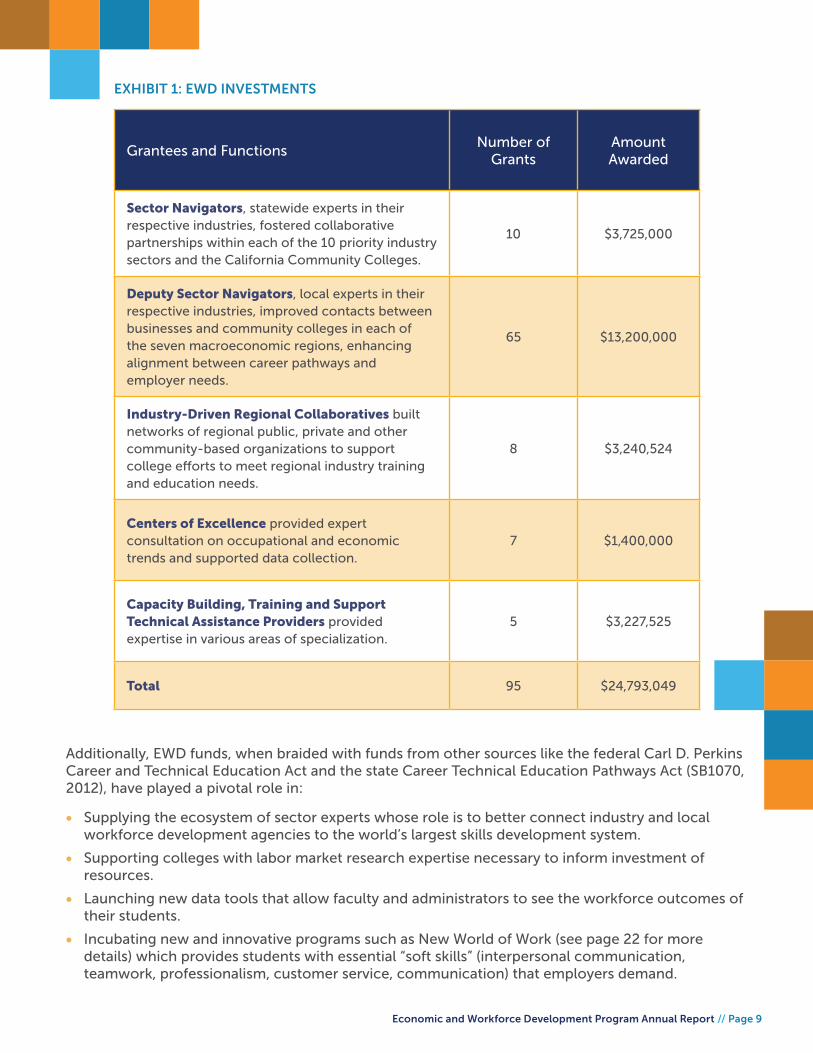
Grantees and FunctionsNumber of
GrantsAmount Awarded
Sector Navigators, statewide experts in their respective industries, fostered collaborative partnerships within each of the 10 priority industry sectors and the California Community Colleges.
10 $3,725,000
Deputy Sector Navigators, local experts in their respective industries, improved contacts between businesses and community colleges in each of the seven macroeconomic regions, enhancing alignment between career pathways and employer needs.
65 $13,200,000
Industry-Driven Regional Collaboratives built networks of regional public, private and other community-based organizations to support college efforts to meet regional industry training and education needs.
8 $3,240,524
Centers of Excellence provided expert consultation on occupational and economic trends and supported data collection.
7 $1,400,000
Capacity Building, Training and Support Technical Assistance Providers provided expertise in various areas of specialization.
5 $3,227,525
Total 95 $24,793,049
EXHIBIT 1: EWD INVESTMENTS
Additionally, EWD funds, when braided with funds from other sources like the federal Carl D. Perkins Career and Technical Education Act and the state Career Technical Education Pathways Act (SB1070, 2012), have played a pivotal role in:
• Supplying the ecosystem of sector experts whose role is to better connect industry and local workforce development agencies to the world’s largest skills development system.
• Supporting colleges with labor market research expertise necessary to inform investment of resources.
• Launching new data tools that allow faculty and administrators to see the workforce outcomes of their students.
• Incubating new and innovative programs such as New World of Work (see page 22 for more details) which provides students with essential “soft skills” (interpersonal communication, teamwork, professionalism, customer service, communication) that employers demand.

Economic and Workforce Development Program Annual Report // Page 10
TABLE OF CONTENTS

Economic and Workforce Development Program Annual Report // Page 11
Chancellor’s Letter ................................................. 4
Executive Summary ................................................ 6
Table of Contents ................................................. 10
Background and Structure .................................. 12
Incubator of Educational and Workforce Innovation ..................................20
Opportunities, Investments and Results ..........26
Conclusion .............................................................34
Methodology .........................................................36
Appendices ............................................................38
Appendix A .............................................................40
Appendix B ...........................................................100
Appendix C ........................................................... 114

Economic and Workforce Development Program Annual Report // Page 12
BACKGROUND AND STRUCTURE
Economic and Workforce Development Program Annual Report // Page 13
ECONOMIC AND WORKFORCE DEVELOPMENT PROGRAMAN INCUBATOR OF EDUCATIONAL AND WORKFORCE INNOVATION
The California Community Colleges’ Economic and Workforce Development Program (EWD) advances the economic growth and global competitiveness of California and its regional economies through education, training and other services, thereby contributing to continuous workforce improvement, technology deployment and business development.
To achieve these goals, EWD provides grant funding to help community colleges become more responsive to the needs of employers, employees and students. Grantees funded by EWD:
• assist community colleges in collaborating with other public institutions in an effort to align resources, foster cooperation across workforce education and service delivery systems, and build well-articulated career pathways; and
• develop strong partnerships with the private sector, ensuring industry involvement in community college programs.
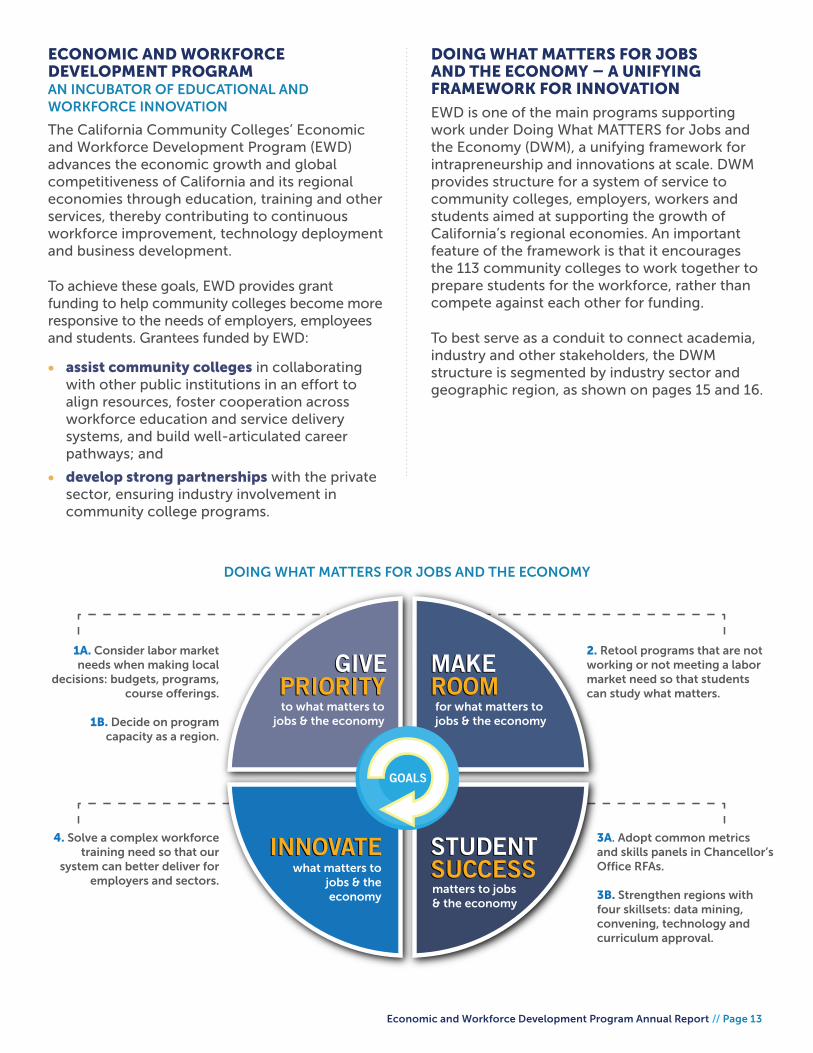
DOING WHAT MATTERS FOR JOBS AND THE ECONOMY – A UNIFYING FRAMEWORK FOR INNOVATION
EWD is one of the main programs supporting work under Doing What MATTERS for Jobs and the Economy (DWM), a unifying framework for intrapreneurship and innovations at scale. DWM provides structure for a system of service to community colleges, employers, workers and students aimed at supporting the growth of California’s regional economies. An important feature of the framework is that it encourages the 113 community colleges to work together to prepare students for the workforce, rather than compete against each other for funding.
To best serve as a conduit to connect academia, industry and other stakeholders, the DWM structure is segmented by industry sector and geographic region, as shown on pages 15 and 16.
PRIORITYGIVE
ROOMMAKE
GOALS
INNOVATESUCCESSSTUDENT
PRIORITYGIVE
ROOMMAKE
INNOVATESUCCESSSTUDENT
to what matters to jobs & the economy
for what matters to jobs & the economy
2. Retool programs that are not working or not meeting a labor market need so that students can study what matters.
1A. Consider labor market needs when making local
decisions: budgets, programs, course offerings.
1B. Decide on program capacity as a region.
3A. Adopt common metrics and skills panels in Chancellor’s Office RFAs.
3B. Strengthen regions with four skillsets: data mining, convening, technology and curriculum approval.
4. Solve a complex workforce training need so that our
system can better deliver for employers and sectors.
what matters to jobs & the economy
matters to jobs & the economy
DOING WHAT MATTERS FOR JOBS AND THE ECONOMYDOING WHAT MATTERS FOR JOBS AND THE ECONOMY

Economic and Workforce Development Program Annual Report // Page 14
ECONOMIC AND WORKFORCE DEVELOPMENT PROGRAM The intent of the program is to:
• Maintain its core mission to advance California’s economic growth and global competitiveness.
• Strengthen linkages between EWD programs and other state workforce and economic development systems and programs in order to train and educate a highly skilled workforce for the mutual benefit of industry and students.
• Support the regional alignment between the career technical education programs of the community college system and the needs of California’s competitive and emerging industry sectors.
• Ensure that EWD programs are being developed, tracked and evaluated based on data-driven analyses and common metrics.
Economic and Workforce Development Program Annual Report // Page 15
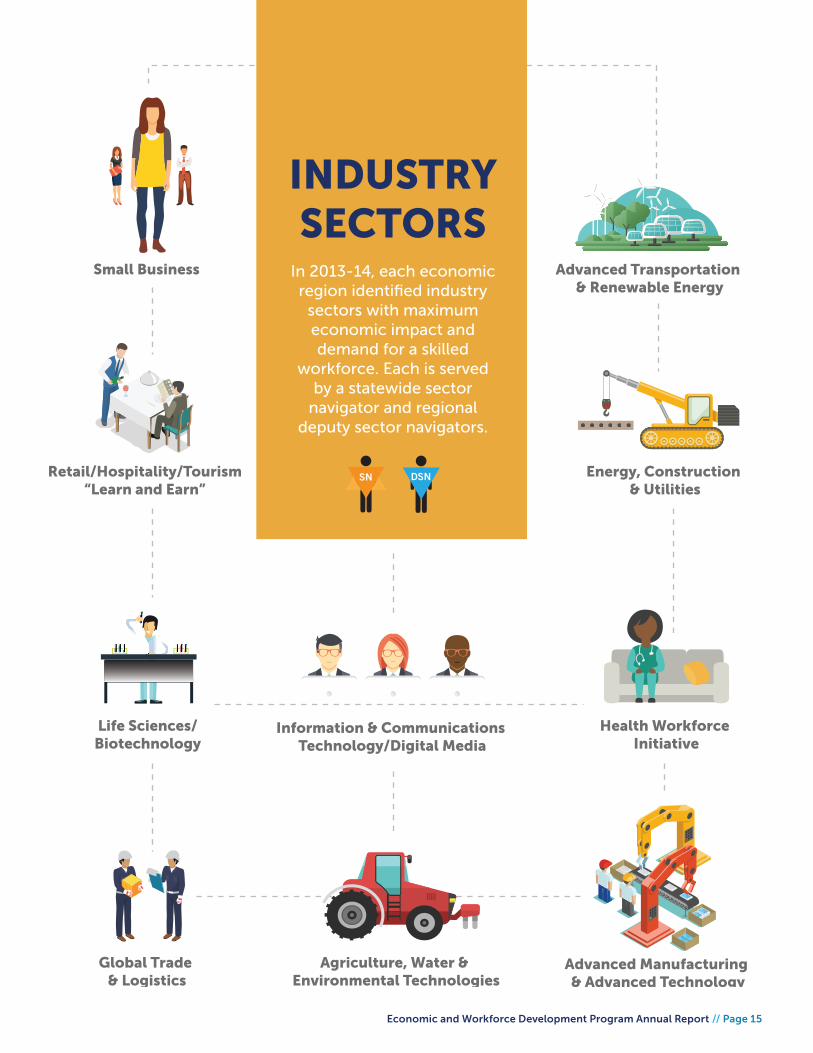
INDUSTRYSECTORS
In 2013-14, each economic region identified industry
sectors with maximum economic impact and demand for a skilled
workforce. Each is served by a statewide sector
navigator and regional deputy sector navigators.
Advanced Manufacturing & Advanced Technology
Advanced Transportation & Renewable Energy
Agriculture, Water & Environmental Technologies
Energy, Construction & Utilities
Global Trade & Logistics
Health Workforce Initiative
Information & Communications Technology/Digital Media
Life Sciences/Biotechnology
Retail/Hospitality/Tourism “Learn and Earn”
Small Business
SN DSN
Economic and Workforce Development Program Annual Report // Page 16
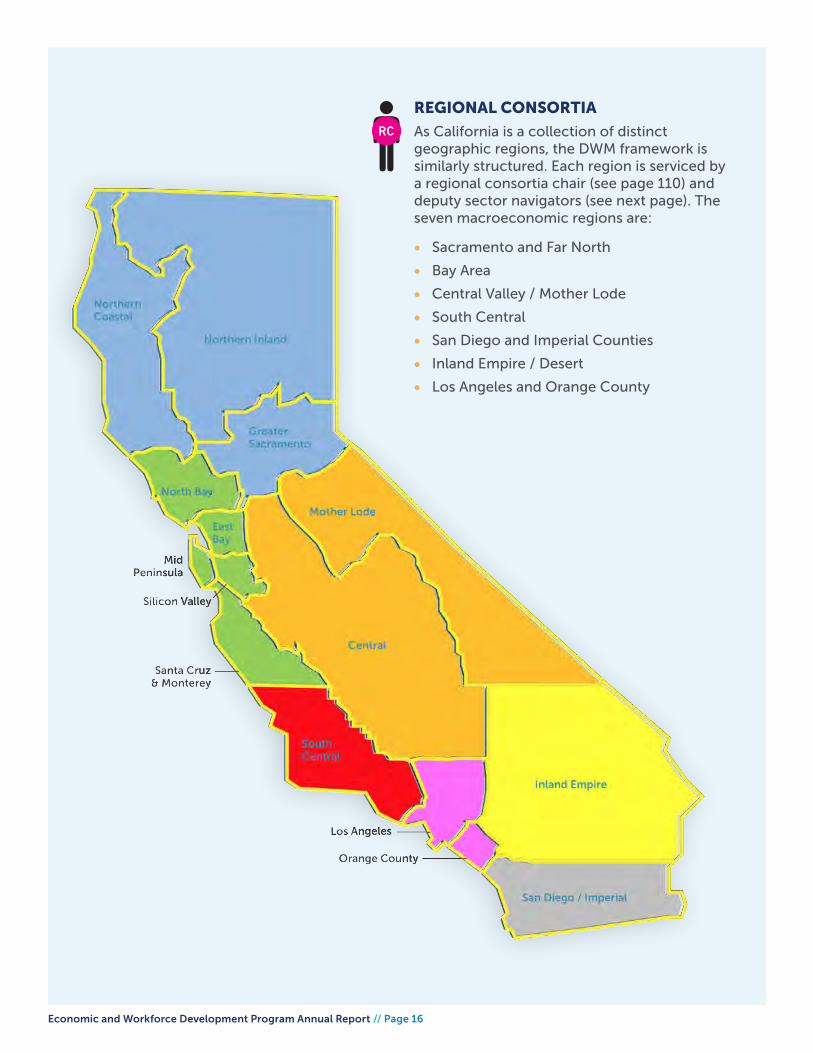
REGIONAL CONSORTIA
As California is a collection of distinct geographic regions, the DWM framework is similarly structured. Each region is serviced by a regional consortia chair (see page 110) and deputy sector navigators (see next page). The seven macroeconomic regions are:
• Sacramento and Far North
• Bay Area
• Central Valley / Mother Lode
• South Central
• San Diego and Imperial Counties
• Inland Empire / Desert
• Los Angeles and Orange County
RC

Economic and Workforce Development Program Annual Report // Page 17
THE INTRAPRENEURS OF DOING WHAT MATTERS FOR JOBS AND THE ECONOMY
DWM encourages an active ecosystem of “intrapreneurs” — defined as forward-thinking, calculated risk-takers within large organizations — to bolster career and technical education in California’s 113 community colleges.
Because the whole is greater than the sum of its parts, DWM is focused on inspiring multiple stakeholders within and beyond academia to engage in education and workforce development. To that end, DWM is staffed with a venture capital model of intrapreneurs who are empowered and charged to develop workforce development solutions collectively and innovatively. These grantees are experts in their industry sectors, regions and technical specialties.
Sector Navigators are the first contacts for employers and the community college system in a given priority sector. These statewide professionals:
• Develop an advisory structure for their sector and work across regions (or statewide) to coordinate work plans and communications between their deputy sector navigators.
• Partner with regional consortia (see page 108) and technical assistance providers (see next column) to align community college and other workforce development resources with the needs of industry.
• Track industry trends with workforce development implications and assist the community college system in connecting to industry associations and major employers.
• Facilitate the spread of information by identifying and disseminating curriculum models and effective practices and alerting and mobilizing regional consortia to pursue contract and grant opportunities.
Deputy Sector Navigators are in-region contacts for a given sector. These regionalized professionals:
• Work with their region’s colleges and employers to create alignment with workforce training and career pathways.
• Operate within the seven macroregions designated under the DWM framework (see previous page). Within each macroregion there are between five and seven deputy
sector navigators, each serving a different priority or emergent industry sector.
• Collaborate with their sector navigator and fellow deputy sector navigators working in the same sector to comprise a statewide, industry-focused network that normalizes work plans, provides for exchange of effective practices and fields “how to” questions from colleges and employers.
Centers of Excellence for Labor Market Research are labor market and data resource centers for education and industry stakeholders. These centers provide real-time and forecasted industry-validated regional labor market research. As part of the DWM framework, these centers provide regional consortia and sector-based initiatives with labor market information useful in decision making, inlcuding data to support better alignment of labor market workforce demands with training capacities at the colleges, within the region and across the state.
Industry-Driven Regional Collaboratives are short-term, grant-funded networks of regional public, private, and other community-based organizations. They support community colleges’ efforts to meet regional industries’ training and education needs. Responsiveness to these collaboratives is designed to allow for ample local autonomy and flexibility in decision making. Examples of services are:
• Providing professional development on new curriculum and instructional modes to community college faculty.
• Providing counseling and training to businesses aimed at helping them succeed and grow.
• Developing model curriculum/instructional packages, creating new courses and instituting up-to-date instructional methodologies and technologies needed to train students and incumbent workers on new technologies.
• Offering instruction through new programs/courses, work-based learning opportunities and performance improvement training.
• purchasing equipment necessary to support eligible activities.
Technical Assistance Providers enable the Chancellor’s Office, individual colleges, regional consortia, sector
DSN
SN
TAP
Economic and Workforce Development Program Annual Report // Page 18
navigators, deputy sector navigators, sector partnerships and collaborative communities of practice to more effectively carry out their roles by providing subject matter expertise in these areas:
• Apprenticeships
• Communications
• Contract education and alternative fee structures
• Data tools through the LaunchBoard (learn more on page 21)
• Employability skills through New World of Work (learn more on page 22)
• Internship back-end payroll services
• K-14 pathways
• Leadership and coordination support
• STEM/STEAM through Innovation Maker 3, CCCMaker and Teacher Prep Pipeline
• Strong Workforce Program implementation
• Third-party credentials
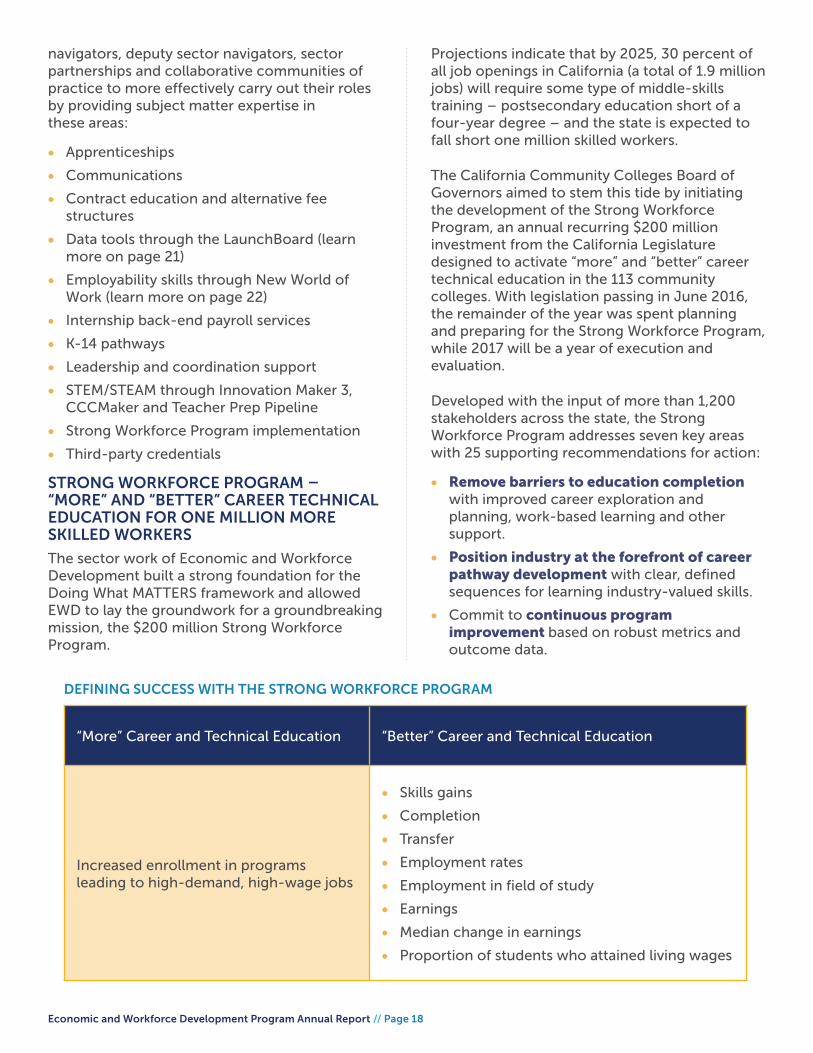
STRONG WORKFORCE PROGRAM – “MORE” AND “BETTER” CAREER TECHNICAL EDUCATION FOR ONE MILLION MORE SKILLED WORKERS
The sector work of Economic and Workforce Development built a strong foundation for the Doing What MATTERS framework and allowed EWD to lay the groundwork for a groundbreaking mission, the $200 million Strong Workforce Program.
“More” Career and Technical Education “Better” Career and Technical Education
Increased enrollment in programs leading to high-demand, high-wage jobs
• Skills gains
• Completion
• Transfer
• Employment rates
• Employment in field of study
• Earnings
• Median change in earnings
• Proportion of students who attained living wages
DEFINING SUCCESS WITH THE STRONG WORKFORCE PROGRAM
Projections indicate that by 2025, 30 percent of all job openings in California (a total of 1.9 million jobs) will require some type of middle-skills training – postsecondary education short of a four-year degree – and the state is expected to fall short one million skilled workers.
The California Community Colleges Board of Governors aimed to stem this tide by initiating the development of the Strong Workforce Program, an annual recurring $200 million investment from the California Legislature designed to activate “more” and “better” career technical education in the 113 community colleges. With legislation passing in June 2016, the remainder of the year was spent planning and preparing for the Strong Workforce Program, while 2017 will be a year of execution and evaluation.
Developed with the input of more than 1,200 stakeholders across the state, the Strong Workforce Program addresses seven key areas with 25 supporting recommendations for action:
• Remove barriers to education completion with improved career exploration and planning, work-based learning and other support.
• Position industry at the forefront of career pathway development with clear, defined sequences for learning industry-valued skills.
• Commit to continuous program improvement based on robust metrics and outcome data.

Economic and Workforce Development Program Annual Report // Page 19
• Streamline the curriculum-approval process to deliver in-demand skills at the speed of business, not the speed of lengthy approval cycles.
• Increase the pool of qualified CTE faculty through modified education requirements and salary differentials.
• Enable regional coordination to pool resources and efforts for CTE and responding to industry needs.
• Establish a dedicated and sustainable funding source for CTE programs that’s not dependent on grants or enrollment numbers that don’t account for the smaller student-to-teacher ratio required by many CTE courses.
The Strong Workforce Program focuses on data-driven outcomes rather than activities, along with an emphasis on innovation and risk-taking. In this way, colleges can be more responsive to labor market conditions and student outcomes. CTE Data Unlocked, a component of the program (learn more on page 21), helps colleges use CTE data to strengthen regional workforce plans by furthering local processes like program review, accreditation, and integrated planning.
The ongoing funding is structured as a 60 percent Local Share allocation for each community college district and a 40 percent Regional Share determined by a regional consortia of colleges to focus on the state’s seven macroeconomic regions. Both the Local and Regional Share require local stakeholders to collaborate, including industry and local workforce development boards. As much as possible, this program builds upon existing regional partnerships formed in conjunction with the federal Workforce Innovation and Opportunity Act, state Adult Education Block Grant and public school CTE programs.
WORKFORCE INNOVATION AND OPPORTUNITY ACT
California state law requires the California Workforce Development Board to collaborate with the chancellor of the California Community Colleges, the California Department of Education, other appropriate state agencies and local workforce development boards to develop a comprehensive state plan as a framework for public policy, fiscal investment and the operation of all state labor exchange, workforce education and training programs. State law specifically
The Economic Development
Program Advisory Committee
(EDPAC) is an advisory body
established to fulfill the statutory
requirements of SB 1402, which
is the California law authorizing
the Economic and Workforce
Development program. The
Workforce and Economic
Development Performance Advisory
Committee (WEDPAC) complements
EDPAC by incorporating partners
outside the state’s community
college system. Combined, these
advisory boards promote discussion
between industry, labor, economic
development, policy advocacy,
related state agencies, as well as
community college faculty, classified
staff, administrators, students and
district trustees.
directs the California Workforce Development Board to develop a plan that builds regional alliances between workforce and education professionals and employers to meet industry’s workforce needs.
State planning requirements anticipate, and are consistent with, the policy direction prescribed in the Workfore Innovation and Opportunity Act. This state plan coordinates training services and investment to align with industry needs by organizing efforts around career pathways and regional labor market trends. By doing so, this state plan is designed to meet both state and federal planning requirements while also providing a comprehensive framework for partnership between private industry and the state’s publically-funded workforce and education systems.
Economic and Workforce Development Program Annual Report // Page 20
ECONOMIC AND WORKFORCE DEVELOPMENT AS AN INCUBATOR OF EDUCATIONAL AND WORKFORCE INNOVATION

Economic and Workforce Development Program Annual Report // Page 21
With the Doing What MATTERS for Jobs and the Economy unifying framework of intrapreneurs, the Economic and Workforce Development Program is empowered to be an incubator of educational and workforce innovation, and numerous successes featured here illustrate the point. Additional innovations and best practices by priority sector can be found in Appendix A.
INNOVATIONS IN DATA: LAUNCHBOARD AND LABOR MARKET INFORMATION LIBRARY “FREE THE DATA”
Each year, California Community Colleges, through Economic and Workforce Development, adds to its suite of world-class data tools to support program development and improvement and student outcomes. Previous successes include:
• SalarySurfer, a tool that provides detailed data on median salaries for students two years before, two years after and five years after completing career and technical education (CTE) degrees of certificates at a California community college. It assists students to determine which programs to pursue to help improve their economic situations and enable social mobility.
• Student Success Scorecard, which provides transparency on student enrollment and outcomes at each of the 113 California community colleges, including outcome data for students who partially complete career and technical education programs.
In 2016, EWD released improvements to its LaunchBoard tool and related CTE Data Unlocked training, and it launched its Labor Market Information Library to fulfill the request of CTE deans to “free the data” to help them improve student outcomes.
The LaunchBoard is a statewide data system that provides data on the effectiveness of career and technical education programs. The information is intended to facilitate local, regional and statewide conversations about how to improve students’ educational and employment outcomes. The innovation of LaunchBoard is how it automates data feeds to calculate workforce metrics, thereby reducing data collection efforts by campuses and increasing the quality of the data. Aided visibility and ease of use increased access by a broad range of users at varied levels of data skills.
As a result of LaunchBoard’s innovations, decisions are more data-driven and evidence-based, resulting in strategic investments based on proven practices. The LaunchBoard accountability dashboard, now in version 2.0, gives California Community Colleges a tool to report and share the effectiveness of their programs by tracking student outcome data and economic impact. It is a powerful new tool to support the development and improvement of career technical education programs.
The Program Snapshot, a part of the LaunchBoard data system, promotes access to data on student outcomes and labor market information. This feature gives faculty and college leadership easy access to the information needed for program review, accreditation, college planning and regional coordination.
Practitioners can access information by Doing What MATTERS sector (such as healthcare or advanced manufacturing), program, college and region. Information is displayed in a visual format, based on common questions such as “Are we training the right number of students for available jobs?” “Are there equity gaps in student success?” and “Are students getting jobs?”
Users can also drill down to more detailed data tables, where they can disaggregate results by 20 different factors including demographic information, special needs status and prior education. Each metric shows the most recent year’s figures as well as a three-year trend, regional totals and statewide figures.
In addition to viewing information online, users can download information into multiple applications and insert it directly into reports, PowerPoint presentations and websites. Excel worksheets can also be downloaded to facilitate further research into student outcomes.
UNLOCKING LAUNCHBOARD’S DATA WITH CTE DATA UNLOCKED
To help practitioners harness the power of LaunchBoard, the Strong Workforce Program enabled creation of CTE Data Unlocked, a statewide training program consisting of:
• In-depth, in-person training and a vast library of print and video resources.
• $50,000 in related funding.
• 10 hours of free technical assistance from a CTE Data Unlocked Expert to support data usage.

Economic and Workforce Development Program Annual Report // Page 22
LABOR MARKET INFORMATION LIBRARY
Additionally, 2016 saw the launch of the Labor Market Information Library, a curated compilation of reports and data tables relevant to career technical education program planning. Included reports’ focus is occupational and includes timely information on workforce needs and/or trends relevant to California Community Colleges. This easy-to-use tool allows CTE practitioners to select a sector or program and the geographic area, resulting in a list of accurate, current and reliable resources to help understand the status of the selected industry.
EWD’s innovations in data are positioning California Community Colleges as a data leader. The White House Domestic Policy Council asked California Community Colleges leadership to participate in briefings to help other states evolve their community college data tools. In addition, experts from California Community Colleges serve as advisors to the Workforce Data Quality Campaign (WDQC), a nonprofit that aims to use data to advance the U.S. workforce and help our country’s industries better compete in a changing economy.
NEW WORLD OF WORK: PROOF-OF-CONCEPT AT SCALE THAT’S ALREADY EARNING ACCOLADES
Experience has taught the Economic and Workforce Development program that starting a program at one college with its unique composition and needs and then retrofitting it to accommodate other colleges with different needs doesn’t always work. Therefore, rather than funding one college at a time to pilot change, the program took an innovative approach by funding a network of ten colleges at the start. Doing so challenged colleges to organize for scale from the beginning.
To address employers’ needs for soft skills, a 10-college network was awarded a grant as an EWD Industry-Driven Regional Collaborative to tackle the gap in employability/soft skills. The result is the New World of Work modular curriculum with badging technologies incorporated. Now this curriculum is being adopted by colleges region by region, rather than one college at a time. The thought is this: once proof of concept has been established for 10 colleges, adding the 15th, the 20th or the 113st can be much easier.
Additionally, the Mozilla Foundation named New World of Work as one of two promising practices nationally in higher education to develop and implement digital badges for soft skills.
“The LaunchBoard makes the California Community College system the national leader in the development of data base tools for aligning student’s career aspirations, curricula and labor market opportunities. The LaunchBoard offers community college practitioners detailed and readily accessible information on student progress, credential attainment, employment outcomes, and labor market information all in one place.”
-Anthony P. CarnevaleResearch Professor and Director, McCourt School of Public Policy
Georgetown University Center on Education and the Workforce
Economic and Workforce Development Program Annual Report // Page 23
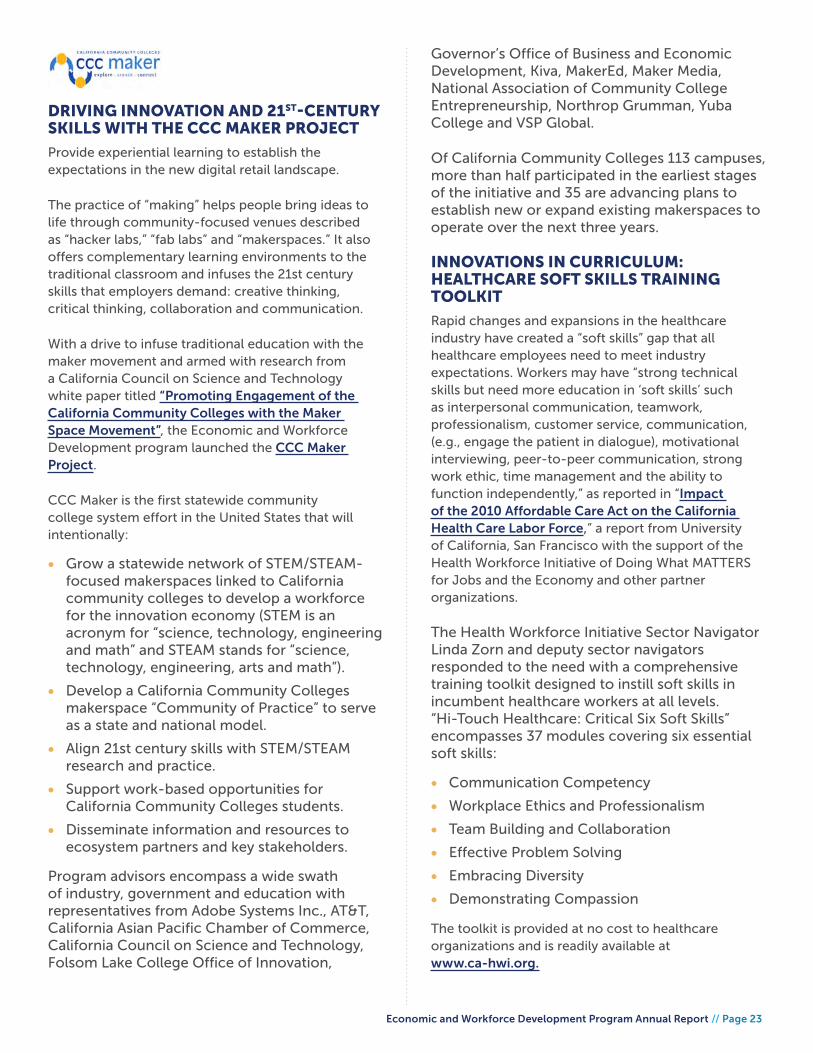
DRIVING INNOVATION AND 21ST-CENTURY SKILLS WITH THE CCC MAKER PROJECT
Provide experiential learning to establish the expectations in the new digital retail landscape.
The practice of “making” helps people bring ideas to life through community-focused venues described as “hacker labs,” “fab labs” and “makerspaces.” It also offers complementary learning environments to the traditional classroom and infuses the 21st century skills that employers demand: creative thinking, critical thinking, collaboration and communication.
With a drive to infuse traditional education with the maker movement and armed with research from a California Council on Science and Technology white paper titled “Promoting Engagement of the California Community Colleges with the Maker Space Movement”, the Economic and Workforce Development program launched the CCC Maker Project.
CCC Maker is the first statewide community college system effort in the United States that will intentionally:
• Grow a statewide network of STEM/STEAM-focused makerspaces linked to California community colleges to develop a workforce for the innovation economy (STEM is an acronym for “science, technology, engineering and math” and STEAM stands for “science, technology, engineering, arts and math”).
• Develop a California Community Colleges makerspace “Community of Practice” to serve as a state and national model.
• Align 21st century skills with STEM/STEAM research and practice.
• Support work-based opportunities for California Community Colleges students.
• Disseminate information and resources to ecosystem partners and key stakeholders.
Program advisors encompass a wide swath of industry, government and education with representatives from Adobe Systems Inc., AT&T, California Asian Pacific Chamber of Commerce, California Council on Science and Technology, Folsom Lake College Office of Innovation,
Governor’s Office of Business and Economic Development, Kiva, MakerEd, Maker Media, National Association of Community College Entrepreneurship, Northrop Grumman, Yuba College and VSP Global.
Of California Community Colleges 113 campuses, more than half participated in the earliest stages of the initiative and 35 are advancing plans to establish new or expand existing makerspaces to operate over the next three years.
INNOVATIONS IN CURRICULUM: HEALTHCARE SOFT SKILLS TRAINING TOOLKIT
Rapid changes and expansions in the healthcare industry have created a “soft skills” gap that all healthcare employees need to meet industry expectations. Workers may have “strong technical skills but need more education in ‘soft skills’ such as interpersonal communication, teamwork, professionalism, customer service, communication, (e.g., engage the patient in dialogue), motivational interviewing, peer-to-peer communication, strong work ethic, time management and the ability to function independently,” as reported in “Impact of the 2010 Affordable Care Act on the California Health Care Labor Force,” a report from University of California, San Francisco with the support of the Health Workforce Initiative of Doing What MATTERS for Jobs and the Economy and other partner organizations.
The Health Workforce Initiative Sector Navigator Linda Zorn and deputy sector navigators responded to the need with a comprehensive training toolkit designed to instill soft skills in incumbent healthcare workers at all levels. “Hi-Touch Healthcare: Critical Six Soft Skills” encompasses 37 modules covering six essential soft skills:
• Communication Competency
• Workplace Ethics and Professionalism
• Team Building and Collaboration
• Effective Problem Solving
• Embracing Diversity
• Demonstrating Compassion
The toolkit is provided at no cost to healthcare organizations and is readily available at www.ca-hwi.org.

Economic and Workforce Development Program Annual Report // Page 24
INNOVATIONS IN PARTNERSHIPS WITH THE SMART MANUFACTURING INNOVATION INSTITUTE
The Advanced Manufacturing priority sector, led by Sector Navigator Jose Anaya, worked with a nationwide consortium of nearly 200 partners from across academia, industry, and nonprofits to help UCLA’s Smart Manufacturing Leadership Coalition win the bid to lead the new Smart Manufacturing Innovation Institute, in partnership with the United States Department of Energy. The consortium brings more than $140 million in public-private investment from leading universities and manufacturers to develop smart sensors and digital process controls for use in advanced manufacturing – an initiative that can radically improve the efficiency of U.S. advanced manufacturing.
Doing What MATTERS for Jobs and the Economy is involved in all stages of the initiative. In addition to contributing matching funds to the winning consortium, Anaya helped write the workforce component of the winning grant. After the technology is adopted by industry, Anaya and his deputy sector navigators will help colleges develop career pathways so students can earn the high-demand jobs and employers can have a pipeline of work-ready talent.
INNOVATION IN CAREER PATHWAYS: BUSINESS INFORMATION WORKER CURRICULUM ADOPTED AT 72 COLLEGES WITHIN 24 MONTHS
In response to employers’ demand for digital and soft skills, the Information Communications and Technology / Digital Media and Small Business sector teams developed the Business Information Worker curriculum. The short-term, branded pathway prepares students for entry-level, middle-skill office jobs in six months or less, incorporating keyboarding, Microsoft Office (Word, Excel, Outlook) information systems, business communications and human relations/customer service.
Three stages are offered:
• Business Information Worker I offers entry-level skills with a solid foundation in Microsoft Windows and Office as well as strong digital and web literacy skills.
• Business Information Worker II adds skills in PowerPoint, QuickBooks, records management and collaboration software
• Business Information Specialist adds specialized skills such as project management, marketing support and graphic design.
Each stage includes relevant third-party certifications such as Microsoft Office Specialist or QuickBooks Certified User.
In fewer than two years after the statewide launch of the Business Information Worker program, 72 colleges have joined the initiative.

Economic and Workforce Development Program Annual Report // Page 25
Ph
oto
Cre
dit
: Cu
yam
aca
Co
lleg
e

Economic and Workforce Development Program Annual Report // Page 26
OPPORTUNITIES, INVESTMENTS AND RESULTS

Economic and Workforce Development Program Annual Report // Page 27
THE OPPORTUNITY FOR SOCIAL MOBILITY:PROJECTED INDUSTRY EMPLOYMENT IN PRIORITY SECTORS
Demand for skilled workers in California is strong, as shown by the projected job openings in Doing What MATTERS for Jobs and the Economy priority industry sectors in Exhibit 2. All sectors are anticipated to experience new job growth over the three-year period with the exception of advanced manufacturing.
Sorted in descending order by number of jobs, the data below summarize:
• The current number of jobs in the state for eight of the 10 priority sectors.
• The most recent average annual earnings per worker1.
• The anticipated growth or decline in jobs through 2019 (this data does not include the estimated need for replacement workers, which is an important measure of demand for assessing occupational training programs).
Select examples of occupations related to the priority sectors and that have established community college application are profiled for the 2015-18 period in Appendix A. Although chosen for their relevance to one priority sector, the data represent employment estimates, projections and wages for each occupation across all sectors.
Source: Center of Excellence
1 Average annual earnings per worker are on a ‘gross’ basis and do not reflect wages by occupation. All regular employee wages in the industry sector are included in the average — part-time and full-time workers as well as all paid positions, from security guard to CEO, for example. These data include variable factors such as premium pay for overtime and late-shift work and changes in output of employees paid on an incentive plan.
2 All employment data in this report provided by Economic Modeling Specialists International (EMSI), 2016.4 — QCEW Employees, Non-QCEW Employees, and Self-Employed. Totals are not representative of all industry employment in California. Industry sub-sectors overlap between sectors causing duplication while other non-related subsectors were not included.
3 Annual change is the average yearly change for the projected period (2016-19).
4 Due to the difficulty isolating industry employment data specific to renewable energy firms and functions, industry data shown here represents transportation industry codes only.
Sector2Number of
Jobs in 2016
Projected Change
(2016-19)
Annual Change3
% Change (2016-19)
2015 Average Annual
Earnings
% Change 2015-16
Retail, Hospitality and Tourism 3,411,135 163,125 54,375 5% $28,438 2.33%
Healthcare 1,673,094 117,360 39,120 7% $64,145 3.43%
Advanced Manufacturing 1,314,730 (44,642) (14,881) (3%) $82,966 0.30%
Energy Efficiency, Utility and Construction
1,087,597 56,170 18,723 5% $77,785 2.21%
Information and Communications Technology / Digital Media
1,016,179 62,898 20,966 6% $136,633 4.10%
Life Sciences/Biotechnology 897,916 38,787 12,929 4% $98,286 3.72%
Agriculture, Water and Environmental Technologies
609,837 13,941 4,647 2% $37,263 0.93%
Advanced Transportation and Renewable Energy4
575,078 15,482 5,161 3% $48,724 3.10%
EXHIBIT 2: JOB OPENINGS IN PRIORITY SECTORS, 2016

Economic and Workforce Development Program Annual Report // Page 28
THE INVESTMENT IN CALIFORNIA’S ECONOMY AND WORKFORCE: PROGRAM FUNDING
The following section explains the distribution of funds to bolster California’s economy and workforce.
INVESTMENT BY GRANT INITIATIVE
In 2015-16, EWD funded 95 grants across five major initiatives, totaling $24.8 million as shown in Exhibit 3 below. Deputy sector navigators, those on the front lines of workforce development, received the lion’s share of funding at $13.2 million.
INVESTMENT BY PRIORITY SECTOR
While Doing What MATTERS supports 10 industry sectors statewide, each of the seven regions supports a selection of industry sectors that are most relevant and impactful to its regional economy. The five sectors most frequently selected among regions are:
• Small Business
• Health
• Information and Communications Technology (ICT)/Digital Media
• Global Trade and Logistics
• Advanced Manufacturing
The amount of funding allocated to a given sector is correlated to the number of regions that select the sector as a priority area, as shown in Exhibit 4.
Source: EWD Quarterly and Final Expenditure Reporting System
Initiative # of Grants Value of Awards Percentage of Total
Deputy Sector Navigators 65 $13,200,000 53%
Sector Navigators 10 $3,725,000 15%
Industry-Driven Regional
Collaborative8 $3,240,524 13%
Centers of Excellence 7 $1,400,000 6%
Capacity Building, Training & Support TAPs 5 $3,227,525 13%
Total 95 $24,793,049 100%
EXHIBIT 3: 2015-16 FUNDING BY EWD GRANT INITIATIVE
Photo Credit: Riverside City College
Photo Credit: Antelope Valley College

Economic and Workforce Development Program Annual Report // Page 29
EXHIBIT 4: 2015-16 FUNDING BY PRIORITY
0.0
0.5
1.0
1.5
2.0
2.5
Ad
v. T
ran
s. &
Ren
ew.
Ad
van
ced
Man
ufa
ctu
rin
g
Ag
ricu
ltu
re, W
ater
& E
nvi
ron
men
tal T
ech
no
log
ies
En
erg
y, C
on
stru
ctio
n &
Uti
liti
es
Glo
bal
Tra
de
& L
og
isti
cs
Hea
lth
ICT
/DM
Life
Sci
ence
s/B
iote
ch
Ret
ail/
Ho
spit
alit
y/To
uri
sm
Sm
all B
usi
nes
s
Economic and Workforce Development Program Annual Report // Page 30
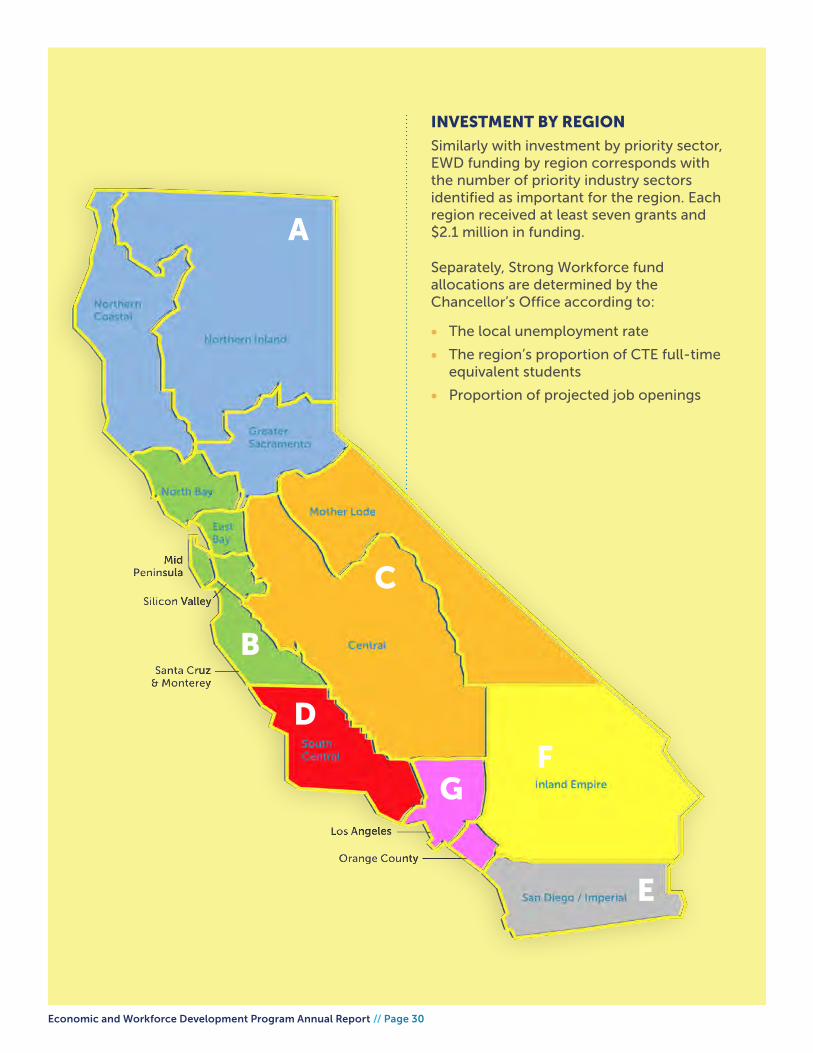
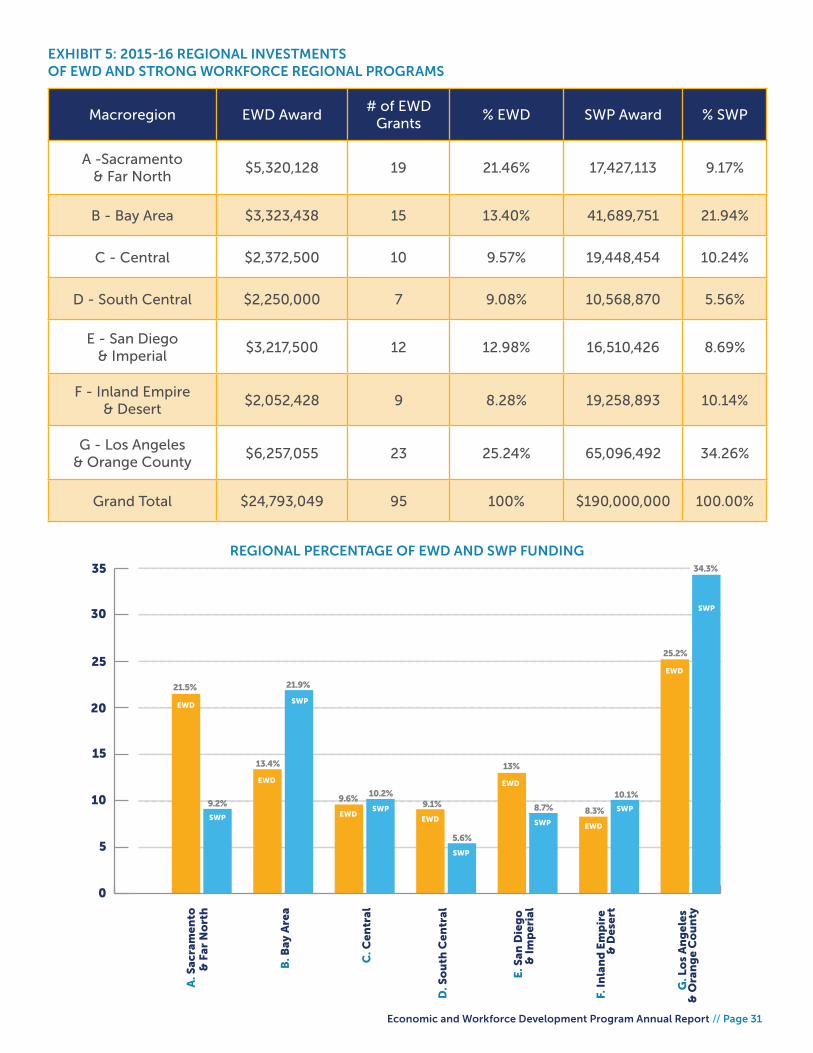
INVESTMENT BY REGION
Similarly with investment by priority sector, EWD funding by region corresponds with the number of priority industry sectors identified as important for the region. Each region received at least seven grants and $2.1 million in funding.
Separately, Strong Workforce fund allocations are determined by the Chancellor’s Office according to:
• The local unemployment rate
• The region’s proportion of CTE full-time equivalent students
• Proportion of projected job openings
A
B
D
GF
E
C
Economic and Workforce Development Program Annual Report // Page 31
EXHIBIT 5: 2015-16 REGIONAL INVESTMENTS OF EWD AND STRONG WORKFORCE REGIONAL PROGRAMS
Macroregion EWD Award# of EWD
Grants% EWD SWP Award % SWP
A -Sacramento & Far North
$5,320,128 19 21.46% 17,427,113 9.17%
B - Bay Area $3,323,438 15 13.40% 41,689,751 21.94%
C - Central $2,372,500 10 9.57% 19,448,454 10.24%
D - South Central $2,250,000 7 9.08% 10,568,870 5.56%
E - San Diego & Imperial
$3,217,500 12 12.98% 16,510,426 8.69%
F - Inland Empire & Desert
$2,052,428 9 8.28% 19,258,893 10.14%
G - Los Angeles & Orange County
$6,257,055 23 25.24% 65,096,492 34.26%
Grand Total $24,793,049 95 100% $190,000,000 100.00%
SWP
8.7%
0
5
10
15
20
25
30
35
A. S
acra
men
to&
Far
No
rth
B. B
ay A
rea
C. C
entr
al
D. S
ou
th C
entr
al
E. S
an D
ieg
o
& I
mp
eria
l
F. I
nla
nd
Em
pir
e &
Des
ert
G. L
os
An
gel
es
& O
ran
ge
Co
un
tyEWD
SWP
SWP
SWP
SWP
SWP
SWP
EWD
EWDEWD
EWD
EWD
EWD
21.5%
13.4%
21.9%
9.6%10.2%
9.1%
13%
8.3%
10.1%
25.2%
34.3%
5.6%
9.2%
REGIONAL PERCENTAGE OF EWD AND SWP FUNDING

Economic and Workforce Development Program Annual Report // Page 32
THE RESULTS OF INVESTING IN CAREER AND TECHNICAL EDUCATION
With the generation of 1,584 jobs, 149 new products and services and $33.7 million in business revenue, career and technical education is proving to be a worthwhile investment for California to increase social mobility and deliver the skills companies need to thrive. Following are more details.
EXHIBIT 6: IMPACTS ON BUSINESS
EXHIBIT 7: IMPACTS ON EMPLOYERS, EMPLOYEES AND STUDENTS
Jobs created 1,584
Employees retained 9,414
Business revenue generated $ 33,669,637
Sales increased $ 67,866,769
New products developed 65
New services created 84
Businesses served 12,159
Students served 61,056
Employees served 19,624
Programs completed 19,233
Contract education hours delivered 67,831
Performance improvement training hours delivered
55,521
Instruction hours delivered 102,872
Students placed in jobs 1,433
Students in work-based learning, internships and apprenticeships
3,114
Source: EWD Quarterly and Final Expenditure Reporting System
Source: EWD Quarterly and Final Expenditure Reporting System
Economic and Workforce Development Program Annual Report // Page 33
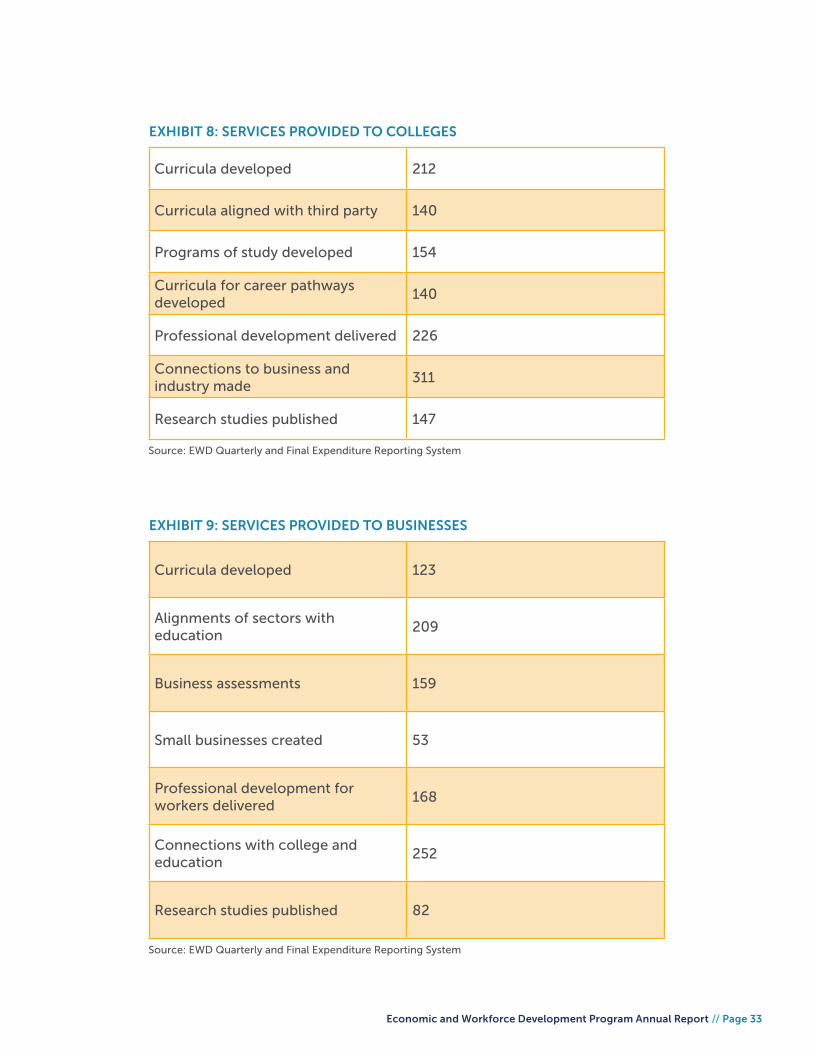
EXHIBIT 8: SERVICES PROVIDED TO COLLEGES
EXHIBIT 9: SERVICES PROVIDED TO BUSINESSES
Curricula developed 212
Curricula aligned with third party 140
Programs of study developed 154
Curricula for career pathways developed
140
Professional development delivered 226
Connections to business and industry made
311
Research studies published 147
Curricula developed 123
Alignments of sectors with education
209
Business assessments 159
Small businesses created 53
Professional development for workers delivered
168
Connections with college and education
252
Research studies published 82
Source: EWD Quarterly and Final Expenditure Reporting System
Source: EWD Quarterly and Final Expenditure Reporting System

Economic and Workforce Development Program Annual Report // Page 34
CONCLUSION

Economic and Workforce Development Program Annual Report // Page 35
CONCLUSION
Creating a strong workforce for California is a team effort. It is not something that community colleges, or workforce development agencies, or industry can do alone. Success requires full input of the unique assets and perspectives from all stakeholders: the entire community college system, education and workforce partners, business and industry and state policymakers.
The Economic and Workforce Development Program, through the Doing What MATTERS for Jobs and the Economy framework and its ecosystem of intrapreneurs, enables and nurtures effective collaboration, provides a structured support system and spurs workforce innovation to deliver the more than one million industry-recognized mid-skill credentials needed over the next decade in California’s fast evolving and globally connected economy.
The initiatives funded in fiscal year 2015-16 created and strengthened the alignment between stakeholders, specifically:
• Sector Navigators and Deputy Sector Navigators continued to serve businesses through the Doing What MATTERS for Jobs and the Economy intrapreneurial ecosystem. Sector navigators provided statewide technical expertise for their priority and emergent industries. Likewise, deputy sector navigators connected colleges to their industries within the regions they represent.
• Industry-Driven Regional Collaboratives provided employers and colleges the opportunity to work together to create and improve course offerings, preparing students with the skills and education needed to fill high-demand jobs.
• The Centers of Excellence and LaunchBoard provided world-class data for laser-sharp, outcomes-driven strategic decisions.
The sum of this collaborative work enables the California Community Colleges to advance social mobility for more Californians through the attainment of in-demand skills employers require for good-paying jobs, lifting thousands of Californians out of poverty. It also provides employers with the skilled talent necessary to give their organizations the market distinction for competing on a global scale.
With the incremental support provided by the $200 million Strong Workforce Program, the momentum for career and technical education will only increase in 2017-18 when plans take flight.

Economic and Workforce Development Program Annual Report // Page 36
METHODOLOGY
Economic and Workforce Development Program Annual Report // Page 37
The data for this report were collected through quantitative and qualitative methods. Financial data and select performance information were collected through online grant reporting systems. Qualitative data, such as success stories, were collected through the Sector Navigators. The data presented in this report covers the grantee term fiscal year 2015-16.
QUANTITATIVE REPORTING
With oversight by their EWD grant monitors in the Chancellor’s Office, project directors and chief business officers report and certify their grants’ budget and expenditures quarterly in the EWD Online Expenditure System. Before grants are closed, a report of their required match and any additional resources leveraged is also collected. Project directors, including sector navigators and deputy sector navigators, also provide a quarterly summary of performance information—a list of activities conducted and a report on outcomes achieved.
QUALITATIVE REPORTING
Qualitative reporting provides rich detail about the achievements of EWD grantees that cannot be obtained through quantitative data only. Each of the 10 sector navigator grantees provided illustrative success stories, available in Appendix A.

Economic and Workforce Development Program Annual Report // Page 38

Economic and Workforce Development Program Annual Report // Page 39
APPENDICES

Economic and Workforce Development Program Annual Report // Page 40
APPENDIX A

Economic and Workforce Development Program Annual Report // Page 41
ADVANCED MANUFACTURING& ADVANCED TECHNOLOGY
Sector HighlightsSector Navigator Jose Anayawww.makingitincalifornia.com
Ph
oto
Cre
dit
: San
Die
go
Mir
amar
Co
lleg
e

Economic and Workforce Development Program Annual Report // Page 42
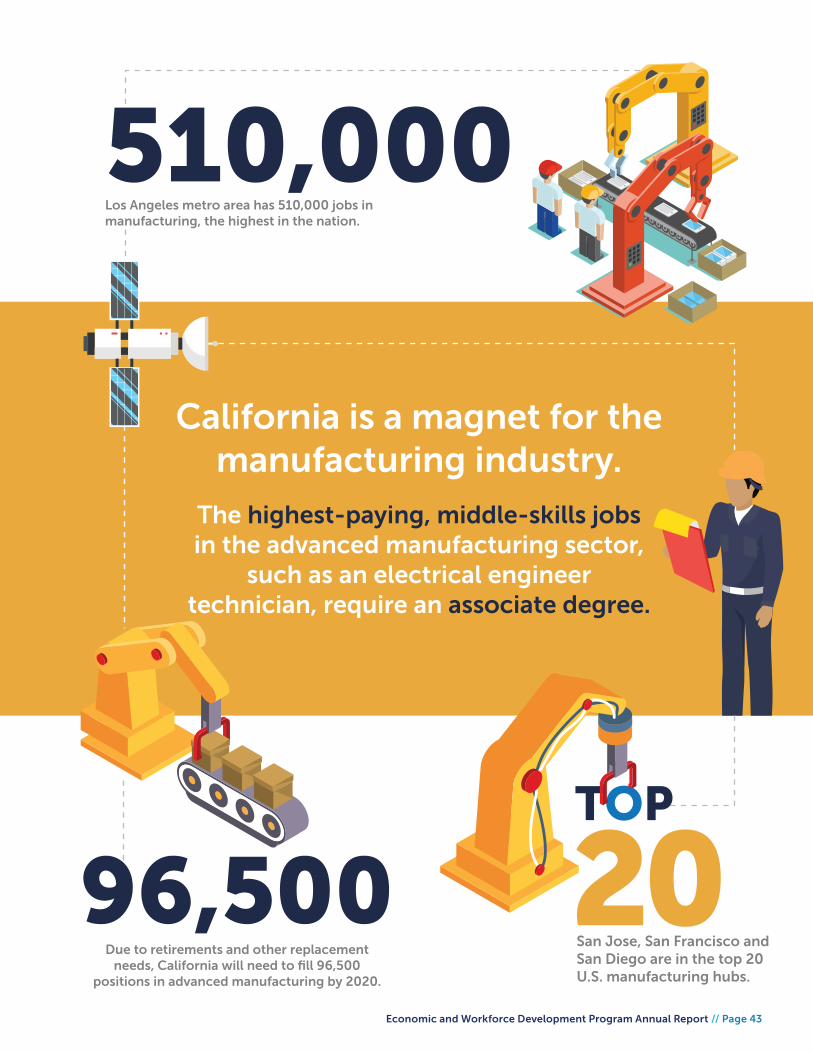
California’s manufacturing sector of today employs advanced and versatile technology, with processes designed to maximize every step of the value chain. Manufacturing jobs in California are thriving, and recent surveys suggest many California manufacturers plan to hire new workers. The sector’s continuous and rapid evolution creates the need for workers who possess up-to-the-minute skills.
Economic and Workforce Development Program Annual Report // Page 43
California is a magnet for the manufacturing industry.
Due to retirements and other replacement needs, California will need to fill 96,500
positions in advanced manufacturing by 2020.
20San Jose, San Francisco and San Diego are in the top 20 U.S. manufacturing hubs.
510,000Los Angeles metro area has 510,000 jobs in manufacturing, the highest in the nation.
The highest-paying, middle-skills jobs in the advanced manufacturing sector,
such as an electrical engineer technician, require an associate degree.
96,500TOP

Economic and Workforce Development Program Annual Report // Page 44
BEST PRACTICE: DISNEYLAND RESORT MACHINING TRAINING PROGRAM
Norma Alvarado, Deputy Sector Navigator for Advanced Manufacturing
In response to the need for a trained technical workforce, Disneyland Resort and Fullerton College developed a machinist training program for Disneyland employees, also known as cast members. The four-year work study program offers practical, industry-specific coursework in a variety of topics, including blueprint reading, technical mathematics, computer numeric control machining, welding, metallurgy, manufacturing processes and transportation services.
The vigorous program includes classroom instruction at Fullerton College, hands-on training at Disneyland Resort and training support from the International Association of Machinists and Aerospace Workers District Lodge 947. Program participants earn a Journeyman
card, certifying them to perform advanced technical work.
Cast members who successfully complete this program are eligible for job advancement and greater compensation. What’s more, after completion of the program, only 16 additional credits are needed to earn an associate degree from Fullerton College.
“Fullerton College’s robust vocational programs create a perfect partner for us as we look for ways to support the professional development of our cast members,” said Disneyland Resort Vice President of Operations Rich Langhorst.
“The Disneyland Resort Machining Training Program has been an awesome learning experience; it just shows me that you are
never too old to learn new skills.”
Andrew Fenton
California Community Colleges’ Centers for Applied Competitive Technologies (CACT) help California manufacturers compete in ever-changing markets and the global economy through customized technology education, manufacturing training and services that contribute to continuous workforce development.
Manufacturers benefit from onsite training, low- or no-cost technical assistance and educational workshops, as well as information on how to qualify for state funds to assist with retraining employees and upgrading equipment.
OCCUPATIONAL TRENDS IN ADVANCED MANUFACTURING & ADVANCED TECHNOLOGY
Occupation2016 Jobs
Projected Change
ReplacementsTotal
OpeningsAnnual
Openings
Median Annual Wages
First-Line Supervisors of Production and Operating Workers
59,867 (690) 2,819 2,819 940 $54,169
Electrical & Electronics Repairers, Commercial & Industrial Equipment
6,543 94 341 435 145 $58,319
Mechanical Engineering Technicians 4,742 81 353 434 145 $60,297
Industrial Engineering Technicians 4,566 51 346 397 132 $57,963
Semiconductor Processors 6,057 (179) 365 365 122 $35,926
Additionally, CACT:
• Provides industry-specific reports on manufacturing and emerging industries/technologies.
• Offers strategies for addressing specialized economic and workforce issues.
• Promotes science, technology, engineering and mathematics (STEM) education through school presentations.
• Develops recruitment tools and strategic partnerships.
• Delivers varied resources to help industry, educators and students succeed in “Making it in California.”
Economic and Workforce Development Program Annual Report // Page 45
DATA SOURCES:
https://www.brookings.edu/interactives/interactive-locating-american-manufacturing/
https://cwdb.ca.gov/plans_policies/WIOA_Unified_Strategic_Workforce_Development-_Plan/
(California Workforce Development Board, “Strategic Workforce Development Plan, 2016-20)
https://www.bls.gov/regions/west/summary/blssummary_losangeles.pdf
http://blogs.wsj.com/economics/2015/07/15/where-are-the-most-u-s-manufacturing-workers-los-angeles/
ADVANCED MANUFACTURING& ADVANCED TECHNOLOGY

Economic and Workforce Development Program Annual Report // Page 46

Economic and Workforce Development Program Annual Report // Page 47
AGRICULTURE, WATER &ENVIRONMENTAL TECHNOLOGIES
Sector HighlightsSector Navigator Nancy Gutierrezwww.calagcc.org
Ph
oto
Cre
dit
: Oh
lon
e C
olle
ge

Economic and Workforce Development Program Annual Report // Page 48
The Agriculture, Water and Environmental Technology initiative works to ensure the economic viability of California’s agriculture and natural resources industry, while maintaining our environmental integrity, especially in the area of water – our most precious resource.
The work of this sector team supports the growth and development of several industry clusters, including agriculture support, agriculture production, agriculture wholesale trade, and agriculture water, forestry, natural resources and environmental services through various programs, including the following:
• Environmental Training Centers
Assist business and industry to conform to local, state, and federal environmental, health, and safety laws, regulations, ordinances and regulations.
• Water & Wastewater Technology Programs
Prepare and certify students for the municipal drinking water and wastewater treatment departments and industrial treatment facilities.
• Agriculture & Natural Resources Programs
Offer traditional education attainment as well as industry certification preparation in a variety of disciplines, including high-wage careers such as heavy equipment operators, landscape irrigation auditors, pest control advisers, agriculture sales representatives and many more.

Economic and Workforce Development Program Annual Report // Page 49
Food inspectors in California are paid an average8 percent higher than those nationwide, with the state
ranking 8th among the states in average pay.
California’s agricultural exports totaled $20.7 billion in 2015.
$20.7 billion
%8

Economic and Workforce Development Program Annual Report // Page 50
BEST PRACTICE FOOD SAFETY TRAINING AND PATHWAY DEVELOPMENT
Nancy Gutierrez, Sector Navigator for Agriculture, Water & Environmental Technologies
The FDA Food Safety Modernization Act (FSMA) of 2011 is the most sweeping reform of our food safety laws in more than 70 years. For producers, this mandates an influx of food safety workers and additional training. California Community Colleges is aligned with industry to respond.
In 2014-15, only 148 completed Food Technology and Animal Science programs to fill the 30,000 job openings related to food safety. To address this gap, the sector navigator and
several deputy sector navigators collaborated with colleges to provide:
• Good Ag Practices (GAP) training for farm workers and farmers in the San Joaquin Valley and Central Coast
• Safe Quality Food Training to workers in food processing facilities
• Internal Auditing Training to workers in cold storage and packing houses
• Hazard Analysis Critical Control Point (HACCP) Certification, composed of four introductory courses developed by instructors statewide
Work will continue to develop competencies in food safety protocols for incumbent workers and traditional students.
OCCUPATIONAL TRENDS IN AGRICULTURE, WATER & ENVIRONMENTAL TECHNOLOGIES
Occupation2016 Jobs
Projected Change
ReplacementsTotal
OpeningsAnnual
Openings
Median Annual Wages
Environmental Scientists & Specialists
16,618 849 1,588 2,437 812 $80,453
Veterinary Technologists & Techs 10,964 866 348 1,214 405 $37,067
Environmental Science & Protection Techs
4,651 281 611 892 297 $46,611
Agricultural & Food Science Techs 3,609 131 363 494 165 $38,864
Agricultural Inspectors 3,172 61 244 305 102 $39,977
Ph
oto
Cre
dit
: (to
p)
San
Die
go
Cit
y C
olle
ge
, (b
ott
om
) D
e A
nza
Co
lleg
e

Economic and Workforce Development Program Annual Report // Page 51
DATA SOURCES:
http://www.careersinpublichealth.net/careers/food-inspector
https://www.cdfa.ca.gov/Statistics/pdfs/AgExports2015-2016.pdf
AGRICULTURE, WATER &ENVIRONMENTAL TECHNOLOGIES

Economic and Workforce Development Program Annual Report // Page 52

Economic and Workforce Development Program Annual Report // Page 53
ADVANCED TRANSPORTATION& RENEWABLE ENERGY
Sector HighlightsSector Navigator Peter Daviswww.4NRG.org
Ph
oto
Cre
dit
: Am
eri
can
Riv
er
Co
lleg
e
Economic and Workforce Development Program Annual Report // Page 54
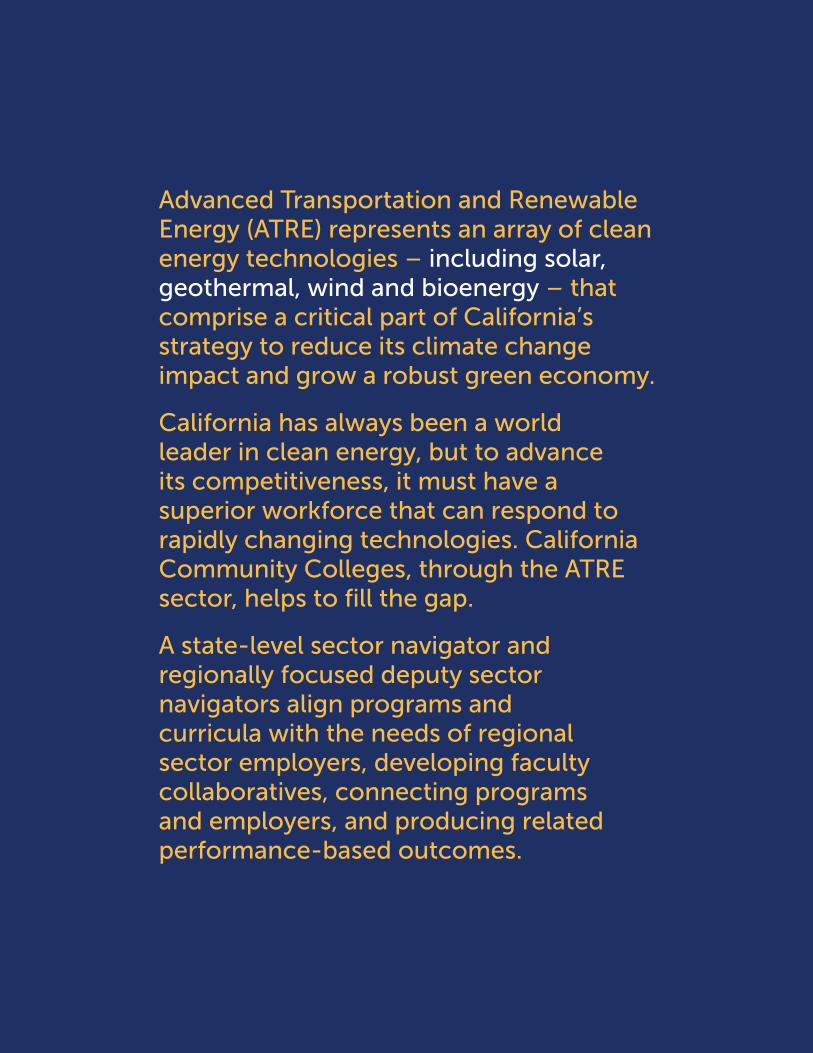
Advanced Transportation and Renewable Energy (ATRE) represents an array of clean energy technologies – including solar, geothermal, wind and bioenergy – that comprise a critical part of California’s strategy to reduce its climate change impact and grow a robust green economy.
California has always been a world leader in clean energy, but to advance its competitiveness, it must have a superior workforce that can respond to rapidly changing technologies. California Community Colleges, through the ATRE sector, helps to fill the gap.
A state-level sector navigator and regionally focused deputy sector navigators align programs and curricula with the needs of regional sector employers, developing faculty collaboratives, connecting programs and employers, and producing related performance-based outcomes.

Economic and Workforce Development Program Annual Report // Page 55
116 wind projects are located in 9 counties in the San Francisco Bay, Inland Empire and San Diego/Imperial regions.
Statewide, college ATRE programs support 50 automotive-related programs, 14 aeronautics-related programs and 23 renewable energy programs.
24%Solar photovoltaic installers will see 24 percent job growth from 2014 to 2024, triple that of other industries.
6,000On average, workers trained in advanced transportation and renewable energy technologies at a community college earned an additional $6,000 over the three years following their training.
$
Economic and Workforce Development Program Annual Report // Page 56
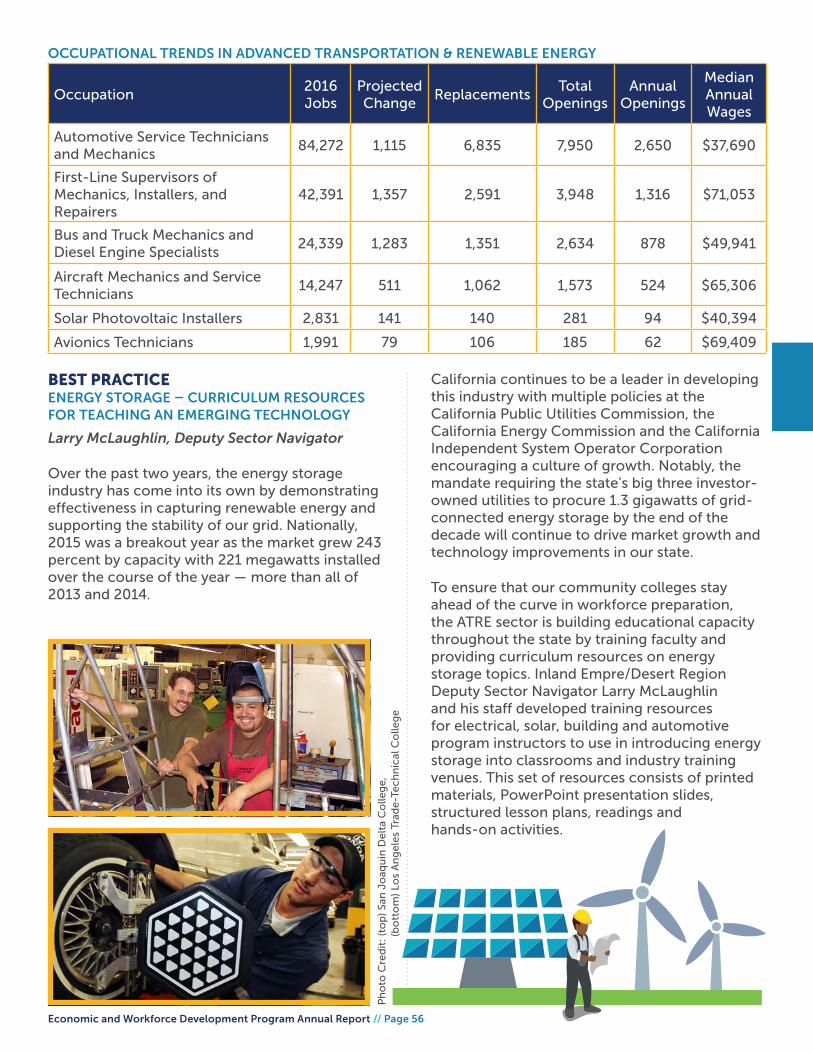
BEST PRACTICE ENERGY STORAGE – CURRICULUM RESOURCES FOR TEACHING AN EMERGING TECHNOLOGY
Larry McLaughlin, Deputy Sector Navigator
Over the past two years, the energy storage industry has come into its own by demonstrating effectiveness in capturing renewable energy and supporting the stability of our grid. Nationally, 2015 was a breakout year as the market grew 243 percent by capacity with 221 megawatts installed over the course of the year — more than all of 2013 and 2014.
California continues to be a leader in developing this industry with multiple policies at the California Public Utilities Commission, the California Energy Commission and the California Independent System Operator Corporation encouraging a culture of growth. Notably, the mandate requiring the state’s big three investor-owned utilities to procure 1.3 gigawatts of grid-connected energy storage by the end of the decade will continue to drive market growth and technology improvements in our state.
To ensure that our community colleges stay ahead of the curve in workforce preparation, the ATRE sector is building educational capacity throughout the state by training faculty and providing curriculum resources on energy storage topics. Inland Empre/Desert Region Deputy Sector Navigator Larry McLaughlin and his staff developed training resources for electrical, solar, building and automotive program instructors to use in introducing energy storage into classrooms and industry training venues. This set of resources consists of printed materials, PowerPoint presentation slides, structured lesson plans, readings and hands-on activities.
OCCUPATIONAL TRENDS IN ADVANCED TRANSPORTATION & RENEWABLE ENERGY
Occupation2016 Jobs
Projected Change
ReplacementsTotal
OpeningsAnnual
Openings
Median Annual Wages
Automotive Service Technicians and Mechanics
84,272 1,115 6,835 7,950 2,650 $37,690
First-Line Supervisors of Mechanics, Installers, and Repairers
42,391 1,357 2,591 3,948 1,316 $71,053
Bus and Truck Mechanics and Diesel Engine Specialists
24,339 1,283 1,351 2,634 878 $49,941
Aircraft Mechanics and Service Technicians
14,247 511 1,062 1,573 524 $65,306
Solar Photovoltaic Installers 2,831 141 140 281 94 $40,394
Avionics Technicians 1,991 79 106 185 62 $69,409
Ph
oto
Cre
dit
: (to
p)
San
Jo
aqu
in D
elt
a C
olle
ge
,
(
bo
tto
m)
Los
An
ge
les
Trad
e-T
ech
nic
al C
olle
ge

Economic and Workforce Development Program Annual Report // Page 57
DATA SOURCES:
http://www.atreeducation.org/wp-content/uploads/2017/01/ATRE-Investment-Options.pdf
https://www.bls.gov/ooh/construction-and-extraction/solar-photovoltaic-installers.htm
http://www.atreeducation.org/publications-the-atre-program-viewbook
ADVANCED TRANSPORTATION& RENEWABLE ENERGY

Economic and Workforce Development Program Annual Report // Page 58

Economic and Workforce Development Program Annual Report // Page 59
ENERGY, CONSTRUCTION& UTILITIES
Sector HighlightsSector Navigator Jim Caldwellwww.ecusectordwm.com
Ph
oto
Cre
dit
: We
st H
ills
Co
lleg
e C
oal
ing
a

Economic and Workforce Development Program Annual Report // Page 60
A collection of three industry clusters is engaged in deploying and managing technologies related to the generation, distribution, storage and efficient use of energy. They include:
• Energy efficiency, encompassing firms engaged in
energy planning, installation and management with the purpose of making new and existing buildings more energy efficient.
• Construction, which propagates the skills necessary
to make energy efficiency a reality through building and construction practices.
• Utilities that are primarily focused on generating,
transmitting and delivering electric power; distributing natural gas and water and collecting and treating waste water.
The Energy, Construction and Utilities Sector (ECU) facilitates development of a workforce capable of compliance with California’s greenhouse gas reduction mandates such as SB 350, the Clean Energy and Pollution Reduction Act (de Léon, 2015) and the Title 24 Building Energy Efficiency Standards. Informed by industry, the sector team collaborates with the colleges on faculty-driven talent pipelines to meet the state’s needs for new workers and for incumbent workers with skills to keep pace with technology and standards evolution. Pipelines connect with students in K-12 and workforce investment board talent pools, providing career pathways, work-based learning, new courses and professional development for faculty.

Economic and Workforce Development Program Annual Report // Page 61
Energy, construction and utility industries account for more than 461,200 jobs and are projected to add almost 18,100 jobs by 2018.
There are 48,000 energy, utility and energy efficiency-related businesses in California.
BILLION$
UC Berkeley forecasts about $11.2 billion in public and private investments in energy efficiency
in California by the year 2020.
461,200
11.2
48,000
Economic and Workforce Development Program Annual Report // Page 62
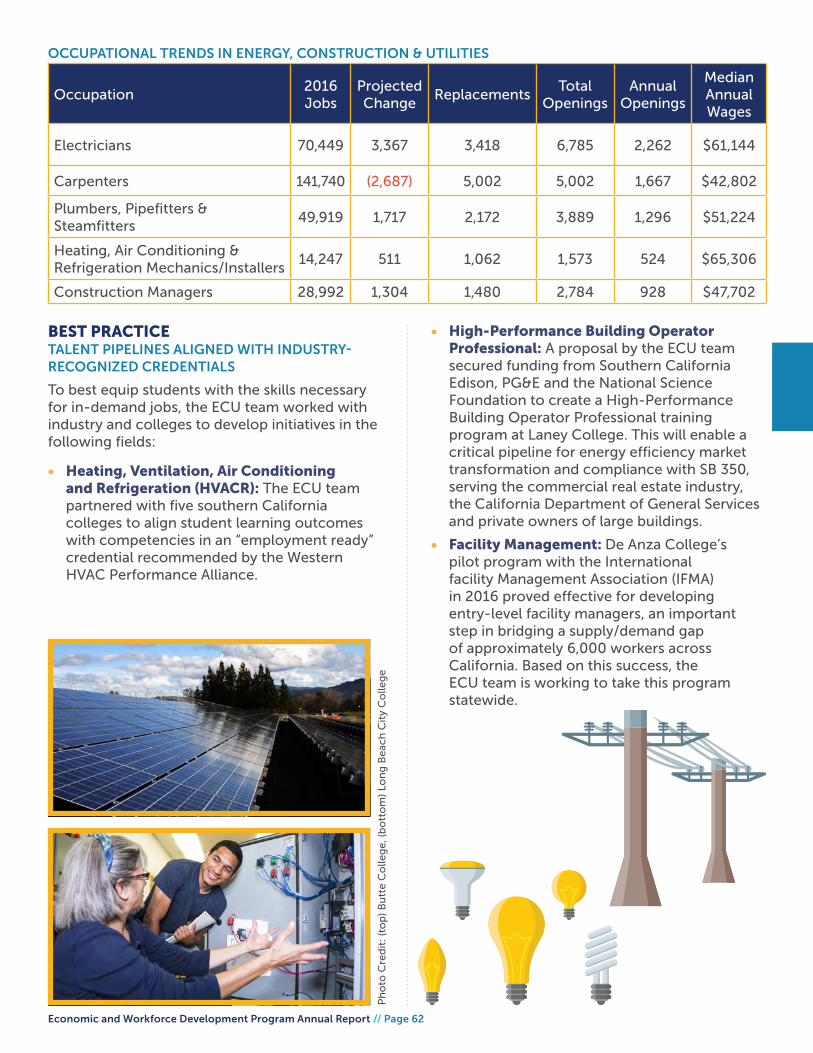
BEST PRACTICETALENT PIPELINES ALIGNED WITH INDUSTRY-RECOGNIZED CREDENTIALS
To best equip students with the skills necessary for in-demand jobs, the ECU team worked with industry and colleges to develop initiatives in the following fields:
• Heating, Ventilation, Air Conditioning and Refrigeration (HVACR): The ECU team partnered with five southern California colleges to align student learning outcomes with competencies in an “employment ready” credential recommended by the Western HVAC Performance Alliance.
• High-Performance Building Operator Professional: A proposal by the ECU team secured funding from Southern California Edison, PG&E and the National Science Foundation to create a High-Performance Building Operator Professional training program at Laney College. This will enable a critical pipeline for energy efficiency market transformation and compliance with SB 350, serving the commercial real estate industry, the California Department of General Services and private owners of large buildings.
• Facility Management: De Anza College’s pilot program with the International facility Management Association (IFMA) in 2016 proved effective for developing entry-level facility managers, an important step in bridging a supply/demand gap of approximately 6,000 workers across California. Based on this success, the ECU team is working to take this program statewide.
OCCUPATIONAL TRENDS IN ENERGY, CONSTRUCTION & UTILITIES
Occupation2016 Jobs
Projected Change
ReplacementsTotal
OpeningsAnnual
Openings
Median Annual Wages
Electricians 70,449 3,367 3,418 6,785 2,262 $61,144
Carpenters 141,740 (2,687) 5,002 5,002 1,667 $42,802
Plumbers, Pipefitters & Steamfitters
49,919 1,717 2,172 3,889 1,296 $51,224
Heating, Air Conditioning & Refrigeration Mechanics/Installers
14,247 511 1,062 1,573 524 $65,306
Construction Managers 28,992 1,304 1,480 2,784 928 $47,702
Ph
oto
Cre
dit
: (to
p)
Bu
tte
Co
lleg
e, (
bo
tto
m)
Lon
g B
eac
h C
ity
Co
lleg
e

Economic and Workforce Development Program Annual Report // Page 63
DATA SOURCE:
http://bit.ly/CA_EnergySector
ENERGY, CONSTRUCTION& UTILITIES

Economic and Workforce Development Program Annual Report // Page 64

Economic and Workforce Development Program Annual Report // Page 65
GLOBAL TRADE& LOGISTICS
Ph
oto
Cre
dit
: No
rco
Co
lleg
e

Economic and Workforce Development Program Annual Report // Page 66
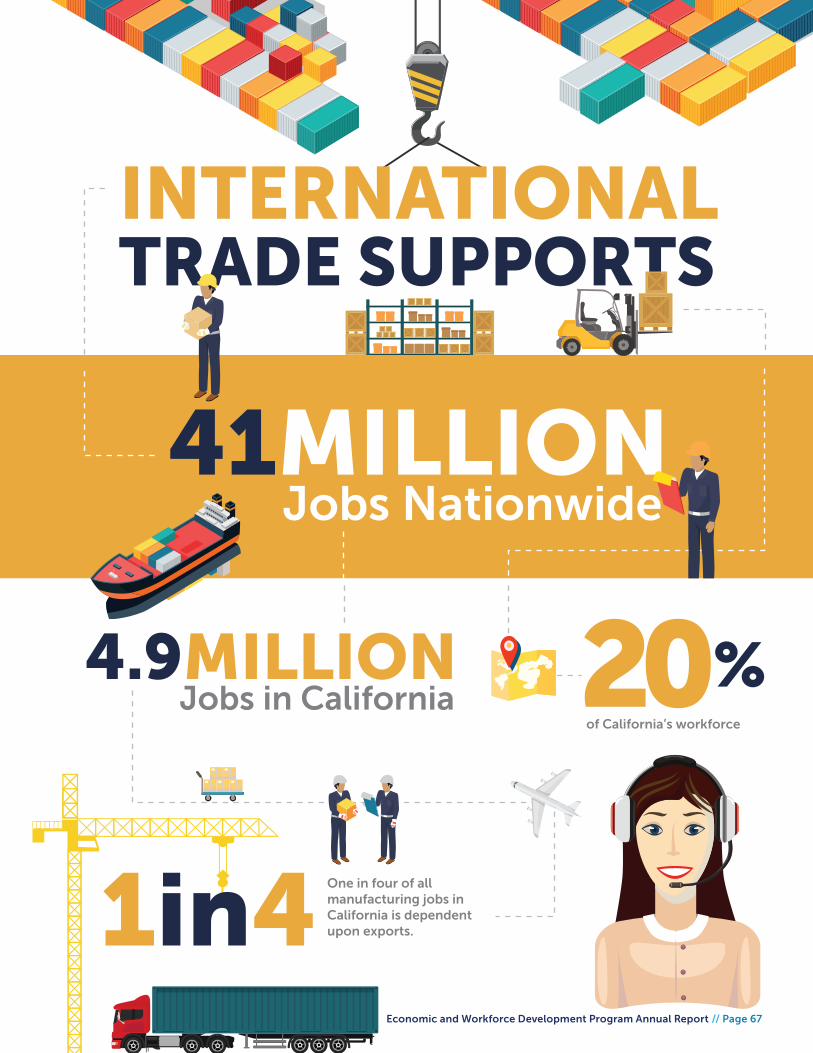
California is a global trade and logistics powerhouse, with 2015 exports hitting $165.4 billion in American-made goods, the majority of which were manufactured products. It’s estimated that more than 800,000 jobs are supported by California’s exporting and importing of goods and services, licensing of technology and intellectual property, and investments across international boundaries — including logistics, finance, marketing and management of business processes to support trade.
Economic and Workforce Development Program Annual Report // Page 67
20%of California’s workforce
41MILLIONJobs Nationwide
One in four of all manufacturing jobs in California is dependent upon exports.
4.9MILLIONJobs in California
INTERNATIONALTRADE SUPPORTS
1in4
Economic and Workforce Development Program Annual Report // Page 68
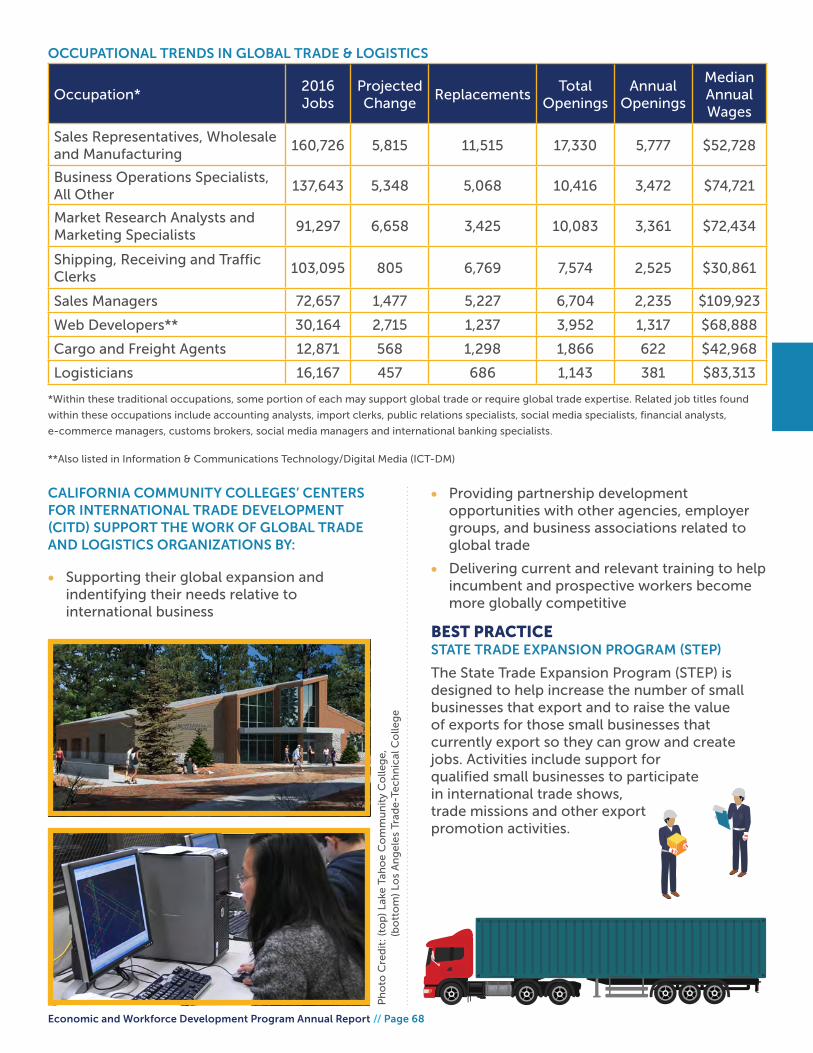
CALIFORNIA COMMUNITY COLLEGES’ CENTERS FOR INTERNATIONAL TRADE DEVELOPMENT (CITD) SUPPORT THE WORK OF GLOBAL TRADE AND LOGISTICS ORGANIZATIONS BY:
• Supporting their global expansion and indentifying their needs relative to international business
• Providing partnership development opportunities with other agencies, employer groups, and business associations related to global trade
• Delivering current and relevant training to help incumbent and prospective workers become more globally competitive
BEST PRACTICESTATE TRADE EXPANSION PROGRAM (STEP)
The State Trade Expansion Program (STEP) is designed to help increase the number of small businesses that export and to raise the value of exports for those small businesses that currently export so they can grow and create jobs. Activities include support for qualified small businesses to participate in international trade shows, trade missions and other export promotion activities.
*Within these traditional occupations, some portion of each may support global trade or require global trade expertise. Related job titles found
within these occupations include accounting analysts, import clerks, public relations specialists, social media specialists, financial analysts,
e-commerce managers, customs brokers, social media managers and international banking specialists.
**Also listed in Information & Communications Technology/Digital Media (ICT-DM)
OCCUPATIONAL TRENDS IN GLOBAL TRADE & LOGISTICS
Occupation*2016 Jobs
Projected Change
ReplacementsTotal
OpeningsAnnual
Openings
Median Annual Wages
Sales Representatives, Wholesale and Manufacturing
160,726 5,815 11,515 17,330 5,777 $52,728
Business Operations Specialists, All Other
137,643 5,348 5,068 10,416 3,472 $74,721
Market Research Analysts and Marketing Specialists
91,297 6,658 3,425 10,083 3,361 $72,434
Shipping, Receiving and Traffic Clerks
103,095 805 6,769 7,574 2,525 $30,861
Sales Managers 72,657 1,477 5,227 6,704 2,235 $109,923
Web Developers** 30,164 2,715 1,237 3,952 1,317 $68,888
Cargo and Freight Agents 12,871 568 1,298 1,866 622 $42,968
Logisticians 16,167 457 686 1,143 381 $83,313P
ho
to C
red
it: (
top
) La
ke T
aho
e C
om
mu
nit
y C
olle
ge
,
(
bo
tto
m)
Los
An
ge
les
Trad
e-T
ech
nic
al C
olle
ge

Economic and Workforce Development Program Annual Report // Page 69
DATA SOURCES:
http://bit.ly/LA_trade_and_logistics
https://beaconecon.com/products/trade_report
https://www.census.gov/foreign-trade/statistics/state/data/ca.html
https://ustr.gov/about-us/policy-offices/press-office/fact-sheets/2015/march/unlocking-economic-opportunity
http://businessroundtable.org/resources/trade-and-american-jobs-2016-update
GLOBAL TRADE& LOGISTICS

Economic and Workforce Development Program Annual Report // Page 70

Economic and Workforce Development Program Annual Report // Page 71
HEALTH CARE
Ph
oto
Cre
dit
: Co
lleg
e o
f th
e C
anyo
ns
Sector HighlightsSector Navigator Linda Zornwww.ca-hwi.org

Economic and Workforce Development Program Annual Report // Page 72
Demand for skilled health care workers is widespread nationwide and particularly in California. The Public Policy Institute of California estimates that by 2024, the state will need an additional 190,000 allied healthcare workers, including licensed vocational nurses, certified nursing assistants, medical assistants, imaging technologists, dental hygienists and dental assistants.
To develop innovative solutions for addressing the shortage, the Health Workforce Initiative sector navigator and deputy sector navigators maintain close collaborations with colleges and industry professionals.
Colleges benefit by receiving professional development for faculty and staff and technical assistance with program and curriculum development and/or revision; convening of faculty collaboratives; and connecting with industry through program advisory structures.
Health care employers and employees benefit from incumbent worker training, professional development for licensure renewal, labor market analysis to determine needs and gaps, and subsequent strategy development on meeting workforce needs identified in the analysis.

Economic and Workforce Development Program Annual Report // Page 73
43One of the fastest-growing allied health care professions is occupational therapy assistant with a projected 42.7 percent increase by 2024.
$56,950Median wage for
occupational therapy assistants in 2014 was
$56,950.
Required level of education to become an occupational therapy assistant: associate degree.
15%
%
Openings for medical records and health information technicians are expected to grow 15 percent between 2014 and 2024.

Economic and Workforce Development Program Annual Report // Page 74
BEST PRACTICES• Health and Science Pipeline Initiative
(HASPI) is a statewide project to support middle and high schools in implementing science-based health pathway programs to increase student performance and strengthen transition and retention rates in community college programs. HASPI is the program being used for the health sector component of the California Career Pathway Trust grants. Outcomes included 18 HAPSI workshops/events and 872 participants.
• Healthcare Information Technology (HIT) Specialist is facilitated by Paula Hodge, DSN in the ICT/DM Sector and John Cordova, DSN in the Health Sector. This is a cross-functional initiative that addresses the emerging need for updated skills for entry-level workers such as help desk coordinators, information technicians, medical assistants, certified nurses aides and/or other entry level workers. The collaboration included partners statewide, including leaders from the American Health Information Management Association and Healthcare Information and Management Systems Society.
• Critical Care Specialty Training for Registered Nurses is an important initiative to help close the skills gap for this profession.
Ph
oto
Cre
dit
: We
st V
alle
y C
olle
ge
OCCUPATIONAL TRENDS IN HEALTH CARE
Occupation2016 Jobs
Projected Change
ReplacementsTotal
OpeningsAnnual
Openings
Median Annual Wages
Registered Nurses 284,150 17,828 21,405 39,233 13,078 $102,030
Nursing Assistants 112,306 13,180 8,237 21,417 7,139 $29,483
Licensed Practical & Vocational Nurses
73,837 6,278 6,875 13,153 4,384 $51,275
Medical Assistants 90,654 6,935 6,096 13,031 4,344 $34,427
Dental Assistants 52,833 2,425 4,045 6,470 2,157 $38,198
This program in Orange County is in its 12th year and reports more than 500 completers. What makes the program unique is the additional use of high-fidelity simulation experiences that allow for experiential learning of clinical and decision making skills. Nursing managers report that the course provides skills required to provide safe, competent care to critically ill patients and is a service that hospitals could not duplicate themselves.
• Ambulatory Care Specialty Training for registered nurses addresses an increasing need in the San Diego/Imperial region. HWI hired industry partner Lisa Duncan, BSN, MBA, RN-C, CIC, to create and deliver an Ambulatory Care Nurse Certification Review Course. The first session in June 2016 served 17 nurses from organizations such as Kaiser Permanente, UC San Diego, Scripps and Family Health Centers of San Diego, and received excellent reviews.
• An annual event since 2011, the Career Summer Institute in Mental Health in the South Bay area allows high school and college students to explore mental health careers and to experience “hands on” communication techniques used in group sessions. They complete the program with a certification in Mental Health First Aid. The administration at one of the participating high schools reported that high-risk students who participated in the program ultimately graduated from high school.
“...high-risk students who participated in the program ultimately graduated from
high school.”

Economic and Workforce Development Program Annual Report // Page 75
DATA SOURCES:
https://www.bls.gov/ooh/healthcare/medical-records-and-health-information-technicians.htm
https://www.bls.gov/news.release/pdf/ecopro.pdf
HEALTH CARE

Economic and Workforce Development Program Annual Report // Page 76

Economic and Workforce Development Program Annual Report // Page 77
INFORMATION ANDCOMMUNICATION TECHNOLOGIES
Ph
oto
Cre
dit
: Cu
yam
aca
Co
lleg
e
Sector HighlightsSector Navigator Stephen Wrightwww.ict-dm.net
Economic and Workforce Development Program Annual Report // Page 78
California faces a continuously rapid evolution of technology that renders the in-demand skills of today to the minimum skills of tomorrow. Employers have a tremendous need for workers with up-to-the-minute skills in computers, software, networking, telecommunications; internet, programming and information systems technologies including hardware, software, digital media and services.
The Information and Communication Technologies/Digital Media sector identifies, verifies and promotes effective strategies and pathways necessary to build the pipeline of Information Technology workers, and contributes to accelerated student outcomes by helping colleges acquire the technology to train students remotely and providing faculty development and system support.

Economic and Workforce Development Program Annual Report // Page 79
39 percent of California’s job openings from 2012 to 2022 will be ICT-related, including computer systems analysts, software
developers, systems software experts, market research analysts, web developers and information security analysts.
%Another 27 percent of jobs will require business skills relying on information
systems and office applications software.
27
%39

Economic and Workforce Development Program Annual Report // Page 80
BEST PRACTICESMAXIMUM LEVERAGE OF RESOURCES AND RETURN ON INVESTMENT • In addition to a variety of services the ICT/
Digital Media Priority Sector successfully delivers, the ones noted below address regional and statewide model and scalability of programs.
COMPUTER SCIENCE/SOFTWARE DEVELOPMENT• Update Transfer Model Curriculum (TMC)
in Computer Science to increase transfer processes for software development careers
• Project manage TMC C-ID conversion at colleges
• Model and replicate successful Articulation Alliances, like CSin3 at Hartnell/CSU
• Communicate adult learner pathways to Software Development through CCCs to close critical skills gap (SD Edge)
• Expand SD EDGE program, a Bay Regional website for efficient search of all 28 regional colleges to find relevant pathway course offerings and expand statewide
• Update faculty computer science skills with training
INFORMATION TECHNOLOGY (IT) — NETWORKING/INFRASTRUCTURE• Develop and secure pilot for Bachelor’s
of Applied Science — IT Networking to accommodate growing demand for IT professionals
• Model and replicate successful Articulation Alliances (ex. CSU San Bernardino IT BS)
• Expand successful HS CyberPatriots Programs statewide to encourage under-represented minorities to participate in IT
OCCUPATIONAL TRENDS IN INFORMATION AND COMMUNICATION TECHNOLOGIES/DIGITAL MEDIA
Occupation2016 Jobs
Projected Change
ReplacementsTotal
OpeningsAnnual
Openings
Median Annual Wages
Computer User Support Specialists
76,353 5,179 3,086 8,265 2,755 $58,241
Network & Computer Systems Administrators
47,679 2,371 1,991 4,362 1,454 $88,597
Web Developers 30,164 2,715 1,237 3,952 1,317 $68,888
Computer Network Support Specialists
23,162 1,304 929 2,233 744 $73,950
Multimedia Artists & Animators 14,197 324 806 1,130 377 $65,543
• Expand CCC ITTP Program to accommodate increasing students from HS CyberPatriot program
• Manager NetLab+ User Group and website for CCC faculty using this successful 24/7, low-cost computer lab alternative (* separate $13M equip/org request through BACCC)
• Update faculty skills with three training conferences per year
• Develop and deploy advanced certificate programs for experienced IT professionals (e.g. B2B Sales, or Rockwell instrumentation)
• Internship and interview program coordination statewide to influence businesses utilizing LaunchPath (CCCF) and AWE Programs
BUSINESS INFORMATION SERVICES• Expand successful BIW 1, 2 and Specialist
program with proactive enrollment
• Focus on Microsoft Office Specialist Digital Badge attainment in BIW Series
• Expand placement support to agencies statewide
DIGITAL MEDIA • Provide critical faculty training in expanded
uses of digital media as middle skill in hybrid business needs
• Develop adult “retool” certification to accommodate the rapidly changing work/office environment
• Develop more integrated curricula paths with business and sciences for student training
ENTERTAINMENT• Develop entry, growth and exit pathways and
share on LA Regional website for efficient search of all 28 regional colleges.
• Expand Ent EDGE to statewide

Economic and Workforce Development Program Annual Report // Page 81
DATA SOURCES:
http://bit.ly/CA_ITTechnicianPathway
INFORMATION ANDCOMMUNICATION TECHNOLOGIES

Economic and Workforce Development Program Annual Report // Page 82

Economic and Workforce Development Program Annual Report // Page 83
LIFE SCIENCES / BIOTECHNOLOGY
Ph
oto
Cre
dit
: So
lan
o C
om
mu
nit
y C
olle
ge
Sector HighlightsSector Navigator Sandra Slivkawww.calbiotechcareers.org

Economic and Workforce Development Program Annual Report // Page 84
Life Sciences / Biotechnology encompasses a group of diverse industries, including agriculture feedstock and chemicals, drugs and pharmaceuticals, medical devices and equipment, research testing and medical laboratories, and bioscience-related distribution. All have a common link: the application of biological scientific knowledge to make products that are useful to humans.
Development of this sector provides excellent workforce opportunities for California’s community college students, as a Centers of Excellence Labor Market Information study predicts 6,000 middle-skills jobs and 17,000 “pathway jobs” (requiring BS degrees) over the next five years. To meet this need, there are 34 active community college degree and certificate programs that support workforce readiness and provide pathways to the Baccalaureate of Science degrees in Bio-Manufacturing programs scheduled to launch at Solano College and Mira Costa College in 2017.
Additionally, many Life Sciences / Biotechnology jobs require quality and regulatory skills, but general education biology and/or chemistry at California community colleges and four-year universities do not prepare students accordingly. Thus, Life Sciences / Biotechnology strives to meet this workforce need.

Economic and Workforce Development Program Annual Report // Page 85
Los Angeles County projects hiring an additional 502 medical
and clinical laboratory technicians by 2020.
Statewide there are 1,872 annual openings in sales, wholesale and manufacturing positions
related to life sciences.
1,872Annual Job Openings
California has the largest life sciences/biotechnology employment base in the U.S. with more than 235,000 jobs, spanning more than 8,000 individual business establishments.
502MORE TECHNICIANS
235,000Life Sciences/Biotechnology Jobs

Economic and Workforce Development Program Annual Report // Page 86
BEST PRACTICESINDUSTRY ALIGNMENT AND THIRD PARTY CREDENTIALS• Program alignment to industry needs
through third-party credentials or licensure is important to increase the capacity to deliver industry-relevant training with in-demand skills sets, improve outreach to students, improve program visibility with industry, and increase industry engagement with community colleges.
EXAMPLES OF DEVELOPMENT OR ALIGNMENT TO CREDENTIALS INCLUDE:• Employability Milestone: For most
California Community Colleges Life Science / Biotechnology programs, there is no third-party credential or licensure. So, a collaborative effort resulted in the “Employability Milestone,” which is a skill set thoroughly vetted and approved by industry and faculty. Classes leading to this milestone are categorized as Lab Skills I and II. Aligned classes teach similar skill sets and provide adequate hands-on lab hours to prepare students for entry-level employment. Alignment of biotechnology programs is 76 percent complete.
Ph
oto
Cre
dit
: Cu
yam
aca
Co
lleg
e
OCCUPATIONAL TRENDS IN LIFE SCIENCES/BIOTECHNOLOGY
Occupation2016 Jobs
Projected Change
ReplacementsTotal
OpeningsAnnual
Openings
Median Annual Wages
Sales Representatives, Wholesale/Mfg, Technical & Scientific Products
51,800 2,152 3,460 5,612 1,871 $78,790
Medical & Clinical Laboratory Technicians
19,262 1,267 1,443 2,710 903 $46,036
Biological Techs 13,367 650 1,155 1,805 602 $51,503
Medical & Clinical Laboratory Technologists
12,076 792 906 1,698 566 $83,064
Chemical Techs 6,275 226 575 801 267 $44,362
• Medical Laboratory Technology: These programs are 100 percent aligned to state and national licensures. CDPH/LFS (California Department of Public Health/Laboratory Field Services) and/or NAACLS (National Accrediting Agency for Clinical Laboratory Sciences) provides accreditation. CDPH also accredits programs that lead to licensure for HT-ASCP (Histotechnician - American Society of Clinical Pathology) certification.
• Third party credentialing in Quality to serve Advanced Manufacturing: An industry-recognized third party credential, the Certified Quality Improvement Associate (CQIA) Certification from the American Society for Quality (ASQ) requires two years of college or two years of work experience and successful completion of the certification exam. With assistance from the initiative, community colleges are developing the capacity to prepare students for the CQIA certification. The CQIA certification also prepares students for the Quality/Regulatory Registered Apprenticeship program recently funded through the Innovate Industry Apprenticeship Grant from the Chancellor’s Office.

Economic and Workforce Development Program Annual Report // Page 87
DATA SOURCES:
http://bit.ly/LA_health_services
http://www.calbiotechcareers.org/wp-content/uploads/2014/11/LS-Biotech-MIddle-Skills-Jobs-in-CA_Report_Oct-2014.pdf
LIFE SCIENCES / BIOTECHNOLOGY

Economic and Workforce Development Program Annual Report // Page 88

Economic and Workforce Development Program Annual Report // Page 89
RETAIL/HOSPITALITY/TOURISM
Ph
oto
Cre
dit
: San
Die
go
Co
nti
nu
ing
Ed
uca
tio
n
Sector HighlightsSector Navigator Philip Suttonwww.californiarht.com

Economic and Workforce Development Program Annual Report // Page 90
The retail, hospitality and tourism sector – with subsectors including food services, accommodation, activities/amusement and transportation – is vital for California, with 2017 expenditures projected to top $129 billion. California Community Colleges supports the sector with a full complement of work-ready certificates, credentials, and associate degrees in retail management, fashion design and merchandising, e-commerce, culinary arts, nutrition, restaurant and food services, travel services and tourism, hospitality, massage therapy, lodging management, resort operations and management, small business, entrepreneurship and more.
Additionally, the Retail/Hospitality/Tourism “Learn and Earn” Sector supports employers through specific programs teaching highly valued interpersonal and soft skills, advanced workplace skills, technical knowledge and industry-specific skills. Colleges benefit from collaboratives facilitated by the sector navigator and deputy sector navigators that support curriculum development, professional development and faculty training.

Economic and Workforce Development Program Annual Report // Page 91
Leisure and hospitality jobs account for about 12 percent of all wage and
salary jobs in California.
In 2015, there were 782,100 retail workers in the Los Angeles five-county area, an increase of 1.5 percent over 2014. Add in San Diego, and the total job count increases to more than 929,000. This equates to 10.5 percent of
all nonfarm payroll jobs in Southern California.
MILLIONLeisure and hospitality employment grew by 3 percent in 2016 to 1.9 million jobs. The sector added 55,300 jobs over the course of 2016.
12
1.9
+
%
929,000

Economic and Workforce Development Program Annual Report // Page 92
BEST PRACTICEBRIDGE PROGRAM: CAREER PATHWAY TRANSITION PARTNERSHIPS WITH ADULT SCHOOLS
In an effort to open retail, hospitality and tourism career opportunities to adult learners and help them transition into related college-level courses, Deputy Sector Navigator Andrea Vizenor partnered with Skyline College, the San Mateo Adult Education College and Career Leadership (ACCEL) consortium, and 20 industry representatives to develop a Bridge Program that includes:
• Hospitality ADVANCE, a 48-hour bridge training course consisting of 12 modules.
• Introduction to College, offered upon
completion of Hospitality ADVANCE, which includes a tour of Skyline College to learn about the many programs and services available.
• Internship and Workforce Readiness Training experience that embeds course work and experiences that allow students to earn 1.5 units of college credit and three industry-recognized credentials. Upon completion, students can apply for a paid six-week internship experience with Bon Appetit located on the Google corporate campus in Mountain View.
• Other pre-college and ESL (English as a second language) experiences to help alleviate transitioning from the Adult School to a college campus are also offered.
The Skyline College model is not only relevant to careers in retail, hospitality and tourism but can be adapted to the other priority sectors of the Doing What MATTERS for Jobs and the Economy framework. The model assists in addressing the Strong Workforce Program’s guiding recommendations for Career Pathways by “contextualizing workplace readiness skills into pathway curricula in collaboration with faculty” and “supporting the development of study tools for bridging from high school and adult education preparation into community college CTE pathways in order to help community college students plan their CTE course taking.”
OCCUPATIONAL TRENDS IN RETAIL/HOSPITALITY/TOURISM
Occupation2016 Jobs
Projected Change
ReplacementsTotal
OpeningsAnnual
Openings
Median Annual Wages
Recreation Workers 54,971 4,067 3,221 7,288 2,429 $26,271
Human Resources Specialists 61,498 2,204 4,823 7,027 2,342 $66,725
Administrative Services Managers 44,441 1,517 2,554 4,071 1,357 $92,257
Meeting, Convention & Event Planners
13,581 975 516 1,491 497 $50,554
Advertising & Promotions Managers
4,483 138 438 576 192 $92,265
Ph
oto
Cre
dit
: (to
p)
Fulle
rto
n C
olle
ge
, (b
ott
om
) Sa
n D
ieg
o C
ity
Co
lleg
e
Economic and Workforce Development Program Annual Report // Page 93
DATA SOURCES:
http://laedc.org/wp-content/uploads/2016/02/LAEDC-2016-2017-February-Forecast.pdf
http://www.calmis.ca.gov/file/lfmonth/Employment-Highlights.pdf
RETAIL/HOSPITALITY/TOURISM

Economic and Workforce Development Program Annual Report // Page 94

Economic and Workforce Development Program Annual Report // Page 95
SMALL BUSINESS
Ph
oto
Cre
dit
: Co
astl
ine
Co
mm
un
ity
Co
lleg
e
Sector HighlightsSector Navigator Charles Easonwww.smallbusinesssector.net
Economic and Workforce Development Program Annual Report // Page 96
Small business is the backbone of California’s economy. Using the Small Business Administration’s (SBA) definition of a small business (fewer than 500 employees), small businesses account for 80 percent of employment in California, with 70 percent of California businesses having fewer than five employees. According to the Bureau of Labor Statistics and a report from Intuit, by 2020, more than 40 percent of American workers, or 7.6 million people, will be own their own small business owners as freelancers, contractors and temp workers as part of the “gig economy.”
To help nurture the California entrepreneurial spirit and deliver a job-ready workforce to small businesses, the Small Business Sector Navigator and Deputy Sector Navigators work with experts from industry and education to develop contextualized training for incumbent workers and specialized entrepreneurship and small business curriculum that can be infused into existing California Community Colleges programs.

Economic and Workforce Development Program Annual Report // Page 97
California ranked 11th among the nation’s 25 largest states for
entrepreneurship growth in 2016.
48 percent of California small businesses remain in operation after five years.
48
In 2016, 7 percent of adult Californians operated their own small business, placing
it 9th of the 25 largest states.
11
7%
%
TH

Economic and Workforce Development Program Annual Report // Page 98
BEST PRACTICEVIRTUAL ENTERPRISE
The Small Business Sector provides support for Virtual Enterprise, an in-school, live, global business simulation that prepares high school students for college and career through project-based, collaborative learning and the development of 21st-century skills in entrepreneurship, global business, problem solving, communication, personal finance and technology.
Virtual Enterprise replicates all businesses functions in both structure and practice. Under the guidance of a teacher-facilitator and business mentors, students create and manage their virtual businesses from product development,
production and distribution, to marketing, sales, human resources, accounting/finance and web design.
Structured with the assistance of the California Community Colleges Small Business Sector, competitions require students to write business plans, develop market research strategies, create websites, pay wages and taxes, and sell their virtual services and products to each other using virtual bank accounts.
OCCUPATIONAL TRENDS IN SMALL BUSINESS
Occupation2016 Jobs
Projected Change
ReplacementsTotal
OpeningsAnnual
Openings
Median Annual Wages
Office Clerks, General 384,304 12,539 25,429 37,968 12,656 $33,177
First-Line Supervisors of Office & Administrative Support Workers
189,463 7,059 8,929 15,988 5,329 $56,997
Bookkeeping, Accounting & Auditing Clerks
212,104 (1,353) 6,284 6,284 2,095 $42,322
Payroll and Timekeeping Clerks 28,372 141 2,315 2,456 819 $45,719
Human Resources Assistants 18,398 362 633 995 332 $42,824
Ph
oto
Cre
dit
: Lo
ng
Be
ach
Cit
y C
olle
ge
“We were delighted to support this Virtual Enterprise Trade Show Competition. The
project-based model replicates the functions of real businesses and offers the soft-skill set
that business owners are looking for.”
Joe Molina, Small Business Deputy Sector Navigator for the San Diego Region

Economic and Workforce Development Program Annual Report // Page 99
DATA SOURCES:
http://www.kauffman.org/microsites/kauffman-index/rankings/state?Report=MainStreet&Indicator=LRank
http://www.kauffman.org/microsites/kauffman-index/rankings/state?Report=GrowthEntrepreneurship&Indicator=LRank
http://www.labormarketinfo.edd.ca.gov/LMID/Size_of_Business_Data_for_CA.html
California Employment Development Department (EDD)
http://investors.intuit.com/press-releases/press-release-details/2015/Intuit-Forecast-76-Million-People-in-On-Demand-Economy-by-2020/default.aspx
SMALL BUSINESS
Economic and Workforce Development Program Annual Report // Page 100
APPENDIX BECONOMIC & WORKFORCE DEVELOPMENT PROGRAM TEAM

Economic and Workforce Development Program Annual Report // Page 101
ECONOMIC AND WORKFORCE DEVELOPMENT PROGRAM TEAMCHANCELLOR'S OFFICE
Role Name Contact Info
Vice Chancellor, Workforce & Economic Development
Van Ton-Quinlivan
916.327.5492, [email protected] @WorkforceVan For Appointments: Faye James 916.323.4990, [email protected]
Dean, Career Education Practices
Dr. Debra Jones916.322.6972 [email protected]
Dean, Innovation and Quality Practices
Gary W. Adams916.322.7079 [email protected]
Dean Dr. Jeffrey A. Mrizek916.325.5935 [email protected]
Dean, Field Operations Dr. Matthew Roberts916.445.7692 [email protected]
Dean, Policy Alignment & Outreach
Javier Romero916.322.1677 [email protected]
Staff Services Manager Nita Patel916.327.6226 [email protected]
Visiting Faculty Dr. Lynn Shaw562.708.3803 [email protected]
Visiting Counselor Lynell Wiggins323.445.5940 [email protected]

Economic and Workforce Development Program Annual Report // Page 102
Sector Sector Navigator Macroregion Served Deputy Sector Navigators
Advanced Manufacturing
Jose Anaya310.973.3163 [email protected]
Region ANorthern InlandNorthern CoastalGreater Sacramento
Carol Pepper-Kittredge (Sacramento)[email protected]
Charlie Pooler(Northern Coastal, Northern Inland)[email protected]
Region BSF/San Mateo, East BaySilicon Valley, North BaySanta Cruz/Monterey
Mark [email protected]
Region CCentral Valley, Mother Lode
Gurminder [email protected]: @gurminder2014
Region DSouth Central Coast
Michael [email protected]
Region ESan Diego/Imperial
Trudy [email protected]
Region FInland Empire Desert
Alan [email protected]: @DSN_Alan
Region GLos AngelesOrange County
Ben Traina (Los Angeles)310.973.3170 [email protected]
Norma A. Alvarado (Orange County)[email protected]
INDUSTRY PRIORITY SECTORS, SECTOR NAVIGATORS AND DEPUTY SECTOR NAVIGATORS

Economic and Workforce Development Program Annual Report // Page 103
Sector Sector Navigator Macroregion Served Deputy Sector Navigators
Advanced Transportation & Renewables
Peter [email protected]
Region BSF/San Mateo, East BaySilicon Valley, North BaySanta Cruz/Monterey
Gerald W. [email protected]
Region ESan Diego / Imperial
Gregory M. [email protected]
Region FInland Empire Desert
Larry [email protected]
Region GLos AngelesOrange County
Jannet Malig562.860.2451 [email protected]
Agriculture, Water & Environmental Technologies
Nancy Gutierrez559.637.2530nancy.gutierrez@reedleycollege.educalagcc.org
Region ANorthern InlandNorthern CoastalGreater Sacramento
Heather Kelnhofer [email protected]
Carrie Petersoninterim through 7/1/2017530.668.2531 [email protected]
Julie Blacklock on leave through 7/1/[email protected]: @JulieBlacklock1
Region BSF/San Mateo, East BaySilicon Valley, North BaySanta Cruz/Monterey
David [email protected]
Region CCentral Valley, Mother Lode
Lori Marchy209.575.6449 [email protected]
Region DSouth Central Coast
Holly Nolan Chavez805.922.6966 [email protected]

Economic and Workforce Development Program Annual Report // Page 104
Sector Sector Navigator Macroregion Served Deputy Sector Navigators
Energy, Construction & Utilities
Jim Caldwell925.899.2665jcaldwell@workforceincubator.orgecusectordwm.com
Region ANorthern InlandNorthern CoastalGreater Sacramento
Prop 39 Project DirectorOrion [email protected]
Region BSF / San Mateo, East BaySilicon Valley, North BaySanta Cruz/Monterey
Jamie [email protected]
Prop 39 Project DirectorMark Williams925.858-5990 (cell) [email protected]
Region CCentral Valley, Mother Lode
Prop 39 Project DirectorDavid Teasdale661.477.5447 [email protected]
Region DSouth Central Coast
Prop 39 Project DirectorDavid Teasdale661.477.5447 [email protected]
Region ESan Diego/Imperial
Prop 39 Project DirectorJonathan Kropp619.660.4045 [email protected]
Region FInland Empire Desert
Prop 39 Project DirectorJon Caffery760.668.4370 (cell) [email protected]
Region GLos AngelesOrange County
Bruce Noble (Los Angeles)[email protected]
Len Pettis (Orange)[email protected]
Prop 39 Project DirectorChristie [email protected]
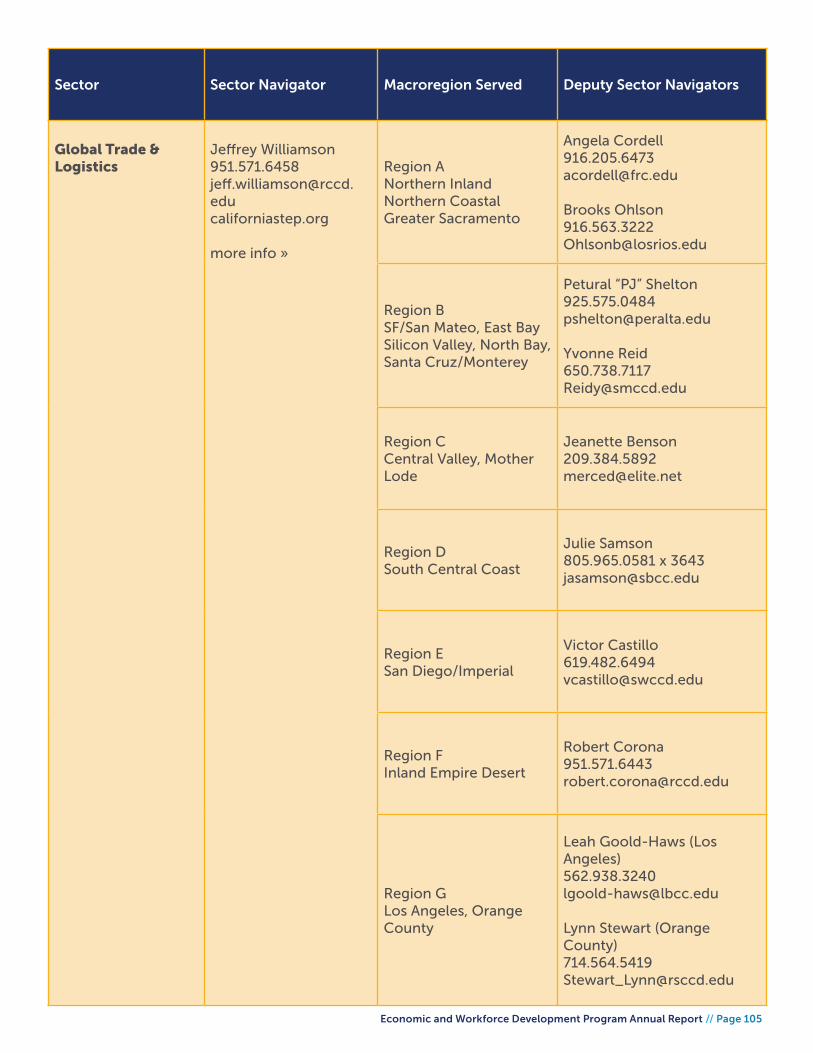
Economic and Workforce Development Program Annual Report // Page 105
Sector Sector Navigator Macroregion Served Deputy Sector Navigators
Global Trade & Logistics
Jeffrey [email protected]
more info »
Region ANorthern InlandNorthern CoastalGreater Sacramento
Angela [email protected]
Brooks [email protected]
Region BSF/San Mateo, East Bay Silicon Valley, North Bay, Santa Cruz/Monterey
Petural “PJ” [email protected]
Yvonne [email protected]
Region CCentral Valley, Mother Lode
Jeanette [email protected]
Region DSouth Central Coast
Julie Samson805.965.0581 x [email protected]
Region ESan Diego/Imperial
Victor [email protected]
Region FInland Empire Desert
Robert [email protected]
Region GLos Angeles, Orange County
Leah Goold-Haws (Los Angeles)[email protected]
Lynn Stewart (Orange County)[email protected]
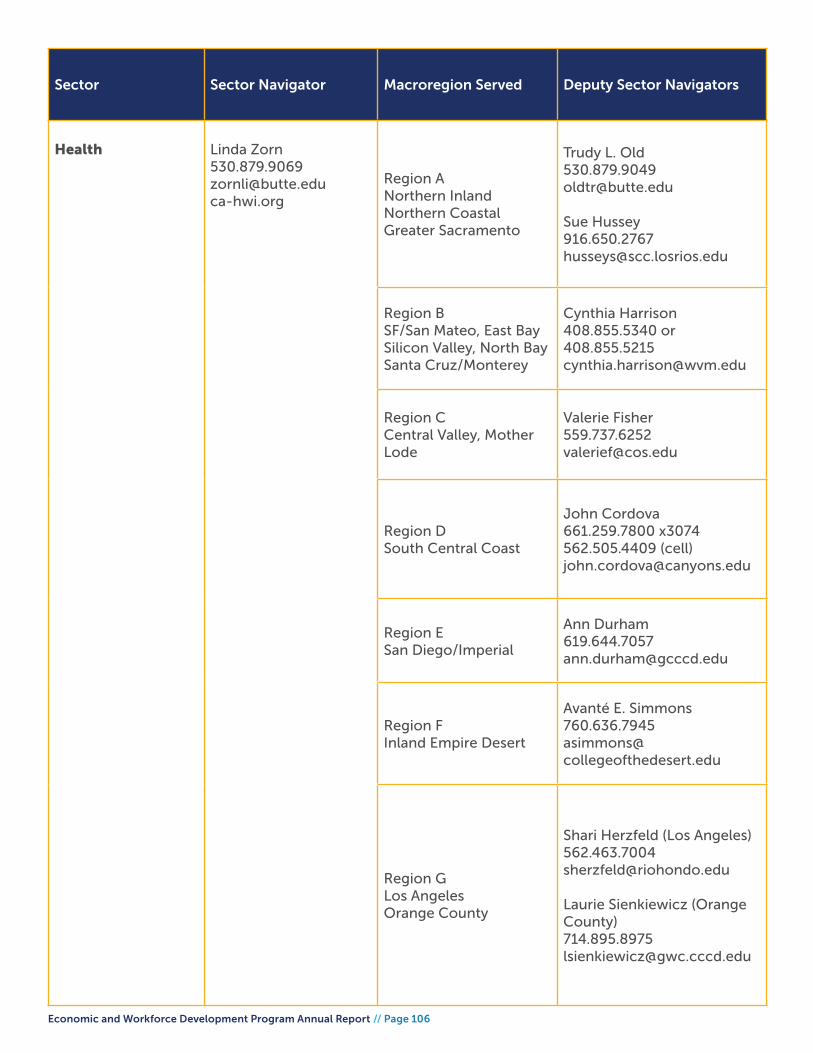
Economic and Workforce Development Program Annual Report // Page 106
Sector Sector Navigator Macroregion Served Deputy Sector Navigators
Health Linda [email protected]
Region ANorthern InlandNorthern CoastalGreater Sacramento
Trudy L. [email protected]
Sue Hussey916.650.2767 [email protected]
Region BSF/San Mateo, East BaySilicon Valley, North BaySanta Cruz/Monterey
Cynthia Harrison408.855.5340 or [email protected]
Region CCentral Valley, Mother Lode
Valerie [email protected]
Region DSouth Central Coast
John Cordova661.259.7800 x3074562.505.4409 (cell) [email protected]
Region ESan Diego/Imperial
Region FInland Empire Desert
Avanté E. [email protected]
Region GLos AngelesOrange County
Shari Herzfeld (Los Angeles)[email protected]
Laurie Sienkiewicz (Orange County)[email protected]
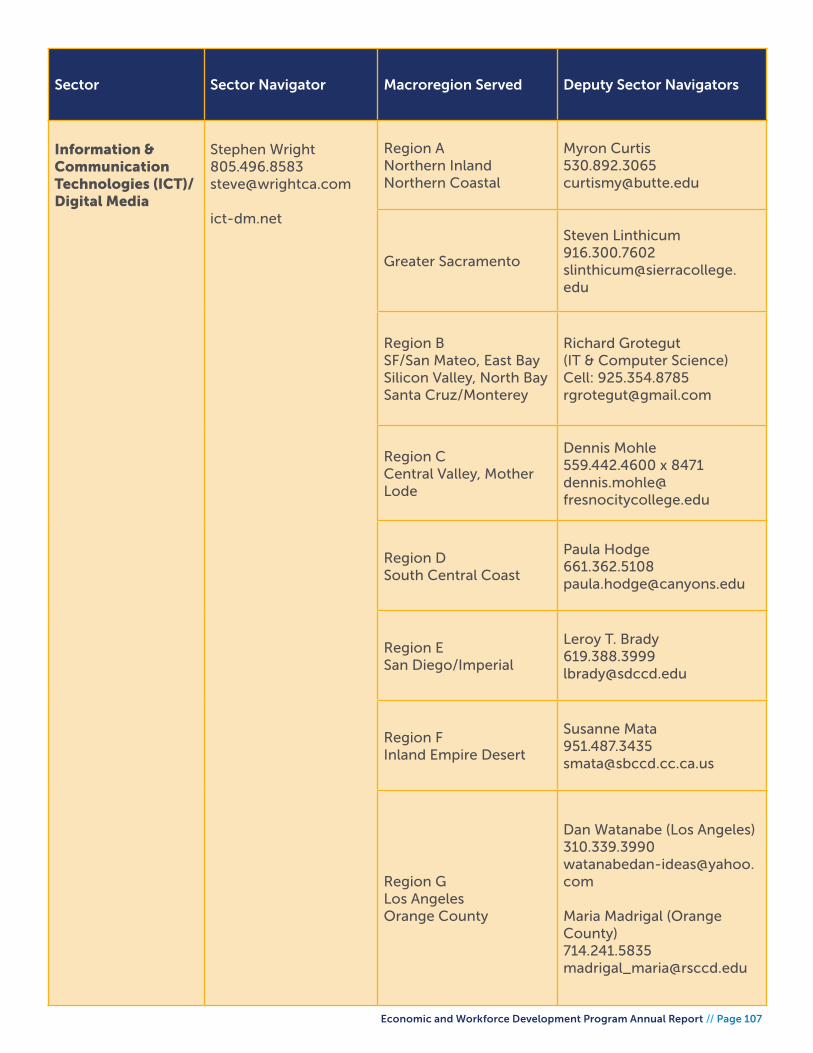
Economic and Workforce Development Program Annual Report // Page 107
Sector Sector Navigator Macroregion Served Deputy Sector Navigators
Information & Communication Technologies (ICT)/Digital Media
Stephen [email protected]
ict-dm.net
Region ANorthern InlandNorthern Coastal
Myron [email protected]
Greater Sacramento
Steven [email protected]
Region BSF/San Mateo, East BaySilicon Valley, North BaySanta Cruz/Monterey
Richard Grotegut(IT & Computer Science)Cell: [email protected]
Region CCentral Valley, Mother Lode
Dennis Mohle559.442.4600 x [email protected]
Region DSouth Central Coast
Paula [email protected]
Region ESan Diego/Imperial
Leroy T. [email protected]
Region FInland Empire Desert
Susanne [email protected]
Region GLos AngelesOrange County
Dan Watanabe (Los Angeles)[email protected]
Maria Madrigal (Orange County)[email protected]

Economic and Workforce Development Program Annual Report // Page 108
Sector Sector Navigator Macroregion Served Deputy Sector Navigators
Life Sciences/Biotech
Sandra Slivka619.388.7490 [email protected]: @CBiotechCareers
Region BSF/San Mateo, East BaySilicon Valley, North BaySanta Cruz/Monterey
Josie [email protected]
Region ESan Diego/Imperial
TBD - Sandra Slivka (Interim)619.388.7490 [email protected]
Retail/Hospitality/Tourism‘Learn and Earn’
Philip [email protected]
Region BSF/San Mateo, East BaySilicon Valley, North BaySanta Cruz/Monterey
Andrea Vizenor650.766.5060 (Cell)650.738.7124 (Office)[email protected]
Region CCentral Valley, Mother Lode
Shelley [email protected]
Region GLos AngelesOrange County
Ruth [email protected]

Economic and Workforce Development Program Annual Report // Page 109
Sector Sector Navigator Macroregion Served Deputy Sector Navigators
Small Business Charles [email protected]: @CharlesEason5smallbusinessbector.net
Region ANorthern InlandNorthern Coastal
Greater Sacramento
Rachelle [email protected]
Cornelius [email protected]
Region BSF/San Mateo, Silicon Valley, Santa Cruz / Monterey East Bay, North Bay
Gabriela [email protected]
Molly [email protected]
Region CCentral Valley, Mother Lode
Indria Gillespie209.954.5069 Office209.481.9605 [email protected]: @CentralVlyBiz
Region DSouth Central Coast
Gayla [email protected]
Region ESan Diego/Imperial
Region FInland Empire Desert
Lisa [email protected]
Region GLos AngelesOrange County
Doris Driver (Los Angeles)[email protected]
Elizabeth Arteaga (Orange County)[email protected]

Economic and Workforce Development Program Annual Report // Page 110
MacroregionRegional ConsortiaChair/Vice Chair
Regional TA Provider: Centers of Excellencefor Labor Market Research
Community College CEO Serving as Regional Liaison
Regional TA Provider:K-14 Pathways (formerly SB1070 Directors)
Region ANorthern Inland, Northern Coastal, Greater Sacramento
Regional Consortia Website:http://nfnrc.org/
Interim Co-Chair: Tessa [email protected]
Co-Chair: Jamey Nye916.563.3207 [email protected]
Aaron [email protected]
Doug Houston
Tanya Meyer530.283.0202 [email protected]
Teri Munger916.484.8021 [email protected]
Region BSF/San Mateo, East Bay,Silicon Valley, North Bay,Santa Cruz/Monterey Regional Consortia Website: http://baccc.net
Chair: Rock [email protected]
Director: Kit O’[email protected]
John Carrese415.452.5529 [email protected]
Judy Miner
Northeast BayJanine [email protected]
Southwest BayDr. Sharon [email protected]
Region CCentral Valley, Mother Lode
Regional Consortia Website: crconsortium.com
Chair: Karri [email protected]
Nora [email protected]
Carole GoldsmithLeticia [email protected]
Region DSouth Central Coast
Regional Consortia Website:http://sccrcolleges.org/
Chair: Luann [email protected]
Co-Chair: Diane [email protected]
Laura [email protected]
Dianne Van HookKaren [email protected]
REGIONAL CONSORTIA
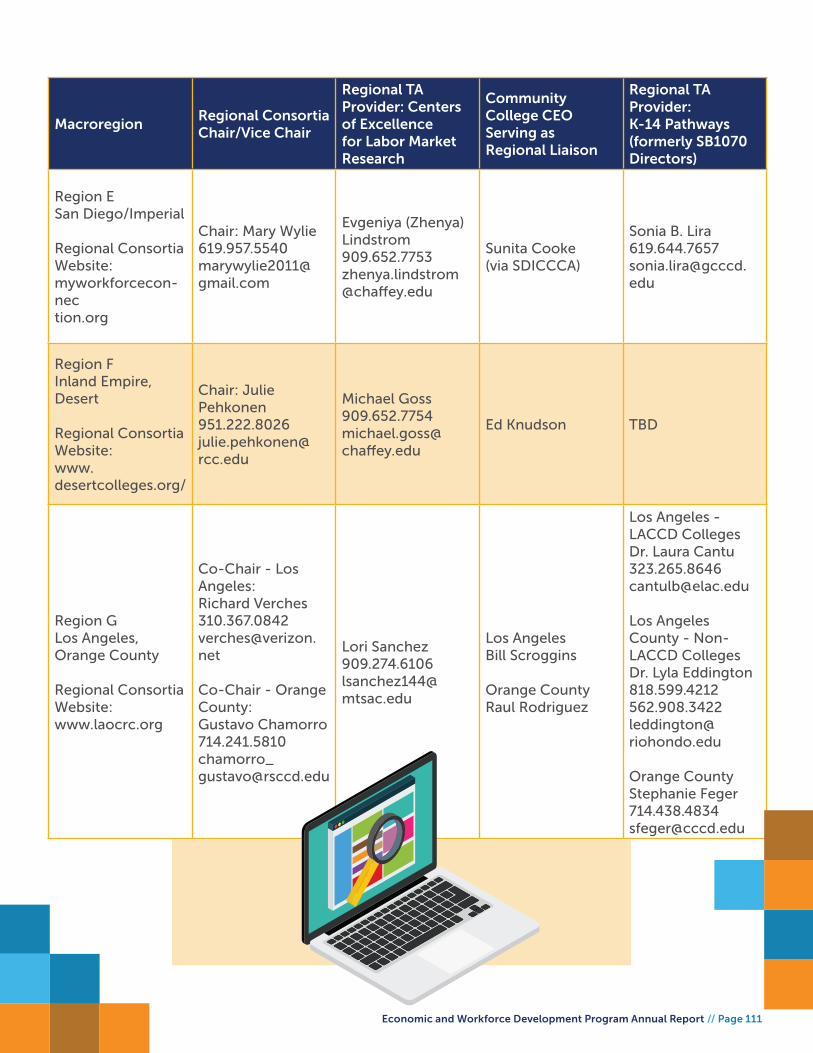
Economic and Workforce Development Program Annual Report // Page 111
MacroregionRegional ConsortiaChair/Vice Chair
Regional TA Provider: Centers of Excellencefor Labor Market Research
Community College CEO Serving as Regional Liaison
Regional TA Provider:K-14 Pathways (formerly SB1070 Directors)
Region ESan Diego/Imperial Regional Consortia Website:myworkforcecon-nection.org
Chair: Mary [email protected]
Evgeniya (Zhenya) Lindstrom909.652.7753 [email protected]
Sunita Cooke(via SDICCCA)
Sonia B. [email protected]
Region FInland Empire, Desert
Regional Consortia Website:www.desertcolleges.org/
Chair: Julie [email protected]
Michael [email protected]
Ed Knudson TBD
Region GLos Angeles,Orange County
Regional Consortia Website:www.laocrc.org
Co-Chair - Los Angeles: Richard [email protected] Co-Chair - Orange County: Gustavo [email protected]
Lori [email protected]
Los AngelesBill Scroggins
Orange CountyRaul Rodriguez
Los Angeles - LACCD CollegesDr. Laura [email protected]
Los Angeles County - Non-LACCD CollegesDr. Lyla [email protected]
Orange CountyStephanie [email protected]
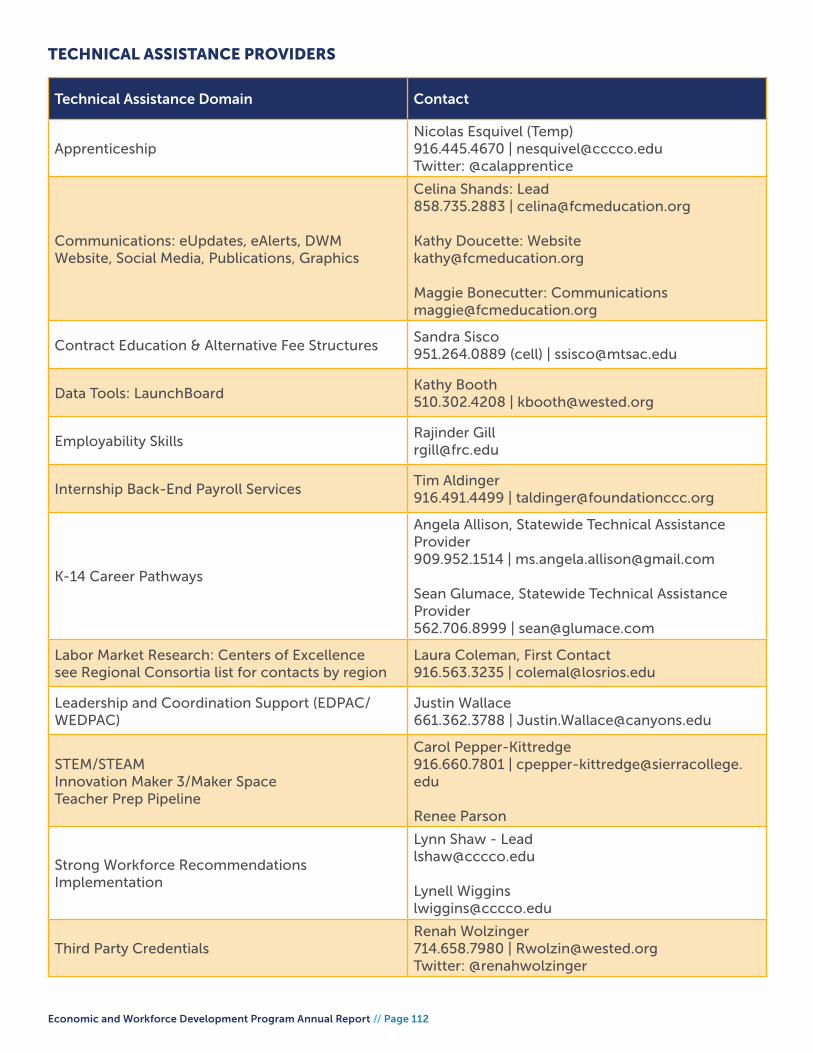
Economic and Workforce Development Program Annual Report // Page 112
Technical Assistance Domain Contact
ApprenticeshipNicolas Esquivel (Temp)916.445.4670 | [email protected]: @calapprentice
Communications: eUpdates, eAlerts, DWM Website, Social Media, Publications, Graphics
Celina Shands: Lead858.735.2883 | [email protected]
Kathy Doucette: [email protected]
Maggie Bonecutter: [email protected]
Contract Education & Alternative Fee StructuresSandra Sisco951.264.0889 (cell) | [email protected]
Data Tools: LaunchBoardKathy Booth510.302.4208 | [email protected]
Employability SkillsRajinder [email protected]
Internship Back-End Payroll ServicesTim Aldinger916.491.4499 | [email protected]
K-14 Career Pathways
Angela Allison, Statewide Technical Assistance Provider 909.952.1514 | [email protected]
Sean Glumace, Statewide Technical Assistance Provider 562.706.8999 | [email protected]
Labor Market Research: Centers of Excellencesee Regional Consortia list for contacts by region
Laura Coleman, First Contact916.563.3235 | [email protected]
Leadership and Coordination Support (EDPAC/WEDPAC)
Justin Wallace661.362.3788 | [email protected]
STEM/STEAMInnovation Maker 3/Maker SpaceTeacher Prep Pipeline
Carol Pepper-Kittredge 916.660.7801 | [email protected]
Renee Parson
Strong Workforce Recommendations Implementation
Lynn Shaw - [email protected]
Lynell [email protected]
Third Party CredentialsRenah Wolzinger714.658.7980 | [email protected]: @renahwolzinger
TECHNICAL ASSISTANCE PROVIDERS
Economic and Workforce Development Program Annual Report // Page 113
Ph
oto
Cre
dit
: Mt.
San
An
ton
io C
olle
ge

Economic and Workforce Development Program Annual Report // Page 114
APPENDIX CWEDPAC/EDPAC/STRONG WORKFORCE IMPLEMENTATION ADVISORY
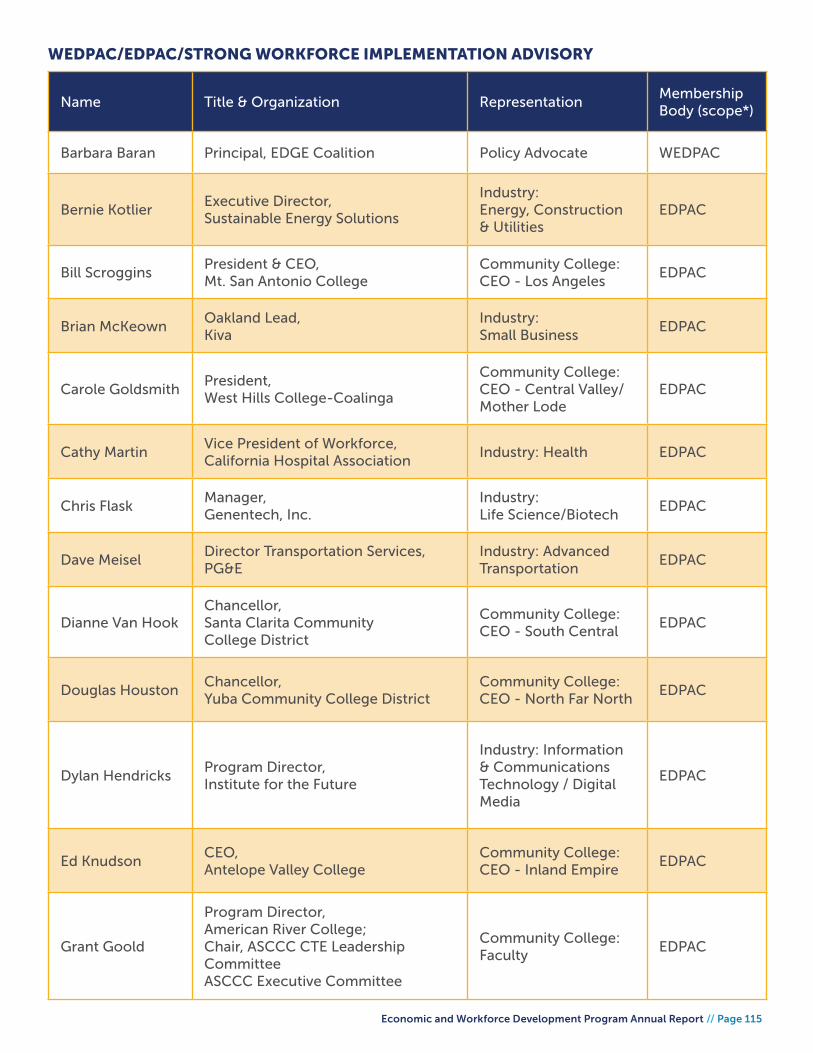
Economic and Workforce Development Program Annual Report // Page 115
WEDPAC/EDPAC/STRONG WORKFORCE IMPLEMENTATION ADVISORY
Name Title & Organization RepresentationMembership Body (scope*)
Barbara Baran Principal, EDGE Coalition Policy Advocate WEDPAC
Bernie KotlierExecutive Director,Sustainable Energy Solutions
Industry: Energy, Construction & Utilities
EDPAC
Bill ScrogginsPresident & CEO, Mt. San Antonio College
Community College: CEO - Los Angeles
EDPAC
Brian McKeownOakland Lead,Kiva
Industry: Small Business
EDPAC
Carole GoldsmithPresident,West Hills College-Coalinga
Community College:CEO - Central Valley/Mother Lode
EDPAC
Cathy MartinVice President of Workforce,California Hospital Association
Industry: Health EDPAC
Chris FlaskManager,Genentech, Inc.
Industry: Life Science/Biotech
EDPAC
Dave MeiselDirector Transportation Services,PG&E
Industry: Advanced Transportation
EDPAC
Dianne Van HookChancellor, Santa Clarita Community College District
Community College: CEO - South Central
EDPAC
Douglas HoustonChancellor,Yuba Community College District
Community College:CEO - North Far North
EDPAC
Dylan HendricksProgram Director,Institute for the Future
Industry: Information & Communications Technology / Digital Media
EDPAC
Ed KnudsonCEO,Antelope Valley College
Community College:CEO - Inland Empire
EDPAC
Grant Goold
Program Director,American River College; Chair, ASCCC CTE Leadership CommitteeASCCC Executive Committee
Community College: Faculty
EDPAC

Economic and Workforce Development Program Annual Report // Page 116
Name Title & Organization RepresentationMembership Body (scope*)
Gregory Anderson
Vice President of Instruction,Cañada College
Community College: Chief Instructional Officer
WEDPAC
Greg PetersonVice President, Student Support Services,Long Beach City College
Community College: Student Support Services
WEDPAC
Gustavo HerreraWestern Regional Director,Young Invincibles
Policy Advocate WEDPAC
Jack Buckhorn Business Manager, IBEW Local 551 Labor WEDPAC
James LanichPresident & CEO, Educational Results Partnership
STEM WEDPAC
James MayerPresident & CEO, CAFWD
Economic Development
EDPAC
Jamey NyeCTE Regional Consortia Co-Chair - North Far North Region, Doing What MATTERS for Jobs & the Economy
Community College:DWM CTE Regional Consortia
WEDPAC
Jessica Garcia-Kohl
Vice President of City Development,LRNG
WEDPAC
Jim Caldwell
Statewide Sector Navigator for Energy, Construction & Utilities,Doing What MATTERS for Jobs & the Economy
Community College:DWM Sector Navigator
WEDPAC
John Stanskas Vice President, San Bernardino Valley College
Community College:Statewide Academic Senate
WEDPAC
Joyce JohnsonDean, Career Technical Education / Nursing & Allied Health, Mt. San Jacinto College
Community College: CTE Dean
WEDPAC
Judy MinerChancellor,Foothill-DeAnza Community College District
Community College:CEO - Bay Region
EDPAC
Keerthana Muthukrishnan
System Affairs Director, Region IVCommunity College: Student Senate
EDPAC
Leigh-Anne Elizondo
Interim Lead Interpreter, Ohlone College
Community College: Classified
EDPAC
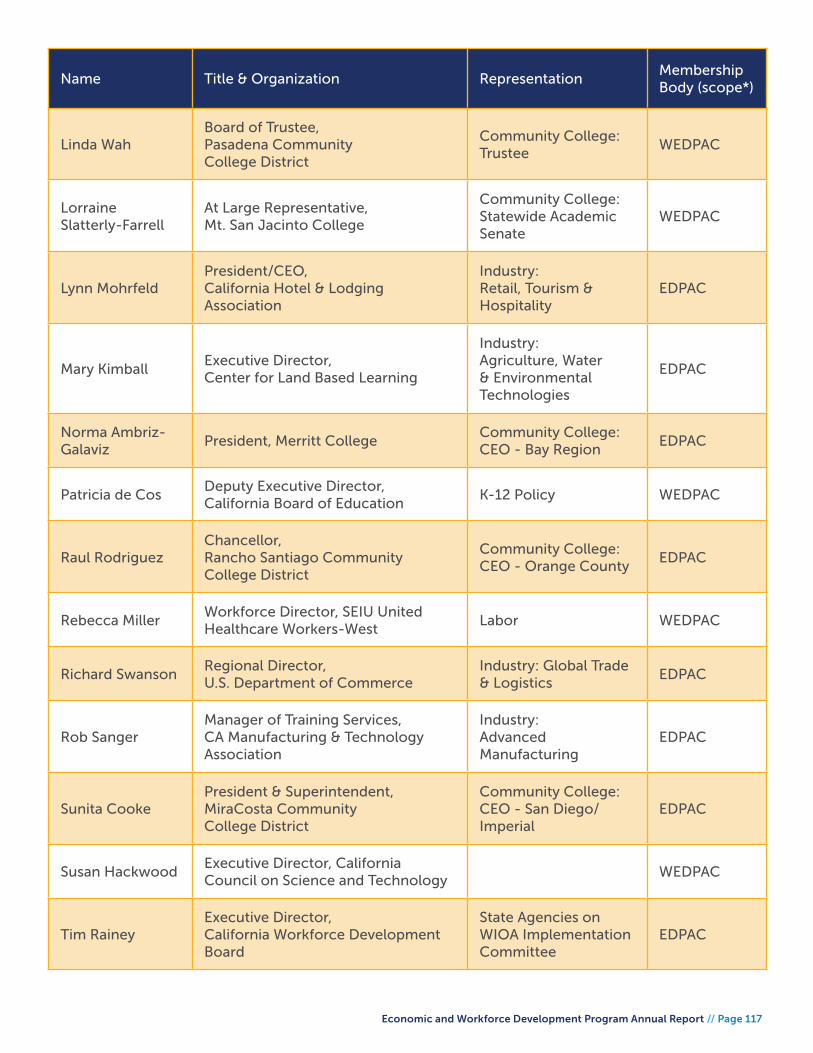
Economic and Workforce Development Program Annual Report // Page 117
Name Title & Organization RepresentationMembership Body (scope*)
Linda WahBoard of Trustee,Pasadena Community College District
Community College:Trustee
WEDPAC
Lorraine Slatterly-Farrell
At Large Representative,Mt. San Jacinto College
Community College: Statewide Academic Senate
WEDPAC
Lynn MohrfeldPresident/CEO,California Hotel & Lodging Association
Industry: Retail, Tourism & Hospitality
EDPAC
Mary KimballExecutive Director,Center for Land Based Learning
Industry: Agriculture, Water & Environmental Technologies
EDPAC
Norma Ambriz-Galaviz
President, Merritt CollegeCommunity College:CEO - Bay Region
EDPAC
Patricia de CosDeputy Executive Director, California Board of Education
K-12 Policy WEDPAC
Raul RodriguezChancellor,Rancho Santiago Community College District
Community College: CEO - Orange County
EDPAC
Rebecca MillerWorkforce Director, SEIU United Healthcare Workers-West
Labor WEDPAC
Richard SwansonRegional Director,U.S. Department of Commerce
Industry: Global Trade & Logistics
EDPAC
Rob SangerManager of Training Services,CA Manufacturing & Technology Association
Industry: Advanced Manufacturing
EDPAC
Sunita CookePresident & Superintendent,MiraCosta Community College District
Community College:CEO - San Diego/Imperial
EDPAC
Susan HackwoodExecutive Director, California Council on Science and Technology
WEDPAC
Tim RaineyExecutive Director,California Workforce Development Board
State Agencies on WIOA Implementation Committee
EDPAC

Economic and Workforce Development Program Annual Report // Page 118
Back Cover Photo Credits: (left
to right, top to bottom) De Anza
College, American River College,
West Hills College Coalinga, Santa
Rosa Junior College, San Diego
Continuing Education, American
River College, Fullerton College,
Sacramento City College, Crafton
Hills College, Diablo Valley College,
San Diego Mesa College

Economic and Workforce Development Program Annual Report // Page 119