2017 COURT ACCESS & FAIRNESS SURVEY REPORT · 2017 Court Access & Fairness Survey Report ... in...
72
2017 COURT ACCESS & FAIRNESS SURVEY REPORT Maine Statistical Analysis Center Muskie School of Public Service University of Southern Maine
Transcript of 2017 COURT ACCESS & FAIRNESS SURVEY REPORT · 2017 Court Access & Fairness Survey Report ... in...

2017 COURT ACCESS &
FAIRNESS SURVEY REPORT
Maine Statistical Analysis Center
Muskie School of Public Service
University of Southern Maine
ACKNOWLEDGMENTS
USM Muskie School of Public Service
Authors Maine Statistical Analysis Center
Robyn Dumont, Research Analyst George Shaler, Senior Research Associate
Research Assistance Erika Arthur, Research Assistant
Survey Administration Al Leighton and Staff, Survey Research Center
Graphics, Layout, and Design Sheryl Moulton, Project Assistant
Peer Review Laura M. O’Hanlon, Maine Judicial Branch
Contents Executive Summary ............................................................................................................................................................ 1
Introduction ......................................................................................................................................................................... 3
Methodology & Limitations .............................................................................................................................................. 5
Findings ................................................................................................................................................................................ 8
Participant Description ................................................................................................................................................. 8
Court Activities ........................................................................................................................................................... 8
Type of Court Case ..................................................................................................................................................... 9
Race/Ethnicity ........................................................................................................................................................... 10
Attorney Representation ........................................................................................................................................... 11
Frequency of Court Visits ........................................................................................................................................ 12
Gender......................................................................................................................................................................... 13
Court Region............................................................................................................................................................... 14
Access ............................................................................................................................................................................. 15
Access by Participant and Court Characteristics ................................................................................................ 16
Individual Facets of Court Access ......................................................................................................................... 22
Fairness .......................................................................................................................................................................... 46
Fairness by Participant/Court Characteristics ................................................................................................... 47
Individual Facets of Fairness .................................................................................................................................. 51
Comparison With Other States .................................................................................................................................. 62
Conclusion ......................................................................................................................................................................... 63
Access ........................................................................................................................................................................ 63
Fairness ..................................................................................................................................................................... 63
Appendix ............................................................................................................................................................................ 65

(this page intentionally left blank)
2017
Cou
rt A
cces
s & F
airn
ess
Surv
ey R
epor
t
1
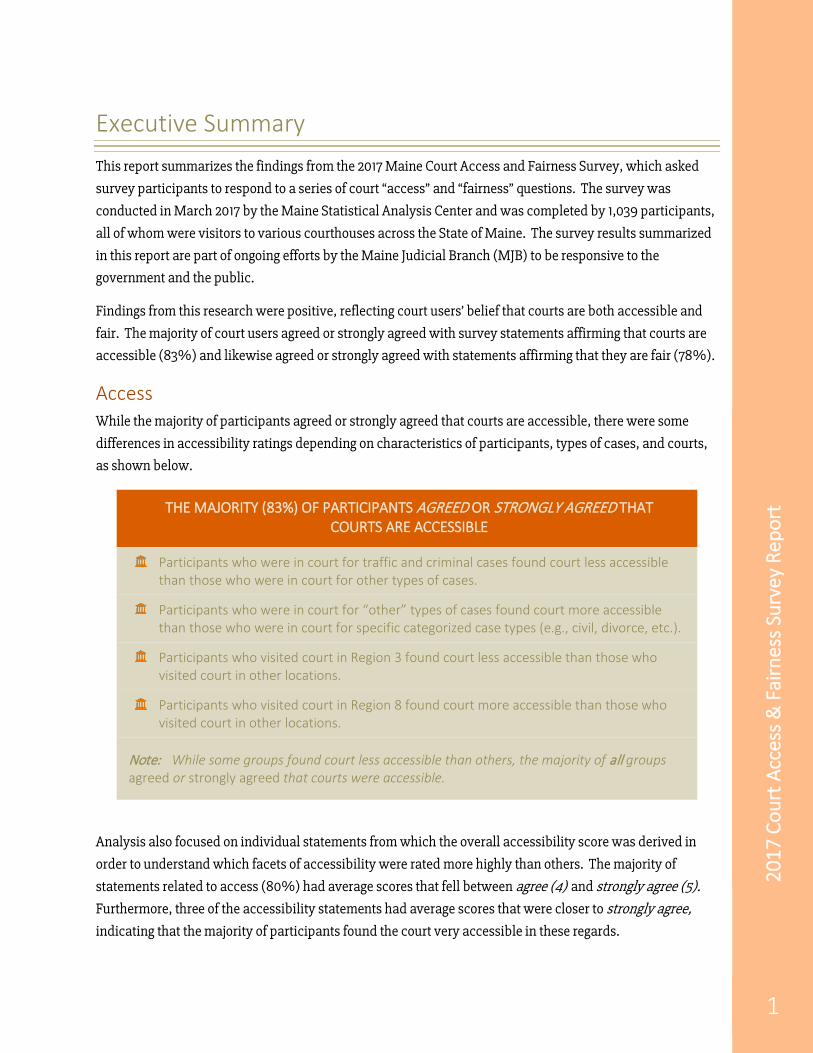
Executive Summary This report summarizes the findings from the 2017 Maine Court Access and Fairness Survey, which asked
survey participants to respond to a series of court “access” and “fairness” questions. The survey was
conducted in March 2017 by the Maine Statistical Analysis Center and was completed by 1,039 participants,
all of whom were visitors to various courthouses across the State of Maine. The survey results summarized
in this report are part of ongoing efforts by the Maine Judicial Branch (MJB) to be responsive to the
government and the public.
Findings from this research were positive, reflecting court users’ belief that courts are both accessible and
fair. The majority of court users agreed or strongly agreed with survey statements affirming that courts are
accessible (83%) and likewise agreed or strongly agreed with statements affirming that they are fair (78%).
Access While the majority of participants agreed or strongly agreed that courts are accessible, there were some
differences in accessibility ratings depending on characteristics of participants, types of cases, and courts,
as shown below.
THE MAJORITY (83%) OF PARTICIPANTS AGREED OR STRONGLY AGREED THAT COURTS ARE ACCESSIBLE
Participants who were in court for traffic and criminal cases found court less accessible than those who were in court for other types of cases.
Participants who were in court for “other” types of cases found court more accessible than those who were in court for specific categorized case types (e.g., civil, divorce, etc.).
Participants who visited court in Region 3 found court less accessible than those who visited court in other locations.
Participants who visited court in Region 8 found court more accessible than those who visited court in other locations.
Note: While some groups found court less accessible than others, the majority of all groups agreed or strongly agreed that courts were accessible.
Analysis also focused on individual statements from which the overall accessibility score was derived in
order to understand which facets of accessibility were rated more highly than others. The majority of
statements related to access (80%) had average scores that fell between agree (4) and strongly agree (5).
Furthermore, three of the accessibility statements had average scores that were closer to strongly agree,
indicating that the majority of participants found the court very accessible in these regards.
2017
Cou
rt A
cces
s & F
airn
ess
Surv
ey R
epor
t
2
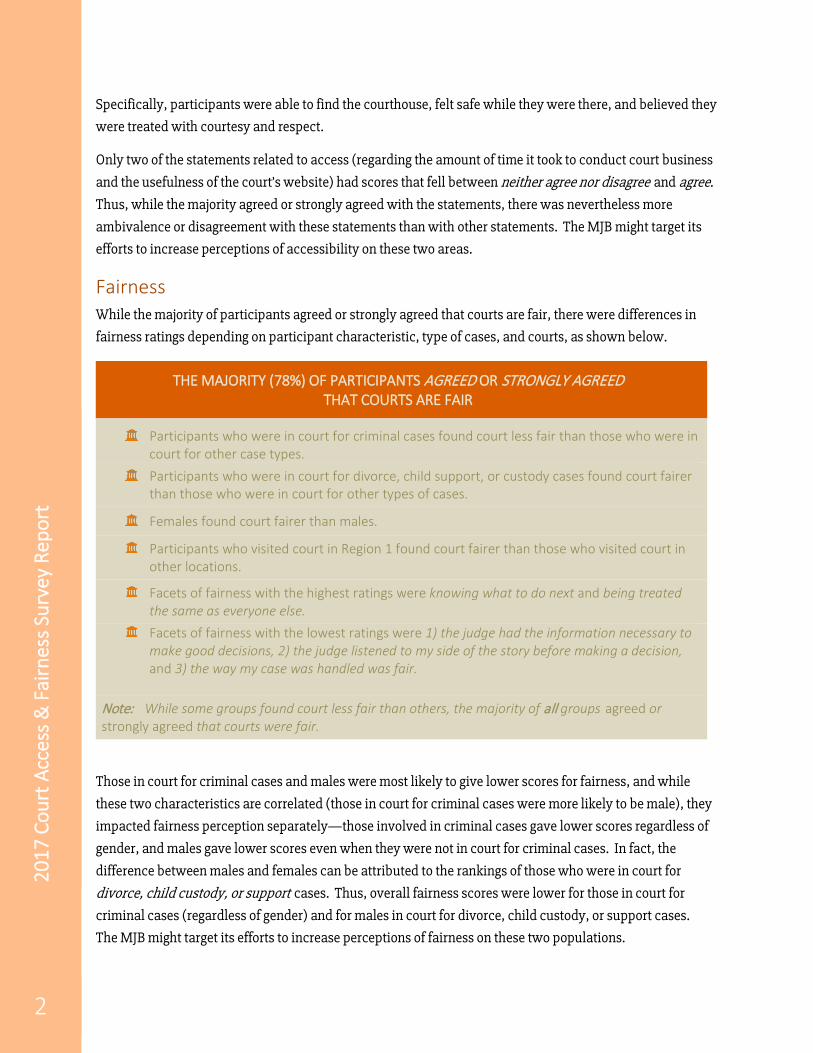
Specifically, participants were able to find the courthouse, felt safe while they were there, and believed they
were treated with courtesy and respect.
Only two of the statements related to access (regarding the amount of time it took to conduct court business
and the usefulness of the court’s website) had scores that fell between neither agree nor disagree and agree.
Thus, while the majority agreed or strongly agreed with the statements, there was nevertheless more
ambivalence or disagreement with these statements than with other statements. The MJB might target its
efforts to increase perceptions of accessibility on these two areas.
Fairness While the majority of participants agreed or strongly agreed that courts are fair, there were differences in
fairness ratings depending on participant characteristic, type of cases, and courts, as shown below.
THE MAJORITY (78%) OF PARTICIPANTS AGREED OR STRONGLY AGREED THAT COURTS ARE FAIR
Participants who were in court for criminal cases found court less fair than those who were in court for other case types.
Participants who were in court for divorce, child support, or custody cases found court fairer than those who were in court for other types of cases.
Females found court fairer than males.
Participants who visited court in Region 1 found court fairer than those who visited court in other locations.
Facets of fairness with the highest ratings were knowing what to do next and being treated the same as everyone else.
Facets of fairness with the lowest ratings were 1) the judge had the information necessary to make good decisions, 2) the judge listened to my side of the story before making a decision, and 3) the way my case was handled was fair.
Note: While some groups found court less fair than others, the majority of all groups agreed or strongly agreed that courts were fair.
Those in court for criminal cases and males were most likely to give lower scores for fairness, and while
these two characteristics are correlated (those in court for criminal cases were more likely to be male), they
impacted fairness perception separately—those involved in criminal cases gave lower scores regardless of
gender, and males gave lower scores even when they were not in court for criminal cases. In fact, the
difference between males and females can be attributed to the rankings of those who were in court for
divorce, child custody, or support cases. Thus, overall fairness scores were lower for those in court for
criminal cases (regardless of gender) and for males in court for divorce, child custody, or support cases.
The MJB might target its efforts to increase perceptions of fairness on these two populations.
2017
Cou
rt A
cces
s & F
airn
ess
Surv
ey R
epor
t
3
Introduction This report summarizes the findings from the 2017 Maine Court Access and Fairness Survey. This survey
and subsequent analysis were performed by the Maine Statistical Analysis Center (SAC), located at the
Muskie School of Public Service, University of Southern Maine, at the request of the Maine Judicial Branch
(MJB). The objective of this research was to measure the attitudes of Maine state court users regarding the
accessibility and fairness of the courts they visited.
The MJB consists primarily of the Supreme Judicial Court, the Superior Court, and the District Court.1 Each
of these courts has a different function within the judicial system. The District Court has jurisdiction over
family law matters, civil cases, and non-felony criminal cases, all of which are decided by a judge rather
than a jury. The Superior Court has jurisdiction over all felony cases as well as misdemeanor and civil cases
in which the defendant has requested a jury trial. District and Superior Court judges and justices share
responsibility for and resolve all criminal matters within the Unified Criminal Docket. The Supreme Judicial
Court addresses questions of law arising from civil action and criminal trials as well as hearing appeals from
trial courts. Maine’s court system is composed of eight judicial regions, each containing between one and
four counties.2 There are a number of court locations within each region, some of which house both
Superior and District Courts or consolidated trial courts.
State of Maine Judicial Branch Mission:
The MJB has embraced performance measurement as a means of demonstrating to the state’s legislative and
executive branches that it is responsive to the needs of the courts’ users. Additionally, performance
measures provide the MJB with valuable feedback regarding what the state’s courts are doing well and what
areas need improvement. In recent years, the Judicial Branch has engaged in several process improvement
efforts to enhance the performance of the court system. Among these efforts has been the development of a
business and consumer docket and a unified criminal docket. Recently, the MJB selected a vendor to
develop a new electronic case management and e-filing system that will greatly improve case and
information management. In addition, the MJB is exploring new civil filing protocols designed to increase
efficiency in the processing and disposition of civil cases.
1 In addition, the Maine Judicial Branch has a number of drug treatment courts, a co-occuring disorder court, business and
consumer court, small claims court, Unified Criminal Docket, and other judicial services. 2 Region 1: York; Region 2: Cumberland; Region 3: Androscoggin, Franklin, and Oxford; Region 4: Kennebec and Somerset;
Region 5: Penobscot and Piscataquis; Region 6: Knox, Lincoln, Sagadahoc, and Waldo; Region 7: Hancock and Washington; Region 8: Aroostook
To administer justice by providing a safe, accessible, efficient and
impartial system of dispute resolution that serves the public interest,
protects individual rights, and instills respect for the law

2017
Cou
rt A
cces
s & F
airn
ess
Surv
ey R
epor
t
4
The survey results summarized in this report are part of the MJB’s ongoing effort to solicit feedback from
those who have had contact with the state court system to find additional ways in which the MJB can
provide better public service. While winning a court case may be important to those involved in judicial
disputes, research demonstrates that positive perceptions of court experiences are more influenced by the
treatment participants experience in court and their perceptions of fairness.3 Feedback related to access
and fairness is particularly valuable to the court system, given its mission statement “to administer justice
by providing a safe, accessible, efficient and impartial system of dispute resolution that serves the public
interest, protects individual rights, and instills respect for the law.”
3 National Center for State Courts, CourTools, Access and Fairness. Retrieved from
http://www.courtools.org/~/media/Microsites/Files/CourTools/courtools_Trial_measure1_access_and_fairness.ashx
2017
Cou
rt A
cces
s & F
airn
ess
Surv
ey R
epor
t
5
Methodology & Limitations In 2015, MJB Court Management convened an internal stakeholder group (consisting of employees from
operations, the marshal service, facilities, and data and information units) to consider ways to obtain
feedback from the public. This group determined that the National Center for State Courts (NCSC)
CourTools Access and Fairness Survey would work well in Maine. The NCSC works with court systems
throughout the United States and understands the elements of an effective court system.
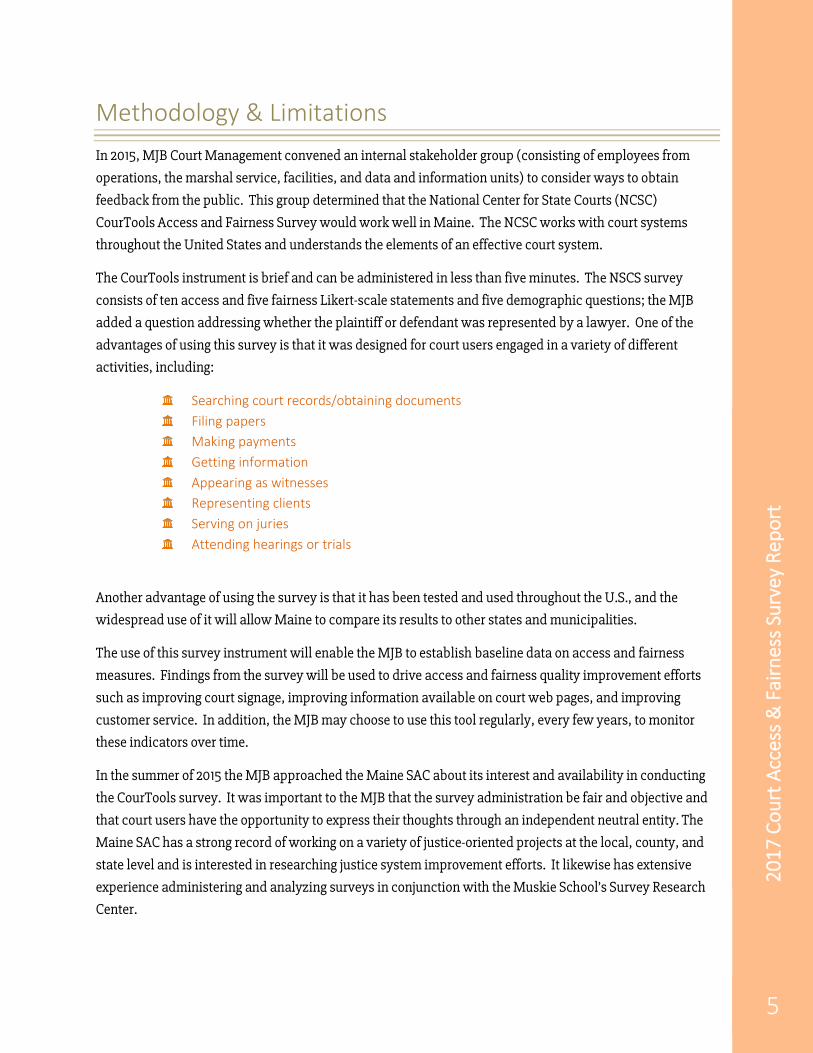
The CourTools instrument is brief and can be administered in less than five minutes. The NSCS survey
consists of ten access and five fairness Likert-scale statements and five demographic questions; the MJB
added a question addressing whether the plaintiff or defendant was represented by a lawyer. One of the
advantages of using this survey is that it was designed for court users engaged in a variety of different
activities, including:
Searching court records/obtaining documents Filing papers Making payments Getting information Appearing as witnesses Representing clients Serving on juries Attending hearings or trials
Another advantage of using the survey is that it has been tested and used throughout the U.S., and the
widespread use of it will allow Maine to compare its results to other states and municipalities.
The use of this survey instrument will enable the MJB to establish baseline data on access and fairness
measures. Findings from the survey will be used to drive access and fairness quality improvement efforts
such as improving court signage, improving information available on court web pages, and improving
customer service. In addition, the MJB may choose to use this tool regularly, every few years, to monitor
these indicators over time.
In the summer of 2015 the MJB approached the Maine SAC about its interest and availability in conducting
the CourTools survey. It was important to the MJB that the survey administration be fair and objective and
that court users have the opportunity to express their thoughts through an independent neutral entity. The
Maine SAC has a strong record of working on a variety of justice-oriented projects at the local, county, and
state level and is interested in researching justice system improvement efforts. It likewise has extensive
experience administering and analyzing surveys in conjunction with the Muskie School’s Survey Research
Center.
2017
Cou
rt A
cces
s & F
airn
ess
Surv
ey R
epor
t
6
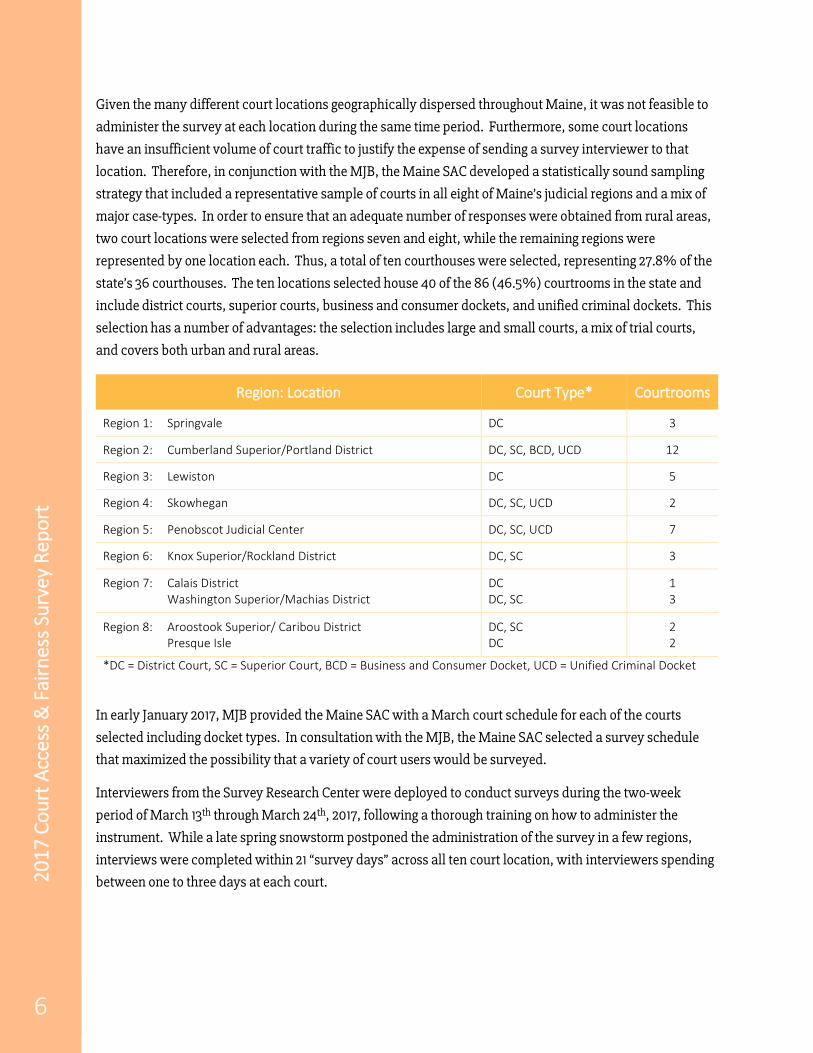
Given the many different court locations geographically dispersed throughout Maine, it was not feasible to
administer the survey at each location during the same time period. Furthermore, some court locations
have an insufficient volume of court traffic to justify the expense of sending a survey interviewer to that
location. Therefore, in conjunction with the MJB, the Maine SAC developed a statistically sound sampling
strategy that included a representative sample of courts in all eight of Maine’s judicial regions and a mix of
major case-types. In order to ensure that an adequate number of responses were obtained from rural areas,
two court locations were selected from regions seven and eight, while the remaining regions were
represented by one location each. Thus, a total of ten courthouses were selected, representing 27.8% of the
state’s 36 courthouses. The ten locations selected house 40 of the 86 (46.5%) courtrooms in the state and
include district courts, superior courts, business and consumer dockets, and unified criminal dockets. This
selection has a number of advantages: the selection includes large and small courts, a mix of trial courts,
and covers both urban and rural areas.
Region: Location Court Type* Courtrooms
Region 1: Springvale DC 3
Region 2: Cumberland Superior/Portland District DC, SC, BCD, UCD 12
Region 3: Lewiston DC 5
Region 4: Skowhegan DC, SC, UCD 2
Region 5: Penobscot Judicial Center DC, SC, UCD 7
Region 6: Knox Superior/Rockland District DC, SC 3
Region 7: Calais District Washington Superior/Machias District
DC DC, SC
1 3
Region 8: Aroostook Superior/ Caribou District Presque Isle
DC, SC DC
2 2
*DC = District Court, SC = Superior Court, BCD = Business and Consumer Docket, UCD = Unified Criminal Docket
In early January 2017, MJB provided the Maine SAC with a March court schedule for each of the courts
selected including docket types. In consultation with the MJB, the Maine SAC selected a survey schedule
that maximized the possibility that a variety of court users would be surveyed.
Interviewers from the Survey Research Center were deployed to conduct surveys during the two-week
period of March 13th through March 24th, 2017, following a thorough training on how to administer the
instrument. While a late spring snowstorm postponed the administration of the survey in a few regions,
interviews were completed within 21 “survey days” across all ten court location, with interviewers spending
between one to three days at each court.

2017
Cou
rt A
cces
s & F
airn
ess
Surv
ey R
epor
t
7
In order to ensure that all court users were able to understand and take part in the survey, interviewers were
prepared to use LanguageLine for participants requiring translation services. While English was not the
primary language for some survey participants, they were nevertheless able to complete the survey with
minimal assistance from friends and family members.
Survey participants were given the survey upon completion of their court business. Participants completed
a total of 1,039 surveys from ten locations in eight regions. The number of completed surveys ranged from a
high of 301 in Bangor (Region 5) to a low of 11 in Calais (Region 7).
Region: Location # of Completed Surveys
# of Survey Days
Region 1: Springvale 60 2
Region 2: Portland 211 4
Region 3: Lewiston 154 3
Region 4: Skowhegan 89 2
Region 5: Bangor 301 3
Region 6: Rockland 74 2
Region 7: Machias Calais
20 11
1 1
Region 8: Caribou Presque Isle
72 47
2 1
Total 1039 21
In addition to administering surveys, interviewers were asked to log how many people chose not to
complete the survey. A total of 449 non-responders were logged. While this number should be viewed with
some caution since this was not a core responsibility and some survey interviewers were not as methodical
as others in keeping track of their non-responders, it can be used to compute a rough estimate of the
percentage of people approached who completed the survey (69.8%).
One of the limitations of this study lies with the challenge of selecting a representative sample. While efforts
were made to ensure that the survey selection would be representative of the state’s overall court activity,
these efforts were balanced against practical constraints. These constraints limited the number of locations
visited as well as the time spent at each location. As a result, survey results could be biased by issues
specific to a particular time and location. While this challenge is inherent to all survey research and the
survey interviewers did not identify any specific issues, it nevertheless is a possibility that bears
mentioning.
2017
Cou
rt A
cces
s & F
airn
ess
Surv
ey R
epor
t
8
Findings
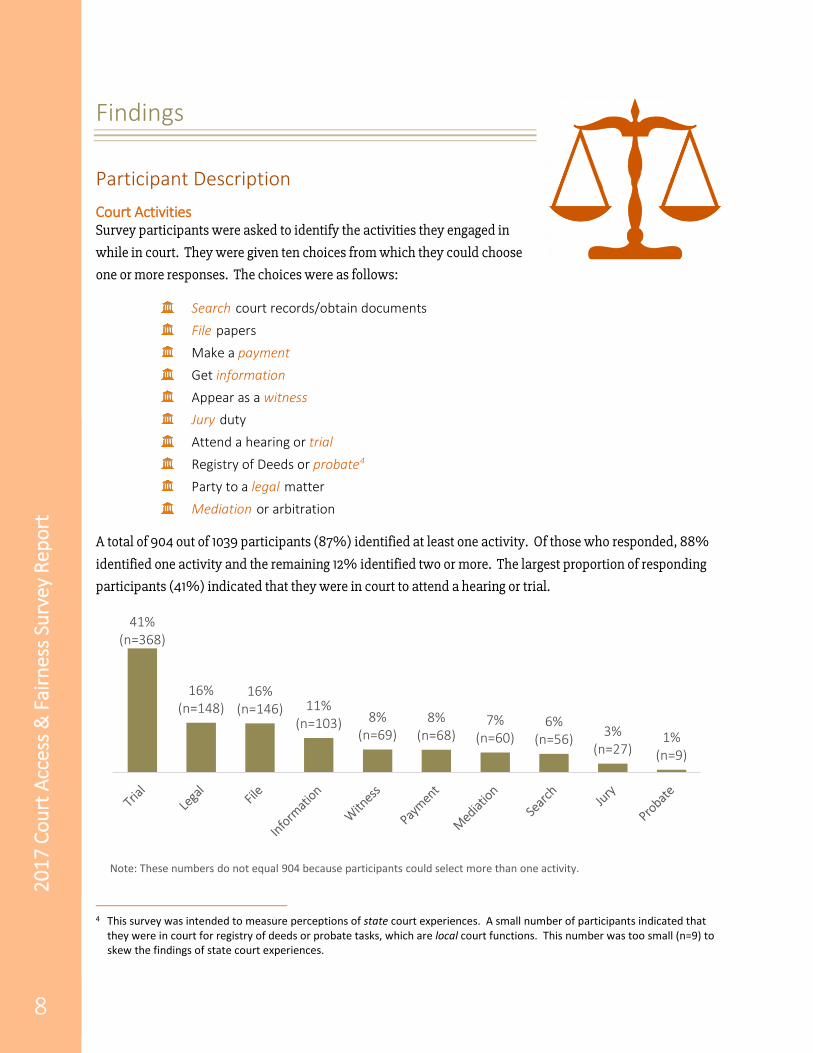
Participant Description Court Activities Survey participants were asked to identify the activities they engaged in
while in court. They were given ten choices from which they could choose
one or more responses. The choices were as follows:
Search court records/obtain documents File papers Make a payment Get information Appear as a witness Jury duty Attend a hearing or trial Registry of Deeds or probate4 Party to a legal matter Mediation or arbitration
A total of 904 out of 1039 participants (87%) identified at least one activity. Of those who responded, 88%
identified one activity and the remaining 12% identified two or more. The largest proportion of responding
participants (41%) indicated that they were in court to attend a hearing or trial.
4 This survey was intended to measure perceptions of state court experiences. A small number of participants indicated that
they were in court for registry of deeds or probate tasks, which are local court functions. This number was too small (n=9) to skew the findings of state court experiences.
41%(n=368)
16%(n=148)
16%(n=146) 11%
(n=103) 8%(n=69)
8%(n=68)
7%(n=60)
6%(n=56) 3%
(n=27)1%
(n=9)
Note: These numbers do not equal 904 because participants could select more than one activity.
2017
Cou
rt A
cces
s & F
airn
ess
Surv
ey R
epor
t
9
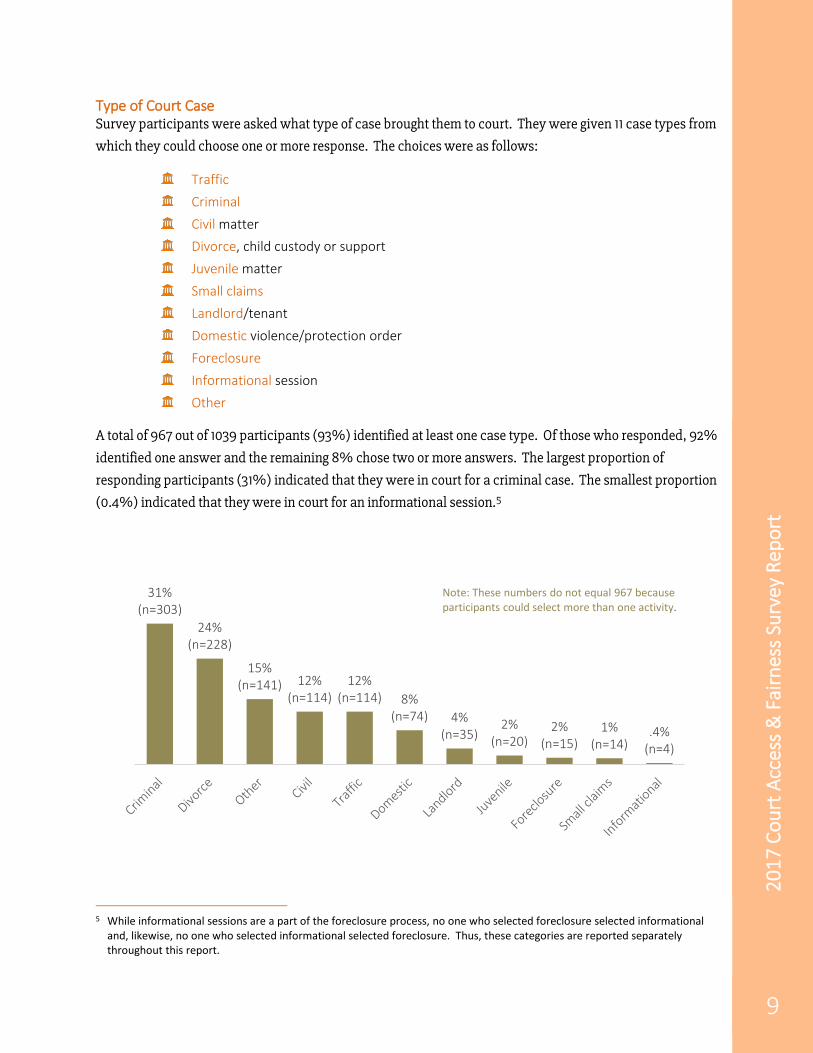
Type of Court Case Survey participants were asked what type of case brought them to court. They were given 11 case types from
which they could choose one or more response. The choices were as follows:
Traffic Criminal Civil matter Divorce, child custody or support Juvenile matter Small claims Landlord/tenant Domestic violence/protection order Foreclosure Informational session Other
A total of 967 out of 1039 participants (93%) identified at least one case type. Of those who responded, 92%
identified one answer and the remaining 8% chose two or more answers. The largest proportion of
responding participants (31%) indicated that they were in court for a criminal case. The smallest proportion
(0.4%) indicated that they were in court for an informational session.5
5 While informational sessions are a part of the foreclosure process, no one who selected foreclosure selected informational
and, likewise, no one who selected informational selected foreclosure. Thus, these categories are reported separately throughout this report.
31%(n=303)
24%(n=228)
15%(n=141) 12%
(n=114)12%
(n=114) 8%(n=74) 4%
(n=35)2%
(n=20)2%
(n=15)1%
(n=14).4%
(n=4)
Note: These numbers do not equal 967 because participants could select more than one activity.

2017
Cou
rt A
cces
s & F
airn
ess
Surv
ey R
epor
t
10
Race/Ethnicity Survey participants were asked to identify their race/ethnicity. They were given nine choices from which to
choose one response. The choices were as follows:
American Indian or Alaska Native Asian Black or African American Hispanic or Latino Native Hawaiian or Other Pacific Islander White Mixed Race Other Prefer not to answer
A total of 948 out of 1039 participants (91%) identified a race/ethnicity. The majority of responding
participants (89%) indicated that they were White, while the remaining 11% reported other races and/or
ethnicity. The proportion of the general population that are persons of color is approximately 5%, so
persons of color were disproportionately represented among survey participants. Of the subcategories that
compose persons of color, American Indian or Alaska Native was identified most frequently; 3% of
participants who identified a race/ethnicity identified this choice.
White89%
Person of Color11%

2017
Cou
rt A
cces
s & F
airn
ess
Surv
ey R
epor
t
11
Attorney Representation Participants were asked whether they were represented by an attorney if they were a party in a court case or
legal matter. A total of 560 participants responded to this question, and a little more than half (55%)
indicated that they did not have an attorney.
The proportion of participants who indicated they had an attorney varied by case type.6 Participants who
reported that they were in court because of a foreclosure case were most likely to have an attorney; about
three-quarters (75%) of these participants indicated that they had an attorney.
6 Case types are listed on page 4.
No attorney55%
Attorney45%
75% 67% 58% 55% 51% 43% 42% 40% 35% 33% 25%
25% 33% 42% 45% 49% 57% 58% 60% 65% 67% 75%
Attorney No attorney
2017
Cou
rt A
cces
s & F
airn
ess
Surv
ey R
epor
t
12
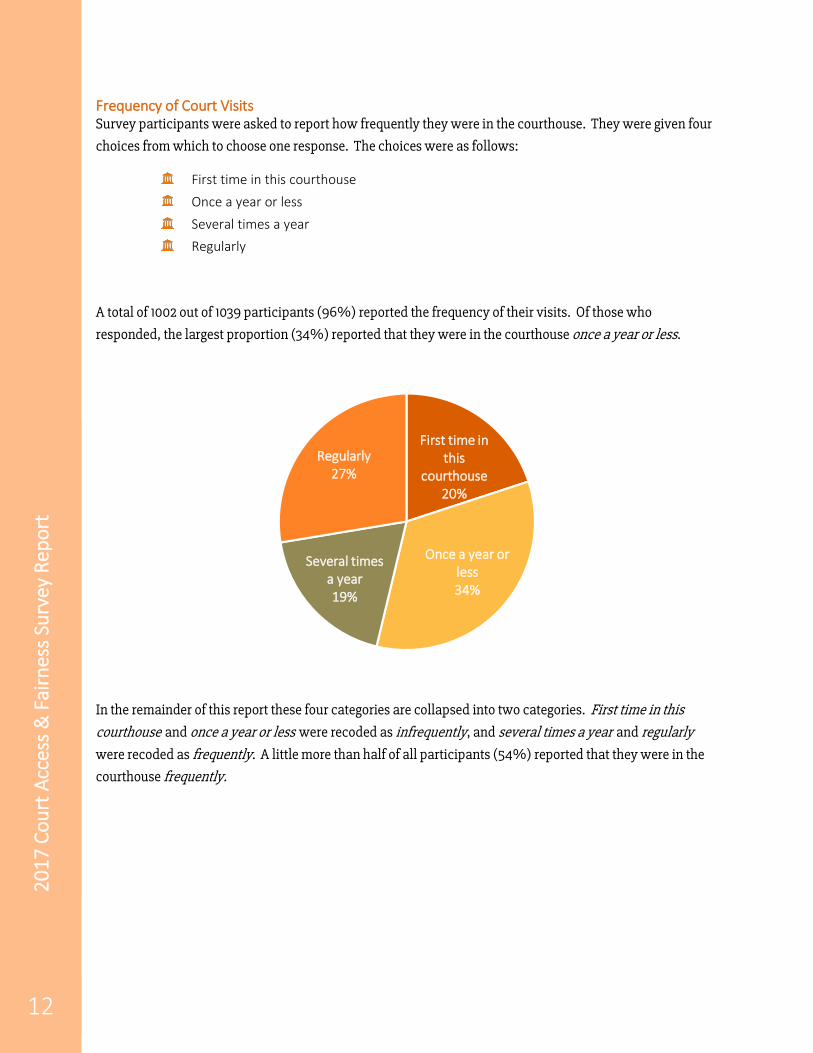
Frequency of Court Visits Survey participants were asked to report how frequently they were in the courthouse. They were given four
choices from which to choose one response. The choices were as follows:
First time in this courthouse Once a year or less Several times a year Regularly
A total of 1002 out of 1039 participants (96%) reported the frequency of their visits. Of those who
responded, the largest proportion (34%) reported that they were in the courthouse once a year or less.
In the remainder of this report these four categories are collapsed into two categories. First time in this
courthouse and once a year or less were recoded as infrequently, and several times a year and regularly
were recoded as frequently. A little more than half of all participants (54%) reported that they were in the
courthouse frequently.
First time in this
courthouse20%
Once a year or less34%
Several times a year19%
Regularly27%
2017
Cou
rt A
cces
s & F
airn
ess
Surv
ey R
epor
t
13
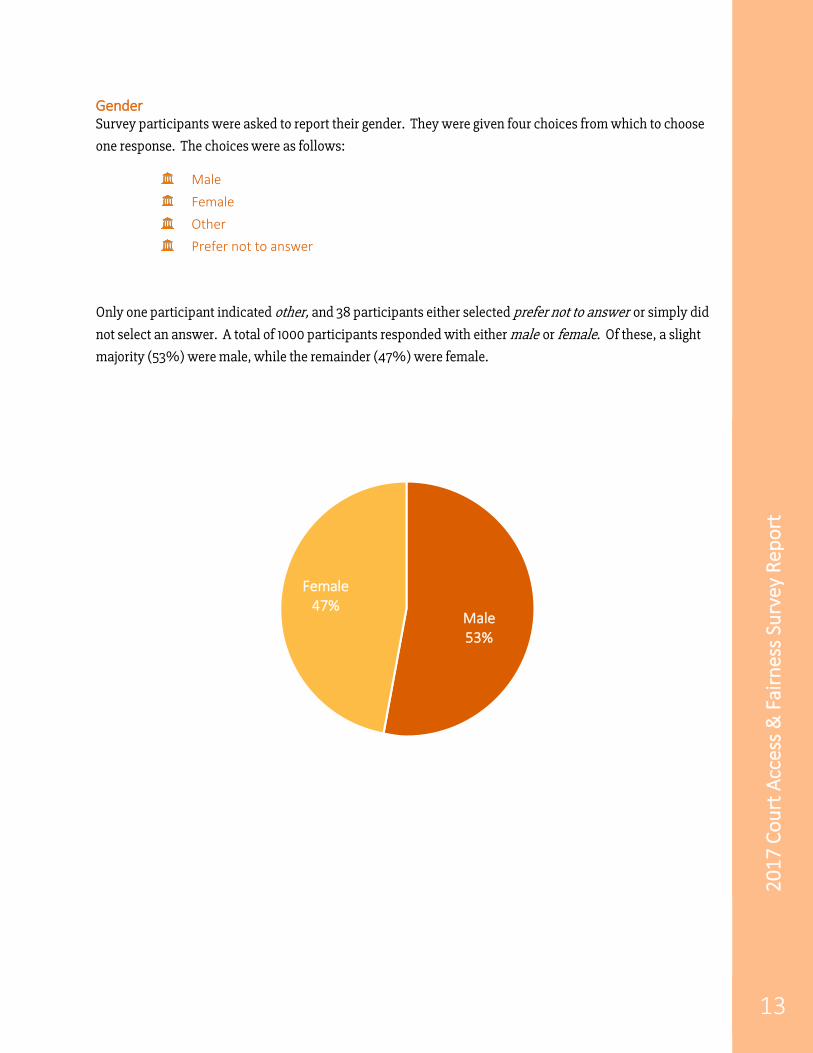
Gender Survey participants were asked to report their gender. They were given four choices from which to choose
one response. The choices were as follows:
Male Female Other Prefer not to answer
Only one participant indicated other, and 38 participants either selected prefer not to answer or simply did
not select an answer. A total of 1000 participants responded with either male or female. Of these, a slight
majority (53%) were male, while the remainder (47%) were female.
Male53%
Female47%
2017
Cou
rt A
cces
s & F
airn
ess
Surv
ey R
epor
t
14
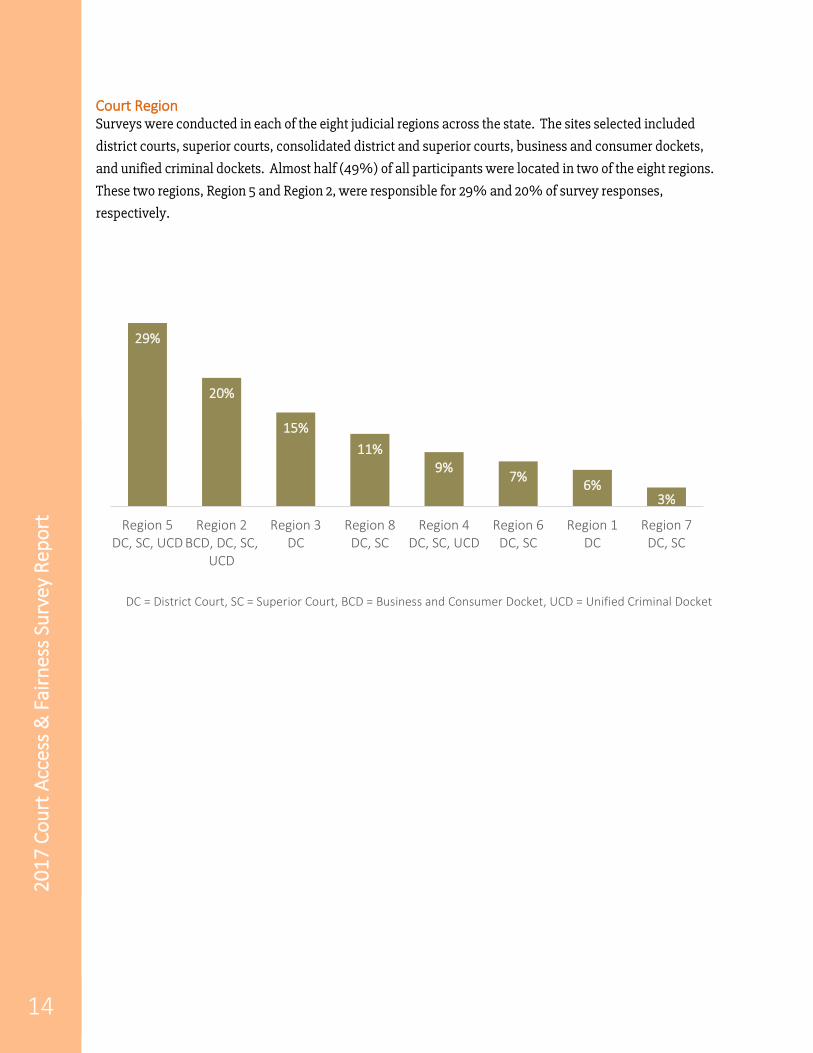
Court Region Surveys were conducted in each of the eight judicial regions across the state. The sites selected included
district courts, superior courts, consolidated district and superior courts, business and consumer dockets,
and unified criminal dockets. Almost half (49%) of all participants were located in two of the eight regions.
These two regions, Region 5 and Region 2, were responsible for 29% and 20% of survey responses,
respectively.
DC = District Court, SC = Superior Court, BCD = Business and Consumer Docket, UCD = Unified Criminal Docket
29%
20%
15%11%
9%7% 6%
3%
Region 5DC, SC, UCD
Region 2BCD, DC, SC,
UCD
Region 3DC
Region 8DC, SC
Region 4DC, SC, UCD
Region 6DC, SC
Region 1DC
Region 7DC, SC
2017
Cou
rt A
cces
s & F
airn
ess
Surv
ey R
epor
t
15
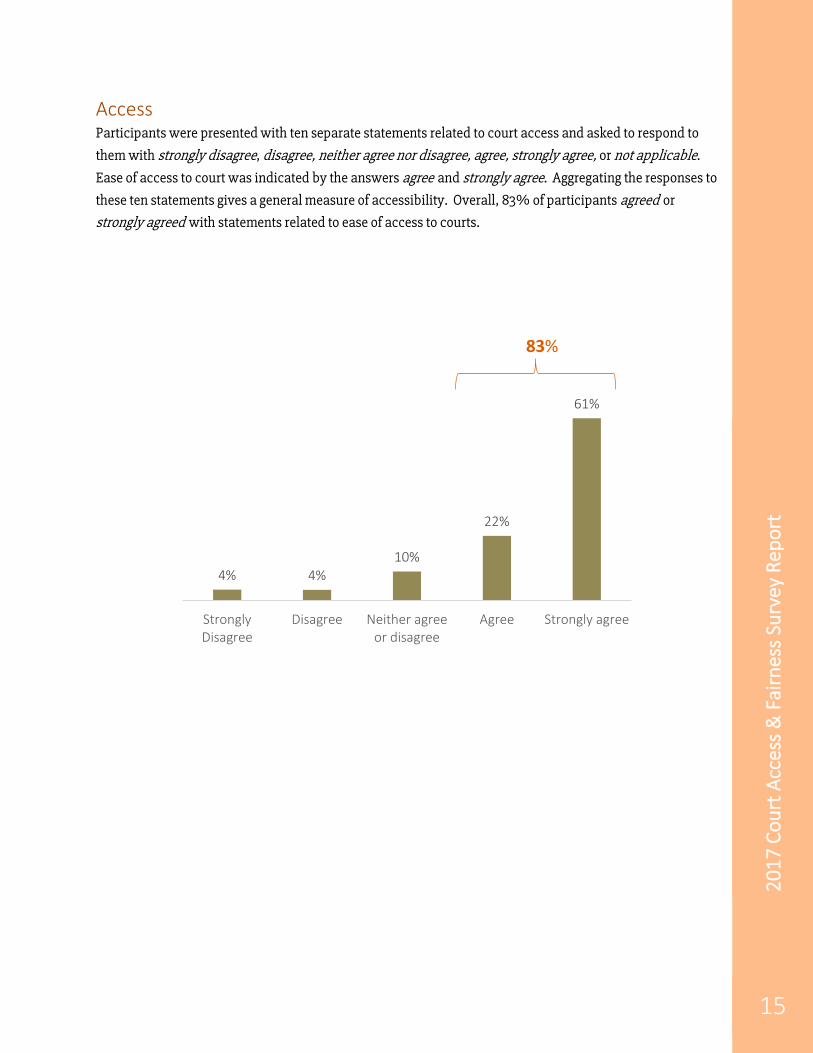
Access Participants were presented with ten separate statements related to court access and asked to respond to
them with strongly disagree, disagree, neither agree nor disagree, agree, strongly agree, or not applicable.
Ease of access to court was indicated by the answers agree and strongly agree. Aggregating the responses to
these ten statements gives a general measure of accessibility. Overall, 83% of participants agreed or
strongly agreed with statements related to ease of access to courts.
4% 4%10%
22%
61%
StronglyDisagree
Disagree Neither agreeor disagree
Agree Strongly agree
83%
2017
Cou
rt A
cces
s & F
airn
ess
Surv
ey R
epor
t
16
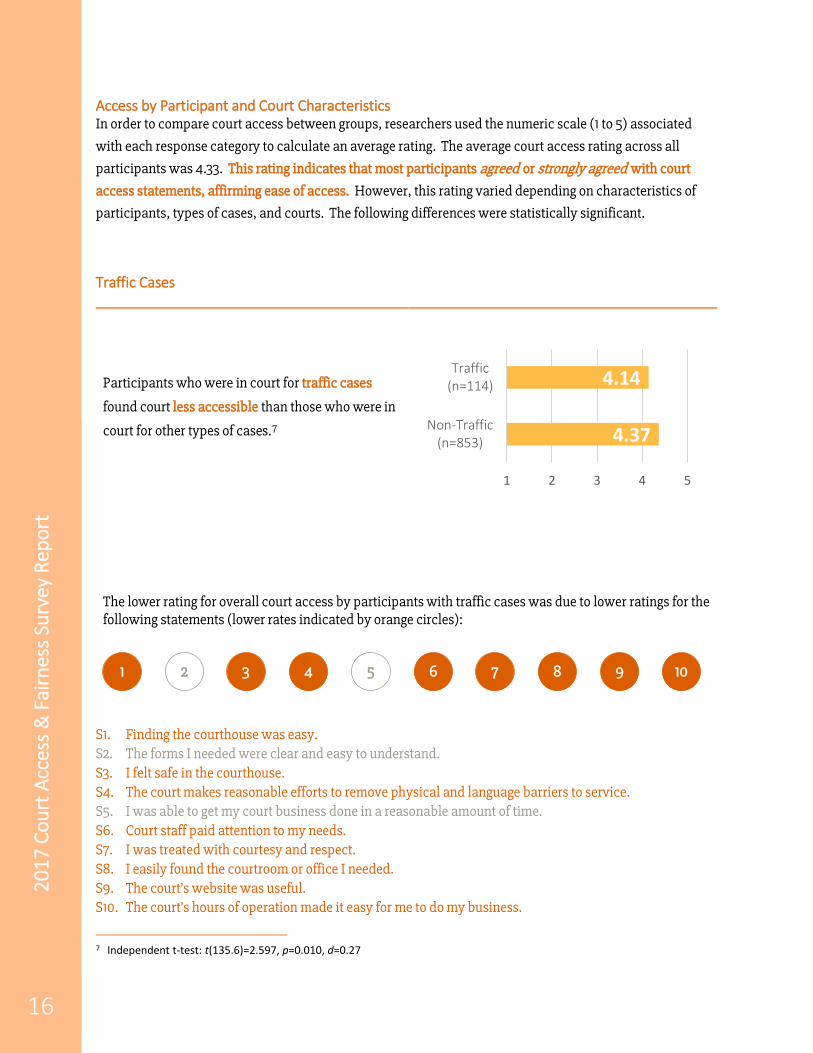
Access by Participant and Court Characteristics In order to compare court access between groups, researchers used the numeric scale (1 to 5) associated
with each response category to calculate an average rating. The average court access rating across all
participants was 4.33. This rating indicates that most participants agreed or strongly agreed with court
access statements, affirming ease of access. However, this rating varied depending on characteristics of
participants, types of cases, and courts. The following differences were statistically significant.
Traffic Cases
Participants who were in court for traffic cases
found court less accessible than those who were in
court for other types of cases.7
The lower rating for overall court access by participants with traffic cases was due to lower ratings for the following statements (lower rates indicated by orange circles):
S1. Finding the courthouse was easy. S2. The forms I needed were clear and easy to understand. S3. I felt safe in the courthouse. S4. The court makes reasonable efforts to remove physical and language barriers to service. S5. I was able to get my court business done in a reasonable amount of time. S6. Court staff paid attention to my needs. S7. I was treated with courtesy and respect. S8. I easily found the courtroom or office I needed. S9. The court’s website was useful. S10. The court’s hours of operation made it easy for me to do my business.
7 Independent t-test: t(135.6)=2.597, p=0.010, d=0.27
4.37
4.14
1 2 3 4 5
Non-Traffic(n=853)
Traffic(n=114)
2 3 4 5 1 6 7 8 9 10

2017
Cou
rt A
cces
s & F
airn
ess
Surv
ey R
epor
t
17
Criminal Cases
Participants who were in court for criminal cases
found court less accessible than those who were in
court for other types of cases.8
The lower rating for overall court access by participants with criminal cases was due to lower ratings for
the following statements (lower rates indicated by orange circles):
S1. Finding the courthouse was easy. S2. The forms I needed were clear and easy to understand. S3. I felt safe in the courthouse. S4. The court makes reasonable efforts to remove physical and language barriers to service. S5. I was able to get my court business done in a reasonable amount of time. S6. Court staff paid attention to my needs. S7. I was treated with courtesy and respect. S8. I easily found the courtroom or office I needed. S9. The court’s website was useful. S10. The court’s hours of operation made it easy for me to do my business.
8 Independent t-test: t(965)=2.785, p=0.005, d=0.19
4.39
4.24
1 2 3 4 5
Non-Criminal(n=664)
Criminal(n=303)
2 3 4 5 1 6 7 8 9 10
2017
Cou
rt A
cces
s & F
airn
ess
Surv
ey R
epor
t
18
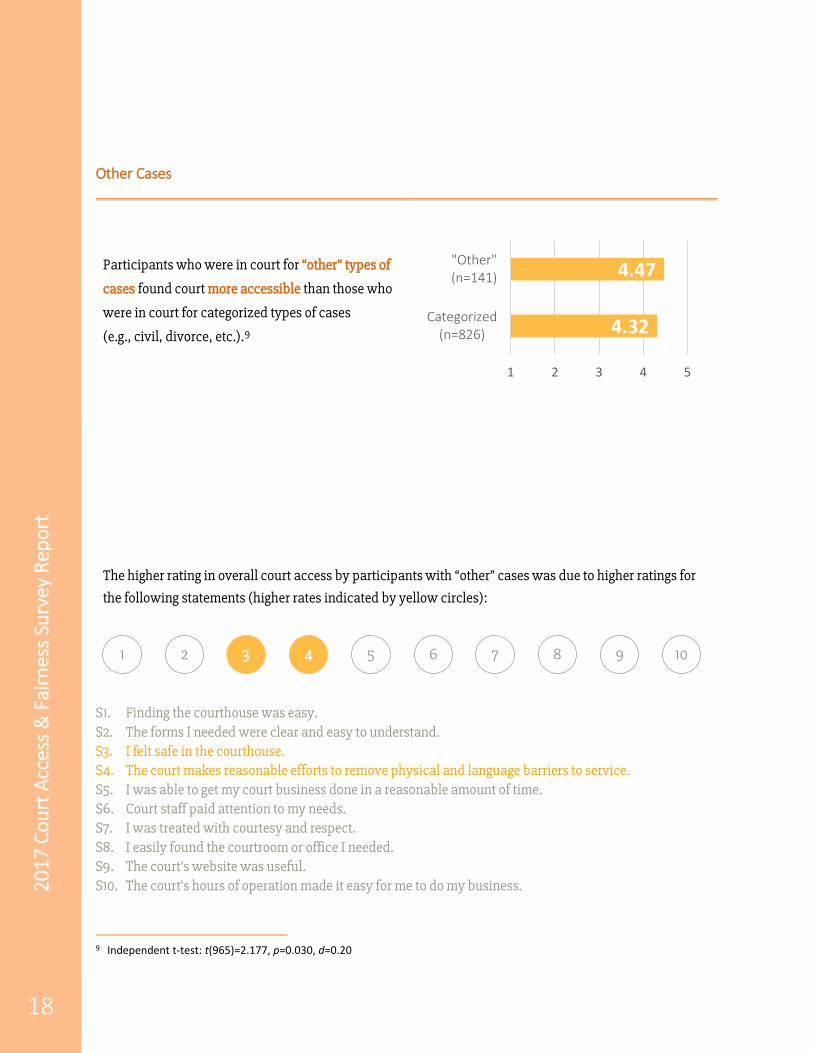
Other Cases
Participants who were in court for “other” types of
cases found court more accessible than those who
were in court for categorized types of cases
(e.g., civil, divorce, etc.).9
The higher rating in overall court access by participants with “other” cases was due to higher ratings for
the following statements (higher rates indicated by yellow circles):
S1. Finding the courthouse was easy. S2. The forms I needed were clear and easy to understand. S3. I felt safe in the courthouse. S4. The court makes reasonable efforts to remove physical and language barriers to service. S5. I was able to get my court business done in a reasonable amount of time. S6. Court staff paid attention to my needs. S7. I was treated with courtesy and respect. S8. I easily found the courtroom or office I needed. S9. The court’s website was useful. S10. The court’s hours of operation made it easy for me to do my business.
9 Independent t-test: t(965)=2.177, p=0.030, d=0.20
4.32
4.47
1 2 3 4 5
Categorized(n=826)
"Other"(n=141)
2 3 4 5 1 6 7 8 9 10

2017
Cou
rt A
cces
s & F
airn
ess
Surv
ey R
epor
t
19
Frequency of Court Use
Participants who were in court frequently found
court more accessible than those who were in
court infrequently.10
The lower rating in overall court access by participants who were in court infrequently was due to lower
ratings for the following statements (lower rates indicated by orange circles):
S1. Finding the courthouse was easy. S2. The forms I needed were clear and easy to understand. S3. I felt safe in the courthouse. S4. The court makes reasonable efforts to remove physical and language barriers to service. S5. I was able to get my court business done in a reasonable amount of time. S6. Court staff paid attention to my needs. S7. I was treated with courtesy and respect. S8. I easily found the courtroom or office I needed. S9. The court’s website was useful. S10. The court’s hours of operation made it easy for me to do my business.
10 Independent t-test: t(999.1)=1.965, p=.0.050, d=0 12
4.29
4.39
1 2 3 4 5
Infrequently(n=539)
Frequently(n=463)
2 3 4 5 1 6 7 8 9 10

2017
Cou
rt A
cces
s & F
airn
ess
Surv
ey R
epor
t
20
Region 3
Participants who visited court in Region 3 found
court less accessible than those who visited court
in other locations.11
The lower rating in overall court access by participants who visited a courthouse in Region 3 was due to
lower ratings for the following statements (lower rates indicated by orange circles):
S1. Finding the courthouse was easy. S2. The forms I needed were clear and easy to understand. S3. I felt safe in the courthouse. S4. The court makes reasonable efforts to remove physical and language barriers to service. S5. I was able to get my court business done in a reasonable amount of time. S6. Court staff paid attention to my needs. S7. I was treated with courtesy and respect. S8. I easily found the courtroom or office I needed. S9. The court’s website was useful. S10. The court’s hours of operation made it easy for me to do my business.
11 Independent t-test: t(196.7)=2.780, p=0.006, d=0.25
4.36
4.15
1 2 3 4 5
Other(n=885)
Region 3(n=154)
2 3 4 5 1 6 7 8 9 10

2017
Cou
rt A
cces
s & F
airn
ess
Surv
ey R
epor
t
21
Region 8
Participants who visited court in Region 8 found
court more accessible than those who visited court
in other locations.12
The higher rating in overall court access by participants who visited a courthouse in Region 8 was due to
higher ratings for the following statements (higher rates indicated by yellow circles):
S1. Finding the courthouse was easy. S2. The forms I needed were clear and easy to understand. S3. I felt safe in the courthouse. S4. The court makes reasonable efforts to remove physical and language barriers to service. S5. I was able to get my court business done in a reasonable amount of time. S6. Court staff paid attention to my needs. S7. I was treated with courtesy and respect. S8. I easily found the courtroom or office I needed. S9. The court’s website was useful. S10. The court’s hours of operation made it easy for me to do my business.
12 Independent t-test: t(181.0)=4.187, p<.0.001, d=0.36
4.30
4.55
1 2 3 4 5
Other(n=920)
Region 8(n=119)
2 3 4 5 1 6 7 8 9 10
2017
Cou
rt A
cces
s & F
airn
ess
Surv
ey R
epor
t
22
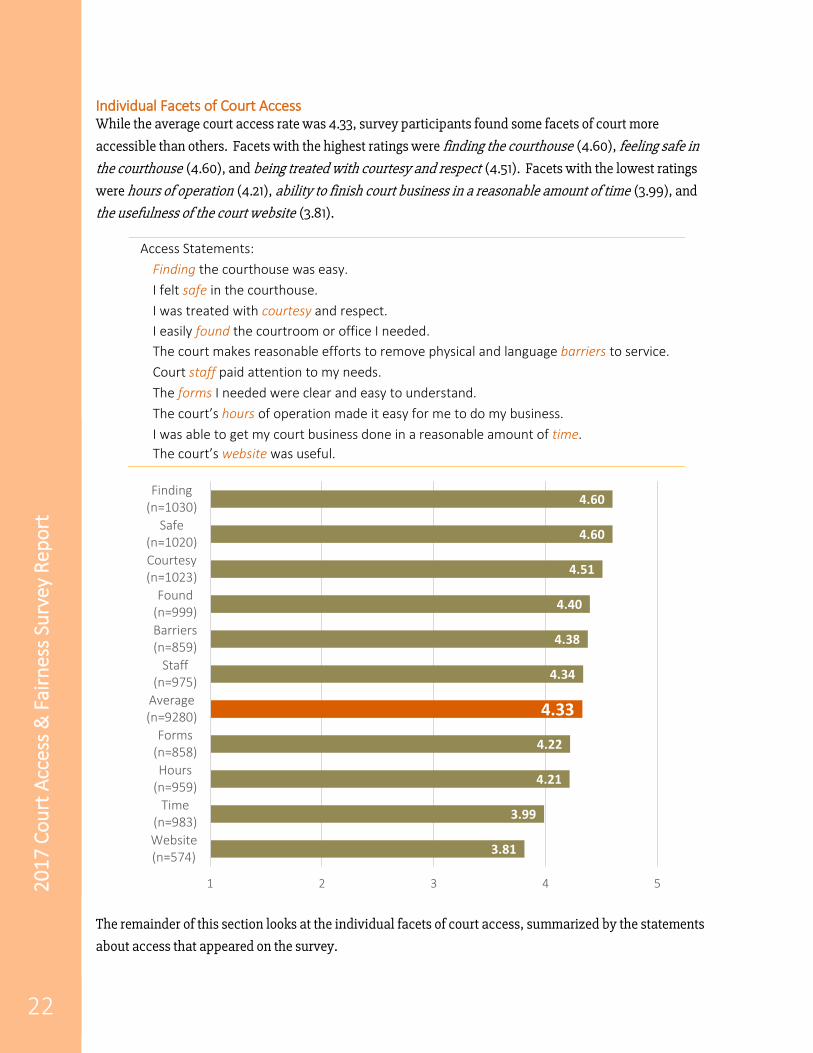
Individual Facets of Court Access While the average court access rate was 4.33, survey participants found some facets of court more
accessible than others. Facets with the highest ratings were finding the courthouse (4.60), feeling safe in
the courthouse (4.60), and being treated with courtesy and respect (4.51). Facets with the lowest ratings
were hours of operation (4.21), ability to finish court business in a reasonable amount of time (3.99), and
the usefulness of the court website (3.81).
Access Statements: Finding the courthouse was easy. I felt safe in the courthouse. I was treated with courtesy and respect. I easily found the courtroom or office I needed. The court makes reasonable efforts to remove physical and language barriers to service. Court staff paid attention to my needs. The forms I needed were clear and easy to understand. The court’s hours of operation made it easy for me to do my business. I was able to get my court business done in a reasonable amount of time. The court’s website was useful.
The remainder of this section looks at the individual facets of court access, summarized by the statements
about access that appeared on the survey.
3.81
3.99
4.21
4.22
4.33
4.34
4.38
4.40
4.51
4.60
4.60
1 2 3 4 5
Website(n=574)
Time(n=983)
Hours(n=959)
Forms(n=858)
Average(n=9280)
Staff(n=975)
Barriers(n=859)
Found(n=999)
Courtesy(n=1023)
Safe(n=1020)
Finding(n=1030)

2017
Cou
rt A
cces
s & F
airn
ess
Surv
ey R
epor
t
23
1. Finding the courthouse was easy.
Approximately 92% of participants agreed or strongly agreed with this statement.
While the average rating for this question was 4.60, ratings varied depending on the activity participants
engaged in while in court. Those who were in court to search court records/obtain documents had a rating
(4.78) that was statistically significantly higher than those who were not in court for this activity (4.60).13
13 Independent t-test: t(68.1)=2.021, p=0.047, d=0.24
3% 2% 4%
16%
76%
StronglyDisagree
Disagree Neither agreeor disagree
Agree Strongly agree
92%
4.78
1 2 3 4 5
Search(n=55)

2017
Cou
rt A
cces
s & F
airn
ess
Surv
ey R
epor
t
24
Ratings also varied according to the type of case that brought participants to court. Those who were in court
for traffic cases had a rating (4.37) that was statistically significantly lower than those who were not in
court for this type of case (4.63).14 Those who were in court for divorce, child custody or support type cases
had a rating (4.70) that was statistically significantly higher than those who were not in court for this type of
case (4.57).15
Ratings varied according to participant race/ethnicity. Persons of color had a rating (4.41) that was
statistically significantly lower than that of white participants (4.63).16
14 Independent t-test: t(131.8)=2.480, p=0.014, d=0.27 15 Independent t-test: t(434.4)=2.181, p=0.030, d=0.16 16 Independent t-test: t(122.9)=2.194, p=0.030, d=0.24
4.37
4.70
1 2 3 4 5
Divorce(n=226)
Traffic(n=113)
4.41
4.63
1 2 3 4 5
White(n=837)
Persons of color(n=104)
2017
Cou
rt A
cces
s & F
airn
ess
Surv
ey R
epor
t
25
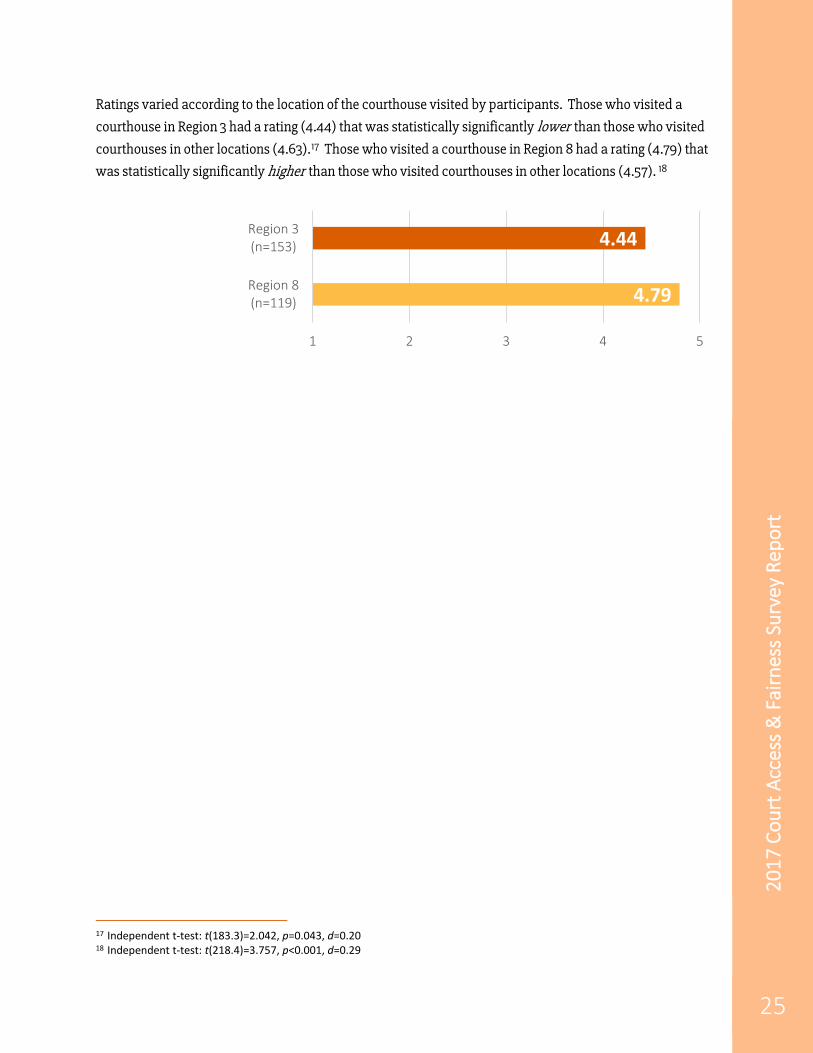
Ratings varied according to the location of the courthouse visited by participants. Those who visited a
courthouse in Region 3 had a rating (4.44) that was statistically significantly lower than those who visited
courthouses in other locations (4.63).17 Those who visited a courthouse in Region 8 had a rating (4.79) that
was statistically significantly higher than those who visited courthouses in other locations (4.57). 18
17 Independent t-test: t(183.3)=2.042, p=0.043, d=0.20 18 Independent t-test: t(218.4)=3.757, p<0.001, d=0.29
4.44
4.79
1 2 3 4 5
Region 8(n=119)
Region 3(n=153)
2017
Cou
rt A
cces
s & F
airn
ess
Surv
ey R
epor
t
26
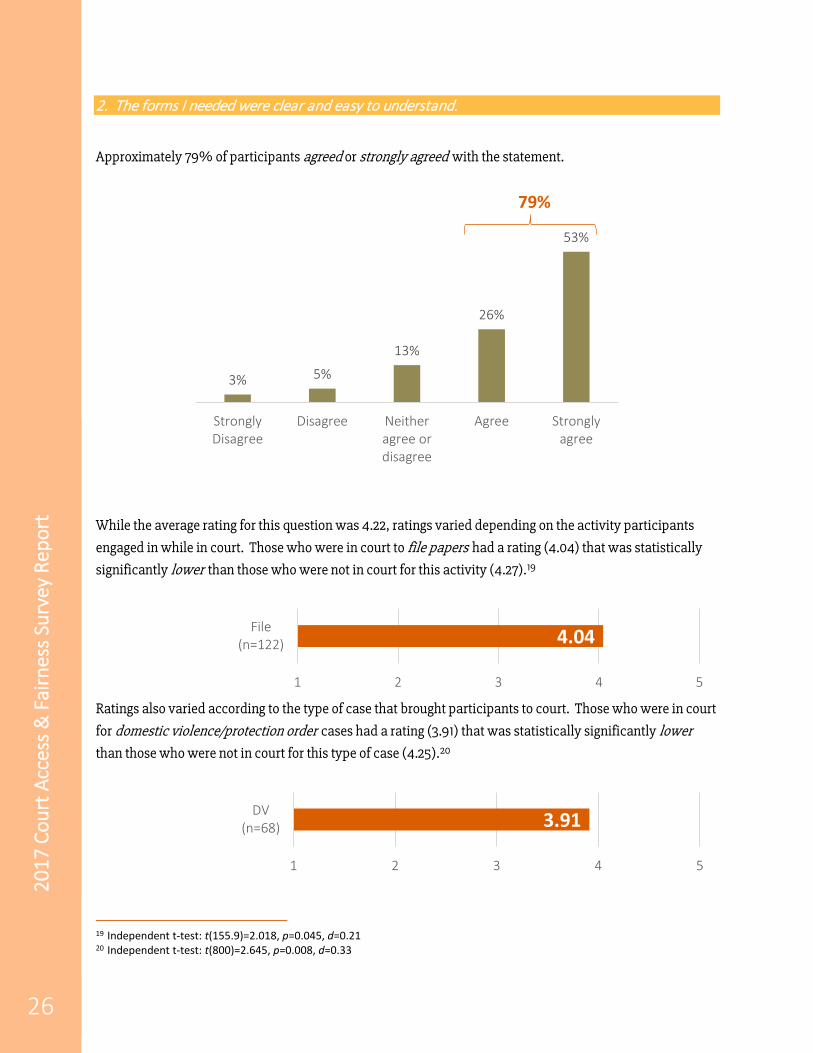
2. The forms I needed were clear and easy to understand.
Approximately 79% of participants agreed or strongly agreed with the statement.
While the average rating for this question was 4.22, ratings varied depending on the activity participants
engaged in while in court. Those who were in court to file papers had a rating (4.04) that was statistically
significantly lower than those who were not in court for this activity (4.27).19
Ratings also varied according to the type of case that brought participants to court. Those who were in court
for domestic violence/protection order cases had a rating (3.91) that was statistically significantly lower than those who were not in court for this type of case (4.25).20
19 Independent t-test: t(155.9)=2.018, p=0.045, d=0.21 20 Independent t-test: t(800)=2.645, p=0.008, d=0.33
3% 5%
13%
26%
53%
StronglyDisagree
Disagree Neitheragree ordisagree
Agree Stronglyagree
79%
4.04
1 2 3 4 5
File(n=122)
3.91
1 2 3 4 5
DV(n=68)
2017
Cou
rt A
cces
s & F
airn
ess
Surv
ey R
epor
t
27
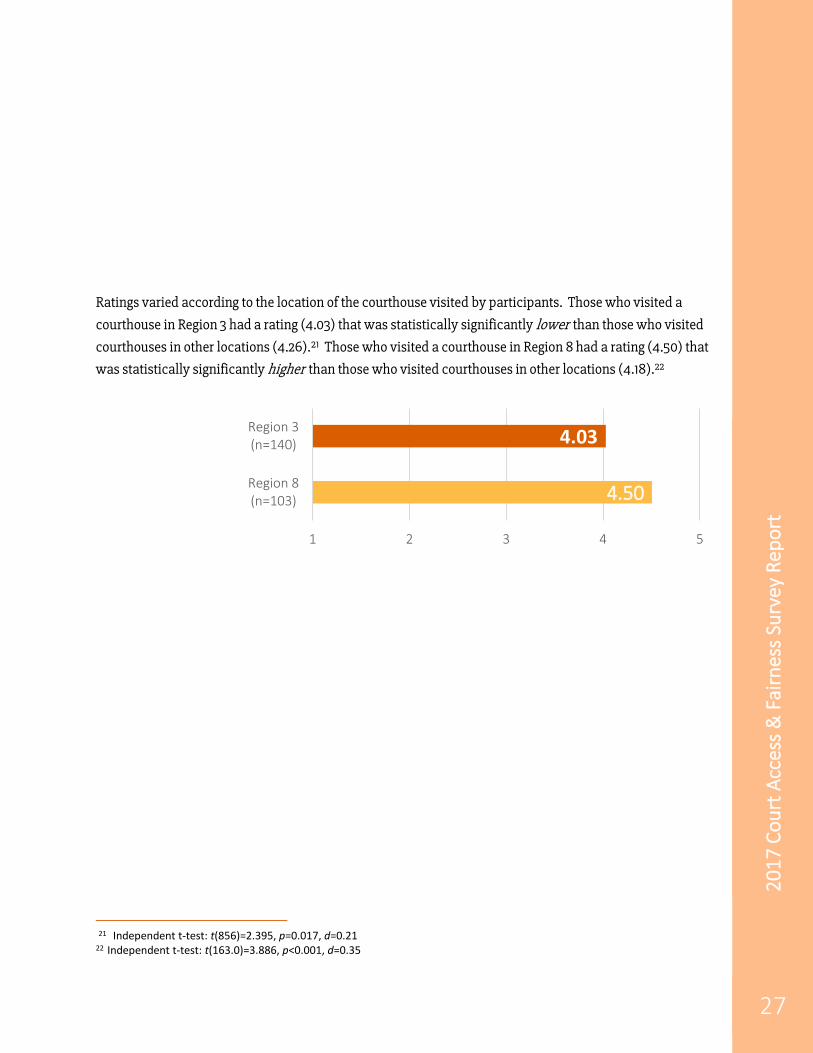
Ratings varied according to the location of the courthouse visited by participants. Those who visited a
courthouse in Region 3 had a rating (4.03) that was statistically significantly lower than those who visited
courthouses in other locations (4.26).21 Those who visited a courthouse in Region 8 had a rating (4.50) that
was statistically significantly higher than those who visited courthouses in other locations (4.18).22
21 Independent t-test: t(856)=2.395, p=0.017, d=0.21 22 Independent t-test: t(163.0)=3.886, p<0.001, d=0.35
4.03
4.50
1 2 3 4 5
Region 8(n=103)
Region 3(n=140)
2017
Cou
rt A
cces
s & F
airn
ess
Surv
ey R
epor
t
28
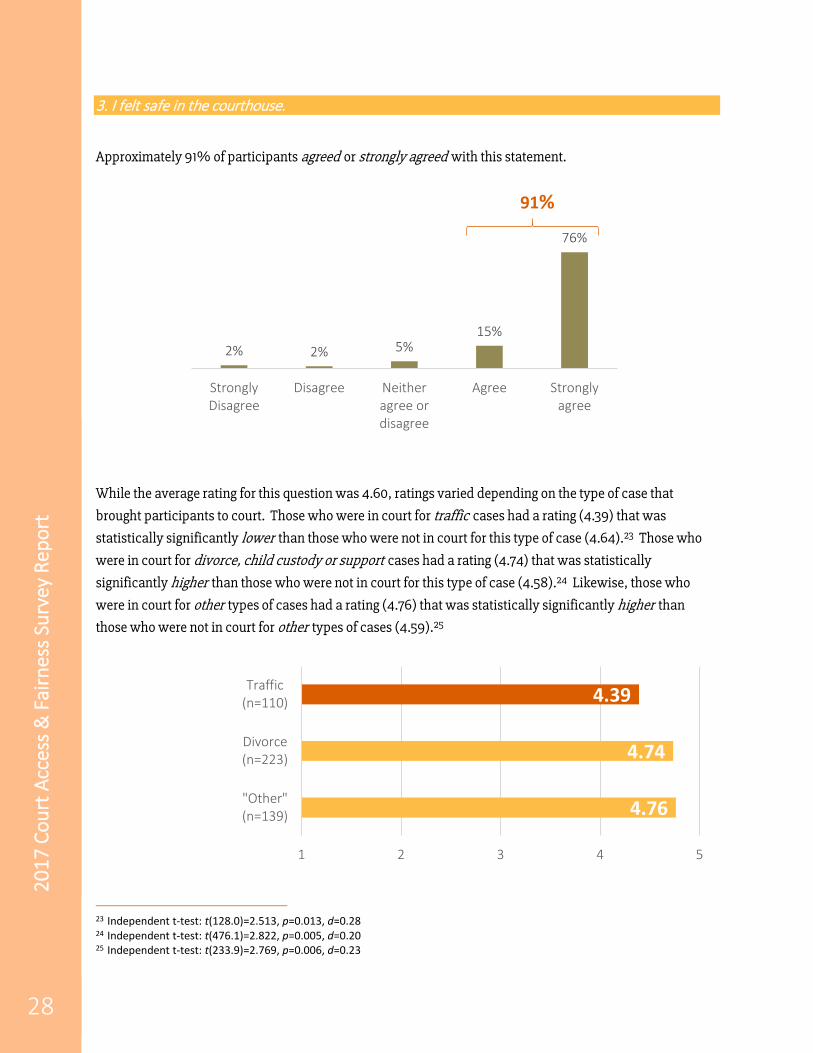
3. I felt safe in the courthouse.
Approximately 91% of participants agreed or strongly agreed with this statement.
While the average rating for this question was 4.60, ratings varied depending on the type of case that
brought participants to court. Those who were in court for traffic cases had a rating (4.39) that was
statistically significantly lower than those who were not in court for this type of case (4.64).23 Those who
were in court for divorce, child custody or support cases had a rating (4.74) that was statistically
significantly higher than those who were not in court for this type of case (4.58).24 Likewise, those who
were in court for other types of cases had a rating (4.76) that was statistically significantly higher than
those who were not in court for other types of cases (4.59).25
23 Independent t-test: t(128.0)=2.513, p=0.013, d=0.28 24 Independent t-test: t(476.1)=2.822, p=0.005, d=0.20 25 Independent t-test: t(233.9)=2.769, p=0.006, d=0.23
2% 2% 5%15%
76%
StronglyDisagree
Disagree Neitheragree ordisagree
Agree Stronglyagree
91%
4.39
4.76
4.74
1 2 3 4 5
"Other"(n=139)
Divorce(n=223)
Traffic(n=110)
2017
Cou
rt A
cces
s & F
airn
ess
Surv
ey R
epor
t
29
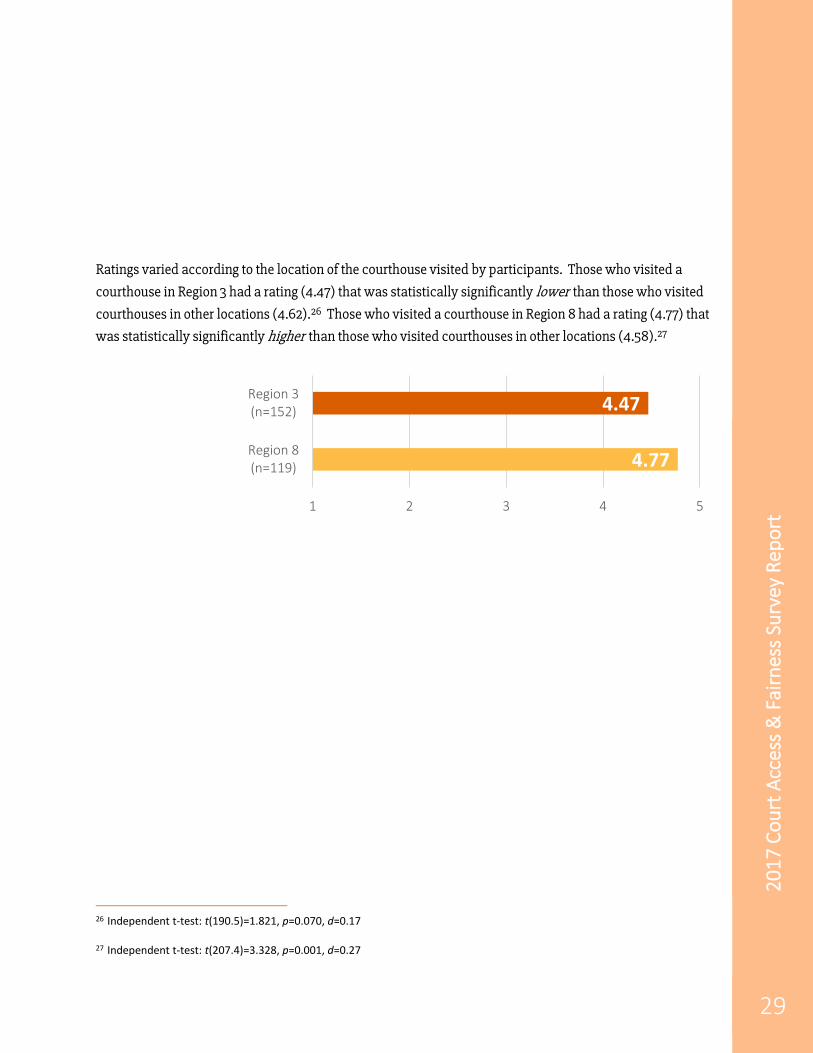
Ratings varied according to the location of the courthouse visited by participants. Those who visited a
courthouse in Region 3 had a rating (4.47) that was statistically significantly lower than those who visited
courthouses in other locations (4.62).26 Those who visited a courthouse in Region 8 had a rating (4.77) that
was statistically significantly higher than those who visited courthouses in other locations (4.58).27
26 Independent t-test: t(190.5)=1.821, p=0.070, d=0.17 27 Independent t-test: t(207.4)=3.328, p=0.001, d=0.27
4.47
4.77
1 2 3 4 5
Region 8(n=119)
Region 3(n=152)
2017
Cou
rt A
cces
s & F
airn
ess
Surv
ey R
epor
t
30
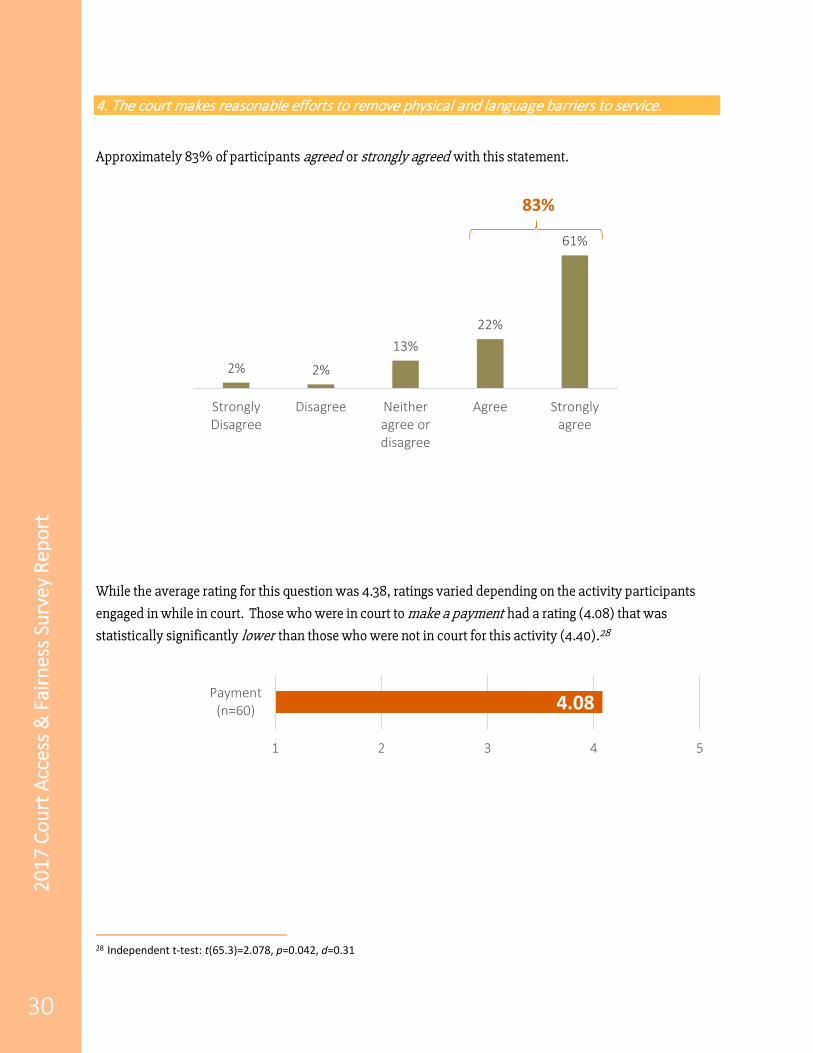
4. The court makes reasonable efforts to remove physical and language barriers to service.
Approximately 83% of participants agreed or strongly agreed with this statement.
While the average rating for this question was 4.38, ratings varied depending on the activity participants
engaged in while in court. Those who were in court to make a payment had a rating (4.08) that was
statistically significantly lower than those who were not in court for this activity (4.40).28
28 Independent t-test: t(65.3)=2.078, p=0.042, d=0.31
2% 2%
13%22%
61%
StronglyDisagree
Disagree Neitheragree ordisagree
Agree Stronglyagree
83%
4.08
1 2 3 4 5
Payment(n=60)
2017
Cou
rt A
cces
s & F
airn
ess
Surv
ey R
epor
t
31
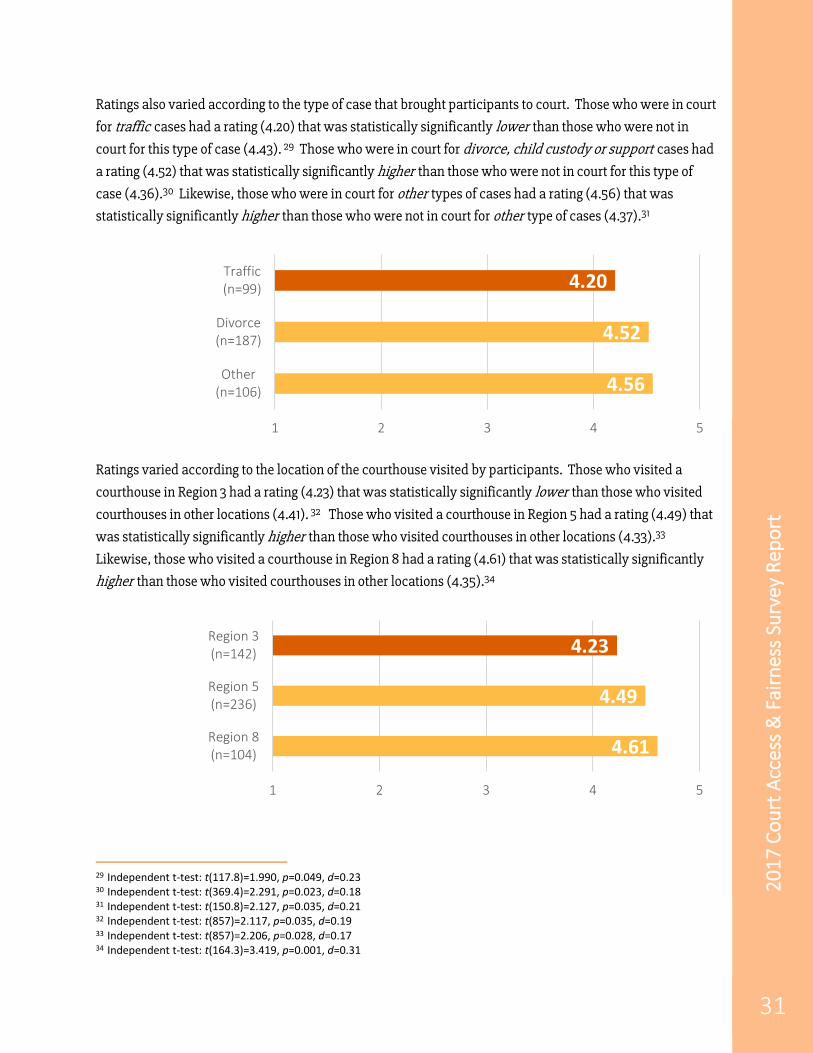
Ratings also varied according to the type of case that brought participants to court. Those who were in court
for traffic cases had a rating (4.20) that was statistically significantly lower than those who were not in
court for this type of case (4.43). 29 Those who were in court for divorce, child custody or support cases had
a rating (4.52) that was statistically significantly higher than those who were not in court for this type of
case (4.36).30 Likewise, those who were in court for other types of cases had a rating (4.56) that was
statistically significantly higher than those who were not in court for other type of cases (4.37).31
Ratings varied according to the location of the courthouse visited by participants. Those who visited a
courthouse in Region 3 had a rating (4.23) that was statistically significantly lower than those who visited
courthouses in other locations (4.41). 32 Those who visited a courthouse in Region 5 had a rating (4.49) that
was statistically significantly higher than those who visited courthouses in other locations (4.33).33
Likewise, those who visited a courthouse in Region 8 had a rating (4.61) that was statistically significantly
higher than those who visited courthouses in other locations (4.35).34
29 Independent t-test: t(117.8)=1.990, p=0.049, d=0.23 30 Independent t-test: t(369.4)=2.291, p=0.023, d=0.18 31 Independent t-test: t(150.8)=2.127, p=0.035, d=0.21 32 Independent t-test: t(857)=2.117, p=0.035, d=0.19 33 Independent t-test: t(857)=2.206, p=0.028, d=0.17 34 Independent t-test: t(164.3)=3.419, p=0.001, d=0.31
4.20
4.56
4.52
1 2 3 4 5
Other(n=106)
Divorce(n=187)
Traffic(n=99)
4.23
4.61
4.49
1 2 3 4 5
Region 8(n=104)
Region 5(n=236)
Region 3(n=142)

2017
Cou
rt A
cces
s & F
airn
ess
Surv
ey R
epor
t
32
5. I was able to get my court business done in a reasonable amount of time.
Approximately 71% of participants agreed or strongly agreed with this statement.
While the average rating was 3.99, ratings varied depending on the activity participants engaged in while in
court. Those who were in court to attend a hearing or trial had a rating (3.86) that was statistically
significantly lower than those who were not in court for this type of case (4.10).35 Those who were in court
to get information had a rating (4.26) that was statistically significantly higher than those who were not in
court for this type of case (3.97).36 Likewise, those who were in court to search court records/obtain
documents had a rating (4.36) that was statistically significantly higher than those who were not in court
for this type of case (3.98).37
35 Independent t-test: t(855)=2.757, p=0.006, d=0.19 36 Independent t-test: t(125.3)=2.319, p=0.022, d=0.24 37 Independent t-test: t(855)=2.221, p=0.027, d=0.33
7% 8%14%
22%
49%
StronglyDisagree
Disagree Neitheragree ordisagree
Agree Stronglyagree
71%
3.86
4.36
4.26
1 2 3 4 5
Search(n=55)
Information(n=94)
Hearing(n=349)
2017
Cou
rt A
cces
s & F
airn
ess
Surv
ey R
epor
t
33
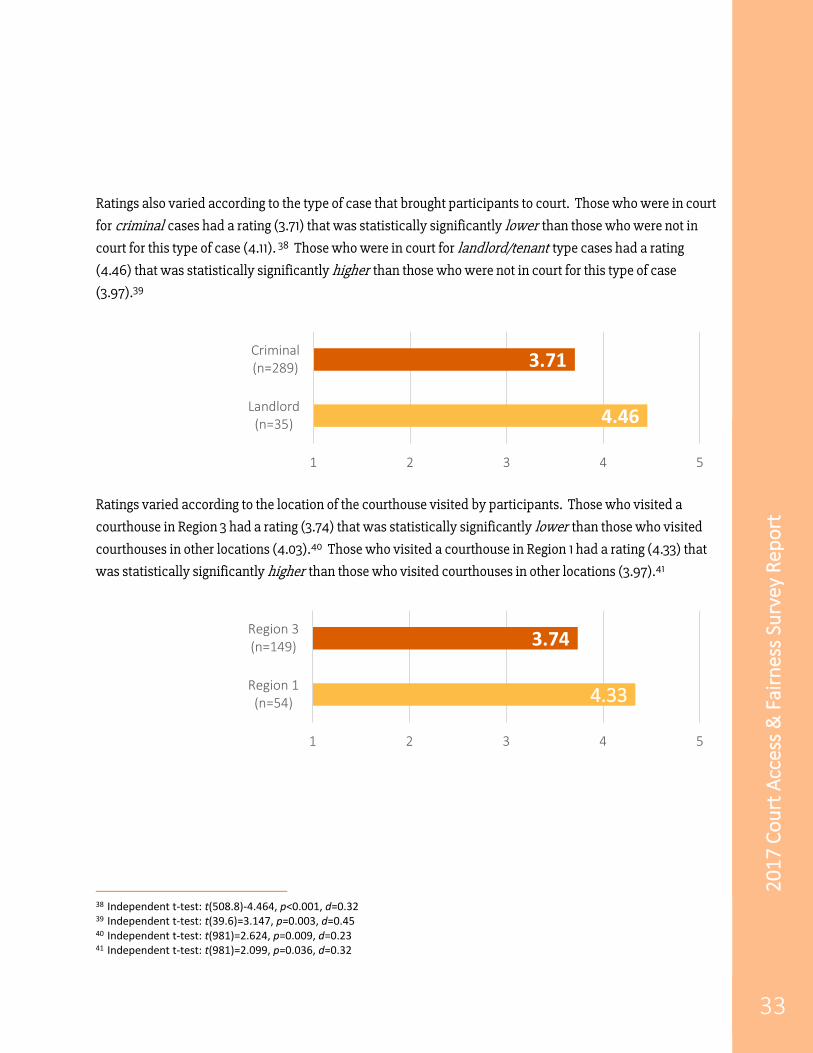
Ratings also varied according to the type of case that brought participants to court. Those who were in court
for criminal cases had a rating (3.71) that was statistically significantly lower than those who were not in
court for this type of case (4.11). 38 Those who were in court for landlord/tenant type cases had a rating
(4.46) that was statistically significantly higher than those who were not in court for this type of case
(3.97).39
Ratings varied according to the location of the courthouse visited by participants. Those who visited a
courthouse in Region 3 had a rating (3.74) that was statistically significantly lower than those who visited
courthouses in other locations (4.03).40 Those who visited a courthouse in Region 1 had a rating (4.33) that
was statistically significantly higher than those who visited courthouses in other locations (3.97).41
38 Independent t-test: t(508.8)-4.464, p<0.001, d=0.32 39 Independent t-test: t(39.6)=3.147, p=0.003, d=0.45 40 Independent t-test: t(981)=2.624, p=0.009, d=0.23 41 Independent t-test: t(981)=2.099, p=0.036, d=0.32
3.71
4.46
1 2 3 4 5
Landlord(n=35)
Criminal(n=289)
3.74
4.33
1 2 3 4 5
Region 1(n=54)
Region 3(n=149)
2017
Cou
rt A
cces
s & F
airn
ess
Surv
ey R
epor
t
34
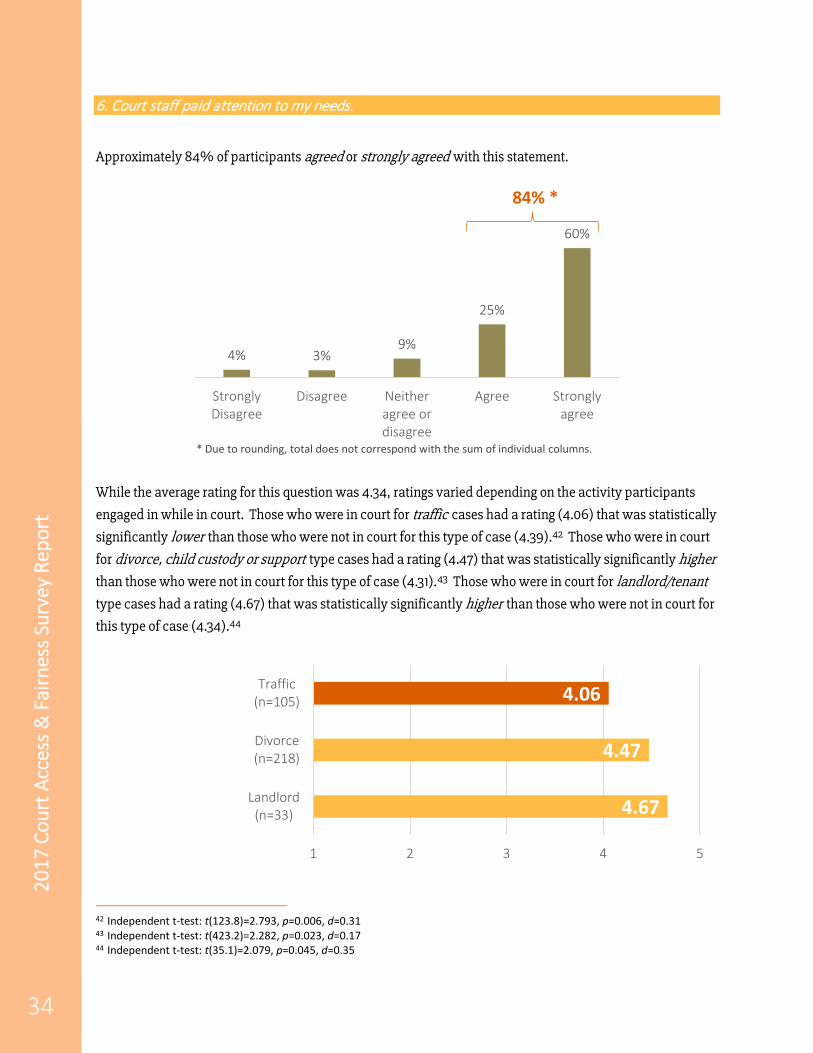
6. Court staff paid attention to my needs.
Approximately 84% of participants agreed or strongly agreed with this statement.
While the average rating for this question was 4.34, ratings varied depending on the activity participants
engaged in while in court. Those who were in court for traffic cases had a rating (4.06) that was statistically
significantly lower than those who were not in court for this type of case (4.39).42 Those who were in court
for divorce, child custody or support type cases had a rating (4.47) that was statistically significantly higher
than those who were not in court for this type of case (4.31).43 Those who were in court for landlord/tenant
type cases had a rating (4.67) that was statistically significantly higher than those who were not in court for
this type of case (4.34).44
42 Independent t-test: t(123.8)=2.793, p=0.006, d=0.31 43 Independent t-test: t(423.2)=2.282, p=0.023, d=0.17 44 Independent t-test: t(35.1)=2.079, p=0.045, d=0.35
4% 3%9%
25%
60%
StronglyDisagree
Disagree Neitheragree ordisagree
Agree Stronglyagree
84% *
* Due to rounding, total does not correspond with the sum of individual columns.
4.06
4.67
4.47
1 2 3 4 5
Landlord(n=33)
Divorce(n=218)
Traffic(n=105)
2017
Cou
rt A
cces
s & F
airn
ess
Surv
ey R
epor
t
35
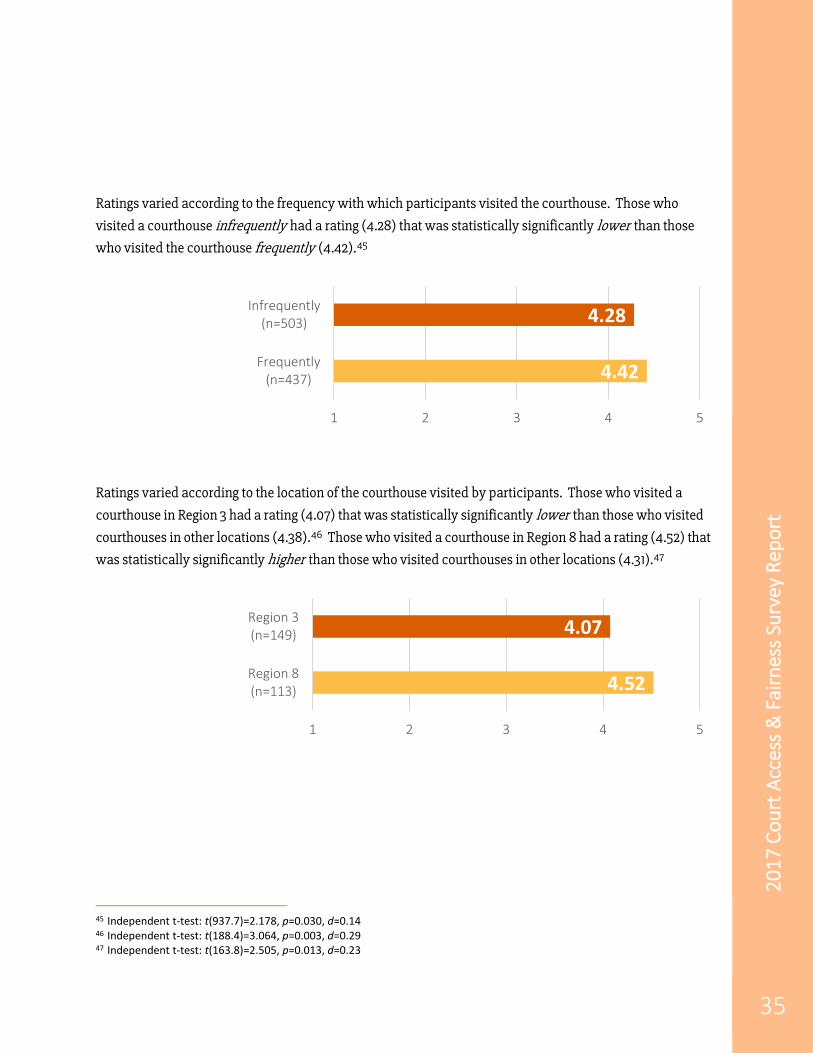
Ratings varied according to the frequency with which participants visited the courthouse. Those who
visited a courthouse infrequently had a rating (4.28) that was statistically significantly lower than those
who visited the courthouse frequently (4.42).45
Ratings varied according to the location of the courthouse visited by participants. Those who visited a
courthouse in Region 3 had a rating (4.07) that was statistically significantly lower than those who visited
courthouses in other locations (4.38).46 Those who visited a courthouse in Region 8 had a rating (4.52) that
was statistically significantly higher than those who visited courthouses in other locations (4.31).47
45 Independent t-test: t(937.7)=2.178, p=0.030, d=0.14 46 Independent t-test: t(188.4)=3.064, p=0.003, d=0.29 47 Independent t-test: t(163.8)=2.505, p=0.013, d=0.23
4.28
4.42
1 2 3 4 5
Frequently(n=437)
Infrequently(n=503)
4.07
4.52
1 2 3 4 5
Region 8(n=113)
Region 3(n=149)
2017
Cou
rt A
cces
s & F
airn
ess
Surv
ey R
epor
t
36
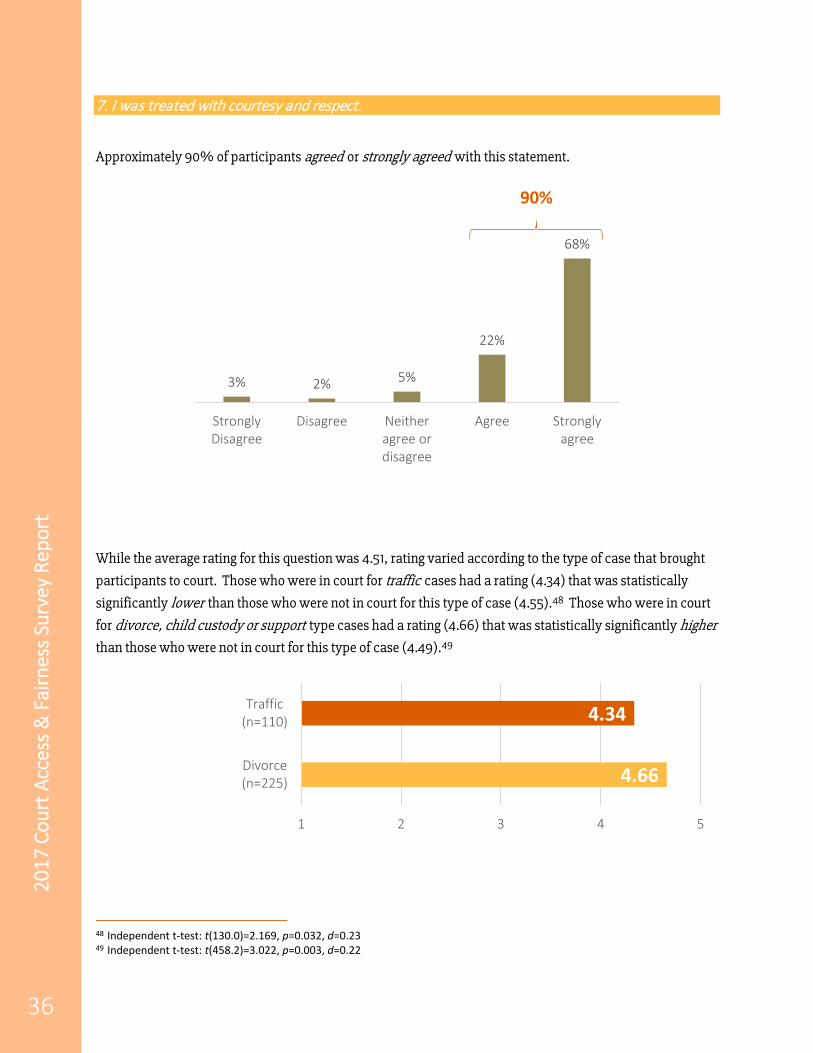
7. I was treated with courtesy and respect.
Approximately 90% of participants agreed or strongly agreed with this statement.
While the average rating for this question was 4.51, rating varied according to the type of case that brought
participants to court. Those who were in court for traffic cases had a rating (4.34) that was statistically
significantly lower than those who were not in court for this type of case (4.55).48 Those who were in court
for divorce, child custody or support type cases had a rating (4.66) that was statistically significantly higher than those who were not in court for this type of case (4.49).49
48 Independent t-test: t(130.0)=2.169, p=0.032, d=0.23 49 Independent t-test: t(458.2)=3.022, p=0.003, d=0.22
3% 2% 5%
22%
68%
StronglyDisagree
Disagree Neitheragree ordisagree
Agree Stronglyagree
90%
4.34
4.66
1 2 3 4 5
Divorce(n=225)
Traffic(n=110)

2017
Cou
rt A
cces
s & F
airn
ess
Surv
ey R
epor
t
37
Ratings varied according to the frequency with which participants visited the courthouse. Those who
visited a courthouse infrequently had a rating (4.47) that was statistically significantly lower than those
who visited courthouses frequently (4.58).50
Ratings varied according to the location of the courthouse visited by participants. Those who visited a
courthouse in Region 3 had a rating (4.26) that was statistically significantly lower than those who visited
courthouses in other locations (4.55). 51 Those who visited a courthouse in Region 8 had a rating (4.67) that
was statistically significantly higher than those who visited courthouses in other locations (4.49).52
Likewise, those who visited a courthouse in Region 1 had a rating (4.76) that was statistically significantly
higher than those who visited courthouses in other locations (4.49).53
50 Independent t-test: t(986.6)=2.013, p=0.044, d=0.13 51 Independent t-test: t(184.9)=3.129, p=0.002, d=0.30 52 Independent t-test: t(182.4)=2.723, p=0.007, d=0.23 53 Independent t-test: t(85.1)=3.883, p<0.001, d=0.37
4.47
4.58
1 2 3 4 5
Frequently(n=459)
Infrequently(n=530)
4.26
4.76
4.67
1 2 3 4 5
Region 1(n=58)
Region 8(n=119)
Region 3(n=152)

2017
Cou
rt A
cces
s & F
airn
ess
Surv
ey R
epor
t
38
8. I easily found the courtroom or office I needed.
Approximately 86% of participants agreed or strongly agreed with this statement.
While the average rating for this question was 4.40, ratings varied depending on the activity participants
engaged in while in court. Those who were in court to file papers had a rating (4.58) that was statistically
significantly higher than those who were not in court for this activity (4.38).54
54 Independent t-test: t(233.8)=2.700, p=0.007, d=0.23
3% 4% 7%
22%
64%
StronglyDisagree
Disagree Neitheragree ordisagree
Agree Stronglyagree
86%
4.58
1 2 3 4 5
File(n=139)

2017
Cou
rt A
cces
s & F
airn
ess
Surv
ey R
epor
t
39
Ratings also varied according to the type of case that brought participants to court. Those who were in court
for traffic cases had a rating (4.22) that was statistically significantly lower than those who were not in
court for this type of case (4.44).55
Ratings varied according to the frequency with which participants visited the courthouse. Those who
visited a courthouse infrequently had a rating (4.31) that was statistically significantly lower than those
who visited a courthouse frequently (4.52).56
55 Independent t-test: t(138.2)=2.098, p=0.038, d=0.22 56 Independent t-test: t(965.3)=3.442, p=0.001, d=0.22
4.22
1 2 3 4 5
Traffic(n=112)
4.31
4.52
1 2 3 4 5
Frequently(n=450)
Infrequently(n=518)

2017
Cou
rt A
cces
s & F
airn
ess
Surv
ey R
epor
t
40
Ratings varied according to the location of the courthouse visited by participants. Those who visited a
courthouse in Region 3 had a rating (4.20) that was statistically significantly lower than those who visited
courthouses in other locations (4.43).57 Likewise, those who visited a courthouse in Region 2 had a rating
(4.24) that was statistically significantly lower than those who visited courthouses in other locations
(4.43).58 Those who visited a courthouse in Region 4 had a rating (4.58) that was statistically significantly
higher than those who visited courthouses in other locations (4.38).59 Likewise, those who visited a
courthouse in Region 8 had a rating (4.70) that was statistically significantly higher than those who visited
courthouses in other locations (4.36).60
57 Independent t-test: t(190.0)=2.384, p=0.018, d=0.22 58 Independent t-test: t(296.1)=2.412, p=0.016, d=0.19 59 Independent t-test: t(102.5)=2.054, p=0.043, d=0.21 60 Independent t-test: t(185.3)=4.640, p<0.001, d=0.39
4.24
4.20
4.70
4.58
1 2 3 4 5
Region 8(n=115)
Region 4(n=80)
Region 2(n=198)
Region 3(n=148)
2017
Cou
rt A
cces
s & F
airn
ess
Surv
ey R
epor
t
41
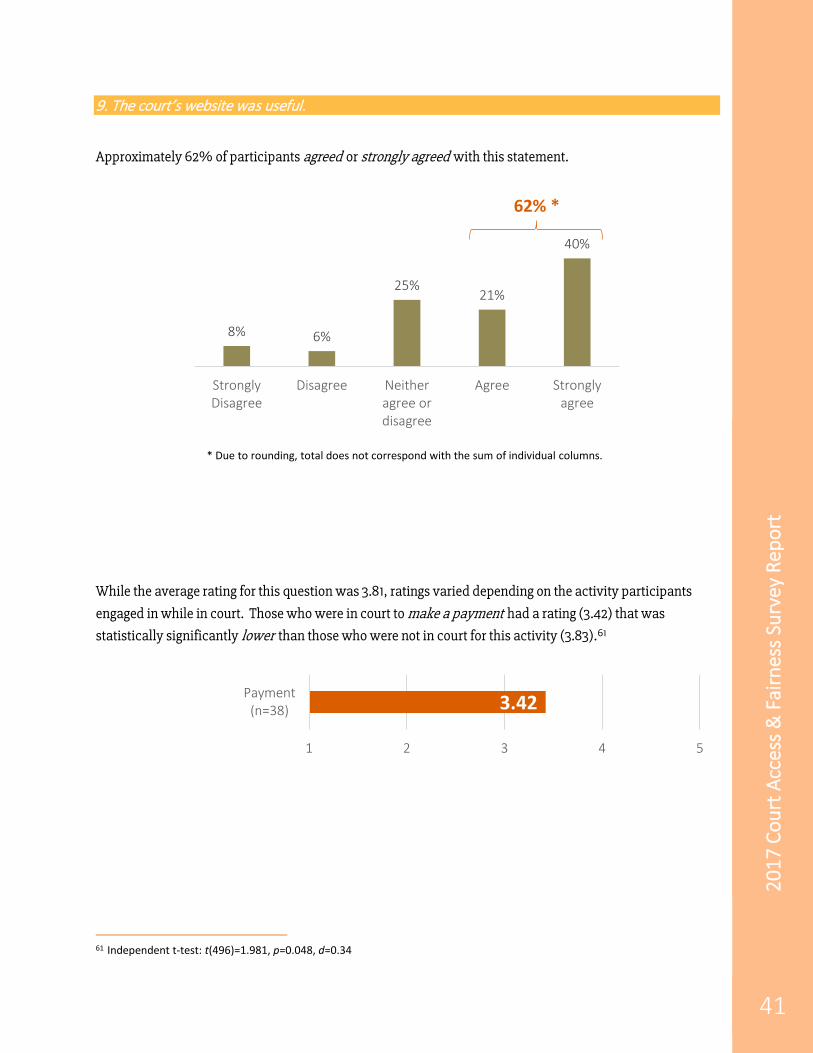
9. The court’s website was useful.
Approximately 62% of participants agreed or strongly agreed with this statement.
While the average rating for this question was 3.81, ratings varied depending on the activity participants
engaged in while in court. Those who were in court to make a payment had a rating (3.42) that was
statistically significantly lower than those who were not in court for this activity (3.83).61
61 Independent t-test: t(496)=1.981, p=0.048, d=0.34
8% 6%
25%21%
40%
StronglyDisagree
Disagree Neitheragree ordisagree
Agree Stronglyagree
62% *
* Due to rounding, total does not correspond with the sum of individual columns.
3.42
1 2 3 4 5
Payment(n=38)

2017
Cou
rt A
cces
s & F
airn
ess
Surv
ey R
epor
t
42
Ratings also varied according to the type of case that brought participants to court. Those who were in court
for traffic cases had a rating (3.28) that was statistically significantly lower than those who were not in
court for this type of case (3.89).62 Those who were in court for domestic violence/protection order cases
had a rating (3.43) that was statistically significantly lower than those who were not in court for this type of
case (3.85).63 Those who were in court for criminal cases had a rating (3.64) that was statistically
significantly lower than those who were not in court for this type of case (3.91).64
Ratings varied according to gender. Male participants had a rating (3.66) that was statistically significantly
lower than that of female participants (4.01).65
62 Independent t-test: t(541)=3.735, p<0.001, d=0.49 63 Independent t-test: t(541)=2.130, p=0.034, d=0.32 64 Independent t-test: t(541)=2.390, p=0.017, d=0.22 65 Independent t-test: t(551.9)=3.348, p=0.001, d=0.28
3.64
3.43
3.28
1 2 3 4 5
Criminal(n=176)
DV(n=42)
Traffic(n=64)
3.66
4.01
1 2 3 4 5
Female(n=249)
Male(n=307)
2017
Cou
rt A
cces
s & F
airn
ess
Surv
ey R
epor
t
43
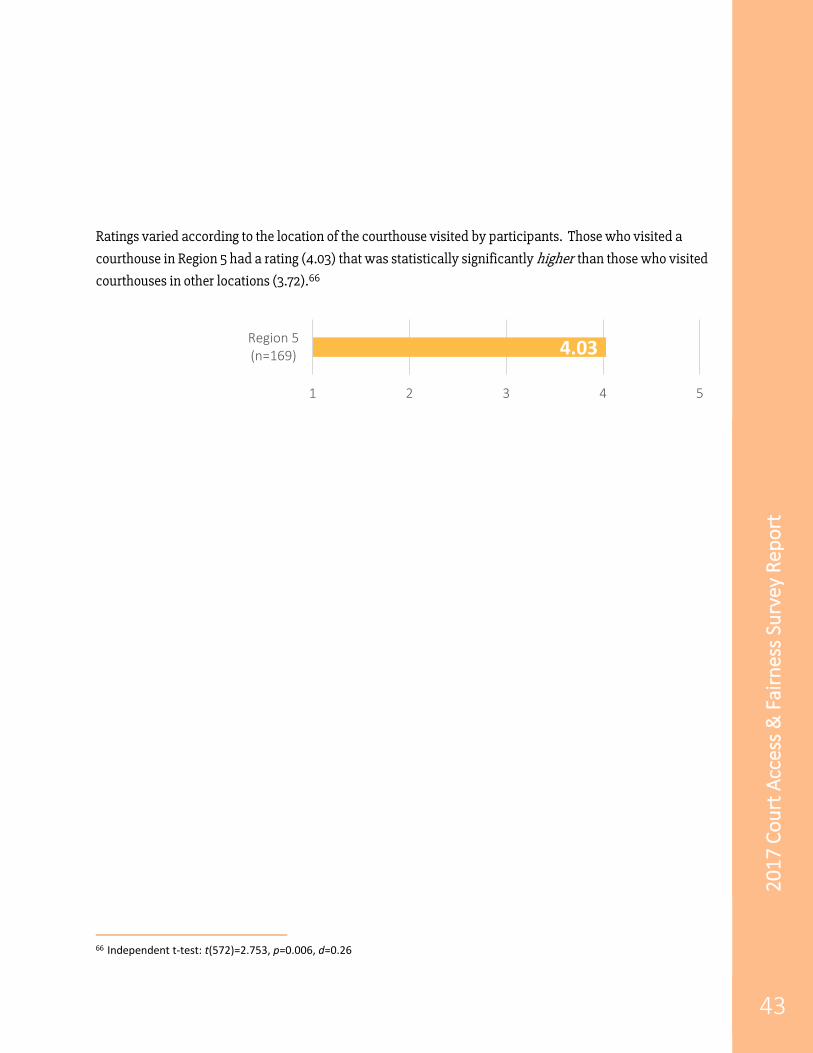
Ratings varied according to the location of the courthouse visited by participants. Those who visited a
courthouse in Region 5 had a rating (4.03) that was statistically significantly higher than those who visited
courthouses in other locations (3.72).66
66 Independent t-test: t(572)=2.753, p=0.006, d=0.26
4.03
1 2 3 4 5
Region 5(n=169)

2017
Cou
rt A
cces
s & F
airn
ess
Surv
ey R
epor
t
44
10. The court’s hours of operation made it easy for me to do my business.
Approximately 80% of participants agreed or strongly agreed with this statement.
While the average rating for this question was 4.21, ratings varied depending on the type of case that brought
participants to court. Those who were in court for traffic cases had a rating (3.92) that was statistically
significantly lower than those who were not in court for this type of case (4.26).67 Likewise, those who were
in court for criminal cases had a rating (4.07) that was statistically significantly lower than those who were
not in court for this type of case (4.29).68
67 Independent t-test: t(122.1)=2.599, p=0.010, d=0.29 68 Independent t-test: t(898)=2.849, p=0.004, d=0.20
4% 4%12%
26%
54%
StronglyDisagree
Disagree Neitheragree ordisagree
Agree Stronglyagree
80%
4.07
3.92
1 2 3 4 5
Criminal(n=282)
Traffic(n=105)

2017
Cou
rt A
cces
s & F
airn
ess
Surv
ey R
epor
t
45
Ratings varied according to the frequency with which participants visited the courthouse. Those who
visited a courthouse infrequently had a rating (4.13) that was statistically significantly lower than those
who visited a courthouse frequently (4.32).69
Ratings varied according to the location of the courthouse visited by participants. Those who visited a
courthouse in Region 8 had a rating (4.45) that was statistically significantly higher than those who visited
courthouses in other regions (4.18).70
69 Independent t-test: t(922.5)=2.656, p=0.008, d=0.17 70 Independent t-test: t(174.2)=3.185, p=0.002, d=0.28
4.13
4.32
1 2 3 4 5
Frequently(n=436)
Infrequently(n=489)
4.45
1 2 3 4 5
Region 8(n=110)
2017
Cou
rt A
cces
s & F
airn
ess
Surv
ey R
epor
t
46
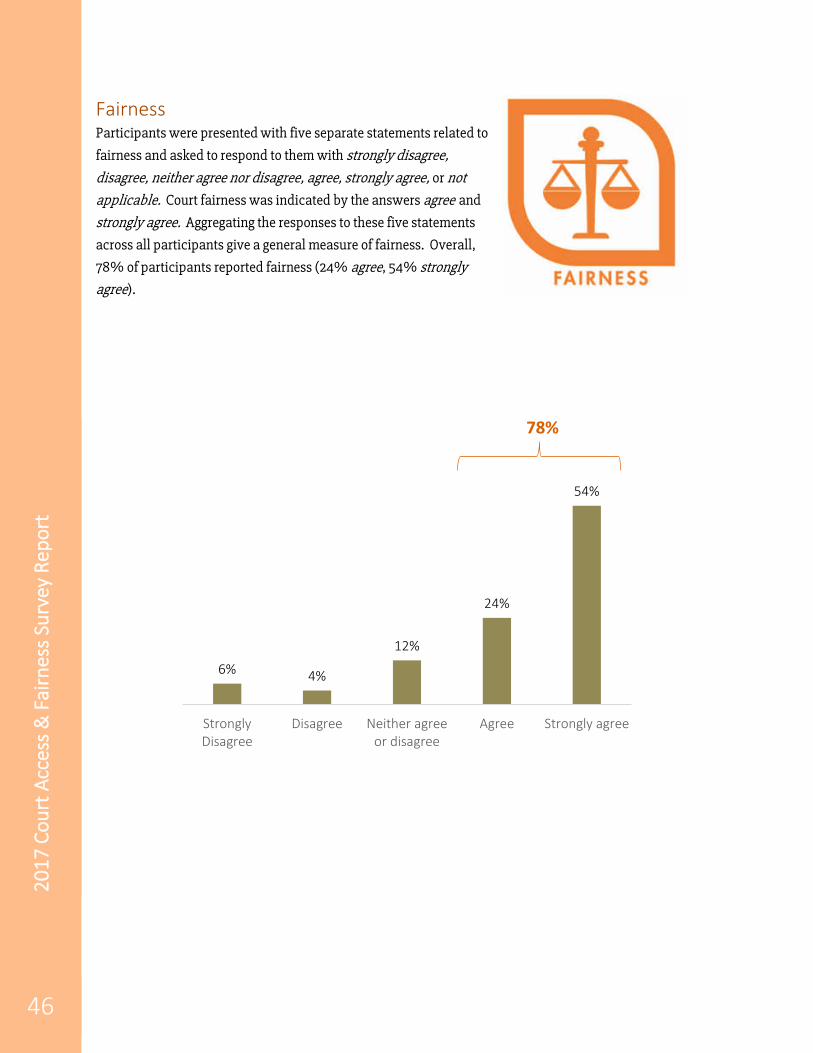
Fairness Participants were presented with five separate statements related to
fairness and asked to respond to them with strongly disagree,
disagree, neither agree nor disagree, agree, strongly agree, or not
applicable. Court fairness was indicated by the answers agree and
strongly agree. Aggregating the responses to these five statements
across all participants give a general measure of fairness. Overall,
78% of participants reported fairness (24% agree, 54% strongly agree).
6% 4%
12%
24%
54%
StronglyDisagree
Disagree Neither agreeor disagree
Agree Strongly agree
78%
2017
Cou
rt A
cces
s & F
airn
ess
Surv
ey R
epor
t
47
Fairness by Participant/Court Characteristics In order to compare court fairness between groups, researchers used the numeric scale associated with
each response category to calculate an average rating. The average court fairness rating across all
participants was 4.19. This rating indicates that most participants agreed (4) or strongly agreed (5) with
court fairness statements. However, this rating varied depending on characteristics of both participants
and courts. The following differences were statistically significant.
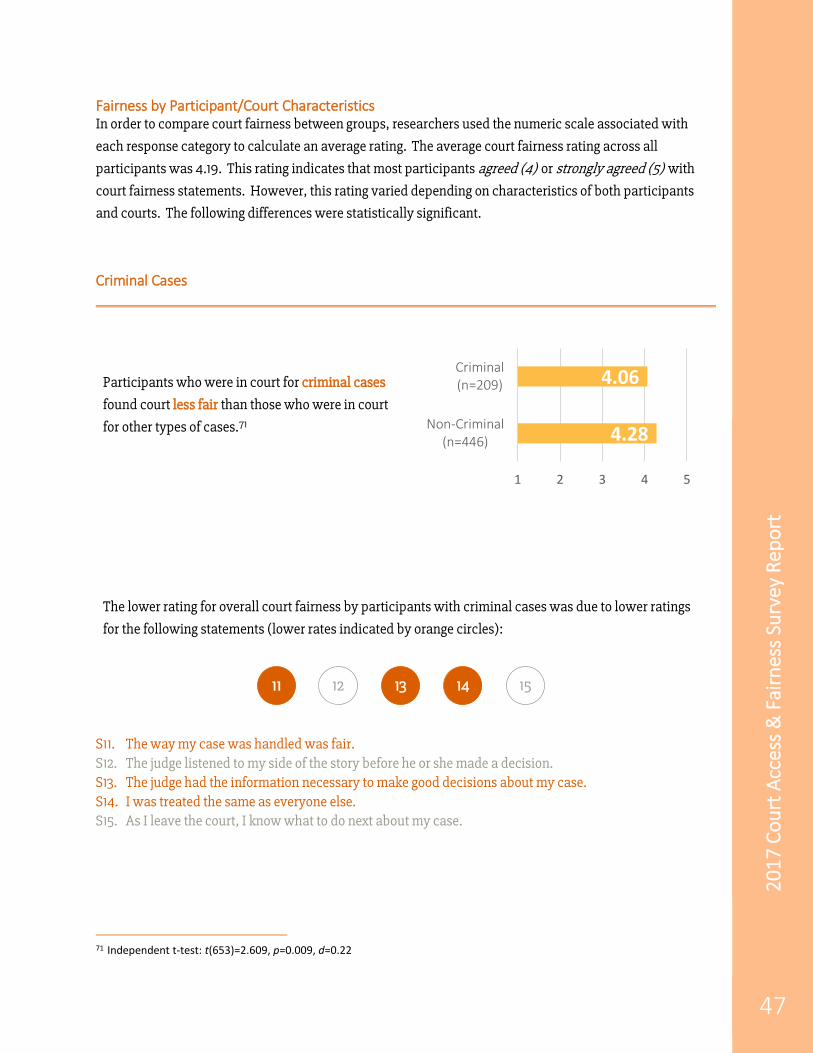
Criminal Cases
Participants who were in court for criminal cases
found court less fair than those who were in court
for other types of cases.71
The lower rating for overall court fairness by participants with criminal cases was due to lower ratings
for the following statements (lower rates indicated by orange circles):
S11. The way my case was handled was fair. S12. The judge listened to my side of the story before he or she made a decision. S13. The judge had the information necessary to make good decisions about my case. S14. I was treated the same as everyone else. S15. As I leave the court, I know what to do next about my case.
71 Independent t-test: t(653)=2.609, p=0.009, d=0.22
4.28
4.06
1 2 3 4 5
Non-Criminal(n=446)
Criminal(n=209)
11 12 13 14 15

2017
Cou
rt A
cces
s & F
airn
ess
Surv
ey R
epor
t
48
Divorce Cases
Participants who were in court for divorce cases
found court fairer than those who were in court for
other types of cases.72
The higher rating for overall court fairness by participants with divorce cases was due to higher ratings
for the following statements (higher rates indicated by yellow circles):
S11. The way my case was handled was fair. S12. The judge listened to my side of the story before he or she made a decision. S13. The judge had the information necessary to make good decisions about my case. S14. I was treated the same as everyone else. S15. As I leave the court, I know what to do next about my case.
72 Independent t-test: t(263.5)=2.500, p=0.013, d=0.23
4.17
4.38
1 2 3 4 5
Non-Divorce(n=511)
Divorce(n=144)
11 12 13 14 15

2017
Cou
rt A
cces
s & F
airn
ess
Surv
ey R
epor
t
49
Gender
Females found court fairer than males.73
The higher rating in overall court fairness by females was due to higher ratings for the following
statements (higher rates indicated by yellow circles):
S11. The way my case was handled was fair. S12. The judge listened to my side of the story before he or she made a decision. S13. The judge had the information necessary to make good decisions about my case. S14. I was treated the same as everyone else. S15. As I leave the court, I know what to do next about my case.
73 Independent t-test: t(639.0)=2.618, p=0.009, d=0.20
4.12
4.32
1 2 3 4 5
Male(n=371)
Female(n=289)
11 12 13 14 15
2017
Cou
rt A
cces
s & F
airn
ess
Surv
ey R
epor
t
50
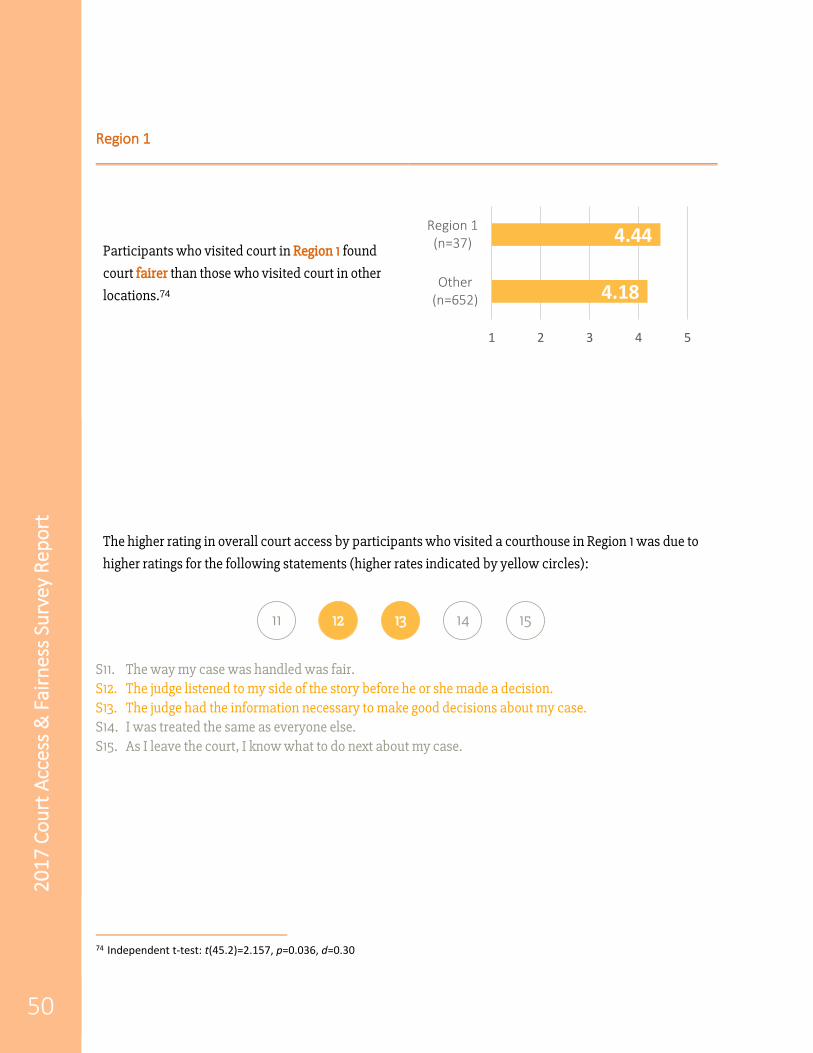
Region 1
Participants who visited court in Region 1 found
court fairer than those who visited court in other
locations.74
The higher rating in overall court access by participants who visited a courthouse in Region 1 was due to
higher ratings for the following statements (higher rates indicated by yellow circles):
S11. The way my case was handled was fair. S12. The judge listened to my side of the story before he or she made a decision. S13. The judge had the information necessary to make good decisions about my case. S14. I was treated the same as everyone else. S15. As I leave the court, I know what to do next about my case.
74 Independent t-test: t(45.2)=2.157, p=0.036, d=0.30
4.18
4.44
1 2 3 4 5
Other(n=652)
Region 1(n=37)
11 12 13 14 15
2017
Cou
rt A
cces
s & F
airn
ess
Surv
ey R
epor
t
51
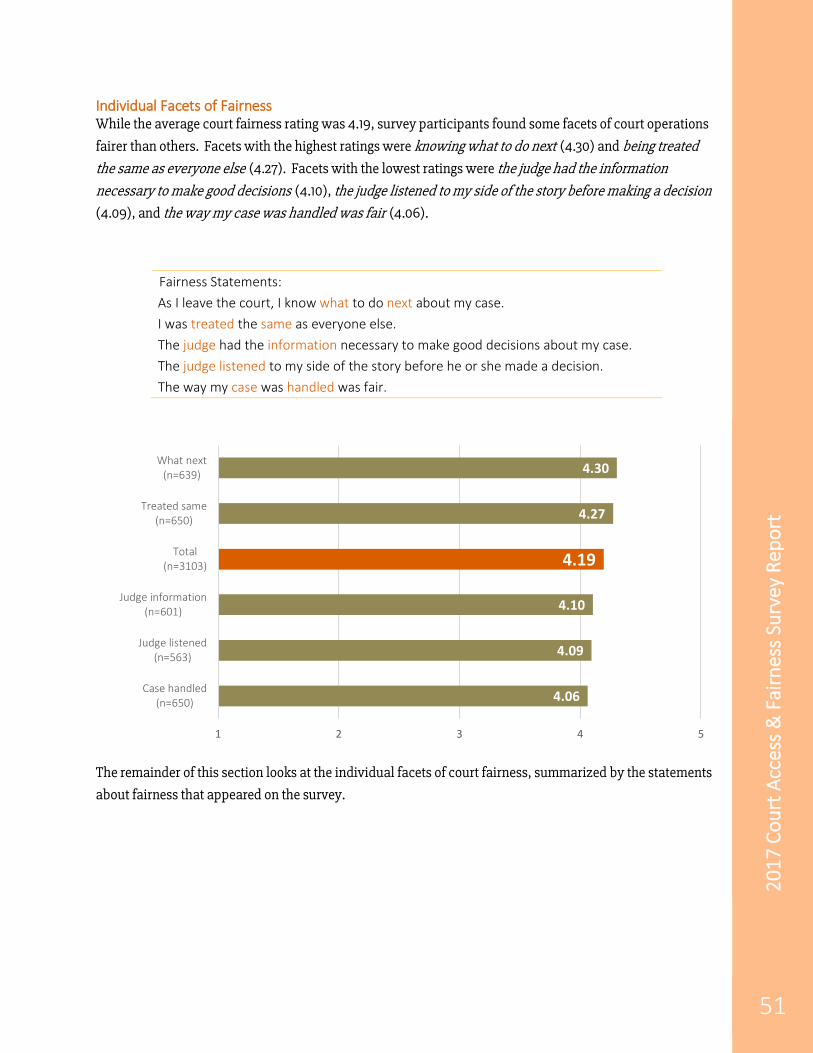
Individual Facets of Fairness While the average court fairness rating was 4.19, survey participants found some facets of court operations
fairer than others. Facets with the highest ratings were knowing what to do next (4.30) and being treated
the same as everyone else (4.27). Facets with the lowest ratings were the judge had the information
necessary to make good decisions (4.10), the judge listened to my side of the story before making a decision (4.09), and the way my case was handled was fair (4.06).
Fairness Statements: As I leave the court, I know what to do next about my case. I was treated the same as everyone else. The judge had the information necessary to make good decisions about my case. The judge listened to my side of the story before he or she made a decision. The way my case was handled was fair.
The remainder of this section looks at the individual facets of court fairness, summarized by the statements
about fairness that appeared on the survey.
4.06
4.09
4.10
4.19
4.27
4.30
1 2 3 4 5
Case handled(n=650)
Judge listened(n=563)
Judge information(n=601)
Total(n=3103)
Treated same(n=650)
What next(n=639)
2017
Cou
rt A
cces
s & F
airn
ess
Surv
ey R
epor
t
52
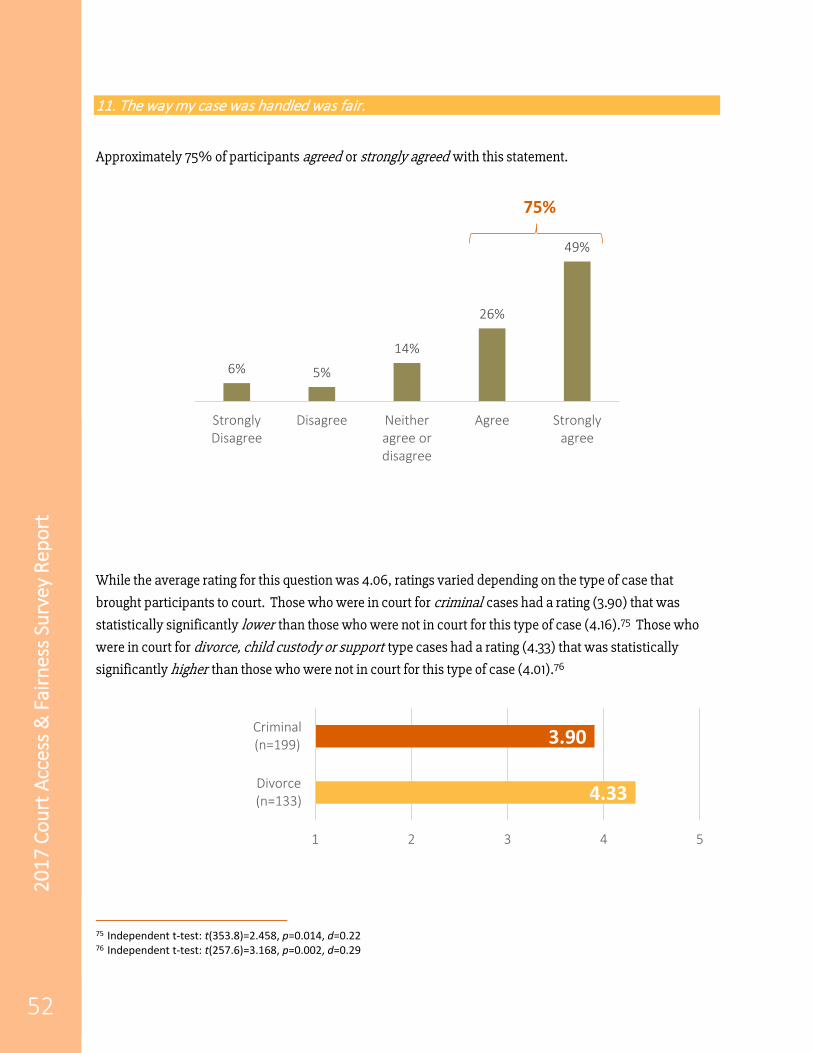
11. The way my case was handled was fair.
Approximately 75% of participants agreed or strongly agreed with this statement.
While the average rating for this question was 4.06, ratings varied depending on the type of case that
brought participants to court. Those who were in court for criminal cases had a rating (3.90) that was
statistically significantly lower than those who were not in court for this type of case (4.16).75 Those who
were in court for divorce, child custody or support type cases had a rating (4.33) that was statistically
significantly higher than those who were not in court for this type of case (4.01).76
75 Independent t-test: t(353.8)=2.458, p=0.014, d=0.22 76 Independent t-test: t(257.6)=3.168, p=0.002, d=0.29
6% 5%
14%
26%
49%
StronglyDisagree
Disagree Neitheragree ordisagree
Agree Stronglyagree
75%
3.90
4.33
1 2 3 4 5
Divorce(n=133)
Criminal(n=199)

2017
Cou
rt A
cces
s & F
airn
ess
Surv
ey R
epor
t
53
Rating varied according to the frequency with which participants visited the courthouse. Those who visited
a courthouse infrequently had a rating (3.96) that was statistically significantly lower than those who
visited the courthouse frequently (4.19).77
Ratings varied according to gender. Male participants had a rating (3.98) that was statistically significantly
lower than that of female participants (4.19).78
77 Independent t-test: t(625)=2.369, p=0.018, d=0.19 78 Independent t-test: t(620)=2.194, p=0.029, d=0.18
3.96
4.19
1 2 3 4 5
Frequently(n=286)
Infrequently(n=341)
3.98
4.19
1 2 3 4 5
Females(n=275)
Males(n=347)

2017
Cou
rt A
cces
s & F
airn
ess
Surv
ey R
epor
t
54
12. The judge listened to my side of the story before he or she made a decision.
Approximately 74% of participants agreed or strongly agreed with this statement.
While the average rating for this question was 4.09, ratings varied depending on the type of case that
brought participants to court. Those who were in court for divorce, child custody or support cases had a
rating (4.35) that was statistically significantly higher than those who were not in court for this type of case
(4.05).79
79 Independent t-test: t(234.6)=2.867, p=0.005, d=0.28
7% 4%
16%21%
52%
StronglyDisagree
Disagree Neitheragree ordisagree
Agree Stronglyagree
74%
* Due to rounding, total does not correspond with the sum of individual columns.
4.35
1 2 3 4 5
Divorce(n=119)
2017
Cou
rt A
cces
s & F
airn
ess
Surv
ey R
epor
t
55
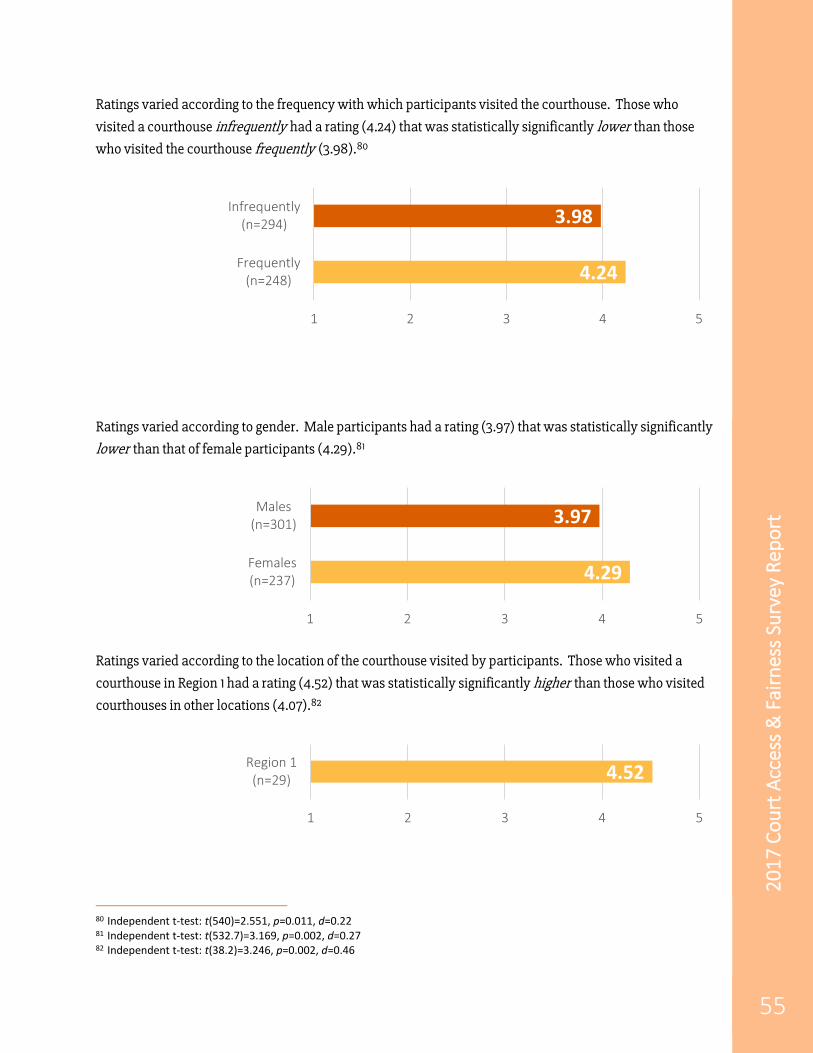
Ratings varied according to the frequency with which participants visited the courthouse. Those who
visited a courthouse infrequently had a rating (4.24) that was statistically significantly lower than those
who visited the courthouse frequently (3.98).80
Ratings varied according to gender. Male participants had a rating (3.97) that was statistically significantly
lower than that of female participants (4.29).81
Ratings varied according to the location of the courthouse visited by participants. Those who visited a
courthouse in Region 1 had a rating (4.52) that was statistically significantly higher than those who visited
courthouses in other locations (4.07).82
80 Independent t-test: t(540)=2.551, p=0.011, d=0.22 81 Independent t-test: t(532.7)=3.169, p=0.002, d=0.27 82 Independent t-test: t(38.2)=3.246, p=0.002, d=0.46
3.98
4.24
1 2 3 4 5
Frequently(n=248)
Infrequently(n=294)
3.97
4.29
1 2 3 4 5
Females(n=237)
Males(n=301)
4.52
1 2 3 4 5
Region 1(n=29)
2017
Cou
rt A
cces
s & F
airn
ess
Surv
ey R
epor
t
56
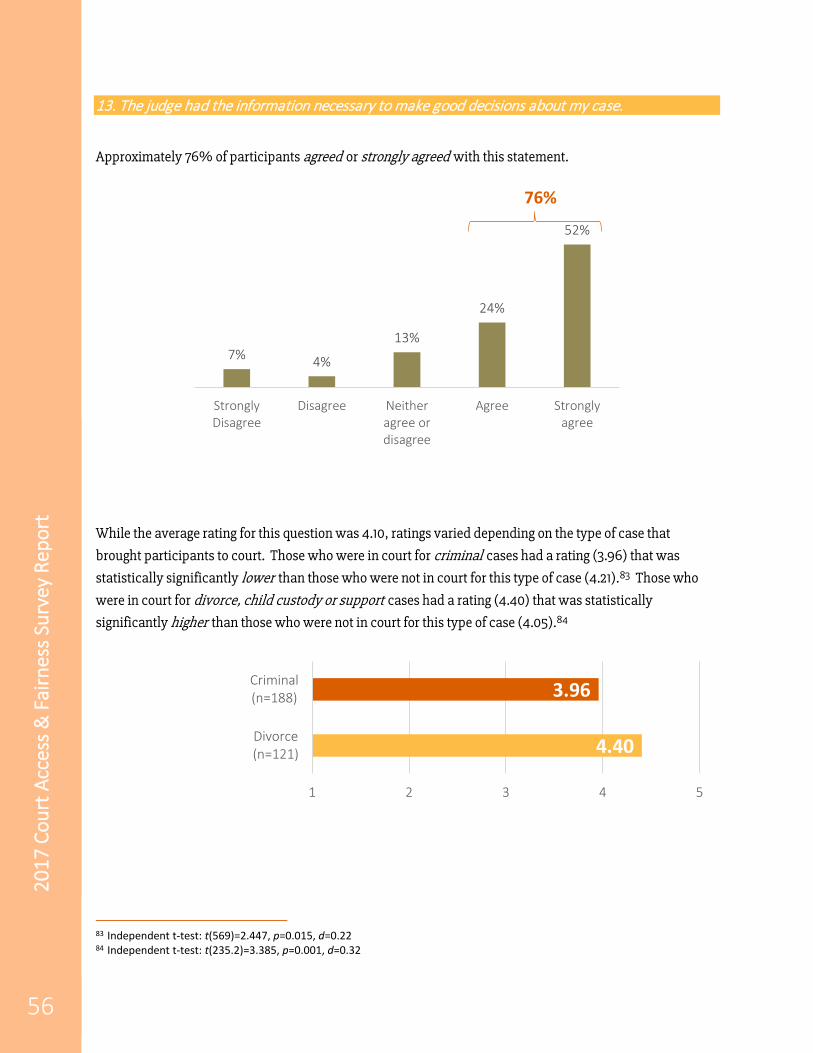
13. The judge had the information necessary to make good decisions about my case.
Approximately 76% of participants agreed or strongly agreed with this statement.
While the average rating for this question was 4.10, ratings varied depending on the type of case that
brought participants to court. Those who were in court for criminal cases had a rating (3.96) that was
statistically significantly lower than those who were not in court for this type of case (4.21).83 Those who
were in court for divorce, child custody or support cases had a rating (4.40) that was statistically
significantly higher than those who were not in court for this type of case (4.05).84
83 Independent t-test: t(569)=2.447, p=0.015, d=0.22 84 Independent t-test: t(235.2)=3.385, p=0.001, d=0.32
7% 4%
13%
24%
52%
StronglyDisagree
Disagree Neitheragree ordisagree
Agree Stronglyagree
76%
3.96
4.40
1 2 3 4 5
Divorce(n=121)
Criminal(n=188)
2017
Cou
rt A
cces
s & F
airn
ess
Surv
ey R
epor
t
57
Ratings varied according to the frequency with which participants visited the courthouse. Those who
visited a courthouse infrequently had a rating (4.01) that was statistically significantly lower than those
who visited the courthouse frequently (4.23).85
Ratings varied according to gender. Male participants had a rating (4.03) that was statistically significantly
lower than that of female participants (4.24).86
Ratings varied according to the location of the courthouse visited by participants. Those who visited a
courthouse in Region 6 had a rating (3.72) that was statistically significantly lower than those who visited
courthouses in other locations (4.13). 87 Those who visited a courthouse in Region 1 had a rating (4.42) that
was statistically significantly higher than those who visited courthouses in other locations (4.09).88
85 Independent t-test: t(578)=2.262, p=0.024, d=0.19 86 Independent t-test: t(573)=2.157, p=0.031, d=0.18 87 Independent t-test: t(599)=1.989, p=0.047, d=0.31 88 Independent t-test: t(38.7)=2.265, p=0.029, d=0.33
4.01
4.23
1 2 3 4 5
Frequently(n=267)
Infrequently(n=313)
4.03
4.24
1 2 3 4 5
Females(n=253)
Males(n=322)
3.72
4.42
1 2 3 4 5
Region 1(n=31)
Region 6(n=36)

2017
Cou
rt A
cces
s & F
airn
ess
Surv
ey R
epor
t
58
14. I was treated the same as everyone else.
Approximately 82% of participants agreed or strongly agreed with this statement.
While the average rating for this question was 4.27, ratings varied depending on the type of case that
brought participants to court. Those who were in court for criminal cases had a rating (4.16) that was
statistically significantly lower than those who were not in court for this type of case (4.35).89 Those who
were in court for divorce, child custody or support cases had a rating (4.45) that was statistically
significantly higher than those who were not in court for this type of case (4.24).90
89 Independent t-test: t(617)=2.007, p=0.045, d=0.17 90 Independent t-test: t(250.5)=2.132, p=0.034, d=0.20
5% 3%10%
23%
59%
StronglyDisagree
Disagree Neitheragree ordisagree
Agree Stronglyagree
82%
4.16
4.45
1 2 3 4 5
Divorce(n=137)
Criminal(n=196)
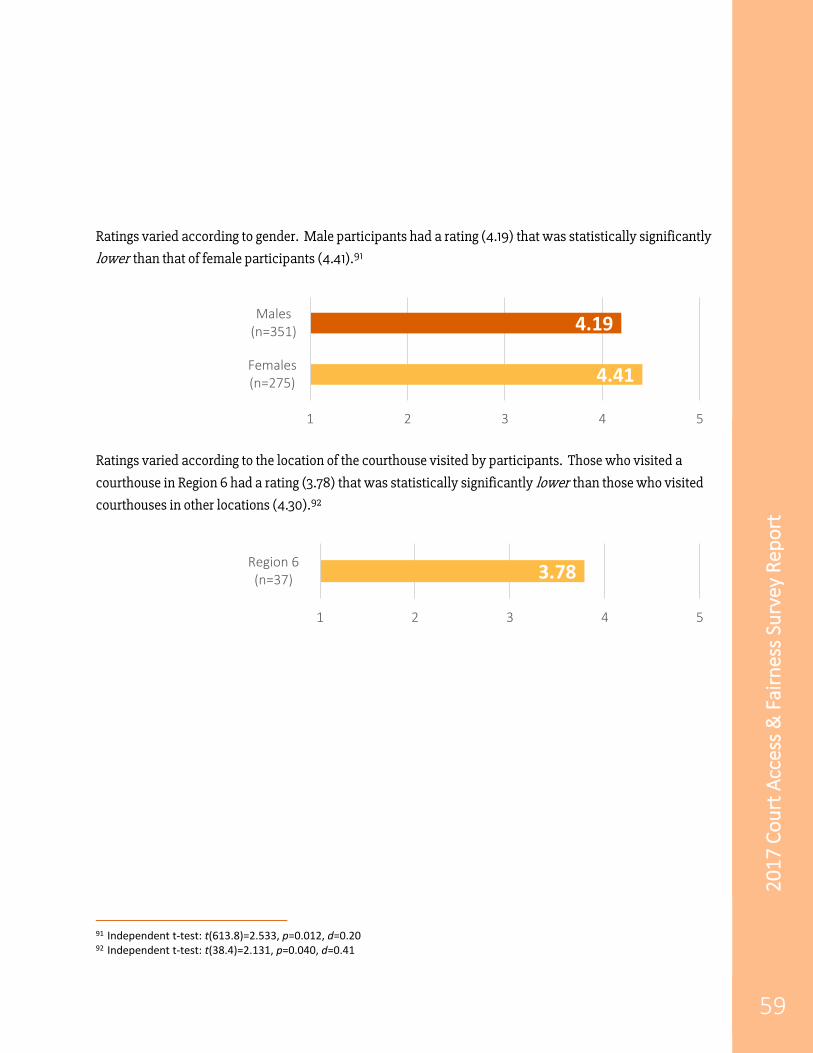
2017
Cou
rt A
cces
s & F
airn
ess
Surv
ey R
epor
t
59
Ratings varied according to gender. Male participants had a rating (4.19) that was statistically significantly
lower than that of female participants (4.41).91
Ratings varied according to the location of the courthouse visited by participants. Those who visited a
courthouse in Region 6 had a rating (3.78) that was statistically significantly lower than those who visited
courthouses in other locations (4.30).92
91 Independent t-test: t(613.8)=2.533, p=0.012, d=0.20 92 Independent t-test: t(38.4)=2.131, p=0.040, d=0.41
4.19
4.41
1 2 3 4 5
Females(n=275)
Males(n=351)
3.78
1 2 3 4 5
Region 6(n=37)

2017
Cou
rt A
cces
s & F
airn
ess
Surv
ey R
epor
t
60
15. As I leave court, I know what to do next about my case.
Approximately 83% of participants agreed or strongly agreed with this statement.
While the average rating for this question was 4.30, ratings varied depending on the type of case that
brought participants to court. Those who were in court for domestic violence/protection order cases had a
rating (4.00) that was statistically significantly lower than those who were not in court for this type of case
(4.35).93
93 Independent t-test: t(606)=2.313, p=0.021, d=0.32
4% 3%10%
24%
59%
StronglyDisagree
Disagree Neitheragree ordisagree
Agree Stronglyagree
83%
4.00
1 2 3 4 5
DV(n=49)

2017
Cou
rt A
cces
s & F
airn
ess
Surv
ey R
epor
t
61
Ratings varied according to the frequency with which participants visited the courthouse. Those who
visited a courthouse infrequently had a rating (4.23) that was statistically significantly lower than those
who visited the courthouse frequently (4.41).94
Ratings varied according to gender. Male participants had a rating (4.23) that was statistically significantly
lower than that of female participants (4.45).95
94 Independent t-test: t(617)=2.067, p=0.039, d=0.17 95 Independent t-test: t(599.9)=2.600, p=0.010, d=0.21
4.23
4.41
1 2 3 4 5
Frequently(n=279)
Infrequently(n=340)
4.23
4.45
1 2 3 4 5
Females(n=266)
Males(n=349)
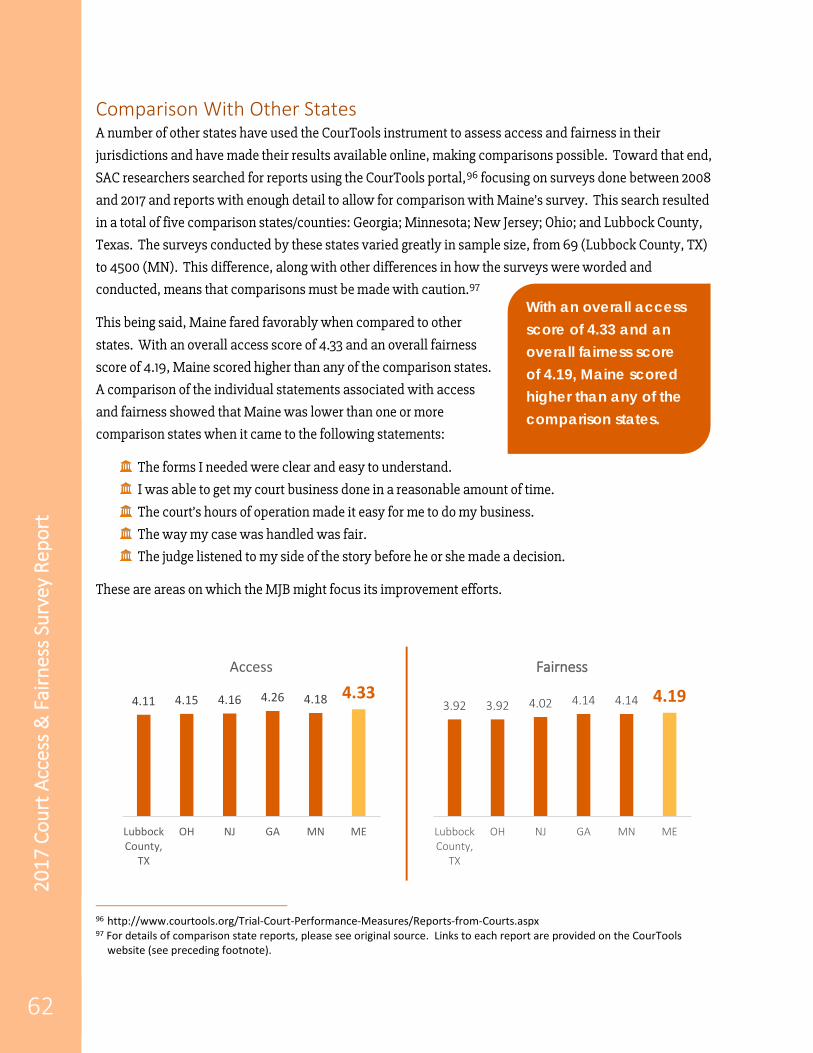
2017
Cou
rt A
cces
s & F
airn
ess
Surv
ey R
epor
t
62
Comparison With Other States A number of other states have used the CourTools instrument to assess access and fairness in their
jurisdictions and have made their results available online, making comparisons possible. Toward that end,
SAC researchers searched for reports using the CourTools portal,96 focusing on surveys done between 2008
and 2017 and reports with enough detail to allow for comparison with Maine’s survey. This search resulted
in a total of five comparison states/counties: Georgia; Minnesota; New Jersey; Ohio; and Lubbock County,
Texas. The surveys conducted by these states varied greatly in sample size, from 69 (Lubbock County, TX)
to 4500 (MN). This difference, along with other differences in how the surveys were worded and
conducted, means that comparisons must be made with caution.97
This being said, Maine fared favorably when compared to other
states. With an overall access score of 4.33 and an overall fairness
score of 4.19, Maine scored higher than any of the comparison states.
A comparison of the individual statements associated with access
and fairness showed that Maine was lower than one or more
comparison states when it came to the following statements:
The forms I needed were clear and easy to understand.
I was able to get my court business done in a reasonable amount of time.
The court’s hours of operation made it easy for me to do my business.
The way my case was handled was fair.
The judge listened to my side of the story before he or she made a decision.
These are areas on which the MJB might focus its improvement efforts.
96 http://www.courtools.org/Trial-Court-Performance-Measures/Reports-from-Courts.aspx 97 For details of comparison state reports, please see original source. Links to each report are provided on the CourTools
website (see preceding footnote).
4.11 4.15 4.16 4.26 4.18 4.33
LubbockCounty,
TX
OH NJ GA MN ME
Access
3.92 3.92 4.02 4.14 4.14 4.19
LubbockCounty,
TX
OH NJ GA MN ME
Fairness
With an overall access score of 4.33 and an overall fairness score of 4.19, Maine scored higher than any of the comparison states.
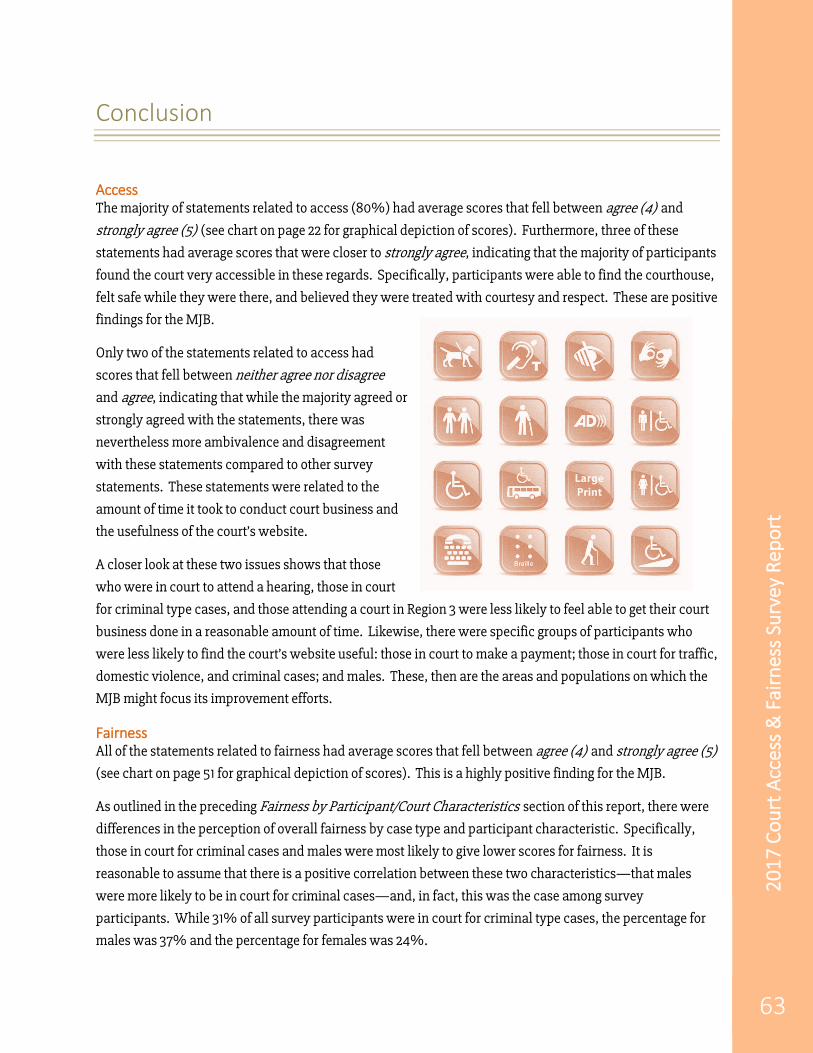
2017
Cou
rt A
cces
s & F
airn
ess
Surv
ey R
epor
t
63
Conclusion
Access The majority of statements related to access (80%) had average scores that fell between agree (4) and
strongly agree (5) (see chart on page 22 for graphical depiction of scores). Furthermore, three of these
statements had average scores that were closer to strongly agree, indicating that the majority of participants
found the court very accessible in these regards. Specifically, participants were able to find the courthouse,
felt safe while they were there, and believed they were treated with courtesy and respect. These are positive
findings for the MJB.
Only two of the statements related to access had
scores that fell between neither agree nor disagree
and agree, indicating that while the majority agreed or
strongly agreed with the statements, there was
nevertheless more ambivalence and disagreement
with these statements compared to other survey
statements. These statements were related to the
amount of time it took to conduct court business and
the usefulness of the court’s website.
A closer look at these two issues shows that those
who were in court to attend a hearing, those in court
for criminal type cases, and those attending a court in Region 3 were less likely to feel able to get their court
business done in a reasonable amount of time. Likewise, there were specific groups of participants who
were less likely to find the court’s website useful: those in court to make a payment; those in court for traffic,
domestic violence, and criminal cases; and males. These, then are the areas and populations on which the
MJB might focus its improvement efforts.
Fairness All of the statements related to fairness had average scores that fell between agree (4) and strongly agree (5) (see chart on page 51 for graphical depiction of scores). This is a highly positive finding for the MJB.
As outlined in the preceding Fairness by Participant/Court Characteristics section of this report, there were
differences in the perception of overall fairness by case type and participant characteristic. Specifically,
those in court for criminal cases and males were most likely to give lower scores for fairness. It is
reasonable to assume that there is a positive correlation between these two characteristics—that males
were more likely to be in court for criminal cases—and, in fact, this was the case among survey
participants. While 31% of all survey participants were in court for criminal type cases, the percentage for
males was 37% and the percentage for females was 24%.

2017
Cou
rt A
cces
s & F
airn
ess
Surv
ey R
epor
t
64
When these characteristics are teased apart, however, the picture becomes more complex. Males and
females in court for criminal cases had similar scores (4.1 and 4.0, respectively), while males in court for
non-criminal cases had statistically significantly lower scores than females in court for non-criminal
cases.98 Thus, the difference in fairness score between males and females cannot be explained by criminal
case type; the difference persists among males and females with other case types.
Case Type
Criminal Non-Criminal
Gender
Female 4.0
(n=65) 4.4
(n=214)
Male 4.1
(n=141) 4.2
(n=222)
This persisting gender difference can be attributed to the rankings of males and females in divorce, child
custody, or support cases. A little under a quarter of all participants (24%) indicated divorce, child
custody, or support as the type of case that brought them to court, second only to criminal cases. Overall,
those who were in court for this type of case had a high fairness score (4.38), but scores differed by gender;
males had an average fairness score of 4.2 while females had an average score of 4.5, a statistically
significantly difference.99
In summary, overall fairness scores were lower for those in court for criminal cases (regardless of gender)
and males in court for divorce, child custody, or support cases. The MJB might target its efforts to increase
perceptions of fairness on these two populations.
98 Independent t-test: t(430.5)=2.682, p=0.008, d=0.26 99 Independent t-test: t(141)=2.219, p=0.028, d=0.37

2017
Cou
rt A
cces
s & F
airn
ess
Surv
ey R
epor
t
65
Appendix

Judicial Branch Survey
Name/Location of Court:_____________________________________________
Section I: Access to the Court n/a Circle the number.
1. Finding the courthouse was easy. 1 2 3 4 5 n/a 2. The forms I needed were clear and easy to understand. 1 2 3 4 5 n/a 3. I felt safe in the courthouse. 1 2 3 4 5 n/a 4. The court makes reasonable efforts to remove physical and language barriers to service. 1 2 3 4 5 n/a 5. I was able to get my court business done in a reasonable amount of time. 1 2 3 4 5 n/a 6. Court staff paid attention to my needs. 1 2 3 4 5 n/a 7. I was treated with courtesy and respect. 1 2 3 4 5 n/a 8. I easily found the courtroom or office I needed. 1 2 3 4 5 n/a 9. The Court’s Web site was useful. 1 2 3 4 5 n/a 10. The Court’s hours of operation made it easy for me to do my business. 1 2 3 4 5 n/a If you are party to a legal matter and appeared before a judicial officer today, complete questions 11-15:
Section II: Fairness Circle the number. 11. The way my case was handled was fair. 1 2 3 4 5 n/a 12. The judge listened to my side of the story before he or she made a decision. 1 2 3 4 5 n/a 13. The judge had the information necessary to make good decisions about my case. 1 2 3 4 5 n/a 14. I was treated the same as everyone else. 1 2 3 4 5 n/a 15. As I leave the court, I know what to do next about my case. 1 2 3 4 5 n/a
Section III: Background Information (check all that apply for each category)
What did you do at the court today? What type of case brought you to the courthouse today?
How do you identify yourself?
____Search court records/obtain documents ____Traffic ____American Indian or Alaska Native ____File papers ____Criminal ____Asian ____Make a payment ____Civil matter ____Black or African American ____Get information ____Divorce, child custody or support ____Hispanic or Latino ____Appear as a witness ____Juvenile matter ____Native Hawaiian/Other Pacific Islander ____Jury duty ____Small claims ____White ____Attend a hearing or trial ____Landlord/Tenant ____Mixed Race ____Registry of Deeds or Probate ____Domestic Violence/Protection Order ____Other:____________________________ ____Party to a legal matter ____Foreclosure ____ Prefer Not to Answer ____Mediation or Arbitration ____Informational Session ____Other:________________________
If you are a party in a court case/legal matter, are you represented by an attorney in the case? ___Yes ___No
How often are you typically in this courthouse? What is your gender?
____First time in this courthouse ____Male ____Once a year or less ____Female ____Several times a year ____Other ____Regularly ____ Prefer Not to Answer
1 2 3 4 5

About the Muskie School of Public Service
The Muskie School of Public Service is Maine’s distinguished public policy school, combining an extensive
applied research and technical assistance portfolio with rigorous undergraduate and graduate degree programs in
geography-anthropology; policy, planning, and management (MPPM); and public health (MPH). The school is
nationally recognized for applying innovative knowledge to critical issues in the fields of sustainable development
and health and human service policy and management, and is home to the Cutler Institute for Health and Social
Policy.
About the Cutler Institute for Health and Social Policy
The Cutler Institute for Health and Social Policy at the Muskie School of Public Service is dedicated to developing
innovative, evidence-informed, and practical approaches to pressing health and social challenges faced by
individuals, families, and communities.
About the Maine Statistical Analysis Center
The Maine Statistical Analysis Center (SAC) informs policy development and improvement of practice in Maine’s
criminal and juvenile justice systems. A partnership between the University of Southern Maine Muskie School of
Public Service and the Maine Department of Corrections, SAC collaborates with numerous community-based and
governmental agencies. SAC conducts applied research, evaluates programs and new initiatives, and provides
technical assistance, consultation and organizational development services. The Maine Statistical Analysis Center
is funded by the Bureau of Justice Statistics and supported by the Justice Research Statistics Association.
US Department of Justice
The Law Enforcement Data Use Survey and Report were conducted under the auspices of the State Justice
Statistics Program, Bureau of Justice Statistics (BJS), Department of Justice (DOJ). Funding for this initiative was
provided by the BJS grant 2016–BJ–CX–K006.
Maine SAC website: http://muskie.usm.maine.edu/justiceresearch

MUSKIE SCHOOL OF PUBLIC SERVICE
University of Southern Maine PO Box 9300
Portland, Maine 04014-9300 www.usm.maine.edu/muskie
A member of the University of Maine System
This report is available on the Maine Statistical Analysis Center Website at: http://muskie.usm.maine.edu/justiceresearch/Publications/Adult/2017_Court_Access_&_Fairness_Survey_Report.pdf