2017 Corn Silage Field Crop Trials Results Plot Data/2017 Minnesota... · early and late corn...
14
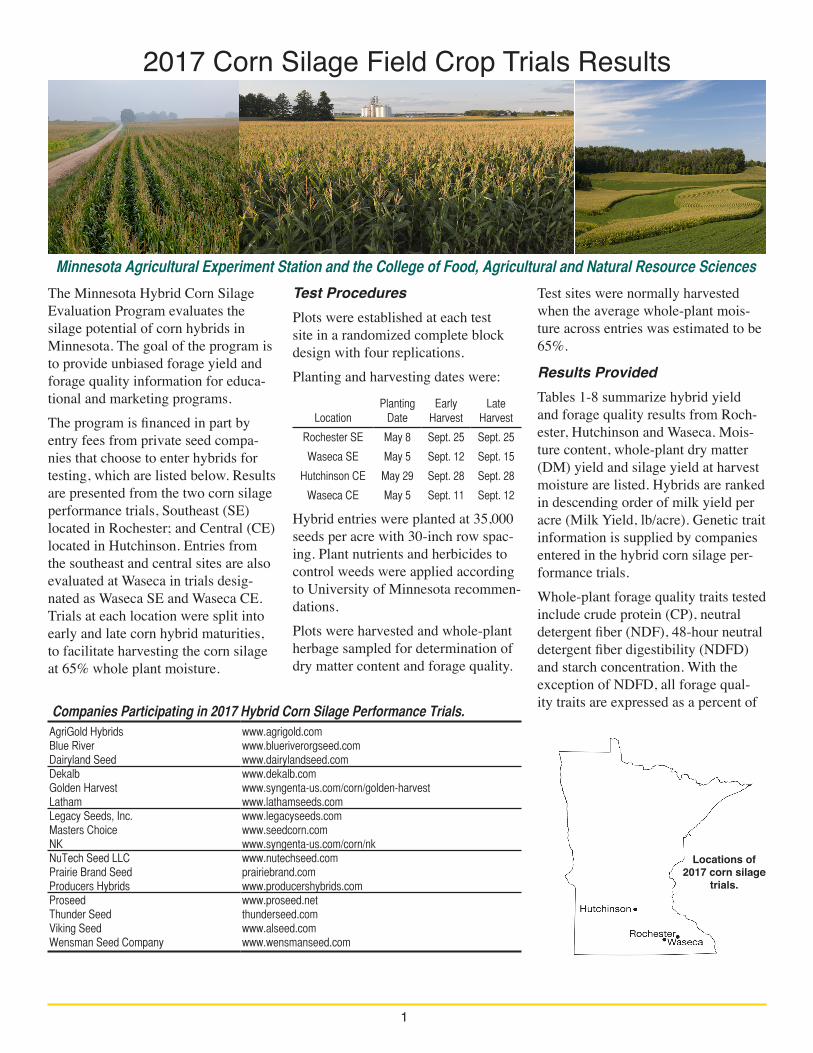
1 The Minnesota Hybrid Corn Silage Evaluation Program evaluates the silage potential of corn hybrids in Minnesota. The goal of the program is to provide unbiased forage yield and forage quality information for educa- tional and marketing programs. The program is financed in part by entry fees from private seed compa- nies that choose to enter hybrids for testing, which are listed below. Results are presented from the two corn silage performance trials, Southeast (SE) located in Rochester; and Central (CE) located in Hutchinson. Entries from the southeast and central sites are also evaluated at Waseca in trials desig- nated as Waseca SE and Waseca CE. Trials at each location were split into early and late corn hybrid maturities, to facilitate harvesting the corn silage at 65% whole plant moisture. Test Procedures Plots were established at each test site in a randomized complete block design with four replications. Planting and harvesting dates were: Location Planting Date Early Harvest Late Harvest Rochester SE May 8 Sept. 25 Sept. 25 Waseca SE May 5 Sept. 12 Sept. 15 Hutchinson CE May 29 Sept. 28 Sept. 28 Waseca CE May 5 Sept. 11 Sept. 12 Hybrid entries were planted at 35,000 seeds per acre with 30-inch row spac- ing. Plant nutrients and herbicides to control weeds were applied according to University of Minnesota recommen- dations. Plots were harvested and whole-plant herbage sampled for determination of dry matter content and forage quality. Test sites were normally harvested when the average whole-plant mois- ture across entries was estimated to be 65%. Results Provided Tables 1-8 summarize hybrid yield and forage quality results from Roch- ester, Hutchinson and Waseca. Mois- ture content, whole-plant dry matter (DM) yield and silage yield at harvest moisture are listed. Hybrids are ranked in descending order of milk yield per acre (Milk Yield, lb/acre). Genetic trait information is supplied by companies entered in the hybrid corn silage per- formance trials. Whole-plant forage quality traits tested include crude protein (CP), neutral detergent fiber (NDF), 48-hour neutral detergent fiber digestibility (NDFD) and starch concentration. With the exception of NDFD, all forage qual- ity traits are expressed as a percent of 2017 Corn Silage Field Crop Trials Results Minnesota Agricultural Experiment Station and the College of Food, Agricultural and Natural Resource Sciences Locations of 2017 corn silage trials. Companies Participating in 2017 Hybrid Corn Silage Performance Trials. AgriGold Hybrids www.agrigold.com Blue River www.blueriverorgseed.com Dairyland Seed www.dairylandseed.com Dekalb www.dekalb.com Golden Harvest www.syngenta-us.com/corn/golden-harvest Latham www.lathamseeds.com Legacy Seeds, Inc. www.legacyseeds.com Masters Choice www.seedcorn.com NK www.syngenta-us.com/corn/nk NuTech Seed LLC www.nutechseed.com Prairie Brand Seed prairiebrand.com Producers Hybrids www.producershybrids.com Proseed www.proseed.net Thunder Seed thunderseed.com Viking Seed www.alseed.com Wensman Seed Company www.wensmanseed.com
Transcript of 2017 Corn Silage Field Crop Trials Results Plot Data/2017 Minnesota... · early and late corn...
1
The Minnesota Hybrid Corn Silage Evaluation Program evaluates the silage potential of corn hybrids in Minnesota. The goal of the program is to provide unbiased forage yield and forage quality information for educa-tional and marketing programs.The program is financed in part by entry fees from private seed compa-nies that choose to enter hybrids for testing, which are listed below. Results are presented from the two corn silage performance trials, Southeast (SE) located in Rochester; and Central (CE) located in Hutchinson. Entries from the southeast and central sites are also evaluated at Waseca in trials desig-nated as Waseca SE and Waseca CE. Trials at each location were split into early and late corn hybrid maturities, to facilitate harvesting the corn silage at 65% whole plant moisture.
Test ProceduresPlots were established at each test site in a randomized complete block design with four replications. Planting and harvesting dates were:
LocationPlanting
DateEarly
HarvestLate
Harvest
Rochester SE May 8 Sept. 25 Sept. 25
Waseca SE May 5 Sept. 12 Sept. 15
Hutchinson CE May 29 Sept. 28 Sept. 28
Waseca CE May 5 Sept. 11 Sept. 12
Hybrid entries were planted at 35,000 seeds per acre with 30-inch row spac-ing. Plant nutrients and herbicides to control weeds were applied according to University of Minnesota recommen-dations.Plots were harvested and whole-plant herbage sampled for determination of dry matter content and forage quality.
Test sites were normally harvested when the average whole-plant mois-ture across entries was estimated to be 65%.
Results ProvidedTables 1-8 summarize hybrid yield and forage quality results from Roch-ester, Hutchinson and Waseca. Mois-ture content, whole-plant dry matter (DM) yield and silage yield at harvest moisture are listed. Hybrids are ranked in descending order of milk yield per acre (Milk Yield, lb/acre). Genetic trait information is supplied by companies entered in the hybrid corn silage per-formance trials.Whole-plant forage quality traits tested include crude protein (CP), neutral detergent fiber (NDF), 48-hour neutral detergent fiber digestibility (NDFD) and starch concentration. With the exception of NDFD, all forage qual-ity traits are expressed as a percent of
2017 Corn Silage Field Crop Trials Results
Minnesota Agricultural Experiment Station and the College of Food, Agricultural and Natural Resource Sciences
Locations of 2017 corn silage
trials.
Companies Participating in 2017 Hybrid Corn Silage Performance Trials.AgriGold Hybrids www.agrigold.comBlue River www.blueriverorgseed.comDairyland Seed www.dairylandseed.comDekalb www.dekalb.comGolden Harvest www.syngenta-us.com/corn/golden-harvestLatham www.lathamseeds.comLegacy Seeds, Inc. www.legacyseeds.comMasters Choice www.seedcorn.comNK www.syngenta-us.com/corn/nkNuTech Seed LLC www.nutechseed.comPrairie Brand Seed prairiebrand.comProducers Hybrids www.producershybrids.comProseed www.proseed.netThunder Seed thunderseed.comViking Seed www.alseed.comWensman Seed Company www.wensmanseed.com
2
University of Minnesota 2017 Corn Silage
dry matter. NDFD is expressed as a percent of NDF.Milk production potential per ton (lb milk/ton forage) and per acre (lb milk/acre) of forage was calculated using the MILK2006 spreadsheet devel-oped by the University of Wisconsin. MILK2006 approximates animal performance based on a standard cow weight and milk production level (1,350 lb body weight and 90 lb/day at 3.8% fat).Field values for moisture and DM yield at harvest; laboratory values for CP, NDF, NDFD, starch, oil and ash concentration; and book values for NDFCP (1.3%) were used for spread-sheet calculations. For MILK2006 predictions, we assumed that kernel processing occurred. Milk production (lb milk/ton and lb milk/acre) values can be used as a quick reference for
relative comparison of hybrids within test locations.
How to Use ResultsNDF is a negative indicator of forage intake potential; higher NDF concen-tration generally implies lower intake potential. NDFD estimates digest-ibility of the fiber fraction. Starch concentration is positively associated with digestibility because of its high digestibility. Relatively higher NDFD and/or starch concentrations generally imply greater animal performance po-tential. Milk yield per acre represents the combined effects of silage yield and quality.Corn hybrids differed in yield, forage quality and milk production potential at all sites. Means and least signifi-cant difference (LSD) values at the 10% probability level are shown for each parameter. Where the difference
between two hybrids for a particular yield or quality trait is greater than the LSD value, there is a 90% probability that there is a statistically significant difference between the two hybrids for that parameter (i.e., moisture, yield, quality concentration or milk produc-tion). A difference less than the LSD value probably is due to environmental factors.Figures 1-4 summarize the relationship between silage dry matter yield and milk per ton for test sites at Rochester, Waseca and Hutchinson. The figures also highlight those entries at each site that have a combination of high silage dry matter yields and milk production per ton.
Project LeadersCraig Sheaffer, M. Scott Wells, Thom-as Hoverstad and Joshua Larson.
3
University of Minnesota 2017 Corn Silage
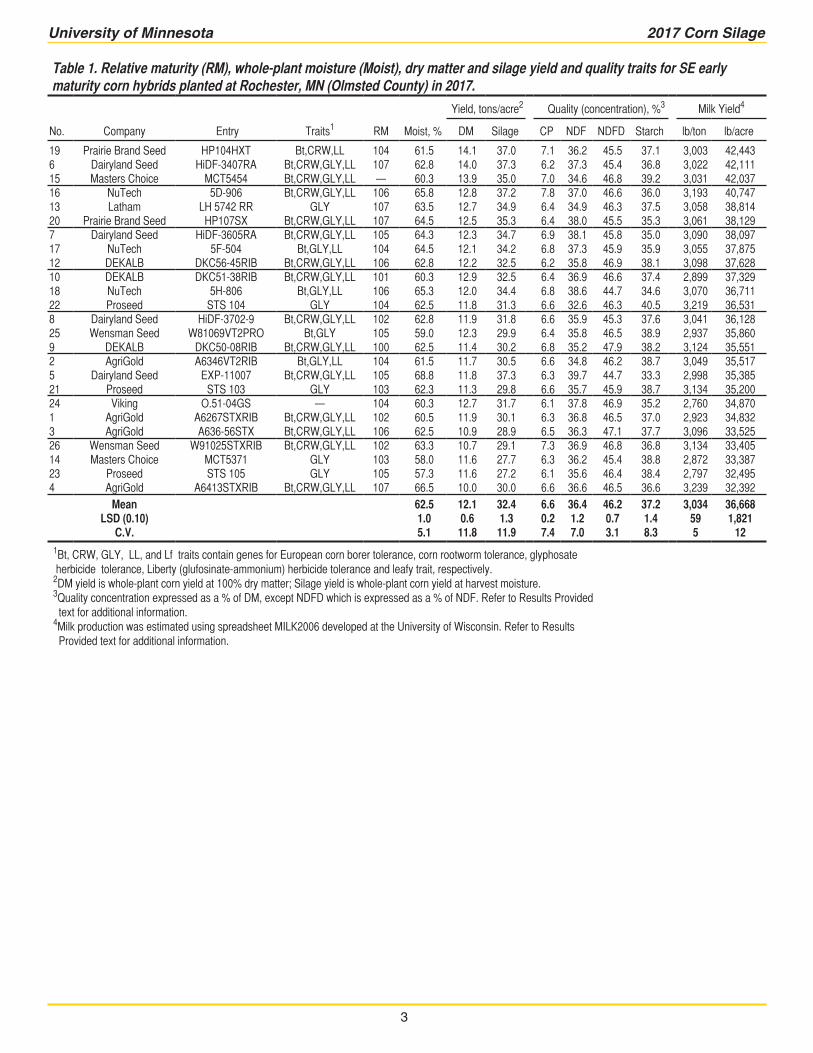
Table 1. Relative maturity (RM), whole-plant moisture (Moist), dry matter and silage yield and quality traits for SE early maturity corn hybrids planted at Rochester, MN (Olmsted County) in 2017.
Yield, tons/acre2 Quality (concentration), %3 Milk Yield4
No. Company Entry Traits1 RM Moist, % DM Silage CP NDF NDFD Starch lb/ton lb/acre
19 Prairie Brand Seed HP104HXT Bt,CRW,LL 104 61.5 14.1 37.0 7.1 36.2 45.5 37.1 3,003 42,443 6 Dairyland Seed HiDF-3407RA Bt,CRW,GLY,LL 107 62.8 14.0 37.3 6.2 37.3 45.4 36.8 3,022 42,111 15 Masters Choice MCT5454 Bt,CRW,GLY,LL — 60.3 13.9 35.0 7.0 34.6 46.8 39.2 3,031 42,037 16 NuTech 5D-906 Bt,CRW,GLY,LL 106 65.8 12.8 37.2 7.8 37.0 46.6 36.0 3,193 40,747 13 Latham LH 5742 RR GLY 107 63.5 12.7 34.9 6.4 34.9 46.3 37.5 3,058 38,814 20 Prairie Brand Seed HP107SX Bt,CRW,GLY,LL 107 64.5 12.5 35.3 6.4 38.0 45.5 35.3 3,061 38,129 7 Dairyland Seed HiDF-3605RA Bt,CRW,GLY,LL 105 64.3 12.3 34.7 6.9 38.1 45.8 35.0 3,090 38,097 17 NuTech 5F-504 Bt,GLY,LL 104 64.5 12.1 34.2 6.8 37.3 45.9 35.9 3,055 37,875 12 DEKALB DKC56-45RIB Bt,CRW,GLY,LL 106 62.8 12.2 32.5 6.2 35.8 46.9 38.1 3,098 37,628 10 DEKALB DKC51-38RIB Bt,CRW,GLY,LL 101 60.3 12.9 32.5 6.4 36.9 46.6 37.4 2,899 37,329 18 NuTech 5H-806 Bt,GLY,LL 106 65.3 12.0 34.4 6.8 38.6 44.7 34.6 3,070 36,711 22 Proseed STS 104 GLY 104 62.5 11.8 31.3 6.6 32.6 46.3 40.5 3,219 36,531 8 Dairyland Seed HiDF-3702-9 Bt,CRW,GLY,LL 102 62.8 11.9 31.8 6.6 35.9 45.3 37.6 3,041 36,128 25 Wensman Seed W81069VT2PRO Bt,GLY 105 59.0 12.3 29.9 6.4 35.8 46.5 38.9 2,937 35,860 9 DEKALB DKC50-08RIB Bt,CRW,GLY,LL 100 62.5 11.4 30.2 6.8 35.2 47.9 38.2 3,124 35,551 2 AgriGold A6346VT2RIB Bt,GLY,LL 104 61.5 11.7 30.5 6.6 34.8 46.2 38.7 3,049 35,517 5 Dairyland Seed EXP-11007 Bt,CRW,GLY,LL 105 68.8 11.8 37.3 6.3 39.7 44.7 33.3 2,998 35,385 21 Proseed STS 103 GLY 103 62.3 11.3 29.8 6.6 35.7 45.9 38.7 3,134 35,200 24 Viking O.51-04GS — 104 60.3 12.7 31.7 6.1 37.8 46.9 35.2 2,760 34,870 1 AgriGold A6267STXRIB Bt,CRW,GLY,LL 102 60.5 11.9 30.1 6.3 36.8 46.5 37.0 2,923 34,832 3 AgriGold A636-56STX Bt,CRW,GLY,LL 106 62.5 10.9 28.9 6.5 36.3 47.1 37.7 3,096 33,525 26 Wensman Seed W91025STXRIB Bt,CRW,GLY,LL 102 63.3 10.7 29.1 7.3 36.9 46.8 36.8 3,134 33,405 14 Masters Choice MCT5371 GLY 103 58.0 11.6 27.7 6.3 36.2 45.4 38.8 2,872 33,387 23 Proseed STS 105 GLY 105 57.3 11.6 27.2 6.1 35.6 46.4 38.4 2,797 32,495 4 AgriGold A6413STXRIB Bt,CRW,GLY,LL 107 66.5 10.0 30.0 6.6 36.6 46.5 36.6 3,239 32,392
Mean 62.5 12.1 32.4 6.6 36.4 46.2 37.2 3,034 36,668 LSD (0.10) 1.0 0.6 1.3 0.2 1.2 0.7 1.4 59 1,821
C.V. 5.1 11.8 11.9 7.4 7.0 3.1 8.3 5 12 1Bt, CRW, GLY, LL, and Lf traits contain genes for European corn borer tolerance, corn rootworm tolerance, glyphosate herbicide tolerance, Liberty (glufosinate-ammonium) herbicide tolerance and leafy trait, respectively. 2DM yield is whole-plant corn yield at 100% dry matter; Silage yield is whole-plant corn yield at harvest moisture.3Quality concentration expressed as a % of DM, except NDFD which is expressed as a % of NDF. Refer to Results Provided text for additional information.4Milk production was estimated using spreadsheet MILK2006 developed at the University of Wisconsin. Refer to Results Provided text for additional information.
4
University of Minnesota 2017 Corn Silage
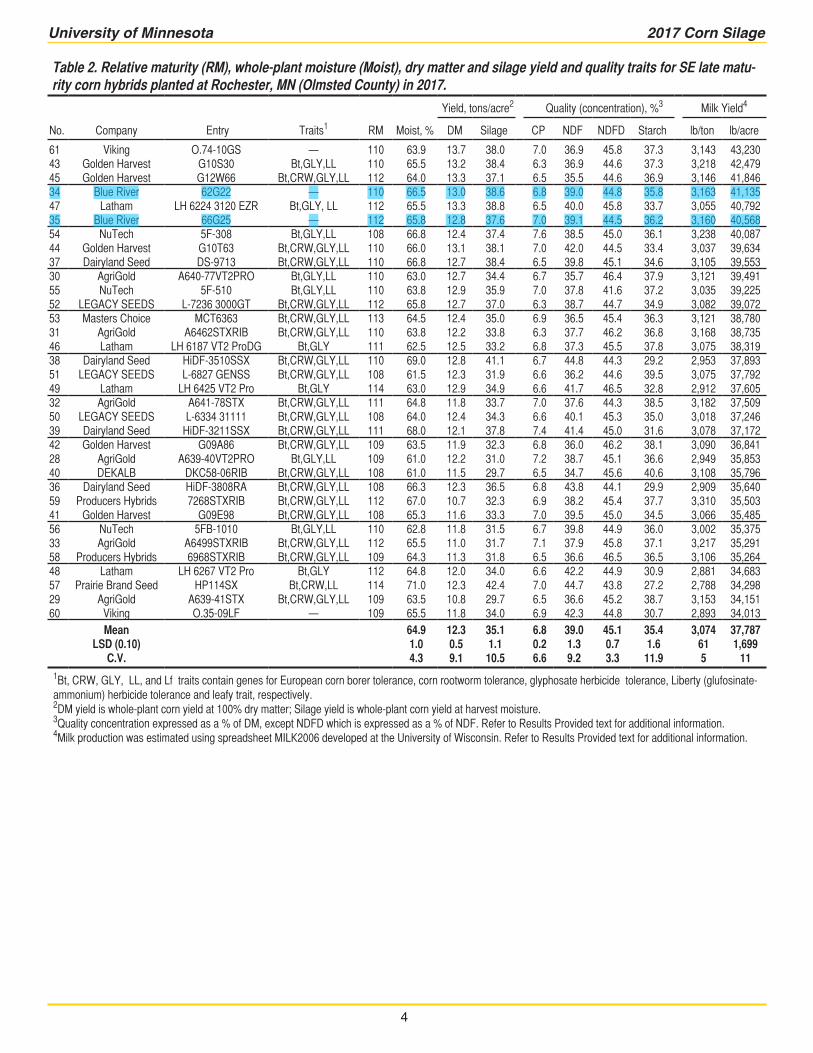
Table 2. Relative maturity (RM), whole-plant moisture (Moist), dry matter and silage yield and quality traits for SE late matu-rity corn hybrids planted at Rochester, MN (Olmsted County) in 2017.
Yield, tons/acre2 Quality (concentration), %3 Milk Yield4
No. Company Entry Traits1 RM Moist, % DM Silage CP NDF NDFD Starch lb/ton lb/acre
61 Viking O.74-10GS — 110 63.9 13.7 38.0 7.0 36.9 45.8 37.3 3,143 43,230 43 Golden Harvest G10S30 Bt,GLY,LL 110 65.5 13.2 38.4 6.3 36.9 44.6 37.3 3,218 42,479 45 Golden Harvest G12W66 Bt,CRW,GLY,LL 112 64.0 13.3 37.1 6.5 35.5 44.6 36.9 3,146 41,846 34 Blue River 62G22 — 110 66.5 13.0 38.6 6.8 39.0 44.8 35.8 3,163 41,135 47 Latham LH 6224 3120 EZR Bt,GLY, LL 112 65.5 13.3 38.8 6.5 40.0 45.8 33.7 3,055 40,792 35 Blue River 66G25 — 112 65.8 12.8 37.6 7.0 39.1 44.5 36.2 3,160 40,568 54 NuTech 5F-308 Bt,GLY,LL 108 66.8 12.4 37.4 7.6 38.5 45.0 36.1 3,238 40,087 44 Golden Harvest G10T63 Bt,CRW,GLY,LL 110 66.0 13.1 38.1 7.0 42.0 44.5 33.4 3,037 39,634 37 Dairyland Seed DS-9713 Bt,CRW,GLY,LL 110 66.8 12.7 38.4 6.5 39.8 45.1 34.6 3,105 39,553 30 AgriGold A640-77VT2PRO Bt,GLY,LL 110 63.0 12.7 34.4 6.7 35.7 46.4 37.9 3,121 39,491 55 NuTech 5F-510 Bt,GLY,LL 110 63.8 12.9 35.9 7.0 37.8 41.6 37.2 3,035 39,225 52 LEGACY SEEDS L-7236 3000GT Bt,CRW,GLY,LL 112 65.8 12.7 37.0 6.3 38.7 44.7 34.9 3,082 39,072 53 Masters Choice MCT6363 Bt,CRW,GLY,LL 113 64.5 12.4 35.0 6.9 36.5 45.4 36.3 3,121 38,780 31 AgriGold A6462STXRIB Bt,CRW,GLY,LL 110 63.8 12.2 33.8 6.3 37.7 46.2 36.8 3,168 38,735 46 Latham LH 6187 VT2 ProDG Bt,GLY 111 62.5 12.5 33.2 6.8 37.3 45.5 37.8 3,075 38,319 38 Dairyland Seed HiDF-3510SSX Bt,CRW,GLY,LL 110 69.0 12.8 41.1 6.7 44.8 44.3 29.2 2,953 37,893 51 LEGACY SEEDS L-6827 GENSS Bt,CRW,GLY,LL 108 61.5 12.3 31.9 6.6 36.2 44.6 39.5 3,075 37,792 49 Latham LH 6425 VT2 Pro Bt,GLY 114 63.0 12.9 34.9 6.6 41.7 46.5 32.8 2,912 37,605 32 AgriGold A641-78STX Bt,CRW,GLY,LL 111 64.8 11.8 33.7 7.0 37.6 44.3 38.5 3,182 37,509 50 LEGACY SEEDS L-6334 31111 Bt,CRW,GLY,LL 108 64.0 12.4 34.3 6.6 40.1 45.3 35.0 3,018 37,246 39 Dairyland Seed HiDF-3211SSX Bt,CRW,GLY,LL 111 68.0 12.1 37.8 7.4 41.4 45.0 31.6 3,078 37,172 42 Golden Harvest G09A86 Bt,CRW,GLY,LL 109 63.5 11.9 32.3 6.8 36.0 46.2 38.1 3,090 36,841 28 AgriGold A639-40VT2PRO Bt,GLY,LL 109 61.0 12.2 31.0 7.2 38.7 45.1 36.6 2,949 35,853 40 DEKALB DKC58-06RIB Bt,CRW,GLY,LL 108 61.0 11.5 29.7 6.5 34.7 45.6 40.6 3,108 35,796 36 Dairyland Seed HiDF-3808RA Bt,CRW,GLY,LL 108 66.3 12.3 36.5 6.8 43.8 44.1 29.9 2,909 35,640 59 Producers Hybrids 7268STXRIB Bt,CRW,GLY,LL 112 67.0 10.7 32.3 6.9 38.2 45.4 37.7 3,310 35,503 41 Golden Harvest G09E98 Bt,CRW,GLY,LL 108 65.3 11.6 33.3 7.0 39.5 45.0 34.5 3,066 35,485 56 NuTech 5FB-1010 Bt,GLY,LL 110 62.8 11.8 31.5 6.7 39.8 44.9 36.0 3,002 35,375 33 AgriGold A6499STXRIB Bt,CRW,GLY,LL 112 65.5 11.0 31.7 7.1 37.9 45.8 37.1 3,217 35,291 58 Producers Hybrids 6968STXRIB Bt,CRW,GLY,LL 109 64.3 11.3 31.8 6.5 36.6 46.5 36.5 3,106 35,264 48 Latham LH 6267 VT2 Pro Bt,GLY 112 64.8 12.0 34.0 6.6 42.2 44.9 30.9 2,881 34,683 57 Prairie Brand Seed HP114SX Bt,CRW,LL 114 71.0 12.3 42.4 7.0 44.7 43.8 27.2 2,788 34,298 29 AgriGold A639-41STX Bt,CRW,GLY,LL 109 63.5 10.8 29.7 6.5 36.6 45.2 38.7 3,153 34,151 60 Viking O.35-09LF — 109 65.5 11.8 34.0 6.9 42.3 44.8 30.7 2,893 34,013
Mean 64.9 12.3 35.1 6.8 39.0 45.1 35.4 3,074 37,787 LSD (0.10) 1.0 0.5 1.1 0.2 1.3 0.7 1.6 61 1,699
C.V. 4.3 9.1 10.5 6.6 9.2 3.3 11.9 5 11 1Bt, CRW, GLY, LL, and Lf traits contain genes for European corn borer tolerance, corn rootworm tolerance, glyphosate herbicide tolerance, Liberty (glufosinate-ammonium) herbicide tolerance and leafy trait, respectively. 2DM yield is whole-plant corn yield at 100% dry matter; Silage yield is whole-plant corn yield at harvest moisture.3Quality concentration expressed as a % of DM, except NDFD which is expressed as a % of NDF. Refer to Results Provided text for additional information.4Milk production was estimated using spreadsheet MILK2006 developed at the University of Wisconsin. Refer to Results Provided text for additional information.
scott.ausborn
Highlight
scott.ausborn
Highlight
5
University of Minnesota 2017 Corn Silage
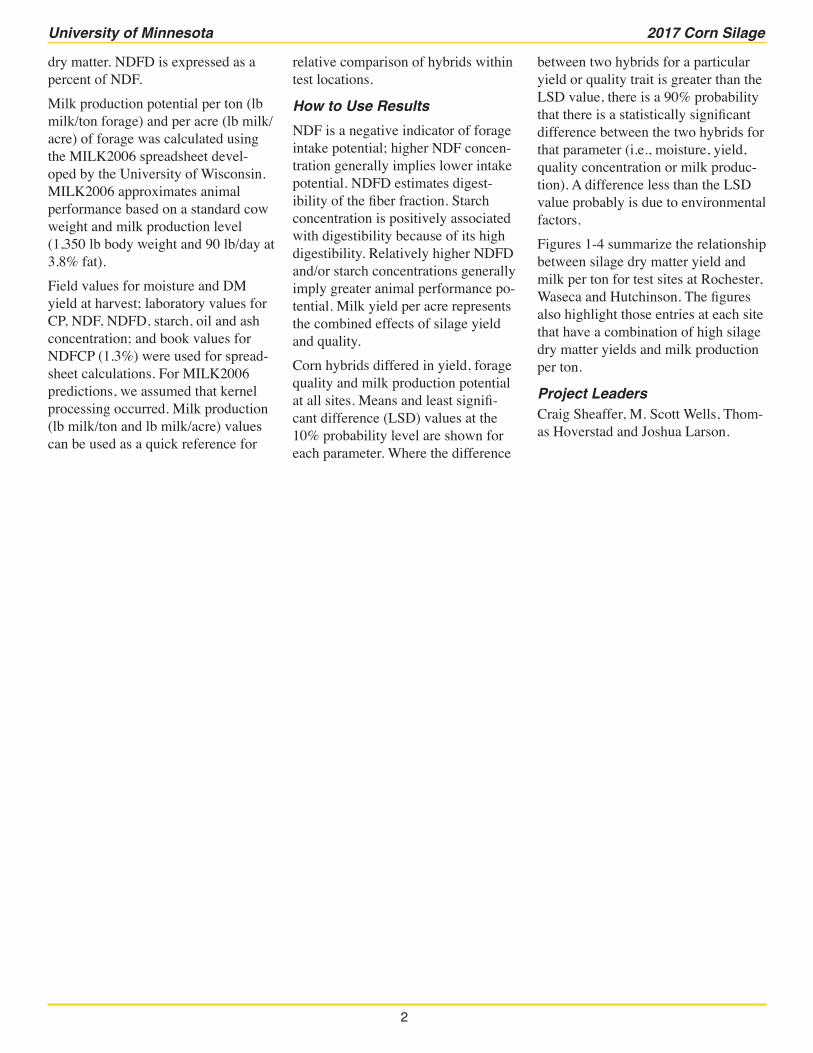
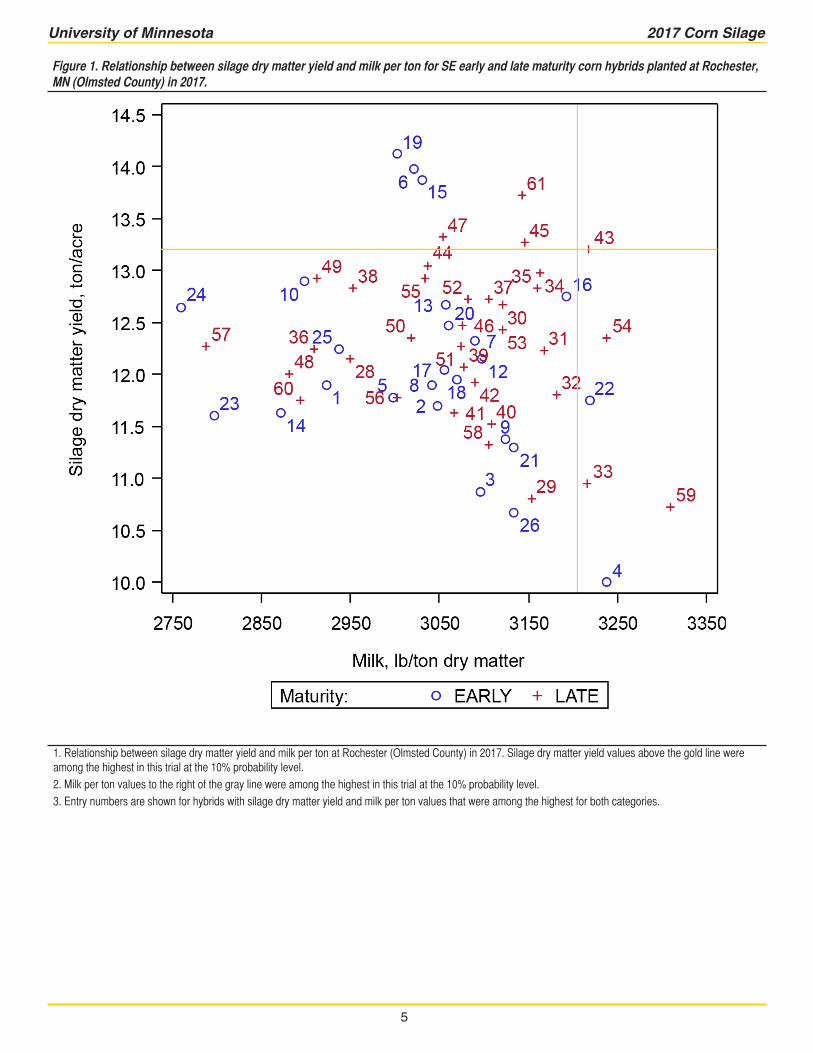
Figure 1. Relationship between silage dry matter yield and milk per ton for SE early and late maturity corn hybrids planted at Rochester, MN (Olmsted County) in 2017.
1. Relationship between silage dry matter yield and milk per ton at Rochester (Olmsted County) in 2017. Silage dry matter yield values above the gold line were among the highest in this trial at the 10% probability level. 2. Milk per ton values to the right of the gray line were among the highest in this trial at the 10% probability level.3. Entry numbers are shown for hybrids with silage dry matter yield and milk per ton values that were among the highest for both categories.
6
University of Minnesota 2017 Corn Silage
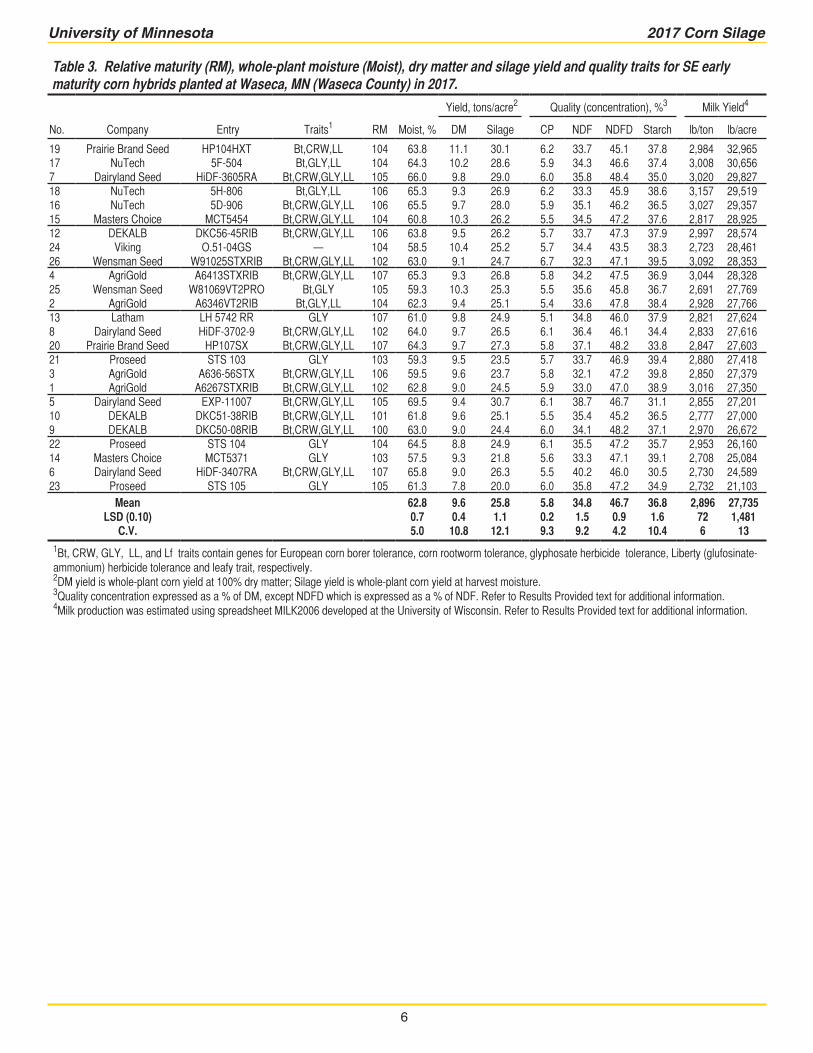
Table 3. Relative maturity (RM), whole-plant moisture (Moist), dry matter and silage yield and quality traits for SE early maturity corn hybrids planted at Waseca, MN (Waseca County) in 2017.
Yield, tons/acre2 Quality (concentration), %3 Milk Yield4
No. Company Entry Traits1 RM Moist, % DM Silage CP NDF NDFD Starch lb/ton lb/acre
19 Prairie Brand Seed HP104HXT Bt,CRW,LL 104 63.8 11.1 30.1 6.2 33.7 45.1 37.8 2,984 32,96517 NuTech 5F-504 Bt,GLY,LL 104 64.3 10.2 28.6 5.9 34.3 46.6 37.4 3,008 30,6567 Dairyland Seed HiDF-3605RA Bt,CRW,GLY,LL 105 66.0 9.8 29.0 6.0 35.8 48.4 35.0 3,020 29,82718 NuTech 5H-806 Bt,GLY,LL 106 65.3 9.3 26.9 6.2 33.3 45.9 38.6 3,157 29,51916 NuTech 5D-906 Bt,CRW,GLY,LL 106 65.5 9.7 28.0 5.9 35.1 46.2 36.5 3,027 29,35715 Masters Choice MCT5454 Bt,CRW,GLY,LL 104 60.8 10.3 26.2 5.5 34.5 47.2 37.6 2,817 28,92512 DEKALB DKC56-45RIB Bt,CRW,GLY,LL 106 63.8 9.5 26.2 5.7 33.7 47.3 37.9 2,997 28,57424 Viking O.51-04GS — 104 58.5 10.4 25.2 5.7 34.4 43.5 38.3 2,723 28,46126 Wensman Seed W91025STXRIB Bt,CRW,GLY,LL 102 63.0 9.1 24.7 6.7 32.3 47.1 39.5 3,092 28,3534 AgriGold A6413STXRIB Bt,CRW,GLY,LL 107 65.3 9.3 26.8 5.8 34.2 47.5 36.9 3,044 28,32825 Wensman Seed W81069VT2PRO Bt,GLY 105 59.3 10.3 25.3 5.5 35.6 45.8 36.7 2,691 27,7692 AgriGold A6346VT2RIB Bt,GLY,LL 104 62.3 9.4 25.1 5.4 33.6 47.8 38.4 2,928 27,76613 Latham LH 5742 RR GLY 107 61.0 9.8 24.9 5.1 34.8 46.0 37.9 2,821 27,6248 Dairyland Seed HiDF-3702-9 Bt,CRW,GLY,LL 102 64.0 9.7 26.5 6.1 36.4 46.1 34.4 2,833 27,61620 Prairie Brand Seed HP107SX Bt,CRW,GLY,LL 107 64.3 9.7 27.3 5.8 37.1 48.2 33.8 2,847 27,60321 Proseed STS 103 GLY 103 59.3 9.5 23.5 5.7 33.7 46.9 39.4 2,880 27,4183 AgriGold A636-56STX Bt,CRW,GLY,LL 106 59.5 9.6 23.7 5.8 32.1 47.2 39.8 2,850 27,3791 AgriGold A6267STXRIB Bt,CRW,GLY,LL 102 62.8 9.0 24.5 5.9 33.0 47.0 38.9 3,016 27,3505 Dairyland Seed EXP-11007 Bt,CRW,GLY,LL 105 69.5 9.4 30.7 6.1 38.7 46.7 31.1 2,855 27,20110 DEKALB DKC51-38RIB Bt,CRW,GLY,LL 101 61.8 9.6 25.1 5.5 35.4 45.2 36.5 2,777 27,0009 DEKALB DKC50-08RIB Bt,CRW,GLY,LL 100 63.0 9.0 24.4 6.0 34.1 48.2 37.1 2,970 26,67222 Proseed STS 104 GLY 104 64.5 8.8 24.9 6.1 35.5 47.2 35.7 2,953 26,16014 Masters Choice MCT5371 GLY 103 57.5 9.3 21.8 5.6 33.3 47.1 39.1 2,708 25,0846 Dairyland Seed HiDF-3407RA Bt,CRW,GLY,LL 107 65.8 9.0 26.3 5.5 40.2 46.0 30.5 2,730 24,58923 Proseed STS 105 GLY 105 61.3 7.8 20.0 6.0 35.8 47.2 34.9 2,732 21,103
Mean 62.8 9.6 25.8 5.8 34.8 46.7 36.8 2,896 27,735 LSD (0.10) 0.7 0.4 1.1 0.2 1.5 0.9 1.6 72 1,481
C.V. 5.0 10.8 12.1 9.3 9.2 4.2 10.4 6 13 1Bt, CRW, GLY, LL, and Lf traits contain genes for European corn borer tolerance, corn rootworm tolerance, glyphosate herbicide tolerance, Liberty (glufosinate-ammonium) herbicide tolerance and leafy trait, respectively. 2DM yield is whole-plant corn yield at 100% dry matter; Silage yield is whole-plant corn yield at harvest moisture.3Quality concentration expressed as a % of DM, except NDFD which is expressed as a % of NDF. Refer to Results Provided text for additional information.4Milk production was estimated using spreadsheet MILK2006 developed at the University of Wisconsin. Refer to Results Provided text for additional information.

7
University of Minnesota 2017 Corn Silage
Table 4. Relative maturity (RM), whole-plant moisture (Moist), dry matter and silage yield, and quality traits for SE late matu-rity corn hybrids planted at Waseca, MN (Waseca County) in 2017.
Yield, tons/acre2 Quality (concentration), %3 Milk Yield4
No. Company Entry Traits1 RM Moist, % DM Silage CP NDF NDFD Starch lb/ton lb/acre
37 Dairyland Seed DS-9713 Bt,CRW,GLY,LL 110 62.0 11.3 29.9 5.7 37.0 47.2 36.1 2,933 33,211 35 Blue River 66G25 — 112 60.3 11.4 28.6 5.0 37.8 46.4 36.5 2,835 32,083 32 AgriGold A641-78STX Bt,CRW,GLY,LL 111 61.0 10.5 26.6 6.0 35.0 46.4 38.7 2,989 31,171 34 Blue River 62G22 — 110 62.0 10.8 28.0 5.3 37.2 45.7 37.1 2,905 31,078 31 AgriGold A6462STXRIB Bt,CRW,GLY,LL 110 59.3 10.4 25.5 5.4 33.7 46.1 40.9 2,959 30,648 48 Latham LH 6267 VT2 Pro Bt,GLY 112 60.8 11.0 27.9 5.2 37.6 46.7 35.5 2,776 30,510 54 NuTech 5F-308 Bt,GLY,LL 108 60.8 10.2 25.7 5.8 34.1 45.5 40.3 3,018 30,504 38 Dairyland Seed HiDF-3510SSX Bt,CRW,GLY,LL 110 65.2 10.6 30.0 5.5 41.0 47.4 31.0 2,818 30,197 29 AgriGold A639-41STX Bt,CRW,GLY,LL 109 57.5 10.9 25.5 5.7 34.8 46.2 39.0 2,779 30,156 39 Dairyland Seed HiDF-3211SSX Bt,CRW,GLY,LL 111 65.5 9.8 28.8 5.9 37.9 46.2 34.9 3,062 30,155 57 Prairie Brand Seed HP114SX Bt,CRW,LL 114 65.5 11.2 32.5 4.9 42.3 48.0 29.1 2,696 30,130 58 Producers Hybrids 6968STXRIB Bt,CRW,GLY,LL 109 61.3 10.1 25.9 5.2 35.7 46.1 38.7 2,952 29,611 50 LEGACY SEEDS L-6334 31111 Bt,CRW,GLY,LL 108 56.5 10.8 25.0 5.2 36.3 46.3 38.3 2,737 29,518 36 Dairyland Seed HiDF-3808RA Bt,CRW,GLY,LL 108 62.6 10.3 27.6 5.2 37.5 45.2 35.7 2,867 29,516 49 Latham LH 6425 VT2 Pro Bt,GLY 114 55.3 10.9 24.6 4.8 35.9 44.9 39.9 2,701 29,516 56 NuTech 5FB-1010 Bt,GLY,LL 110 56.5 10.8 25.0 5.5 37.2 43.4 38.4 2,726 29,438 51 LEGACY SEEDS L-6827 GENSS Bt,CRW,GLY,LL 108 57.7 10.8 25.5 5.5 37.4 46.5 36.7 2,718 29,372 52 LEGACY SEEDS L-7236 3000GT Bt,CRW,GLY,LL 112 59.3 10.4 25.3 6.0 36.2 45.1 37.7 2,834 29,357 44 Golden Harvest G10T63 Bt,CRW,GLY,LL 110 61.8 10.5 27.5 5.6 40.3 46.1 33.4 2,785 29,270 43 Golden Harvest G10S30 Bt,GLY,LL 110 62.8 10.1 27.2 5.3 38.9 46.3 34.7 2,878 29,133 45 Golden Harvest G12W66 Bt,CRW,GLY,LL 112 59.8 10.2 25.3 5.8 37.0 46.4 36.9 2,832 28,924 59 Producers Hybrids 7268STXRIB Bt,CRW,GLY,LL 112 61.5 10.1 26.5 5.2 37.6 46.9 36.7 2,872 28,890 42 Golden Harvest G09A86 Bt,CRW,GLY,LL 109 56.8 10.4 24.2 5.2 36.1 45.3 38.8 2,719 28,417 61 Viking O.74-10GS — 110 60.0 10.0 25.2 4.7 37.7 44.7 36.9 2,793 28,017 55 NuTech 5F-510 Bt,GLY,LL 110 60.5 9.3 23.7 5.9 35.2 45.4 39.2 2,975 27,720 33 AgriGold A6499STXRIB Bt,CRW,GLY,LL 112 59.0 9.8 24.0 5.4 37.2 46.8 36.9 2,801 27,410 41 Golden Harvest G09E98 Bt,CRW,GLY,LL 108 60.3 10.0 25.1 5.5 39.0 46.3 33.8 2,670 26,648 30 AgriGold A640-77VT2PRO Bt,GLY,LL 110 57.0 9.7 22.5 4.9 35.9 45.2 39.3 2,744 26,631 40 DEKALB DKC58-06RIB Bt,CRW,GLY,LL 108 53.3 9.1 19.5 5.4 31.1 46.6 44.5 2,892 26,373 46 Latham LH 6187 VT2 ProDG Bt,GLY 111 57.7 10.3 24.3 4.8 39.2 45.1 35.0 2,572 26,314 47 Latham LH 6224 3120 EZR Bt,GLY, LL 112 60.3 9.3 23.4 5.6 38.1 45.9 35.7 2,809 26,025 53 Masters Choice MCT6363 Bt,CRW,GLY,LL 113 61.5 9.0 22.9 5.7 36.9 45.2 36.8 2,904 25,694 28 AgriGold A639-40VT2PRO Bt,GLY,LL 109 56.0 9.7 22.0 5.4 37.6 45.1 37.3 2,612 25,313 60 Viking O.35-09LF — 109 61.3 9.5 24.4 4.9 40.6 44.5 32.2 2,592 24,622
Mean 60.0 10.3 25.7 5.4 37.1 45.9 36.8 2,819 28,889 LSD (0.10) 0.9 0.5 1.1 0.2 1.0 1.0 1.3 62 1,488
C.V. 5.7 10.6 12.5 10.2 7.7 4.4 10.2 6 12 1Bt, CRW, GLY, LL, and Lf traits contain genes for European corn borer tolerance, corn rootworm tolerance, glyphosate herbicide tolerance, Liberty (glufosinate-ammonium) herbicide tolerance and leafy trait, respectively. 2DM yield is whole-plant corn yield at 100% dry matter; Silage yield is whole-plant corn yield at harvest moisture.3Quality concentration expressed as a % of DM, except NDFD which is expressed as a % of NDF. Refer to Results Provided text for additional information.4Milk production was estimated using spreadsheet MILK2006 developed at the University of Wisconsin. Refer to Results Provided text for additional information.
scott.ausborn
Highlight
scott.ausborn
Highlight
8
University of Minnesota 2017 Corn Silage
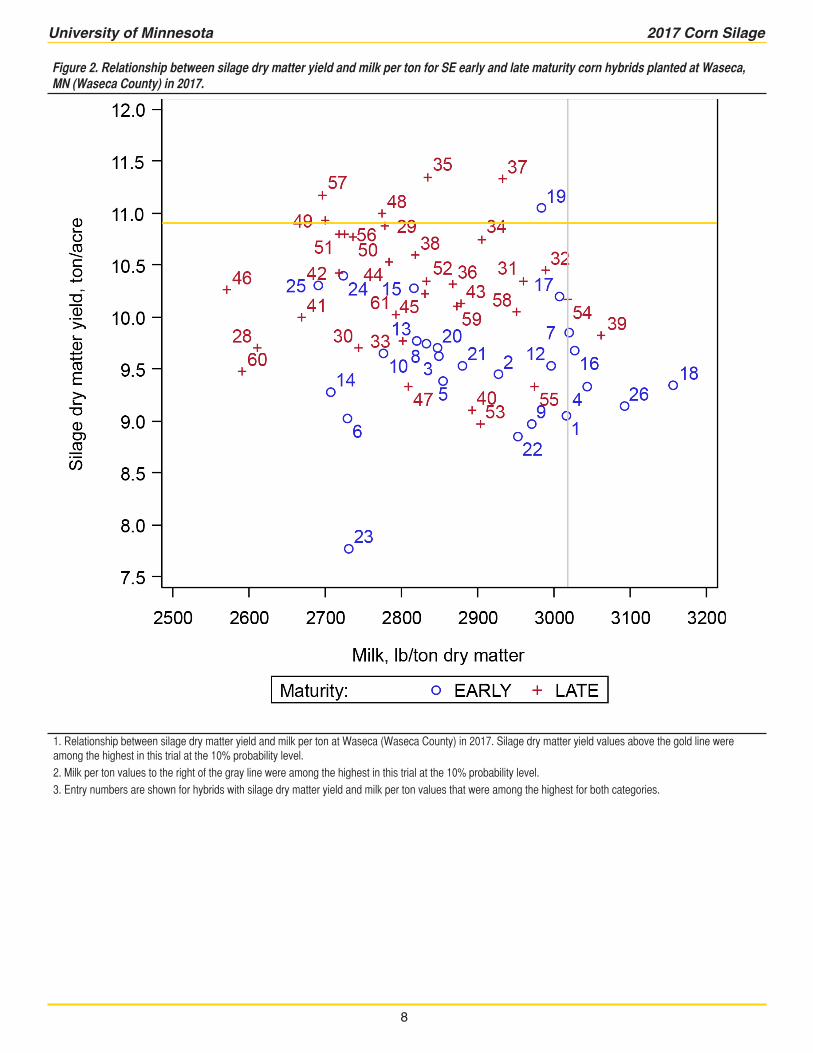
Figure 2. Relationship between silage dry matter yield and milk per ton for SE early and late maturity corn hybrids planted at Waseca, MN (Waseca County) in 2017.
1. Relationship between silage dry matter yield and milk per ton at Waseca (Waseca County) in 2017. Silage dry matter yield values above the gold line were among the highest in this trial at the 10% probability level. 2. Milk per ton values to the right of the gray line were among the highest in this trial at the 10% probability level.3. Entry numbers are shown for hybrids with silage dry matter yield and milk per ton values that were among the highest for both categories.
9
University of Minnesota 2017 Corn Silage
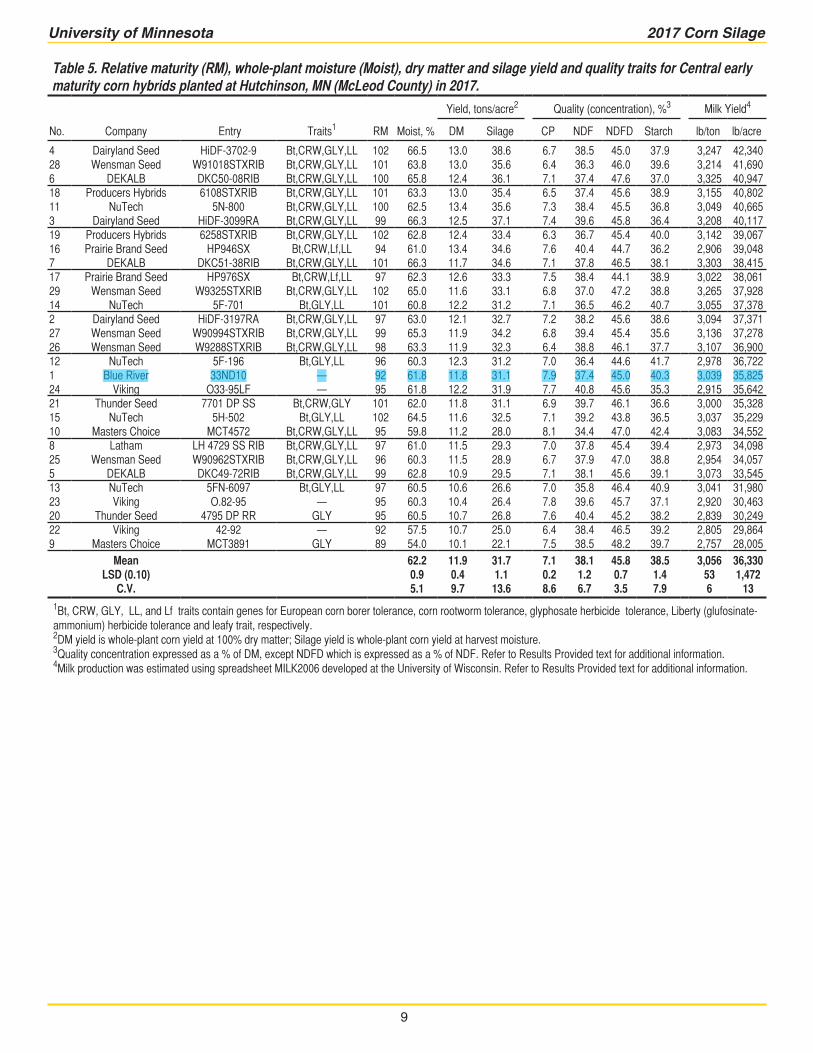
Table 5. Relative maturity (RM), whole-plant moisture (Moist), dry matter and silage yield and quality traits for Central early maturity corn hybrids planted at Hutchinson, MN (McLeod County) in 2017.
Yield, tons/acre2 Quality (concentration), %3 Milk Yield4
No. Company Entry Traits1 RM Moist, % DM Silage CP NDF NDFD Starch lb/ton lb/acre
4 Dairyland Seed HiDF-3702-9 Bt,CRW,GLY,LL 102 66.5 13.0 38.6 6.7 38.5 45.0 37.9 3,247 42,340 28 Wensman Seed W91018STXRIB Bt,CRW,GLY,LL 101 63.8 13.0 35.6 6.4 36.3 46.0 39.6 3,214 41,690 6 DEKALB DKC50-08RIB Bt,CRW,GLY,LL 100 65.8 12.4 36.1 7.1 37.4 47.6 37.0 3,325 40,947 18 Producers Hybrids 6108STXRIB Bt,CRW,GLY,LL 101 63.3 13.0 35.4 6.5 37.4 45.6 38.9 3,155 40,802 11 NuTech 5N-800 Bt,CRW,GLY,LL 100 62.5 13.4 35.6 7.3 38.4 45.5 36.8 3,049 40,665 3 Dairyland Seed HiDF-3099RA Bt,CRW,GLY,LL 99 66.3 12.5 37.1 7.4 39.6 45.8 36.4 3,208 40,117 19 Producers Hybrids 6258STXRIB Bt,CRW,GLY,LL 102 62.8 12.4 33.4 6.3 36.7 45.4 40.0 3,142 39,067 16 Prairie Brand Seed HP946SX Bt,CRW,Lf,LL 94 61.0 13.4 34.6 7.6 40.4 44.7 36.2 2,906 39,048 7 DEKALB DKC51-38RIB Bt,CRW,GLY,LL 101 66.3 11.7 34.6 7.1 37.8 46.5 38.1 3,303 38,415 17 Prairie Brand Seed HP976SX Bt,CRW,Lf,LL 97 62.3 12.6 33.3 7.5 38.4 44.1 38.9 3,022 38,061 29 Wensman Seed W9325STXRIB Bt,CRW,GLY,LL 102 65.0 11.6 33.1 6.8 37.0 47.2 38.8 3,265 37,928 14 NuTech 5F-701 Bt,GLY,LL 101 60.8 12.2 31.2 7.1 36.5 46.2 40.7 3,055 37,378 2 Dairyland Seed HiDF-3197RA Bt,CRW,GLY,LL 97 63.0 12.1 32.7 7.2 38.2 45.6 38.6 3,094 37,371 27 Wensman Seed W90994STXRIB Bt,CRW,GLY,LL 99 65.3 11.9 34.2 6.8 39.4 45.4 35.6 3,136 37,278 26 Wensman Seed W9288STXRIB Bt,CRW,GLY,LL 98 63.3 11.9 32.3 6.4 38.8 46.1 37.7 3,107 36,900 12 NuTech 5F-196 Bt,GLY,LL 96 60.3 12.3 31.2 7.0 36.4 44.6 41.7 2,978 36,722 1 Blue River 33ND10 — 92 61.8 11.8 31.1 7.9 37.4 45.0 40.3 3,039 35,825 24 Viking O33-95LF — 95 61.8 12.2 31.9 7.7 40.8 45.6 35.3 2,915 35,642 21 Thunder Seed 7701 DP SS Bt,CRW,GLY 101 62.0 11.8 31.1 6.9 39.7 46.1 36.6 3,000 35,328 15 NuTech 5H-502 Bt,GLY,LL 102 64.5 11.6 32.5 7.1 39.2 43.8 36.5 3,037 35,229 10 Masters Choice MCT4572 Bt,CRW,GLY,LL 95 59.8 11.2 28.0 8.1 34.4 47.0 42.4 3,083 34,552 8 Latham LH 4729 SS RIB Bt,CRW,GLY,LL 97 61.0 11.5 29.3 7.0 37.8 45.4 39.4 2,973 34,098 25 Wensman Seed W90962STXRIB Bt,CRW,GLY,LL 96 60.3 11.5 28.9 6.7 37.9 47.0 38.8 2,954 34,057 5 DEKALB DKC49-72RIB Bt,CRW,GLY,LL 99 62.8 10.9 29.5 7.1 38.1 45.6 39.1 3,073 33,545 13 NuTech 5FN-6097 Bt,GLY,LL 97 60.5 10.6 26.6 7.0 35.8 46.4 40.9 3,041 31,980 23 Viking O.82-95 — 95 60.3 10.4 26.4 7.8 39.6 45.7 37.1 2,920 30,463 20 Thunder Seed 4795 DP RR GLY 95 60.5 10.7 26.8 7.6 40.4 45.2 38.2 2,839 30,249 22 Viking 42-92 — 92 57.5 10.7 25.0 6.4 38.4 46.5 39.2 2,805 29,864 9 Masters Choice MCT3891 GLY 89 54.0 10.1 22.1 7.5 38.5 48.2 39.7 2,757 28,005
Mean 62.2 11.9 31.7 7.1 38.1 45.8 38.5 3,056 36,330 LSD (0.10) 0.9 0.4 1.1 0.2 1.2 0.7 1.4 53 1,472
C.V. 5.1 9.7 13.6 8.6 6.7 3.5 7.9 6 13 1Bt, CRW, GLY, LL, and Lf traits contain genes for European corn borer tolerance, corn rootworm tolerance, glyphosate herbicide tolerance, Liberty (glufosinate-ammonium) herbicide tolerance and leafy trait, respectively. 2DM yield is whole-plant corn yield at 100% dry matter; Silage yield is whole-plant corn yield at harvest moisture.3Quality concentration expressed as a % of DM, except NDFD which is expressed as a % of NDF. Refer to Results Provided text for additional information.4Milk production was estimated using spreadsheet MILK2006 developed at the University of Wisconsin. Refer to Results Provided text for additional information.
scott.ausborn
Highlight

10
University of Minnesota 2017 Corn Silage
Table 6. Relative maturity (RM), whole-plant moisture (Moist), dry matter and silage yield and quality traits for Central late maturity corn hybrids planted at Hutchinson, MN (McLeod County) in 2017.
Yield, tons/acre2 Quality (concentration), %3 Milk Yield4
No. Company Entry Traits1 RM Moist, % DM Silage CP NDF NDFD Starch lb/ton lb/acre
55 Prairie Brand Seed HP104HXT Bt,CRW, LL 104 63.2 15.5 42.0 6.6 36.1 44.4 40.1 3,169 49,029 31 Blue River 51T59 — 103 66.7 14.0 41.9 7.0 36.9 46.8 38.4 3,376 47,150 54 NuTech 5H-806 Bt,GLY,LL 106 68.7 12.8 40.6 7.3 37.0 45.5 38.1 3,379 43,297 32 Dairyland Seed HiDF-3605RA Bt,CRW,GLY,LL 105 67.0 13.6 41.1 7.5 40.5 45.6 33.5 3,165 43,161 47 Masters Choice MCT5454 Bt,CRW,GLY,LL 104 64.7 13.5 38.0 6.8 38.4 46.4 37.1 3,156 42,545 35 Dairyland Seed HiDF-3808RA Bt,CRW,GLY,LL 108 67.0 13.6 41.8 7.2 41.5 43.9 32.7 3,073 41,740 37 DEKALB DKC56-45RIB Bt,CRW,GLY,LL 106 64.7 12.7 36.1 6.8 37.5 47.0 39.0 3,300 41,735 52 NuTech 5F-504 Bt,GLY,LL 104 67.0 12.9 39.2 7.3 39.6 44.8 36.9 3,220 41,440 57 Proseed STS 103 GLY 103 64.7 12.7 35.8 7.1 38.2 46.0 37.7 3,218 40,829 38 Golden Harvest G06Z79 Bt,CRW,GLY,LL 105 65.5 12.5 36.3 7.3 39.1 45.1 36.9 3,199 39,935 34 Dairyland Seed HiDF-3407RA Bt,CRW,GLY,LL 107 68.7 12.9 41.5 6.9 44.1 46.2 30.3 3,061 39,673 58 Proseed STS 104 GLY 104 65.7 12.1 35.5 7.3 37.4 45.8 39.1 3,261 39,300 51 NK N63R Bt,CRW,GLY,LL 108 68.0 12.6 39.0 7.4 42.0 45.9 32.3 3,104 39,046 39 Latham LH 5335 VT2 Pro Bt,GLY 103 62.7 12.4 33.2 7.4 37.5 46.0 39.4 3,102 38,432 42 Latham LH 5742 RR GLY 107 66.7 11.9 35.7 6.7 39.2 43.8 37.1 3,195 37,966 45 LEGACY SEEDS L-6334 31111 Bt,CRW,GLY,LL 108 67.2 12.3 37.4 7.3 41.9 44.0 33.1 3,067 37,625 53 NuTech 5D-906 Bt,CRW,GLY,LL 106 68.5 12.0 38.4 8.2 40.9 46.5 33.4 3,121 37,609 44 LEGACY SEEDS L-5516 GENSS Bt,CRW,GLY,LL 105 63.0 12.1 32.8 7.0 39.4 48.6 36.2 3,104 37,579 33 Dairyland Seed EXP-11007 Bt,CRW,GLY,LL 105 70.7 12.2 41.2 6.8 42.4 44.6 32.0 3,083 37,492 46 Masters Choice MCT5371 GLY 103 61.2 11.9 30.9 6.7 36.8 48.7 39.4 3,096 36,807 56 Prairie Brand Seed HP107SX Bt,CRW, Lf, LL 107 68.0 11.8 37.0 6.4 43.3 43.7 31.9 3,031 35,796 41 Latham LH 5635 VT2 Pro Bt,GLY 106 62.5 11.6 30.9 7.2 37.9 44.1 38.9 3,067 35,578 48 NK N53W Bt,CRW,GLY,LL 103 65.5 11.7 34.2 6.9 42.9 47.8 31.5 3,035 35,505 50 NK N58S Bt,CRW,GLY,LL 106 67.5 11.2 34.4 7.8 41.8 45.3 32.9 3,158 35,492 43 LEGACY SEEDS L-5350 3122 Bt,CRW,GLY,LL 104 68.0 11.3 35.2 6.9 43.9 47.7 31.2 3,076 34,722 40 Latham LH 5495 3122 EZR Bt,CRW,GLY,LL 104 66.7 11.3 33.8 6.9 43.7 47.9 30.1 3,034 34,300 49 NK NK0576 Bt,GLY,LL 105 64.7 10.6 30.1 7.8 38.9 45.6 36.9 3,137 33,167 59 Proseed STS 105 GLY 105 62.0 11.0 29.0 6.4 39.6 47.2 36.9 3,022 33,130
Mean 66.0 12.4 36.5 7.1 39.9 45.9 35.5 3,143 38,931 LSD (0.10) 0.9 0.5 1.5 0.3 1.2 0.8 1.4 63 1,941
C.V. 4.6 11.3 13.2 9.1 8.3 4.4 11.6 5 13 1Bt, CRW, GLY, LL, and Lf traits contain genes for European corn borer tolerance, corn rootworm tolerance, glyphosate herbicide tolerance, Liberty (glufosinate-ammonium) herbicide tolerance and leafy trait, respectively. 2DM yield is whole-plant corn yield at 100% dry matter; Silage yield is whole-plant corn yield at harvest moisture.3Quality concentration expressed as a % of DM, except NDFD which is expressed as a % of NDF. Refer to Results Provided text for additional information.4Milk production was estimated using spreadsheet MILK2006 developed at the University of Wisconsin. Refer to Results Provided text for additional information.
scott.ausborn
Highlight
11
University of Minnesota 2017 Corn Silage
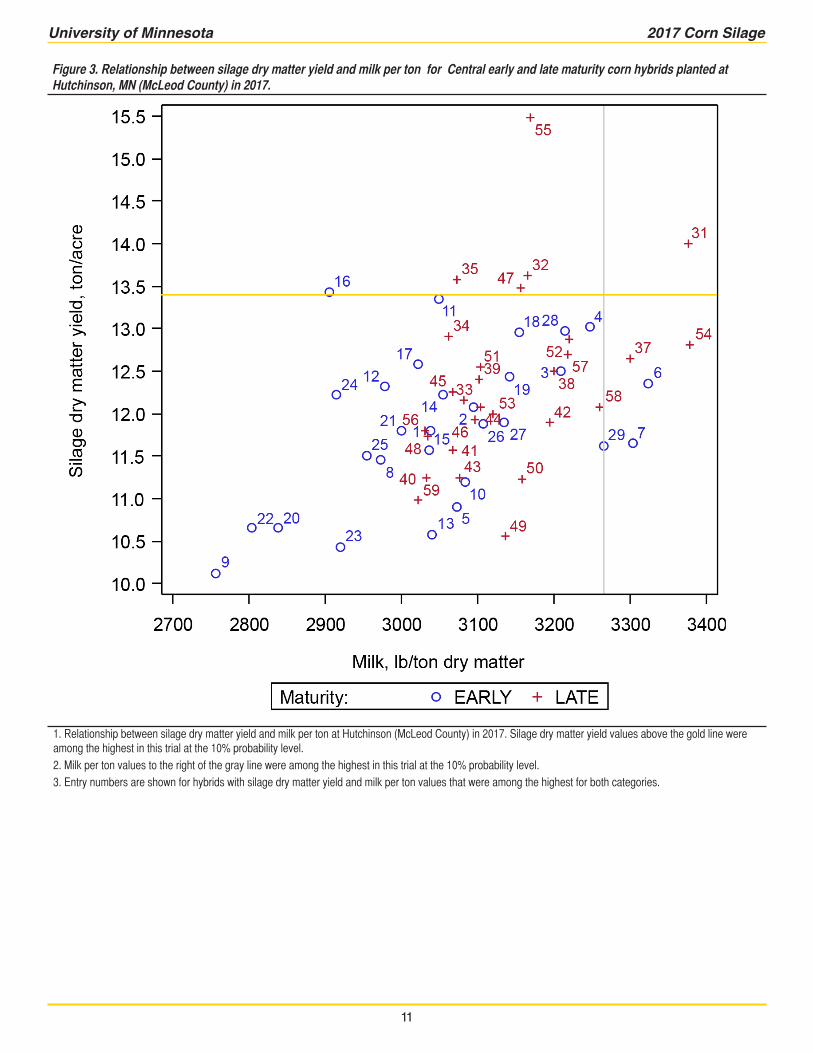
Figure 3. Relationship between silage dry matter yield and milk per ton for Central early and late maturity corn hybrids planted at Hutchinson, MN (McLeod County) in 2017.
1. Relationship between silage dry matter yield and milk per ton at Hutchinson (McLeod County) in 2017. Silage dry matter yield values above the gold line were among the highest in this trial at the 10% probability level. 2. Milk per ton values to the right of the gray line were among the highest in this trial at the 10% probability level.3. Entry numbers are shown for hybrids with silage dry matter yield and milk per ton values that were among the highest for both categories.

12
University of Minnesota 2017 Corn Silage
Table 7. Relative maturity (RM), whole-plant moisture (Moist), dry matter and silage yield and quality traits for Central early maturity corn hybrids planted at Waseca, MN (Waseca County) in 2017.
Yield, tons/acre2 Quality (concentration), %3 Milk Yield4
No. Company Entry Traits1 RM Moist, % DM Silage CP NDF NDFD Starch lb/ton lb/acre
14 NuTech 5F-701 Bt,GLY,LL 101 61.5 10.5 27.3 6.7 34.1 45.6 39.2 3,054 31,844 7 DEKALB DKC51-38RIB Bt,CRW,GLY,LL 101 63.8 10.0 27.3 6.2 35.4 47.2 37.6 3,057 30,664 3 Dairyland Seed HiDF-3099RA Bt,CRW,GLY,LL 99 63.5 10.1 27.8 6.0 36.2 45.1 37.4 3,011 30,491 15 NuTech 5H-502 Bt,GLY,LL 102 64.0 9.9 27.4 6.0 35.6 45.7 37.6 3,064 30,400 18 Producers Hybrids 6108STXRIB Bt,CRW,GLY,LL 101 62.8 10.1 27.0 6.2 36.0 47.1 36.6 2,962 29,962 29 Wensman Seed W9325STXRIB Bt,CRW,GLY,LL 102 62.5 9.9 26.2 6.2 36.5 47.3 36.2 2,968 29,324 27 Wensman Seed W90994STXRIB Bt,CRW,GLY,LL 99 64.0 9.7 26.8 6.1 37.0 46.1 36.1 3,016 29,125 5 DEKALB DKC49-72RIB Bt,CRW,GLY,LL 99 58.5 10.0 24.0 5.8 35.3 45.3 39.7 2,920 28,990 17 Prairie Brand Seed HP976SX Bt,CRW,Lf,LL 97 61.5 9.6 24.8 6.3 37.3 45.8 37.1 2,967 28,498 1 Blue River 33ND10 — 92 60.3 10.6 26.8 6.0 38.5 49.4 32.9 2,706 28,366 28 Wensman Seed W91018STXRIB Bt,CRW,GLY,LL 101 63.0 9.3 25.0 5.7 34.8 47.5 37.8 3,005 27,874 11 NuTech 5N-800 Bt,CRW,GLY,LL 100 58.5 9.9 23.8 6.2 36.2 48.0 37.3 2,808 27,790 10 Masters Choice MCT4572 Bt,CRW,GLY,LL 95 61.8 9.1 23.9 6.0 35.1 44.4 39.9 3,047 27,738 23 Viking O.82-95 — 95 59.0 9.4 22.9 6.4 35.5 46.5 38.6 2,924 27,429 26 Wensman Seed W9288STXRIB Bt,CRW,GLY,LL 98 60.8 9.7 24.6 5.6 36.3 47.1 36.3 2,813 27,202 20 Thunder Seed 4795 DP RR GLY 95 57.8 9.3 22.1 5.9 35.3 46.5 39.4 2,876 26,642 21 Thunder Seed 7701 DP SS Bt,CRW,GLY 101 59.3 9.8 24.3 5.9 41.3 46.9 32.0 2,692 26,444 13 NuTech 5FN-6097 Bt,GLY,LL 97 61.5 9.0 23.6 6.8 36.7 47.0 36.2 2,940 26,341 2 Dairyland Seed HiDF-3197RA Bt,CRW,GLY,LL 97 60.5 10.0 25.5 5.5 41.2 47.5 30.6 2,566 25,755 22 Viking 42-92 — 92 55.8 9.8 22.3 5.2 38.7 47.6 35.1 2,631 25,720 16 Prairie Brand Seed HP946SX Bt,CRW,Lf,LL 94 61.3 9.6 24.6 6.2 39.9 47.1 31.8 2,693 25,687 4 Dairyland Seed HiDF-3702-9 Bt,CRW,GLY,LL 102 68.0 8.3 26.1 6.3 38.8 46.9 33.3 3,077 25,666 19 Producers Hybrids 6258STXRIB Bt,CRW,GLY,LL 102 60.5 9.1 23.1 5.8 34.5 46.2 37.6 2,809 25,331 25 Wensman Seed W90962STXRIB Bt,CRW,GLY,LL 96 57.8 9.1 21.5 5.4 35.7 45.3 39.5 2,779 25,292 8 Latham LH 4729 SS RIB Bt,CRW,GLY,LL 97 59.9 9.0 22.5 5.8 38.5 45.1 35.5 2,777 25,152 6 DEKALB DKC50-08RIB Bt,CRW,GLY,LL 100 62.0 9.1 24.0 5.8 39.6 45.7 33.2 2,745 25,082 12 NuTech 5F-196 Bt,GLY,LL 96 60.3 8.9 22.4 5.9 37.5 44.7 36.8 2,836 25,071 9 Masters Choice MCT3891 GLY 89 51.3 9.0 18.6 5.8 36.3 47.5 38.2 2,685 24,219 24 Viking O33-95LF — 95 59.8 9.9 24.3 5.8 43.1 46.3 28.4 2,430 23,988
Mean 60.7 9.6 24.5 6.0 37.1 46.5 36.1 2,857 27,338 LSD (0.10) 1.3 0.5 1.3 0.3 1.8 0.9 2.2 91.7 1,832
C.V. 6.9 11.8 12.8 10.5 10.6 4.3 13.5 8.5 14.5 1Bt, CRW, GLY, LL, and Lf traits contain genes for European corn borer tolerance, corn rootworm tolerance, glyphosate herbicide tolerance, Liberty (glufosinate-ammonium) herbicide tolerance and leafy trait, respectively. 2DM yield is whole-plant corn yield at 100% dry matter; Silage yield is whole-plant corn yield at harvest moisture.3Quality concentration expressed as a % of DM, except NDFD which is expressed as a % of NDF. Refer to Results Provided text for additional information.4Milk production was estimated using spreadsheet MILK2006 developed at the University of Wisconsin. Refer to Results Provided text for additional information.
scott.ausborn
Highlight
13
University of Minnesota 2017 Corn Silage
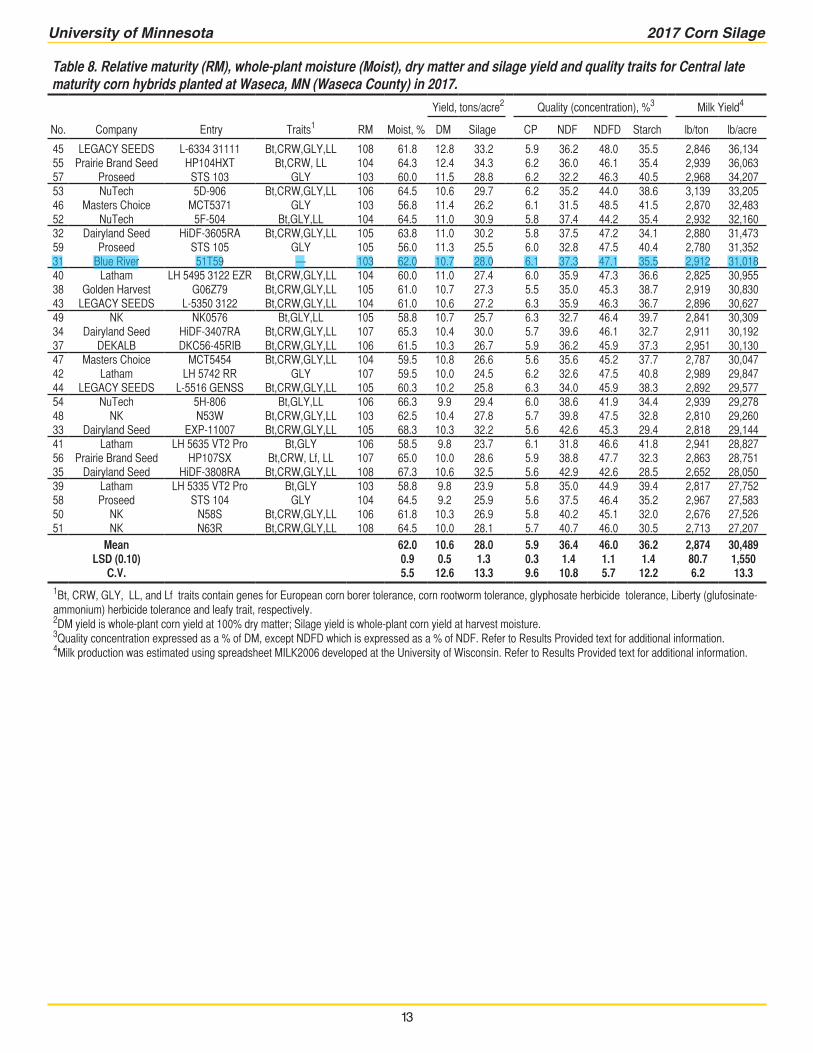
Table 8. Relative maturity (RM), whole-plant moisture (Moist), dry matter and silage yield and quality traits for Central late maturity corn hybrids planted at Waseca, MN (Waseca County) in 2017.
Yield, tons/acre2 Quality (concentration), %3 Milk Yield4
No. Company Entry Traits1 RM Moist, % DM Silage CP NDF NDFD Starch lb/ton lb/acre
45 LEGACY SEEDS L-6334 31111 Bt,CRW,GLY,LL 108 61.8 12.8 33.2 5.9 36.2 48.0 35.5 2,846 36,134 55 Prairie Brand Seed HP104HXT Bt,CRW, LL 104 64.3 12.4 34.3 6.2 36.0 46.1 35.4 2,939 36,063 57 Proseed STS 103 GLY 103 60.0 11.5 28.8 6.2 32.2 46.3 40.5 2,968 34,207 53 NuTech 5D-906 Bt,CRW,GLY,LL 106 64.5 10.6 29.7 6.2 35.2 44.0 38.6 3,139 33,205 46 Masters Choice MCT5371 GLY 103 56.8 11.4 26.2 6.1 31.5 48.5 41.5 2,870 32,483 52 NuTech 5F-504 Bt,GLY,LL 104 64.5 11.0 30.9 5.8 37.4 44.2 35.4 2,932 32,160 32 Dairyland Seed HiDF-3605RA Bt,CRW,GLY,LL 105 63.8 11.0 30.2 5.8 37.5 47.2 34.1 2,880 31,473 59 Proseed STS 105 GLY 105 56.0 11.3 25.5 6.0 32.8 47.5 40.4 2,780 31,352 31 Blue River 51T59 — 103 62.0 10.7 28.0 6.1 37.3 47.1 35.5 2,912 31,018 40 Latham LH 5495 3122 EZR Bt,CRW,GLY,LL 104 60.0 11.0 27.4 6.0 35.9 47.3 36.6 2,825 30,955 38 Golden Harvest G06Z79 Bt,CRW,GLY,LL 105 61.0 10.7 27.3 5.5 35.0 45.3 38.7 2,919 30,830 43 LEGACY SEEDS L-5350 3122 Bt,CRW,GLY,LL 104 61.0 10.6 27.2 6.3 35.9 46.3 36.7 2,896 30,627 49 NK NK0576 Bt,GLY,LL 105 58.8 10.7 25.7 6.3 32.7 46.4 39.7 2,841 30,309 34 Dairyland Seed HiDF-3407RA Bt,CRW,GLY,LL 107 65.3 10.4 30.0 5.7 39.6 46.1 32.7 2,911 30,192 37 DEKALB DKC56-45RIB Bt,CRW,GLY,LL 106 61.5 10.3 26.7 5.9 36.2 45.9 37.3 2,951 30,130 47 Masters Choice MCT5454 Bt,CRW,GLY,LL 104 59.5 10.8 26.6 5.6 35.6 45.2 37.7 2,787 30,047 42 Latham LH 5742 RR GLY 107 59.5 10.0 24.5 6.2 32.6 47.5 40.8 2,989 29,847 44 LEGACY SEEDS L-5516 GENSS Bt,CRW,GLY,LL 105 60.3 10.2 25.8 6.3 34.0 45.9 38.3 2,892 29,577 54 NuTech 5H-806 Bt,GLY,LL 106 66.3 9.9 29.4 6.0 38.6 41.9 34.4 2,939 29,278 48 NK N53W Bt,CRW,GLY,LL 103 62.5 10.4 27.8 5.7 39.8 47.5 32.8 2,810 29,260 33 Dairyland Seed EXP-11007 Bt,CRW,GLY,LL 105 68.3 10.3 32.2 5.6 42.6 45.3 29.4 2,818 29,144 41 Latham LH 5635 VT2 Pro Bt,GLY 106 58.5 9.8 23.7 6.1 31.8 46.6 41.8 2,941 28,827 56 Prairie Brand Seed HP107SX Bt,CRW, Lf, LL 107 65.0 10.0 28.6 5.9 38.8 47.7 32.3 2,863 28,751 35 Dairyland Seed HiDF-3808RA Bt,CRW,GLY,LL 108 67.3 10.6 32.5 5.6 42.9 42.6 28.5 2,652 28,050 39 Latham LH 5335 VT2 Pro Bt,GLY 103 58.8 9.8 23.9 5.8 35.0 44.9 39.4 2,817 27,752 58 Proseed STS 104 GLY 104 64.5 9.2 25.9 5.6 37.5 46.4 35.2 2,967 27,583 50 NK N58S Bt,CRW,GLY,LL 106 61.8 10.3 26.9 5.8 40.2 45.1 32.0 2,676 27,526 51 NK N63R Bt,CRW,GLY,LL 108 64.5 10.0 28.1 5.7 40.7 46.0 30.5 2,713 27,207
Mean 62.0 10.6 28.0 5.9 36.4 46.0 36.2 2,874 30,489 LSD (0.10) 0.9 0.5 1.3 0.3 1.4 1.1 1.4 80.7 1,550
C.V. 5.5 12.6 13.3 9.6 10.8 5.7 12.2 6.2 13.3 1Bt, CRW, GLY, LL, and Lf traits contain genes for European corn borer tolerance, corn rootworm tolerance, glyphosate herbicide tolerance, Liberty (glufosinate-ammonium) herbicide tolerance and leafy trait, respectively. 2DM yield is whole-plant corn yield at 100% dry matter; Silage yield is whole-plant corn yield at harvest moisture.3Quality concentration expressed as a % of DM, except NDFD which is expressed as a % of NDF. Refer to Results Provided text for additional information.4Milk production was estimated using spreadsheet MILK2006 developed at the University of Wisconsin. Refer to Results Provided text for additional information.
scott.ausborn
Highlight
14
University of Minnesota 2017 Corn Silage
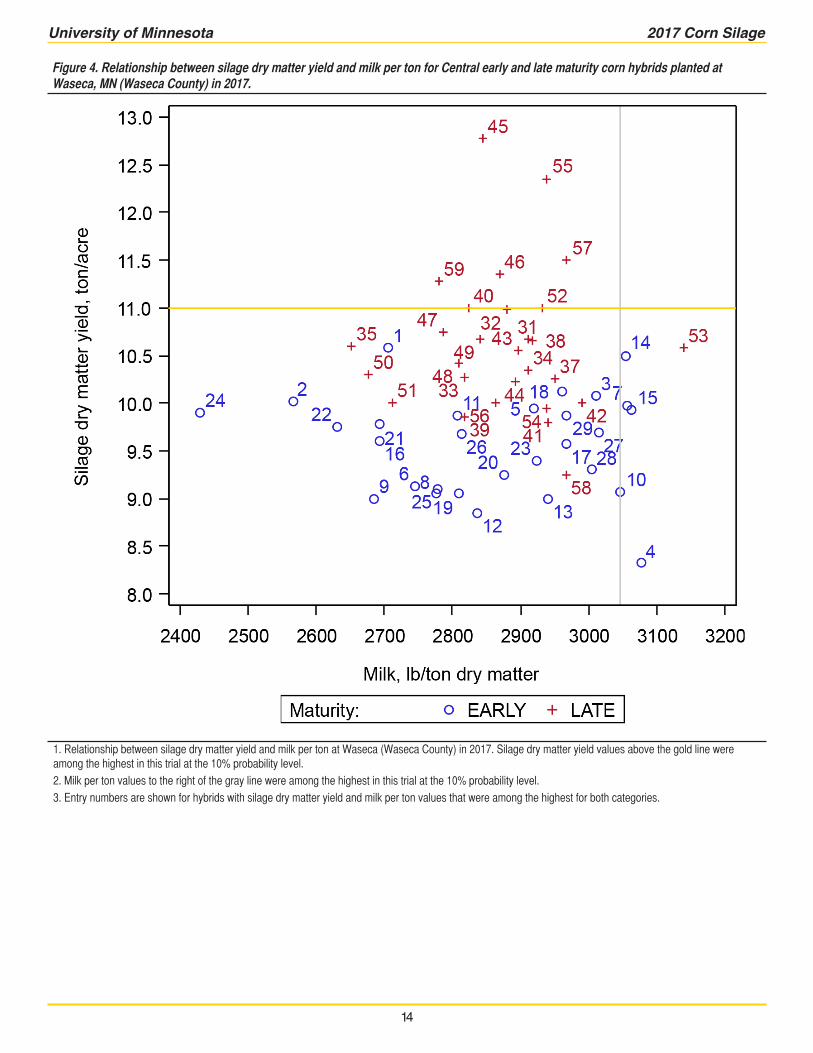
Figure 4. Relationship between silage dry matter yield and milk per ton for Central early and late maturity corn hybrids planted at Waseca, MN (Waseca County) in 2017.
1. Relationship between silage dry matter yield and milk per ton at Waseca (Waseca County) in 2017. Silage dry matter yield values above the gold line were among the highest in this trial at the 10% probability level. 2. Milk per ton values to the right of the gray line were among the highest in this trial at the 10% probability level.3. Entry numbers are shown for hybrids with silage dry matter yield and milk per ton values that were among the highest for both categories.