2017 Classified Service Compensation Report - … 120417 Item 23 SPO... · 2017 Classified Service...
67
2017 Classified Service Compensation Report State of New Mexico State Personnel Board Justin Najaka, Director, State Personnel Office December 7, 2017
Transcript of 2017 Classified Service Compensation Report - … 120417 Item 23 SPO... · 2017 Classified Service...

2017ClassifiedService
CompensationReport
State of New Mexico
State Personnel Board
Justin Najaka, Director, State Personnel Office
December 7, 2017
Classified Service
Compensation Report
| 2
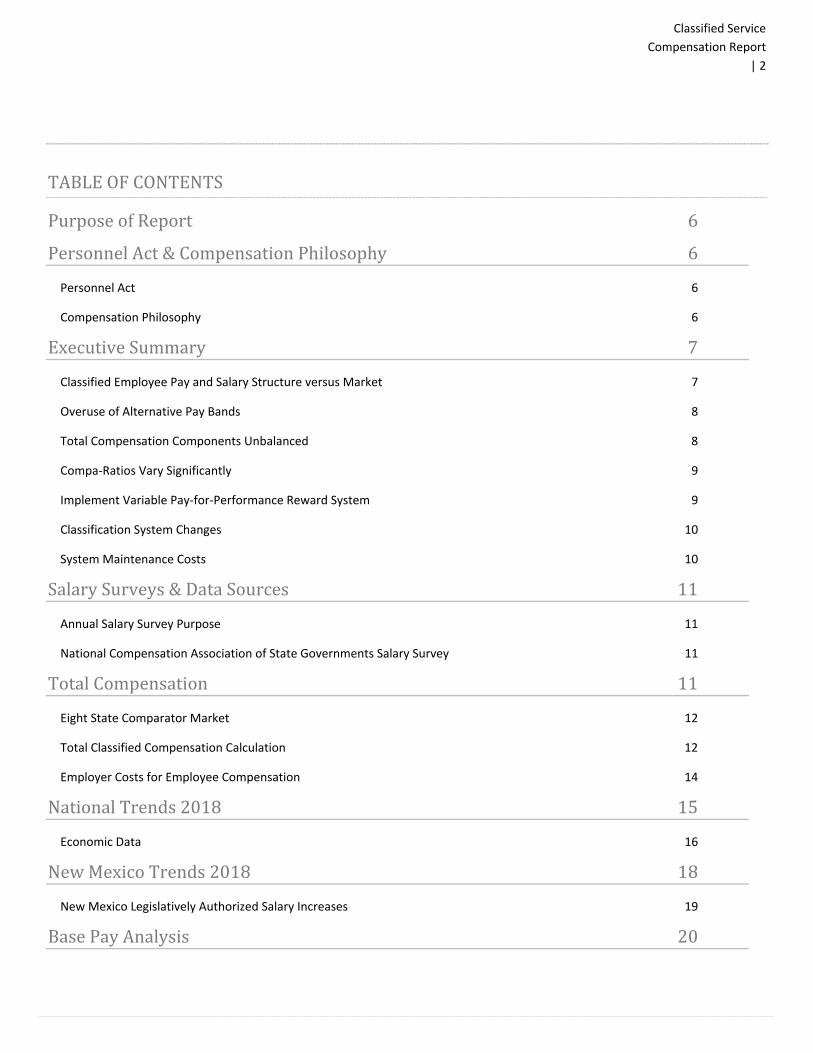
TABLEOFCONTENTS
PurposeofReport 6
PersonnelAct&CompensationPhilosophy 6
Personnel Act 6
Compensation Philosophy 6
ExecutiveSummary 7
Classified Employee Pay and Salary Structure versus Market 7
Overuse of Alternative Pay Bands 8
Total Compensation Components Unbalanced 8
Compa‐Ratios Vary Significantly 9
Implement Variable Pay‐for‐Performance Reward System 9
Classification System Changes 10
System Maintenance Costs 10
SalarySurveys&DataSources 11
Annual Salary Survey Purpose 11
National Compensation Association of State Governments Salary Survey 11
TotalCompensation 11
Eight State Comparator Market 12
Total Classified Compensation Calculation 12
Employer Costs for Employee Compensation 14
NationalTrends2018 15
Economic Data 16
NewMexicoTrends2018 18
New Mexico Legislatively Authorized Salary Increases 19
BasePayAnalysis 20

Classified Service
Compensation Report
| 3
Maintaining External Competitiveness 20
New Mexico Classified Employee Average & Median Salary Comparison 20
Proposed Occupationally Based Salary Structures 21
Average Salary Data by Pay Band 24
Average Salary Data by Agency 27
Key Classification Studies that Solved Staffing and Pay Issues 27
SalaryStructure 28
Regression Analysis 29
Classified Employee Compa‐Ratio 31
Alternative Pay Bands (APB) 33
PayAdministration 33
Pay Mechanisms 33
County‐by‐County Population vs. Classified Demographics 36
Classified Positions & Average Salary By County 38
ClassificationStudies 39
WorkPlan 39
Supervisors 40
Managers 40
Misclassification & Classification Creep 41
Performance‐BasedVariablePayStrategy 42
LeaveAccrualsandPayouts 43
Annual Leave 43
Sick Leave 44
Overtime 45
Turnover&Vacancy 46
Hiring 47
Separation 47
Classified Service
Compensation Report
| 4
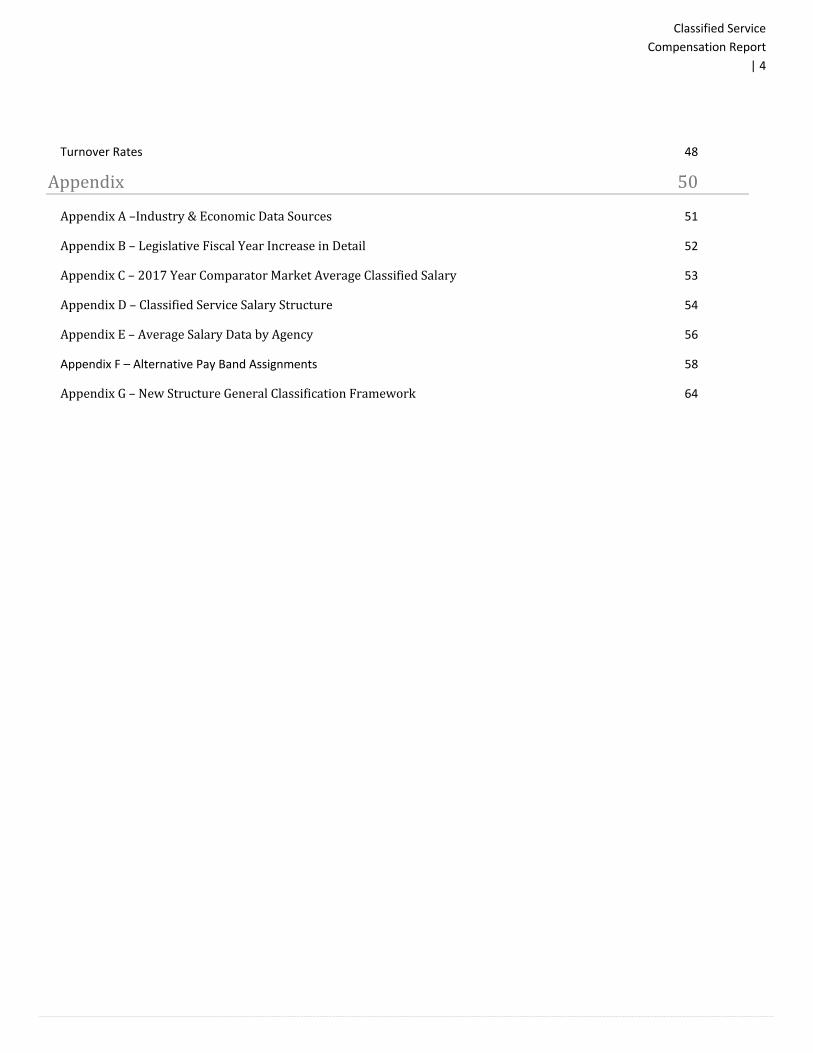
Turnover Rates 48
Appendix 50
AppendixA–Industry&EconomicDataSources 51
AppendixB–LegislativeFiscalYearIncreaseinDetail 52
AppendixC–2017YearComparatorMarketAverageClassifiedSalary 53
AppendixD–ClassifiedServiceSalaryStructure 54
AppendixE–AverageSalaryDatabyAgency 56
Appendix F – Alternative Pay Band Assignments 58
AppendixG–NewStructureGeneralClassificationFramework 64

Classified Service
Compensation Report
| 5
StateLeadership
SusanaMartinez,Governor
JohnSanchez,LieutenantGovernor
StatePersonnelBoardMembers
ChristineRomero,Chair
JerryManzagol,ViceChair
MeganMuirhead,Member
CarmenV.Chavez,Member
StatePersonnelOffice
JustinNajaka,StatePersonnelDirector
NiviaThames,DeputyDirector
BernadettePerez,ActingCompensationandClassificationDirector
CliffMcNary,StateClassificationandTestingManager
MichaelMcEuen,Compensation&ClassificationAnalyst
AmparoJuarez,CompensationandClassificationAnalyst
StephanieMartinezdeBerenger,CompensationandClassificationAnalyst
AliciaLucero,SeniorHRPolicyAnalyst
CynthiaAnaya,HRAgencyConsultant

Classified Service
Compensation Report
| 6
PurposeofReportThe State Personnel Board (SPB) Rules1 require the SPB to annually adopt and submit a compensation report to the
Governor and the Legislative Finance Committee (LFC) that details the results of the State of New Mexico’s (State)
annual compensation survey, and provides a review of the State’s total compensation structure. This document shall
serve as the official report.
This report conveys economic pay trends, findings, and data derived from the compensation and benefits surveys
analyzed by the State Personnel Office (SPO). This data is analyzed in order to illustrate the salary ranges, rates, average
salaries, and benefits for state classifications in the eight state comparator labor market. The report also summarizes
key findings and comparative data showing the relationship of the State’s wages and compensation programs to those
of the eight state comparator labor markets. Additionally, it presents data on State employee demographics, the use of
available pay mechanisms, and industry accepted workforce metrics for the enhancement of the classified service pay
system.
PersonnelAct&CompensationPhilosophyPersonnelAct
The State Personnel Act requires New Mexico to establish and maintain a system of personnel administration for
classified employees based solely on employee qualifications and abilities that provides greater economy and efficiency
in the management of State affairs.2
CompensationPhilosophy
In 2001, the SPB established a policy regarding the state’s approach to compensation:
“The Compensation System (salary and benefits) for classified state government employees will be
structured to support the mission of State Government and be consistent with state statutes to provide
a high level of responsive service in meeting the needs of its citizens. The foundation of this structure is
to reward employees for their specific contributions to the achievement of organizational goals and
objectives. Fiscal responsibility requires that this approach be administered in a consistent manner
throughout the state’s classified service based on its financial capabilities.”
1 NMAC 1.7.4.8(E). 2 NMSA 1978 § 10‐9‐2.
Classified Service
Compensation Report
| 7
ExecutiveSummaryThe classified service workforce consists of over 17,000 employees within 64 executive agencies. The State recognizes
that its employees are its most valuable asset, and that these employees are critical to providing services to all New
Mexicans. Employment with New Mexico state government represents a career in public service, and an opportunity to
deliver excellence, accountability, and efficiency.
Both private and public employers seek to attract and retain qualified and dedicated employees to translate business
strategy into success. Accordingly, it is critical to have a sound compensation program that is externally competitive. As
the economy continues to recover, the State is experiencing pressure as other private and public sector organizations
are competing for the same workers that the State is trying to attract and retain. Thus, SPO has worked hard to develop
12 new pay lines which will address market pricing issues, of which 4 pay lines have been approved by the SPB, creating
a cleaner and more responsive compensation system to help recruit new employees. Work continues to get all new pay
lines approved by the SPB.
ClassifiedEmployeePayandSalaryStructureversusMarket
The State strives to pay a competitive public sector salary, while remaining fiscally responsible. This approach has
allowed the State to compete with both private and public employers in the region. Currently, the State’s annual
classified employee average base salary is $45,324. New Mexico ranks sixth in both the primary eight state Comparator
market for public sector employee and total compensation (salary plus benefits). Both of these rankings indicate that
New Mexico is slightly behind its goal of being the average payer within the region. Regardless, a detailed analysis and
Comparison of specific classification levels shows New Mexico to be at market for most general classifications, but
further behind actual market averages in many hard to recruit and retain classifications for critical occupations such as
Corrections, Information Technology, and Healthcare. In some cases, the average salary levels for selected benchmark
classifications in these occupations, impact the State’s ability to attract, retain, engage, motivate, and reward qualified
employees.
In 2001, the State’s pay band width was expanded to 78% wide, to allow employees the ability to laterally move (be
promoted) in pay, as skills increased, rather than having to be promoted on a vertically designed pay structure. In FY14,
SPO narrowed the pay band width to 74%, in an effort to bring the State classified service band width closer to the
industry standard of 50% to 60%. The Governor, working with the Legislature, addressed this matter by having vacancies
budgeted at midpoint rather than entry. The pay band width has already had a positive impact on filling vacant
positions. In a continuing effort to align the State’s compensation practices with industry standards, four new pay lines
have narrower pay band widths of 67% (IT), 60% (Engineering and Architecture) and 40% (Corrections).
The State must be prepared to address pay concerns; however, revenue shortfalls in the past few years have restricted
the State from:
Establishing and maintaining competitive position in the marketplace;
Attracting and retaining high quality employees; and,
Addressing the need for a salary structure adjustment, that may occur when funding becomes available.
Classified Service
Compensation Report
| 8
SPO has worked with the Hay Group and Kenning Consulting to review and develop a methodology to address these
issues.
OveruseofAlternativePayBands
Currently, over 23.5% of the State’s job classifications are assigned to Alternative Pay Bands (APB). APBs are being
utilized in response to the State’s inability to adjust and maintain a competitive salary structure. The high number of
APBs is an indicator that the state’s classified service salary structure has not been maintained and requires further
attention.
APBs were originally designed to only be used on an exception basis, to address compensation issues related to
recruitment and retention that could not normally be handled within the general base salary structure. A job that is
evaluated and assigned to range levels appropriately captures and maintains internal equity to other similar sized jobs
within the classified service. When external forces of demand exceed the supply of the labor market, pressure is placed
on the State’s compensation structure. This market pressure has impacted the State’s ability to attract and retain well‐
qualified applicants, resulting in the SPB “temporarily” assigning job classifications to higher pay bands. These APBs are
reviewed annually, and the Compensation and Classification Division presents recommendations to the State Personnel
Board on renewing or discontinuing the temporary pay band assignment. Some classifications have never had an APB
removed once it has been approved; market conditions and talent availability require the annual renewal of certain
APBs.
Absent ongoing maintenance and adjustments to the State’s compensation structure, New Mexico will continue to
experience challenges each year in its ability to competitively recruit and retain employees, especially in critical
occupations. Changes to the State’s compensation structure in FY18 will provide needed relief to these market
pressures.
TotalCompensationComponentsUnbalanced
Total compensation for employees consists not only of the cost of the direct salary received, but also includes the value
and cost to the State for benefits provided to employees. For the State’s classified service, the percentage of total
compensation provided in direct salary versus indirect benefits is skewed towards providing higher indirect benefits by
as much as 10%. When compared to both public and private sectors, the State contributes significantly more to
employees in both medical and retirement benefits.
Total compensation includes benefits of health, dental, life and disability insurance, pharmacy and vision insurance,
retirement, deferred compensation, paid leave (annual, sick and holiday), compensatory time off, and all other types of
leave.
Health insurance costs make up a significant portion of indirect benefit costs, and are a recruiting incentive for the State.
Nationally, employers, including New Mexico, are beginning to more effectively manage benefits to maximize the return
on investment to both the organization and to its workforce. As an example, an increasing number of organizations are
paying 100% of coverage for the employee, while requiring employees to pick up a greater portion, if not all, of
dependent coverage. Accordingly, the State should continue its efforts to review and manage its healthcare plan design,

Classified Service
Compensation Report
| 9
utilization rates, and to implement cost‐management strategies that both mitigate contribution increases, and improve
the overall health and well‐being of employees.
The Public Employee Retirement Association (PERA) offers a defined benefit retirement program for State employees
(educational employees participate in a separate plan). Significant changes to PERA plans have recently occurred
including modifications to the employer/employee contribution rates, and a movement to an age and service credit
requirement (rule of 85) for new employees. Currently, the PERA retirement calculation considers both years of service,
and average highest earnings.
It is important that employees be provided with a complete picture of the total value of their compensation package
with the State of New Mexico, including both direct and indirect compensation. SPO worked with the Department of
Finance and Administration (DFA) and the General Services Department (GSD) to develop within PeopleSoft, a total
compensation statement to be provided annually to each employee.
As costs continue to increase for all of the major components of total compensation, the State must continue examining
its practices to ensure that it is providing the most effective combination of salary and benefits in order to enhance
recruitment while remaining fiscally responsible.
Compa‐RatiosVarySignificantly
Compa‐ratio3 is a position within a pay range relative to the midpoint of a
pay range. It is an industry standard measurement of a compensation
plan.
When evaluating individual agencies:
• The average Compa‐ratio throughout the state ranges from 90% to 116%;
• 8 executive agencies have an average Compa‐ratio of less than 100%; and,
• 14 executive agencies have an average Compa‐ratio of over 110%.
This is indicative that in most agencies the midpoint or close to it has become the entry level for new hires. The lack of
pay adjustments has resulted in significant Compaction for tenured employees who typically have more experience or
qualifications than new hires.
ImplementVariablePay‐for‐PerformanceRewardSystem
SPO continues to assess the feasibility of introducing variable pay‐for‐performance models into the classified service
compensation system. These types of programs are currently being utilized successfully in other government entities.
Employee rewards may include merit increases to base salaries or lump sum rewards and bonuses.
In general, the State’s compensation system should align variable pay with achieved results to recognize and reward
employees for their contribution to the success of the agency. To be effective, variable pay must accommodate market
3 “Compa‐ratio” means pay expressed as a percentage of the midpoint of a pay band. NMAC 1.7.1.7(I).
The midpoint or close to it has become
the entry level for new hires.

Classified Service
Compensation Report
| 10
fluctuations and the cost of living. Variable pay mechanisms are important components of a reward system that
provides effective methods for rewarding outstanding performance, for accomplishments of short‐term assignments, for
retaining employees and for similar special situations.
ClassificationSystemChangesIn 2001, the State revised the classification and compensation system resulting in a 27% reduction in the number of job
classifications from 1,200 to 867. This project, known as NM.HR.2001, included:
• Increasing the compensation plan from a 50% spread to a 78% spread due to a change in the State’s
compensation system and strategy that was abandoned shortly after its establishment; and,
• Abolishment of minimum qualifications for each classification.
The implementation and subsequent abandonment of the premises of NM.HR.2001, coupled with the impact of the
economic downturn, significantly contributed to the State’s inability to attract and retain employees. In 2011, SPO
initiated a review of all classifications. This review has resulted in all classifications and job descriptions being scheduled
to be modified to address:
• Requisite minimum qualifications for each classification; and,
• A specific description of the job duties and responsibilities related to the duties of the position.
These changes resulted in applicants having a better understanding of the duties of the job, and the qualifications
required, resulting in better qualified applicants being hired.
SPO has developed a new market‐focused Classification & Compensation System that will deliver 12 new pay lines that
capture different families of work. These pay lines will allow for targeted, well‐planned increases to be delivered, easing
market tensions and bringing New Mexico closer to the Comparative market.
SystemMaintenanceCosts
In a joint effort the LFC and DFA agreed to a methodology which would identify the cost of a 1% salary increase for
classified and exempt employees for a full year. Cost of In‐Range Salary Adjustments for a Full Fiscal Year is based on
actual classified and exempt employee salaries, and equates to approximately $9.7 million, including benefits. The table
below illustrates the cost of General Fund Split for a full fiscal year:
Table 1
Cost of In‐Range Salary Adjustments for a Full Fiscal Year
Percent of Actual Salary Adjustment
Cost of the General Fund Split (millions)
1% $5,431.6
Classified Service
Compensation Report
| 11
SalarySurveys&DataSources
AnnualSalarySurveyPurpose
Annually, the State Personnel Office’s Compensation & Classification Division collects salary survey data to identify and
compare the labor market competitiveness of the State’s salary structure (pay bands), and current pay practices (actual
pay), with the State’s comparator market. This survey also allows an assessment of the competitiveness of pay and
benefits (insurance, leave, etc.) to the labor market. SPO’s Compensation & Classification Division reviews and analyzes
numerous, credible, salary and budget surveys to collect salary data. (See Appendix A).
Job classifications are reviewed and compared to benchmarks to determine how close to similar jobs are represented
through comparative analyses, and are selected based on market criteria which are consistent with past comparisons.
These represent a:
● Large sample of state employees;
● Variety of job occupa ons (clerical, administrative, trade, counseling, law enforcement, etc.); and,
● Range of levels in job complexity (measured in job content points).
Unless noted, data used in the compilation of this report is as of July 1, 2017.
NationalCompensationAssociationofStateGovernmentsSalarySurvey
SPO participates annually in a comprehensive salary survey of benchmark job classifications sponsored by the National
Compensation Association of State Governments (NCASG). The NCASG’s primary objectives in regards to the survey are
to improve the validity of job matches, to improve the accuracy of data in salary surveys among the states, and to
reduce the number of individual surveys exchanged among the states on
an annual basis.
In 2017, 37 state governments participated in NCASG’s annual survey,
representing 637,494 public sector employees. In 2017, SPO identified job
matches for 240 of 251 benchmark classification in the survey..
TotalCompensationThe U.S. Bureau of Labor Statistics defines total compensation as “the
complete reward/recognition package for employees, including all forms of
money, benefits, perquisites, services and in‐kind payments.”
The State of New Mexico provides a competitive employee benefit package that includes: Employer‐paid medical insurance
contributions, pension (retirement) contributions, paid leave allowances for vacation days, sick days, and paid holidays.
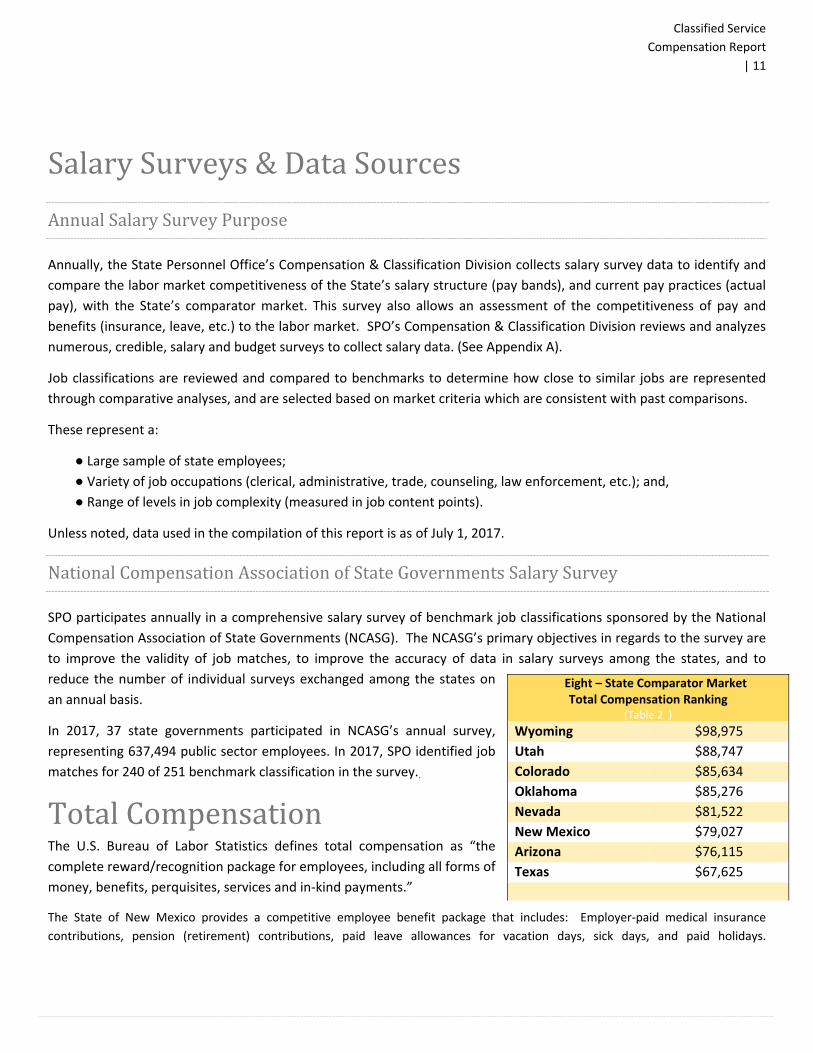
Eight – State Comparator MarketTotal Compensation Ranking
(Table 2 )
Wyoming $98,975
Utah $88,747
Colorado $85,634
Oklahoma $85,276
Nevada $81,522
New Mexico $79,027
Arizona $76,115
Texas $67,625
Classified Service
Compensation Report
| 12
Additionally, State employees may take advantage of a Section 457 Deferred Compensation Plan that allows for
contributions to a tax‐deferred savings program that can be used to supplement their retirement plan.
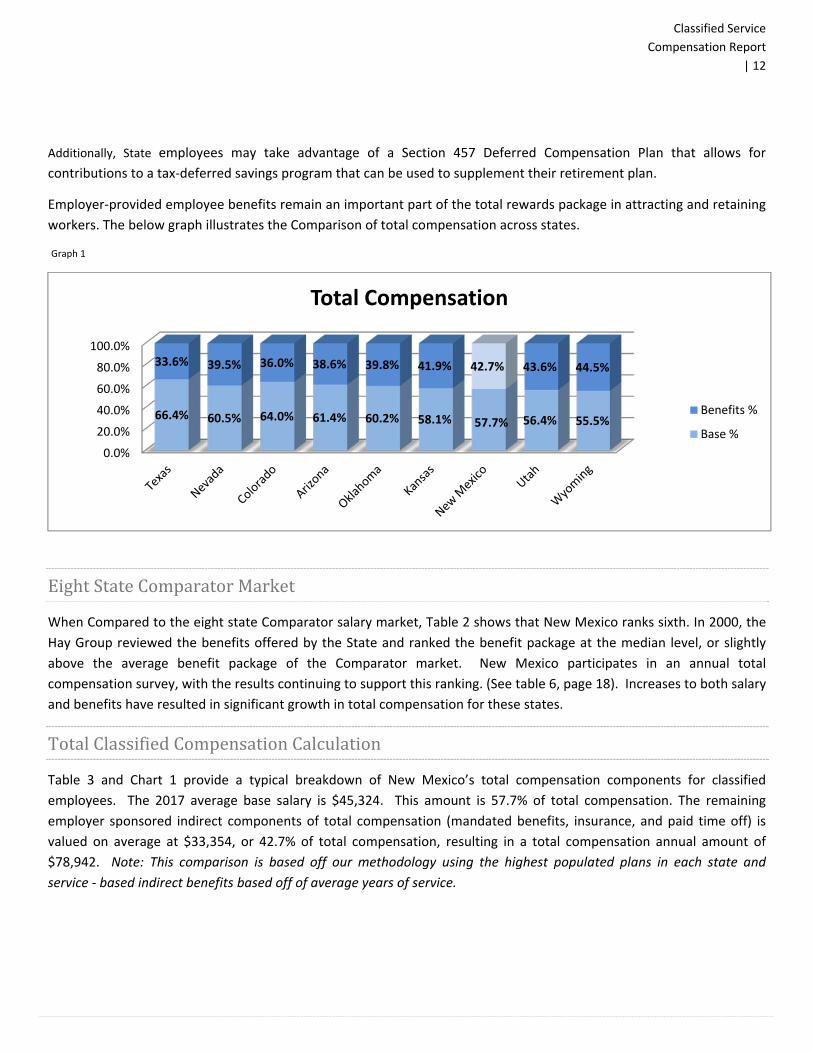
Employer‐provided employee benefits remain an important part of the total rewards package in attracting and retaining
workers. The below graph illustrates the Comparison of total compensation across states.
Graph 1
EightStateComparatorMarket
When Compared to the eight state Comparator salary market, Table 2 shows that New Mexico ranks sixth. In 2000, the
Hay Group reviewed the benefits offered by the State and ranked the benefit package at the median level, or slightly
above the average benefit package of the Comparator market. New Mexico participates in an annual total
compensation survey, with the results continuing to support this ranking. (See table 6, page 18). Increases to both salary
and benefits have resulted in significant growth in total compensation for these states.
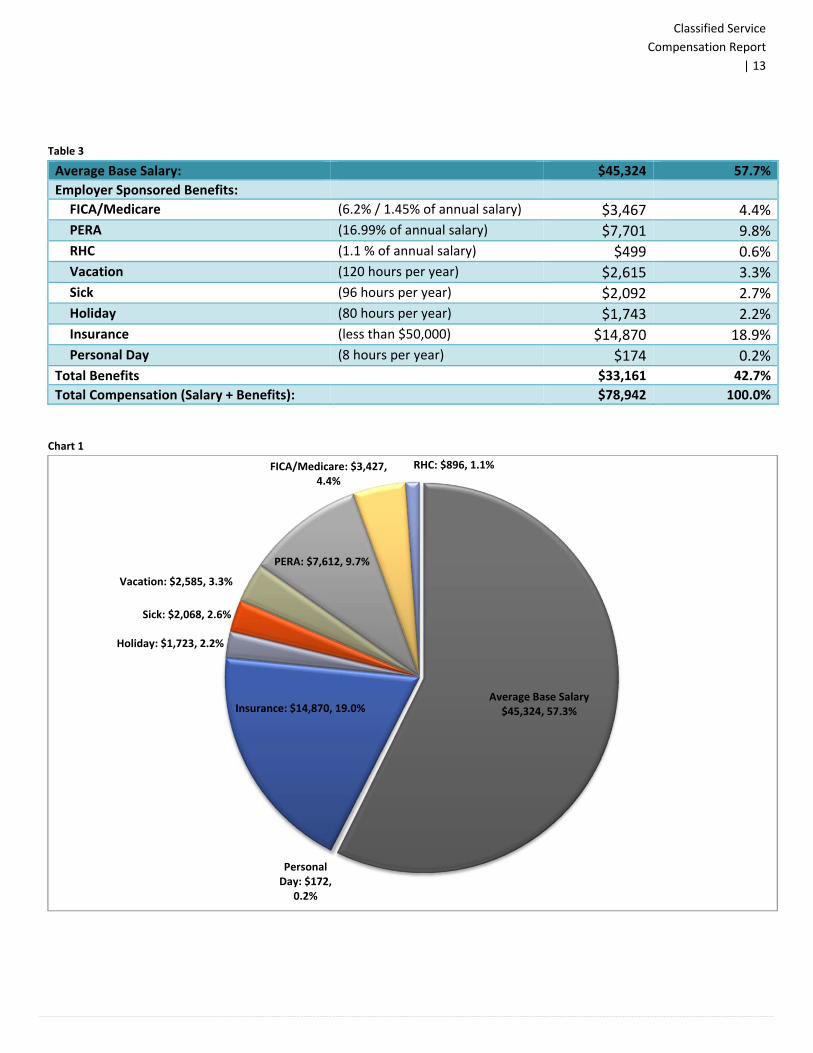
TotalClassifiedCompensationCalculation
Table 3 and Chart 1 provide a typical breakdown of New Mexico’s total compensation components for classified
employees. The 2017 average base salary is $45,324. This amount is 57.7% of total compensation. The remaining
employer sponsored indirect components of total compensation (mandated benefits, insurance, and paid time off) is
valued on average at $33,354, or 42.7% of total compensation, resulting in a total compensation annual amount of
$78,942. Note: This comparison is based off our methodology using the highest populated plans in each state and
service ‐ based indirect benefits based off of average years of service.
0.0%
20.0%
40.0%
60.0%
80.0%
100.0%
66.4% 60.5% 64.0% 61.4% 60.2% 58.1% 57.7% 56.4% 55.5%
33.6% 39.5% 36.0% 38.6% 39.8% 41.9% 42.7% 43.6% 44.5%
Total Compensation
Benefits %
Base %
Classified Service
Compensation Report
| 13
Table 3
Average Base Salary: $45,324 57.7%
Employer Sponsored Benefits:
FICA/Medicare (6.2% / 1.45% of annual salary) $3,467 4.4%PERA (16.99% of annual salary) $7,701 9.8%RHC (1.1 % of annual salary) $499 0.6%Vacation (120 hours per year) $2,615 3.3%Sick (96 hours per year) $2,092 2.7%Holiday (80 hours per year) $1,743 2.2%Insurance (less than $50,000) $14,870 18.9%Personal Day (8 hours per year) $174 0.2%
Total Benefits $33,161 42.7%
Total Compensation (Salary + Benefits): $78,942 100.0%
Chart 1
Average Base Salary $45,324, 57.3%
Personal Day: $172,
0.2%
Insurance: $14,870, 19.0%
Holiday: $1,723, 2.2%
Sick: $2,068, 2.6%
Vacation: $2,585, 3.3%
PERA: $7,612, 9.7%
FICA/Medicare: $3,427, 4.4%
RHC: $896, 1.1%
Classified Service
Compensation Report
| 14
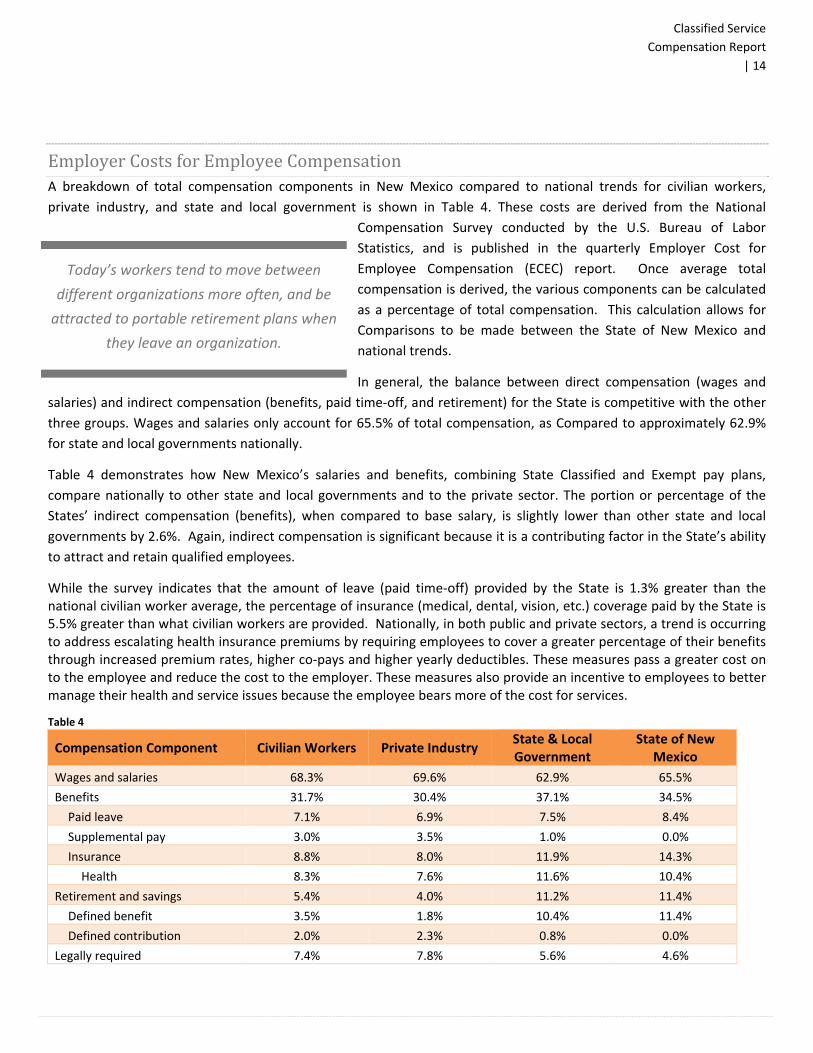
EmployerCostsforEmployeeCompensationA breakdown of total compensation components in New Mexico compared to national trends for civilian workers,
private industry, and state and local government is shown in Table 4. These costs are derived from the National
Compensation Survey conducted by the U.S. Bureau of Labor
Statistics, and is published in the quarterly Employer Cost for
Employee Compensation (ECEC) report. Once average total
compensation is derived, the various components can be calculated
as a percentage of total compensation. This calculation allows for
Comparisons to be made between the State of New Mexico and
national trends.
In general, the balance between direct compensation (wages and
salaries) and indirect compensation (benefits, paid time‐off, and retirement) for the State is competitive with the other
three groups. Wages and salaries only account for 65.5% of total compensation, as Compared to approximately 62.9%
for state and local governments nationally.
Table 4 demonstrates how New Mexico’s salaries and benefits, combining State Classified and Exempt pay plans,
compare nationally to other state and local governments and to the private sector. The portion or percentage of the
States’ indirect compensation (benefits), when compared to base salary, is slightly lower than other state and local
governments by 2.6%. Again, indirect compensation is significant because it is a contributing factor in the State’s ability
to attract and retain qualified employees.
While the survey indicates that the amount of leave (paid time‐off) provided by the State is 1.3% greater than the national civilian worker average, the percentage of insurance (medical, dental, vision, etc.) coverage paid by the State is 5.5% greater than what civilian workers are provided. Nationally, in both public and private sectors, a trend is occurring to address escalating health insurance premiums by requiring employees to cover a greater percentage of their benefits through increased premium rates, higher co‐pays and higher yearly deductibles. These measures pass a greater cost on to the employee and reduce the cost to the employer. These measures also provide an incentive to employees to better manage their health and service issues because the employee bears more of the cost for services.
Table 4
Compensation Component Civilian Workers Private Industry State & Local Government
State of New Mexico
Wages and salaries 68.3% 69.6% 62.9% 65.5%
Benefits 31.7% 30.4% 37.1% 34.5%
Paid leave 7.1% 6.9% 7.5% 8.4%
Supplemental pay 3.0% 3.5% 1.0% 0.0%
Insurance 8.8% 8.0% 11.9% 14.3%
Health 8.3% 7.6% 11.6% 10.4%
Retirement and savings 5.4% 4.0% 11.2% 11.4%
Defined benefit 3.5% 1.8% 10.4% 11.4%
Defined contribution 2.0% 2.3% 0.8% 0.0%
Legally required 7.4% 7.8% 5.6% 4.6%
Today’s workers tend to move between
different organizations more often, and be
attracted to portable retirement plans when
they leave an organization.
Classified Service
Compensation Report
| 15
The retirement and savings component in state and local government is more than twice the national average for civilian
workers. Defined benefit programs were increased as a recruitment mechanism in the late 1960’s. While defined
benefit programs have been phased out in most private sector organizations, they are also being used less in the public
sector. Although deferred earnings are critical to maintaining a comfortable living in later years, a key issue with
employer paid retirement is that this liability continues long after an employee has left the organization.
A solid retirement plan is a key factor in attracting employees to work for an organization, and it is an even larger factor
in retaining employees; however, due to the changes in workforce demographics, today’s workers tend to move
between different organizations more often, and tend to be attracted to portable retirement plans when they leave an
organization. Although there is no dispute on the importance of retirement and the time value of money, it may be
beneficial to review the balance between the various components of total compensation, given the changes in
workforce demographics.
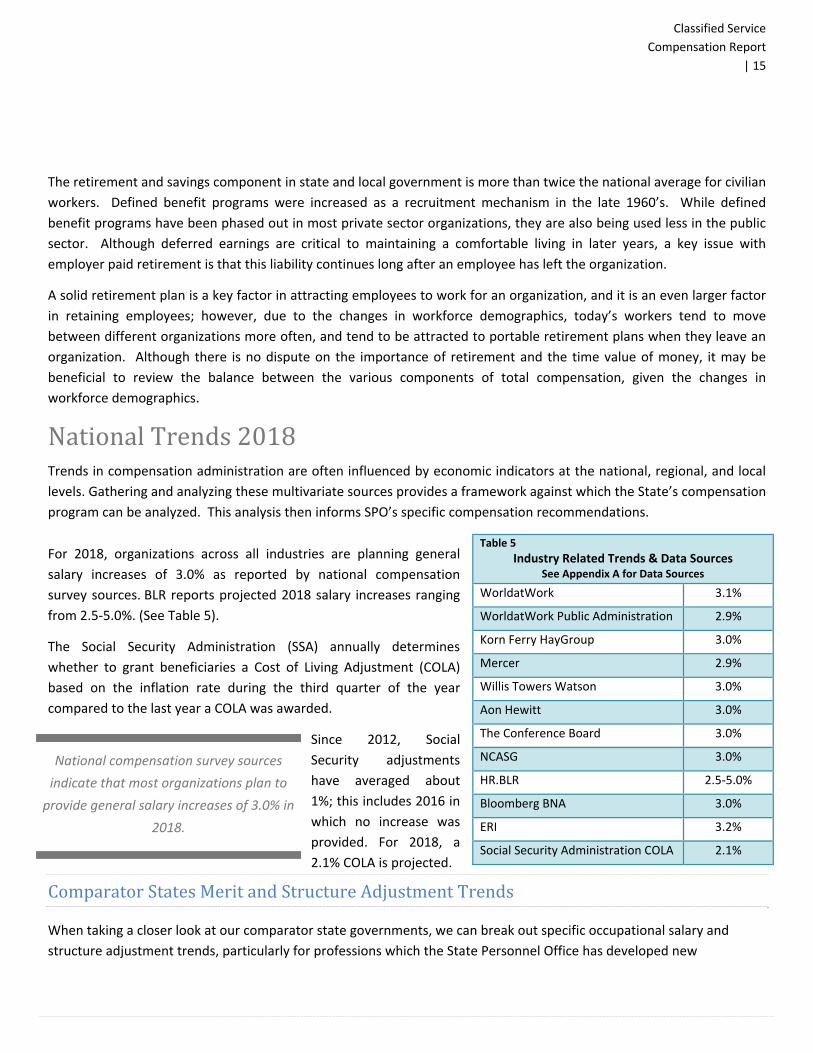
NationalTrends2018 Trends in compensation administration are often influenced by economic indicators at the national, regional, and local
levels. Gathering and analyzing these multivariate sources provides a framework against which the State’s compensation
program can be analyzed. This analysis then informs SPO’s specific compensation recommendations.
For 2018, organizations across all industries are planning general
salary increases of 3.0% as reported by national compensation
survey sources. BLR reports projected 2018 salary increases ranging
from 2.5‐5.0%. (See Table 5).
The Social Security Administration (SSA) annually determines
whether to grant beneficiaries a Cost of Living Adjustment (COLA)
based on the inflation rate during the third quarter of the year
compared to the last year a COLA was awarded.
Since 2012, Social
Security adjustments
have averaged about
1%; this includes 2016 in
which no increase was
provided. For 2018, a
2.1% COLA is projected.
ComparatorStatesMeritandStructureAdjustmentTrends
When taking a closer look at our comparator state governments, we can break out specific occupational salary and
structure adjustment trends, particularly for professions which the State Personnel Office has developed new
Table 5
Industry Related Trends & Data Sources See Appendix A for Data Sources
WorldatWork 3.1%
WorldatWork Public Administration 2.9%
Korn Ferry HayGroup 3.0%
Mercer 2.9%
Willis Towers Watson 3.0%
Aon Hewitt 3.0%
The Conference Board 3.0%
NCASG 3.0%
HR.BLR 2.5‐5.0%
Bloomberg BNA 3.0%
ERI 3.2%
Social Security Administration COLA 2.1%
National compensation survey sources
indicate that most organizations plan to
provide general salary increases of 3.0% in
2018.

Classified Service
Compensation Report
| 16
classifications and new salary structures. According to the latest NCASG salary survey data presented at its annual
conference this fall, states projected a 3.0% merit increase for all occupations in FY17; yet the actual average increase
from year‐to‐year was 1.88%. States reported actual average merit increases for Engineering and Architects at 1.3%;
Security/Corrections at 2.54%: and IT at 1.6%. Reporting states are projecting for FY18 salary increases of 3.0% and
structure adjustments (pay bands) of 2.1%.
EconomicData
The U.S. Department of Labor (DOL) Bureau of Labor Statistics (BLS) tracks a
number of primary economic indicators relevant to compensation and the
price of goods and services.
Employment Cost Index (ECI)
The Employment Cost Index (ECI) is an indicator measured quarterly that
tracks changes in compensation costs including wages, salaries and the
employer’s cost for employee benefits.
Consumer Price Index—All Urban Consumers (CPI—U)
The Consumer Price Index—All Urban Consumers (CPI—U) is tracked monthly
and is a measure of the changing purchasing power of the dollar. The number
reflects the average change in the prices paid by urban consumers for a fixed
market basket of goods and services. The index is principally used as an
indicator of inflation.
For the period ending September 2017, the CPI‐U, which covers 89% of the population of the United States, was
reported as 2.2%. (See Graph 2). Supporting data may be found at www.bls.gov.
Table 6 and Graph 2 show ECI wage‐related data Compared to CPI‐U’s inflation‐related data.
Graph 2
2001 2002 2003 2004 2005 2006 2007 2008 2009 2010 2011 2012 2013 2014 2015 2016 2017
ECI (Civilian) 4.1% 3.7% 3.9% 3.8% 3.0% 3.0% 3.3% 2.9% 1.5% 1.5% 1.6% 2.0% 1.9% 2.2% 2.0% 2.0% 2.5%
ECI (State & Local Govt.) 4.4% 3.8% 3.6% 3.4% 3.9% 4.1% 4.3% 3.4% 2.4% 1.7% 1.5% 1.8% 1.7% 2.1% 2.3% 2.3% 2.4%
CPI‐U 2.6% 1.5% 2.3% 2.5% 4.7% 2.1% 2.8% 4.9% ‐1.0% 1.1% 3.9% 2.0% 1.2% 1.7% 0.0% 1.1% 2.2%
‐2.0%
0.0%
2.0%
4.0%
6.0%ECI & CPI Economic Data
Table 6
ECI & CPI Economic Data
Year ECI (Civilian)
ECI (State & Local Govt.) CPI‐U
2006 3.3% 4.1% 2.1%
2007 3.3% 4.3% 2.9%
2008 2.9% 3.4% 4.9%
2009 1.5% 2.4% ‐1.0%
2010 1.5% 1.7% 1.1%
2011 1.6% 1.5% 3.9%
2012 2.0% 1.8% 2.0%
2013 1.9% 1.7% 1.2%
2014 2.2% 2.1% 1.7%
2015 2.0% 2.3% 0.0%
2016 2.3% 2.3% 1.1%
2017 2.5% 2.4% 2.2%
Classified Service
Compensation Report
| 17
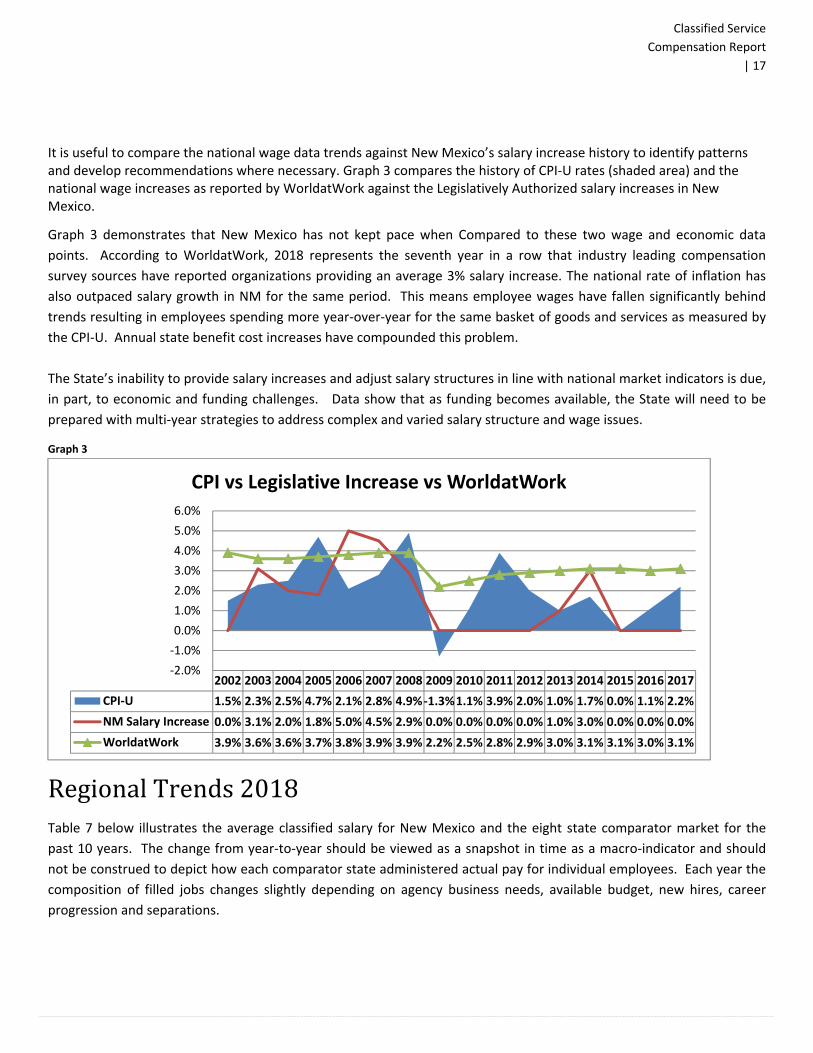
It is useful to compare the national wage data trends against New Mexico’s salary increase history to identify patterns and develop recommendations where necessary. Graph 3 compares the history of CPI‐U rates (shaded area) and the national wage increases as reported by WorldatWork against the Legislatively Authorized salary increases in New Mexico.
Graph 3 demonstrates that New Mexico has not kept pace when Compared to these two wage and economic data
points. According to WorldatWork, 2018 represents the seventh year in a row that industry leading compensation
survey sources have reported organizations providing an average 3% salary increase. The national rate of inflation has
also outpaced salary growth in NM for the same period. This means employee wages have fallen significantly behind
trends resulting in employees spending more year‐over‐year for the same basket of goods and services as measured by
the CPI‐U. Annual state benefit cost increases have compounded this problem.
The State’s inability to provide salary increases and adjust salary structures in line with national market indicators is due,
in part, to economic and funding challenges. Data show that as funding becomes available, the State will need to be
prepared with multi‐year strategies to address complex and varied salary structure and wage issues.
Graph 3
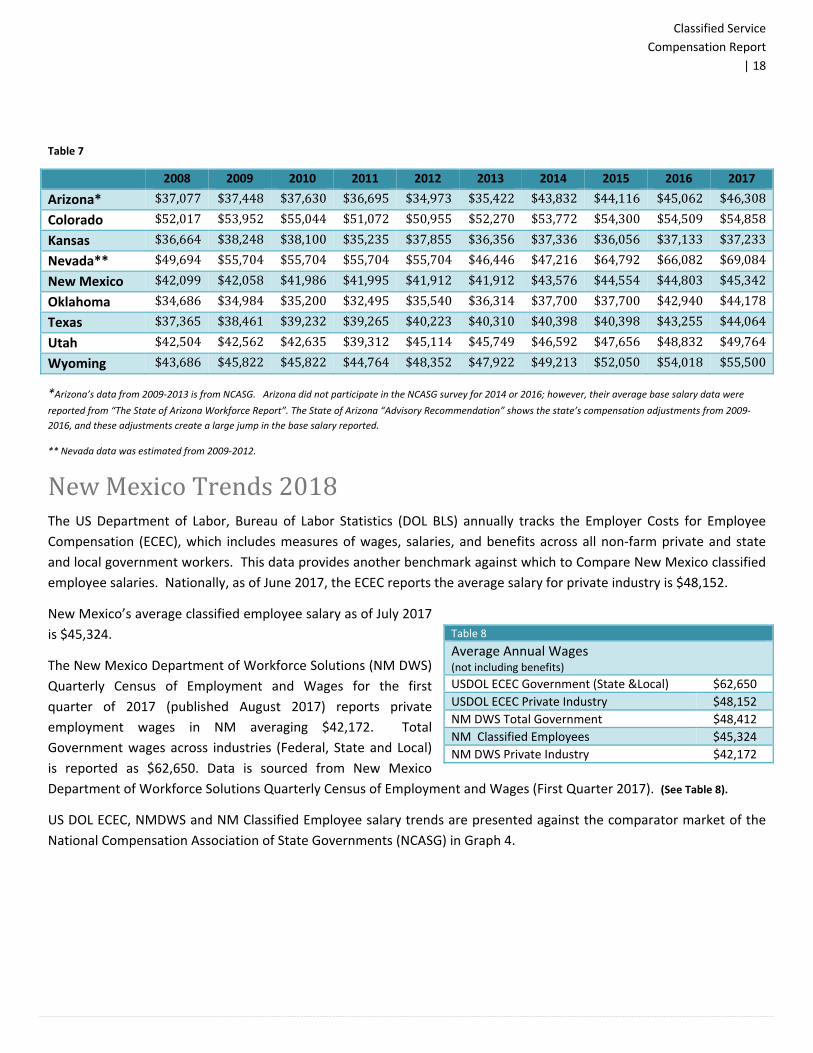
RegionalTrends2018Table 7 below illustrates the average classified salary for New Mexico and the eight state comparator market for the
past 10 years. The change from year‐to‐year should be viewed as a snapshot in time as a macro‐indicator and should
not be construed to depict how each comparator state administered actual pay for individual employees. Each year the
composition of filled jobs changes slightly depending on agency business needs, available budget, new hires, career
progression and separations.
2002 2003 2004 2005 2006 2007 2008 2009 2010 2011 2012 2013 2014 2015 2016 2017
CPI‐U 1.5% 2.3% 2.5% 4.7% 2.1% 2.8% 4.9%‐1.3%1.1% 3.9% 2.0% 1.0% 1.7% 0.0% 1.1% 2.2%
NM Salary Increase 0.0% 3.1% 2.0% 1.8% 5.0% 4.5% 2.9% 0.0% 0.0% 0.0% 0.0% 1.0% 3.0% 0.0% 0.0% 0.0%
WorldatWork 3.9% 3.6% 3.6% 3.7% 3.8% 3.9% 3.9% 2.2% 2.5% 2.8% 2.9% 3.0% 3.1% 3.1% 3.0% 3.1%
‐2.0%
‐1.0%
0.0%
1.0%
2.0%
3.0%
4.0%
5.0%
6.0%
CPI vs Legislative Increase vs WorldatWork
Classified Service
Compensation Report
| 18
Table 7
2008 2009 2010 2011 2012 2013 2014 2015 2016 2017
Arizona* $37,077 $37,448 $37,630 $36,695 $34,973 $35,422 $43,832 $44,116 $45,062 $46,308
Colorado $52,017 $53,952 $55,044 $51,072 $50,955 $52,270 $53,772 $54,300 $54,509 $54,858
Kansas $36,664 $38,248 $38,100 $35,235 $37,855 $36,356 $37,336 $36,056 $37,133 $37,233
Nevada** $49,694 $55,704 $55,704 $55,704 $55,704 $46,446 $47,216 $64,792 $66,082 $69,084
New Mexico $42,099 $42,058 $41,986 $41,995 $41,912 $41,912 $43,576 $44,554 $44,803 $45,342
Oklahoma $34,686 $34,984 $35,200 $32,495 $35,540 $36,314 $37,700 $37,700 $42,940 $44,178
Texas $37,365 $38,461 $39,232 $39,265 $40,223 $40,310 $40,398 $40,398 $43,255 $44,064
Utah $42,504 $42,562 $42,635 $39,312 $45,114 $45,749 $46,592 $47,656 $48,832 $49,764
Wyoming $43,686 $45,822 $45,822 $44,764 $48,352 $47,922 $49,213 $52,050 $54,018 $55,500
*Arizona’s data from 2009‐2013 is from NCASG. Arizona did not participate in the NCASG survey for 2014 or 2016; however, their average base salary data were
reported from “The State of Arizona Workforce Report”. The State of Arizona “Advisory Recommendation” shows the state’s compensation adjustments from 2009‐
2016, and these adjustments create a large jump in the base salary reported.
** Nevada data was estimated from 2009‐2012.
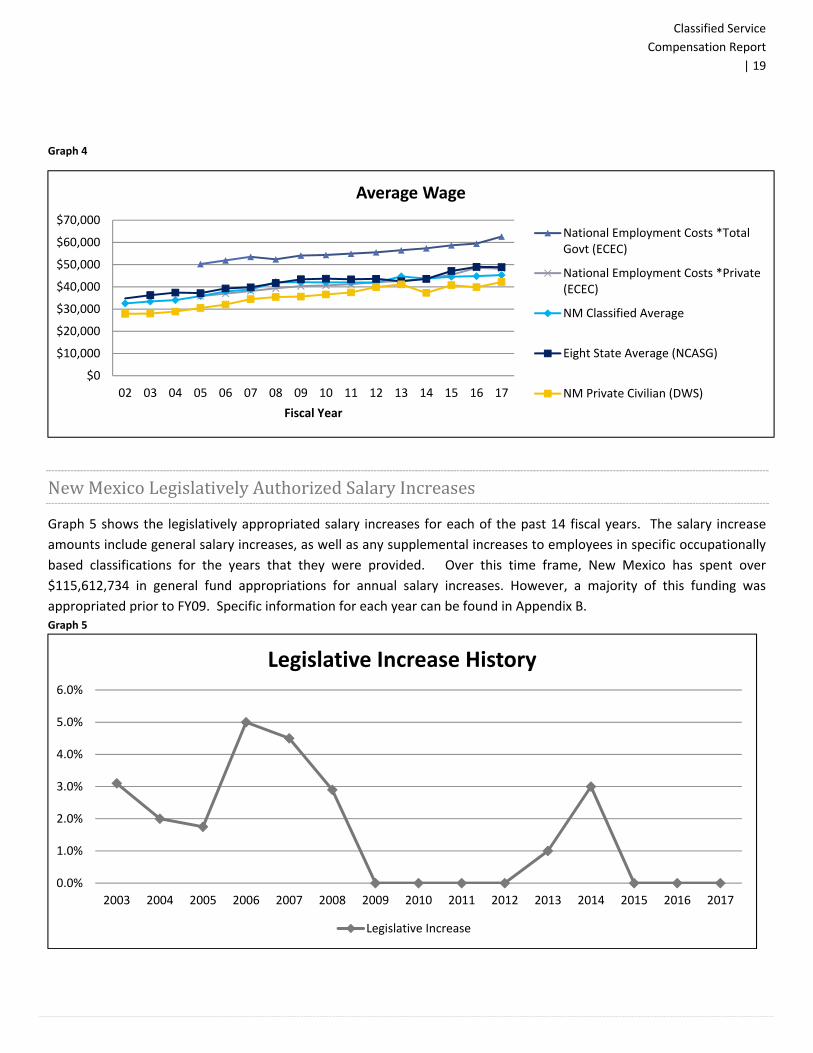
NewMexicoTrends2018The US Department of Labor, Bureau of Labor Statistics (DOL BLS) annually tracks the Employer Costs for Employee
Compensation (ECEC), which includes measures of wages, salaries, and benefits across all non‐farm private and state
and local government workers. This data provides another benchmark against which to Compare New Mexico classified
employee salaries. Nationally, as of June 2017, the ECEC reports the average salary for private industry is $48,152.
New Mexico’s average classified employee salary as of July 2017
is $45,324.
The New Mexico Department of Workforce Solutions (NM DWS)
Quarterly Census of Employment and Wages for the first
quarter of 2017 (published August 2017) reports private
employment wages in NM averaging $42,172. Total
Government wages across industries (Federal, State and Local)
is reported as $62,650. Data is sourced from New Mexico
Department of Workforce Solutions Quarterly Census of Employment and Wages (First Quarter 2017). (See Table 8).
US DOL ECEC, NMDWS and NM Classified Employee salary trends are presented against the comparator market of the
National Compensation Association of State Governments (NCASG) in Graph 4.
Table 8
Average Annual Wages (not including benefits)
USDOL ECEC Government (State &Local) $62,650
USDOL ECEC Private Industry $48,152
NM DWS Total Government $48,412
NM Classified Employees $45,324
NM DWS Private Industry $42,172
Classified Service
Compensation Report
| 19
Graph 4
NewMexicoLegislativelyAuthorizedSalaryIncreases
Graph 5 shows the legislatively appropriated salary increases for each of the past 14 fiscal years. The salary increase
amounts include general salary increases, as well as any supplemental increases to employees in specific occupationally
based classifications for the years that they were provided. Over this time frame, New Mexico has spent over
$115,612,734 in general fund appropriations for annual salary increases. However, a majority of this funding was
appropriated prior to FY09. Specific information for each year can be found in Appendix B. Graph 5
$0
$10,000
$20,000
$30,000
$40,000
$50,000
$60,000
$70,000
02 03 04 05 06 07 08 09 10 11 12 13 14 15 16 17
Fiscal Year
Average Wage
National Employment Costs *TotalGovt (ECEC)
National Employment Costs *Private(ECEC)
NM Classified Average
Eight State Average (NCASG)
NM Private Civilian (DWS)
0.0%
1.0%
2.0%
3.0%
4.0%
5.0%
6.0%
2003 2004 2005 2006 2007 2008 2009 2010 2011 2012 2013 2014 2015 2016 2017
Legislative Increase History
Legislative Increase

Classified Service
Compensation Report
| 20
Base Pay Analysis
MaintainingExternalCompetitiveness
New Mexico’s compensation strategy for more than 10 years has been to
“match” the market and be the average payer in the compared region. In 2017,
New Mexico ranked sixth (Table 9) in the eight state comparator market;
however, this simple indicator is misleading, and requires a further in‐depth
analysis to show how New Mexico’s ranking compares to similar benchmark
jobs in the comparator market, based on similar job content, size, complexity,
qualifications and working conditions.
Appendix C shows the average classified salary over the past 16 years for New
Mexico, as compared to the average within the eight state comparator market,
and the relationship between the two components for each year. Appendix C
must be viewed as a snapshot in time, macro‐indicator, and cannot and should
not be construed to depict how each comparator state administers actual pay
for individual employees, because each year the composition of filled jobs
changes slightly depending on agency business needs, available budget, new hires, career progression, and separations.
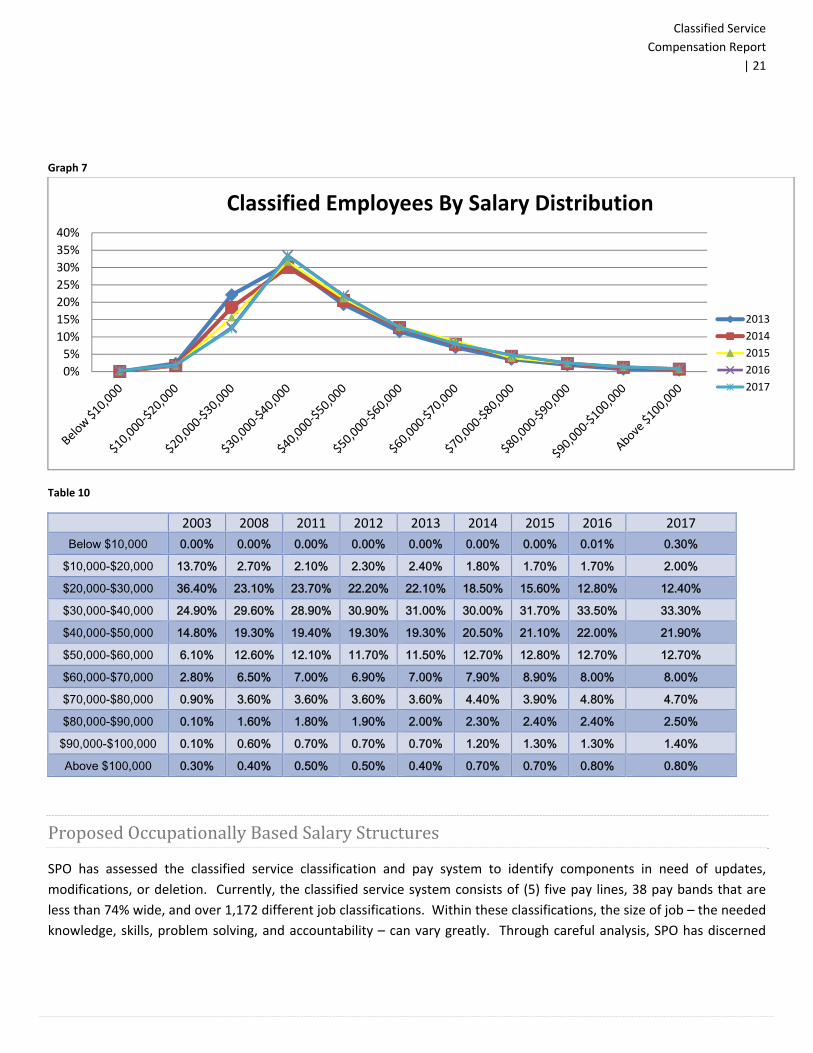
NewMexicoClassifiedEmployeeAverage&MedianSalaryComparison
Average and median classified salaries advanced from 2004 to 2008
and then remained flat from 2008 to 2013. The dollar difference
between average and median salaries occurs due to the larger
number of employees earning less than the average annual salary of
$45,324. The difference between the average and median salaries is
further illustrated upon review of the distribution of classified
employees by earnings between FY04 and FY17. (See Graph 7). FY17 data shows that 45.7% of New Mexico’s classified
employees earned between $20,000 and $40,000 annually. Supplemental information may be found in Table 10.
Graph 6
$25,000
$30,000
$35,000
$40,000
$45,000
2004 2005 2006 2007 2008 2009 2010 2011 2012 2013 2014 2015 2016 2017
New Mexico Classified Employee Average v. Median Annual Salaries
Median Average
Table 9
Eight ‐ State Comparator Market Base Compensation Ranking
Nevada $69,084
Colorado $54,858
Wyoming $55,500
Utah $49,764
Arizona $46,308
New Mexico $45,324
Texas $44,064
Oklahoma $44,178
Kansas $37,233
45.7% of New Mexico’s classified employees
earn between $20,000 and $40,000 annually.
Classified Service
Compensation Report
| 21
Graph 7
Table 10
2003 2008 2011 2012 2013 2014 2015 2016 2017
Below $10,000 0.00% 0.00% 0.00% 0.00% 0.00% 0.00% 0.00% 0.01% 0.30%
$10,000-$20,000 13.70% 2.70% 2.10% 2.30% 2.40% 1.80% 1.70% 1.70% 2.00%
$20,000-$30,000 36.40% 23.10% 23.70% 22.20% 22.10% 18.50% 15.60% 12.80% 12.40%
$30,000-$40,000 24.90% 29.60% 28.90% 30.90% 31.00% 30.00% 31.70% 33.50% 33.30%
$40,000-$50,000 14.80% 19.30% 19.40% 19.30% 19.30% 20.50% 21.10% 22.00% 21.90%
$50,000-$60,000 6.10% 12.60% 12.10% 11.70% 11.50% 12.70% 12.80% 12.70% 12.70%
$60,000-$70,000 2.80% 6.50% 7.00% 6.90% 7.00% 7.90% 8.90% 8.00% 8.00%
$70,000-$80,000 0.90% 3.60% 3.60% 3.60% 3.60% 4.40% 3.90% 4.80% 4.70%
$80,000-$90,000 0.10% 1.60% 1.80% 1.90% 2.00% 2.30% 2.40% 2.40% 2.50%
$90,000-$100,000 0.10% 0.60% 0.70% 0.70% 0.70% 1.20% 1.30% 1.30% 1.40%
Above $100,000 0.30% 0.40% 0.50% 0.50% 0.40% 0.70% 0.70% 0.80% 0.80%
ProposedOccupationallyBasedSalaryStructures
SPO has assessed the classified service classification and pay system to identify components in need of updates,
modifications, or deletion. Currently, the classified service system consists of (5) five pay lines, 38 pay bands that are
less than 74% wide, and over 1,172 different job classifications. Within these classifications, the size of job – the needed
knowledge, skills, problem solving, and accountability – can vary greatly. Through careful analysis, SPO has discerned
0%
5%
10%
15%
20%
25%
30%
35%
40%
Classified Employees By Salary Distribution
2013
2014
2015
2016
2017
Classified Service
Compensation Report
| 22
that this variance will compound over time, as our current and future classifications demand more and more
specialization and skill.
In response, SPO is in the process of creating a new classification structure with 12 new pay lines, each targeted towards
a particular sector, which take into account the sizes of different jobs and the movement of the market in these sectors.
These occupationally based pay lines are:
Corrections (Completed)
Information Technology (Completed)
Engineer, Surveyor, Water Resources,
Engineering Tech (Completed)
Architecture (Completed)
Healthcare and Healthcare Support(In Progress)
Legal
Public Safety and Security
Social Services
General Administration
Management
Scientific
Trades and Labor
These new pay lines will provide policy makers with the flexibility to assess both economic indicators and agency
requests in a more pointed manner. The new pay lines will also enable policy makers to take appropriate, targeted
action, and continue the utilization of the Hay methodology to accurately evaluate jobs without utilizing artificial levels
to accommodate market pay differences.
SPO has also identified job classifications that are unused or underutilized. Many of these classifications are being
consolidated. This process has been ongoing, and SPO anticipates that it will be completed within the next fiscal year.
SPO will rely heavily on agency input and collaboration during the remainder of the project. The last few elements of the
project will involve cross walking old job titles to the new job titles, updating the SHARE and NEOGOV systems, and
training our client agencies on the use of the new system.
The new framework has organized all jobs in state government by occupation, thereby providing a mechanism to correct
the link between classification and compensation as they relate to the market. The new classification framework
provides a means by which the evolution and placement of certain classifications can be accommodated in the future
without having to reshuffle the entire framework.
Every classification within the classified service will be evaluated by SPO and properly defined. Each classification is
categorized into a dedicated job family with defined levels of work. Every job family contains a classification series that
fits together within that job family, such as Civil Engineers and Electrical Engineers within the Engineering family. Once
all the classification series have been placed into their job families, the families are assigned to an occupationally market
based pay line, which allows SPO to responsively adjust to market pressures that could affect certain types of job
families, as seen in the example below:
2017Classified Service
Compensation Report | 23
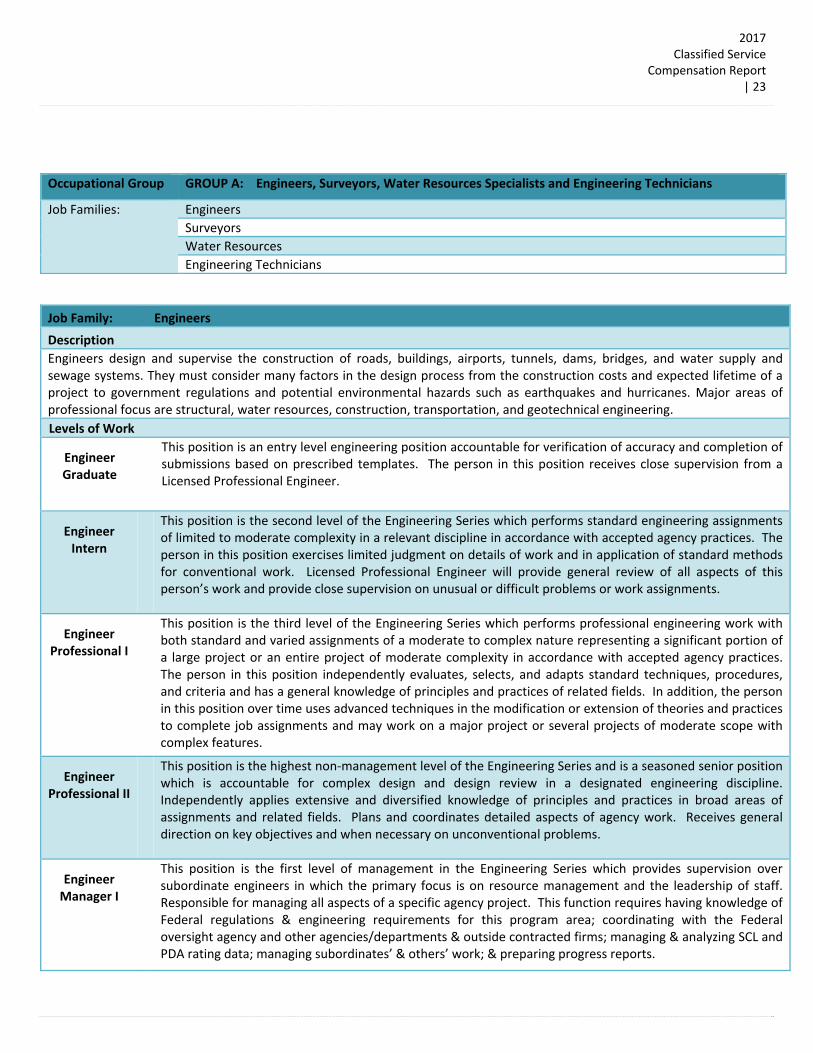
Occupational Group GROUP A: Engineers, Surveyors, Water Resources Specialists and Engineering Technicians
Job Families: Engineers
Surveyors
Water Resources
Engineering Technicians
Job Family: Engineers
Description
Engineers design and supervise the construction of roads, buildings, airports, tunnels, dams, bridges, and water supply and sewage systems. They must consider many factors in the design process from the construction costs and expected lifetime of a project to government regulations and potential environmental hazards such as earthquakes and hurricanes. Major areas of professional focus are structural, water resources, construction, transportation, and geotechnical engineering.
Levels of Work
Engineer Graduate
This position is an entry level engineering position accountable for verification of accuracy and completion of submissions based on prescribed templates. The person in this position receives close supervision from a Licensed Professional Engineer.
Engineer Intern
This position is the second level of the Engineering Series which performs standard engineering assignments of limited to moderate complexity in a relevant discipline in accordance with accepted agency practices. The person in this position exercises limited judgment on details of work and in application of standard methods for conventional work. Licensed Professional Engineer will provide general review of all aspects of this person’s work and provide close supervision on unusual or difficult problems or work assignments.
Engineer Professional I
This position is the third level of the Engineering Series which performs professional engineering work with both standard and varied assignments of a moderate to complex nature representing a significant portion of a large project or an entire project of moderate complexity in accordance with accepted agency practices. The person in this position independently evaluates, selects, and adapts standard techniques, procedures, and criteria and has a general knowledge of principles and practices of related fields. In addition, the person in this position over time uses advanced techniques in the modification or extension of theories and practices to complete job assignments and may work on a major project or several projects of moderate scope with complex features.
Engineer Professional II
This position is the highest non‐management level of the Engineering Series and is a seasoned senior position which is accountable for complex design and design review in a designated engineering discipline. Independently applies extensive and diversified knowledge of principles and practices in broad areas of assignments and related fields. Plans and coordinates detailed aspects of agency work. Receives general direction on key objectives and when necessary on unconventional problems.
Engineer Manager I
This position is the first level of management in the Engineering Series which provides supervision over subordinate engineers in which the primary focus is on resource management and the leadership of staff. Responsible for managing all aspects of a specific agency project. This function requires having knowledge of Federal regulations & engineering requirements for this program area; coordinating with the Federal oversight agency and other agencies/departments & outside contracted firms; managing & analyzing SCL and PDA rating data; managing subordinates’ & others’ work; & preparing progress reports.
2017Classified Service
Compensation Report | 24
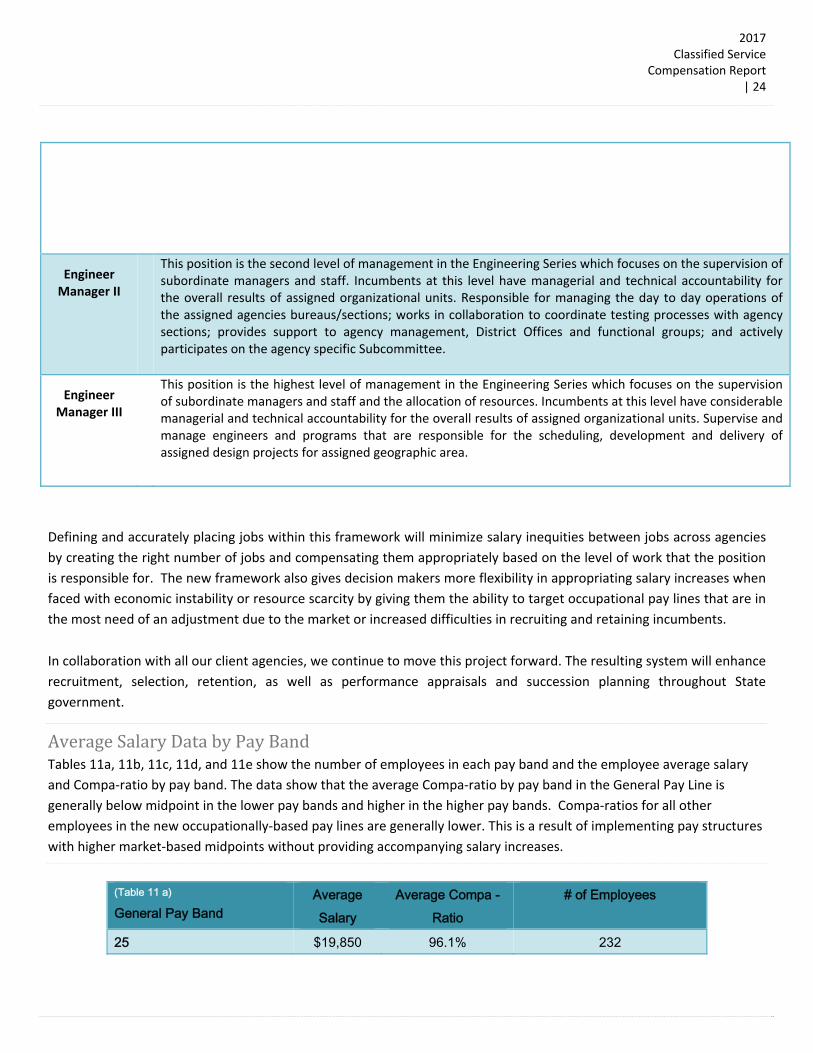
Engineer Manager II
This position is the second level of management in the Engineering Series which focuses on the supervision of subordinate managers and staff. Incumbents at this level have managerial and technical accountability for the overall results of assigned organizational units. Responsible for managing the day to day operations of the assigned agencies bureaus/sections; works in collaboration to coordinate testing processes with agency sections; provides support to agency management, District Offices and functional groups; and actively participates on the agency specific Subcommittee.
Engineer Manager III
This position is the highest level of management in the Engineering Series which focuses on the supervision of subordinate managers and staff and the allocation of resources. Incumbents at this level have considerable managerial and technical accountability for the overall results of assigned organizational units. Supervise and manage engineers and programs that are responsible for the scheduling, development and delivery of assigned design projects for assigned geographic area.
In collaboration with all our client agencies, we continue to move this project forward. The resulting system will enhance
recruitment, selection, retention, as well as performance appraisals and succession planning throughout State
government.
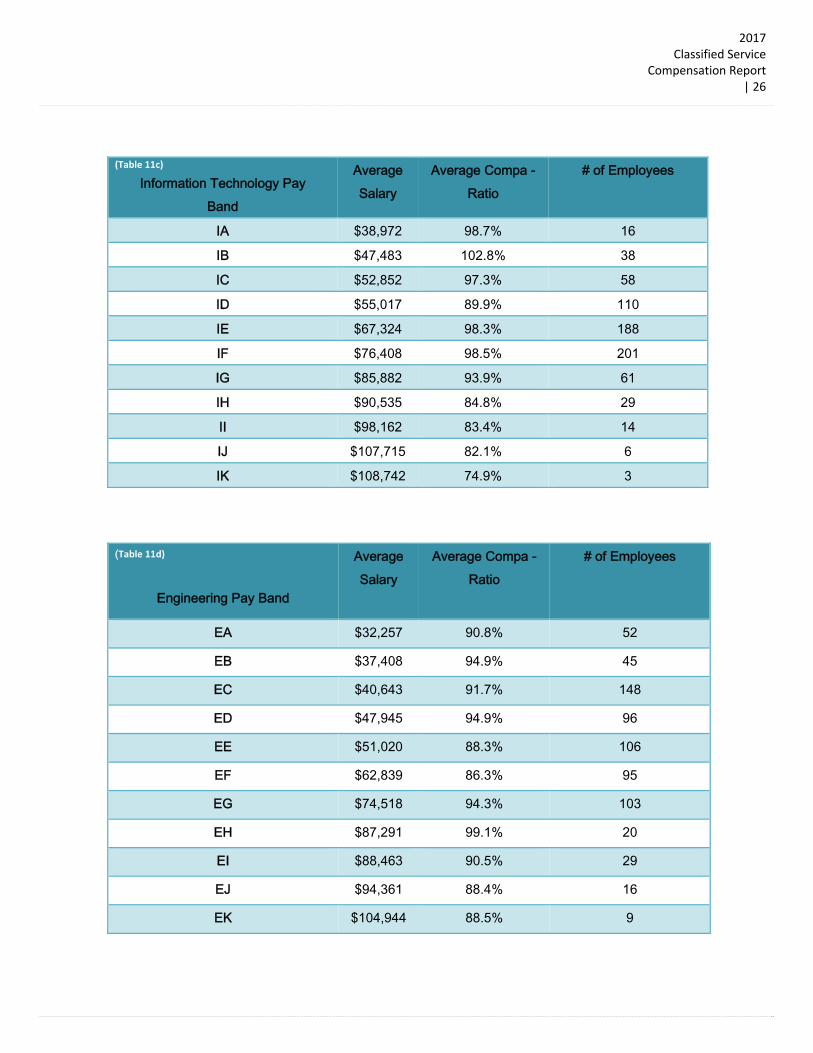
AverageSalaryDatabyPayBandTables 11a, 11b, 11c, 11d, and 11e show the number of employees in each pay band and the employee average salary
and Compa‐ratio by pay band. The data show that the average Compa‐ratio by pay band in the General Pay Line is
generally below midpoint in the lower pay bands and higher in the higher pay bands. Compa‐ratios for all other
employees in the new occupationally‐based pay lines are generally lower. This is a result of implementing pay structures
with higher market‐based midpoints without providing accompanying salary increases.
Defining and accurately placing jobs within this framework will minimize salary inequities between jobs across agencies
by creating the right number of jobs and compensating them appropriately based on the level of work that the position
is responsible for. The new framework also gives decision makers more flexibility in appropriating salary increases when
faced with economic instability or resource scarcity by giving them the ability to target occupational pay lines that are in
the most need of an adjustment due to the market or increased difficulties in recruiting and retaining incumbents.
(Table 11 a)
General Pay Band Average Salary
Average Compa - Ratio
# of Employees
25 $19,850 96.1% 232

2017Classified Service
Compensation Report | 25
30 $20,787 98.7% 362
35 $23,726 98.7% 324
40 $26,805 102.5% 882
45 $30,309 104.4% 862
50 $33,308 103.2% 1201
55 $36,426 101.0% 1521
60 $38,231 97.0% 2035
65 $45,151 103.6% 2251
70 $50,585 104.3% 1678
75 $59,146 108.6% 1174
80 $67,339 109.2% 647
85 $74,948 106.5% 543
90 $86,438 107.3% 279
95 $95,268 102.4% 61
96 $109,744 101.6% 33
97 $137,956 112.5% 11
98 $154,340 108.5% 18
99 $283,221 105.5% 23
(Table 11b)
Corrections Pay Band Average Salary
Average Compa - Ratio
# of Employees
CA
$28,558
83.3%
13
CB $35,704 84.5% 731
CC $39,532 84.7% 187
CD $43,933 86.5% 101
CE $50,532 91.7% 23
CF $ % 0
CG $63,045 99.5% 3
CH $58,228 84.1% 7
CJ $66,155 83.3% 30
CK $74,102 83.1% 15
CL $83,945 85.9% 3
CM $93,593 85.7% 2
2017Classified Service
Compensation Report | 26
(Table 11c)
Information Technology Pay Band
Average Salary
Average Compa - Ratio
# of Employees
IA $38,972 98.7% 16
IB $47,483 102.8% 38
IC $52,852 97.3% 58
ID $55,017 89.9% 110
IE $67,324 98.3% 188
IF $76,408 98.5% 201
IG $85,882 93.9% 61
IH $90,535 84.8% 29
II $98,162 83.4% 14
IJ $107,715 82.1% 6
IK $108,742 74.9% 3
(Table 11d)
Engineering Pay Band
Average Salary
Average Compa - Ratio
# of Employees
EA $32,257 90.8% 52
EB $37,408 94.9% 45
EC $40,643 91.7% 148
ED $47,945 94.9% 96
EE $51,020 88.3% 106
EF $62,839 86.3% 95
EG $74,518 94.3% 103
EH $87,291 99.1% 20
EI $88,463 90.5% 29
EJ $94,361 88.4% 16
EK $104,944 88.5% 9
2017Classified Service
Compensation Report | 27
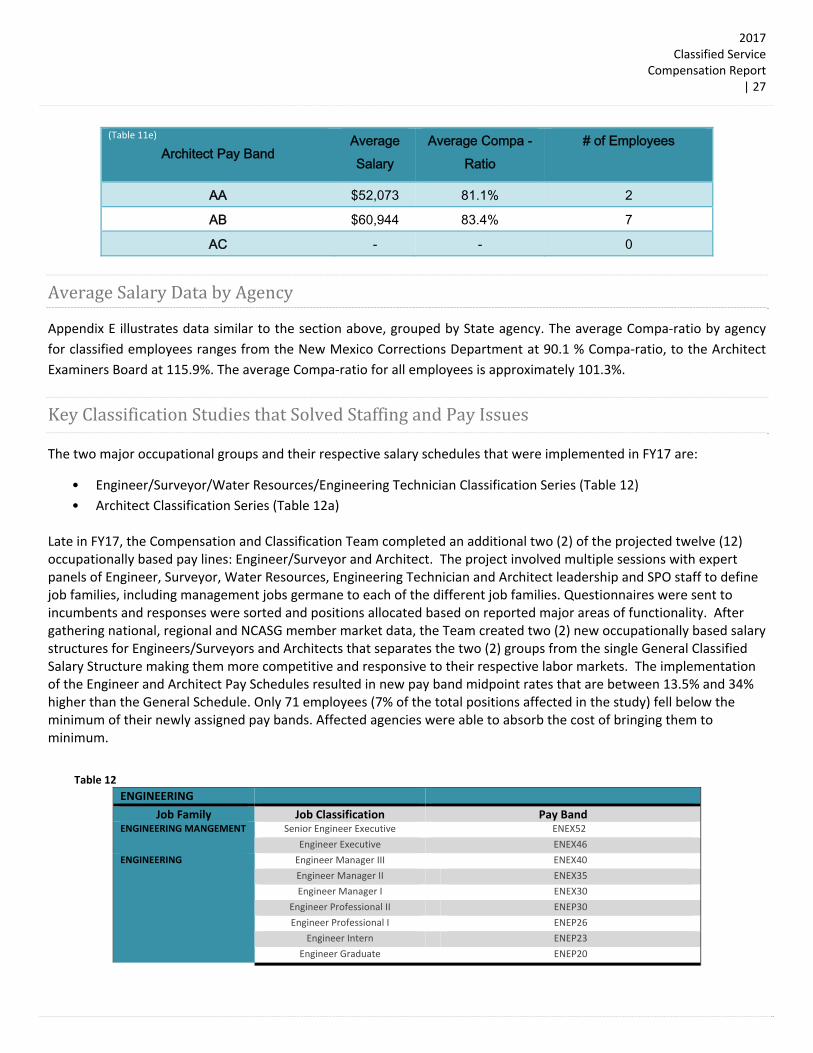
AverageSalaryDatabyAgency
Appendix E illustrates data similar to the section above, grouped by State agency. The average Compa‐ratio by agency
for classified employees ranges from the New Mexico Corrections Department at 90.1 % Compa‐ratio, to the Architect
Examiners Board at 115.9%. The average Compa‐ratio for all employees is approximately 101.3%.
KeyClassificationStudiesthatSolvedStaffingandPayIssues
The two major occupational groups and their respective salary schedules that were implemented in FY17 are:
• Engineer/Surveyor/Water Resources/Engineering Technician Classification Series (Table 12)
• Architect Classification Series (Table 12a) Late in FY17, the Compensation and Classification Team completed an additional two (2) of the projected twelve (12) occupationally based pay lines: Engineer/Surveyor and Architect. The project involved multiple sessions with expert panels of Engineer, Surveyor, Water Resources, Engineering Technician and Architect leadership and SPO staff to define job families, including management jobs germane to each of the different job families. Questionnaires were sent to incumbents and responses were sorted and positions allocated based on reported major areas of functionality. After gathering national, regional and NCASG member market data, the Team created two (2) new occupationally based salary structures for Engineers/Surveyors and Architects that separates the two (2) groups from the single General Classified Salary Structure making them more competitive and responsive to their respective labor markets. The implementation of the Engineer and Architect Pay Schedules resulted in new pay band midpoint rates that are between 13.5% and 34% higher than the General Schedule. Only 71 employees (7% of the total positions affected in the study) fell below the minimum of their newly assigned pay bands. Affected agencies were able to absorb the cost of bringing them to minimum.
Table 12
(Table 11e) Architect Pay Band
Average Salary
Average Compa - Ratio
# of Employees
AA $52,073 81.1% 2
AB $60,944 83.4% 7
AC - - 0
ENGINEERING
Job Family Job Classification Pay Band ENGINEERING MANGEMENT Senior Engineer Executive ENEX52
Engineer Executive ENEX46
ENGINEERING Engineer Manager III ENEX40
Engineer Manager II ENEX35
Engineer Manager I ENEX30
Engineer Professional II ENEP30
Engineer Professional I ENEP26
Engineer Intern ENEP23
Engineer Graduate ENEP20
2017Classified Service
Compensation Report | 28
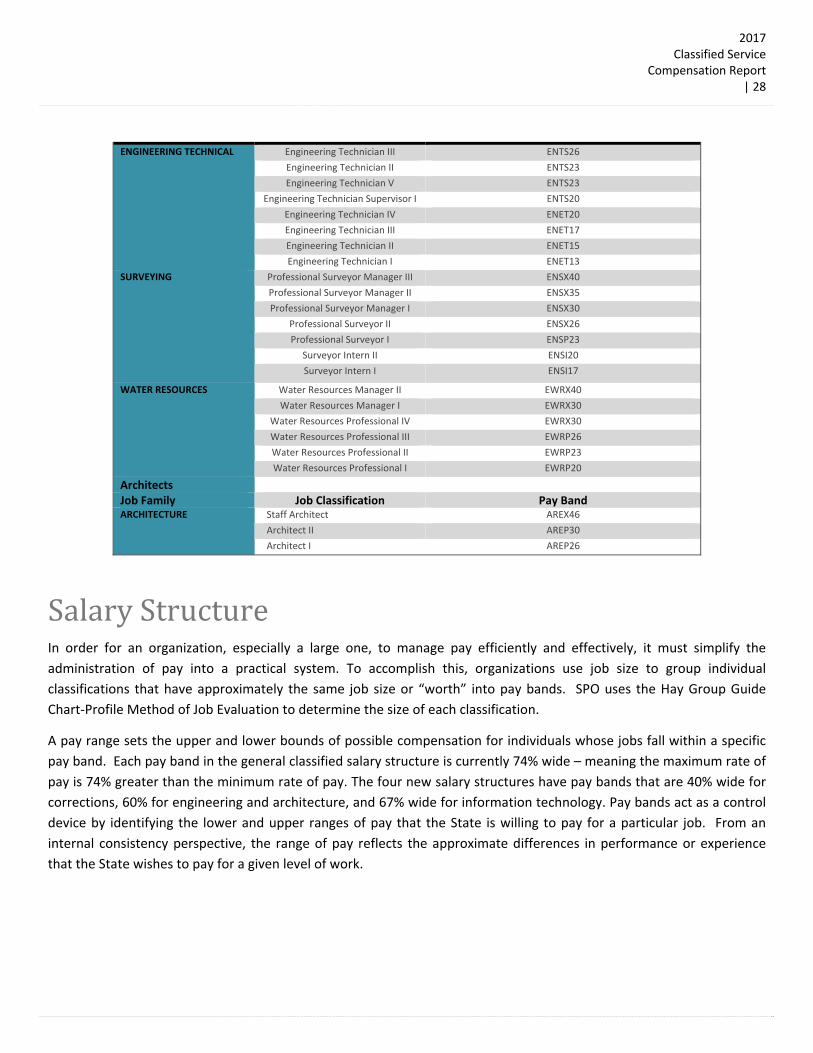
SalaryStructureIn order for an organization, especially a large one, to manage pay efficiently and effectively, it must simplify the
administration of pay into a practical system. To accomplish this, organizations use job size to group individual
classifications that have approximately the same job size or “worth” into pay bands. SPO uses the Hay Group Guide
Chart‐Profile Method of Job Evaluation to determine the size of each classification.
A pay range sets the upper and lower bounds of possible compensation for individuals whose jobs fall within a specific
pay band. Each pay band in the general classified salary structure is currently 74% wide – meaning the maximum rate of
pay is 74% greater than the minimum rate of pay. The four new salary structures have pay bands that are 40% wide for
corrections, 60% for engineering and architecture, and 67% wide for information technology. Pay bands act as a control
device by identifying the lower and upper ranges of pay that the State is willing to pay for a particular job. From an
internal consistency perspective, the range of pay reflects the approximate differences in performance or experience
that the State wishes to pay for a given level of work.
ENGINEERING TECHNICAL Engineering Technician III ENTS26
Engineering Technician II ENTS23
Engineering Technician V ENTS23
Engineering Technician Supervisor I ENTS20
Engineering Technician IV ENET20
Engineering Technician III ENET17
Engineering Technician II ENET15
Engineering Technician I ENET13
SURVEYING Professional Surveyor Manager III ENSX40
Professional Surveyor Manager II ENSX35
Professional Surveyor Manager I ENSX30
Professional Surveyor II ENSX26
Professional Surveyor I ENSP23
Surveyor Intern II ENSI20
Surveyor Intern I ENSI17
WATER RESOURCES Water Resources Manager II EWRX40
Water Resources Manager I EWRX30
Water Resources Professional IV EWRX30
Water Resources Professional III EWRP26
Water Resources Professional II EWRP23
Water Resources Professional I EWRP20
Architects Job Family Job Classification Pay Band ARCHITECTURE Staff Architect AREX46
Architect II AREP30
Architect I AREP26

2017Classified Service
Compensation Report | 29
RegressionAnalysisRegression analysis is a statistical tool that is used in compensation administration to document salary movement
and generate pay lines. For New Mexico, the linear regression line that connects the 19 midpoint values of each
pay band is described as the “policy” line. The policy line defines what the State is able to pay in order to remain
competitive.
Two other linear regression lines commonly used in compensation analysis are the “market” line and the “practice”
line. The market line is developed using the average pay rates for each relevant comparator market job. The
practice line represents the average pay of classified employees using actual pay rates. In sum:
• Policy Line = New Mexico Classified Service Midpoints of Current Salary Structure;
• Market Line = Average of comparator Market Pay Rates; and,
• Practice Line = New Mexico Average of Classified Employee Actual Pay Rates.
Using regression analysis in 2001, SPO implemented a salary structure that was set at 95% of the eight‐state
Comparator market. Use of regression analysis continues through FY17 for all New Mexico salary structures, now
including separate pay structures for Corrections, Engineering, Architecture and Information Technology.
Salary structures must accurately reflect the salary market for many reasons, including recruitment, retention,
employee motivation, performance management, employee engagement, and appropriate valuation of job and
budget management. An improperly maintained salary structure contributes to staffing problems for the State. For
example, in the recruitment area, qualified applicants may not apply for State positions due to low starting pay
or low salary ceiling thresholds. Existing highly qualified state employees may see the lack of salary structure
movement and lack of wage growth opportunity as a reason to seek employment outside of the State, causing a
talent drain.
74%GeneralClassifiedBandWidth
67%InformationTechnologyBandWidth
40%CorrectionsBandWidth
60%EngineeringBandWidth
60%ArchitectureBandWidth

2017Classified Service
Compensation Report | 30
Graph 8 illustrates the annual salary structure adjustment relative to the national WorldatWork industry indicator.
Since 2003, SPO data indicate that the State’s structure has increased 11.2%, while WorldatWork reports
participating organizations adjusted their structures by over 32.7%. The four (4) new salary structures are not
reflected in this graph, which is based on the general salary structure. This will require a change to how SPO reports
structure adjustment figures in the future.
SPO will continue this project to reengineer the compensation and classification structures for all of the State’s
classifications, but this will take time to completely study, define and implement the remaining structures. When
complete, this new system will provide unique salary structures that will allow the State and policy makers to
better respond to changing market conditions in individual occupational groups, without having to redesign a
single salary structure that affects every State job. The resulting system will allow New Mexico to become more
responsive, strategic, and competitive in its compensation practices. Graph 8
0.0%
0.5%
1.0%
1.5%
2.0%
2.5%
3.0%
3.5%
2003 2004 2005 2006 2007 2008 2009 2010 2011 2012 2013 2014 2015 2016 2017
Structure Adustment History
WorldatWork
NM Actual
2017Classified Service
Compensation Report | 31
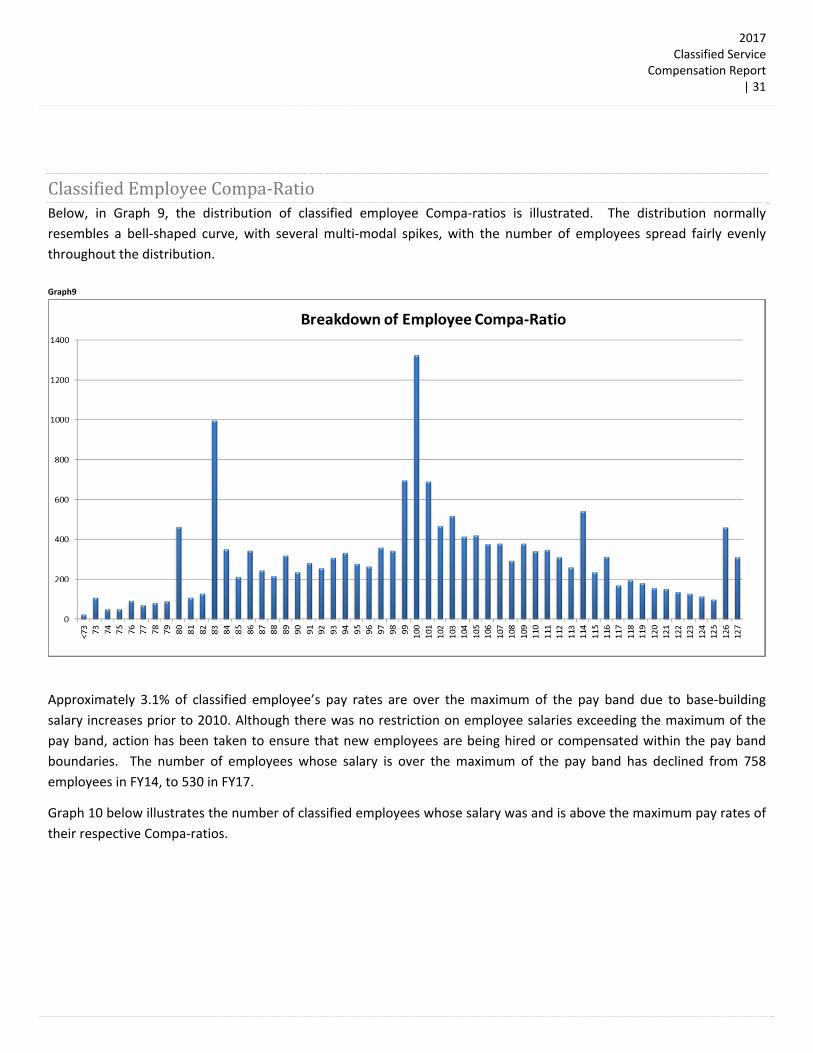
ClassifiedEmployeeCompa‐RatioBelow, in Graph 9, the distribution of classified employee Compa‐ratios is illustrated. The distribution normally
resembles a bell‐shaped curve, with several multi‐modal spikes, with the number of employees spread fairly evenly
throughout the distribution.
Graph9
Approximately 3.1% of classified employee’s pay rates are over the maximum of the pay band due to base‐building
salary increases prior to 2010. Although there was no restriction on employee salaries exceeding the maximum of the
pay band, action has been taken to ensure that new employees are being hired or compensated within the pay band
boundaries. The number of employees whose salary is over the maximum of the pay band has declined from 758
employees in FY14, to 530 in FY17.
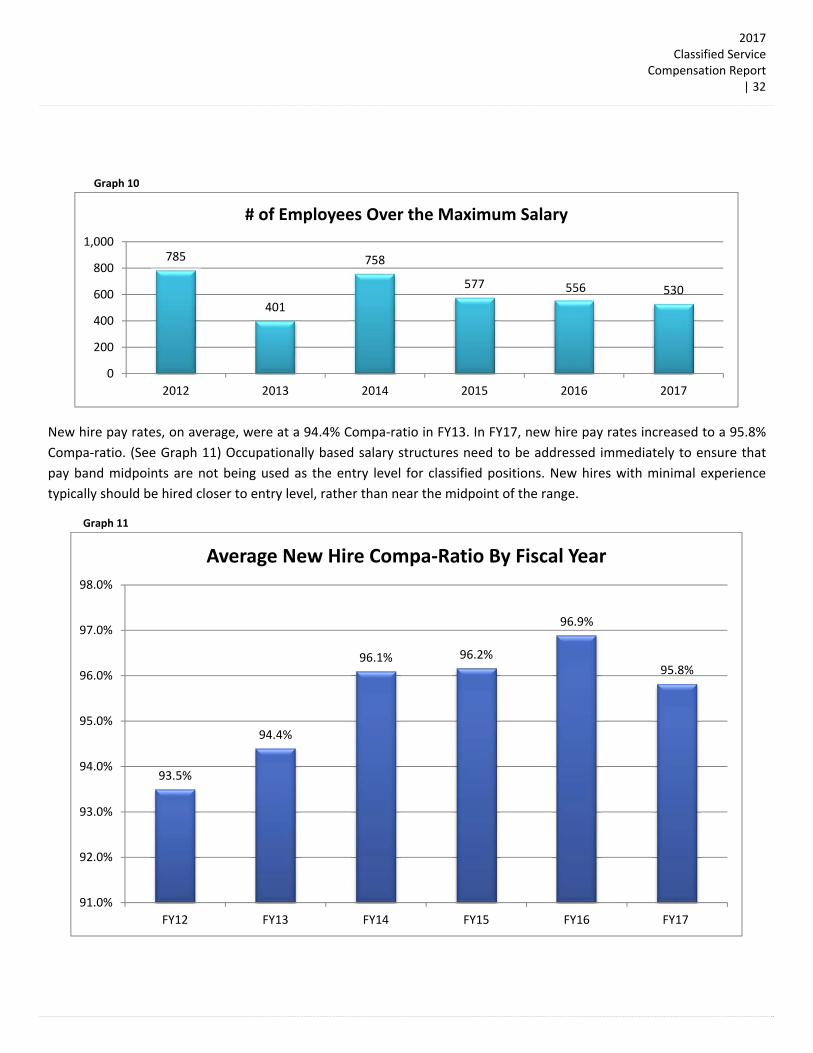
Graph 10 below illustrates the number of classified employees whose salary was and is above the maximum pay rates of
their respective Compa‐ratios.
2017Classified Service
Compensation Report | 32
Graph 10
New hire pay rates, on average, were at a 94.4% Compa‐ratio in FY13. In FY17, new hire pay rates increased to a 95.8%
Compa‐ratio. (See Graph 11) Occupationally based salary structures need to be addressed immediately to ensure that
pay band midpoints are not being used as the entry level for classified positions. New hires with minimal experience
typically should be hired closer to entry level, rather than near the midpoint of the range.
Graph 11
785
401
758
577 556 530
0
200
400
600
800
1,000
2012 2013 2014 2015 2016 2017
# of Employees Over the Maximum Salary
93.5%
94.4%
96.1% 96.2%
96.9%
95.8%
91.0%
92.0%
93.0%
94.0%
95.0%
96.0%
97.0%
98.0%
FY12 FY13 FY14 FY15 FY16 FY17
Average New Hire Compa‐Ratio By Fiscal Year

2017Classified Service
Compensation Report | 33
Graph 12 Graph 13
AlternativePayBands(APB)
An APB assignment is used when the current market rate for a classification significantly exceeds the pay band assigned
through the job evaluation process. APB assignments are typically utilized due to external market pressures, such as the
low supply and high demand of labor (labor shortage). When a qualified labor shortage exists, organizations compete
with one other to attract and retain qualified employees. Since the internal value (size of job identified through job
evaluation) has not changed, there are no new higher qualifications or more complex duties and responsibilities, so it
does not make sense to permanently assign the classification to a different pay band. The solution is to “temporarily”
assign the classification to a higher pay band for a limited time until either the market pressures recede, or the actual
employee pay catches up to the market rate, and the APB assignment is no longer needed. The implementation of
occupationally based salary structures will allow the State to reduce, if not eliminate, the need for APBs in critical
occupations.
While APB assignments were intended to be used on a limited basis, it had become the norm, with 32% of job
classifications using them in 2015. With the implementation of the four occupational base salary structures in 2016 and
2017, only 23.8% of job classifications have APBs. The new pay lines under development are intended to eliminate APBs
entirely, once implemented. A complete list of all job classifications assigned to APBs can be found in Appendix F.
PayAdministrationPayMechanisms
The SPB Rules provide pay mechanisms to enhance recruitment and retention efforts, by providing agencies with the
tools to attract and retain a qualified workforce. The various pay mechanisms are explained and listed below:
817
608737
498582
704617
525
0
200
400
600
800
1,000
Q1 Q2 Q3 Q4
New Hires By Quarter Fiscal Year Comparison
FY16 FY17
NOTE: Hires represent only new hires and do not include
97% 97% 97% 96%96% 97% 97% 94%
0%
20%
40%
60%
80%
100%
120%
Q1 Q2 Q3 Q4
New Hire Compa‐Ratio
FY16 FY17
2017Classified Service
Compensation Report | 34
Temporary Recruitment Differentials (TREC’s) are authorized for positions documented as being critical to the
business needs of an agency, and addressing problems for those agencies who have demonstrated recruitment
difficulty.
Temporary Retention Differentials (TRET’s) are authorized for positions that have a critical need to retain an
employee, and to maintain the business needs of an agency that would otherwise be disrupted if the employee
left the position.
Temporary Salary Increases (TSI’s) are used when an employee temporarily accepts and consistently performs
additional duties that are the characteristics of a job requiring greater responsibility and accountability, making
it a higher valued job. A TSI is a short‐term salary measure that may be used until the conditions of the
additional duties and responsibilities cease to exist, and may not be extended beyond a one‐year period.
In‐Pay Band Salary Adjustments (IPB’s) provide agencies the latitude to make recommendations to the State
Personnel Director for a base compensation increase up to ten percent (10%) within a fiscal year to employees
whose performance has demonstrated placement at a higher Compa‐ratio. This pay mechanism allows flexibility
for agencies to provide salary growth within the pay band. DFA reviews the requests to ensure current and
future agency budget availability.
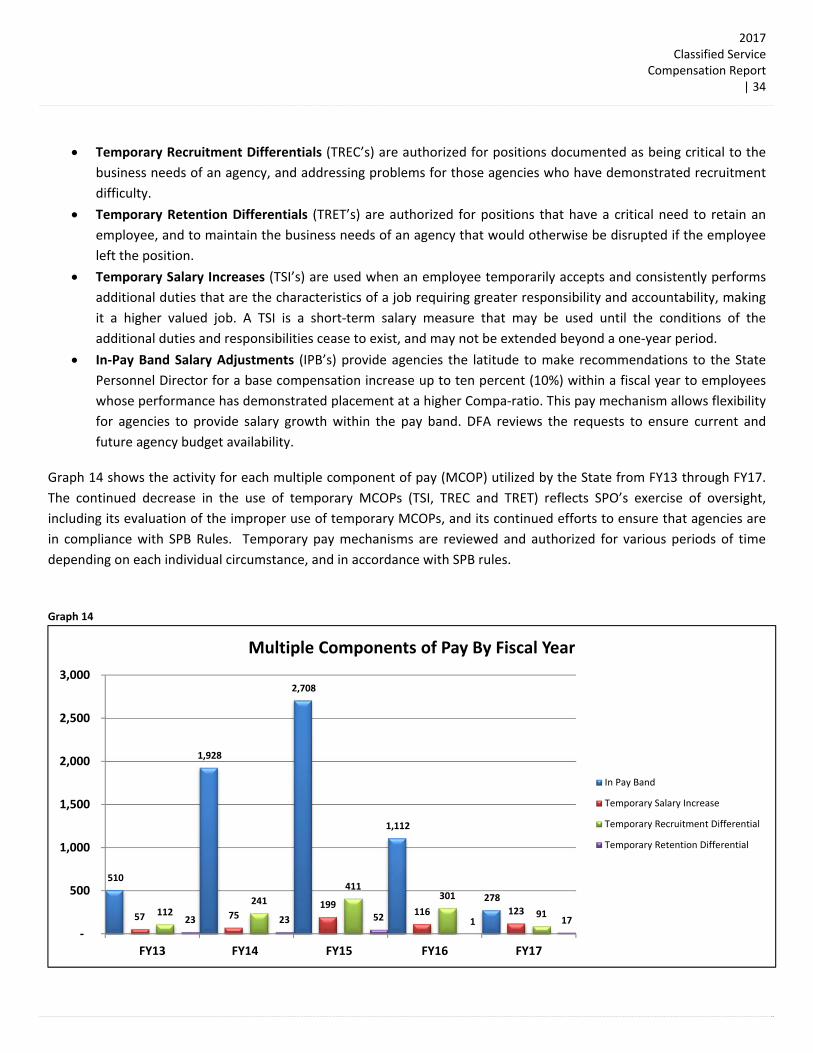
Graph 14 shows the activity for each multiple component of pay (MCOP) utilized by the State from FY13 through FY17.
The continued decrease in the use of temporary MCOPs (TSI, TREC and TRET) reflects SPO’s exercise of oversight,
including its evaluation of the improper use of temporary MCOPs, and its continued efforts to ensure that agencies are
in compliance with SPB Rules. Temporary pay mechanisms are reviewed and authorized for various periods of time
depending on each individual circumstance, and in accordance with SPB rules.
Graph 14
510
1,928
2,708
1,112
278
57 75199
116 123112241
411301
9123 23 52 1 17
‐
500
1,000
1,500
2,000
2,500
3,000
FY13 FY14 FY15 FY16 FY17
Multiple Components of Pay By Fiscal Year
In Pay Band
Temporary Salary Increase
Temporary Recruitment Differential
Temporary Retention Differential
2017Classified Service
Compensation Report | 35
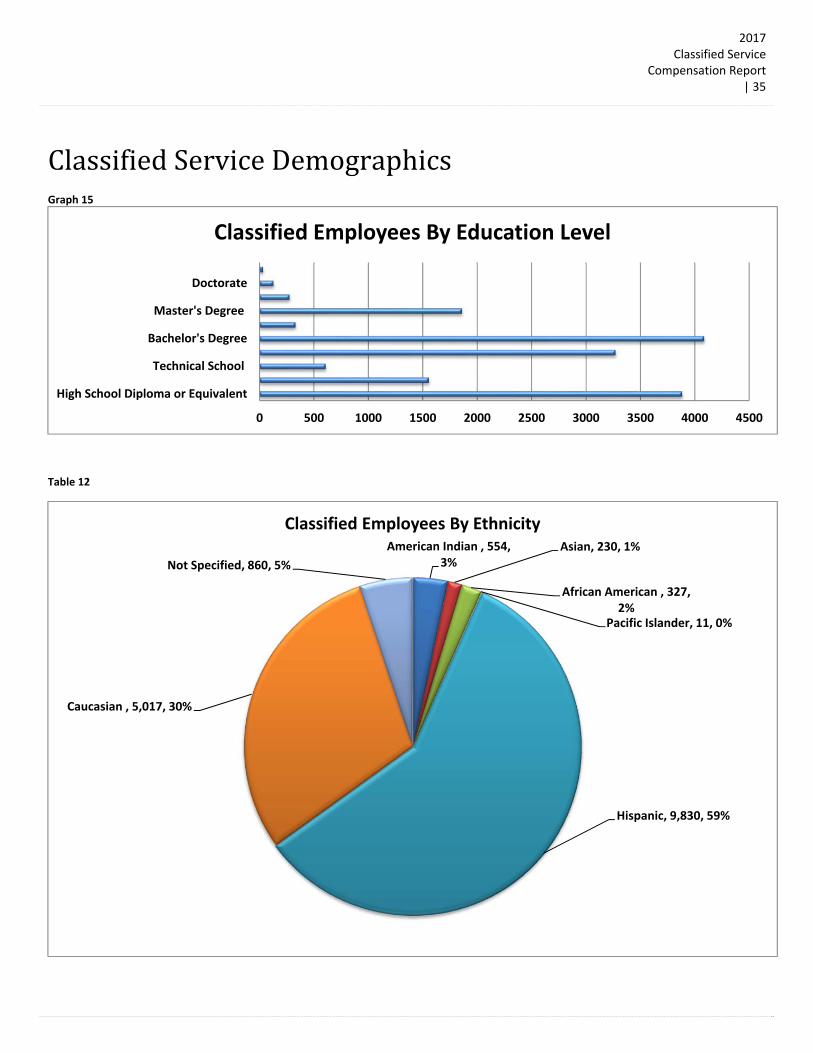
ClassifiedServiceDemographicsGraph 15
Table 12
0 500 1000 1500 2000 2500 3000 3500 4000 4500
High School Diploma or Equivalent
Technical School
Bachelor's Degree
Master's Degree
Doctorate
Classified Employees By Education Level
American Indian , 554, 3%
Asian, 230, 1%
African American , 327, 2%
Pacific Islander, 11, 0%
Hispanic, 9,830, 59%
Caucasian , 5,017, 30%
Not Specified, 860, 5%
Classified Employees By Ethnicity
2017Classified Service
Compensation Report | 36
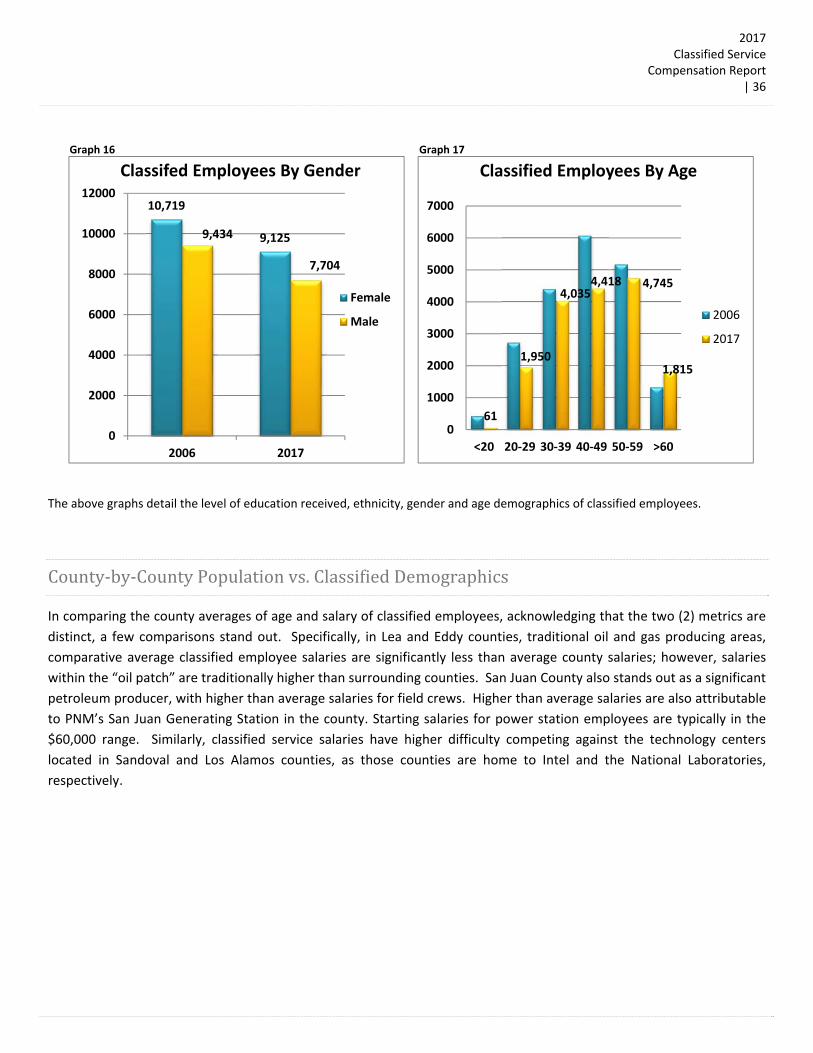
Graph 16 Graph 17
The above graphs detail the level of education received, ethnicity, gender and age demographics of classified employees.
County‐by‐CountyPopulationvs.ClassifiedDemographics
In comparing the county averages of age and salary of classified employees, acknowledging that the two (2) metrics are
distinct, a few comparisons stand out. Specifically, in Lea and Eddy counties, traditional oil and gas producing areas,
comparative average classified employee salaries are significantly less than average county salaries; however, salaries
within the “oil patch” are traditionally higher than surrounding counties. San Juan County also stands out as a significant
petroleum producer, with higher than average salaries for field crews. Higher than average salaries are also attributable
to PNM’s San Juan Generating Station in the county. Starting salaries for power station employees are typically in the
$60,000 range. Similarly, classified service salaries have higher difficulty competing against the technology centers
located in Sandoval and Los Alamos counties, as those counties are home to Intel and the National Laboratories,
respectively.
10,719
9,1259,434
7,704
0
2000
4000
6000
8000
10000
12000
2006 2017
Classifed Employees By Gender
Female
Male
61
1,950
4,0354,418 4,745
1,815
0
1000
2000
3000
4000
5000
6000
7000
<20 20‐29 30‐39 40‐49 50‐59 >60
Classified Employees By Age
2006
2017
2017Classified Service
Compensation Report | 37
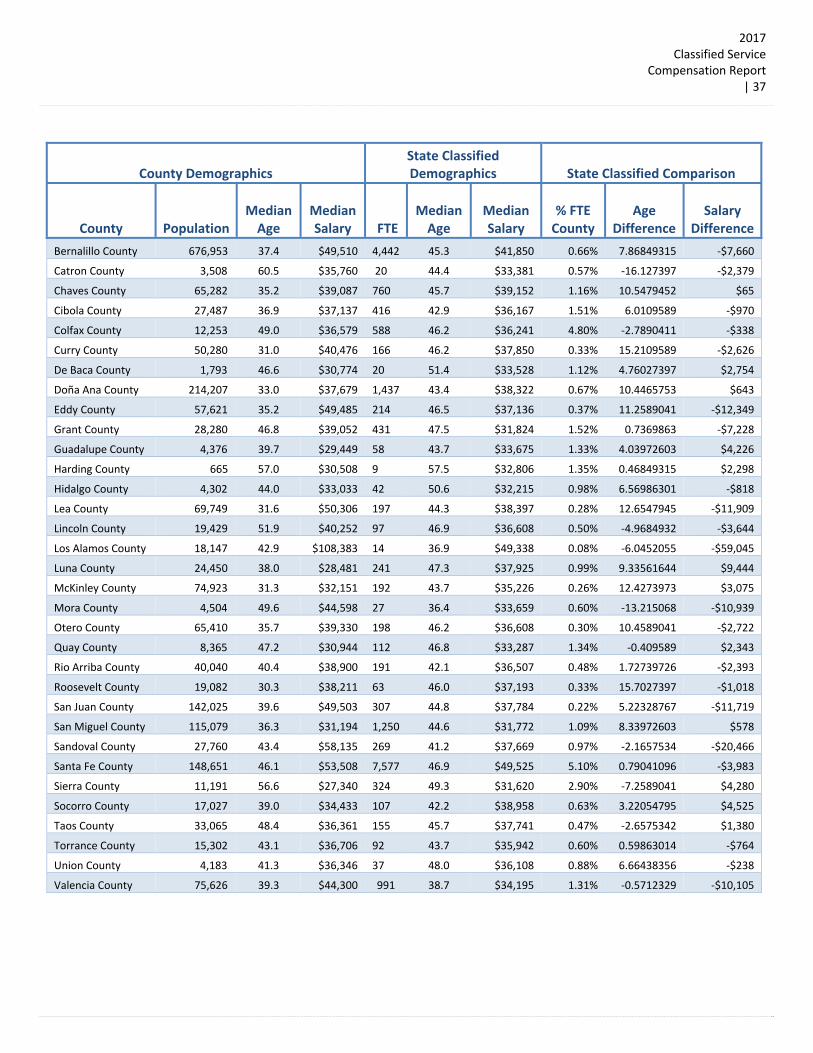
County Demographics State Classified Demographics State Classified Comparison
County
Population Median Age
Median Salary FTE
Median Age
Median Salary
% FTE County
Age Difference
Salary Difference
Bernalillo County 676,953 37.4 $49,510 4,442 45.3 $41,850 0.66% 7.86849315 ‐$7,660
Catron County 3,508 60.5 $35,760 20 44.4 $33,381 0.57% ‐16.127397 ‐$2,379
Chaves County 65,282 35.2 $39,087 760 45.7 $39,152 1.16% 10.5479452 $65
Cibola County 27,487 36.9 $37,137 416 42.9 $36,167 1.51% 6.0109589 ‐$970
Colfax County 12,253 49.0 $36,579 588 46.2 $36,241 4.80% ‐2.7890411 ‐$338
Curry County 50,280 31.0 $40,476 166 46.2 $37,850 0.33% 15.2109589 ‐$2,626
De Baca County 1,793 46.6 $30,774 20 51.4 $33,528 1.12% 4.76027397 $2,754
Doña Ana County 214,207 33.0 $37,679 1,437 43.4 $38,322 0.67% 10.4465753 $643
Eddy County 57,621 35.2 $49,485 214 46.5 $37,136 0.37% 11.2589041 ‐$12,349
Grant County 28,280 46.8 $39,052 431 47.5 $31,824 1.52% 0.7369863 ‐$7,228
Guadalupe County 4,376 39.7 $29,449 58 43.7 $33,675 1.33% 4.03972603 $4,226
Harding County 665 57.0 $30,508 9 57.5 $32,806 1.35% 0.46849315 $2,298
Hidalgo County 4,302 44.0 $33,033 42 50.6 $32,215 0.98% 6.56986301 ‐$818
Lea County 69,749 31.6 $50,306 197 44.3 $38,397 0.28% 12.6547945 ‐$11,909
Lincoln County 19,429 51.9 $40,252 97 46.9 $36,608 0.50% ‐4.9684932 ‐$3,644
Los Alamos County 18,147 42.9 $108,383 14 36.9 $49,338 0.08% ‐6.0452055 ‐$59,045
Luna County 24,450 38.0 $28,481 241 47.3 $37,925 0.99% 9.33561644 $9,444
McKinley County 74,923 31.3 $32,151 192 43.7 $35,226 0.26% 12.4273973 $3,075
Mora County 4,504 49.6 $44,598 27 36.4 $33,659 0.60% ‐13.215068 ‐$10,939
Otero County 65,410 35.7 $39,330 198 46.2 $36,608 0.30% 10.4589041 ‐$2,722
Quay County 8,365 47.2 $30,944 112 46.8 $33,287 1.34% ‐0.409589 $2,343
Rio Arriba County 40,040 40.4 $38,900 191 42.1 $36,507 0.48% 1.72739726 ‐$2,393
Roosevelt County 19,082 30.3 $38,211 63 46.0 $37,193 0.33% 15.7027397 ‐$1,018
San Juan County 142,025 39.6 $49,503 307 44.8 $37,784 0.22% 5.22328767 ‐$11,719
San Miguel County 115,079 36.3 $31,194 1,250 44.6 $31,772 1.09% 8.33972603 $578
Sandoval County 27,760 43.4 $58,135 269 41.2 $37,669 0.97% ‐2.1657534 ‐$20,466
Santa Fe County 148,651 46.1 $53,508 7,577 46.9 $49,525 5.10% 0.79041096 ‐$3,983
Sierra County 11,191 56.6 $27,340 324 49.3 $31,620 2.90% ‐7.2589041 $4,280
Socorro County 17,027 39.0 $34,433 107 42.2 $38,958 0.63% 3.22054795 $4,525
Taos County 33,065 48.4 $36,361 155 45.7 $37,741 0.47% ‐2.6575342 $1,380
Torrance County 15,302 43.1 $36,706 92 43.7 $35,942 0.60% 0.59863014 ‐$764
Union County 4,183 41.3 $36,346 37 48.0 $36,108 0.88% 6.66438356 ‐$238
Valencia County 75,626 39.3 $44,300 991 38.7 $34,195 1.31% ‐0.5712329 ‐$10,105
2017Classified Service
Compensation Report | 38
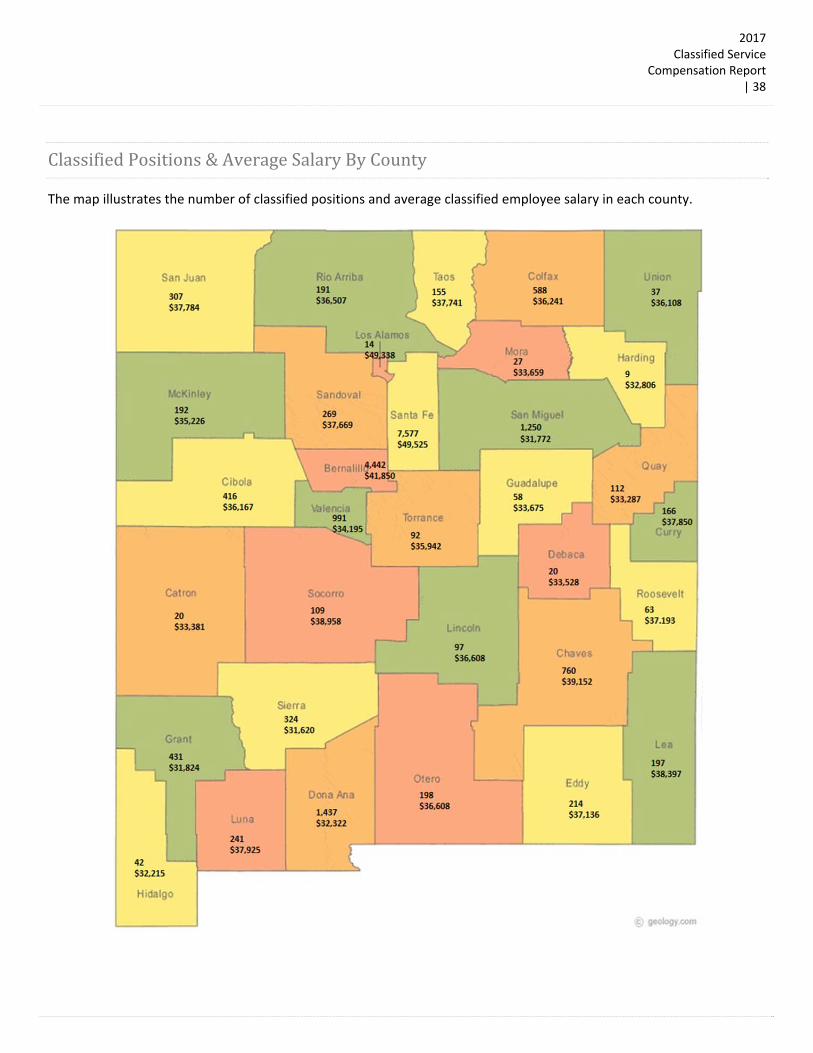
ClassifiedPositions&AverageSalaryByCounty
The map illustrates the number of classified positions and average classified employee salary in each county.

2017Classified Service
Compensation Report | 39
Classification The New Mexico State Classification system classifies jobs and the work being performed into occupational categories, in order to enable management to identify and group work functions in alignment with the mission of the agency. The current classification system was transformed in 2001 by the SPB adopting the Standard Occupational Classifications (SOC) system that was introduced by the Federal Office of Personnel Management (OPM) that same year. Currently, SPO is working to restructure the classification system to better identify and align job families into common occupational categories. The two (2) occupational groups created in FY16 were Corrections and Information Technology. Additionally, two (2) more were developed in FY17: Engineer/Surveyor/Water Resources and the Architect occupational groups were created each with their separate salary structures. Placing jobs into similar pay categories with unused or under‐utilized classifications are then deleted. Consequently, any misclassified jobs will be addressed. All state workers are classified into one of 1,011 detailed non‐manager occupational roles, or 161 manager classifications, according to the agency’s documented utilization of that job.
ClassificationStudies
The Classified Service is an occupationally based classification system with the majority of non‐manager titles delineated
into three levels or roles: Basic, Operational, and Advanced. When there is pay compaction, most, if not all, of the
employees wind up at the higher end of the classification series, and roles or levels go unused. The appropriate number
of levels should be determined by detailed analysis that captures actual utilization and job size. Recent classification
studies have yielded a variable number of roles or levels for a number of classifications. When SPO identifies unused or
unnecessary classifications within the Classified System, those classifications are recommended for deletion.
Classification Studies Completed FY17
Special Agent Series Aircraft Pilot
State Investigator Series New Mexico Youth ChalleNGe Academy Cadre Supervisor
DPS Investigator Series Engineer/Surveyor/Water Resource/Engineer Tech Series
CID Criminal Investigator Series Architects Series
Plumber Series Family Assistance Analyst Supervisor
New Mexico Youth ChalleNGe Academy Cadre Medical Assistant
WorkPlan
SPO has been working to restructure the classification and compensation system to better reflect the common
occupational groupings and job families utilized in the classified service, in an effort to create separate occupationally
based pay lines. These proposed 12 separate pay lines or salary structures will enable the state to better compete with
the external comparator labor market by targeting the salary structure adjustments of individual occupational groups,
instead of trying to raise the pay band midpoints of all 1,172 classifications in the state. Each occupationally based pay
line will move independently when adjusted, making each line more responsive to the market should monies become
available to fund one or more adjustments.

2017Classified Service
Compensation Report | 40
Table 13
Proposed Classifications for Review # Positions Proposed Classifications for Review # Positions
Healthcare and Healthcare Support 1,353 Museum Study 226
Attorney Series 174 Rehabilitation Counselors 86
Paralegals, Legal Assistants, Law Clerks 74 Generic Manager Classifications 1,723
Total: 3,636
Supervisors
Prior to April 2012, SPO did not classify the function or title of Supervisor. Instead, employees that were assigned
supervisory duties were compensated through an additional Supervisory Pay Allowance that was added onto the
employee’s salary. At the time, the SPB rules allowed for an allowance of up to 20%; however, the methods used to
determine how large the allowance would be varied from agency‐to‐agency. In some agencies, there was a flat
percentage, and others made the determination by the number of employees supervised. The intent was that if
management determined that an employee receiving the differential was not performing the leadership role
adequately, the pay was to be taken away. Another suitable employee could then be assigned the duties and provided
the additional pay differential; thus, eliminating the need to go through a costly and time consuming reclassification of
the position and employee.
Since April 2012, SPO has implemented 175 new supervisory classifications. All agencies where supervisory positions
were identified have transitioned those positions into the new titles. The compensation mechanism known as
Supervisory Pay Allowance is not a permanent part of the employee’s base salary, has now become part of the
employee’s base pay. This consolidation of pay allows for a more solid organizational structure that clearly identifies
supervisors from non‐supervisory employees. Additionally, when an employee accepts a transfer or promotion into or
out of a supervisor classification, there is no confusion regarding what the employee’s base salary will be, or what the
responsibilities will be.
ManagersThere are eight (8) core manager job categories, each distinguished in size by four (4) compensable measures:
Scope and Complexity of Responsibility;
Types of Employees Managed;
Financial Accountability; and,
Strategic Planning/Decision Challenge.
Formerly, manager classifications were developed in the same format as the non‐manager classifications, except that they were developed from a lengthy three year class study that analyzed all manager positions across levels and agencies. It was eventually determined that there were eight (8) distinct sized manager jobs:
Line I
Line II

2017Classified Service
Compensation Report | 41
Staff
Administrative Operations I
Administrative Operations II
General I
General II
Executive
Initially, 14 occupation specific areas of specialization (Table 14) were identified for market pricing purposes:
Table 14
Dental Economics
Engineering EnvironmentalScienceForensic Science HospitalAdministration
Information Technology Nutrition/Dietitian
Occupational/Physical/Speech‐Language Pharmacy
Psychiatry Nursing
Physician Motor Transportation /Special Investigations
Currently, there is a solid distinction between the “size” and a correct number of manager levels that cover the full
range of management in the classified service; but many times it is difficult to know what work is actually being
performed by specific managers based on the generic titles. For example, the generic title of Administrative Operations
Manager II may contain an agency’s general counsel, chief economist, chief financial officer, county office manager,
human resource manager, special projects coordinator, program manager or bureau chiefs over many different
functions – all with very different job specific duties, responsibilities, and minimum qualifications.
Beginning in April 2012, SPO introduced and implemented classification specific manager job descriptions that detail the
purpose and areas of responsibility with occupational specific titles, and job specific education and experience
requirements. The project, with participation by state agency management, is on‐going with the final target of
classifying approximately 273 generic manager (FTE) positions. As of FY17, ending June 30, 2017, there are currently 161
manager titles in use, with more coming online every quarter.
Although many classification studies have been completed, many more still require attention through FY18. SPO’s
current classification structure project will determine how the following classifications will be addressed.
Misclassification&ClassificationCreep
Job misclassification and classification creep often occur when wages do not keep pace with the Comparative market,
resulting in employees being “artificially” promoted or reclassified into a pay band with higher pay opportunities. Such
artificial promotion creates several administrative difficulties, including putting the employee at risk of having to deliver
on expectations that they are unqualified to perform. While many employees perform well when taking direction, they
may be ineffective at assigning work, evaluating, or disciplining coworkers. Also, managers can experience pay
Compaction issues when subordinates are all at the top end of the pay range, with no room for rewarding exceptional
job performance. Misclassification creates financial costs, as well. According to estimates by the Hay Group, if 15% of
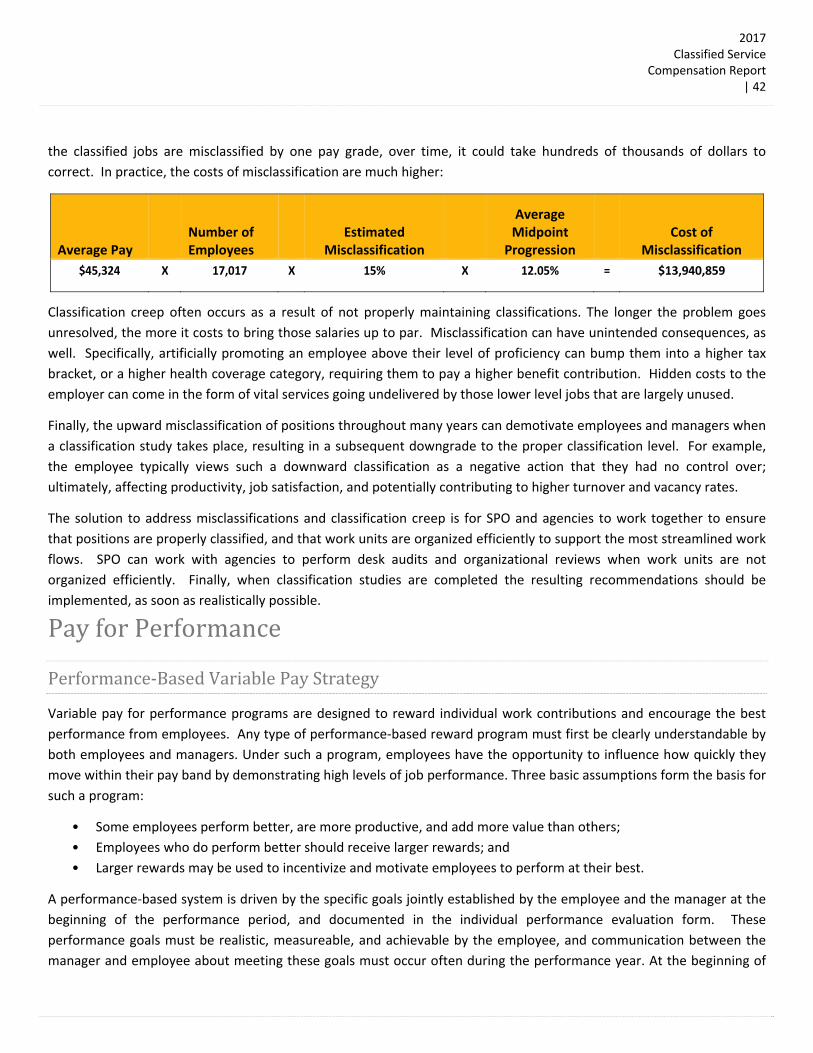
2017Classified Service
Compensation Report | 42
the classified jobs are misclassified by one pay grade, over time, it could take hundreds of thousands of dollars to
correct. In practice, the costs of misclassification are much higher:
Average Pay Number of Employees
Estimated Misclassification
Average Midpoint
Progression Cost of
Misclassification
$45,324 X 17,017 X 15% X 12.05% = $13,940,859
Classification creep often occurs as a result of not properly maintaining classifications. The longer the problem goes
unresolved, the more it costs to bring those salaries up to par. Misclassification can have unintended consequences, as
well. Specifically, artificially promoting an employee above their level of proficiency can bump them into a higher tax
bracket, or a higher health coverage category, requiring them to pay a higher benefit contribution. Hidden costs to the
employer can come in the form of vital services going undelivered by those lower level jobs that are largely unused.
Finally, the upward misclassification of positions throughout many years can demotivate employees and managers when
a classification study takes place, resulting in a subsequent downgrade to the proper classification level. For example,
the employee typically views such a downward classification as a negative action that they had no control over;
ultimately, affecting productivity, job satisfaction, and potentially contributing to higher turnover and vacancy rates.
The solution to address misclassifications and classification creep is for SPO and agencies to work together to ensure
that positions are properly classified, and that work units are organized efficiently to support the most streamlined work
flows. SPO can work with agencies to perform desk audits and organizational reviews when work units are not
organized efficiently. Finally, when classification studies are completed the resulting recommendations should be
implemented, as soon as realistically possible.
PayforPerformance
Performance‐BasedVariablePayStrategy
Variable pay for performance programs are designed to reward individual work contributions and encourage the best
performance from employees. Any type of performance‐based reward program must first be clearly understandable by
both employees and managers. Under such a program, employees have the opportunity to influence how quickly they
move within their pay band by demonstrating high levels of job performance. Three basic assumptions form the basis for
such a program:
• Some employees perform better, are more productive, and add more value than others;
• Employees who do perform better should receive larger rewards; and
• Larger rewards may be used to incentivize and motivate employees to perform at their best.
A performance‐based system is driven by the specific goals jointly established by the employee and the manager at the
beginning of the performance period, and documented in the individual performance evaluation form. These
performance goals must be realistic, measureable, and achievable by the employee, and communication between the
manager and employee about meeting these goals must occur often during the performance year. At the beginning of
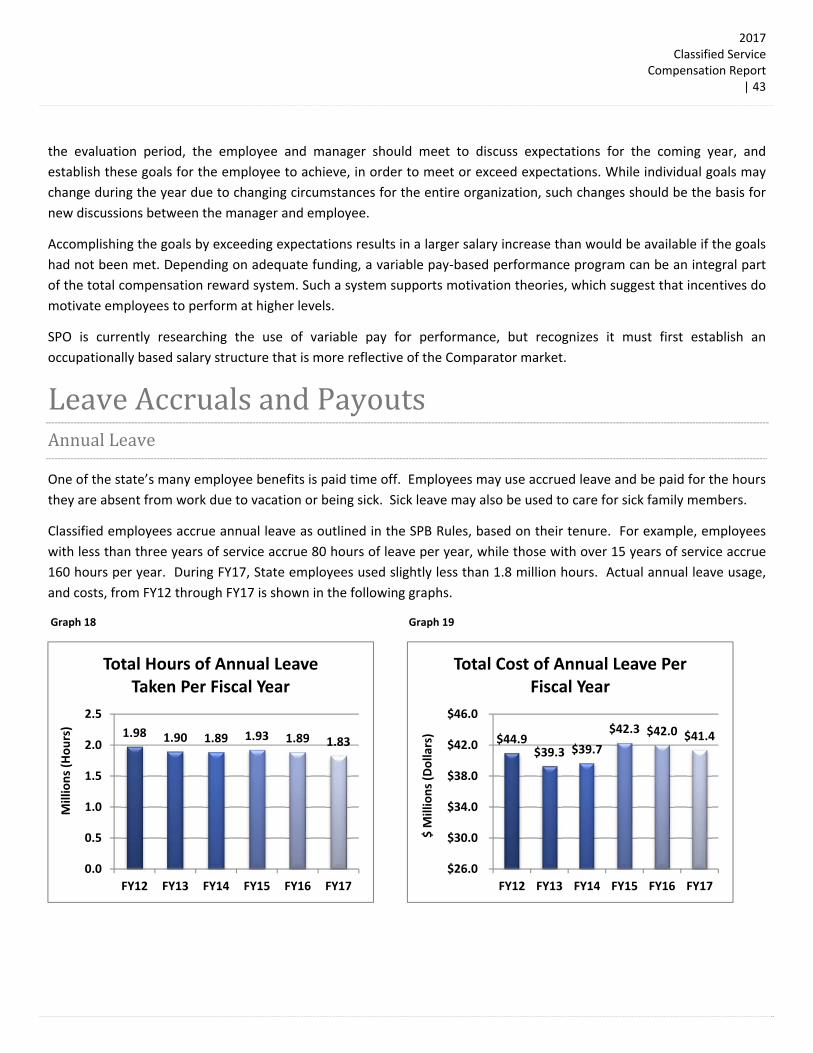
2017Classified Service
Compensation Report | 43
the evaluation period, the employee and manager should meet to discuss expectations for the coming year, and
establish these goals for the employee to achieve, in order to meet or exceed expectations. While individual goals may
change during the year due to changing circumstances for the entire organization, such changes should be the basis for
new discussions between the manager and employee.
Accomplishing the goals by exceeding expectations results in a larger salary increase than would be available if the goals
had not been met. Depending on adequate funding, a variable pay‐based performance program can be an integral part
of the total compensation reward system. Such a system supports motivation theories, which suggest that incentives do
motivate employees to perform at higher levels.
SPO is currently researching the use of variable pay for performance, but recognizes it must first establish an
occupationally based salary structure that is more reflective of the Comparator market.
LeaveAccrualsandPayoutsAnnualLeave
One of the state’s many employee benefits is paid time off. Employees may use accrued leave and be paid for the hours
they are absent from work due to vacation or being sick. Sick leave may also be used to care for sick family members.
Classified employees accrue annual leave as outlined in the SPB Rules, based on their tenure. For example, employees
with less than three years of service accrue 80 hours of leave per year, while those with over 15 years of service accrue
160 hours per year. During FY17, State employees used slightly less than 1.8 million hours. Actual annual leave usage,
and costs, from FY12 through FY17 is shown in the following graphs.
Graph 18 Graph 19
1.98 1.90 1.89 1.93 1.89 1.83
0.0
0.5
1.0
1.5
2.0
2.5
FY12 FY13 FY14 FY15 FY16 FY17
Millions (Hours)
Total Hours of Annual Leave Taken Per Fiscal Year
$44.9$39.3 $39.7
$42.3 $42.0 $41.4
$26.0
$30.0
$34.0
$38.0
$42.0
$46.0
FY12 FY13 FY14 FY15 FY16 FY17
$ M
illions (Dolla
rs)
Total Cost of Annual Leave Per Fiscal Year
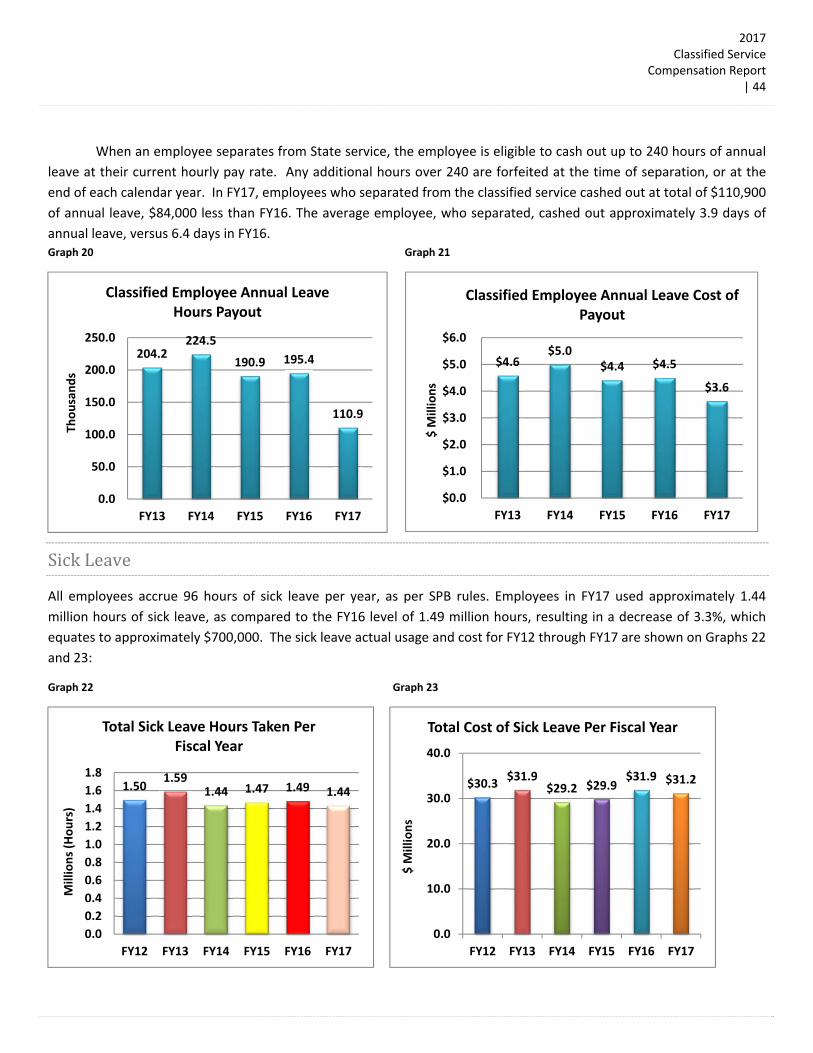
2017Classified Service
Compensation Report | 44
When an employee separates from State service, the employee is eligible to cash out up to 240 hours of annual
leave at their current hourly pay rate. Any additional hours over 240 are forfeited at the time of separation, or at the
end of each calendar year. In FY17, employees who separated from the classified service cashed out at total of $110,900
of annual leave, $84,000 less than FY16. The average employee, who separated, cashed out approximately 3.9 days of
annual leave, versus 6.4 days in FY16. Graph 20 Graph 21
SickLeave
All employees accrue 96 hours of sick leave per year, as per SPB rules. Employees in FY17 used approximately 1.44
million hours of sick leave, as compared to the FY16 level of 1.49 million hours, resulting in a decrease of 3.3%, which
equates to approximately $700,000. The sick leave actual usage and cost for FY12 through FY17 are shown on Graphs 22
and 23:
Graph 22 Graph 23
204.2224.5
190.9 195.4
110.9
0.0
50.0
100.0
150.0
200.0
250.0
FY13 FY14 FY15 FY16 FY17
Thousands
Classified Employee Annual Leave Hours Payout
$4.6$5.0
$4.4 $4.5
$3.6
$0.0
$1.0
$2.0
$3.0
$4.0
$5.0
$6.0
FY13 FY14 FY15 FY16 FY17
$ M
illions
Classified Employee Annual Leave Cost of Payout
1.501.59
1.44 1.47 1.49 1.44
0.0
0.2
0.4
0.6
0.8
1.0
1.2
1.4
1.6
1.8
FY12 FY13 FY14 FY15 FY16 FY17
Millions (Hours)
Total Sick Leave Hours Taken Per Fiscal Year
$30.3$31.9
$29.2 $29.9$31.9 $31.2
0.0
10.0
20.0
30.0
40.0
FY12 FY13 FY14 FY15 FY16 FY17
$ M
illions
Total Cost of Sick Leave Per Fiscal Year
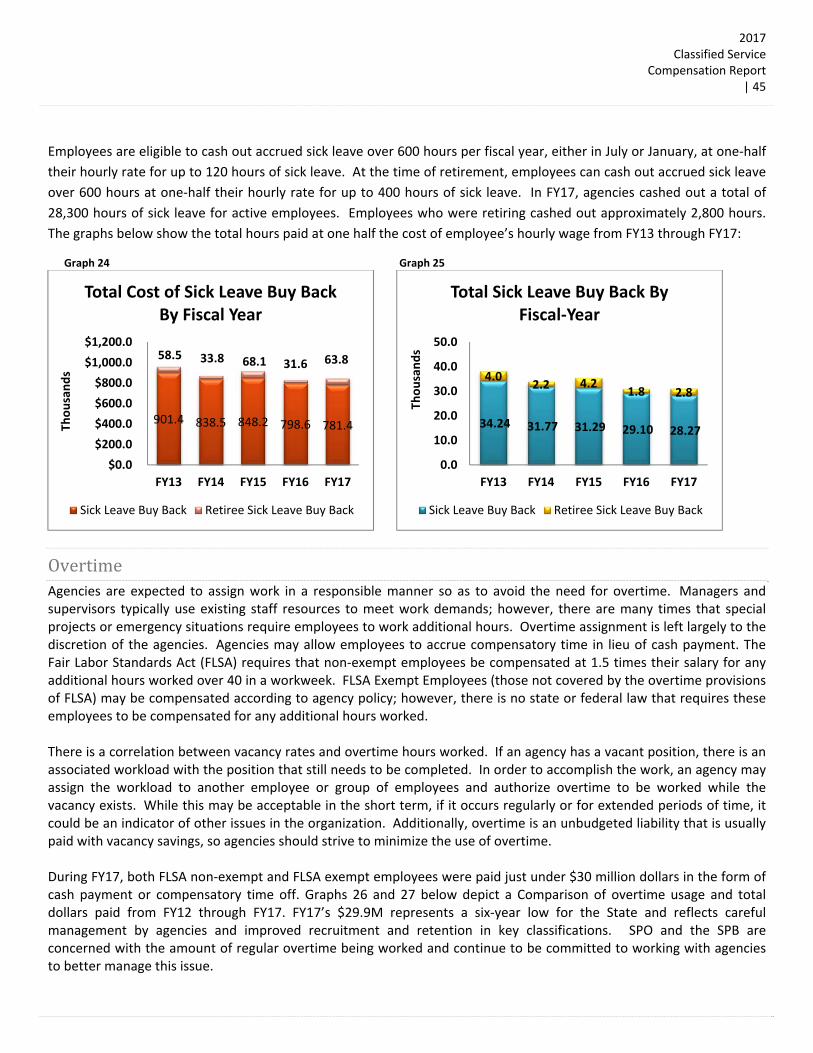
2017Classified Service
Compensation Report | 45
Employees are eligible to cash out accrued sick leave over 600 hours per fiscal year, either in July or January, at one‐half
their hourly rate for up to 120 hours of sick leave. At the time of retirement, employees can cash out accrued sick leave
over 600 hours at one‐half their hourly rate for up to 400 hours of sick leave. In FY17, agencies cashed out a total of
28,300 hours of sick leave for active employees. Employees who were retiring cashed out approximately 2,800 hours.
The graphs below show the total hours paid at one half the cost of employee’s hourly wage from FY13 through FY17:
Graph 24 Graph 25
OvertimeAgencies are expected to assign work in a responsible manner so as to avoid the need for overtime. Managers and supervisors typically use existing staff resources to meet work demands; however, there are many times that special projects or emergency situations require employees to work additional hours. Overtime assignment is left largely to the discretion of the agencies. Agencies may allow employees to accrue compensatory time in lieu of cash payment. The Fair Labor Standards Act (FLSA) requires that non‐exempt employees be compensated at 1.5 times their salary for any additional hours worked over 40 in a workweek. FLSA Exempt Employees (those not covered by the overtime provisions of FLSA) may be compensated according to agency policy; however, there is no state or federal law that requires these employees to be compensated for any additional hours worked. There is a correlation between vacancy rates and overtime hours worked. If an agency has a vacant position, there is an associated workload with the position that still needs to be completed. In order to accomplish the work, an agency may assign the workload to another employee or group of employees and authorize overtime to be worked while the vacancy exists. While this may be acceptable in the short term, if it occurs regularly or for extended periods of time, it could be an indicator of other issues in the organization. Additionally, overtime is an unbudgeted liability that is usually paid with vacancy savings, so agencies should strive to minimize the use of overtime. During FY17, both FLSA non‐exempt and FLSA exempt employees were paid just under $30 million dollars in the form of cash payment or compensatory time off. Graphs 26 and 27 below depict a Comparison of overtime usage and total dollars paid from FY12 through FY17. FY17’s $29.9M represents a six‐year low for the State and reflects careful management by agencies and improved recruitment and retention in key classifications. SPO and the SPB are concerned with the amount of regular overtime being worked and continue to be committed to working with agencies to better manage this issue.
901.4 838.5 848.2 798.6 781.4
58.5 33.8 68.1 31.6 63.8
$0.0
$200.0
$400.0
$600.0
$800.0
$1,000.0
$1,200.0
FY13 FY14 FY15 FY16 FY17
Thousands
Total Cost of Sick Leave Buy Back By Fiscal Year
Sick Leave Buy Back Retiree Sick Leave Buy Back
34.24 31.77 31.29 29.10 28.27
4.02.2 4.2
1.8 2.8
0.0
10.0
20.0
30.0
40.0
50.0
FY13 FY14 FY15 FY16 FY17
Thousands
Total Sick Leave Buy Back By Fiscal‐Year
Sick Leave Buy Back Retiree Sick Leave Buy Back

2017Classified Service
Compensation Report | 46
Graph 26 Graph 27
Turnover&VacancySPO is responsible for assisting applicants with applying for jobs within the State’s classified service, and ensuring that
the qualified applicants are referred to fill vacant positions. Beginning in the second quarter of FY12, SPO implemented
a more flexible and responsive applicant tracking system through NEOGOV. This system brought the State back into
compliance with the portion of the State Personnel Act that mandates a competitive ranking of applicants. NEOGOV is
the applicant tracking system currently being utilized by over 20 states, in addition to many universities, colleges, and
thousands of municipal and county governments.
Since the implementation of NEOGOV in November 2011, there have been over 18.1 million hits reviewing various job
postings. Thus, it is clear that the flexibility and responsiveness of NEOGOV has made it easier for applicants to apply for
state jobs.
In FY17, as a result of the more straightforward application process (NEOGOV), 176,998 applications were received and
processed for 5,223 advertised jobs. These metrics illustrate the dramatic increase in both positions advertised and
applications received. In FY17, 2,660 classified new hires were made. Graph 29 shows that in FY17, nearly 65% of new
hires completed their probationary period.
The implementation of NEOGOV provides agencies with ranked lists of qualified applicants, allowing managers to make
hiring decisions from pools of applicants who possess the job related qualifications required to successfully perform the
advertised jobs. Additionally, SPO is currently working on developing an onboarding process to assist agencies in better
integrating new hires into State government. These two initiatives are expected to positively impact agency efforts in
attracting and retaining qualified employees.
1.441.60
1.771.69 1.68 1.62
$0.0
$0.2
$0.4
$0.6
$0.8
$1.0
$1.2
$1.4
$1.6
$1.8
$2.0
FY12 FY13 FY14 FY15 FY16 FY17
Millions Hours
Overtime Usage By Fiscal Year
$32.7$36.7
$41.0 $41.3
$32.7$29.9
$0
$5
$10
$15
$20
$25
$30
$35
$40
$45
FY12 FY13 FY14 FY15 FY16 FY17$ in
Millions
Overtime Cost By Fiscal Year
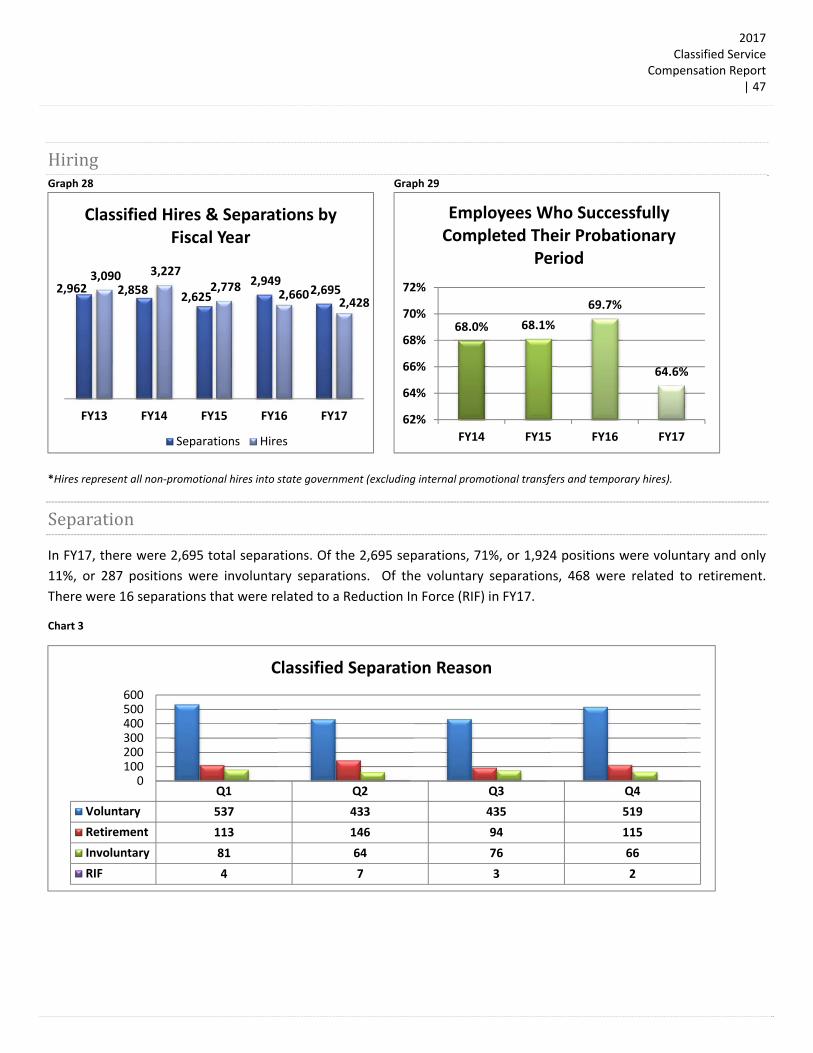
2017Classified Service
Compensation Report | 47
HiringGraph 28 Graph 29
*Hires represent all non‐promotional hires into state government (excluding internal promotional transfers and temporary hires).
Separation
In FY17, there were 2,695 total separations. Of the 2,695 separations, 71%, or 1,924 positions were voluntary and only
11%, or 287 positions were involuntary separations. Of the voluntary separations, 468 were related to retirement.
There were 16 separations that were related to a Reduction In Force (RIF) in FY17.
Chart 3
2,962 2,858 2,625
2,949 2,695
3,090 3,227 2,778
2,660 2,428
FY13 FY14 FY15 FY16 FY17
Classified Hires & Separations by Fiscal Year
Separations Hires
68.0% 68.1%
69.7%
64.6%
62%
64%
66%
68%
70%
72%
FY14 FY15 FY16 FY17
Employees Who Successfully Completed Their Probationary
Period
Q1 Q2 Q3 Q4
Voluntary 537 433 435 519
Retirement 113 146 94 115
Involuntary 81 64 76 66
RIF 4 7 3 2
0100200300400500600
Classified Separation Reason

2017Classified Service
Compensation Report | 48
Graph 30 Graph 31
TurnoverRates
High turnover rates affect the State in many ways,
including the cost to hire, which involves the labor
costs associated with reviewing applications,
interviewing candidates, and training new employees.
Turnover also costs the State because it causes
agencies to have to train current employees to under‐
fill positions. Under‐filling positions not only takes a
toll on production, but also negatively affects employee morale due to increased workloads and responsibilities, long
hours, potential lack of adequate training, potential poor communication, and organizational practices. These potential
morale issues can ultimately cause a domino effect of burnt out employees who are eager to find a job with less stress,
and an increased work and family life balance.
Table 15
The Cost of Employee Turnover Separation Cost
Cost of Exit Interviewer's Time $33 x 1 hr. $33
Cost of terminating employee's time $33 x .5 hr. $17
Cost of administrative functions related to termination $33 x 2 hrs. $66
Separation Pay $33 x 80 hrs. $2,640
Vacancy Costs
2,962 2,858 2,625
2,949 2,695
1,000
1,500
2,000
2,500
3,000
3,500
FY13 FY14 FY15 FY16 FY17
Classified Separations By Fiscal Year
702 664761
822735
650608
702
0
200
400
600
800
1000
Q1 Q2 Q3 Q4
Separations By Quarter
FY16 FY17
If the turnover rate were reduced by approximately 50%, this could potentially free up almost $56 million dollars to use
toward salary increases and structure adjustments.
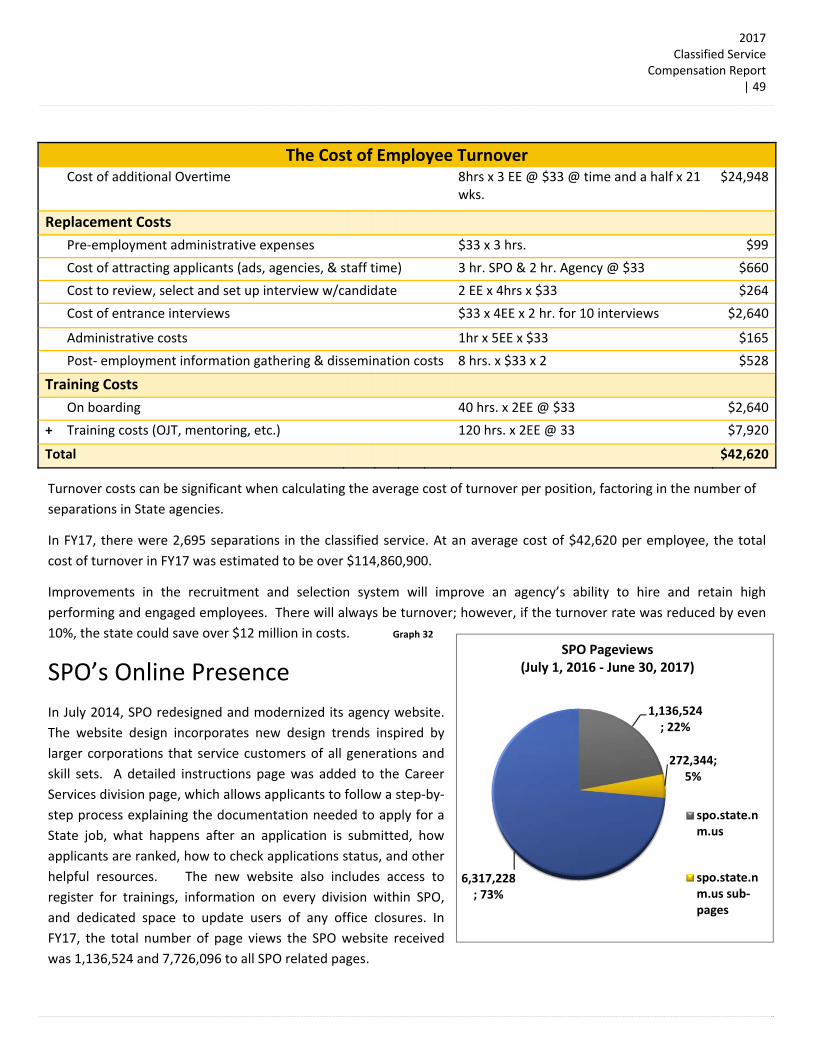
2017Classified Service
Compensation Report | 49
The Cost of Employee Turnover Cost of additional Overtime 8hrs x 3 EE @ $33 @ time and a half x 21
wks. $24,948
Replacement Costs
Pre‐employment administrative expenses $33 x 3 hrs. $99
Cost of attracting applicants (ads, agencies, & staff time) 3 hr. SPO & 2 hr. Agency @ $33 $660
Cost to review, select and set up interview w/candidate 2 EE x 4hrs x $33 $264
Cost of entrance interviews $33 x 4EE x 2 hr. for 10 interviews $2,640
Administrative costs 1hr x 5EE x $33 $165
Post‐ employment information gathering & dissemination costs 8 hrs. x $33 x 2 $528
Training Costs
On boarding 40 hrs. x 2EE @ $33 $2,640
+ Training costs (OJT, mentoring, etc.) 120 hrs. x 2EE @ 33 $7,920
Total $42,620
Turnover costs can be significant when calculating the average cost of turnover per position, factoring in the number of
separations in State agencies.
In FY17, there were 2,695 separations in the classified service. At an average cost of $42,620 per employee, the total
cost of turnover in FY17 was estimated to be over $114,860,900.
Improvements in the recruitment and selection system will improve an agency’s ability to hire and retain high
performing and engaged employees. There will always be turnover; however, if the turnover rate was reduced by even
10%, the state could save over $12 million in costs. Graph 32
SPO’s Online Presence
In July 2014, SPO redesigned and modernized its agency website.
The website design incorporates new design trends inspired by
larger corporations that service customers of all generations and
skill sets. A detailed instructions page was added to the Career
Services division page, which allows applicants to follow a step‐by‐
step process explaining the documentation needed to apply for a
State job, what happens after an application is submitted, how
applicants are ranked, how to check applications status, and other
helpful resources. The new website also includes access to
register for trainings, information on every division within SPO,
and dedicated space to update users of any office closures. In
FY17, the total number of page views the SPO website received
was 1,136,524 and 7,726,096 to all SPO related pages.
1,136,524; 22%
272,344; 5%
6,317,228; 73%
SPO Pageviews(July 1, 2016 ‐ June 30, 2017)
spo.state.nm.us
spo.state.nm.us sub‐pages
2017Classified Service
Compensation Report | 50
Appendix
AppendixA–Industry&EconomicDataSources
AppendixB–LegislativeFiscalYearIncreaseinDetail
AppendixC–2016YearComparatorMarketAverageClassifiedSalary
AppendixD–ClassifiedServiceSalaryStructure
AppendixE–AverageSalaryDatabyAgency
AppendixF–AlternativePayBandAssignments
AppendixG–NewStructureGeneralClassificationFramework

2017Classified Service
Compensation Report | 51
AppendixA–Industry&EconomicDataSources
WorldatWork Total Salary Increase Budget Survey: (United States participating members)
WorldatWork is a nonprofit human resources association focused on compensation, benefits, work‐life effectiveness and total rewards. WorldatWork has more than 70,000 members and subscribers worldwide. Their Salary Budget Survey is the #1 source in the industry, as well as the longest and largest survey of its kind. WorldatWork projects an average salary increase of three and one tenths percent (3.1%) across all US industries for 2018 and a two and nine‐tenths percent increase for the public administration sector (2.9%). Supporting data may be found at www.worldatwork.org.
The Hay Group: (United States participating member)
The Hay Group, acquired by Korn Ferry in September 2015, is a global management and consulting firm providing a range of HR services to companies in 50 countries. They are a leading provider of compensation data, strategy and services across all major industries and employment sectors. For 2018, The Hay Group projects a three percent (3.0%) median base salary increase across all industries. Supporting data may be found at www.haygroup.com or www.kornferry.com/haygroup.
Mercer: (United States participating member)
Mercer is a global human resources consulting firm providing services from strategy to implementation in more than 40 countries. Mercer is a leading provider of compensation and benefits information created from one of the largest warehouses of employer‐reported data. Mercer projects an average increase in base pay of two and nine‐tenths percent (2.9%) across all industries for 2018. Supporting data may be found at www.imercer.com.
Willis Towers Watson: (United States participating member)
Willis Towers Watson is a global advisory, broking and solutions company with over 39,000 employees in more than 140 countries. The Willis Towers Watson survey of 819 U.S. companies shows employers planning a three percent (3.0%) salary increase across all industries for 2018. Supporting data may be found at www.willistowerswatson.com.
Aon Hewitt: (United States participating member
The Aon Hewitt U.S. Salary Increase Survey of 1,062 U.S. companies indicates that organizations plan on providing a three percent (3.0%) average salary increase in 2018. Supporting data may be found at www.aon.com.
The Conference Board: (United States participating members)
The Conference Board is a global, independent business membership and research association working in the public interest to provide an objective, independent source of economic and business knowledge. The Conference Board projects an average salary budget increase of three percent (3.0%) across all U.S. industries for 2018. Supporting data may be found at www.conference‐board.org.
BLR.com:
BLR.com provides US business and legal resources and solutions in the areas of employment, safety and environmental compliance. BLR.com Compensation reports base salary increases ranging from 2.5‐3.0% for 2018.
Bloomberg BNA:
Bloomberg BNA provides legal, tax and compliance professionals with critical information, practical guidance and workflow solutions. BNA leverages leading technology and a global network of experts to deliver a unique combination of news and authoritative analysis, comprehensive research solutions, innovative practice tools, and proprietary business data and analytics. Bloomberg BNA

2017Classified Service
Compensation Report | 52
projects an average increase in base pay of three percent (3.0%) across all industries for 2018. Supporting data may be found at www.bna.com.
ERI Economic Research Institute:
ERI Economic Research Institute compiles robust salary, cost‐of‐living, and executive compensation survey data for more than 1,000 industry sectors in public and private organizations. In its report on Planning Global Compensation Budgets for 2018, ERI projects a three and two‐tenths percent (3.2%) salary increase for the U.S. in 2018. Supporting data may be found at https://www.erieri.com/
United States Bureau of Labor Statistics:
The Bureau of Labor Statistics of the U.S. Department of Labor is the principal Federal agency responsible for measuring labor market activity, working conditions and price changes in the US economy. Its mission is to collect, analyze and disseminate essential economic information to support public and private decision‐making. As an independent statistical agency, BLS serves its diverse user communities by providing products and services that are objective, timely, accurate and relevant. Supporting data may be found at www.bls.gov.
New Mexico Department of Workforce Solutions:
The New Mexico Department of Workforce Solutions (DWS) is responsible for economic research and analysis, business development and outreach, employment outreach and transition programs, workforce services programs, and labor compliance programs. The Economic Research and Analysis Bureau of DWS publishes a wide variety of reports and data on labor market information. The Bureau measures labor market activity, working conditions and price changes in the statewide economy. Supporting data may be found at www.dws.state.nm.us.
AppendixB–LegislativeFiscalYearIncreaseinDetail
Date Legislative Increase
Other
General Fund
Appropriation
7/1/2017 0.00%
‐
7/1/2016 0.00%
The Legislature appropriated $4.5 million to the Corrections department specifically for the purpose to “…implement and occupationally based salary structure that brings staff salaries to the minimum of the pay bands and to provide targeted salary increases to custody staff for the purpose of reducing compaction and improving employee recruitment and retention …”.
$4,500,000
7/1/2015 0.00% ‐
7/5/2014 3.00%
• $13,973,968 GF to provide a 3% salary increase effective the first full pay period after 7/1/2013 to for both union & non‐union classified employees who have completed their probationary period and subject to a satisfactory job evaluation. Employees who reach the end of probationary status between 7/5/14 and 6/30/15 will receive this increase effective the first pay period following anniversary date.
$15,973,968
• An additional $2,000,000 GF was given for salary adjustments in specific classified job classification to be identified by SPO & DFA as trouble with recruitment & retention
7/6/2013 1.00% • Additional 3% was given to commissioned officers in the Motor Transportation Division for a total of 4%.
$8,197,068
7/1/2011 0.00% ‐
7/1/2010 0.00% ‐
7/1/2009 0.00% ‐
7/1/2008 2.90% ‐
7/1/2007 4.50%
• Bring 86 employees to $7.50/hr. $29,661,10
0 • 5% to MTD/SID Officers at DPS “in lieu” of FY08 pay package.
• Additional 5% to Adult Correctional Officers and Public Defender Attorneys.
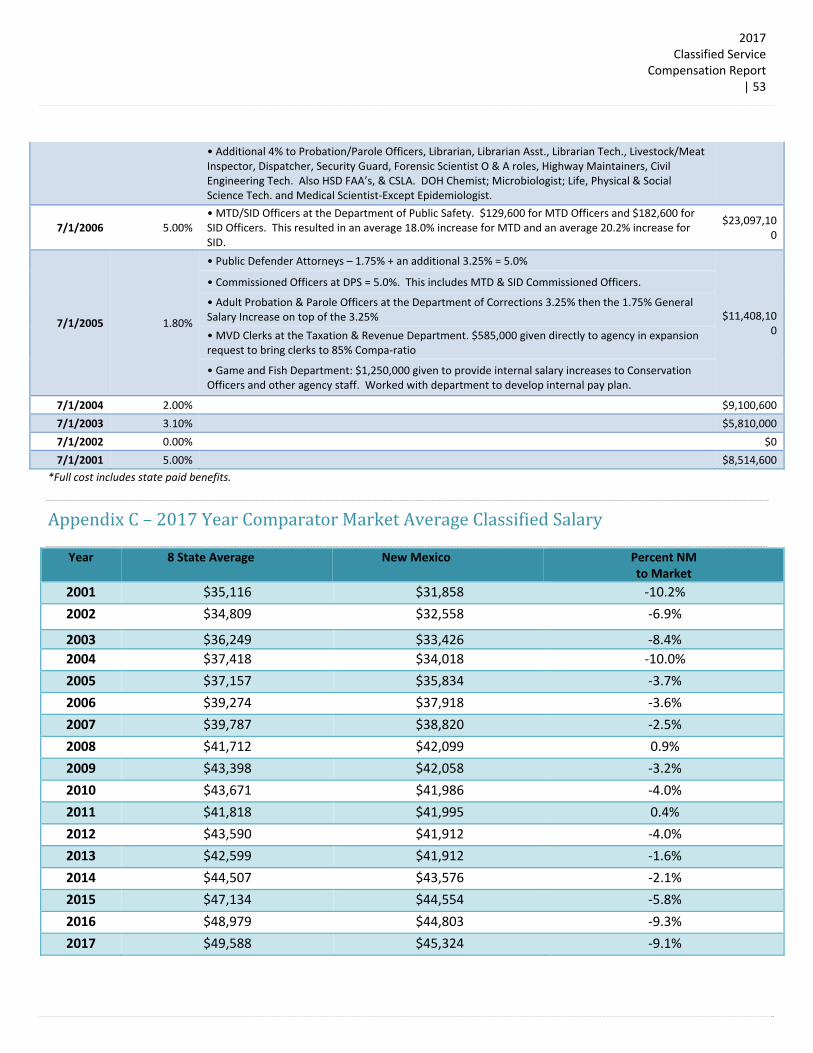
2017Classified Service
Compensation Report | 53
• Additional 4% to Probation/Parole Officers, Librarian, Librarian Asst., Librarian Tech., Livestock/Meat Inspector, Dispatcher, Security Guard, Forensic Scientist O & A roles, Highway Maintainers, Civil Engineering Tech. Also HSD FAA’s, & CSLA. DOH Chemist; Microbiologist; Life, Physical & Social Science Tech. and Medical Scientist‐Except Epidemiologist.
7/1/2006 5.00% • MTD/SID Officers at the Department of Public Safety. $129,600 for MTD Officers and $182,600 for SID Officers. This resulted in an average 18.0% increase for MTD and an average 20.2% increase for SID.
$23,097,100
7/1/2005 1.80%
• Public Defender Attorneys – 1.75% + an additional 3.25% = 5.0%
$11,408,100
• Commissioned Officers at DPS = 5.0%. This includes MTD & SID Commissioned Officers.
• Adult Probation & Parole Officers at the Department of Corrections 3.25% then the 1.75% General Salary Increase on top of the 3.25%
• MVD Clerks at the Taxation & Revenue Department. $585,000 given directly to agency in expansion request to bring clerks to 85% Compa‐ratio
• Game and Fish Department: $1,250,000 given to provide internal salary increases to Conservation Officers and other agency staff. Worked with department to develop internal pay plan.
7/1/2004 2.00% $9,100,600
7/1/2003 3.10% $5,810,000
7/1/2002 0.00% $0
7/1/2001 5.00% $8,514,600
*Full cost includes state paid benefits.
AppendixC–2017YearComparatorMarketAverageClassifiedSalary
Year 8 State Average New Mexico Percent NMto Market
2001 $35,116 $31,858 ‐10.2%
2002 $34,809 $32,558 ‐6.9%
2003 $36,249 $33,426 ‐8.4%
2004 $37,418 $34,018 ‐10.0%
2005 $37,157 $35,834 ‐3.7%
2006 $39,274 $37,918 ‐3.6%
2007 $39,787 $38,820 ‐2.5%
2008 $41,712 $42,099 0.9%
2009 $43,398 $42,058 ‐3.2%
2010 $43,671 $41,986 ‐4.0%
2011 $41,818 $41,995 0.4%
2012 $43,590 $41,912 ‐4.0%
2013 $42,599 $41,912 ‐1.6%
2014 $44,507 $43,576 ‐2.1%
2015 $47,134 $44,554 ‐5.8%
2016 $48,979 $44,803 ‐9.3%
2017 $49,588 $45,324 ‐9.1%

2017Classified Service
Compensation Report | 54
AppendixD–ClassifiedServiceSalaryStructure
ENGINEER,SURVEYORANDWATERRESOURCECLASSIFIEDSERVICESALARYSTRUCTURE
Pay Band Minimum Midpoint Maximum Band Width
EA $27,307 $35,500 $43,693 60%
EB $30,307 $39,400 $48,493 60%
EC $34,076 $44,300 $54,524 60%
ED $38,845 $50,500 $62,155 60%
EE $45,383 $59,000 $72,617 60%
EF $54,614 $71,000 $87,386 60%
EG $60,768 $79,000 $97,232 60%
EH $67,460 $87,700 $107,940 60%
EI $74,883 $97,350 $119,817 60%
EJ $81,613 $106,100 $130,587 60%
EK $88,959 $115,650 $142,341 60%
ARCHITECTCLASSIFIEDSERVICESALARYSTRUCTUREPay Band Minimum Midpoint Maximum Band Width
AA $49,383 $64,200 $79,017 60%
AB $56,152 $73,000 $89,848 60%
AC $75,383 $98,000 $120,617 60%
CLASSIFIEDSERVICESALARYSCHEDULEPay Band Minimum Midpoint Maximum Band Width
25 $15,600 $20,714 $26,312 69%
30 $16,245 $22,265 $28,267 74%
35 $17,618 $24,140 $30,659 74%
40 $19,261 $26,375 $33,488 74%
45 $21,195 $29,039 $36,878 74%
50 $23,525 $32,215 $40,914 74%
55 $26,229 $35,944 $45,656 74%
60 $28,766 $39,413 $50,045 74%
65 $31,782 $43,549 $55,307 74%
70 $35,381 $48,479 $61,568 74%
75 $39,686 $54,355 $69,035 74%
80 $44,782 $61,359 $77,917 74%
85 $50,898 $69,709 $88,525 74%
90 $58,136 $79,649 $101,150 74%

2017Classified Service
Compensation Report | 55
95 $66,810 $91,525 $116,230 74%
96 $77,147 $105,674 $134,202 74%
97 $89,461 $122,539 $155,626 74%
98 $104,125 $142,626 $181,126 74%
99 $195,874 $268,320 $340,766 74%
CORRECTIONSCLASSIFIEDSERVICESALARYSTRUCTUREPay Band Minimum Midpoint Maximum Band Width
CA $28,558 $34,278 $39,998 40%
CB $34,195 $40,976 $47,757 40%
CC $37,856 $45,386 $52,915 40%
CD $41,662 $49,982 $58,302 40%
CE $45,677 $54,808 $63,918 40%
CF $49,525 $59,426 $69,306 40%
CG $52,811 $63,357 $73,902 40%
CH $57,678 $69,181 $80,704 40%
CI $61,859 $74,194 $86,549 40%
CJ $66,144 $79,331 $92,539 40%
CK $73,008 $87,559 $102,149 40%
CL $81,370 $97,635 $113,880 40%
CM $90,979 $109,158 $127,358 40%
ITCLASSIFIEDSERVICESALARYSTRUCTUREPay Band Minimum Midpoint Maximum Band Width
IA $29,598 $39,478 $49,358 67%
IB $34,549 $46,072 $57,602 67%
IC $40,685 $54,267 $67,848 67%
ID $45,843 $61,131 $76,430 67%
IE $51,355 $68,453 $85,584 67%
IF $58,094 $77,459 $96,844 67%
IG $67,912 $90,563 $113,228 67%
IH $79,664 $106,205 $132,784 67%
II $87,714 $116,938 $146,203 67%
IJ $97,302 $129,730 $162,196 67%
IK $108,742 $144,997 $181,284 67%
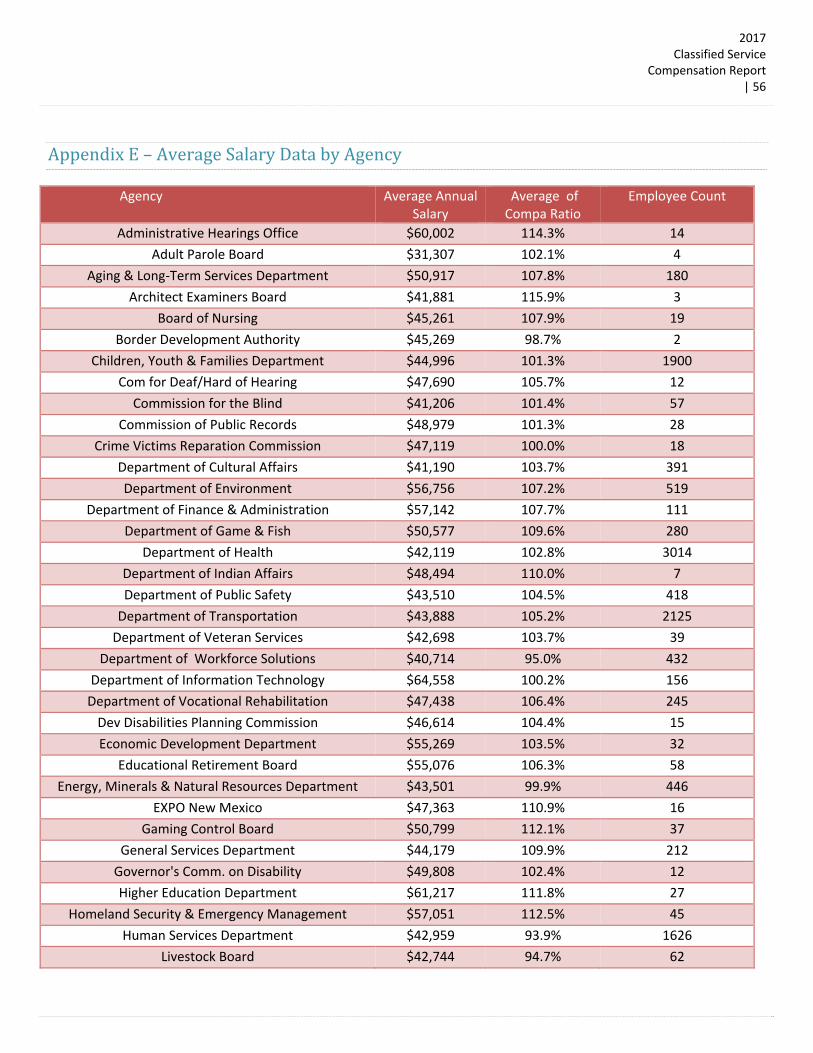
2017Classified Service
Compensation Report | 56
AppendixE–AverageSalaryDatabyAgency
Agency Average Annual Salary
Average of Compa Ratio
Employee Count
Administrative Hearings Office $60,002 114.3% 14
Adult Parole Board $31,307 102.1% 4
Aging & Long‐Term Services Department $50,917 107.8% 180
Architect Examiners Board $41,881 115.9% 3
Board of Nursing $45,261 107.9% 19
Border Development Authority $45,269 98.7% 2
Children, Youth & Families Department $44,996 101.3% 1900
Com for Deaf/Hard of Hearing $47,690 105.7% 12
Commission for the Blind $41,206 101.4% 57
Commission of Public Records $48,979 101.3% 28
Crime Victims Reparation Commission $47,119 100.0% 18
Department of Cultural Affairs $41,190 103.7% 391
Department of Environment $56,756 107.2% 519
Department of Finance & Administration $57,142 107.7% 111
Department of Game & Fish $50,577 109.6% 280
Department of Health $42,119 102.8% 3014
Department of Indian Affairs $48,494 110.0% 7
Department of Public Safety $43,510 104.5% 418
Department of Transportation $43,888 105.2% 2125
Department of Veteran Services $42,698 103.7% 39
Department of Workforce Solutions $40,714 95.0% 432
Department of Information Technology $64,558 100.2% 156
Department of Vocational Rehabilitation $47,438 106.4% 245
Dev Disabilities Planning Commission $46,614 104.4% 15
Economic Development Department $55,269 103.5% 32
Educational Retirement Board $55,076 106.3% 58
Energy, Minerals & Natural Resources Department $43,501 99.9% 446
EXPO New Mexico $47,363 110.9% 16
Gaming Control Board $50,799 112.1% 37
General Services Department $44,179 109.9% 212
Governor's Comm. on Disability $49,808 102.4% 12
Higher Education Department $61,217 111.8% 27
Homeland Security & Emergency Management $57,051 112.5% 45
Human Services Department $42,959 93.9% 1626
Livestock Board $42,744 94.7% 62
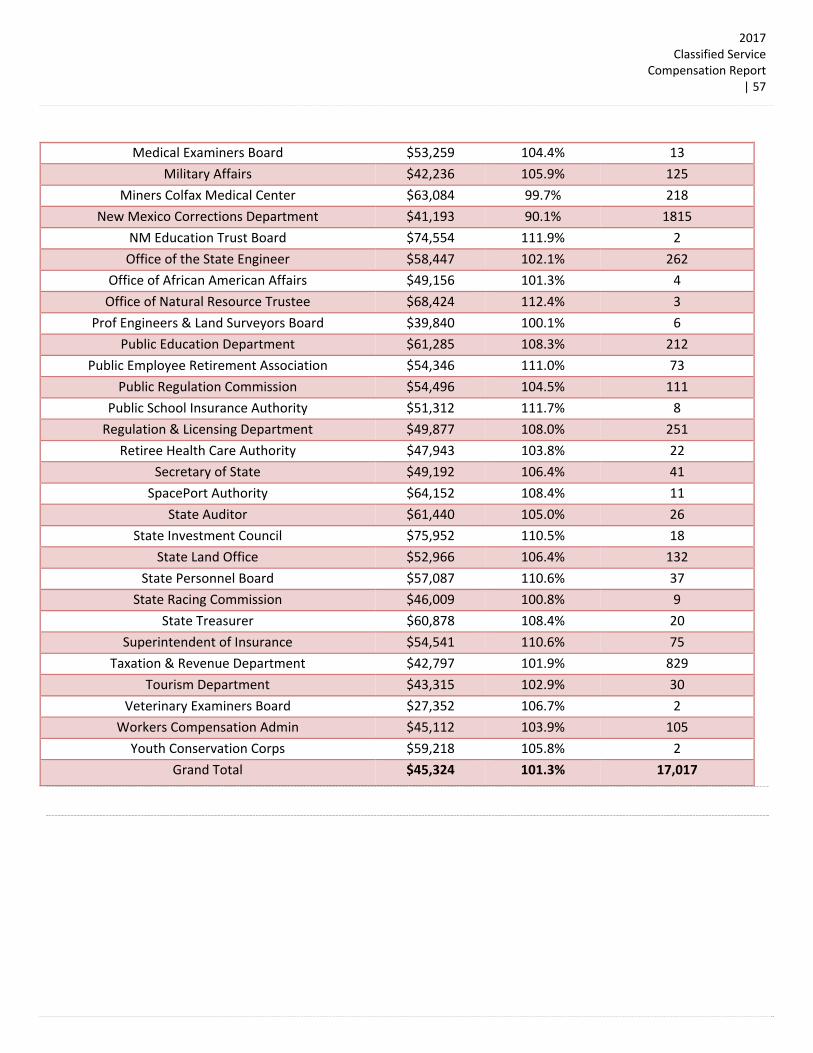
2017Classified Service
Compensation Report | 57
Medical Examiners Board $53,259 104.4% 13
Military Affairs $42,236 105.9% 125
Miners Colfax Medical Center $63,084 99.7% 218
New Mexico Corrections Department $41,193 90.1% 1815
NM Education Trust Board $74,554 111.9% 2
Office of the State Engineer $58,447 102.1% 262
Office of African American Affairs $49,156 101.3% 4
Office of Natural Resource Trustee $68,424 112.4% 3
Prof Engineers & Land Surveyors Board $39,840 100.1% 6
Public Education Department $61,285 108.3% 212
Public Employee Retirement Association $54,346 111.0% 73
Public Regulation Commission $54,496 104.5% 111
Public School Insurance Authority $51,312 111.7% 8
Regulation & Licensing Department $49,877 108.0% 251
Retiree Health Care Authority $47,943 103.8% 22
Secretary of State $49,192 106.4% 41
SpacePort Authority $64,152 108.4% 11
State Auditor $61,440 105.0% 26
State Investment Council $75,952 110.5% 18
State Land Office $52,966 106.4% 132
State Personnel Board $57,087 110.6% 37
State Racing Commission $46,009 100.8% 9
State Treasurer $60,878 108.4% 20
Superintendent of Insurance $54,541 110.6% 75
Taxation & Revenue Department $42,797 101.9% 829
Tourism Department $43,315 102.9% 30
Veterinary Examiners Board $27,352 106.7% 2
Workers Compensation Admin $45,112 103.9% 105
Youth Conservation Corps $59,218 105.8% 2
Grand Total $45,324 101.3% 17,017
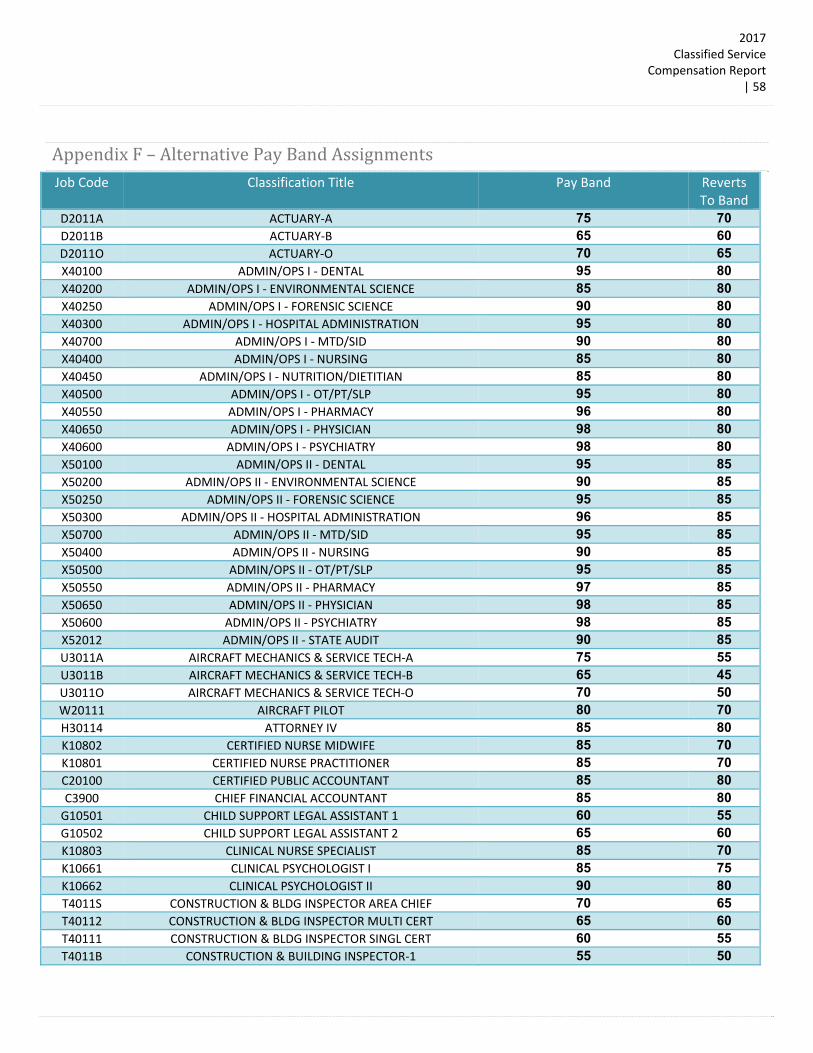
2017Classified Service
Compensation Report | 58
AppendixF–AlternativePayBandAssignmentsJob Code Classification Title Pay Band Reverts
To Band D2011A ACTUARY‐A 75 70 D2011B ACTUARY‐B 65 60 D2011O ACTUARY‐O 70 65 X40100 ADMIN/OPS I ‐ DENTAL 95 80 X40200 ADMIN/OPS I ‐ ENVIRONMENTAL SCIENCE 85 80 X40250 ADMIN/OPS I ‐ FORENSIC SCIENCE 90 80 X40300 ADMIN/OPS I ‐ HOSPITAL ADMINISTRATION 95 80 X40700 ADMIN/OPS I ‐ MTD/SID 90 80 X40400 ADMIN/OPS I ‐ NURSING 85 80 X40450 ADMIN/OPS I ‐ NUTRITION/DIETITIAN 85 80 X40500 ADMIN/OPS I ‐ OT/PT/SLP 95 80 X40550 ADMIN/OPS I ‐ PHARMACY 96 80 X40650 ADMIN/OPS I ‐ PHYSICIAN 98 80 X40600 ADMIN/OPS I ‐ PSYCHIATRY 98 80 X50100 ADMIN/OPS II ‐ DENTAL 95 85 X50200 ADMIN/OPS II ‐ ENVIRONMENTAL SCIENCE 90 85 X50250 ADMIN/OPS II ‐ FORENSIC SCIENCE 95 85 X50300 ADMIN/OPS II ‐ HOSPITAL ADMINISTRATION 96 85 X50700 ADMIN/OPS II ‐ MTD/SID 95 85 X50400 ADMIN/OPS II ‐ NURSING 90 85 X50500 ADMIN/OPS II ‐ OT/PT/SLP 95 85 X50550 ADMIN/OPS II ‐ PHARMACY 97 85 X50650 ADMIN/OPS II ‐ PHYSICIAN 98 85 X50600 ADMIN/OPS II ‐ PSYCHIATRY 98 85 X52012 ADMIN/OPS II ‐ STATE AUDIT 90 85 U3011A AIRCRAFT MECHANICS & SERVICE TECH‐A 75 55 U3011B AIRCRAFT MECHANICS & SERVICE TECH‐B 65 45 U3011O AIRCRAFT MECHANICS & SERVICE TECH‐O 70 50 W20111 AIRCRAFT PILOT 80 70 H30114 ATTORNEY IV 85 80 K10802 CERTIFIED NURSE MIDWIFE 85 70 K10801 CERTIFIED NURSE PRACTITIONER 85 70 C20100 CERTIFIED PUBLIC ACCOUNTANT 85 80 C3900 CHIEF FINANCIAL ACCOUNTANT 85 80 G10501 CHILD SUPPORT LEGAL ASSISTANT 1 60 55 G10502 CHILD SUPPORT LEGAL ASSISTANT 2 65 60 K10803 CLINICAL NURSE SPECIALIST 85 70 K10661 CLINICAL PSYCHOLOGIST I 85 75 K10662 CLINICAL PSYCHOLOGIST II 90 80 T4011S CONSTRUCTION & BLDG INSPECTOR AREA CHIEF 70 65 T40112 CONSTRUCTION & BLDG INSPECTOR MULTI CERT 65 60 T40111 CONSTRUCTION & BLDG INSPECTOR SINGL CERT 60 55 T4011B CONSTRUCTION & BUILDING INSPECTOR‐1 55 50

2017Classified Service
Compensation Report | 59
T4011O CONSTRUCTION & BUILDING INSPECTOR‐2 60 55 T4011A CONSTRUCTION & BUILDING INSPECTOR‐3 65 60 I90311 COORDINATOR ‐ CLASSROOM TECH 70 65 L9091A DENTAL ASSISTANT‐A 50 35 L9091B DENTAL ASSISTANT‐B 40 25 L9091O DENTAL ASSISTANT‐O 45 30 K2021A DENTAL HYGIENIST‐A 70 55 K2021B DENTAL HYGIENIST‐B 60 45 K2021O DENTAL HYGIENIST‐O 65 50 K1021S DENTIST, GENERAL SUPV 95 85 K1021A DENTIST, GENERAL‐A 90 80 K1021B DENTIST, GENERAL‐B 80 70 K1021O DENTIST, GENERAL‐O 85 75 X40251 DEPUTY FORENSIC TOXICOLOGY BUR CHIEF 90 80 X45033 DPS EMERGENCY COMMUNICATIONS MANAGER 90 80 Q20102 ECONOMIC DEVELOPMENT PROGRAM COORD 80 70 Q20101 ECONOMIC DEVELOPMENT REPRESENTITIVE 75 65 F3011S ECONOMIST SUPV 85 75 F3011A ECONOMIST‐A 80 70 F3011B ECONOMIST‐B 70 60 F3011O ECONOMIST‐O 75 65 B9039S EDUCATION ADMINISTRATOR SUPV 85 80 B9039A EDUCATION ADMINISTRATOR‐A 80 75 T2111A ELECTRICIAN‐A 55 50 T2111B ELECTRICIAN‐B 45 40 M40101 EMERGENCY MANAGEMENT SPECIALIST 65 60 F2041S ENVIRONMENTAL SCIENTIST & SPEC SUPV 80 70 F2041A ENVIRONMENTAL SCIENTIST & SPEC‐A 75 65 F2041B ENVIRONMENTAL SCIENTIST & SPEC‐B 65 55 F2041O ENVIRONMENTAL SCIENTIST & SPEC‐O 70 60 X80300 EXECUTIVE ‐ HOSPITAL ADMINISTRATION 98 96 X80550 EXECUTIVE ‐ PHARMACY 97 96 X80650 EXECUTIVE ‐ PHYSICIAN 98 96 X80600 EXECUTIVE ‐ PSYCHIATRY 98 96 K1062S FAMILY & GENERAL PRACTITIONER SUPV 98 90 K1062A FAMILY & GENERAL PRACTITIONER‐A 97 85 K1062B FAMILY & GENERAL PRACTITIONER‐B 95 75 K1062O FAMILY & GENERAL PRACTITIONER‐O 96 80 G10601 FAMILY ASSISTANCE ANALYST 1 60 55 G10602 FAMILY ASSISTANCE ANALYST 2 65 60 C2061S FINANCIAL EXAMINER SUPERVISOR 75 70 C2061A FINANCIAL EXAMINER‐A 70 65 C2061B FINANCIAL EXAMINER‐B 60 55 C2061O FINANCIAL EXAMINER‐O 65 60 F4092O FORENSIC SCIENTIST 1 75 55 F4092A FORENSIC SCIENTIST 2 80 60 F4092S FORENSIC SCIENTIST SUPERVISOR 85 65
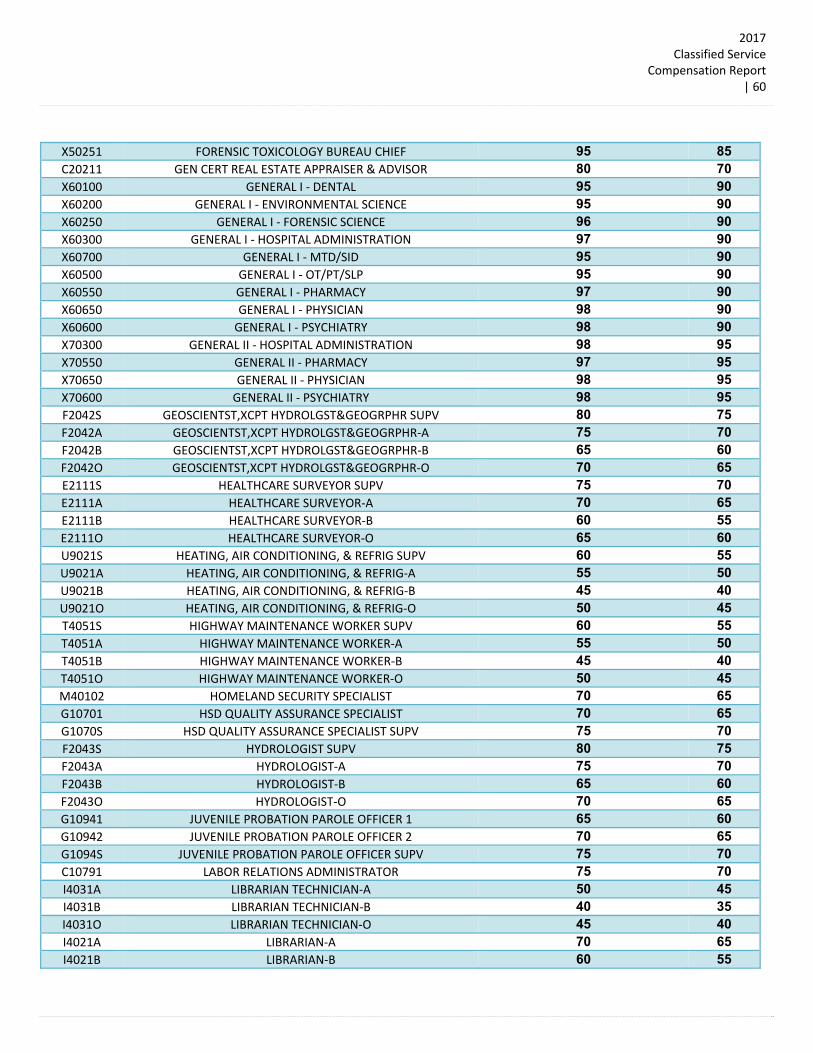
2017Classified Service
Compensation Report | 60
X50251 FORENSIC TOXICOLOGY BUREAU CHIEF 95 85 C20211 GEN CERT REAL ESTATE APPRAISER & ADVISOR 80 70 X60100 GENERAL I ‐ DENTAL 95 90 X60200 GENERAL I ‐ ENVIRONMENTAL SCIENCE 95 90 X60250 GENERAL I ‐ FORENSIC SCIENCE 96 90 X60300 GENERAL I ‐ HOSPITAL ADMINISTRATION 97 90 X60700 GENERAL I ‐ MTD/SID 95 90 X60500 GENERAL I ‐ OT/PT/SLP 95 90 X60550 GENERAL I ‐ PHARMACY 97 90 X60650 GENERAL I ‐ PHYSICIAN 98 90 X60600 GENERAL I ‐ PSYCHIATRY 98 90 X70300 GENERAL II ‐ HOSPITAL ADMINISTRATION 98 95 X70550 GENERAL II ‐ PHARMACY 97 95 X70650 GENERAL II ‐ PHYSICIAN 98 95 X70600 GENERAL II ‐ PSYCHIATRY 98 95 F2042S GEOSCIENTST,XCPT HYDROLGST&GEOGRPHR SUPV 80 75 F2042A GEOSCIENTST,XCPT HYDROLGST&GEOGRPHR‐A 75 70 F2042B GEOSCIENTST,XCPT HYDROLGST&GEOGRPHR‐B 65 60 F2042O GEOSCIENTST,XCPT HYDROLGST&GEOGRPHR‐O 70 65 E2111S HEALTHCARE SURVEYOR SUPV 75 70 E2111A HEALTHCARE SURVEYOR‐A 70 65 E2111B HEALTHCARE SURVEYOR‐B 60 55 E2111O HEALTHCARE SURVEYOR‐O 65 60 U9021S HEATING, AIR CONDITIONING, & REFRIG SUPV 60 55 U9021A HEATING, AIR CONDITIONING, & REFRIG‐A 55 50 U9021B HEATING, AIR CONDITIONING, & REFRIG‐B 45 40 U9021O HEATING, AIR CONDITIONING, & REFRIG‐O 50 45 T4051S HIGHWAY MAINTENANCE WORKER SUPV 60 55 T4051A HIGHWAY MAINTENANCE WORKER‐A 55 50 T4051B HIGHWAY MAINTENANCE WORKER‐B 45 40 T4051O HIGHWAY MAINTENANCE WORKER‐O 50 45 M40102 HOMELAND SECURITY SPECIALIST 70 65 G10701 HSD QUALITY ASSURANCE SPECIALIST 70 65 G1070S HSD QUALITY ASSURANCE SPECIALIST SUPV 75 70 F2043S HYDROLOGIST SUPV 80 75 F2043A HYDROLOGIST‐A 75 70 F2043B HYDROLOGIST‐B 65 60 F2043O HYDROLOGIST‐O 70 65 G10941 JUVENILE PROBATION PAROLE OFFICER 1 65 60 G10942 JUVENILE PROBATION PAROLE OFFICER 2 70 65 G1094S JUVENILE PROBATION PAROLE OFFICER SUPV 75 70 C10791 LABOR RELATIONS ADMINISTRATOR 75 70 I4031A LIBRARIAN TECHNICIAN‐A 50 45 I4031B LIBRARIAN TECHNICIAN‐B 40 35 I4031O LIBRARIAN TECHNICIAN‐O 45 40 I4021A LIBRARIAN‐A 70 65 I4021B LIBRARIAN‐B 60 55
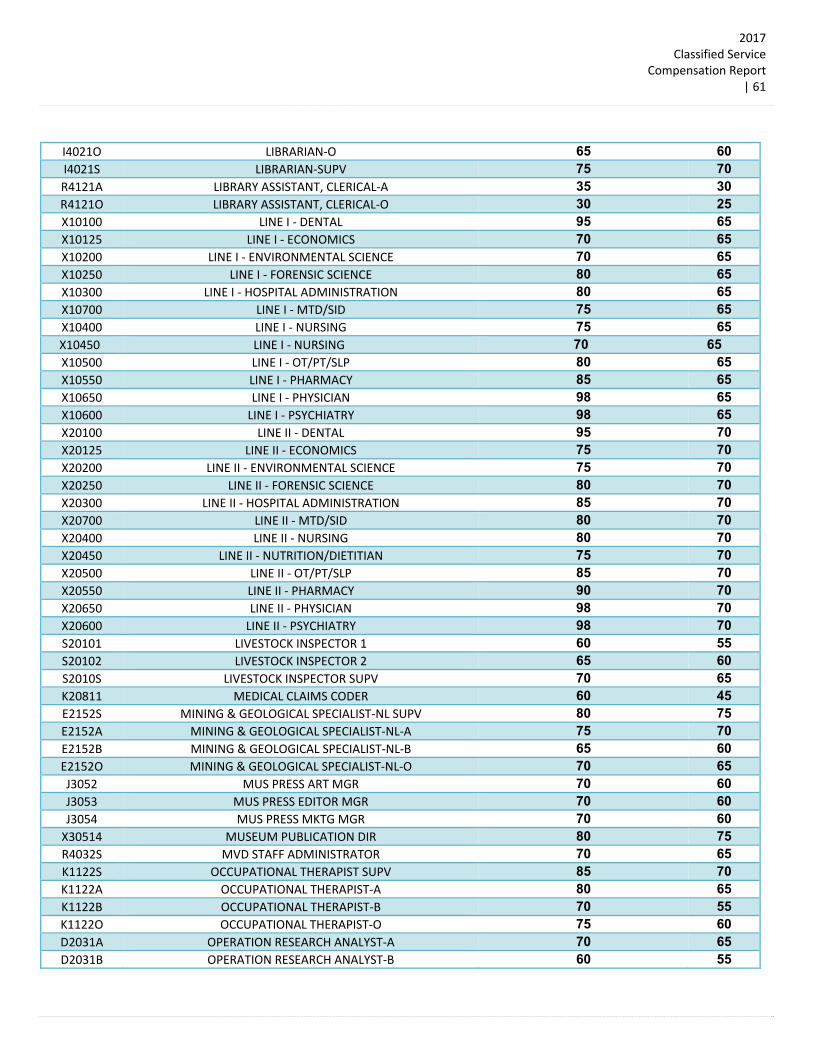
2017Classified Service
Compensation Report | 61
I4021O LIBRARIAN‐O 65 60 I4021S LIBRARIAN‐SUPV 75 70 R4121A LIBRARY ASSISTANT, CLERICAL‐A 35 30 R4121O LIBRARY ASSISTANT, CLERICAL‐O 30 25 X10100 LINE I ‐ DENTAL 95 65 X10125 LINE I ‐ ECONOMICS 70 65 X10200 LINE I ‐ ENVIRONMENTAL SCIENCE 70 65 X10250 LINE I ‐ FORENSIC SCIENCE 80 65 X10300 LINE I ‐ HOSPITAL ADMINISTRATION 80 65 X10700 LINE I ‐ MTD/SID 75 65 X10400 LINE I ‐ NURSING 75 65
X10450 LINE I ‐ NURSING 70 65 X10500 LINE I ‐ OT/PT/SLP 80 65 X10550 LINE I ‐ PHARMACY 85 65 X10650 LINE I ‐ PHYSICIAN 98 65 X10600 LINE I ‐ PSYCHIATRY 98 65 X20100 LINE II ‐ DENTAL 95 70 X20125 LINE II ‐ ECONOMICS 75 70 X20200 LINE II ‐ ENVIRONMENTAL SCIENCE 75 70 X20250 LINE II ‐ FORENSIC SCIENCE 80 70 X20300 LINE II ‐ HOSPITAL ADMINISTRATION 85 70 X20700 LINE II ‐ MTD/SID 80 70 X20400 LINE II ‐ NURSING 80 70 X20450 LINE II ‐ NUTRITION/DIETITIAN 75 70 X20500 LINE II ‐ OT/PT/SLP 85 70 X20550 LINE II ‐ PHARMACY 90 70 X20650 LINE II ‐ PHYSICIAN 98 70 X20600 LINE II ‐ PSYCHIATRY 98 70 S20101 LIVESTOCK INSPECTOR 1 60 55 S20102 LIVESTOCK INSPECTOR 2 65 60 S2010S LIVESTOCK INSPECTOR SUPV 70 65 K20811 MEDICAL CLAIMS CODER 60 45 E2152S MINING & GEOLOGICAL SPECIALIST‐NL SUPV 80 75 E2152A MINING & GEOLOGICAL SPECIALIST‐NL‐A 75 70 E2152B MINING & GEOLOGICAL SPECIALIST‐NL‐B 65 60 E2152O MINING & GEOLOGICAL SPECIALIST‐NL‐O 70 65 J3052 MUS PRESS ART MGR 70 60 J3053 MUS PRESS EDITOR MGR 70 60 J3054 MUS PRESS MKTG MGR 70 60 X30514 MUSEUM PUBLICATION DIR 80 75 R4032S MVD STAFF ADMINISTRATOR 70 65 K1122S OCCUPATIONAL THERAPIST SUPV 85 70 K1122A OCCUPATIONAL THERAPIST‐A 80 65 K1122B OCCUPATIONAL THERAPIST‐B 70 55 K1122O OCCUPATIONAL THERAPIST‐O 75 60 D2031A OPERATION RESEARCH ANALYST‐A 70 65 D2031B OPERATION RESEARCH ANALYST‐B 60 55
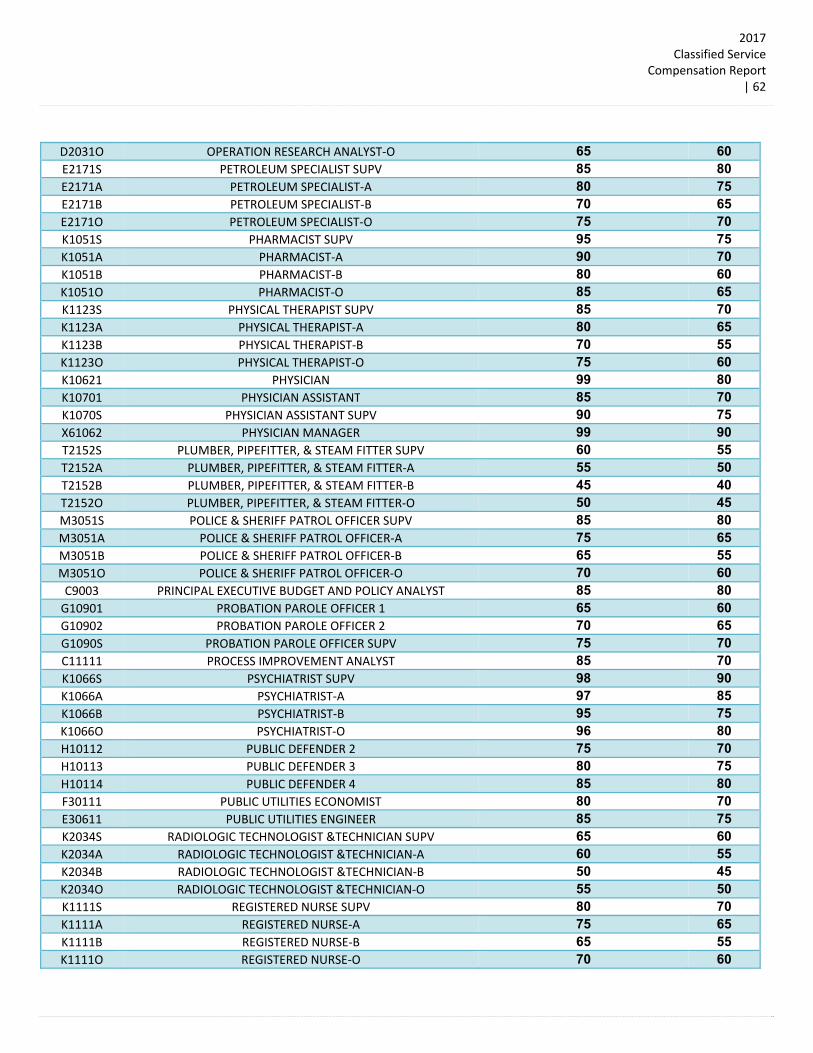
2017Classified Service
Compensation Report | 62
D2031O OPERATION RESEARCH ANALYST‐O 65 60 E2171S PETROLEUM SPECIALIST SUPV 85 80 E2171A PETROLEUM SPECIALIST‐A 80 75 E2171B PETROLEUM SPECIALIST‐B 70 65 E2171O PETROLEUM SPECIALIST‐O 75 70 K1051S PHARMACIST SUPV 95 75 K1051A PHARMACIST‐A 90 70 K1051B PHARMACIST‐B 80 60 K1051O PHARMACIST‐O 85 65 K1123S PHYSICAL THERAPIST SUPV 85 70 K1123A PHYSICAL THERAPIST‐A 80 65 K1123B PHYSICAL THERAPIST‐B 70 55 K1123O PHYSICAL THERAPIST‐O 75 60 K10621 PHYSICIAN 99 80 K10701 PHYSICIAN ASSISTANT 85 70 K1070S PHYSICIAN ASSISTANT SUPV 90 75 X61062 PHYSICIAN MANAGER 99 90 T2152S PLUMBER, PIPEFITTER, & STEAM FITTER SUPV 60 55 T2152A PLUMBER, PIPEFITTER, & STEAM FITTER‐A 55 50 T2152B PLUMBER, PIPEFITTER, & STEAM FITTER‐B 45 40 T2152O PLUMBER, PIPEFITTER, & STEAM FITTER‐O 50 45 M3051S POLICE & SHERIFF PATROL OFFICER SUPV 85 80 M3051A POLICE & SHERIFF PATROL OFFICER‐A 75 65 M3051B POLICE & SHERIFF PATROL OFFICER‐B 65 55 M3051O POLICE & SHERIFF PATROL OFFICER‐O 70 60 C9003 PRINCIPAL EXECUTIVE BUDGET AND POLICY ANALYST 85 80 G10901 PROBATION PAROLE OFFICER 1 65 60 G10902 PROBATION PAROLE OFFICER 2 70 65 G1090S PROBATION PAROLE OFFICER SUPV 75 70 C11111 PROCESS IMPROVEMENT ANALYST 85 70 K1066S PSYCHIATRIST SUPV 98 90 K1066A PSYCHIATRIST‐A 97 85 K1066B PSYCHIATRIST‐B 95 75 K1066O PSYCHIATRIST‐O 96 80 H10112 PUBLIC DEFENDER 2 75 70 H10113 PUBLIC DEFENDER 3 80 75 H10114 PUBLIC DEFENDER 4 85 80 F30111 PUBLIC UTILITIES ECONOMIST 80 70 E30611 PUBLIC UTILITIES ENGINEER 85 75 K2034S RADIOLOGIC TECHNOLOGIST &TECHNICIAN SUPV 65 60 K2034A RADIOLOGIC TECHNOLOGIST &TECHNICIAN‐A 60 55 K2034B RADIOLOGIC TECHNOLOGIST &TECHNICIAN‐B 50 45 K2034O RADIOLOGIC TECHNOLOGIST &TECHNICIAN‐O 55 50 K1111S REGISTERED NURSE SUPV 80 70 K1111A REGISTERED NURSE‐A 75 65 K1111B REGISTERED NURSE‐B 65 55 K1111O REGISTERED NURSE‐O 70 60

2017Classified Service
Compensation Report | 63
K1126A RESPIRATORY THERAPIST‐A 60 50 K1126B RESPIRATORY THERAPIST‐B 50 40 K1126O RESPIRATORY THERAPIST‐O 55 45 C20501 RETIREMENT SPECIALIST, LEVEL 1 55 50 C20502 RETIREMENT SPECIALIST, LEVEL 2 60 55 C2050S RETIREMENT SPECIALIST, SUPERVISOR 65 60 Q3031S SECURITIES, COMMODITIES, & FIN SRVS SUPV 96 75 Q3031A SECURITIES, COMMODITIES, & FIN SRVS‐A 95 70 Q3031B SECURITIES, COMMODITIES, & FIN SRVS‐B 85 60 Q3031O SECURITIES, COMMODITIES, & FIN SRVS‐O 90 65 M9032S SECURITY GUARD SUPV 50 40 M9032A SECURITY GUARD‐A 45 35 M9032B SECURITY GUARD‐B 35 25 M9032O SECURITY GUARD‐O 40 30 I3025 SIGNED LANGUAGE INTERPRETER 75 70 E40495 SPACEPORT AEROSPACE ENGINEER 90 75 Q40401 SPACEPORT AMERICA SALES AGENT 80 65 W20495 SPACEPORT FLIGHT CONTROL SPECIALIST 80 65 X40495 SPACEPORT OPERATIONS MANAGER 85 80 K1127A SPEECH‐LANGUAGE PATHOLOGIST‐A 75 65 K1127B SPEECH‐LANGUAGE PATHOLOGIST‐B 65 55 K1127O SPEECH‐LANGUAGE PATHOLOGIST‐O 70 60 X30100 STAFF ‐ DENTAL 95 75 X30125 STAFF ‐ ECONOMICS 80 75 X30200 STAFF ‐ ENVIRONMENTAL SCIENCE 80 75 X30250 STAFF ‐ FORENSIC SCIENCE 85 75 X30300 STAFF ‐ HOSPITAL ADMINISTRATION 90 75 X30700 STAFF ‐ MTD/SID 85 75 X30400 STAFF ‐ NURSING 80 75 X30450 STAFF ‐ NUTRITION/DIETITIAN 80 75 X30500 STAFF ‐ OT/PT/SLP 90 75 X30550 STAFF ‐ PHARMACY 95 75 X30650 STAFF ‐ PHYSICIAN 98 75 X30600 STAFF ‐ PSYCHIATRY 98 75 C20123 STATE AUDIT AUDITOR COORDINATOR 85 75 C20121 STATE AUDITOR I 65 60 C20122 STATE AUDITOR II 70 65 X70250 STATE SCIENTIFIC LABORATORY DIRECTOR 96 90 M33011 STIU INVESTIGATOR 70 65 C20131 TAX AUDITOR I 60 55 C20132 TAX AUDITOR II 65 60 C20133 TAX AUDITOR III 70 65 C20134 TAX AUDITOR IV 75 70 C2013S TAX AUDITOR SUPV 80 75 K1131A VETERINARIAN‐A 85 80 K1131B VETERINARIAN‐B 75 70 K1131O VETERINARIAN‐O 80 75

2017Classified Service
Compensation Report | 64
B2033 WILDFIRE PREVENTION & CONSERVATION COORD 70 65
AppendixG–NewStructureGeneralClassificationFramework
Architecture, Engineering, and Surveying
• Architecture • Engineering • Engineering, Geological and Surveying Technical• Surveying
Business and Financial Occupations • Accounting • Actuary • Auditing • Budget • Business Operations • Claims • Compliance • Economic Development • Finance • Process Analysis • Public Relations • Purchasing • Real Estate Appraisal and Assessment• Statistics • Tax
Community and Social Services • Child Protective Services • Clergy • Eligibility Determination • Health Education • Health Services Quality Assurance• Social and Community Services• Social Work
Education and Training • Criminal Justice and Law Enforcement Education• Education Administration • Instructional Coordination • Non-Vocational Education and Training
Cultural Affairs • Conservation • Curator • Exhibition • History • Libraries • Media
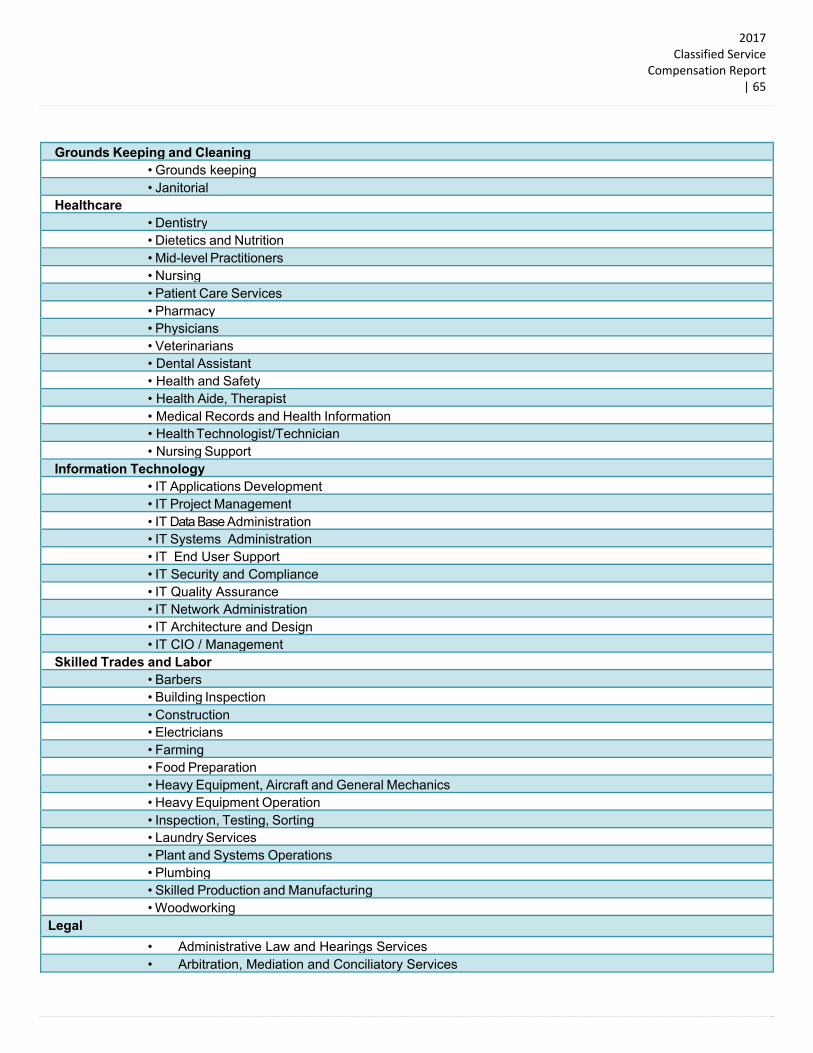
2017Classified Service
Compensation Report | 65
Grounds Keeping and Cleaning • Grounds keeping • Janitorial
Healthcare • Dentistry • Dietetics and Nutrition • Mid-level Practitioners • Nursing • Patient Care Services • Pharmacy • Physicians • Veterinarians • Dental Assistant • Health and Safety • Health Aide, Therapist • Medical Records and Health Information• Health Technologist/Technician• Nursing Support
Information Technology • IT Applications Development • IT Project Management • IT Data Base Administration • IT Systems Administration • IT End User Support • IT Security and Compliance • IT Quality Assurance • IT Network Administration • IT Architecture and Design • IT CIO / Management
Skilled Trades and Labor • Barbers • Building Inspection • Construction • Electricians • Farming • Food Preparation • Heavy Equipment, Aircraft and General Mechanics• Heavy Equipment Operation • Inspection, Testing, Sorting • Laundry Services • Plant and Systems Operations• Plumbing • Skilled Production and Manufacturing• Woodworking
Legal
• Administrative Law and Hearings Services• Arbitration, Mediation and Conciliatory Services
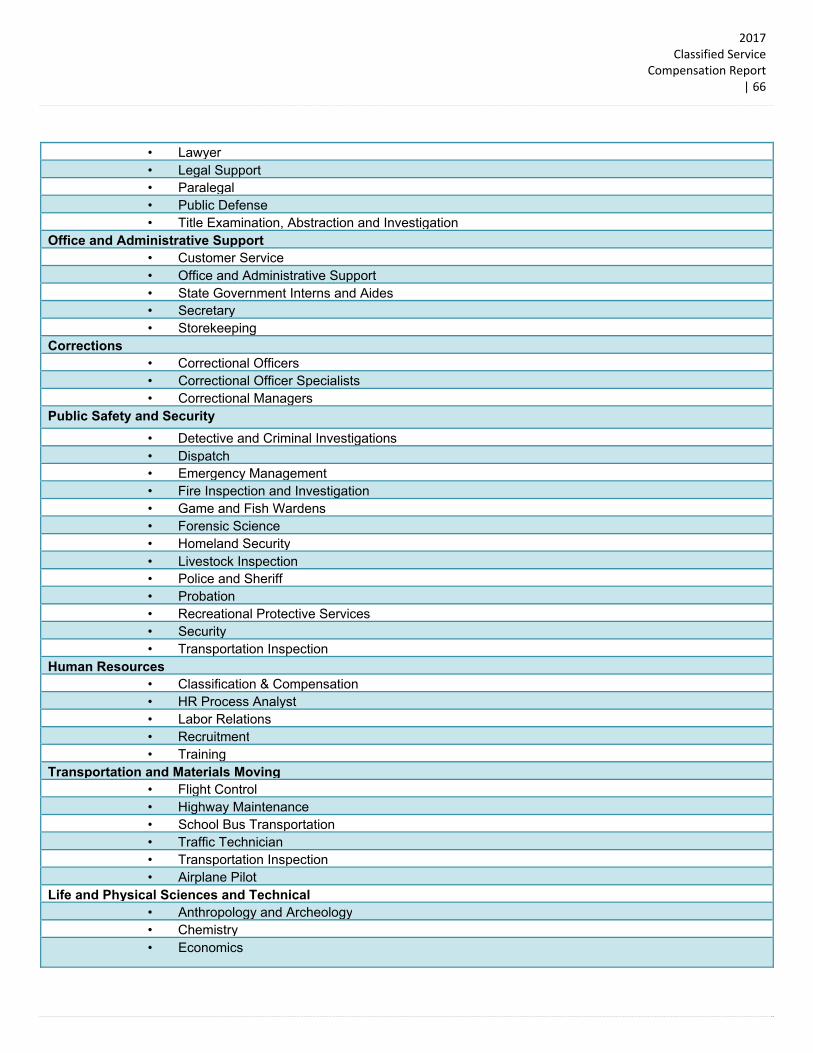
2017Classified Service
Compensation Report | 66
• Lawyer • Legal Support • Paralegal • Public Defense • Title Examination, Abstraction and Investigation
Office and Administrative Support • Customer Service • Office and Administrative Support• State Government Interns and Aides• Secretary • Storekeeping
Corrections • Correctional Officers • Correctional Officer Specialists• Correctional Managers
Public Safety and Security
• Detective and Criminal Investigations• Dispatch • Emergency Management • Fire Inspection and Investigation• Game and Fish Wardens • Forensic Science • Homeland Security • Livestock Inspection • Police and Sheriff • Probation • Recreational Protective Services• Security • Transportation Inspection
Human Resources • Classification & Compensation• HR Process Analyst • Labor Relations • Recruitment • Training
Transportation and Materials Moving • Flight Control • Highway Maintenance • School Bus Transportation• Traffic Technician • Transportation Inspection• Airplane Pilot
Life and Physical Sciences and Technical • Anthropology and Archeology• Chemistry • Economics

2017Classified Service
Compensation Report | 67
• Environmental Science • Epidemiology • Geology • Healthcare Surveyor • Microbiology • Natural Sciences • Petroleum Specialist • Physical Science • Zoologist and Wildlife Biology