2017 Category Management & Shopper Insights … · Dr Pepper Snapple Group ... Dr Pepper...
37
2017 Category Management & Shopper Insights Conference
Transcript of 2017 Category Management & Shopper Insights … · Dr Pepper Snapple Group ... Dr Pepper...

2017 Category Management & Shopper Insights Conference

Dr Pepper Snapple’s Category Captainship at Target
“Optimizing Assortment and Flavor Variety in the Aisle”
Barrie Berquist – Category ManagerDerrek Schulte – Senior Buyer
Presenter ProfilesBarrie BerquistCategory Manager 7 years Category Management experience; 4 years at DPSG
Category Captain: Carbonated Soft Drinks (CSDs)
Derrek SchulteSenior Buyer – Beverages
4 years of Merchandising experience at Target7 years CPG experience with Procter & Gamble

Agenda
▪Introduction to Target and Dr Pepper Snapple Group
▪Methodology and Process Overview
▪Adjusting for Units Sold Off Display
▪Plan-o-gramming Endcaps
▪Next Steps

• 1,795 stores in the United States• 38 distribution centers in the United States• 341,000 team members worldwide• Online business at target.com
• Median age of 40• Median household income of approximately $64K• Approximately 43% have children at home• About 57% have completed college
Target quick factsTarget has: Our Guests:

Mixers Energy
Juices/Drinks RTD Tea
Premium CSD
WaterSoft Drinks
Dr Pepper Snapple Group
Great brands across a diverse portfolio…
Snacking and Other
Partner
Brands

Dr Pepper Distribution Systems
Coke Aligned Sales Organization (CASO)
Pepsi Aligned Sales Organization (PASO)
Packaged Beverages (PB)
Independent Sales Organization (ISO)
40% 44% 15% 1%

Dr Pepper Distribution Map
CASO System PASO System PB System ISO System

Brand Flows and Pepper PlacementPepsi Led Sets Coke Led Sets
Coke Distributed
DPSG Distributed
Pepsi Distributed Pepsi Distributed
DPSG Distributed
Coke Distributed

Methodology and Process Overview

Complexities of Building POGS at Target
Coke led vs. Pepsi led sets
Shopper DemographicsStore Volume Carbonated Soft Drink Volume
Fixtures Profiles Set SizeStore Format
Distribution of Pepper
Market
VS
Presence of Premium Set

Objective #1: Shift the mix toward smaller packages
Source: Nielsen, Target FYTD thru 8.13.16
2 Liters
6 Pack .5 Liter 8 Pack 12oz
7.5-8oz Mini Cans Other
12 Packs

Objective #2: Capitalize on Flavor Growth
Source: Nielsen, Target FYTD thru 8.13.16
Examples of Colas Examples of Flavors

Template Planogram
Planogram Generator
Final Planograms
Data & Rule Sets
Build & Test Template POGs
Define & Prepare POGs
Review POGs
Store Equipment (Target Planograms)
Generate POGs

15
•Allocates space based on an item’s strength – analyzing by SKU not Manufacturer
•No interpretation – decisions are fact based… learn from scanning history!
•Calculates minimum levels of inventory needed between distributor visits.
•Accounts for the different package dimensions
•More efficient use of inventory, frees up space for more variety and new items on shelf
•Reduces Out of Stocks
•Increase Category Turns
•Satisfies Consumer Demand
Days of Supply Methodology
Days of Supply =
Shelf Capacity (# Facings x Depth) /
Daily Unit Sales
Calculation:

▪Pull 52wk Data
▪Calculate Deletes
▪Calculate New Items
▪Adjust for SKU Changes
▪Adjust for Anomaly Weeks
▪Adjust for Units Sold Off Display
Prepping the Reset Data(All Manufacturers and Packages)

Adjusting for Units Sold Off Display

Situation
What percent of units are actually sold off display during promotion?
The shelf needs to support the inventory that consumers are buying in the aisle. Displays offer additional inventory during promotions.
VS.

Our Previous Method
SKU #1 SKU #1 SKU #1
SKU #2 SKU #2 SKU #2
SKU #3 SKU #3 SKU #3
SKU #4 SKU #4 SKU #4
SKU #5 SKU #5 SKU #5
SKU #6 SKU #6 SKU #6
SKU #7 SKU #7 SKU #7
SKU #8 SKU #8 SKU #8
SKU #9 SKU #9 SKU #9
Coke Pepsi DPSG
For 12 packs, remove 50% of promoted unit sales from the top 9 SKUs by store for each manufacturer
Previous Method Assumptions:1) An endcap usually displays
about 9 SKUs2) An equal amount of display
volume is coming from each of the top 9 SKUs
3) Each manufacturer has an equal number of features and displays

20
Determine volume generated from the
shelf to determine true holding power.
Days of Supply Methodology
Total Units = Base Units + Incremental Units
Nielsen breaks out Incremental Units into four
buckets (in blue box).
Our DOS methodology extracts Units best
represented by temporary displays (in red box)
from Total Units which equals Units Sold From
Shelf.
*BASE VOLUME is volume generated in the absence of
any promotion (displays, features, price reductions).
Determining Units Sold from the Shelf
Total
Units
50
Base
Units
18
Increm’l
Units
32= +
Inc Unit Tmp
Display
only
9
Increm’l
Units
32= +
Inc Unit
Feat &
Tmp Disp
15+
Inc Unit
Feat
only
5+
Inc Unit
TPR
only
3
Inc Units Tmp
Display
only
9
Increm’l
Units from
Tmp Display
24= +
Inc Units
Feat &
Tmp Disp
15
Total
Units
50
Increm’l
Units from
Tmp Display
24- =
Units Sold
From
Shelf
26

12 Pack Display Sales by Brand
Source: Nielsen Scantrack ; 52WE 7.18.15

2 Liter Display Sales by Brand
Source: Nielsen Scantrack ; 52WE 7.18.15

Our New Method
12 Packs 2 Liters All Other Packages
Tier 1 Remove X% of unit sales
from top 10 SKUs
Tier 2 Remove Y% of unit sales from next largest SKUs
Tier 3 Did not remove any sales from the rest of the SKUs
Did not remove any sales
Remove Z% of unit sales from top 10
SKUs

Example of 2 LTR Change Before vs. After
Before
After
5 Incremental 2-liter SKUs added to assortment

Example of 12 Pack Change Before vs. After Before
After
7 Incremental 12-pk SKUs added to assortment

Results of Methodology Change▪ CSD category +1.2 pts post transition
▪Flavors +1.5 pts
▪Colas +0.9 pts
▪ Flavored CSD percent of mix = +1 point
▪ Reduced Cola 2 liter facings allowed for expansion of 6pk .5L package which is +28%
▪ Increased assortment despite shrinking set sizes▪2 Liters gained 4,504 or +5.3% points of distribution
▪12pks gained 7,587 or +6% points of distribution
▪ Increased flavor variety
2 Liters Facings Gained
Schweppes Ginger Ale 1223
Cherry Coke Zero 762
Barq's Root Beer 721
Fanta Strawberry 617
Mello Yello 610
Diet Cherry Dr Pepper 589
Cherry Dr Pepper 586
Fanta Grape 553
Mountain Dew Voltage 528
Crush Grape 520
12 Pk 12oz Can Facings Gained
CF Diet Coke 1869
Diet A&W Root Beer 1347
Diet Canada Dry 1305
Sunkist Orange 1147
Canada Dry 966
Fanta Strawberry 894
Vanila Coke 859
Fanta Grape 838
Diet 7up 783
Squirt 774

Plan-o-grammingEndcaps

Bi- and Tri- Manufacturer Shared Ads
Tri Manufacturer Ad

Bulk Endcap VersionsEndcap Variations # of Stores
3x64 (33/33) 1
3x84 (18/18) 51
3x84 (18/22) 9
3x84 (18/33) 20
3x84 (22/22) 72
3x84 (28/22) 2
3x84 (28/28) 161
3x84 (28/33) 1
3x84 (33/22) 11
4x64 (22/22) 7
4x64 (28/22) 44
4x64 (28/28) 4
4x64 (28/33) 5
4x64 (33/22) 2
4x64 (33/33) 1
4x84 (18/18) 55
4x84 (18/22) 100
4x84 (18/33) 63
4x84 (22/22) 547
4x84 (28/22) 1
4x84 (28/28) 336
4x84 (28/33) 4
4x84 (33/22) 87
4x84 (33/33) 2
5x64 (28/22) 4
5x64 (28/28) 4
5x84 (28/22) 4
5x84 (28/28) 22
6x64 (28/33) 5
6x64 (33/33) 143
6x84 (33/33) 1
7x84 (18/33) 1
Grand Total 1770
• 32 different Endcap variations-5 different widths-2 different heights-10 different shelf depth combinations
• Most common version is 4x84 (22/22) – 547 stores
30
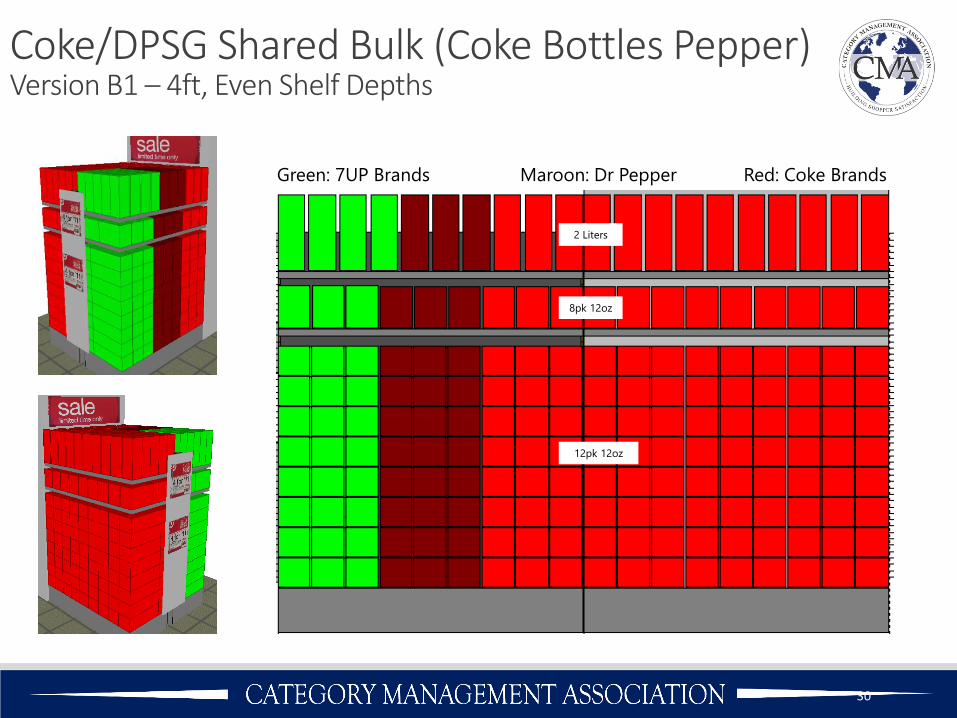
Coke/DPSG Shared Bulk (Coke Bottles Pepper)Version B1 – 4ft, Even Shelf Depths
2 Liters
8pk 12oz
12pk 12oz
Green: 7UP Brands Maroon: Dr Pepper Red: Coke Brands

31
Coke/DPSG Shared Bulk (Pepsi Bottles Pepper)Version B2 – 4ft, Even Shelf Depths
2 Liters
8pk 12oz
12pk 12oz
Green: 7UP Brands Red: Coke Brands

32
Pepsi/DPSG Shared Bulk (Pepsi Bottles Pepper)Version B1 – 4ft, Even Shelf Depths
Green: 7UP Brands Maroon: Dr Pepper Blue: Pepsi Brands

33
Pepsi/DPSG Shared Bulk (Coke Bottles Pepper)Version B2 – 4ft, Even Shelf Depths
Green: 7UP Brands Blue: Pepsi Brands
2 Liters
8pk 12oz
12pk 12oz

Issues Yet to Resolve
▪Communication Challenges with Internal Systems
▪Field execution of POG’d Bulk displays
▪Inventory due to limited back room capacities

Questions?

Appendix

Space & Assortment ProcessPhase 1
Discovery Phase
Phase 2Assortment Process
Phase 3Data Process
Phase 4 Planogram
Development Process
Phase 5 Merchandising
Process
Phase 6Planogram Execution
Process
Phase 7Communication
Process