2017 Birth Report Updated | Mass.gov
60
November 8, 2019 Steven T. James House Clerk State House Room 145 Boston, MA 02133 Michael D. Hurley Senate Clerk State House Room 335 Boston, MA 02133 Dear Mr. Clerk, Pursuant to Section 2 of Chapter 111 of the Massachusetts General Laws, the attached report summarizes birth data and statistics for the 2017 calendar year. Sincerely, Monica Bharel, MD, MPH Commissioner Department of Public Health The Commonwealth of Massachusetts Executive Office of Health and Human Services Department of Public Health 250 Washington Street, Boston, MA 02108-4619 CHARLES D. BAKER Governor KARYN E. POLITO Lieutenant Governor MARYLOU SUDDERS Secretary MONICA BHAREL, MD, MPH Commissioner Tel: 617-624-6000 www.mass.gov/dph
Transcript of 2017 Birth Report Updated | Mass.gov

November 8, 2019 Steven T. James House Clerk State House Room 145 Boston, MA 02133 Michael D. Hurley Senate Clerk State House Room 335 Boston, MA 02133 Dear Mr. Clerk, Pursuant to Section 2 of Chapter 111 of the Massachusetts General Laws, the attached report summarizes birth data and statistics for the 2017 calendar year. Sincerely, Monica Bharel, MD, MPH Commissioner Department of Public Health
The Commonwealth of Massachusetts Executive Office of Health and Human Services
Department of Public Health 250 Washington Street, Boston, MA 02108-4619
CHARLES D. BAKER Governor
KARYN E. POLITO Lieutenant Governor
MARYLOU SUDDERS
Secretary
MONICA BHAREL, MD, MPH Commissioner
Tel: 617-624-6000
www.mass.gov/dph


Massachusetts Births 2017
November 2019


Massachusetts Births 2017
Massachusetts Department of Public Health Registry of Vital Records and Statistics
November 2019 Updated June 16, 2020

ii

ii
Massachusetts Births 2017
Charles D. Baker, Governor Marylou Sudders, Secretary of Health and Human Services Monica Bharel, MD, MPH, Commissioner of Public Health
Abigail R. Averbach, MSc, Assistant Commissioner
Karin Barrett, Registrar
Registry of Vital Records and Statistics
Massachusetts Department of Public Health
November 2019

iv
Acknowledgments
This report was prepared by Vanessa Neergheen and Lisa Murray, Office of Data Management and Outcomes Assessment. A special thank you to Natalie Nguyen Durham, Director, and Kevin Foster, Office of Data Management and Outcomes Assessment. An additional thank you to: Sharon Pagnano, and Maria Vu, Registry of Vital Records and Statistics; Dana Bernson and Malena Hood, Office of Special Analytic Projects. Data in this report have been collected through the efforts of the Registry of Vital Records and Statistics staff, including: Tara Andrews, Michael Baker, June Deloney, Alex Forman, Marta Mercado, Margaret Riley, and Carina Veliz.
To obtain additional copies of this report, contact:
Massachusetts Department of Public Health Registry of Vital Records and Statistics
150 Mt. Vernon Street, 1st Floor Dorchester, MA 02125
(617) 740-2670
To obtain more information on births in Massachusetts and other Department of Public Health data please visit the Department’s free, Internet-based public
health information reports at: http://www.mass.gov/dph/phit or email [email protected]

5
TABLE OF CONTENTS
Note to Readers ......................................................................................................................... 7
Selected Takeaways................................................................................................................... 8
Table 1. Trends in Birth Characteristics, Massachusetts: 1990, 2003-2017 ............................. 10
Table 2. Birth Characteristics by Maternal Race/Hispanic Ethnicity and Birthplace, Massachusetts: 2017 ................................................................................................................ 11
Table 3. Birth Characteristics by Maternal Ancestry, Massachusetts: 2017 ............................. 12
Figure 1. Trends in the Number of Births by Mother’s Age Group, Massachusetts: 1981-2017 ....................................................................................................... 13
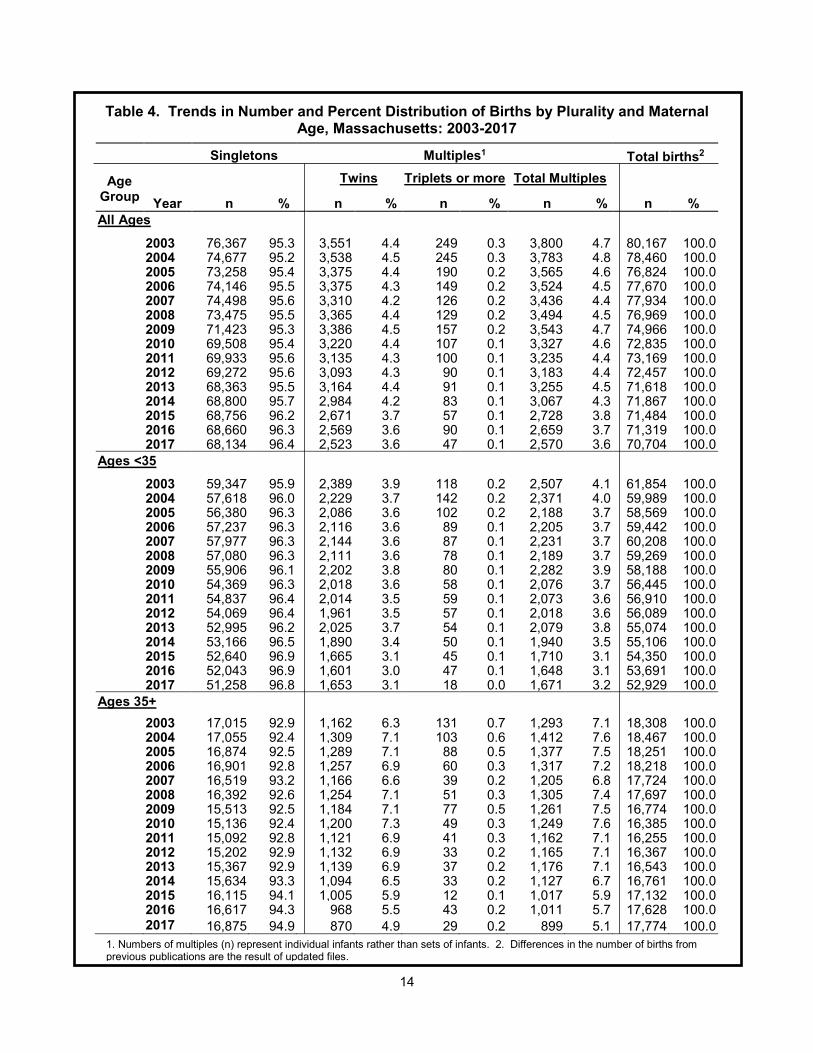
Table 4. Trends in Number and Percent Distribution of Births by Plurality and Maternal Age, Massachusetts: 2003-2017 ....................................................................................................... 14
Table 5. Summary of Selected Teen Birth Characteristics, Massachusetts: 2017 .................... 15
Table 6. Number and Teen Birth Rates by Race/Hispanic Ethnicity for Selected Communities, Massachusetts: 2017 ................................................................................................................ 16
Table 7. Trends in Teen Birth Rates for Selected Communities, Ranked by 2017 Teen Birth Rate, Massachusetts: 2007, 2016-2017 ............................................................................................. 17
Figure 2. Teen Birth Rates among Females Ages 15-19 Years by Mother’s Race/Hispanic Ethnicity, Massachusetts: 2007 and 2017 ................................................................................................ 18
Table 8. Births by Birthweight, Race/Hispanic Ethnicity, Massachusetts: 2017 ........................ 19
Table 9. Low Birthweight by Plurality and Maternal Age, Massachusetts: 2007-2017 ............... 20
Table 10. Births by Gestational Age, Race/Hispanic Ethnicity, Massachusetts: 2017 .............. 21
Table 11. Percent Preterm and Term Births by Gestational Age Category, Massachusetts: 2001-2017 ....................................................................................................... 22
Figure 3. Trends in Adequacy of Prenatal Care2 by Race/Hispanic Ethnicity, Massachusetts: 1997-2017 ....................................................................................................... 23
Figure 4. Adequacy of Prenatal Care by Selected Maternal Characteristics, Massachusetts: 2017 ................................................................................................................ 24
Figure 5. Distribution of Prenatal Care Payment Source, Massachusetts: 2017 ....................... 25
Table 12. Resident Birth Characteristics, 30 Largest Municipalities, Massachusetts: 2017 ...... 26
Table 13. Birth Characteristics by Facility/Location, Massachusetts: 2017 ............................... 28

6
Table 14. Resident Teen Birth Characteristics, 30 Largest Municipalities, Massachusetts: 2017 ................................................................................................................ 30
Table 15. Adequacy of Prenatal Care Utilization: Summary and Component Indices, Massachusetts: 2017 ................................................................................................................ 32
Table 16. Birth Characteristics by Race/Hispanic Ethnicity and Source of Prenatal Care Payment, Massachusetts: 2017 ................................................................................................................ 33
Table 17. Birth Characteristics: Occurrence and Resident Births, Massachusetts Municipalities: 2017 .......................................................................................... 35
Table 18. Birth Characteristics: Occurrence and Resident Births by County, Massachusetts: 2017 ................................................................................................................ 43
Table 19. Birth Characteristics: Occurrence and Resident Births, Massachusetts Community Health Network Areas (CHNAs), Massachusetts: 2017 ........................................................................ 44
Figure 6. Percent of Infants whose Mother Smoked During Pregnancy, Massachusetts: 1990 - 2017 ..................................................................................................... 45
Table 20. Cesarean Deliveries and Vaginal Births after Cesarean (VBACs) by Licensed Maternity Facility, All Mothers, Massachusetts: 2017 ............................................................................... 46
Figure 7. Maternal Body Mass Index (BMI) Prior to Pregnancy, All Mothers, Massachusetts: 2017 ................................................................................................................ 48
Figure 8. Obesity Prior to Pregnancy by Race/Hispanic Ethnicity, All Mothers, Massachusetts: 2017 ................................................................................................................ 48
Figure 9. Mothers Who Reported Having Their Teeth Cleaned During Pregnancy by Race/Hispanic Ethnicity, All Mothers, Massachusetts: 2017 ..................................................... 49
Figure 10. Mothers Who Reported Having Received WIC Food During Pregnancy by Race/Hispanic Ethnicity, All Mothers, Massachusetts: 2017 ..................................................... 49
Figure 11. Mothers Who Reported Smoking During Pregnancy by Race/Hispanic Ethnicity, All Mothers, Massachusetts: 2017 ................................................................................................. 50
Table 21. Mothers Who Used Infertility Treatments, Massachusetts: 2017 .............................. 51
Technical Notes ........................................................................................................................ 52
Data Cautions ........................................................................................................................... 52
Changes in the Collection of Race/Ethnicity Information ........................................................... 52
Table A1. 2017 Massachusetts Population Estimates by Age Group, Gender, Race/Hispanic Ethnicity (mutually exclusive) .................................................................................................................. 55

7
Note to Readers As required by Chapter 111, Section 2 of the General Laws, this report satisfies the requirement of the annual report of statistics on births for calendar year 2017 (Annual Report Vital Statistics of Massachusetts-Births, Public Document #1 2017). Public Document #1 information on 2017 deaths, marriages, and divorces is covered in separate reports.
1. Population Sources. We have used two population files based upon the 2010 Census for denominators in rate calculations:
• The 2017 Modified Age, Race/Ethnicity, and Sex file (MARS), which is a bridged population file produced by the National Center for Health Statistics (NCHS) and the Census Bureau Population Estimates Program was used to calculate state rates by race and Hispanic ethnicity, e.g., teen birth rates. This file has data by single years of age, sex, race and Hispanic ethnicity in the five mutually exclusive categories used by the Department: White Non-Hispanic, Black Non-Hispanic, Asian Non-Hispanic, American Indian/Alaska Native Non-Hispanic, and Hispanic.
• The Massachusetts Department of Public Health Race Allocated Census 2010 Estimates file, which contains population estimates based upon the Census 2010 Summary File 1, was used to calculate city, town, and other substate rates. In this file, the Census 2010 race categories, “Two or more races” and “Some other race” are redistributed to the MDPH standard race categories: White Non-Hispanic, Black Non-Hispanic, Asian Non-Hispanic, and American Indian/Alaska Native Non-Hispanic. All persons in the Census 2010 Hispanic ethnicity category are counted as “Hispanic” race in the MDPH estimates. Please note: If the population in your community increased from 2010 to 2017, the rates listed may overestimate the actual rate. If the population in your community declined from 2010 to 2017, the rates given in the publication may underestimate the actual rate.
2. Resident births. All data in this publication are resident data unless otherwise stated. Resident data
include all events that occur to residents of the Commonwealth, including resident births that occur in other U.S. States and territories.
3. Race and Ethnicity. In the text, the race categories, White, Black, American Indian/Alaska Native, Asian, and Hispanic are mutually exclusive. For example, when we refer to White mothers, this means White Non-Hispanic mothers. See “Technical Notes” for detailed information on the multiple-race reporting area and methods used to bridge responses for those who report more than one race to a single race. Please note that trend data on minority groups such as Native Americans, Hispanics, Blacks, and Asians may not be comparable as these groups will show increases in the number of births solely related to the methods used for re-classification of multiple races into single race categories. Please use caution in interpreting these numbers.
4. Adjusted Adequacy of Prenatal Care Utilization Index. In 2017, there were continued reporting
issues for the number of prenatal visits in three hospitals: Newton Wellesley Hospital, Saint Vincent Hospital, and Winchester Hospital. Adjusted Prenatal Care Utilization Index (APCUI) presents adequate prenatal care without these three hospitals since their data are considered to be unreliable.
5. Breastfeeding. Beginning in 2016, statistics on breastfeeding indicate whether the infant was being breastfed during the hospital stay. In earlier birth reports, statistics on breastfeeding reported on breastfeeding at the time of discharge. Please use caution when comparing breastfeeding data before and after 2016.
6. Tables/Figures Based on Mothers. Please note that Tables 18-19 and Figures 7-11 are based on mothers and not births.
Suggested Citation Massachusetts Births 2017 Boston, MA: Registry of Vital Records and Statistics, Massachusetts Department of Public Health. November 2019.

8
Selected Takeaways
• In 2017, there were 70,704 births to Massachusetts resident mothers, a decline of 0.9% from 71,319 in 2016 and a decline of 23.5% since 1990 (Table 1). The number of births to mothers age 30 and older increased (for the 8th year in a row) by 0.7% percent (2016: 43,377; 2017: 43,669). Similarly, the number of births to mothers under 30 decreased by 3.2% percent (2016: 27,942; 2017: 27,035) (Figure 1).
• Between 2016 and 2017, the number of births to White Non-Hispanic and Asian Non-Hispanic mothers decreased
by 3.4% and 4.6%, respectively, while the number of births to Black Non-Hispanic and Hispanic mothers increased by 2.2% and 3.2%, respectively (Table 1).
• In 2017, the Massachusetts teen birth rate decreased for the tenth year in a row. The teen birth rate was 22.0 births
per 1,000 women age 15-19 in 2007, while in 2017 the rate was 8.1 births per 1,000 women age 15-19 (Table 1). Between 2016 and 2017, the percentage of births to mothers less than 20 years old decreased for all races/ethnicities besides American Indian Non-Hispanic. However, disparities persisted, and the percentage of teen births to Hispanic women remained over five times higher than the percentage of teen births to White Non-Hispanic women (Table 2).
• In 2017, 31.6% of births were cesarean deliveries (Table 1). Among White Non-Hispanic, Black Non-Hispanic,
Hispanic, and Asian Non-Hispanic births, Black Non-Hispanics had the highest percentage of cesarean deliveries (34.9%), while Asian Non-Hispanics had the lowest percentage (29.2%) (Table 2).
• In 2017, the percentage of births to mothers affected by gestational diabetes increased to 6.5% from 5.6% in 2016
(Table 1). • For the fourth year in a row, the percentage of low birthweight infants (less than 2,500 grams or 5.5 pounds)
remained unchanged (2014: 7.5%; 2015: 7.5%; 2016: 7.5%; 2017: 7.5%) (Table 1). • From 2016 to 2017, the percentage of preterm births (births occurring at less than 37 weeks of gestation) increased
slightly from 8.7% to 8.9% (Table 1). The percentage of White Non-Hispanic and Black Non-Hispanic preterm births remained the same from 2016 to 2017 at 8.0% and 11.2%, respectively. In contrast, this percentage increased for Asian Non-Hispanics from 7.5% to 8.3% and for Hispanics from 9.6% to 10.0% (Table 10).
• From 2016 to 2017, the percentage of births to mothers who received adequate prenatal care reversed course and
dropped from 82.3% to 80.5% (Table 1). In 2017, the percentage of births with adequate prenatal care was higher among those with private insurance (87.0%) than public insurance (73.5%) (Table 16).
• The percentage of births to mothers whose prenatal care was covered through public insurance increased slightly
from 2016 (38.6%) to 2017 (39.2%) (Table 1).
• The percentage of multiple births decreased slightly from 3.7% in 2016 to 3.6% in 2017. The percentage of multiple births to mothers under 35 years old increased slightly from 3.1% to 3.2%, and the corresponding percentage for multiple births to mothers 35 and older decreased from 5.7% to 5.1% (Table 4).
• Smoking during pregnancy continued to decline in 2017. The percentage of infants whose mothers reported smoking during pregnancy decreased from 5.3% in 2016 to 4.9% in 2017 (Figure 11).
• In Massachusetts 3,421 women used fertility treatment in 2017. The percentage of mothers who used assisted
reproductive technology (ART) among all mothers who used infertility treatment increased from 68.9% in 2016 to 70.7% in 2017. The percentage of mothers who used ART fertility treatment was much higher among White Non-Hispanic mothers at 77.6% than among Black Non-Hispanic, Asian Non-Hispanic, and Hispanic mothers at 4.2%, 11.3%, and 6.4%, respectively (Table 21).

9

10
Table 1. Trends in Birth Characteristics, Massachusetts: 1990, 2003-2017
Characteristic 1990 2003 2004 2005 2006 2007 2008 2009 2010 2011 2012 2013 2014 2015 2016 2017 Births1 n2 92,461 80,167 78,460 76,824 77,670 77,934 76,969 74,966 72,835 73,169 72,457 71,618 71,867 71,484 71,319 70,704 Rate3 62.1 56.8 56.2 55.6 56.9 57.2 56.5 55.1 53.7 54.1 53.3 52.5 52.1 52.0 52.0 51.2 Race of Mother White Non-Hispanic n 72,483 57,604 55,322 53,469 52,975 52,620 51,760 49,759 48,466 45,973 45,032 44,432 44,128 43,255 42,448 40,989 %4 78.4 71.9 70.5 69.6 68.2 67.5 67.2 66.4 66.5 62.8 62.1 62.0 61.4 60.5 59.5 58.0 Black Non-Hispanic n 7,158 5,902 6,053 6,077 6,452 6,462 6,652 6,945 6,794 6,999 6,892 7,016 7,071 6,949 7,095 7,251 %4 7.7 7.4 7.7 7.9 8.3 8.3 8.6 9.3 9.3 9.6 9.5 9.8 9.8 9.7 9.9 10.3 Asian Non-Hispanic n 3,349 5,224 5,454 5,251 5,469 5,758 5,958 5,939 5,817 6,022 6,530 6,220 6,426 6,473 6,647 6,338 %4 3.6 6.5 7.0 6.8 7.0 7.4 7.7 7.9 8.0 8.2 9.0 8.7 8.9 9.1 9.3 9.0 Hispanic n 8,406 9,764 9,798 10,061 10,696 10,861 10,895 10,986 10,588 12,777 13,088 12,315 12,670 12,927 13,100 13,516 %4 9.1 12.2 12.5 13.1 13.8 13.9 14.2 14.7 14.5 17.5 18.1 17.2 17.6 18.1 18.4 19.1 Teen Births n 7,258 4,639 4,559 4,539 4,722 4,944 4,583 4,477 3,907 3,480 3,219 2,732 2,402 2,140 1,931 1,827 (Ages 15-19) Rate3 35.4 23.0 22.2 21.7 21.3 22.0 20.1 19.5 17.1 15.4 14.0 12.0 10.6 9.4 8.5 8.1 Births to Unmarried n 22,837 22,262 22,376 23,170 24,977 26,010 26,146 26,029 25,220 25,349 24,900 24,014 23,853 23,913 23,566 23,309 % 24.7 27.8 28.5 30.2 32.2 33.4 34.0 34.7 34.6 34.8 34.5 33.7 33.3 33.6 33.2 33.1 Cesarean Deliveries n 20,615 23,392 24,295 24,732 25,901 26,240 26,240 25,067 24,244 23,062 22,900 22,508 22,691 22,431 22,302 22,290 % 22.3 29.2 31.0 32.3 33.4 33.7 34.3 33.6 33.3 32.5 31.7 31.5 31.6 31.4 31.3 31.6 Gestational Diabetes5 n 2,693 2,741 2,666 2,925 3,279 3,086 3,445 3,368 3,698 4,070 3,784 3,867 4,287 4,005 4,575 % 3.4 3.5 3.5 3.8 4.2 4.0 4.7 4.7 5.1 5.6 5.3 5.4 6.0 5.6 6.5 Low Birthweight6 n 5,388 6,115 6,125 6,073 6,150 6,147 5,955 5,804 5,650 5,458 5,491 5,495 5,394 5,321 5,341 5,261 % 5.8 7.6 7.8 7.9 7.9 7.9 7.8 7.8 7.8 7.6 7.6 7.7 7.5 7.5 7.5 7.5 Preterm7 n 5,899 6,963 7,222 6,925 6,954 6,980 6,750 6,516 6,234 5,992 6,107 6,300 6,161 6,001 6,167 6,272 % 6.5 8.7 9.2 9.0 9.0 9.0 8.8 8.7 8.6 8.4 8.6 8.8 8.6 8.4 8.7 8.9 Late Preterm8 n 3,977 4,800 5,016 4,808 4,918 4,945 4,753 4,602 4,361 4,206 4,422 4,518 4,394 4,305 4,492 4,680 % 4.4 6.0 6.4 6.3 6.3 6.4 6.2 6.2 6.0 5.9 6.2 6.3 6.1 6.0 6.3 6.6 Prenatal Care Public Pay Prenatal Care9 % 25.1 28.3 29.9 31.9 33.5 34.9 34.5 35.3 35.8 38.8 39.8 38.9 42.9 38.3 38.6 39.2 APNCU Index10 % 84.5 84.2 84.0 83.1 82.8 82.1 84.3 84.9 82.8 83.4 83.7 82.6 81.8 82.1 80.6 Adjusted APNCU Index11 % 85.3 85.4 84.5 83.1 81.8 82.3 80.5
NOTE: All percentages are calculated based on only those births with known values for the characteristic(s) of interest, unless otherwise stated. 1. Births presented in all tables are resident live births unless otherwise specified. 2. Differences in numbers of births from previous publications are the result of updated files. 3. Birth rates represent the total number of births to women ages 15-44 years per 1,000 females ages 15-44; teen birth rates refer to number of births per 1,000 females ages 15-19. Population data for computing 2017 birth rates at the state level were provided by the US Census Bureau. See the “Population Denominators” section of the “Technical Notes” for further information. 4. Percentages are calculated based on births, including those to mothers of unknown race. 5. Gestational diabetes is defined as glucose intolerance found during pregnancy for the first time. It excludes cases with pre-existing diabetes. 6. Low birthweight: less than 2,500 grams or 5.5 pounds. 7. Preterm: <37 weeks gestation. 8. Late preterm: 34-36 weeks gestation. 9. Government programs including Commonhealth, Healthy Start, Medicaid/MassHealth, and Medicare (may also be HMO or managed care), or free care; other: Worker's Compensation and other sources. 10. Beginning with Births 2001, the APNCU Index has replaced the Kessner Index as the standard measurement of adequacy of prenatal care (see Technical Notes for more information). 11. Does not include data from Newton Wellesley, Saint Vincent and Winchester hospitals because of reporting problems.

11
Table 2. Birth Characteristics by Maternal Race/Hispanic Ethnicity and Birthplace, Massachusetts: 2017
Race and Hispanic Ethnicity (by mother’s birthplace)
Births Teen Births Birthweight Prenatal Care Cesarean Deliveries
Breastfeeding5
<18 Years <20 Years Very Low2 Low3 Adequate4 1st Trimester n %1 n % n % n % n % n % n % n % n %
State Total 70,704 100.0 471 0.7 1,843 2.6 774 1.1 5,261 7.5 49,523 80.5 55,171 79.1 22,290 31.6 60,277 85.5 US inc. DC 47,150 66.7 313 0.7 1,259 2.7 508 1.1 3,432 7.3 33,558 83.5 38,241 82.3 14,742 31.3 39,045 83.1 US Territories7 1,726 2.4 43 2.5 163 9.4 33 1.9 199 11.5 1,271 77.6 1,292 75.7 558 32.3 1,373 80.1 Non-US-born8 21,821 30.9 115 0.5 420 1.9 230 1.1 1,627 7.5 14,691 74.6 15,634 72.6 6,990 32.1 19,857 91.2
White Non-Hispanic 40,989 58.0 111 0.3 548 1.3 333 0.8 2,565 6.3 29,029 84.2 33,640 83.1 12,870 31.4 34,670 84.7 US inc. DC 36,263 88.5 103 0.3 509 1.4 291 0.8 2,299 6.3 25,816 85.2 30,049 83.9 11,424 31.5 30,309 83.7
84.6 US Territories7 13 0.0 0 0.0 --6 --6 --6 --6 --6 --6 10 83.3 11 84.6 --6 --6 11 Non-US-born8 4,712 11.5 8 0.2 38 0.8 40 0.8 263 5.6 3,202 77.3 3,579 76.8 1,443 30.6 4,350 92.5
Black Non-Hispanic 7,251 10.3 68 0.9 232 3.2 164 2.3 768 10.6 4,601 68.8 4,795 67.3 2,534 34.9 6,298 87.2 US inc. DC 3,016 41.6 55 1.8 175 5.8 90 3.0 404 13.4 2,060 73.8 2,177 73.2 1,016 33.7 2,414 80.5 US Territories7 --6 --6 0 0.0 0 0.0 0 0.0 0 0.0 --6 --6 --6 --6 0 0.0 --6 --6 Non-US-born8 4,234 58.4 13 0.3 57 1.3 74 1.7 364 8.6 2,540 65.1 2,617 63.0 1,518 35.9 3,883 92.0
Hispanic 13,516 19.1 269 2.0 972 7.2 185 1.4 1,145 8.5 9,629 75.6 9,715 72.8 4,223 31.2 11,334 84.1 US inc. DC 5,111 37.8 138 2.7 511 10.0 88 1.7 482 9.4 3,682 78.2 3,834 76.0 1,531 30.0 4,030 79.0 US Territories7 1,689 12.5 43 2.5 162 9.6 32 1.9 194 11.5 1,246 77.7 1,263 75.6 547 32.4 1,343 80.0 Non-US-born8 6,714 49.7 88 1.3 298 4.4 65 1.0 469 7.0 4,701 73.3 4,617 69.7 2,145 31.9 5,960 88.9
Asian Non-Hispanic 6,338 9.0 10 0.2 31 0.5 40 0.6 526 8.3 4,334 81.9 5,029 80.2 1,851 29.2 5,773 91.2 US inc. DC 1,207 19.0 8 0.7 20 1.7 9 0.7 103 8.5 831 82.9 969 81.4 310 25.7 1,034 85.7 US Territories7 5 0.1 0 0.0 0 0.0 0 0.0 --6 --6 --6 --6 5 100.0 --6 --6 5 100.0 Non-US-born8 5,126 80.9 --6 --6 11 0.2 31 0.6 421 8.2 3,499 81.7 4,055 79.9 1,540 30.0 4,734 92.4
American Indian Non-Hispanic9 246 0.3 5 2.0 19 7.7 --6 --6 19 7.8 165 76.7 170 71.4 83 33.7 184 74.8
US inc. DC 236 95.9 5 2.1 19 8.1 --6 --6 19 8.1 157 76.6 164 71.9 81 34.3 175 74.2 US Territories7 0 0.0 0 0.0 0 0.0 0 0.0 0 0.0 0 0.0 0 0.0 0 0.0 0 0.0 Non-US-born8 10 4.1 0 0.0 0 0.0 0 0.0 0 0.0 8 80.0 6 60.0 --6 --6 9 90.0
Other Non-Hispanic10 438 0.6 --6 --6 5 1.1 6 1.4 38 8.7 289 70.3 286 66.7 139 31.7 389 88.8 US inc. DC 90 20.5 --6 --6 --6 --6 --6 --6 10 11.1 72 81.8 70 77.8 31 34.4 68 75.6 US Territories7 --6 --6 0 0.0 0 0.0 0 0.0 0 0.0 0 0.0 --6 --6 0 0.0 0 0.0 Non-US-born8 347 79.2 0 0.0 --6 --6 5 1.4 28 8.1 217 67.4 215 63.6 108 31.1 321 92.5
Unknown 1,926 2.7 7 0.4 36 1.9 42 2.2 200 10.7 1,476 86.1 1,536 85.0 590 32.0 1,629 88.3 NOTE: All percentages are calculated based on only those births with known values for the characteristic(s) of interest, unless otherwise stated. 1. In the column “Births %,” the percentages of the race/Hispanic groups (bolded) are based on the state total (including births of unknown race/ethnicity), and the birthplace percentage for the race/ethnicities are based on the total number in race/Hispanic ethnicity category. For all other categories, percentages are based on row totals. 2. Very low birthweight: less than 1,500 grams or 3.3 pounds. 3. Low birthweight: less than 2,500 grams or 5.5 pounds. 4. Based on Adequacy of Prenatal Care Utilization (APNCU) Index. Does not include data from Newton Wellesley, Saint Vincent and Winchester hospitals because of reporting problems. 5. Infant was being breastfed during the hospital stay. 6. Calculations based on 1-4 events are excluded. 7. The category “US Territories” includes women born in Puerto Rico, the US Virgin Islands, and Guam. Approximately 95% of the births in this category were to women born in Puerto Rico. 8. The category “Non-US-born” includes women born outside of the 50 US states, District of Columbia, and the US territories. 9. Mothers who selected American Indian/Alaska Native as their race. 10. Mothers who indicated “Other” as their race.

12
Table 3. Birth Characteristics by Maternal Ancestry, Massachusetts: 2017
Maternal Ancestry
Births1 Teen Births Low Birthweight2
Prenatal Care Late Preterm4
Cesarean Section
Breast-feeding5
Gestational Diabetes6 <18 years <20 Years Adequate3 1st Trimester
N % N % N % N % N % N % N % N % N % N % State Total 70,704 100.0 471 0.7 1,843 2.6 5,261 7.5 49,523 80.5 55,171 79.1 4,680 6.6 22,290 31.6 60,277 85.5 4,575 6.5
American 32,580 46.1 141 0.4 638 2.0 2,110 6.5 23,605 84.4 26,773 83.0 2,141 6.6 10,182 31.3 27,653 85.0 1,924 5.9
European 8,797 12.4 14 0.2 69 0.8 468 5.3 5,804 85.9 7,396 84.8 471 5.4 2,687 30.5 8,085 92.0 479 5.4 Puerto Rican 4,746 6.7 141 3.0 496 10.5 496 10.5 3,438 77.8 3,551 75.8 380 8.0 1,491 31.4 3,633 76.8 303 6.4 African American 3,167 4.5 49 1.5 176 5.6 419 13.3 2,156 73.6 2,275 72.9 275 8.7 1,062 33.5 2,546 80.8 161 5.1 Dominican 3,140 4.4 51 1.6 198 6.3 260 8.3 2,303 76.4 2,275 73.5 193 6.1 1,154 36.8 2,744 87.7 155 4.9 African 2,112 3.0 --7 --7 11 0.5 145 6.9 1,307 68.6 1,340 64.3 120 5.7 770 36.5 1,953 92.7 150 7.1 Portuguese 2,084 2.9 18 0.9 85 4.1 155 7.4 1,572 81.2 1,640 79.5 122 5.9 723 34.7 1,486 71.3 131 6.3 Asian Indian 2,053 2.9 0 0.0 6 0.3 210 10.2 1,263 80.8 1,635 80.2 136 6.6 767 37.4 1,960 95.5 312 15.2 Brazilian 1,958 2.8 12 0.6 48 2.5 137 7.0 1,332 72.7 1,397 72.5 119 6.1 806 41.2 1,834 93.8 113 5.8 Other 1,927 2.7 7 0.4 24 1.2 163 8.5 1,351 82.7 1,490 80.5 136 7.1 607 31.5 933 48.6 119 6.2 Chinese 1,896 2.7 --7 --7 6 0.3 121 6.4 1,370 84.9 1,603 85.3 101 5.3 430 22.7 1,770 93.5 188 9.9 Haitian 1,537 2.2 6 0.4 22 1.4 148 9.7 902 63.7 947 62.8 110 7.2 541 35.2 1,382 90.4 100 6.5 Cape Verdean 1,460 2.1 22 1.5 83 5.7 139 9.5 1,009 70.8 981 68.1 105 7.2 433 29.7 1,237 85.0 91 6.2 Salvadoran 1,293 1.8 23 1.8 80 6.2 91 7.0 873 69.1 852 66.3 78 6.0 282 21.8 1,129 87.4 76 5.9 Middle Eastern 1,128 1.6 --7 --7 5 0.4 84 7.5 735 73.7 808 72.1 63 5.6 345 30.6 1,028 91.5 85 7.5 Guatemalan 1,106 1.6 30 2.7 88 8.0 74 6.7 748 70.7 694 63.9 78 7.1 268 24.2 891 80.6 86 7.8 Russian 694 1.0 --7 --7 9 1.3 29 4.2 449 79.8 541 78.5 33 4.8 170 24.5 659 95.1 38 5.5 Vietnamese 647 0.9 0 0.0 6 0.9 43 6.7 442 78.8 474 74.9 46 7.1 165 25.5 563 87.0 76 11.7 Cambodian 599 0.8 --7 --7 13 2.2 45 7.5 426 77.9 437 74.1 46 7.7 143 23.9 432 72.1 49 8.2 West Indian Caribbean 546 0.8 --7 --7 20 3.7 66 12.1 361 73.4 386 72.4 41 7.5 199 36.4 499 91.6 44 8.1
Other South American 545 0.8 6 1.1 20 3.7 22 4.1 382 79.1 404 75.8 52 9.5 152 27.9 517 94.9 26 4.8
Mexican 523 0.7 7 1.3 26 5.0 36 6.9 358 76.0 362 70.3 43 8.2 138 26.4 465 88.9 41 7.8 Honduran 428 0.6 10 2.3 36 8.4 37 8.7 289 69.1 282 66.4 27 6.3 100 23.4 364 85.4 30 7.0 Native American 405 0.6 6 1.5 23 5.7 33 8.2 274 77.2 290 72.7 28 6.9 134 33.1 321 79.3 25 6.2 Colombian 389 0.6 --7 --7 10 2.6 24 6.2 266 75.4 298 77.4 36 9.3 122 31.4 351 90.5 20 5.1 Korean 352 0.5 0 0.0 --7 --7 29 8.2 262 86.8 291 83.1 28 8.0 105 29.8 332 94.6 36 10.2 NOTE: All percentages are calculated based on only those births with known values for the characteristic(s) of interest, unless otherwise stated. Since 2009, certain ancestry groups were combined: Lebanese, Iranian, Israeli, and Other Middle Eastern ancestries were combined into “Middle Eastern”; and Nigerian and Other African were combined into “African.” 1. In the column “Births,” percentages are based on column total (state total of births, including births for which maternal ethnicity is unknown and other). For all other categories, percentages are based on row totals. 2. Low birthweight: less than 2,500 grams or 5.5 pounds. 3. Based on Adequacy of Prenatal Care Utilization (APNCU) Index. Does not include data from Newton Wellesley, Saint Vincent and Winchester hospitals because of reporting problems. 4. Late preterm: 34-36 weeks gestation. 5. Infant was being breastfed during the hospital stay. 6. Gestational diabetes is defined as glucose intolerance found during pregnancy for the first time. It excludes cases with pre-existing diabetes. 7. Calculations based on 1-4 events are excluded.

13
Figure 1. Trends in the Number of Births by Mother’s Age Group, Massachusetts: 1981-2017
Ages < 30
Ages 30+
0
10,000
20,000
30,000
40,000
50,000
60,000
1981198219831984198519861987198819891990199119921993199419951996199719981999200020012002200320042005200620072008200920102011201220132014201520162017
Num
ber o
f Birt
hs
Year
14
Table 4. Trends in Number and Percent Distribution of Births by Plurality and Maternal
Age, Massachusetts: 2003-2017
Singletons Multiples1 Total births2
Age Group
Twins Triplets or more Total Multiples
Year
n
%
n
%
n
%
n
%
n
% All Ages 2003 76,367 95.3 3,551 4.4 249 0.3 3,800 4.7 80,167 100.0 2004 74,677 95.2 3,538 4.5 245 0.3 3,783 4.8 78,460 100.0 2005 73,258 95.4 3,375 4.4 190 0.2 3,565 4.6 76,824 100.0 2006 74,146 95.5 3,375 4.3 149 0.2 3,524 4.5 77,670 100.0 2007 74,498 95.6 3,310 4.2 126 0.2 3,436 4.4 77,934 100.0 2008 73,475 95.5 3,365 4.4 129 0.2 3,494 4.5 76,969 100.0
2009 71,423 95.3 3,386 4.5 157 0.2 3,543 4.7 74,966 100.0 2010 69,508 95.4 3,220 4.4 107 0.1 3,327 4.6 72,835 100.0 2011 69,933 95.6 3,135 4.3 100 0.1 3,235 4.4 73,169 100.0 2012 69,272 95.6 3,093 4.3 90 0.1 3,183 4.4 72,457 100.0 2013 68,363 95.5 3,164 4.4 91 0.1 3,255 4.5 71,618 100.0 2014 68,800 95.7 2,984 4.2 83 0.1 3,067 4.3 71,867 100.0 2015 68,756 96.2 2,671 3.7 57 0.1 2,728 3.8 71,484 100.0 2016 68,660 96.3 2,569 3.6 90 0.1 2,659 3.7 71,319 100.0 2017 68,134
96.4
2,523 3.6 47 0.1 2,570 3.6 70,704 100.0
Ages <35 2003 59,347 95.9 2,389 3.9 118 0.2 2,507 4.1 61,854 100.0 2004 57,618 96.0 2,229 3.7 142 0.2 2,371 4.0 59,989 100.0 2005 56,380 96.3 2,086 3.6 102 0.2 2,188 3.7 58,569 100.0 2006 57,237 96.3 2,116 3.6 89 0.1 2,205 3.7 59,442 100.0 2007 57,977 96.3 2,144 3.6 87 0.1 2,231 3.7 60,208 100.0 2008 57,080 96.3 2,111 3.6 78 0.1 2,189 3.7 59,269 100.0 2009 55,906 96.1 2,202 3.8 80 0.1 2,282 3.9 58,188 100.0 2010 54,369 96.3 2,018 3.6 58 0.1 2,076 3.7 56,445 100.0 2011 54,837 96.4 2,014 3.5 59 0.1 2,073 3.6 56,910 100.0 2012 54,069 96.4 1,961 3.5 57 0.1 2,018 3.6 56,089 100.0 2013 52,995 96.2 2,025 3.7 54 0.1 2,079 3.8 55,074 100.0 2014 53,166 96.5 1,890 3.4 50 0.1 1,940 3.5 55,106 100.0 2015 52,640 96.9 1,665 3.1 45 0.1 1,710 3.1 54,350 100.0 2016 52,043 96.9 1,601 3.0 47 0.1 1,648 3.1 53,691 100.0 2017 51,258 96.8 1,653 3.1 18 0.0 1,671 3.2 52,929 100.0 Ages 35+ 2003 17,015 92.9 1,162 6.3 131 0.7 1,293 7.1 18,308 100.0 2004 17,055 92.4 1,309 7.1 103 0.6 1,412 7.6 18,467 100.0 2005 16,874 92.5 1,289 7.1 88 0.5 1,377 7.5 18,251 100.0 2006 16,901 92.8 1,257 6.9 60 0.3 1,317 7.2 18,218 100.0 2007 16,519 93.2 1,166 6.6 39 0.2 1,205 6.8 17,724 100.0 2008 16,392 92.6 1,254 7.1 51 0.3 1,305 7.4 17,697 100.0 2009 15,513 92.5 1,184 7.1 77 0.5 1,261 7.5 16,774 100.0 2010 15,136 92.4 1,200 7.3 49 0.3 1,249 7.6 16,385 100.0 2011 15,092 92.8 1,121 6.9 41 0.3 1,162 7.1 16,255 100.0 2012 15,202 92.9 1,132 6.9 33 0.2 1,165 7.1 16,367 100.0 2013 15,367 92.9 1,139 6.9 37 0.2 1,176 7.1 16,543 100.0
2014 15,634 93.3 1,094 6.5 33 0.2 1,127 6.7 16,761 100.0 2015 16,115 94.1 1,005 5.9 12 0.1 1,017 5.9 17,132 100.0 2016 16,617 94.3 968 5.5 43 0.2 1,011 5.7 17,628 100.0 2017 16,875 94.9 870 4.9 29 0.2 899 5.1 17,774 100.0
1. Numbers of multiples (n) represent individual infants rather than sets of infants. 2. Differences in the number of births from previous publications are the result of updated files.

15
Table 5. Summary of Selected Teen Birth Characteristics, Massachusetts: 2017
Ages 15-17 Ages 18-19 Combined Ages 15-19 N %1,2 N %1,2 N %1,2 State Total 444 25.2% 1,321 74.8% 1,765 100.0% White Non-Hispanic 99 22.7% 409 31.6% 508 29.3% Black Non-Hispanic 64 14.6% 159 12.3% 223 12.9% Asian Non-Hispanic 10 2.3% 20 1.5% 30 1.7% Hispanic 258 59.0% 688 53.2% 946 54.7% Other Non-Hispanic 6 1.4% 18 1.4% 24 1.4% Birthplace US States / D.C. 291 65.5% 897 67.9% 1,188 67.3% Puerto Rico / US Terr. 42 9.5% 119 9.0% 161 9.1% Non-US-born 111 25.0% 305 23.1% 416 23.6% Prenatal Care Funding Public 373 85.4% 1,063 81.5% 1,436 82.4% Private, other 64 14.6% 242 18.5% 306 17.6%
Pregnancy-Related Factors Adequacy of Prenatal Care3 Adequate Total4 247 55.6% 866 65.6% 1,113 63.1% Adequate Intensive 131 29.5% 438 33.2% 569 32.2% Adequate Basic 116 26.1% 428 32.4% 544 30.8% Intermediate 46 10.4% 137 10.4% 183 10.4% Inadequate/None 146 32.9% 279 21.1% 425 24.1% Unknown 5 1.1% 39 3.0% 44 2.5% Parity5
1 419 94.4% 1,141 86.4% 1,560 88.4% 2 24 5.4% 152 11.5% 176 10.0%
3+ --6 --6 27 2.0% 28 1.6% Smoking during Pregnancy
Yes 13 3.0% 96 7.6% 109 6.4% No 421 97.0% 1,165 92.4% 1,586 93.6%
Birth Outcomes Birthweight < 500 g 0 0.0% --6 --6 --6 --6 500-1,499 g 9 2.0% 20 1.5% 29 1.6% 1,500-2,499 g 41 9.2% 102 7.7% 143 8.1% LBW (<2,499 g) 50 11.3% 123 9.3% 173 9.8% 2,500-3,999 g 372 83.8% 1,118 84.8% 1,490 84.6% 4000+ g 22 5.0% 77 5.8% 99 5.6% Gestational Age < 28 weeks 5 1.1% 8 0.6% 13 0.7% Preterm (< 37 weeks) 41 9.3% 120 9.1% 161 9.1% 37-42 weeks 402 90.7% 1,200 90.9% 1,602 90.9% Plurality Singleton 436 98.2% 1,305 98.8% 1,741 98.6% Multiple birth 8 1.8% 16 1.2% 24 1.4% NOTE: All percentages are calculated based on only those births with known values for the characteristic(s) of interest, unless otherwise stated. 1. For state total row, percentages are based on total births to females ages 15-19. For the rest of the table, percentages are based on births for a given age group and characteristic. 2. Percentages are based on state total of the age group. 3. Based on Adequacy of Prenatal Care Utilization (APNCU) Index. Does not include data from Newton Wellesley, Saint Vincent, and Winchester hospitals because of reporting problems. 4. Adequate Total = Adequate Basic + Adequate Intensive. 5. Number of live births including the current birth. 6. Calculations based on 1-4 events are excluded.
16
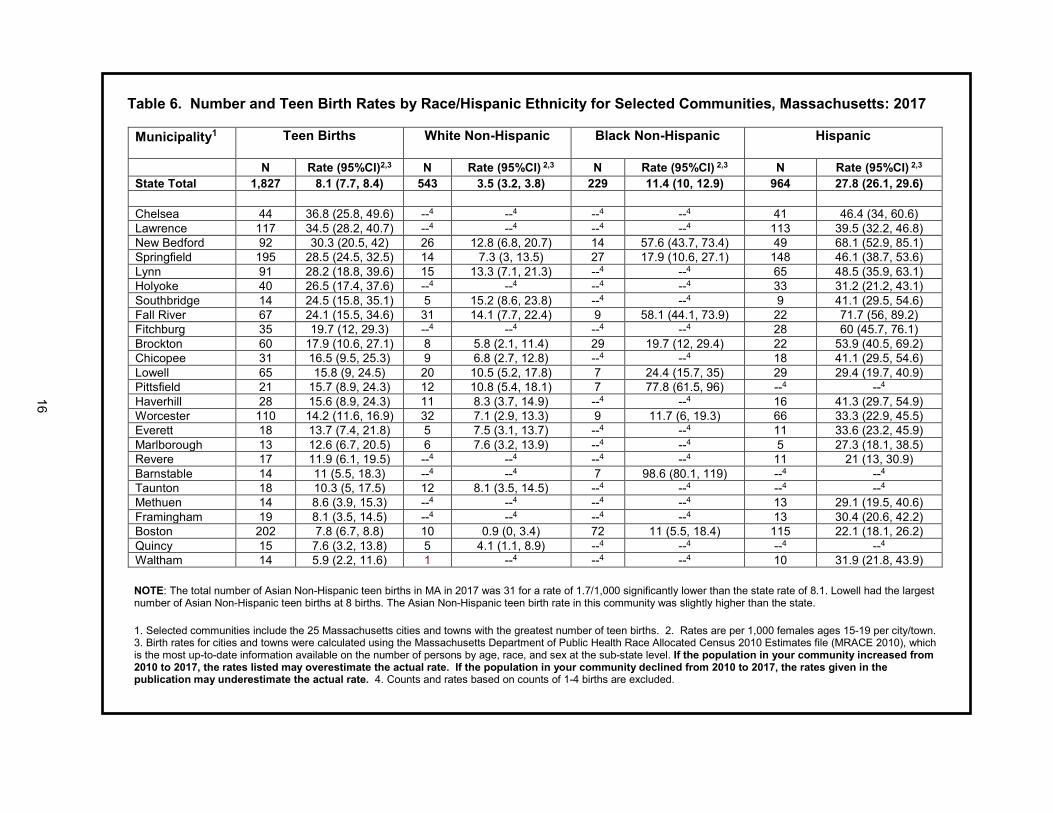
Table 6. Number and Teen Birth Rates by Race/Hispanic Ethnicity for Selected Communities, Massachusetts: 2017
Municipality1 Teen Births
White Non-Hispanic
Black Non-Hispanic
Hispanic
N Rate (95%CI)2,3 N Rate (95%CI) 2,3 N Rate (95%CI) 2,3 N Rate (95%CI) 2,3 State Total 1,827 8.1 (7.7, 8.4) 543 3.5 (3.2, 3.8) 229 11.4 (10, 12.9) 964 27.8 (26.1, 29.6) Chelsea 44 36.8 (25.8, 49.6) --4 --4 --4 --4 41 46.4 (34, 60.6) Lawrence 117 34.5 (28.2, 40.7) --4 --4 --4 --4 113 39.5 (32.2, 46.8) New Bedford 92 30.3 (20.5, 42) 26 12.8 (6.8, 20.7) 14 57.6 (43.7, 73.4) 49 68.1 (52.9, 85.1) Springfield 195 28.5 (24.5, 32.5) 14 7.3 (3, 13.5) 27 17.9 (10.6, 27.1) 148 46.1 (38.7, 53.6) Lynn 91 28.2 (18.8, 39.6) 15 13.3 (7.1, 21.3) --4 --4 65 48.5 (35.9, 63.1) Holyoke 40 26.5 (17.4, 37.6) --4 --4 --4 --4 33 31.2 (21.2, 43.1) Southbridge 14 24.5 (15.8, 35.1) 5 15.2 (8.6, 23.8) --4 --4 9 41.1 (29.5, 54.6) Fall River 67 24.1 (15.5, 34.6) 31 14.1 (7.7, 22.4) 9 58.1 (44.1, 73.9) 22 71.7 (56, 89.2) Fitchburg 35 19.7 (12, 29.3) --4 --4 --4 --4 28 60 (45.7, 76.1) Brockton 60 17.9 (10.6, 27.1) 8 5.8 (2.1, 11.4) 29 19.7 (12, 29.4) 22 53.9 (40.5, 69.2) Chicopee 31 16.5 (9.5, 25.3) 9 6.8 (2.7, 12.8) --4 --4 18 41.1 (29.5, 54.6) Lowell 65 15.8 (9, 24.5) 20 10.5 (5.2, 17.8) 7 24.4 (15.7, 35) 29 29.4 (19.7, 40.9) Pittsfield 21 15.7 (8.9, 24.3) 12 10.8 (5.4, 18.1) 7 77.8 (61.5, 96) --4 --4 Haverhill 28 15.6 (8.9, 24.3) 11 8.3 (3.7, 14.9) --4 --4 16 41.3 (29.7, 54.9) Worcester 110 14.2 (11.6, 16.9) 32 7.1 (2.9, 13.3) 9 11.7 (6, 19.3) 66 33.3 (22.9, 45.5) Everett 18 13.7 (7.4, 21.8) 5 7.5 (3.1, 13.7) --4 --4 11 33.6 (23.2, 45.9) Marlborough 13 12.6 (6.7, 20.5) 6 7.6 (3.2, 13.9) --4 --4 5 27.3 (18.1, 38.5) Revere 17 11.9 (6.1, 19.5) --4 --4 --4 --4 11 21 (13, 30.9) Barnstable 14 11 (5.5, 18.3) --4 --4 7 98.6 (80.1, 119) --4 --4 Taunton 18 10.3 (5, 17.5) 12 8.1 (3.5, 14.5) --4 --4 --4 --4 Methuen 14 8.6 (3.9, 15.3) --4 --4 --4 --4 13 29.1 (19.5, 40.6) Framingham 19 8.1 (3.5, 14.5) --4 --4 --4 --4 13 30.4 (20.6, 42.2) Boston 202 7.8 (6.7, 8.8) 10 0.9 (0, 3.4) 72 11 (5.5, 18.4) 115 22.1 (18.1, 26.2) Quincy 15 7.6 (3.2, 13.8) 5 4.1 (1.1, 8.9) --4 --4 --4 --4 Waltham 14 5.9 (2.2, 11.6) 1 --4 --4 --4 10 31.9 (21.8, 43.9)
NOTE: The total number of Asian Non-Hispanic teen births in MA in 2017 was 31 for a rate of 1.7/1,000 significantly lower than the state rate of 8.1. Lowell had the largest number of Asian Non-Hispanic teen births at 8 births. The Asian Non-Hispanic teen birth rate in this community was slightly higher than the state. 1. Selected communities include the 25 Massachusetts cities and towns with the greatest number of teen births. 2. Rates are per 1,000 females ages 15-19 per city/town. 3. Birth rates for cities and towns were calculated using the Massachusetts Department of Public Health Race Allocated Census 2010 Estimates file (MRACE 2010), which is the most up-to-date information available on the number of persons by age, race, and sex at the sub-state level. If the population in your community increased from 2010 to 2017, the rates listed may overestimate the actual rate. If the population in your community declined from 2010 to 2017, the rates given in the publication may underestimate the actual rate. 4. Counts and rates based on counts of 1-4 births are excluded.

17
Table 7. Trends in Teen Birth Rates for Selected Communities, Ranked by 2017 Teen Birth Rate,
Massachusetts: 2007, 2016-2017
2017 Rank Municipality1
2007 2016 2017
Number of Teen Births
Teen Birth Rate2
Number of Teen Births
Teen Birth Rate2,3
Number of Teen Births
Teen Birth Rate2,3
State Total 4,944 22.0 1,931 8.5 1,827 8.1 1 Chelsea 82 82.0 39 32.6 44 36.8 2 Lawrence 230 76.0 117 34.5 117 34.5 3 New Bedford 197 66.7 96 31.6 92 30.3 4 Springfield 512 84.3 172 25.2 195 28.5 5 Lynn 175 56.7 94 29.2 91 28.2 6 Holyoke 144 95.4 48 31.9 40 26.5 7 Southbridge 43 77.1 17 29.8 14 24.5 8 Fall River 167 59.0 70 25.2 67 24.1 9 Fitchburg 71 45.4 42 23.6 35 19.7 10 Brockton 171 47.0 82 24.4 60 17.9 11 Chicopee 76 43.7 26 13.8 31 16.5 12 Lowell 244 80.6 54 13.1 65 15.8 13 Pittsfield 215 54.2 23 17.2 21 15.7 14 Haverhill 67 35.1 31 17.3 28 15.6 15 Worcester 251 35.7 102 13.2 110 14.2 16 Everett 43 40.6 25 19.0 18 13.7 17 Marlborough4 22 24.9 23 22.4 13 12.6 18 Revere 48 45.6 20 13.9 17 11.9 19 Barnstable4 26 19.3 12 9.4 14 11.0 20 Taunton 55 33.7 23 13.2 18 10.3 21 Methuen 39 29.4 15 9.2 14 8.6 22 Framingham 40 20.5 19 8.1 19 8.1 23 Boston 588 29.7 198 7.6 202 7.8 24 Quincy 38 18.3 12 6.0 15 7.6 25 Waltham4 31 13.5 14 5.9 14 5.9 1. Selected communities include the 25 Massachusetts cities and towns with the greatest number of teen births in 2017. Ranking is by 2017 teen birth rate. 2. Rates are per 1,000 females ages 15-19 per city/town. 3. Birth rates for cities and towns were calculated using the Massachusetts Department of Public Health Race Allocated Census 2010 Estimates file (MRACE 2010), which is the most up-to-date information available on the number of persons by age, race, and sex at the sub-state level. If the population in your community increased from 2010 to 2017, the rates listed may overestimate the actual rate. If the population in your community declined from 2010 to 2017, the rates given in the publication may underestimate the actual rate. 4. Birth rates for select cities and towns were calculated using the Massachusetts Department of Public Health Race Allocated Census 2004 Estimates file (MRACE 2004), which is the most up-to-date information available prior to 2010 on the number of persons by age, race, and sex at the sub-state level.
18
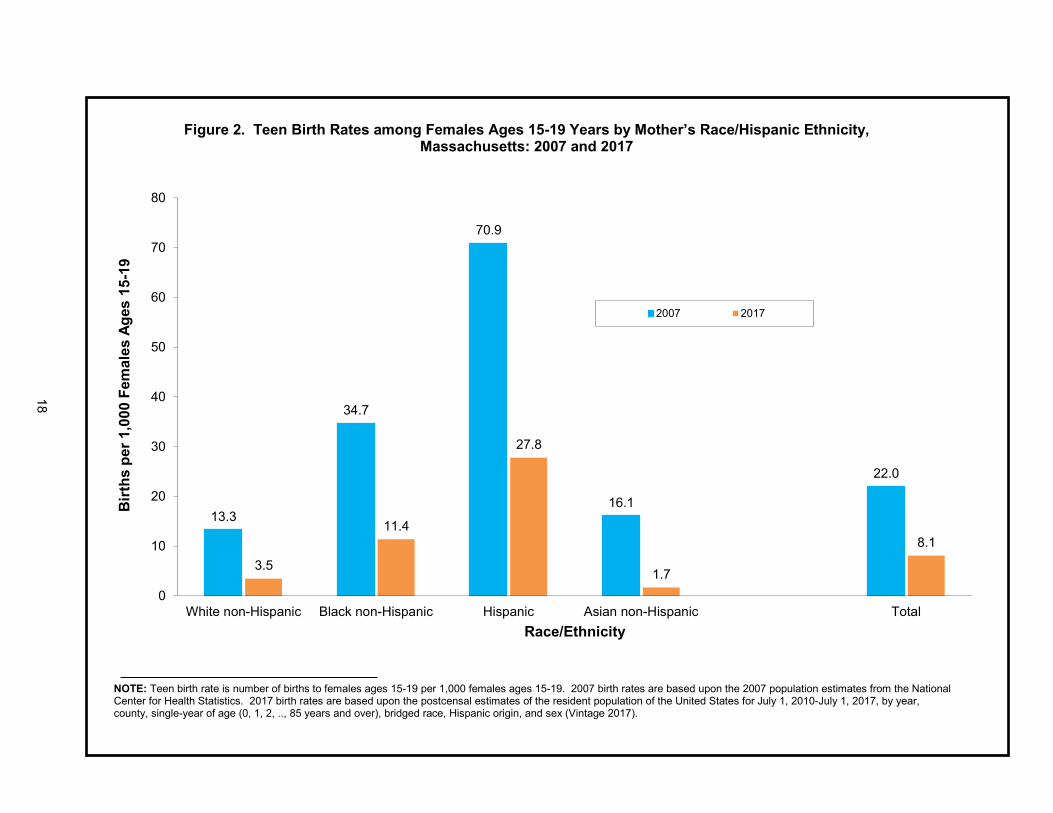
Figure 2. Teen Birth Rates among Females Ages 15-19 Years by Mother’s Race/Hispanic Ethnicity,
Massachusetts: 2007 and 2017
13.3
34.7
70.9
16.1
22.0
3.5
11.4
27.8
1.7
8.1
0
10
20
30
40
50
60
70
80
White non-Hispanic Black non-Hispanic Hispanic Asian non-Hispanic Total
Birt
hs p
er 1
,000
Fem
ales
Age
s 15
-19
Race/Ethnicity
2007 2017
NOTE: Teen birth rate is number of births to females ages 15-19 per 1,000 females ages 15-19. 2007 birth rates are based upon the 2007 population estimates from the National Center for Health Statistics. 2017 birth rates are based upon the postcensal estimates of the resident population of the United States for July 1, 2010-July 1, 2017, by year, county, single-year of age (0, 1, 2, .., 85 years and over), bridged race, Hispanic origin, and sex (Vintage 2017).

19
Table 8. Births by Birthweight, Race/Hispanic Ethnicity, Massachusetts: 2017
Birthweight
Total
White Non- Hispanic
Black Non- Hispanic
Hispanic
Asian Non- Hispanic
Other Non- Hispanic
Unknown Race/Ethnicity
(in grams) n %1 n %1 n %1 n %1 n %1 n %1 n %1 State Total 70,704 100.0 40,989 100.0 7,251 100.0 13,516 100.0 6,338 100.0 684 100.0 1,926 100.0 <500 73 0.1 22 0.1 19 0.3 23 0.2 --2 --2 --2 --2 5 0.3 500-999 257 0.4 112 0.3 62 0.9 64 0.5 8 0.1 --2 --2 10 0.5 1,000-1,499 444 0.6 199 0.5 83 1.1 98 0.7 28 0.4 9 1.3 27 1.4 1,500-1,999 1,039 1.5 525 1.3 142 2.0 220 1.6 100 1.6 10 1.5 42 2.2 2,000-2,499 3,448 4.9 1,707 4.2 462 6.4 740 5.5 386 6.1 37 5.4 116 6.2 2,500-2,999 12,447 17.6 6,216 15.2 1,566 21.6 2,700 20.0 1,492 23.6 134 19.6 339 18.1 3,000-3,499 26,667 37.8 15,042 36.8 2,674 36.9 5,390 39.9 2,608 41.2 260 38.1 693 37.1 3,500-3,999 19,722 27.9 12,554 30.7 1,707 23.6 3,392 25.1 1,415 22.3 187 27.4 467 25.0 4,000-4,499 5,603 7.9 3,963 9.7 431 6.0 759 5.6 261 4.1 37 5.4 152 8.1 4,500-4,999 794 1.1 556 1.4 77 1.1 106 0.8 31 0.5 8 1.2 16 0.9 >=5,000 74 0.1 47 0.1 15 0.2 8 0.1 --2 --2 --2 --2 --2 --2 Unknown birthweight 136 0.2 46 0.1 13 0.2 16 0.1 --2 --2 --2 --2 56 2.9
VLBW3
(0-1,499 g) 774 1.1 333 0.8 164 2.3 185 1.4 40 0.6 10 1.5 42 2.2
LBW4 (0-2,499 g) 5,261 7.5 2,565 6.3 768 10.6 1,145 8.5 526 8.3 57 8.3 200 10.7
NOTE: Percentages for detailed birthweight rows (“<500” through “Unknown birthweight”) are calculated based on births including those with unknown birthweight. Percentages for VLBW
and LBW rows are calculated based on births with known birthweight only.
1. Percentages are based on column totals. 2. Calculations based on values of 1-4 are excluded. 3. Very Low Birthweight (VLBW): less than 1,500 grams (3.3 lbs.). 4. Low Birthweight (LBW): less than 2,500 grams (5.5 lbs.).

20
Table 9. Low Birthweight by Plurality and Maternal Age, Massachusetts: 2007-2017
Maternal
Age Group (years)
Year Singleton Multiples Total Births Twin Triplets or more Total Multiples
VLBW1 LBW2 VLBW1 LBW2 VLBW1 LBW2 VLBW1 LBW2 VLBW1 LBW2
n % n % n % n % n % n % n % n % n % n % All Ages 2007 693 0.9 4,258 5.7 306 9.2 1,772 53.6 54 42.9 117 92.9 360 10.5 1,889 55.0 1,053 1.4 6,147 7.9 2008 627 0.9 4,039 5.5 324 9.7 1,803 53.8 55 42.6 113 87.6 379 10.9 1,916 55.1 1,006 1.3 5,955 7.8 2009 677 1.0 3,886 5.5 276 8.2 1,771 52.7 61 38.9 147 93.6 337 9.6 1,918 54.5 1,014 1.4 5,804 7.8 2010 643 0.9 3,882 5.6 288 8.9 1,668 51.8 30 28.8 100 96.2 318 9.6 1,768 53.2 961 1.3 5,650 7.8 2011 629 0.9 3,824 5.6 286 9.2 1,541 49.8 41 41.0 93 93.0 327 10.2 1,634 51.2 956 1.3 5,458 7.6 2012 585 0.8 3,810 5.5 252 8.2 1,592 51.6 41 45.6 89 98.9 300 7.5 1,731 43.5 878 1.2 5,491 7.6 2013 596 0.9 3,727 5.5 318 10.1 1,686 53.5 23 25.8 82 92.1 351 8.6 1,825 45.0 937 1.3 5,495 7.7 2014 605 0.9 3,690 5.4 270 9.1 1,624 54.5 19 22.9 80 96.4 297 7.6 1,763 45.2 894 1.2 5,394 7.5 2015 627 0.9 3,849 5.6 219 8.2 1,419 53.4 19 34.5 53 96.4 241 6.8 1,528 43.2 865 1.2 5,321 7.5 2016 596 0.9 3,904 5.7 208 8.1 1,351 52.7 38 42.2 86 95.6 258 6.8 1,514 39.7 842 1.2 5,341 7.5 2017 575 0.8 3,878 5.7 183 7.3 1,342 53.4 16 34 41 87.2 206 5.9 1,443 41.2 774 1.1 5,261 7.5
Ages < 35 2007 533 0.9 3,317 5.7 223 10.4 1,191 55.6 45 51.7 85 97.7 268 12.0 1,276 57.2 801 1.3 4,593 7.6 2008 492 0.9 3,134 5.5 218 10.4 1,181 56.2 34 43.6 70 89.7 252 11.6 1,251 57.4 744 1.3 4,385 7.4 2009 525 0.9 3,093 5.6 174 7.9 1,187 54.2 36 45.0 76 95.0 210 9.2 1,263 55.6 735 1.3 4,356 7.5 2010 489 0.9 3,071 5.7 206 10.2 1,059 52.5 22 40.0 51 92.7 228 11.0 1,110 53.5 717 1.3 4,181 7.4 2011 475 0.9 2,964 5.5 189 9.5 1,034 52.0 31 52.5 54 91.5 220 10.8 1,088 53.2 695 1.2 4,052 7.2 2012 437 0.8 2,964 5.5 185 9.5 1,066 54.6 34 59.6 57 100 226 8.4 1,168 43.5 656 1.2 4,087 7.3 2013 433 0.8 2,852 5.4 225 11.2 1,101 54.6 17 32.7 48 92.3 250 9.1 1,202 43.7 675 1.2 4,001 7.3 2014 460 0.9 2,828 5.3 186 9.8 1,076 57.0 14 28.0 48 96.0 207 7.9 1,173 44.7 660 1.2 3,952 7.2
2015 476 0.9 2,922 5.6 142 8.6 902 54.5 16 36.4 43 97.7 160 6.7 990 41.8 634 1.2 3,867 7.1 2016 443 0.9 2,952 5.7 145 9.1 865 54.1 22 46.8 47 100.0 178 6.9 977 37.8 610 1.1 3,864 7.2 2017 446 0.9 2,920 5.7 122 7.4 924 56.1 3 16.7 14 77.8 132 5.4 992 40.9 571 1.1 3,858 7.3
Ages 35+ 2007 160 1.0 941 5.7 83 7.1 581 49.8 9 23.1 32 82.1 92 7.6 613 50.9 252 1.4 1,554 8.8 2008 135 0.8 905 5.6 106 8.5 622 49.8 21 41.2 43 84.3 127 9.8 665 51.2 262 1.5 1,570 8.9 2009 152 1.0 792 5.1 102 8.7 584 49.9 25 32.5 71 92.2 127 10.2 655 52.5 279 1.7 1,447 8.7 2010 154 1.0 810 5.4 82 6.8 609 50.8 8 16.3 49 100 90 7.2 658 52.8 244 1.5 1,468 9.0 2011 154 1.0 860 5.8 97 8.8 507 45.9 10 24.4 39 95.1 107 9.3 546 47.6 261 1.6 1,406 8.8 2012 148 1.0 846 5.6 67 5.9 526 46.5 7 21.2 32 97.0 74 5.7 563 43.5 222 1.4 1,404 8.6 2013 163 1.1 875 5.7 93 8.2 585 51.6 6 16.2 34 91.9 101 7.7 623 47.6 262 1.6 1,494 9.1 2014 145 0.9 862 5.5 84 7.7 548 50.2 5 15.2 32 97.0 90 7.1 590 46.3 234 1.4 1,442 8.6 2015 151 0.9 927 5.8 77 7.7 517 51.7 3 27.3 10 90.9 81 7.0 538 46.3 231 1.4 1,454 8.5 2016 153 0.9 952 5.7 63 6.5 486 50.3 16 37.2 39 90.7 80 6.5 537 43.8 232 1.3 1,477 8.4 2017 129 0.8 958 5.7 61 7 418 48.3 13 44.8 27 93.1 74 6.9 451 41.8 203 1.1 1,403 7.9
NOTE: Very Low Birthweight (VLBW) births are a subset of Low Birthweight (LBW) births. All percentages are calculated based on only those births with known values for the characteristic(s) of interest, unless otherwise stated. 1. Very Low Birthweight (VLBW): less than 1,500 grams (3.3 lbs.). 2. Low Birthweight (LBW): less than 2,500 grams (5.5 lbs.).

21
Table 10. Births by Gestational Age, Race/Hispanic Ethnicity, Massachusetts: 2017
Gestational Age1 (weeks completed)
Total White Non-Hispanic
Black Non-Hispanic
Hispanic Asian Non-Hispanic
Other Non-Hispanic3
Unknown
n %2 n %2 n %2 n %2 n %2 n %2 n State Total 70,704 100.0 40,989 100.0 7,251 100.0 13,516 100.0 6,338 100.0 684 100.0 1,926
<20 10 0.01 --4 --4 --4 --4 --4 --4 --4 --4 0 0.0 2
20-23 82 0.12 28 0.1 27 0.4 23 0.2 --4 --4 0 0.0 3 24-27 248 0.32 117 0.3 52 0.7 59 0.4 10 0.2 --4 --4 7 28-31 546 0.71 266 0.6 91 1.3 119 0.9 31 0.5 9 1.3 30 32-33 706 0.91 337 0.8 91 1.3 171 1.3 61 1.0 7 1.0 39 34-36 4,680 5.74 2,536 6.2 550 7.6 971 7.2 419 6.6 52 7.6 152 37-38 16,368 21.30 8,821 21.5 1,847 25.5 3,491 25.8 1,625 25.6 154 22.6 430
39 23,796 19.07 13,817 33.7 2,278 31.4 4,644 34.4 2,275 35.9 240 35.2 542 40 16,537 14.09 10,148 24.8 1,598 22.0 2,808 20.8 1,383 21.8 163 23.9 437 41 7,324 4.93 4,682 11.4 687 9.5 1,198 8.9 515 8.1 52 7.6 190 42 268 0.19 193 0.5 23 0.3 27 0.2 13 0.2 --4 --4 11 43 10 0.01 6 0.0 --4 --4 0 0.0 --4 --4 0 0.0 0
44+ --4 --4 --4 --4 0 0.0 0 0.0 0 0.0 0 0.0 0
Preterm5 (<37) 6,272 8.9 3,285 8.0 812 11.2 1,347 10.0 524 8.3 71 10.4 233 Very Early6 (<28) 340 0.5 146 0.4 80 1.1 86 0.6 13 0.2 --4 --4 12
(28-33) 1,252 1.8 603 1.5 182 2.5 290 2.1 92 1.5 16 2.3 69 Late (34-36) 4,680 6.6 2,536 6.2 550 7.6 971 7.2 419 6.6 52 7.6 152
Term ( >=37 ) 64,304 91.1 37,668 92.0 6,436 88.8 12,168 90.0 5,812 91.7 610 89.6 1,610 Early Term (37-38) 16,368 23.2 8,821 21.5 1,847 25.5 3,491 25.8 1,625 25.6 154 22.6 430
(39-41) 47,657 67.4 28,647 70.0 4,563 63.0 8,650 64.0 4,173 65.9 455 66.8 1,169 (>=42) 279 0.4 200 0.5 26 0.4 27 0.2 14 0.2 --4 --4 11
Unknown7 128 36 --4 --4 --4 --4 83
NOTE: Percentages are calculated based on births with known gestational age only.
1. A clinical estimate of the number of weeks of pregnancy completed; as estimated by the attendant at birth or the postnatal physician. 2. Percentages are based on column total. 3. Other races include American Indian and others not specified. 4. Calculations based on values of 1-4 are excluded. 5. Also known as early gestational age, premature delivery, or preterm delivery. 6. Also known as extremely premature delivery or extremely preterm delivery. 7. Estimate of gestational age not provided and excluded from percentage calculations.

22
Table 11. Percent Preterm and Term Births by Gestational Age Category, Massachusetts: 2001-2017
Preterm1
Term2
Year
Very Early Preterm (<28
wks)
Moderate Preterm (28-
33 wks)
Late Preterm (34-
36 wks) Early Term (37-38 wks)
Full Term (37+ wks)
2001 0.6 1.9 5.5 18.8 92.0 2002 0.6 1.9 5.9 20.0 91.5 2003 0.7 2.1 6.0 20.8 91.3 2004 0.6 2.2 6.4 22.3 90.8 2005 0.6 2.1 6.3 22.3 91.0 2006 0.6 2.0 6.3 22.7 91.0 2007 0.6 2.0 6.4 22.6 91.0 2008 0.6 2.0 6.2 22.6 91.2 2009 0.7 1.9 6.2 20.8 91.3 2010 0.6 2.0 6.0 21.1 91.4 2011 0.6 1.9 5.9 21.8 91.6 2012 0.6 1.7 6.2 21.5 91.4 2013 0.6 1.9 6.3 21.0 91.2 2014 0.6 1.9 6.1 21.7 91.4 2015 0.6 1.8 6.0 22.5 91.6 2016 0.6 1.8 6.3 22.8 91.3 2017 0.5 1.8 6.6 23.2 91.1
1. Also known as early gestational age, premature delivery, or preterm delivery. Preterm: <37 weeks gestation. 2. Full term and early term are not mutually exclusive.

23
Figure 3. Trends in Adequacy of Prenatal Care2,3 by Race/Hispanic Ethnicity, Massachusetts: 1997-2017
85.7
88.2
84.6
87.2
84.2
72.5
76.0
77.7
68.8
72.7
79.0
76.1
81.6
75.6
79.1
79.3
81.9
82.9
85.2
82.180.3
50
55
60
65
70
75
80
85
90
95
100
1997 1998 1999 2000 2001 2002 2003 2004 2005 2006 2007 2008 2009 2010 2011 2012 2013 2014 2015 2016 2017
Perc
ent o
f Liv
e Bi
rths
with
Ade
quat
e Pr
enat
al C
are
1
Year
White non-Hispanic
Black non-Hispanic
Hispanic
Asian non-Hispanic
Massachusetts
NOTE: FOR PURPOSES OF VISUAL REPRESENTATION THE VERTICAL SCALE OF GRAPH REPRESENTS A SMALL INTERVAL (from 50% to 100%). 1. All percentages are calculated based on only those births with known values for the characteristic(s) of interest, unless otherwise stated. 2. Adequacy of Prenatal Care Utilization (APNCU) Index is an assessment of the timing and number of prenatal care visits and not an evaluation of the quality of care delivered. Years 2011 and 2012 do not include data from Metro West, Newton Wellesley, Saint Vincent and Winchester hospitals because of reporting problems. Years 2013 - 2017 do not include data from Newton Wellesley, Saint Vincent and Winchester hospitals because of reporting problems. 3. Please use caution in interpreting this figure. The birth facility is responsible for collecting prenatal care data reported on the birth certificate. If prenatal care was obtained at a different location, the birth facility may be unable to obtain complete prenatal care data. Missing prenatal care data will impact the APNCU Index.

24
Figure 4. Adequacy of Prenatal Care by Selected Maternal Characteristics, Massachusetts: 2017
56.0%
66.7%
69.7%
74.2%
74.6%
81.3%
81.2%
83.7%
87.1%
86.7%
80.5%
0% 10% 20% 30% 40% 50% 60% 70% 80% 90% 100%
Younger Teens (<18 yrs)
Smokers
Education (< 12 yrs)
Unmarried
Non-U.S.-born
First-time Mothers
Breastfeeding
Mothers Age 35+
Multiple Birth
More than a College Degree
State Total
Percent of Mothers with Adequate Prenatal Care
1
4
2
3
NOTE: All percentages are calculated based on the Adequacy of Prenatal Care Utilization (APNCU) Index. Does not include data from Newton Wellesley, Saint Vincent and Winchester hospitals because of reporting problems. Characteristics of interest are not mutually exclusive, except as noted. 1. Women 20 years of age and older. 2. Marital status at time of birth. 3. Non-US-born includes women born outside of the 50 U.S. states, District of Columbia, and U.S. territories (Puerto Rico, U.S. Virgin Islands, Guam). 4. Infant was being breastfed during the hospital stay.

25
Figure 5. Distribution of Prenatal Care Payment Source, Massachusetts: 2017
Other0.7%
Private60.1%
Public39.2%
NOTE: Sources of Prenatal Care Payment include private: Commercial indemnity plan, commercial managed care (HMO, PPO, IPP, IPA, and other), or other private insurance; public: Government programs including CommonHealth, Healthy Start, Medicaid/MassHealth, and Medicare (may also be HMO or managed care), or free care; and other: self-pay.

26
Table 12. Resident Birth Characteristics, 30 Largest Municipalities, Massachusetts: 2017
Mother's Race/Ethnicity Birthweight Gestational
Municipality1 Rank2 Population
Crude Birth Rate3
White Non-
Hispanic
Black Non-
Hispanic
Hispanic
Asian or
Other5
Very Low
(<1500 g)
Low (<2500 g)
Diabetes
%4 %4 %4 %4 % % % STATE TOTAL 6,859,819 10.8 58.0 10.3 19.1 9.9 1.1 7.5 6.5 Arlington 30 42839 11.7 64.1 2.4 4.6 25.3 1.0 6.6 4.4 Attleboro 29 43585 11.8 75.0 5.2 10.1 8.0 1.2 9.9 6.2 Barnstable 27 45185 9.0 64.4 14.0 15.0 5.9 1.0 7.9 1.0 Boston 1 617594 12.5 36.7 23.7 24.9 9.8 1.3 8.7 4.6 Brockton 7 93802 15.7 19.8 61.3 13.6 3.5 2.0 9.2 6.2 Brookline 18 58730 10.1 59.3 3.7 6.1 25.1 0.2 6.1 4.4 Cambridge 5 105157 10.2 53.1 10.2 8.1 23.6 1.1 6.0 5.0 Chicopee 22 55295 10.5 57.3 6.6 33.7 1.7 2.1 9.2 9.5 Fall River 10 88844 12.5 62.8 9.9 19.4 7.9 0.7 9.0 8.7 Framingham 14 68314 13.8 41.3 8.9 28.7 14.4 0.7 7.8 9.7 Haverhill 15 60876 12.5 58.0 5.3 32.5 3.4 0.9 8.9 4.8 Lawrence 12 76368 19.0 6.6 2.3 89.0 1.7 1.7 8.9 5.7 Lowell 4 106517 14.1 31.8 12.0 26.8 28.6 0.9 8.5 8.4 Lynn 9 90328 17.6 20.8 11.5 53.2 9.4 1.6 7.9 5.1 Malden 17 59447 13.9 33.2 19.6 14.0 27.7 1.7 9.2 5.8 Medford 20 56171 11.9 61.9 10.2 8.7 15.8 0.8 6.5 3.9 Methuen 26 47252 11.9 47.9 4.6 42.5 4.1 0.7 7.1 5.0 New Bedford 6 95071 13.8 44.5 15.3 34.8 3.7 1.4 11.5 7.1 Newton 11 85142 8.2 64.8 4.3 5.6 21.3 1.2 6.6 8.2 Peabody 25 51253 10.8 63.5 5.2 18.7 6.7 0.5 6.5 5.4 Pittsfield 28 44728 9.5 73.3 13.1 10.3 3.3 1.6 8.7 3.3 Plymouth 19 56455 8.9 87.6 3.0 6.8 1.6 0.6 8.4 4.6 Quincy 8 92275 13.0 47.1 6.6 5.6 36.1 1.3 6.4 6.4 Revere 24 51744 15.3 37.2 7.2 39.7 11.3 0.5 5.5 5.0 Somerville 13 75748 11.1 59.8 5.8 16.3 15.5 0.7 7.5 4.6 Springfield 3 153057 13.9 19.3 20.1 55.7 4.3 1.7 10.1 7.6 Taunton 21 55869 11.2 70.2 13.4 11.2 3.2 1.6 9.8 7.8 Waltham 16 60621 12.8 50.2 9.2 23.4 15.9 1.0 6.6 6.6 Weymouth 23 53736 11.7 75.1 6.7 4.8 11.6 1.6 10.0 9.5 Worcester 2 181041 13.5 41.8 20.8 29.9 7.0 1.5 8.0 7.8

27
Table 12 (cont’d). Resident Birth Characteristics, 30 Largest Municipalities, Massachusetts: 2017
Municipality1 Adequate Prenatal Care7
Public Payment8 for
Prenatal Care Unmarried Teen Mothers
15-19 years9
% % % n Rate
STATE TOTAL 80.5 39.2 33.1 1,827 8.1
Arlington 87.1 9.5 5.4 --6 --6
Attleboro 82.3 21.8 31.8 7 5.2 Barnstable 71.3 59.5 42.0 14 11.0 Boston 77.6 44.9 37.1 202 7.8 Brockton 70.4 72.2 56.4 60 17.9 Brookline 82.9 8.1 5.9 --6 --6
Cambridge 83.5 18.1 11.7 5 1.4 Chicopee 82.5 60.3 54.7 31 16.5 Fall River 76.1 59.6 62.6 67 24.1 Framingham 54.2 49.5 28.0 19 8.1 Haverhill 80.0 50.3 47.9 28 15.6 Lawrence 74.7 85.0 62.4 117 34.5 Lowell 77.1 67.5 53.1 65 15.8 Lynn 72.4 69.2 51.5 91 28.2 Malden 81.5 49.6 25.1 7 4.5 Medford 87.5 22.8 16.5 6 3.6 Methuen 79.6 48.4 40.1 14 8.6 New Bedford 77.5 73.4 63.4 92 30.3 Newton 82.6 11.8 8.2 --6 --6
Peabody 84.4 33.9 30.8 6 4.3 Pittsfield 81.1 54.5 60.8 21 15.7 Plymouth 86.3 34.9 31.7 8 4.9 Quincy 83.7 36.0 22.4 15 7.6 Revere 76.4 63.0 33.4 17 11.9 Somerville 86.1 27.7 19.3 10 5.8 Springfield 78.2 79.9 68.8 195 28.5 Taunton 74.8 48.5 49.7 18 10.3 Waltham 82.9 29.8 23.2 14 5.9 Weymouth 83.5 26.1 23.8 5 3.5 Worcester 74.0 50.6 48.1 110 14.2
1. The 30 largest municipalities are the cities/ towns in Massachusetts with the largest populations. 2. Crude birth rates represent the number of births per 1,000 residents (male and female). 2. Rank is by population size. 4. For the category of Mother’s Race/Ethnicity, percentages are calculated based on the state total of resident births, including births for which mother’s race/Hispanic ethnicity is unknown. 5. Mothers who designated themselves as Non-Hispanic Asian, American Indian, or Other. 6. Counts and calculations based on 1-4 events are excluded. 7. Based on the Adequacy of Prenatal Care Utilization (APNCU) Index. The State Total does not include data from Newton Wellesley, Saint Vincent and Winchester hospitals because of reporting problems. 8. Public payment sources include CommonHealth, Healthy Start, Medicaid/MassHealth, and Medicare (may be HMO or managed care), or free care. 9. Births per 1,000 female residents ages 15-19; rates for cities and towns were calculated using MDPH population estimates for 2010.

28
Table 13. Birth Characteristics by Facility/Location, Massachusetts: 2017
Hospital(1) Location
(2)
Occurrence Births
(n)
(3)
Low Birthweight
(%)
(4)
Public Pay for
PNC (%)
(5)
Adequate Prenatal Care (%)
(6)
Early Term
(%)
(7)
Late Preterm
(%)
State Total 71,427 7.4 38.9 80.6 23.1 6.6 Anna Jaques Hospital Newburyport 684 4.5 22.6 88.1 23.0 5.4
Baystate Franklin Medical Center Greenfield 435 2.8 47.5 81.8 12.6 5.1 Baystate Medical Center Springfield 3,920 11.7 56.4 82.3 26.1 9.1 Berkshire Medical Center Pittsfield 736 7.2 47.8 82.1 18.2 5.8 Beth Israel Deaconess Hospital - Plymouth Plymouth 784 5.5 39.1 86.3 20.3 6.8
Beth Israel Deaconess Medical Center Boston 5,111 10.8 23.0 93.2 23.9 9.0
Beverly Hospital Beverly 2,249 4.7 30.2 86.3 22.2 5.7 Boston Medical Center Boston 2,883 9.2 87.8 50.9 26.1 6.9 Brigham And Women's Hospital Boston 6,403 9.6 27.0 83.4 26.7 8.3 Brockton Hospital Brockton 970 5.7 60.0 83.5 25.1 8.4 Cambridge Birth Center Cambridge 100 --8 15.0 87.0 16.0 --8 Cambridge Hospital Cambridge 1,086 4.1 67.7 82.0 23.1 3.7 Cape Cod Hospital Barnstable 828 4.1 59.5 71.3 24.2 5.9 Charlton Memorial Hospital Fall River 1,471 6.7 46.7 79.8 20.0 6.5 Cooley Dickinson Hospital Northampton 575 2.3 45.1 91.6 17.6 2.8 Emerson Hospital Concord 1,246 3.5 12.3 86.9 21.8 3.8 Fairview Hospital Great Barrington 116 --8 15.7 91.3 20.7 --8 Falmouth Hospital Falmouth 370 3.5 47.3 80.9 20.8 3.2 Good Samaritan Medical Center Brockton 1,044 5.5 74.0 60.5 23.1 5.7 Harrington Memorial Hospital Southbridge 155 3.9 61.3 91.0 13.5 --8 HealthAlliance Hospital Leominster 762 4.1 64.7 81.1 19.3 2.4 Heywood Hospital Gardner 390 4.4 54.9 80.5 20.3 3.6 Holy Family Hospital and Medical Center Methuen 1,135 4.8 52.3 78.0 18.2 4.6
Holyoke Medical Center Holyoke 463 4.8 48.1 67.0 23.1 3.9 Lawrence General Hospital Lawrence 1,441 6.4 75.6 78.4 21.7 6.2 Lowell General Hospital Lowell 2,336 6.5 54.3 81.0 25.0 7.2 Martha’s Vineyard Hospital Oak Bluffs 145 --8 57.6 90.4 17.9 --8 Massachusetts General Hospital Boston 3,789 9.4 29.1 86.5 22.4 7.2 Melrose-Wakefield Hospital Melrose 851 3.8 32.3 89.1 23.1 5.5 Mercy Medical Center Springfield 1,293 3.8 66.2 85.6 22.5 4.2 Metro West Medical Center Framingham 1,097 5.6 60.9 35.0 26.5 6.6 Milford Regional Medical Center Milford 962 5.5 38.8 91.8 22.8 4.8 Morton Hospital Taunton 273 6.2 49.8 70.3 19.8 6.6 Mt. Auburn Hospital Cambridge 2,645 3.4 17.3 83.2 17.9 4.8 Nantucket Cottage Hospital Nantucket 120 --8 58.8 77.5 27.5 --8 Newton-Wellesley Hospital9 Newton 3,772 5.3 3.8 80.9 24.0 6.0 North Shore Birth Center Beverly 84 --8 29.8 92.9 14.3 --8 North Shore Medical Center - Salem Hospital Salem 1,284 6.9 59.1 69.1 23.8 5.9
Norwood Hospital Norwood 463 4.5 28.6 79.0 25.3 3.2 Saint Vincent Hospital9 Worcester 1,769 3.2 35.6 85.2 22.5 4.6
South Shore Hospital Weymouth 3,403 6.3 22.9 85.1 21.6 6.2
St. Elizabeth's Medical Center Boston 923 15.4 37.2 81.8 25.0 9.1
St. Luke’s Hospital New Bedford 1,540 8.5 67.7 77.4 23.0 7.7

29
Table 13. Birth Characteristics by Facility/Location, Massachusetts: 2017
Hospital(1) Location
(2)
Occurrence Births
(n)
(3)
Low Birthweight
(%)
(4)
Public Pay for
PNC (%)
(5)
Adequate Prenatal Care (%)
(6)
Early Term
(%)
(7)
Late Preterm
(%)
Sturdy Memorial Hospital Attleboro 683 4.2 11.5 74.5 16.3 2.5 Tobey Hospital Wareham 406 2.7 49.3 86.4 20.7 3.5 Tufts Medical Center Boston 1,342 21.0 48.5 81.1 26.5 12.8
UMass Memorial Medical Center Worcester 4,226 10.1 35.0 76.9 24.3 7.5
Winchester Hospital9 Winchester 2,194 6.2 8.3 80.8 21.4 6.2
Other Hospitals 16 --8 55.6 50.0 --8 --8
Home, Enroute & Dr. Off. 454 7.1 31.3 65.1 20.2 3.4
NOTE: All percentages are calculated based on only those occurrence births with known values for the characteristic(s) of interest.
1. A licensed maternity facility is a medical unit licensed by the Commonwealth for the care of women during pregnancy and childbirth. 2. Occurrence births are births that occurred at the facility, regardless of where the mother was a resident. 3. Less than 2,500 grams (5.5 lbs.) 4. Public payment for prenatal care (PNC) includes Medicaid/MassHealth, CommonHealth, Medicare, Healthy Start, other government programs, and free care. 5. Based on the APNCU Index. 6. Birth at 37 or 38 weeks of gestation. 7. Birth at 34 to 36 weeks of gestation. 8. Calculations based on 1-4 events are excluded. 9. Percent should be interpreted with caution as this is a facility that was identified as having reporting problems for prenatal care.
Table 13 (cont’d). Birth Characteristics by Facility/Location, Massachusetts: 2017

28
28
Table 14. Resident Teen Birth Characteristics, 30 Largest Municipalities, Massachusetts: 2017
Municipality1
Total Population
Rank
Female Population, ages 15-19
Number of Teen Births (Ages 15-19)
Teen Birth Rate2
Mother's Race/Hispanic Ethnicity (% of teen births)
White Non-Hispanic
Black Non-Hispanic Hispanic Asian or Other
Non-Hispanic3
State Total 226,569 1,827 8.1 30.3 12.8 53.8 3.1
Arlington 30 867 --4 --4 --4 0.0 0.0 --4
Attleboro 29 1,344 7 5.2 --4 --4 --4 0.0
Barnstable 27 1,278 14 11.0 --4 50.0 --4 --4 Boston 1 25,988 202 7.8 --4 36.2 57.8 --4 Brockton 7 3,354 60 17.9 --4 48.3 36.7 --4 Brookline 18 1,469 --4 --4 --4 --4 --4 --4
Cambridge 5 3,550 5 1.4 --4 --4 --4 0.0 Chicopee 22 1,881 31 16.5 30.0 --4 60.0 --4 Fall River 10 2,781 67 24.1 46.3 13.4 32.8 7.5 Framingham 14 2,351 19 8.1 --4 --4 72.2 0.0 Haverhill 15 1,791 28 15.6 39.3 --4 57.1 --4 Lawrence 12 3,395 117 34.5 --4 --4 97.4 --4 Lowell 4 4,118 65 15.8 31.3 10.9 45.3 12.5 Lynn 9 3,223 91 28.2 17.4 --4 75.6 --4 Malden 17 1,548 7 4.5 --4 0.0 --4 0.0 Medford 20 1,683 6 3.6 --4 --4 --4 0.0 Methuen 26 1,624 14 8.6 --4 --4 92.9 --4 New Bedford 6 3,037 92 30.3 28.6 --4 53.8 --4 Newton 11 4,195 --4 --4 0.0 0.0 --4 0.0 Peabody 25 1,405 6 4.3 --4 0.0 --4 0.0 Pittsfield 28 1,339 21 15.7 57.1 33.3 --4 --4 Plymouth 19 1,641 8 4.9 62.5 --4 --4 --4 Quincy 8 1,984 15 7.6 41.7 --4 --4 --4 Revere 24 1,434 17 11.9 --4 --4 68.8 --4 Somerville 13 1,711 10 5.8 --4 0.0 50.0 --4 Springfield 3 6,836 195 28.5 7.2 13.9 76.3 2.6 Taunton 21 1,744 18 10.3 66.7 --4 --4 0.0 Waltham 16 2,356 14 5.9 --4 --4 71.4 --4 Weymouth 23 1,444 5 3.5 --4 0.0 --4 0.0 Worcester 2 7,726 110 14.2 29.4 --4 60.6 --4
30

28
29
Table 14 (cont’d). Resident Teen Birth Characteristics, 30 Largest Municipalities, Massachusetts: 2017
Municipality1
Public Payment for
Prenatal Care5 (%)
Unmarried
(%)
Low Birthweight6
(%)
Preterm7
(%)
Adequacy of Prenatal Care8 (% of teen births)
Adequate Intensive
Adequate Basic Intermediate Inadequate9
State Total 82.0 92.3 9.6 9.0 33.1 31.6 10.6 24.7 Arlington --4 --4 0.0 0.0 --4 --4 --4 --4 Attleboro 71.4 100.0 0.0 0.0 --4 --4 --4 --4 Barnstable 92.9 85.7 --4 --4 --4 --4 --4 --4 Boston 86.1 96.0 8.9 7.9 30.3 27.3 9.1 33.3 Brockton 90.0 93.3 --4 8.3 44.1 --4 --4 28.8 Brookline --4 --4 --4 --4 --4 --4 --4 --4 Cambridge --4 100.0 --4 --4 --4 --4 0.0 0.0 Chicopee 87.1 90.0 16.1 --4 44.8 17.2 20.7 17.2 Fall River 73.1 93.9 14.9 11.9 37.3 22.4 10.4 29.9 Framingham 89.5 84.2 --4 --4 31.3 --4 --4 43.8 Haverhill 60.7 100.0 --4 --4 36.0 32.0 --4 --4 Lawrence 91.4 94.0 6.9 4.3 16.5 51.3 13.9 18.3 Lowell 82.5 92.3 7.7 16.9 32.8 23.4 14.1 29.7 Lynn 88.9 89.0 8.8 6.6 31.1 21.1 12.2 35.6 Malden --4 85.7 0.0 0.0 --4 --4 0.0 --4 Medford --4 100.0 --4 --4 --4 0.0 0.0 --4 Methuen 84.6 92.9 0.0 --4 --4 50.0 --4 --4 New Bedford 91.3 94.4 17.6 12.0 36.7 32.2 15.6 15.6 Newton --4 --4 0.0 0.0 --4 0.0 0.0 --4 Peabody --4 83.3 0.0 0.0 --4 --4 0.0 0.0 Pittsfield 85.7 95.2 0.0 --4 33.3 38.1 --4 --4 Plymouth 62.5 87.5 0.0 0.0 --4 --4 --4 --4 Quincy 66.7 73.3 --4 --4 33.3 33.3 --4 --4 Revere 94.1 88.2 0.0 0.0 37.5 --4 --4 31.3 Somerville 70.0 100.0 --4 --4 --4 --4 0.0 --4 Springfield 93.3 92.2 10.3 9.7 35.4 35.4 9.5 19.6 Taunton 82.4 88.9 --4 --4 --4 33.3 --4 --4 Waltham 78.6 92.9 0.0 0.0 --4 --4 --4 41.7 Weymouth 100.0 100.0 --4 --4 --4 --4 0.0 --4 Worcester 75.0 90.9 7.3 5.5 22.4 35.3 21.2 21.2
NOTE: All percentages are calculated based on only those births with known values for the characteristic(s) of interest, unless otherwise stated. 1. The 30 largest municipalities are the cities and towns in Massachusetts with the largest populations according to the 2010 Census. 2. Birth rates represent the number of births per 1,000 females ages 15-19. Birth rates for cities and towns were calculated using MDPH population estimates for 2010. 3. Mothers who designated themselves as Non-Hispanic Asian, American Indian, or Other. 4. Counts and calculations based on values of 1-4 are excluded. 5. Government programs including CommonHealth, Healthy Start, Medicaid/MassHealth, and Medicare (may also be HMO or managed care), or free care; other: Worker's Compensation and other sources. 6. Less than 2,500 grams or 5.5 pounds. 7. Less than 37 weeks of gestational age. 8. Based on Adequacy of Prenatal Care Utilization (APNCU) Index. State total does not include data from Newton Wellesley, Saint Vincent and Winchester hospitals because of reporting problems. 9. Inadequate includes those mothers with no prenatal care.
31

32
Table 15. Adequacy of Prenatal Care Utilization: Summary and Component Indices, Massachusetts: 2017
Adequate Total1
Adequate Intensive
Adequate Basic Intermediate Inadequate Unknown
n % n % n % n % n % n Summary Index Adequacy of Prenatal Care Utilization
49,523 80.5 25,891 42.1 23,632 38.4 3,807 6.2 8,192 13.3 1,616
Component Indices
Adequacy of Initiation 53,976 87.7 19,404 31.5 34,572 56.2 3,937 6.4 3,609 5.9 1,616
Adequacy of Received Services (Visits)
55,965 91.0 31,099 50.5 24,866 40.4 4,351 7.1 1,206 2.0 1,616
NOTE: All percentages are calculated based on the Adequacy of Prenatal Care Utilization (APNCU) Index. Does not include data from Newton Wellesley, Saint Vincent and Winchester hospitals because of reporting problems. 1. Adequate Total is the sum of Adequate Intensive and Adequate Basic categories.

33
Table 16. Birth Characteristics by Race/Hispanic Ethnicity and Source of Prenatal Care Payment,
Massachusetts: 2017
Births1 Teen Births2 Birthweight Race/Ethnicity and Payment Source <18 Years <20 Years Very Low3 Low4
n % n % n % n % n % STATE TOTAL5 70,704 100.0 471 0.7 1,843 2.6 774 1.1 5,261 7.5
Public 27,435 38.9 393 1.4 1,490 5.4 357 1.3 2,349 8.6 Medicaid6 24,225 34.4 359 1.5 1,397 5.8 323 1.3 2,087 8.6 Other Public7 3,210 4.6 34 1.1 93 2.9 34 1.1 262 8.2
Private8 42,143 59.8 68 0.2 314 0.7 375 0.9 2,761 6.6
White Non-Hispanic 40,989 100.0 111 0.3 548 1.3 333 0.8 2,565 6.3 Public 9,962 24.4 72 0.7 359 3.6 108 1.1 784 7.9
Medicaid6 8,477 20.7 65 0.8 341 4.0 98 1.2 669 7.9 Other Public7 1,485 3.6 7 0.5 18 1.2 10 0.7 115 7.7
Private8 30,554 74.7 37 0.1 178 0.6 207 0.7 1,722 5.6 Black Non-Hispanic 7,251 100.0 68 0.9 232 3.2 164 2.3 768 10.6
Public 4,752 65.7 60 1.3 194 4.1 99 2.1 486 10.2 Medicaid6 4,228 58.5 54 1.3 176 4.2 90 2.1 431 10.2 Other Public7 524 7.2 6 1.1 18 3.4 9 1.7 55 10.5
Private8 2,261 31.3 6 0.3 29 1.3 54 2.4 238 10.5 Hispanic 13,516 100.0 269 2.0 972 7.2 185 1.4 1,145 8.5
Public 10,008 74.2 245 2.4 864 8.6 120 1.2 847 8.5 Medicaid6 9,194 68.1 228 2.5 816 8.9 111 1.2 794 8.6 Other Public7 814 6.0 17 2.1 48 5.9 9 1.1 53 6.5
Private8 3,329 24.7 20 0.6 92 2.8 55 1.7 263 7.9 Asian Non-Hispanic 6,338 100.0 10 0.2 31 0.5 40 0.6 526 8.3
Public 1,723 27.2 7 0.4 26 1.5 --9 --9 135 7.8 Medicaid6 1,534 24.2 6 0.4 25 1.6 --9 --9 121 7.9 Other Public7 189 3.0 --9 --9 --9 --9 0 0.0 14 7.4
Private8 4,535 71.7 --9 --9 5 0.1 35 0.8 386 8.5 Other Non-Hispanic9 684 100.0 6 0.9 24 3.5 10 1.5 57 8.3
Public 374 55.2 --9 --9 19 5.1 8 2.1 29 7.8 Medicaid6 322 47.5 --9 --9 16 5.0 8 2.5 27 8.4 Other Public7 52 7.7 --9 --9 --9 --9 0 0.0 --9 --9
Private8 286 42.2 --9 --9 5 1.7 --9 --9 26 9.1

34
Table 16 (cont’d). Birth Characteristics by Race/Hispanic Ethnicity and Source of Prenatal Care Payment, Massachusetts: 2017
Prenatal Care Race/Ethnicity and Payment Source Adequate11
Began 1st Trimester
Cesarean Delivery Breastfeeding12 Smoking13
n % n % n % n % n % STATE TOTAL5 49,523 80.5 55,171 79.1 22,290 31.6 60,277 85.5 3,347 4.9
Public 19,038 73.5 19,161 70.8 8,539 31.1 22,090 80.7 2,405 9.1 Medicaid6 16,890 73.6 16,905 70.7 7,518 31.0 19,407 80.3 2,155 9.2 Other Public7 2,148 72.5 2,256 71.4 1,021 31.8 2,683 83.8 250 8.1
Private8 30,207 87.0 35,736 85.6 13,495 32.0 37,431 88.9 835 2.0
White Non-Hispanic 29,029 84.2 33,640 83.1 12,870 31.4 34,670 84.7 2,552 6.3 Public 7,036 76.3 7,252 73.7 3,121 31.3 7,470 75.2 1,755 18.2
Medicaid6 5,989 76.1 6,137 73.3 2,650 31.3 6,292 74.4 1,560 19.0 Other Public7 1,047 77.6 1,115 76.0 471 31.7 1,178 79.5 195 13.5
Private8 21,854 87.9 26,245 86.7 9,648 31.6 26,873 88.0 722 2.4 Black Non-Hispanic 4,601 68.8 4,795 67.3 2,534 34.9 6,298 87.2 222 3.1
Public 2,947 65.3 2,976 63.6 1,566 33.0 4,060 85.7 181 3.9 Medicaid6 2,642 65.7 2,656 63.8 1,391 32.9 3,596 85.4 159 3.8 Other Public7 305 61.6 320 62.3 175 33.4 464 88.9 22 4.3
Private8 1,621 82.5 1,787 79.9 881 39.0 2,053 91.2 27 1.2 Hispanic 9,629 75.6 9,715 72.8 4,223 31.2 11,334 84.1 458 3.5
Public 7,099 73.8 6,989 70.7 3,084 30.8 8,280 82.9 390 4.0 Medicaid6 6,587 74.4 6,460 71.0 2,824 30.7 7,583 82.7 362 4.1 Other Public7 512 67.2 529 66.5 260 31.9 697 85.7 28 3.6
Private8 2,479 83.7 2,679 81.4 1,100 33.0 2,931 88.3 56 1.7 Asian Non-Hispanic 4,334 81.9 5,029 80.2 1,851 29.2 5,773 91.2 58 0.9
Public 1,268 78.3 1,244 73.5 446 25.9 1,468 85.2 36 2.1 Medicaid6 1,140 78.5 1,103 73.2 402 26.2 1,293 84.3 36 2.4 Other Public7 128 76.6 141 75.8 44 23.3 175 92.6 0 0.0
Private8 3,038 84.3 3,758 83.4 1,387 30.6 4,238 93.5 19 0.4
Other Non-Hispanic10 454 72.5 456 68.4 222 32.5 573 83.8 47 7.3 Public 245 69.0 238 64.9 120 32.1 310 82.9 34 9.8
Medicaid6 211 69.4 210 66.5 102 31.7 267 82.9 29 9.8 Other Public7 34 66.7 28 54.9 18 34.6 43 82.7 5 10.0
Private8
203 80.6 212 75.4 98 34.3 243 85.0 10 3.6
NOTE: All percentages are calculated based on only those births with known values for the characteristic(s) of interest, unless otherwise stated. 1. In the “Births” column, percentages are based on race/ethnicity category totals (in column). For all other characteristics, percentages are based on the total number of births for the race/ethnicity by payment source for the row. 2. Teen births include births to female ages less than 20, not just those ages 15-19. 3. Very low birthweight: less than 1,500 grams or 3.3 pounds. 4. Low Birthweight: less than 2,500 grams or 5.5 pounds. 5. Total births do not equal Public + Private because Workers’ Compensation, self-paid, and other are in the state total but not shown in the table. 6. Medicaid/MassHealth. 7. Other Public: CommonHealth, Healthy Start, Medicare, other government programs, and free care. 8. Private: commercial indemnity plans or commercial managed care organizations (HMO, PPO, IPP, or IPA). It does not include Self-Paid/Other. 9. Calculations based on values of 1-4 are excluded. 10. Other: Mothers who designated their race as American Indian or “Other.” 11. Based on the Adequacy of Prenatal Care Utilization (APNCU) Index. Does not include data from Newton Wellesley, Saint Vincent and Winchester hospitals because of reporting problems. 12. Infant was being breastfed during the hospital stay. 13. Mother reported smoking during pregnancy.

35
Table 17. Birth Characteristics: Occurrence and Resident Births, Massachusetts Municipalities: 2017
Community Occurrence Births1
Resident Births2 Number of Births
Low Birthweight (Less than 2,500 grams, 5.5 lbs.)
Preterm (<37 weeks gestation)
Teen Births (15-19 years)
STATE TOTAL 71,427 70,704 5,261 6,272 1,827 Abington 2 187 10 22 -- Acton 2 184 13 14 -- Acushnet 0 85 6 6 -- Adams 0 65 13 9 -- Agawam 0 246 9 16 8 Alford 0 1 0 0 0 Amesbury 2 159 20 15 -- Amherst 2 130 10 11 -- Andover 0 245 19 15 -- Aquinnah (Formerly Gay Head) 0 1 0 0 0 Arlington 7 502 33 41 -- Ashburnham 0 43 -- -- 0 Ashby 0 29 -- -- 0 Ashfield 2 14 0 -- 0 Ashland 0 205 12 9 -- Athol 3 125 7 11 9 Attleboro 687 515 51 47 7 Auburn 3 150 -- 9 -- Avon 2 56 -- -- 5 Ayer 1 101 10 7 -- Barnstable 831 407 32 37 14 Barre 1 53 -- -- -- Becket 0 11 0 -- 0 Bedford 1 113 -- 5 0 Belchertown 0 115 10 -- 0 Bellingham 2 171 18 20 -- Belmont 0 252 7 10 -- Berkley 0 53 -- 8 -- Berlin 0 23 0 0 0 Bernardston 2 12 -- -- 0 Beverly 2334 410 18 28 -- Billerica 0 421 40 53 5 Blackstone 1 82 6 9 -- Blandford 0 11 0 0 0 Bolton 1 48 -- -- -- Boston 20495 7730 670 765 202 Bourne 1 153 10 17 6 Boxborough 0 41 -- -- -- Boxford 1 60 -- 0 0 Boylston 0 44 -- -- 0 Braintree 1 374 22 35 0 Brewster 0 58 -- -- 0 Bridgewater 0 230 13 13 -- Brimfield 1 22 -- 0 -- Brockton 2025 1473 136 153 60 Brookfield 0 29 -- -- -- Brookline 0 594 36 48 -- Buckland 0 11 0 -- 0

36
Table 17. Birth Characteristics: Occurrence and Resident Births, Massachusetts Municipalities: 2017
Community Occurrence Births1
Resident Births2 Number of Births
Low Birthweight (Less than 2,500 grams, 5.5 lbs.)
Preterm (<37 weeks gestation)
Teen Births (15-19 years)
Burlington 3 288 27 33 0 Cambridge 3840 1077 65 88 5 Canton 1 228 16 23 0 Carlisle 0 30 -- -- 0 Carver 1 99 8 11 -- Charlemont 0 8 -- -- -- Charlton 0 109 -- 8 -- Chatham 1 26 -- -- -- Chelmsford 0 316 14 20 -- Chelsea 2 638 39 56 44 Cheshire 0 19 -- -- 0 Chester 0 9 -- 0 0 Chesterfield 0 7 -- -- -- Chicopee 2 578 53 66 31 Chilmark 1 6 -- 0 0 Clarksburg 1 14 -- -- 0 Clinton 1 150 6 14 7 Cohasset 0 78 -- -- 0 Colrain 1 14 -- 0 -- Concord 1249 111 -- 8 0 Conway 0 10 -- -- 0 Cummington 0 2 0 0 0 Dalton 0 47 -- -- -- Danvers 0 269 17 20 0 Dartmouth 2 210 15 16 -- Dedham 1 271 19 25 -- Deerfield 2 37 -- 0 0 Dennis 2 91 9 11 -- Dighton 1 86 -- -- 0 Douglas 0 69 -- -- -- Dover 0 33 -- 5 0 Dracut 0 341 24 31 0 Dudley 0 78 6 8 0 Dunstable 1 26 -- -- 0 Duxbury 1 123 7 11 0 East Bridgewater 0 118 -- 5 -- East Brookfield 0 24 -- -- 0 East Longmeadow 0 119 8 9 -- Eastham 0 22 -- -- 0 Easthampton 3 125 9 10 -- Easton 3 191 9 13 -- Edgartown 1 49 0 -- 0 Egremont 0 9 0 0 0 Erving 0 17 -- 0 -- Essex 0 40 7 8 0 Everett 3 655 55 64 18 Fairhaven 0 118 8 11 -- Fall River 1472 1113 100 116 67 Falmouth 371 205 13 10 5 Fitchburg 4 500 33 39 35
Table 17 (cont’d). Birth Characteristics: Occurrence and Resident Births, Massachusetts Municipalities: 2017

37
Table 17. Birth Characteristics: Occurrence and Resident Births, Massachusetts Municipalities: 2017
Community Occurrence Births1
Resident Births2 Number of Births
Low Birthweight (Less than 2,500 grams, 5.5 lbs.)
Preterm (<37 weeks gestation)
Teen Births (15-19 years)
Florida 0 2 -- 0 -- Foxborough 2 178 13 17 -- Framingham 1099 940 73 93 19 Franklin 3 275 20 24 -- Freetown 1 67 -- 6 -- Gardner 394 216 10 13 -- Georgetown 0 82 6 -- -- Gill 0 10 0 0 0 Gloucester 2 241 17 25 11 Goshen 0 11 0 0 0 Gosnold 0 0 0 0 0 Grafton 3 195 15 23 -- Granby 0 42 -- 6 -- Granville 0 9 -- -- 0 Great Barrington 117 42 -- -- 0 Greenfield 438 163 10 16 6 Groton 0 89 10 7 -- Groveland 0 62 7 8 -- Hadley 0 34 0 -- 0 Halifax 0 83 10 13 -- Hamilton 0 101 6 7 -- Hampden 0 21 0 0 0 Hancock 0 6 -- 0 -- Hanover 1 124 5 8 0 Hanson 0 107 11 13 -- Hardwick 0 15 -- -- 0 Harvard 1 32 -- -- 0 Harwich 1 88 6 11 0 Hatfield 1 20 -- -- 0 Haverhill 5 758 67 78 28 Hawley 0 3 0 0 0 Heath 1 6 -- -- 0 Hingham 2 217 13 17 -- Hinsdale 0 15 0 0 -- Holbrook 0 139 9 13 -- Holden 2 201 14 20 0 Holland 1 16 -- -- 0 Holliston 2 133 5 9 0 Holyoke 467 493 49 56 40 Hopedale 0 65 -- 8 0 Hopkinton 0 176 14 17 0 Hubbardston 0 41 -- -- -- Hudson 2 204 12 19 0 Hull 1 73 7 -- -- Huntington 0 20 -- -- -- Ipswich 1 111 12 9 -- Kingston 0 140 14 13 0 Lakeville 1 90 6 8 -- Lancaster 2 49 -- -- -- Lanesborough 2 26 -- -- --
Table 17 (cont’d). Birth Characteristics: Occurrence and Resident Births, Massachusetts Municipalities: 2017

38
Table 17. Birth Characteristics: Occurrence and Resident Births, Massachusetts Municipalities: 2017
Community Occurrence Births1
Resident Births2 Number of Births
Low Birthweight (Less than 2,500 grams, 5.5 lbs.)
Preterm (<37 weeks gestation)
Teen Births (15-19 years)
Lawrence 1445 1451 129 135 117 Lee 1 41 -- -- -- Leicester 1 89 9 11 -- Lenox 0 23 0 0 0 Leominster 765 439 27 35 12 Leverett 0 7 -- -- 0 Lexington 1 177 14 15 0 Leyden 0 1 0 0 0 Lincoln 1 74 -- -- -- Littleton 0 86 5 -- -- Longmeadow 0 123 8 9 0 Lowell 2344 1499 128 147 65 Ludlow 0 131 7 8 -- Lunenburg 2 100 8 -- 0 Lynn 11 1589 126 142 91 Lynnfield 0 142 11 14 0 Malden 5 826 76 85 7 Manchester 0 22 -- -- 0 Mansfield 1 209 12 15 -- Marblehead 1 138 5 8 0 Marion 0 27 -- -- -- Marlborough 3 484 26 41 13 Marshfield 1 215 11 25 -- Mashpee 1 111 8 8 -- Mattapoisett 0 33 -- -- 0 Maynard 1 118 11 10 -- Medfield 1 92 -- 5 0 Medford 1 666 43 58 6 Medway 0 113 7 -- 0 Melrose 854 381 33 39 -- Mendon 0 34 5 5 0 Merrimac 0 50 -- -- -- Methuen 1137 560 40 65 14 Middleborough 0 215 15 21 -- Middlefield 0 1 0 0 0 Middleton 0 64 5 5 -- Milford 963 387 32 34 13 Millbury 2 126 7 10 0 Millis 1 84 -- 7 0 Millville 2 31 -- -- -- Milton 2 272 13 15 0 Monroe 0 2 0 0 0 Monson 0 46 -- -- -- Montague 2 65 -- 9 -- Monterey 1 3 0 0 0 Montgomery 1 6 0 0 0 Mount Washington 1 2 0 0 0 Nahant 0 27 -- -- -- Nantucket 122 136 7 7 5 Natick 3 390 30 47 --
Table 15 (cont’d). Birth Characteristics: Occurrence and Resident Births, Massachusetts Municipalities: 2016
Table 17 (cont’d). Birth Characteristics: Occurrence and Resident Births, Massachusetts Municipalities: 2017

39
Table 17. Birth Characteristics: Occurrence and Resident Births, Massachusetts Municipalities: 2017
Community Occurrence Births1
Resident Births2 Number of Births
Low Birthweight (Less than 2,500 grams, 5.5 lbs.)
Preterm (<37 weeks gestation)
Teen Births (15-19 years)
Needham 1 249 11 16 -- New Ashford 0 0 0 0 0 New Bedford 1545 1311 150 144 92 New Braintree 0 6 0 0 0 New Marlborough 0 2 0 0 0 New Salem 1 8 0 0 0 Newbury 0 57 0 -- -- Newburyport 685 113 -- 12 -- Newton 3779 696 46 57 -- Norfolk 2 115 5 5 0 North Adams 3 124 14 18 13 North Andover 0 290 17 22 -- North Attleborough 0 260 17 19 -- North Brookfield 0 49 -- 5 -- North Reading 0 152 9 9 0 Northampton 578 200 13 11 -- Northborough 0 123 6 14 -- Northbridge 1 161 12 8 -- Northfield 0 13 -- 0 -- Norton 0 181 12 16 -- Norwell 1 105 9 8 0 Norwood 465 385 32 38 7 Oak Bluffs 146 53 -- -- -- Oakham 0 14 0 0 0 Orange 1 59 -- 8 -- Orleans 0 16 -- -- 0 Otis 0 14 -- -- 0 Oxford 3 117 5 -- 0 Palmer 3 115 11 11 6 Paxton 0 36 -- -- 0 Peabody 1 556 36 53 6 Pelham 0 8 0 0 0 Pembroke 0 165 11 17 -- Pepperell 2 111 7 10 -- Peru 0 6 -- -- 0 Petersham 0 11 0 0 0 Phillipston 0 21 -- 0 0 Pittsfield 740 427 37 38 21 Plainfield 0 4 0 0 0 Plainville 0 95 -- 9 -- Plymouth 788 502 42 45 8 Plympton 0 40 -- -- 0 Princeton 0 20 -- -- -- Provincetown 0 9 0 0 0 Quincy 5 1195 77 82 15 Randolph 1 415 46 56 5 Raynham 0 138 6 15 5 Reading 0 239 6 8 0 Rehoboth 0 86 -- -- -- Revere 6 794 44 63 17
Table 17 (cont’d). Birth Characteristics: Occurrence and Resident Births, Massachusetts Municipalities: 2017

40
Table 17. Birth Characteristics: Occurrence and Resident Births, Massachusetts Municipalities: 2017
Community Occurrence Births1
Resident Births2 Number of Births
Low Birthweight (Less than 2,500 grams, 5.5 lbs.)
Preterm (<37 weeks gestation)
Teen Births (15-19 years)
Richmond 1 7 0 0 0 Rochester 1 36 -- -- -- Rockland 1 170 10 16 -- Rockport 0 26 0 0 0 Rowe 0 3 0 0 0 Rowley 0 62 -- -- 0 Royalston 0 6 -- 0 0 Russell 4 22 -- -- -- Rutland 1 67 5 5 -- Salem 1287 448 42 52 6 Salisbury 0 56 -- 5 -- Sandisfield 0 4 0 0 0 Sandwich 0 127 -- 8 0 Saugus 1 223 10 19 -- Savoy 0 3 0 0 -- Scituate 1 187 5 6 0 Seekonk 1 116 -- -- -- Sharon 2 151 14 12 0 Sheffield 1 19 -- -- -- Shelburne 0 14 0 0 0 Sherborn 0 28 -- -- 0 Shirley 0 51 -- -- 0 Shrewsbury 0 315 23 20 -- Shutesbury 0 17 -- -- 0 Somerset 1 125 6 7 -- Somerville 10 841 63 63 10 South Hadley 3 131 10 15 -- Southampton 2 43 -- 5 0 Southborough 0 77 5 -- 0 Southbridge 156 190 12 12 14 Southwick 1 65 -- -- -- Spencer 2 96 6 9 -- Springfield 5234 2134 215 240 195 Sterling 1 41 -- 0 0 Stockbridge 0 7 0 0 0 Stoneham 2 227 12 13 -- Stoughton 2 292 34 27 -- Stow 0 62 -- -- 0 Sturbridge 1 90 7 8 -- Sudbury 2 138 10 16 0 Sunderland 0 33 -- 5 -- Sutton 3 78 -- 6 -- Swampscott 0 141 -- 5 0 Swansea 0 126 -- 8 -- Taunton 274 625 61 75 18 Templeton 1 69 6 7 -- Tewksbury 0 285 28 28 -- Tisbury 0 37 -- 5 -- Tolland 0 0 0 0 0 Topsfield 1 38 -- -- 0
Table 17 (cont’d). Birth Characteristics: Occurrence and Resident Births, Massachusetts Municipalities: 2017

41
Table 17. Birth Characteristics: Occurrence and Resident Births, Massachusetts Municipalities: 2017
Community Occurrence Births1
Resident Births2 Number of Births
Low Birthweight (Less than 2,500 grams, 5.5 lbs.)
Preterm (<37 weeks gestation)
Teen Births (15-19 years)
Townsend 2 90 -- 5 -- Truro 0 7 0 -- 0 Tyngsborough 0 97 7 11 -- Tyringham 0 3 0 0 0 Upton 0 78 -- 5 -- Uxbridge 4 132 14 13 -- Wakefield 1 315 16 26 0 Wales 0 20 -- -- 0 Walpole 0 243 8 21 0 Waltham 3 773 51 69 14 Ware 2 81 7 7 -- Wareham 407 209 18 16 7 Warren 0 36 -- -- -- Warwick 1 5 0 0 0 Washington 0 2 -- 0 0 Watertown 1 447 25 28 -- Wayland 0 94 6 7 0 Webster 0 184 14 14 10 Wellesley 2 165 5 8 0 Wellfleet 0 16 -- -- 0 Wendell 2 6 0 -- 0 Wenham 0 28 0 -- 0 West Boylston 0 52 -- -- -- West Bridgewater 1 78 -- 5 -- West Brookfield 0 28 -- 0 -- West Newbury 0 36 0 -- -- West Springfield 2 314 18 27 5 West Stockbridge 1 10 0 0 0 West Tisbury 0 27 -- -- -- Westborough 1 254 23 37 0 Westfield 4 369 24 30 8 Westford 2 169 16 15 0 Westhampton 1 8 0 0 0 Westminster 2 54 -- -- -- Weston 1 63 -- -- 0 Westport 0 120 8 7 -- Westwood 0 121 9 12 0 Weymouth 3405 631 63 64 5 Whately 1 19 0 0 -- Whitman 3 145 10 12 -- Wilbraham 1 107 9 11 0 Williamsburg 0 14 -- -- 0 Williamstown 0 34 -- -- 0 Wilmington 0 234 18 18 -- Winchendon 3 110 8 10 -- Winchester 2194 186 13 7 0 Windsor 1 4 -- -- 0 Winthrop 0 197 8 15 -- Woburn 1 496 39 49 -- Worcester 6014 2451 197 215 110
Table 17 (cont’d). Birth Characteristics: Occurrence and Resident Births, Massachusetts Municipalities: 2017

42
Table 17. Birth Characteristics: Occurrence and Resident Births, Massachusetts Municipalities: 2017
Community Occurrence Births1
Resident Births2 Number of Births
Low Birthweight (Less than 2,500 grams, 5.5 lbs.)
Preterm (<37 weeks gestation)
Teen Births (15-19 years)
Worthington 1 9 0 -- 0 Wrentham 0 121 5 -- -- Yarmouth 1 211 14 23 6 1. Births occurring in a geographical place (state, city/town) regardless of the residency of the mother. 2. Births to mothers who report their usual place of residence as a particular geographical place (state, or city/town). See “Note to Readers” for more details. -- Due to small numbers (n=1-4), exact count not provided. This table was updated on June 16, 2020.
Table 17 (cont’d). Birth Characteristics: Occurrence and Resident Births, Massachusetts Municipalities: 2017

43
Table 18. Birth Characteristics: Occurrence and Resident Births by County, Massachusetts: 2017
County Occurrence Births1
Resident Births2
Number of
Births Low Birthweight3
Preterm4 Teen Births (15-19 Years)
STATE TOTAL 71,427 70,704 5,261 6,272 1,827 BARNSTABLE 1,209 1,547 101 136 38 BERKSHIRE 868 992 91 89 50 BRISTOL 3,988 5,735 482 540 214 DUKES 148 173 9 11 --5 ESSEX 6,914 8,655 638 767 298 FRANKLIN 454 557 34 52 18 HAMPDEN 5,721 4,976 424 495 302 HAMPSHIRE 593 1,005 72 80 13 MIDDLESEX 15,423 16,729 1,178 1,432 202 NANTUCKET 122 136 7 7 5 NORFOLK 3,901 7,136 499 598 54 PLYMOUTH 3,238 5,191 379 471 95 SUFFOLK 20,503 9,359 761 899 264 WORCESTER 8,344 8,513 586 695 270 1. Births occurring in a geographical place (state, city/town) regardless of the residency of the mother. 2. Births to mothers who report their usual place of residence as a particular geographical place (state, or city/town). See “Note to Readers” for more details. 3. Less than 2,500 grams (5.5 lbs.). 4. Less than 37 weeks gestation 5. Due to small numbers (n=1-4), exact count not provided.

44
Table 19. Birth Characteristics: Occurrence and Resident Births, Massachusetts Community Health Network Areas (CHNAs), Massachusetts: 2017
Resident Births2 Community Health Network Area
Occurrence
Births1 Number of Births LBW3 Preterm4 Teen Births
(15-19 Years)
STATE TOTAL 71,427 70,704 5,261 6,272 1,827 1. Community Health Network of Berkshire County 868 992 91 89 50 2. Upper Valley Health Web (Franklin County) 457 720 43 63 27 3. Partnership for Health in Hampshire County (Northampton) 593 985 70 78 12 4. The Community Health Connection (Springfield) 5,246 3,338 285 331 220 5. Community Health Network of Southern Worcester County 164 1,088 69 81 42 6. Community Partners for Health (Milford) 979 1,676 128 138 30 7. Community Health Network of Greater Metro West (Framingham) 1,119 4,354 277 394 44 8. Community Wellness Coalition (Worcester) 6,025 3,659 275 317 120 9. Fitchburg/Gardner Community Health Network 1,184 2,561 154 176 82 10. Greater Lowell Community Health Network 2,347 3,154 259 308 77 11. Greater Lawrence Community Health Network 2,582 2,610 210 242 135 12. Greater Haverhill Community Health Network 693 1,495 113 128 40 13. Community Health Network North (Beverly/Gloucester) 2,338 1,017 62 81 18 14. North Shore Community Health Network 1,301 3,533 253 316 105 15. Greater Woburn/Concord/Littleton Community Health Network 3,452 2,020 143 160 6 16. North Suburban Health Alliance (Medford/Malden/Melrose) 866 3,461 250 302 33 17. Greater Cambridge/Somerville Community Health Network 3,858 3,119 193 230 21 18. West Suburban Health Network (Newton/Waltham) 3,787 2,371 143 194 18 19. Alliance for Community Health (Boston/Chelsea/Revere/Winthrop) 20,503 9,953 797 947 265 20. Blue Hills Community Health Alliance (Greater Quincy) 3,887 4,311 318 363 34 21. Four (For) Communities (Holyoke, Chicopee, Ludlow, Westfield) 473 1,600 137 162 82 22. Greater Brockton Community Health Network 2,038 2,909 228 265 80 23. South Shore Community Partners in Prevention (Plymouth) 793 1,768 131 173 16 24. Greater Attleboro-Taunton Health & Education Response 965 2,574 193 235 42 25. Partners for a Healthier Community (Fall River) 1,473 1,484 118 138 71 26. Greater New Bedford Health & Human Services Coalition 1,956 2,096 204 207 110 27. Cape and Islands Community Health Network 1,479 1,856 117 154 47
1. Births occurring in a geographical place (state, city/town) regardless of the residency of the mother. 2. Births to mothers who report their usual place of residence as a particular geographical place (state, city/town). See “Note to Readers” for more details. 3. Less than 2,500 grams (5.5 lbs.). 4. Less than 37 weeks gestation.
44
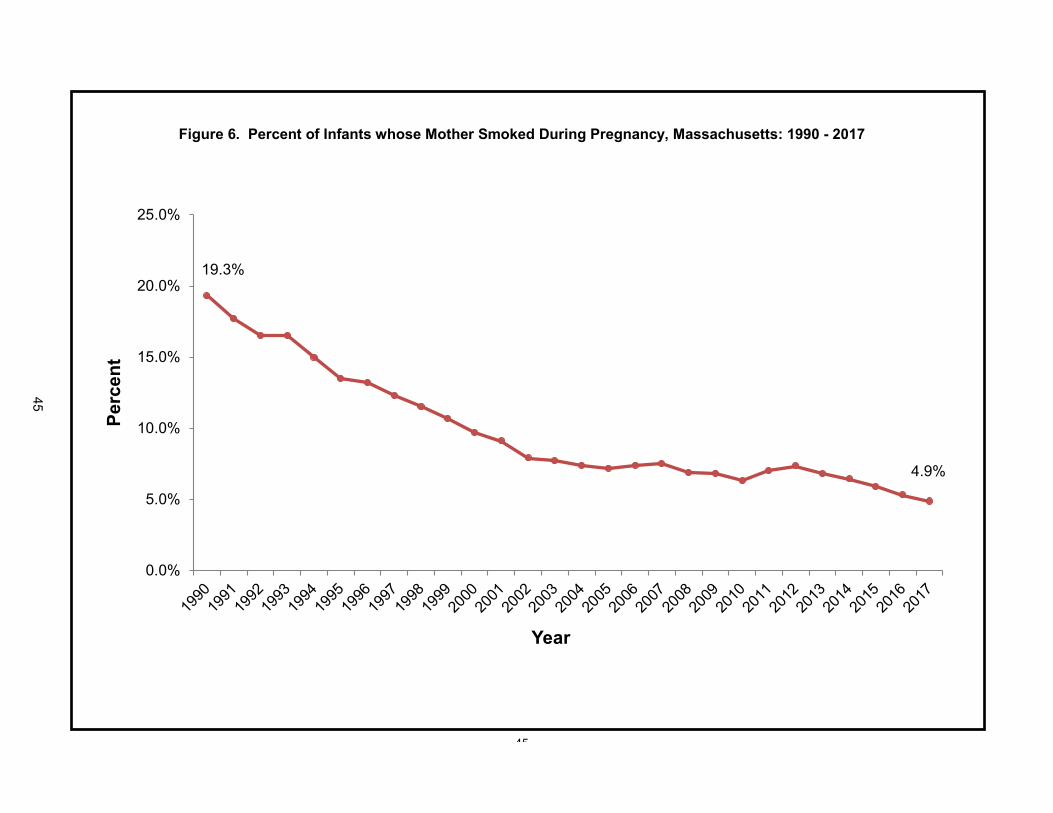
45
Figure 6. Percent of Infants whose Mother Smoked During Pregnancy, Massachusetts: 1990 - 2017
19.3%
4.9%
0.0%
5.0%
10.0%
15.0%
20.0%
25.0%
Perc
ent
Year
45
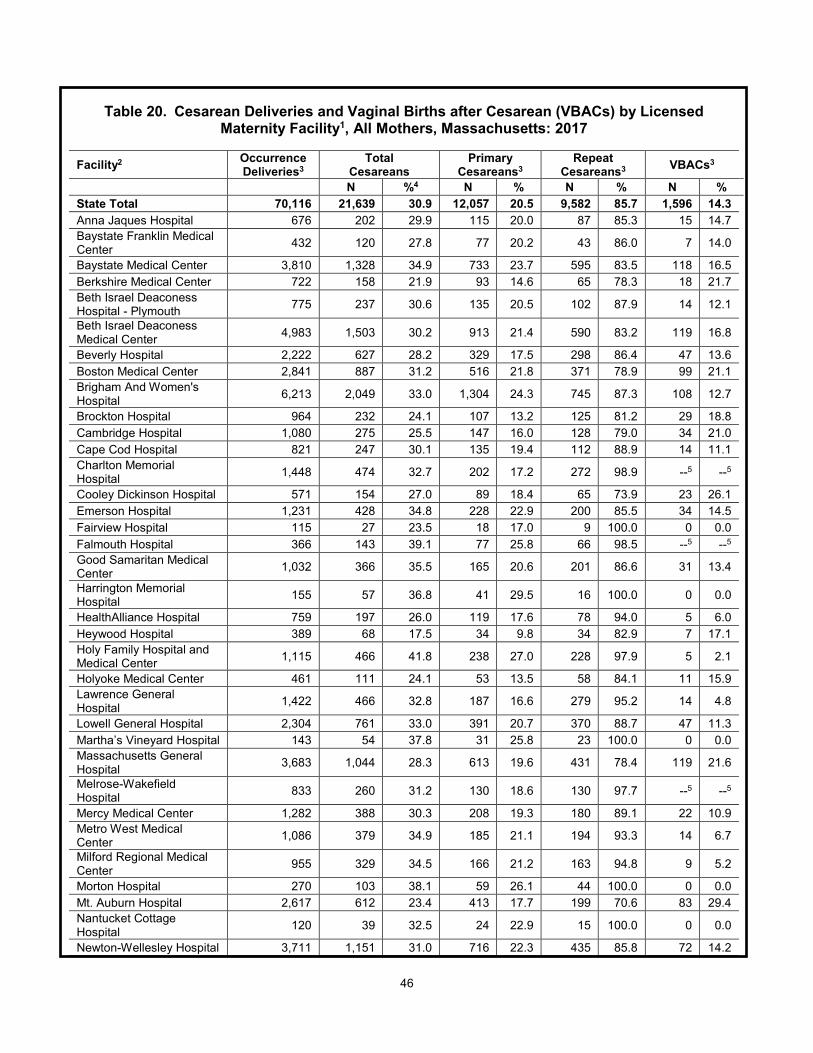
46
Table 20. Cesarean Deliveries and Vaginal Births after Cesarean (VBACs) by Licensed
Maternity Facility1, All Mothers, Massachusetts: 2017
Facility2 Occurrence Deliveries3
Total Cesareans
Primary Cesareans3
Repeat Cesareans3 VBACs3
N %4 N % N % N %
State Total 70,116 21,639 30.9 12,057 20.5 9,582 85.7 1,596 14.3 Anna Jaques Hospital 676 202 29.9 115 20.0 87 85.3 15 14.7 Baystate Franklin Medical Center 432 120 27.8 77 20.2 43 86.0 7 14.0
Baystate Medical Center 3,810 1,328 34.9 733 23.7 595 83.5 118 16.5 Berkshire Medical Center 722 158 21.9 93 14.6 65 78.3 18 21.7 Beth Israel Deaconess Hospital - Plymouth 775 237 30.6 135 20.5 102 87.9 14 12.1
Beth Israel Deaconess Medical Center 4,983 1,503 30.2 913 21.4 590 83.2 119 16.8
Beverly Hospital 2,222 627 28.2 329 17.5 298 86.4 47 13.6 Boston Medical Center 2,841 887 31.2 516 21.8 371 78.9 99 21.1 Brigham And Women's Hospital 6,213 2,049 33.0 1,304 24.3 745 87.3 108 12.7
Brockton Hospital 964 232 24.1 107 13.2 125 81.2 29 18.8 Cambridge Hospital 1,080 275 25.5 147 16.0 128 79.0 34 21.0 Cape Cod Hospital 821 247 30.1 135 19.4 112 88.9 14 11.1 Charlton Memorial Hospital 1,448 474 32.7 202 17.2 272 98.9 --5 --5
Cooley Dickinson Hospital 571 154 27.0 89 18.4 65 73.9 23 26.1 Emerson Hospital 1,231 428 34.8 228 22.9 200 85.5 34 14.5 Fairview Hospital 115 27 23.5 18 17.0 9 100.0 0 0.0 Falmouth Hospital 366 143 39.1 77 25.8 66 98.5 --5 --5 Good Samaritan Medical Center 1,032 366 35.5 165 20.6 201 86.6 31 13.4
Harrington Memorial Hospital 155 57 36.8 41 29.5 16 100.0 0 0.0
HealthAlliance Hospital 759 197 26.0 119 17.6 78 94.0 5 6.0 Heywood Hospital 389 68 17.5 34 9.8 34 82.9 7 17.1 Holy Family Hospital and Medical Center 1,115 466 41.8 238 27.0 228 97.9 5 2.1
Holyoke Medical Center 461 111 24.1 53 13.5 58 84.1 11 15.9 Lawrence General Hospital 1,422 466 32.8 187 16.6 279 95.2 14 4.8
Lowell General Hospital 2,304 761 33.0 391 20.7 370 88.7 47 11.3 Martha’s Vineyard Hospital 143 54 37.8 31 25.8 23 100.0 0 0.0 Massachusetts General Hospital 3,683 1,044 28.3 613 19.6 431 78.4 119 21.6
Melrose-Wakefield Hospital 833 260 31.2 130 18.6 130 97.7 --5 --5
Mercy Medical Center 1,282 388 30.3 208 19.3 180 89.1 22 10.9 Metro West Medical Center 1,086 379 34.9 185 21.1 194 93.3 14 6.7
Milford Regional Medical Center 955 329 34.5 166 21.2 163 94.8 9 5.2
Morton Hospital 270 103 38.1 59 26.1 44 100.0 0 0.0 Mt. Auburn Hospital 2,617 612 23.4 413 17.7 199 70.6 83 29.4 Nantucket Cottage Hospital 120 39 32.5 24 22.9 15 100.0 0 0.0
Newton-Wellesley Hospital 3,711 1,151 31.0 716 22.3 435 85.8 72 14.2

47
Table 20. Cesarean Deliveries and Vaginal Births after Cesarean (VBACs) by Licensed
Maternity Facility1, All Mothers, Massachusetts: 2017
North Shore Medical Center - Salem Hospital 1,265 369 29.2 197 18.5 172 84.7 31 15.3
Norwood Hospital 460 153 33.3 74 20.2 79 84.0 15 16.0 Saint Vincent Hospital 1,756 589 33.5 339 23.3 250 83.6 49 16.4 South Shore Hospital 3,326 1,116 33.6 590 21.7 526 86.4 83 13.6 St. Elizabeth's Medical Center 895 326 36.4 185 25.3 141 86.5 22 13.5
St. Luke’s Hospital 1,517 463 30.5 214 17.0 249 97.3 7 2.7 Sturdy Memorial Hospital 675 215 31.9 101 18.5 114 87.7 16 12.3 Tobey Hospital 400 73 18.3 43 11.6 30 100.0 0 0.0 Tufts Medical Center 1,293 443 34.3 259 24.8 184 74.5 63 25.5 UMass Memorial Medical Center 4,121 1,249 30.3 669 19.6 580 81.5 132 18.5
Winchester Hospital 2,150 701 32.6 395 21.8 306 89.5 36 10.5 NOTE: This table is based on mothers and not births. All percentages are calculated based on only those mothers with known values for the characteristic(s) of interest 1. Birth centers are not included in this table. 2. A licensed maternity facility is a medical unit licensed by the Commonwealth for the care of women during pregnancy and childbirth. 3. The percentages provided in this table are based on occurrence births, and may differ from data that are based on resident births presented elsewhere in this book. 4. The percentage of Cesarean births reported is not adjusted for risk factors such as mother’s age, birthweight, or complications of labor and delivery, which would influence the number of procedures in a particular facility. Caution should be used when comparing unadjusted percentages. 5. Calculations based on values of 1-4 are excluded.
Table 20 (cont’d). Cesarean Deliveries and Vaginal Births after Cesarean (VBACs) by Licensed Maternity Facility1, All Mothers, Massachusetts: 2017

48
Figure 7. Maternal Body Mass Index (BMI) Prior to Pregnancy, All Mothers, Massachusetts: 2017
3.4%
49.5%
25.6%21.6%
0%
20%
40%
60%
80%
100%
Underweight (BMI < 18.5) Normal (18.5-24.9) Overweight (25.0-29.9) Obese (BMI ≥ 30)
Perc
ent o
f Mot
hers
BMI Levels
Figure 8. Obesity Prior to Pregnancy by Race/Hispanic Ethnicity, All Mothers, Massachusetts: 2017
20.0%
31.3%
7.7%
28.2%
0%
10%
20%
30%
40%
50%
White non-Hispanic Black non-Hispanic Asian non-Hispanic Hispanic
Perc
ent o
f Mot
hers
Race/Ethnicity
NOTE: These figures are based on mothers and not births.

49
Figure 9. Mothers Who Reported Having Their Teeth Cleaned During Pregnancy by
Race/Hispanic Ethnicity, All Mothers, Massachusetts: 2017
55.6%
34.5%39.3% 40.7%
48.1%
0%
20%
40%
60%
80%
100%
White Non-Hispanic Black Non-Hispanic Asian Non-Hispanic Hispanic All
Perc
ent o
f Mot
hers
Race/Ethnicity
Figure 10. Mothers Who Reported Having Received WIC Food During Pregnancy by Race/Hispanic Ethnicity, All Mothers, Massachusetts: 2017
17.0%
57.7%
23.1%
69.3%
32.1%
0%
20%
40%
60%
80%
100%
White Non-Hispanic Black Non-Hispanic Asian Non-Hispanic Hispanic All
Perc
ent o
f Mot
hers
Race/Ethnicity
NOTE: These figures are based on mothers and not births.

50
Figure 11. Mothers Who Reported Smoking During Pregnancy by Race/Hispanic Ethnicity,
All Mothers, Massachusetts: 2017
6.4%
3.1%
0.9%
3.5%4.9%
0%
5%
10%
15%
20%
25%
White Non-Hispanic Black Non-Hispanic Asian Non-Hispanic Hispanic Total
Perc
ent o
f Mot
hers
Race/Ethnicity
NOTE: This figure is based on mothers and not births.

51
Table 21. Mothers Who Used Infertility Treatments, Massachusetts: 2017
Assisted Reproductive Technology (ART) with or
without Artificial Insemination and/or
Fertility Drugs1
Artificial Insemination with or without Fertility Drugs2
Fertility Enhancing Drugs Only3
N %4 N %4 N %4 State total 2,419 70.7% 547 16.0% 457 13.4%
Maternal Demographics Race/Hispanic Ethnicity N %5 N %5 N %5
White Non-Hispanic 1,848 77.6% 416 76.9% 343 75.9% Black Non-Hispanic 100 4.2% 21 3.9% 19 4.2% Asian Non-Hispanic 269 11.3% 62 11.5% 57 12.6% Hispanic 152 6.4% 41 7.6% 31 6.9% Other Non-Hispanic 13 0.5% --9 --9 --9 --9
Birthplace US States / D.C. / US Terr. 1,854 76.6% 426 77.9% 348 76.1% Non-US-born 565 23.4% 121 22.1% 109 23.9% Prenatal care funding Public 165 6.8% 48 8.8% 56 12.4% Private, other 2,252 93.2% 497 91.2% 397 87.6% Age 20-29 170 7.0% 69 12.6% 86 18.8% 30-34 779 32.2% 215 39.3% 222 48.6% 35-39 975 40.3% 209 38.2% 116 25.4% 40+ 494 20.4% 54 9.9% 33 7.2%
Pregnancy-Related Factors Adequacy of Prenatal Care6 Adequate Total7 1,753 88.9% 411 89.2% 322 86.6% Adequate Intensive 1,126 57.1% 259 56.2% 191 51.3% Adequate Basic 627 31.8% 152 33.0% 131 35.2% Intermediate 76 3.9% 14 3.0% 16 4.3% Inadequate/None 143 7.3% 36 7.8% 34 9.1% Parity8
1 1,485 61.5% 388 70.9% 298 65.2% 2 737 30.5% 119 21.8% 117 25.6% 3+ 191 7.9% 40 7.3% 42 9.2%
Birth Outcomes Gestational age <28 weeks (extremely preterm)10 21 0.9% --9 --9 5 1.1% <37 weeks (preterm)10 368 15.2% 85 15.5% 60 13.1% 37+ 2,051 84.8% 462 84.5% 397 86.9% Plurality Singleton 2,150 88.9% 504 92.1% 411 89.9% Multiple birth 269 11.1% 43 7.9% 46 10.1%
NOTE: Beginning in 2014, questions about fertility assistance were asked on both the hospital and mother’s worksheets. This table shows combined data from both sources. While asking mothers has increased reporting, it is known that these treatments are still underreported. As such, these numbers should be interpreted with caution. All percentages are calculated based only on mothers with known values for the characteristic(s) of interest, unless otherwise stated. Often women use more than one method of treatment, and the categories presented are mutually exclusive.
NOTE: This table is based on unique mothers and not births.
1. This category includes all women who used ART (typically IVF) and those who used any additional treatments. 2. This category includes women who used artificial insemination (including intrauterine insemination) and those who used fertility drugs in addition. 3. This category includes women who only used fertility drugs. 4. For state total row, percentages are based on total births where infertility treatment was present. 5. Percent is based on state total of the treatment methods. 6. Based on Adequacy of Prenatal Care Utilization (APNCU) Index. Does not include data from Newton Wellesley, Saint Vincent and Winchester hospitals because of reporting problems. 7. Adequate Total = Adequate Basic + Adequate Intensive. 8. Number of live births including the current birth. 9. Numbers and calculations based on 1-4 events are excluded. 10. Categories are not mutually exclusive so percent will add to more than 100%.

52
Technical Notes
Data Cautions Limitations of small numbers: Cells in some tables in this publication, and particularly those tables specific to individual cities and towns, contain small numbers. Rates and proportions based on fewer than five observations are suppressed, and trends based upon small numbers should be interpreted cautiously. Differences with previously published data: Numbers and rates in this publication may differ from those in previous reports because of updated birth data, or release of the most up-to-date population estimates for a given year (see Population Denominators for details on population files). Self-reported data: Many statistics reported in this publication, such as maternal smoking, education, and race/ethnicity are self-reported, and are subject to the usual limitations of this type of information.
Changes in the Collection of Race/Ethnicity Information The 2003 revision of the Standard Certificate of Live Birth allows the reporting of more than one race (multiple races) for each parent in accordance with the revised standards issued by the Office of Management and Budget (OMB) in 1997. The revised standards incorporated two major changes designed to reflect the changing racial and ethnic profile of the United States. First, the revision increased from five to twelve the minimum set of categories to be used for identification of race. The twelve categories for race specified in the 1997 standards are: American Indian or Alaska Native, Asian, Black, Guamanian or Chamorro, Hispanic/Latino/Black, Hispanic/Latino/White, Hispanic/Latino/Other, Native Hawaiian, Samoan, White, Other Pacific Islander and Other. The revised standards called for reporting of Asians separately from Native Hawaiians, Samoan or Other Pacific Islanders. The revised standards require federal data collection programs to allow respondents to select one or more race categories. In order to provide uniformity and comparability of the data during the transition period, before multiple-race data are available for all reporting areas, it is necessary to “bridge” the responses of those who reported more than one race to a single-race. The method used to bridge responses for those who report more than one race to a single race is based on a procedure whereby multiple races are assigned to the smallest minority group first (i.e. Asian and White becomes Asian or Black and Native American becomes Native American). All multiple races that include Hispanic will be assigned as Hispanic and this group also includes all respondents who reported Hispanic ethnicities as well. The revised standards also require federal data collection programs to allow respondents to select one or more ancestry categories. The method used to bridge responses for those who report more than one ancestry is based on a procedure whereby multiple ancestries are assigned to each of the ancestries listed. The following table is from the Parent Worksheet for the birth certificate, which is the self-reported information we use to report on mother’s race and ancestry.
53
2003 Revision Mother/Parent Race Please indicate your race(s). You may choose more than one.
American Indian/Alaska Native (specify tribal nation):
____________________________________
Asian
Black
Guamanian or Chamorro
Hispanic/Latina/Black
Hispanic/Latina/White
Hispanic/Latina/Other (specify):___________________
Native Hawaiian
Samoan
White
Other Pacific Islander (specify):___________________
Other race not listed (specify):____________________
Mother/Parent Ethnicity Please indicate your ethnic background(s). You may choose more than one. African (specify):_ ______________
African-American
American
Asian Indian
Brazilian
Cambodian
Cape Verdean
Caribbean Islander (specify): _ ______________
Chinese
Colombian
Cuban
Dominican
European (specify): ______________
Filipino
Guatemalan
Haitian
Honduran
Japanese
Korean
Laotian
Mexican, Mexican American, Chicano
Middle Eastern (specify):_________________________
Native American (specify tribal nation(s)):____________
Portuguese
Puerto Rican
Russian
Salvadoran
Vietnamese
Other Asian (specify): __________________________
Other Central American (specify): _________________
Other Pacific Islander (specify): __________________
Other Portuguese (specify): ______________________
Other South American (specify): __________________
Other ethnicity (ies) not listed (specify): _______________

54
1989 Revision MOTHER’S RACE Please mark the one category that best describes the mother’s race:
White Black Asian/Pacific Islander American Indian Other (specify) MOTHER’s ANCESTRY Please mark the one category that best describes the mother’s ancestry of ethnic heritage:
HISPANIC/LATINA AFRICAN/AFRICAN AMERICAN
1 Puerto Rican 7 Other Central American (specify) 2 Dominican ______________________________ 3 Mexican 8 Other South American (specify) 4 Cuban ______________________________ 5 Colombian 9 Other Hispanic/Latina (specify): 6 Salvadoran
29 African-American/ Afro-American 30 Nigerian 31 Other African specify):_______________
MIDDLE EASTERN
32 Lebanese 33 Iranian 34 Israeli 35 Other Middle Eastern (specify):________
ASIAN/PACIFIC ISLANDER
10 Chinese 17 Laotian 11 Vietnamese 18 Pakistani 12 Cambodian 19 Thai 13 Asian Indian 20 Hawaiian 14 Korean 21 Other Asian/Pacific Islander(specify) 15 Filipino __________________________________ 16 Japanese
AMERICAN ANCESTRY 36 Native American/ American Indian (specify tribe/affiliation):__________________ 37 American
PORTUGUESE SPEAKING EUROPEAN and OTHER ancestries 22 Cape Verdean 24 Other Portuguese (specify): 23 Brazilian ______________________________ 38 European (specify):
_____________________________________ 39 Other (specify): _____________________________________
WEST INDIAN/CARIBBEAN ISLANDER 25 Haitian 28 OtherWest Indian/Caribbean Islander (specify):______________ 26 Jamaican 27 Barbadian

55
Table A1. 2017 Massachusetts Population Estimates by Age Group, Gender, Race/Hispanic Ethnicity (mutually exclusive)
1. National Center for Health Statistics. Postcensal estimates of the resident population of the United States for July 1, 2010-July 1, 2017, by year, county, single-year of age (0, 1, 2, .., 85 years and over), bridged race, Hispanic origin, and sex (Vintage 2016). Prepared under a collaborative arrangement with the U.S. Census Bureau. Available from: https://www.cdc.gov/nchs/nvss/bridged_race.htm as of June 2018, following release by the U.S. Census Bureau of the unbridged Vintage 2016 postcensal estimates by 5-year age. 2. Persons of Hispanic ethnicity are NOT included in the race categories. These estimates are used to calculate statewide population based rates published in this report.
Age Group Total1 White Non-
Hispanic Black Non-Hispanic
Native American
Non-Hispanic
Asian Non-Hispanic Hispanic2
Female 0 to 4 176,589 107,664 17,650 406 13,832 37,037 5 to 9 180,974 114,131 17,935 477 14,137 34,294
10 to 14 191,473 125,803 17,836 463 14,043 33,328 15 to 19 226,569 153,315 20,015 533 18,054 34,652 20 to 24 247,031 165,430 22,387 602 22,815 35,797 25 to 29 247,423 163,836 22,383 614 25,039 35,551 30 to 34 237,813 160,352 19,856 496 25,212 31,897 35 to 39 218,232 146,011 18,353 426 22,223 31,219 40 to 44 204,744 139,885 16,997 388 19,727 27,747 45 to 49 234,305 172,835 17,732 515 17,962 25,261
50+ 1,364,301 1,140,261 77,763 2,783 60,673 82,821 All
Females 3,529,454 2,589,523 268,907 7,703 253,717 409,604 Male
0 to 4 183,999 112,563 18,463 419 14,525 38,029 5 to 9 189,325 119,473 19,295 460 14,759 35,338
10 to 14 198,877 131,709 18,785 483 14,126 33,774 15 to 19 228,388 154,478 20,491 511 16,452 36,456 20 to 24 247,129 164,514 22,770 650 20,331 38,864 25 to 29 252,198 165,970 23,316 687 23,435 38,790 30 to 34 236,497 159,572 19,480 519 22,635 34,291 35 to 39 212,403 142,376 17,750 436 19,844 31,997 40 to 44 195,122 135,097 16,026 411 17,944 25,644 45 to 49 220,837 165,058 15,860 503 16,558 22,858
50+ 1,165,590 979,600 63,358 2,587 52,331 67,714 All
Males 3,330,365 2,430,410 255,594 7,666 232,940 403,755
0 to 4 360,588 220,227 36,113 825 28,357 75,066 5 to 9 370,299 233,604 37,230 937 28,896 69,632
10 to 14 390,350 257,512 36,621 946 28,169 67,102 15 to 19 454,957 307,793 40,506 1,044 34,506 71,108 20 to 24 494,160 329,944 45,157 1,252 43,146 74,661 25 to 29 499,621 329,806 45,699 1,301 48,474 74,341 30 to 34 474,310 319,924 39,336 1,015 47,847 66,188 35 to 39 430,635 288,387 36,103 862 42,067 63,216 40 to 44 399,866 274,982 33,023 799 37,671 53,391 45 to 49 455,142 337,893 33,592 1,018 34,520 48,119
50+ 2,529,891 2,119,861 141,121 5,370 113,004 150,535 State Total 6,859,819 5,019,933 524,501 15,369 486,657 813,359