2017 - Australian Securities Exchange · 22/9/2017 · Manhattan’s 2017 Annual Report including...
60
ABN 61 123 156 089 www.manhattancorp.com.au ANNUAL REPORT 2017 For personal use only
Transcript of 2017 - Australian Securities Exchange · 22/9/2017 · Manhattan’s 2017 Annual Report including...

ABN 61 123 156 089www.manhattancorp.com.au
A N N U A L R E P O R T
2017For
per
sona
l use
onl
y

CORPORATE DIRECTORY 1
CHAIRMAN’S REVIEW 2
REVIEW OF OPERATIONS 5
DIRECTORS’ REPORT 15
AUDITOR’S REPORT 25
AUDITOR’S DECLARATION 28
FINANCIAL STATEMENTS 29
CONSOLIDATED STATEMENT OF COMPREHENSIVE INCOME 29 CONSOLIDATED STATEMENT OF FINANCIAL POSITION 30 CONSOLIDATED STATEMENT OF CHANGES IN EQUITY 31 CONSOLIDATED STATEMENT OF CASH FLOWS 32 NOTES TO THE FINANCIAL STATEMENTS 33
DIRECTORS’ STATEMENT 52
ASX ADDITIONAL INFORMATION 53
ANALYSIS OF SHAREHOLDINGS 53 TENEMENT SCHEDULE 56
CONTENTS
For
per
sona
l use
onl
y

DIRECTORS
Alan J Eggers Executive ChairmanB.Sc, B.Sc(Hons), M.Sc, F.S.E.G., MAusIMM, MAIG Marcello Cardaci Non Executive DirectorB.Juris, LLB, B.Com John A G Seton Non Executive DirectorLLM(Hons) COMPANY SECRETARY
John G RibbonsB.Bus, CPA, AGIA BUSINESS OFFICE
Level 233 Colin StreetWEST PERTH WA 6005
PO Box 1038WEST PERTH WA 6872
Telephone: +61 8 9322 6677Facsimile: +61 8 9322 1961 REGISTERED OFFICE
Level 233 Colin StreetWEST PERTH WA 6005
INTERNET ACCESS
Email: [email protected] Site: www.manhattancorp.com.au
COUNTRY OF INCORPORATION
Australia
SHARE REGISTRY
Computershare Investor Services Pty LtdLevel 2, Reserve Bank Building45 St Georges TerracePERTH WA 6000
INVESTOR ENQUIRIES
Australia: 1300 850 505International: +61 3 9415 4000Facsimile: +61 8 9323 2033Web Site: www.computershare.com.au AUDITORS
Rothsay Chartered AccountantsLevel 1, Lincoln House4 Ventnor StreetWEST PERTH WA 6005 BANKERS
Westpac Banking Corporation109 St Georges TerracePERTH WA 6000 SOLICITORS
Gilbert + TobinLevel 16, Brookfield Place Tower 2123 St Georges TerracePERTH WA 6000 STOCK EXCHANGE LISTING
Australian Securities Exchange (“ASX”)ASX Code: MHC
CORPORATE DIRECTORY
MANHATTAN CORPORATION LIMITED2017 ANNUAL REPORT
1
For
per
sona
l use
onl
y
2
CHAIRMAN’S REVIEW
MANHATTAN CORPORATION LIMITED2017 ANNUAL REPORT
22 September 2017
Dear Shareholders and Investors
I’m pleased, on behalf of the Board and our executive team, to present Manhattan’s 2017 Annual Report including the Financial Statements for the year ended 30 June 2017 and my review of Manhattan’s business plans.
CHAIRMAN’S REVIEW
For
per
sona
l use
onl
y

3
CHAIRMAN’S REVIEW
MANHATTAN CORPORATION LIMITED2017 ANNUAL REPORT
Uranium Price Outlook
No improvement in the uranium price has materialised over the last 12 months and industry observers agree the decade low price of uranium is unsustainable.
The 2011 Fukushima incident, and tsunami, in Japan led to the shutdown of the country’s 55 nuclear reactors, an oversupply of primary fuel coupled with slower Japanese plant restarts than anticipated. In the wake of Fukushima the uranium spot price continues to be depressed after being at US$28lb in mid-March, then sinking to a 17 year low at US$19.50lb at the beginning of June and is now around US$20.70lb in mid-September 2017. Trade Tech’s term price indicators remained at US$24.45lb (mid) and US$34.00lb (long).
As a result, a number of tier one uranium development projects are on hold around the world including the four approved WA projects and the Mkuju River project in Tanzania.
Uranium Market Dynamics
With the spot price now well below the average cost of primary mine production, and the significant investment underway in new nuclear plants and replacement of ageing plants, we believe that the supply of uranium will come under pressure, prices should improve and the dynamics point to an abrupt return to higher prices when the time comes.
Whilst we believe the low carbon, clean and safe uranium power industry has a strong future the current low cost abundant natural gas and growth of renewable energy are accelerating the retirement of coal and (older) nuclear base load power plants. The rush to renewables and the emerging power storage technologies around the globe are clouding the issue and directing politicians and investment away from nuclear.
Over optimistic renewable energy targets are being set such as California 60% by 2030, Hawaii 100% by 2050 along with 48 third world countries vulnerable to climate change and 100 multinationals making a commitment to 100% renewables (The Economist 13 July 2017). These targets are unlikely to be met but they are also having an impact on the near to medium term energy mix to provide essential base load power at the exclusion of traditional fossil, hydro and nuclear alternatives.
World Nuclear Power Developments
A major case for uranium’s longer term demand outlook is China’s impressive nuclear power growth with 37 plants now operating generating 33,650MW and another 20 under construction capable of delivering 22,000MW of base load carbon free energy.
There are now 447 operable nuclear power plants in 31 countries capable of delivering 392,335MW of power. As well, a record new build is underway with 58 plants capable of generating 63,070MW under construction and another 162 nuclear plants (167,800MW capacity) approved with funding or commitment in place and expected to be operational within 8 to 10 years (WNA 1 August 2017).
In the USA there are calls for greater support for nuclear power being important for energy supply and national security. France and South Korea have also been urged to reconsider their proposals to phase out nuclear, advised it would be a step backwards and they need to help combat climate change by reducing the use of fossil fuels in heating and transport sectors.
Excising E28/1898 from QVSNR
Manhattan’s key licence E28/1898, and reported Inferred Resources of 17.2Mlb and Exploration Targets of 33 to 67Mlb of uranium oxide, at Ponton are located mostly within the remote QVSNR, 200km east northeast of Kalgoorlie.
Whilst a proposal has been developed to excise granted E28/1898 (that equates to 6% or 160km2 of the 2,700km2
QVSNR) from the reserve by a Reserves Amendment Bill in the WA parliament this proposal is now on hold.
The recently elected WA state Labor government’s stated policy not to approve any new uranium mines, and their previously stated policy of not to allow mineral exploration in A Class reserves, suggests there is little likelihood of progressing the exploration and development of the Ponton uranium project over the next four year term of the present WA government.
For
per
sona
l use
onl
y
4
CHAIRMAN’S REVIEW
MANHATTAN CORPORATION LIMITED2017 ANNUAL REPORT
Developments in Western Australia Uranium Mine Approvals
The four new uranium development projects in WA at Yeelirrie, Kintyre, Wiluna and Mulga Rock, that have secured WA state and federal environmental development approvals, will be honoured by the state’s Labor government. However, each of these projects will only be advanced when world uranium prices show a sustained improvement in the order of over double current prices.
Although the WA Labor policy is at odds with the four approved projects we do not see any change in the WA government’s stand on new uranium mine approvals or exploration access to A Class reserves in the foreseeable future.
Manhattan’s Resources and Project Development
Manhattan completed a drilling program at Ponton in late 2016 that delivered the required information to complete and report, on 23 January 2017, an upgraded and JORC Code 2012 Inferred Resources at Ponton. At Double 8 deposit 17.2 million Inferred Resource was reported along with maiden Inferred Resources estimates for the Stallion, Highway and Shelf uranium deposits, to the north of the QVSNR, totalling 6.97Mlb uranium oxide.
The four Inferred Mineral Resources reported in January 2017 of over 24Mlb uranium oxide at Ponton are in addition to the four Exploration Targets at Double 8, Stallion South, Highway South and Ponton previously reported in 2014 of 33 to 67Mlb uranium oxide.
The Ponton project is a future low cost in-situ metal recovery development opportunity for Manhattan with reported Resources and Targets of 57Mlbs to 91Mlbs making it the third largest uranium resource in WA and positioning the project as one of key regional, state and national significance.
The Year Ahead Manhattan will maintain its interests in the key tenement areas at Ponton, with a view that the WA government’s policy on uranium approvals may change in the future and or the Labor government will be replaced by a government that is supportive of the industry.
With the current ban on progressing uranium projects in WA Manhattan is now developing a revised business plan to take the Company forward. We intend to finalise our negotiations and approvals, prepare the required shareholder information then will provide this information and make our plans known to investors as soon as possible in the coming months.
Unless there is a very sudden and positive turnaround in the fortunes of the uranium sector the Board, and management team, at Manhattan are looking to diversify into other mineral exploration and development activities in the resource sector with near term certainty of development and commodity price outlook.
It’s been a tough year, funds remain tight and good opportunities are difficult to identify and then successfully acquire. We are in this process, are reassured by our investor base support that refocussing is the correct way forward and thank you all for your patience whilst we navigate this acquisition process and new corporate path.
As Chairman I look forward to delivering positive news and developments in the coming months that will revitalise Manhattan and create the commercial environment and opportunity for growth and wealth generation.
ALAN J EGGERSExecutive Chairman22 September 2017
For
per
sona
l use
onl
y

MANHATTAN CORPORATION LIMITED 52017 ANNUAL REPORT
REVIEW OF OPERATIONS
REVIEW OFOPERATIONS
Introduction
Manhattan Corporation Limited’s (“Manhattan”) flagship Ponton uranium project is located approximately 200km northeast of Kalgoorlie on the edge of the Great Victoria Desert in WA. The Company has 100% control of around 625km2 of exploration tenements underlain by Tertiary palaeochannels within the Gunbarrel Basin. These palaeochannels are known to host a number of uranium deposits and drilled uranium prospects (Figures 1 & 2).
The Company is drill testing and developing palaeochannel sand hosted uranium mineralisation amenable to in-situ metal recovery (“ISR”).
For
per
sona
l use
onl
y

MANHATTAN CORPORATION LIMITED 62017 ANNUAL REPORT
REVIEW OF OPERATIONS
FIGURE 1: MANHATTAN’S AUSTRALIAN URANIUM PROJECTS
On 23 January 2017 Manhattan reported an upgraded JORC Code 2012 Inferred Resource for the Double 8 uranium deposit at Ponton in WA of 17.2 million pounds (“Mlb”) of uranium oxide (“U3O8”) at a 200ppm cutoff. As well, maiden JORC Code 2012 combined Inferred Resources estimates for three uranium deposits at Ponton of 21.5 million tonnes (“Mt”), grading from 137 to 151ppm U3O8 totalling 6.97Mlb U3O8 at a 100ppm cutoff were reported.
The four Inferred Resource estimates reported for Ponton project are:
• Double uranium deposit of 17.2Mlb U3O8 at 200ppm cut off; • Stallion uranium deposit of 3.3Mlb U3O8 at 100ppm cutoff; • Highway uranium deposit of 1.9Mlb U3O8 at 100ppm cutoff; and • Shelf uranium deposit of 1.8Mlb U3O8 at 100ppm cutoff
Exploration Results at Ponton, reported on 7 February 2014, have also identified four wide spaced drilled Exploration Targets with tonnage ranges of 4 to 45Mt, grade ranges of 250 to 450ppm U3O8 totalling 33 to 67Mlb U3O8 at the 200ppm U3O8 cutoff. In accordance with clause 17 of the JORC Code 2012, the potential quantity and grade reported as Exploration Targets in this report must be considered conceptual in nature as there has been insufficient exploration and drilling to define a Mineral Resource and it is uncertain if further exploration and drilling will result in the determination of a Mineral Resource.
The four Exploration Targets reported for the Ponton project are:
• Double 8 of between 2.5 and 5.5Mlb U3O8; • Stallion South of between 8 and 16Mlb U3O8; • Highway South of between 8 and 16Mlb U3O8; and • Ponton of between 15 and 30Mlb U3O8
The four Inferred Resource estimates and four Exploration Targets at Ponton reported here were prepared by the Company’s independent resource consultants H&S Consultants (“H&SC”).
The Double 8 uranium deposit and the four Exploration Targets at Double 8, Stallion South, Highway South and Ponton are all located on granted exploration licence, E28/1898, located mostly within the Queen Victoria Spring Nature Reserve (“QVSNR”) (Figures 2 & 3).
For
per
sona
l use
onl
y

MANHATTAN CORPORATION LIMITED 72017 ANNUAL REPORT
REVIEW OF OPERATIONS
FIGURE 2: MANHATTAN’S PONTON TENEMENTS
The four Mineral Resource Estimates reported in January 2017, and the four Exploration Targets previously reported in 2014, are based on actual exploration results including Manhattan’s aircore and sonic drilling of over 767 holes and 52,700 metres of drilling along the palaeochannels immediately to the north of QVSNR in 2009 and 2010, 21 holes and 1,170 metres of drilling by Manhattan in 2016 and over 70km of conductive palaeochannels defined by the Company’s airborne EM and magnetic surveys within QVSNR (Figure 3) and uranium mineralised sands discovered in previous drilling of 114 holes and 6,900 metres of drilling and down hole gamma logging by PNC Exploration (“PNC”) and Uranerz Limited (“Uranerz”) in the area in the 1980’s.
Whilst a proposal has been developed to excise granted E28/1898 (that equates to 6% or 160km2 of the 2,700km2 QVSNR) from the reserve by a Reserves Amendment Bill in the WA parliament this proposal is now on hold. The WA state Labor government’s policy of not to approve any new uranium mines, or permit mineral exploration in A Class reserves, suggests there is little likelihood of progressing the exploration and development of the Ponton uranium project over the next four year term of the present WA government.
1. PONTON PROJECT (WA)Interest: Manhattan 100%Operator: Manhattan Corporation Limited
The Ponton project area is underlain by Tertiary palaeochannels within the Gunbarrel Basin. Carbonaceous sand hosted uranium mineralisation, below 40 to 70 metres of cover, has now been defined by drilling along 55 kilometres of the palaeochannels at Stallion, Stallion South, Double 8, Ponton, Highway and Highway South prospects (Figure 3). At a depth of 40 to 70 metres the uranium mineralisation is in shallow reduced sand hosted tabular uranium deposits in a confined palaeochannel that is potentially amenable to ISR metal recovery, the lowest cost method of producing yellowcake with the least environmental impact.
Within E28/1898 approximately 6,900 metres of drilling, in 114 drill holes, was drilled and down hole gamma logged by PNC and Uranerz in 1983 to 1986. This drilling discovered the palaeochannel sand hosted uranium mineralisation at Double 8, Stallion South, Highway South and Ponton (Figure 3). Manhattan has obtained and compiled all the PNC and Uranerz exploration results including the geological drill logs, assay results, down hole gamma logs, logging tool calibrations and estimated disequilibrium factors. These drill logs and gamma logs have been digitised and verified by Manhattan’s independent
For
per
sona
l use
onl
y
MANHATTAN CORPORATION LIMITED 82017 ANNUAL REPORT
REVIEW OF OPERATIONS
consultants.
In 2009 Uranio drilled 1,683 metres of aircore in 20 holes and from December 2009 to September 2016 Manhattan drilled over 52,400 metres of aircore and sonic drilling in 735 holes along the palaeochannels at Ponton to the north of the QVSNR. Manhattan and Uranio’s exploration and drilling results and the historic PNC and Uranerz data have been reviewed and the Inferred Resource estimated for Double 8, Stallion, Highway and Shelf deposits and Exploration Targets reported for Double 8, Stallion South, Highway South and Ponton prospects.
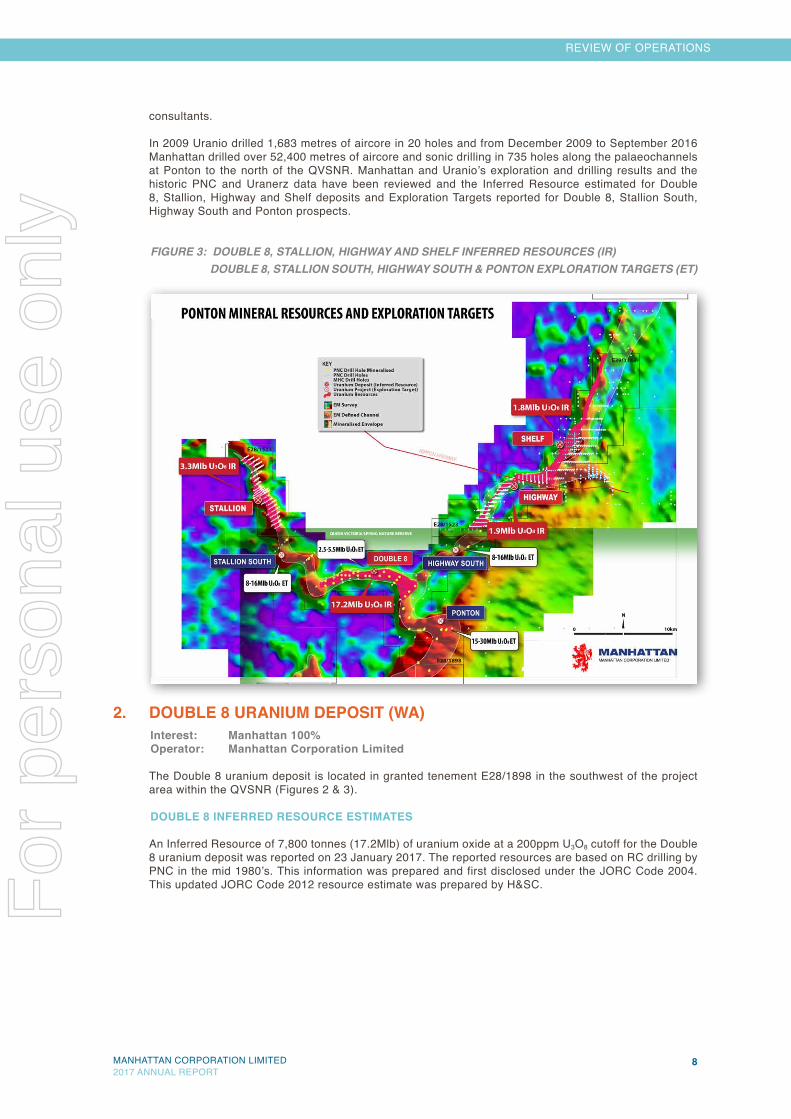
FIGURE 3: DOUBLE 8, STALLION, HIGHWAY AND SHELF INFERRED RESOURCES (IR) DOUBLE 8, STALLION SOUTH, HIGHWAY SOUTH & PONTON EXPLORATION TARGETS (ET)
2. DOUBLE 8 URANIUM DEPOSIT (WA)Interest: Manhattan 100%Operator: Manhattan Corporation Limited
The Double 8 uranium deposit is located in granted tenement E28/1898 in the southwest of the project area within the QVSNR (Figures 2 & 3).
DOUBLE 8 INFERRED RESOURCE ESTIMATES
An Inferred Resource of 7,800 tonnes (17.2Mlb) of uranium oxide at a 200ppm U3O8 cutoff for the Double 8 uranium deposit was reported on 23 January 2017. The reported resources are based on RC drilling by PNC in the mid 1980’s. This information was prepared and first disclosed under the JORC Code 2004. This updated JORC Code 2012 resource estimate was prepared by H&SC.F
or p
erso
nal u
se o
nly

MANHATTAN CORPORATION LIMITED 92017 ANNUAL REPORT
REVIEW OF OPERATIONS
Double 8 Inferred Resources
DOUBLE 8 INFERRED RESOURCE ESTIMATES
CUTOFF GRADE U3O8 (ppm)
TONNES (MILLION)
GRADE U3O8 (ppm)
TONNES U3O8 (t)
POUNDS (MILLION) U3O8
(Mlb)
100 110 170 18,700 42.0150 51 240 12,240 26.0200 26 300 7,800 17.2250 14 360 5,040 11.0
H&SC’s resource estimate for the Double 8 uranium deposit is based on approximately 2,706m of drilling from 44 aircore holes drilled by PNC in the early 1980’s along 10 kilometres of the palaeochannel at Double 8 (Figure 3). The drilling has covered an area of approximately 9 x 1.2 km of the Ponton palaeochannel. 40 holes were successfully logged for uranium decay products using a down hole gamma radiometric probe. The original analog gamma logging data has been digitized and recalibrated by the Company’s consultants as digitized logs converted to eU3O8.
The uranium mineralisation at Double 8 remains open and is yet to be closed off by drilling. Manhattan considers that further drilling, on 100m x 400m centres, of the Double 8 deposit and Exploration Target will expand on the reported resources and targets and the confidence levels of reported resources will improve.
DOUBLE 8 EXPLORATION TARGET
The Double 8 Exploration Target, reported in January 2014, is based on 44 drill holes totalling approximately 2,700 metres of drilling and down hole gamma logs in areas of the deposit where drill spacing is considered too wide to define a Mineral Resource to an inferred resource status.
Exploration Results have identified a drilled Exploration Target with uranium mineralisation potential, at a 200ppm U3O8 cutoff, at Double 8 of 4 to 8Mt grading 250 to 450ppm U3O8 containing 1,100 to 2,500 tonnes or 2.5 to 5.5Mlb of contained U3O8.
Double 8 Exploration Target
DOUBLE 8 EXPLORATION TARGET
CUTOFF GRADE U3O8 (ppm)
TONNAGE RANGE
(MILLION)
GRADE RANGE U3O8 (ppm)
TONNAGE RANGE U3O8 (t)
POUNDS RANGE (MILLION) U3O8 (Mlb)
200 4 - 8 250 - 450 1,100 - 2,500 2.5 - 5.5
In accordance with clause 17 of the JORC Code 2012, the potential quantity and grade reported as Exploration Targets in this report must be considered conceptual in nature as there has been insufficient exploration and drilling to define a Mineral Resource and it is uncertain if further exploration and drilling will result in the determination of a Mineral Resource.
The uranium mineralisation at Double 8 remains open and is yet to be closed off by drilling. Manhattan considers that further drilling, on 100m x 400m centres, of the Double 8 deposit and Exploration Target will expand on the reported resources and targets and the confidence levels of reported resources will improve.
On gaining exploration access to E28/1898, and approval of Manhattan’s Program of Work (“POW”) by the Department of Mines and Petroleum (“DMP”), the Company plans to complete approximately 200 aircore drill holes for 16,000 metres of infill resource definition drilling on 400 x 100m centres along the defined palaeochannel within the reported Inferred Resource and Exploration Target areas at Double 8. This drilling program, including the resource definition drilling planned for the Stallion South, Highway South and Ponton prospects, will be completed within approximately one year of POW approval (Figure 3).
For
per
sona
l use
onl
y

MANHATTAN CORPORATION LIMITED 102017 ANNUAL REPORT
REVIEW OF OPERATIONS
3. STALLION (WA)Interest: Manhattan 100%Operator: Manhattan Corporation Limited
The Stallion uranium prospect is located in E28/1523 and centred 14 kilometres northwest of the Double 8 uranium deposit at Ponton (Figures 2 & 3).
STALLION INFERRED RESOURCE ESTIMATES
An Inferred Resource of 1,490 tonnes (3.3Mlb) of uranium oxide at a 100ppm U3O8 cutoff for the Stallion uranium deposit was reported on 23 January 2017. The reported resources are based primarily on Manhattan’s aircore and sonic drilling in 2010 and 2016. This JORC Code 2012 resource estimate was prepared by H&SC.
Stallion Inferred Resources
STALLION INFERRED RESOURCE ESTIMATES
CUTOFF GRADE eU3O8 (ppm)
TONNES(MILLION)
GRADE eU3O8 (ppm) TONNES U3O8 (t)
POUNDS (MILLION) U3O8 (Mlb)
100 9.9 151 1,490 3.3150 3.6 200 720 1.6200 1.3 253 330 0.7
H&SC’s resource estimate for the Stallion uranium deposit is based on a total of 252 drill holes totalling 18,746m of drilling including 7 aircore holes for approximately 401 metres of drilling by PNC in the early 1980s and Manhattan’s 226 vertical aircore drill holes totalling 16,914m and 16 duplicate sonic drill holes totalling 1,179m of drilling along 8 kilometres of the palaeochannel at Stallion in 2009 and 2010 and 3 aircore holes for 252m, utilising improved high resolution gamma probe technology, drilled into the Stallion deposit twinning previously drilled Manhattan aircore and sonic drill holes in 2016 (Figure 3). Drilling has been completed on 200m and 400m spaced lines with holes drilled at 100m centres along each grid line across the palaeochannel within mineralised zones. All drill holes were gamma logged. The original PNC analog gamma logging data has been digitized and recalibrated by the Company’s consultants as digitized logs converted to eU3O8.
The geological controls and style of the palaeochannel sand hosted uranium mineralisation at Stallion are similar to the mineralisation encountered at Double 8.
4. HIGHWAY (WA)Interest: Manhattan 100%Operator: Manhattan Corporation Limited
The Highway uranium prospect is located in E28/1523 and E39/1143 centred 15 kilometres northwest of the Double 8 uranium deposit at Ponton (Figures 2 & 3).
HIGHWAY INFERRED RESOURCE ESTIMATES
An Inferred Resource of 860 tonnes (1.9Mlb) of uranium oxide at a 100ppm U3O8 cutoff for the Highway uranium deposit was reported on 23 January 2017. The reported resources are based primarily on Manhattan and Uranio’s aircore and sonic drilling in 2009, 2010 and 2016. This JORC Code 2012 resource estimate was prepared by H&SC.
For
per
sona
l use
onl
y

MANHATTAN CORPORATION LIMITED 112017 ANNUAL REPORT
REVIEW OF OPERATIONS
Highway Inferred Resources
HIGHWAY INFERRED RESOURCE ESTIMATES
CUTOFF GRADE eU3O8 (ppm)
TONNES(MILLION)
GRADE eU3O8 (ppm) TONNES U3O8 (t)
POUNDS (MILLION) U3O8 (Mlb)
100 5.7 150 860 1.9150 2.4 196 470 1.0200 1.0 234 220 0.7
H&SC’s resource estimate for the Highway uranium deposit is based on a total of 304 drill holes totalling 18,236m of drilling including 6 aircore holes for approximately 279 metres of drilling by PNC and 27 RC hole for approximately 1,378m of aircore and reverse circulation (“RC”) drilling by Uranerz in the early 1980s, Uranio’s 5 aircore holes totalling 381m in 2009, Manhattan’s 260 vertical aircore drill holes totalling 15,832m and 3 duplicate sonic drill holes totalling 183m of drilling along 10 kilometres of the palaeochannel at Stallion in 2009 and 2010 and 3 aircore holes for 183m, utilising improved high resolution gamma probe technology, drilled into Highway twinning previously drilled Manhattan aircore and sonic drill holes in 2016 (Figure 3). Drilling has been completed on 200m and 400m spaced lines with holes drilled at 100m centres along each grid line across the palaeochannel within mineralised zones. All drill holes were gamma logged. The original PNC and Uranerz analog gamma logging data has been digitized and recalibrated by the Company’s consultants as digitized logs converted to eU3O8.
Apart from some shallow lignite hosted uranium mineralisation encountered along the northern part of the palaeochannel at Highway, the geological controls and style of the channel sand hosted uranium mineralisation at Highway are similar to the mineralisation encountered at Double 8 and Stallion.
5. SHELF (WA)Interest: Manhattan 100%Operator: Manhattan Corporation Limited
The Shelf uranium deposit is located along the palaeochannel approximately 10km northeast of Highway in E39/1143.
SHELF INFERRED RESOURCE ESTIMATES
An Inferred Resource of 810 tonnes (1.8Mlb) of uranium oxide at a 100ppm U3O8 cutoff for the Shelf uranium deposit was reported on 23 January 2017. The reported resources are based on RC and aircore drilling by Uranerz in the mid 1980’s and Manhattan and Uranio’s aircore drilling in 2009 and 2010. This JORC Code 2012 resource estimate was prepared by H&SC.
Shelf Inferred Resources
SHELF INFERRED RESOURCE ESTIMATES
CUTOFF GRADE eU3O8 (ppm)
TONNES(MILLION)
GRADE eU3O8 (ppm) TONNES U3O8 (t)
POUNDS (MILLION) U3O8 (Mlb)
100 5.9 137 810 1.8150 1.4 187 270 0.6200 0.3 270 80 0.2
H&SC’s resource estimate for the Shelf uranium deposit is based on a total of 352 drill holes totalling 21,550m of drilling including 110 holes for approximately 5,871m of aircore and RC drilling by Uranerz in the early 1980’s, Uranio’s 15 aircore holes totalling 1,302m in 2009 and Manhattan’s 227 vertical aircore drill holes totalling 14,377m in 2010 (Figure 3). Drilling has been completed on 200m and 400m
For
per
sona
l use
onl
y
MANHATTAN CORPORATION LIMITED 122017 ANNUAL REPORT
REVIEW OF OPERATIONS
spaced lines with holes drilled at 100m centres along each grid line across the palaeochannel within mineralised zones along 14 kilometres of the palaeochannel at Shelf in 2010. The original Uranerz analog gamma logging data has been digitized and recalibrated by the Company’s consultants as digitized logs converted to eU3O8 and all the Uranio and Manhattan drill holes were gamma logged.
Apart from some shallow lignite hosted uranium mineralisation encountered at the central Shelf uranium deposit the geological controls and style of the channel sand hosted uranium mineralisation at Highway are similar to the mineralisation encountered at Double 8 and Stallion.
6. STALLION SOUTH (WA)Interest: Manhattan 100%Operator: Manhattan Corporation Limited
Stallion South is located immediately to the south of Stallion and northwest of Double 8 along the Ponton palaeochannel. This prospect is within granted licence E28/1898 within the QVSNR (Figures 2 & 3).
The drilled uranium mineralisation at Stallion South is also hosted in palaeochannels within reduced carbonaceous sands and weathered granitic sands in a confined aquifer overlying crystalline granite basement.
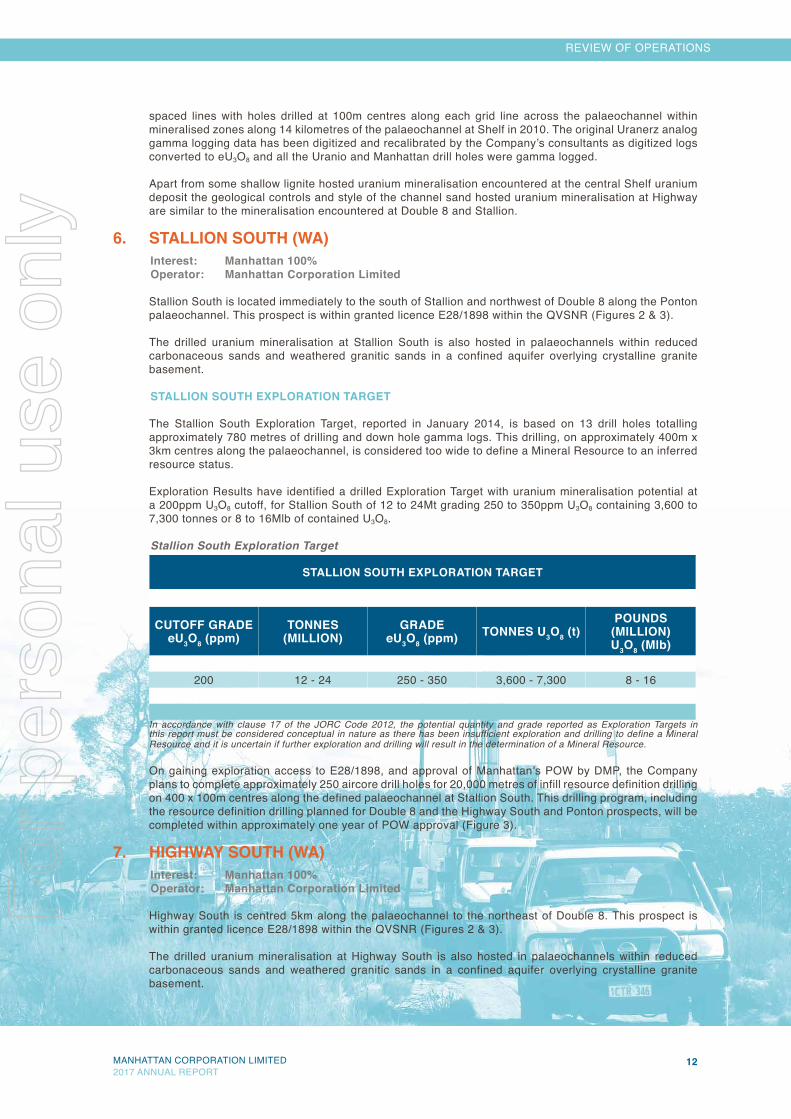
STALLION SOUTH EXPLORATION TARGET
The Stallion South Exploration Target, reported in January 2014, is based on 13 drill holes totalling approximately 780 metres of drilling and down hole gamma logs. This drilling, on approximately 400m x 3km centres along the palaeochannel, is considered too wide to define a Mineral Resource to an inferred resource status.
Exploration Results have identified a drilled Exploration Target with uranium mineralisation potential at a 200ppm U3O8 cutoff, for Stallion South of 12 to 24Mt grading 250 to 350ppm U3O8 containing 3,600 to 7,300 tonnes or 8 to 16Mlb of contained U3O8.
Stallion South Exploration Target
STALLION SOUTH EXPLORATION TARGET
CUTOFF GRADE eU3O8 (ppm)
TONNES(MILLION)
GRADE eU3O8 (ppm) TONNES U3O8 (t)
POUNDS (MILLION) U3O8 (Mlb)
200 12 - 24 250 - 350 3,600 - 7,300 8 - 16
In accordance with clause 17 of the JORC Code 2012, the potential quantity and grade reported as Exploration Targets in this report must be considered conceptual in nature as there has been insufficient exploration and drilling to define a Mineral Resource and it is uncertain if further exploration and drilling will result in the determination of a Mineral Resource.
On gaining exploration access to E28/1898, and approval of Manhattan’s POW by DMP, the Company plans to complete approximately 250 aircore drill holes for 20,000 metres of infill resource definition drilling on 400 x 100m centres along the defined palaeochannel at Stallion South. This drilling program, including the resource definition drilling planned for Double 8 and the Highway South and Ponton prospects, will be completed within approximately one year of POW approval (Figure 3).
7. HIGHWAY SOUTH (WA)Interest: Manhattan 100%Operator: Manhattan Corporation Limited
Highway South is centred 5km along the palaeochannel to the northeast of Double 8. This prospect is within granted licence E28/1898 within the QVSNR (Figures 2 & 3).
The drilled uranium mineralisation at Highway South is also hosted in palaeochannels within reduced carbonaceous sands and weathered granitic sands in a confined aquifer overlying crystalline granite basement.
For
per
sona
l use
onl
y

MANHATTAN CORPORATION LIMITED 132017 ANNUAL REPORT
REVIEW OF OPERATIONS
HIGHWAY SOUTH EXPLORATION TARGET
The Highway South Exploration Target, reported in January 2014, is based on 33 drill holes totalling approximately 1,980 metres of drilling and down hole gamma logs. This drilling, on approximately 400m x 2km centres along the palaeochannel, is considered too wide to define a Mineral Resource to an inferred resource status.
Exploration Results have identified drilled Exploration Targets with uranium mineralisation potential at a 200ppm U3O8 cutoff, for Highway South of 12 to 24Mt grading 250 to 350ppm U3O8 containing 3,600 to 7,300 tonnes or 8 to 16Mlb of contained U3O8.
Highway South Exploration Target
HIGHWAY SOUTH EXPLORATION TARGET
CUTOFF GRADE eU3O8 (ppm)
TONNES(MILLION)
GRADE eU3O8 (ppm) TONNES U3O8 (t)
POUNDS (MILLION) U3O8 (Mlb)
200 12 - 24 250 - 350 3,600 - 7,300 8 - 16
In accordance with clause 17 of the JORC Code 2012, the potential quantity and grade reported as Exploration Targets in this report must be considered conceptual in nature as there has been insufficient exploration and drilling to define a Mineral Resource and it is uncertain if further exploration and drilling will result in the determination of a Mineral Resource.
On gaining exploration access to E28/1898, and approval of Manhattan’s POW by DMP, the Company plans to complete approximately 250 aircore drill holes for 20,000 metres of infill resource definition drilling on 400 x 100m centres along the defined palaeochannel at Highway South. This drilling program, including the resource definition drilling planned for Double 8 and the Stallion South and Ponton prospects, will be completed within approximately one year of POW approval (Figure 3).
8. PONTON (WA)Interest: Manhattan 100%Operator: Manhattan Corporation Limited
Ponton is located along the palaeochannel to the southeast of Double 8. This prospect is within granted licence E28/1898 within the QVSNR (Figures 2 & 3).
The drilled uranium mineralisation at Ponton is also hosted in palaeochannels within reduced carbonaceous sands and weathered granitic sands in a confined aquifer overlying crystalline granite and Patterson Group shale basement.
PONTON EXPLORATION TARGET
The Ponton Exploration Target, reported in January 2014, is based on 24 drill holes totalling approximately 1,440 metres of drilling and down hole gamma logs. This drilling, on approximately 1km x 1km centres along the palaeochannel, is considered too wide to define a Mineral Resource to an inferred resource status.
Exploration Results have identified drilled Exploration Targets with uranium mineralisation potential, at a 200ppm U3O8 cutoff, for the Ponton prospect of 23 to 45Mt grading 250 to 350ppm U3O8 containing 6,800 to 13,600 tonnes or 15 to 30Mlb of contained U3O8.
For
per
sona
l use
onl
y

MANHATTAN CORPORATION LIMITED 142017 ANNUAL REPORT
REVIEW OF OPERATIONS
Ponton Exploration Target
PONTON EXPLORATION TARGET
CUTOFF GRADE eU3O8 (ppm)
TONNES(MILLION)
GRADE eU3O8 (ppm) TONNES U3O8 (t)
POUNDS (MILLION) U3O8 (Mlb)
200 12 - 24 250 - 350 3,600 - 7,300 8 - 16
In accordance with clause 17 of the JORC Code 2012, the potential quantity and grade reported as Exploration Targets in this report must be considered conceptual in nature as there has been insufficient exploration and drilling to define a Mineral Resource and it is uncertain if further exploration and drilling will result in the determination of a Mineral Resource.
On gaining exploration access to E28/1898, and approval of Manhattan’s POW by DMP, the Company plans to complete approximately 300 aircore drill holes for 24,000 metres of infill resource definition drilling on 400 x 100m centres along the defined palaeochannel at the Ponton prospect. This drilling program, including the resource definition drilling planned for Double 8 and the Stallion South and Highway South prospects, will be completed within approximately one year of POW approval (Figure 3).
SUMMARYManhattan completed a drilling program at Ponton in late 2016 that delivered the required information to complete and report, on 23 January 2017, an upgraded JORC Code 2012 Inferred Resource for the Double 8 uranium deposit at Ponton in WA of 17.2 million pounds of uranium oxide.
As well, maiden JORC Code 2012 combined Inferred Resource estimates at Ponton were reported in January 2017 totalling 6.97Mlb uranium oxide for the Stallion, Highway and Shelf uranium deposits to the north of the QVSNR.
The four Inferred Mineral Resources reported in January 2017 of over 24Mlb uranium oxide at Ponton are additional to the four Exploration Targets at Double 8, Stallion South, Highway South and Ponton previously reported in 2014 of 33 to 67Mlb uranium oxide.
Manhattan’s key licence at Ponton, E28/1898, is located mostly within the remote QVSNR, 200km east northeast of Kalgoorlie. Whilst a proposal has been developed to excise granted E28/1898 (that equates to 6% or 160km2 of the 2,700km2 QVSNR) from the reserve by a Reserves Amendment Bill in the WA parliament this proposal is now on hold.
The WA state Labor government’s stated policy of not to approve any new uranium mines, and their previously stated policy of not to allow mineral exploration in A Class reserves, suggests there is little likelihood of progressing the exploration and development of the Ponton uranium project over the next four year term of the present WA government.
With the current ban on progressing uranium projects in WA we are now developing a revised business plan to take the company forward and generate wealth for our investors.
ALAN J EGGERSExecutive Chairman22 September 2017
COMPETENT PERSON’S STATEMENTThe information in this Report that relates to reported Exploration Results or Mineral Resources is based on information compiled by Mr Alan J Eggers, who is a Corporate Member of the Australasian Institute of Mining and Metallurgy (“AusIMM”). Alan Eggers is a professional geologist and an executive director of Manhattan Corporation Limited. Mr Eggers has sufficient experience that is relevant to the style of mineralisation and type of mineral deposits being reported on in this Report and to the activity which he is undertaking to qualify as a Competent Person as defined in the 2012 Edition of the Australasian Code for Reporting of Exploration Results, Mineral Resources and Ore Reserves “JORC Code 2012”. Mr Eggers consents to the inclusion in this Report of the information on the Exploration Results or Mineral Resources based on his information in the form and context in which it appears.
For
per
sona
l use
onl
y

15
DIRECTORS’ REPORT
MANHATTAN CORPORATION LIMITED2017 ANNUAL REPORT
DIRECTORS' REPORT
DIRECTORS’ REPORT
The Directors have pleasure in presenting their Annual Report and Financial Statements for Manhattan Corporation Limited (“Manhattan”) for the year ended 30 June 2017.
For
per
sona
l use
onl
y

16
DIRECTORS’ REPORT
MANHATTAN CORPORATION LIMITED2017 ANNUAL REPORT
DIRECTORS' REPORT
PRINCIPAL ACTIVITIES
The principal continuing activity of Manhattan during the year was mineral exploration and development and evaluation of mineral projects and corporate opportunities in the resource sector world wide.
There has been no significant change in the nature of Manhattan’s business activities during the year under review.
OPERATING RESULTS
The loss of the Company for the year, after provision for income tax, amounted to $2,799,651 (2016: $407,546).
DIVIDENDS
No dividend has been paid or recommended by the Directors since the commencement of the year.
REVIEW OF OPERATIONS
Manhattan listed on the Australian Securities Exchange (“ASX”) on 29 January 2008 following an Initial Public Offering.
In the last Financial Year to 30 June 2017 the Company has focussed on exploration and development of its Western Australian uranium project at Ponton.
Manhattan Corporation Limited’s (“Manhattan”) flagship Ponton uranium project is located approximately 200km northeast of Kalgoorlie on the edge of the Great Victoria Desert in WA. The Company has 100% control of around 690km2 of exploration tenements underlain by Tertiary palaeochannels within the Gunbarrel Basin. These palaeochannels are known to host a number of uranium deposits and drilled uranium prospects.
The Company is drill testing and developing palaeochannel sand hosted uranium mineralisation amenable to in-situ metal recovery (“ISR”). Drilling within the palaeochannels has established extensive continuity of the carbonaceous sand hosted uranium mineralisation for over 55km of strike within the Company’s licences at Ponton.
On 23 January 2017 Manhattan reported an upgraded JORC Code 2012 Inferred Resource for the Double 8 uranium deposit at Ponton in WA of 17.2 million pounds (“Mlb”) of uranium oxide (“U3O8”) at a 200ppm cutoff. As well, maiden JORC Code 2012 combined Inferred Resources estimates for three uranium deposits at Ponton of 21.5 million tonnes (“Mt”), grading from 137 to 151ppm U3O8 totalling 6.97Mlb U3O8 at a 100ppm cutoff were reported.
The four Inferred Resource estimates reported for Ponton project are:
� Double uranium deposit of 17.2Mlb U3O8 at 200ppm cut off; � Stallion uranium deposit of 3.3Mlb U3O8 at 100ppm cutoff; � Highway uranium deposit of 1.9Mlb U3O8 at 100ppm cutoff; and � Shelf uranium deposit of 1.8Mlb U3O8 at 100ppm cutoff
Exploration Results at Ponton, reported on 7 February 2014, have also identified four wide spaced drilled Exploration Targets with tonnage ranges of 4 to 45Mt, grade ranges of 250 to 450ppm U3O8 totalling 33 to 67Mlb U3O8 at the 200ppm U3O8 cutoff. In accordance with clause 17 of the JORC Code 2012, the potential quantity and grade reported as Exploration Targets in this Report must be considered conceptual in nature as there has been insufficient exploration and drilling to define a Mineral Resource and it is uncertain if further exploration and drilling will result in the determination of a Mineral Resource.
The four Exploration Targets reported for the Ponton project are:
� Double 8 of between 2.5 and 5.5Mlb U3O8; � Stallion South of between 8 and 16Mlb U3O8; � Highway South of between 8 and 16Mlb U3O8; and � Ponton of between 15 and 30Mlb U3O8
The four Inferred Resource estimates and four Exploration Targets at Ponton reported here were prepared by the Company’s independent resource consultants H&S Consultants (“H&SC”).
The Double 8 uranium deposit and the four Exploration Targets at Double 8, Stallion South, Highway South and Ponton are all located on granted exploration licence, E28/1898, located mostly within the Queen Victoria Spring Nature Reserve (“QVSNR”).
For
per
sona
l use
onl
y
17
DIRECTORS’ REPORT
MANHATTAN CORPORATION LIMITED2017 ANNUAL REPORT
DIRECTORS' REPORT
The four Mineral Resource Estimates reported in January 2017, and the four Exploration Targets previously reported in 2014, are based on actual exploration results including Manhattan’s aircore and sonic drilling of over 767 holes and 52,700 metres of drilling along the palaeochannels immediately to the north of QVSNR in 2009 and 2010, 21 holes and 1,170 metres of drilling by Manhattan in 2016 and over 70km of conductive palaeochannels defined by the Company’s airborne EM and magnetic surveys within QVSNR and uranium mineralised sands discovered in previous drilling of 114 holes and 6,900 metres of drilling and down hole gamma logging by PNC Exploration (“PNC”) and Uranerz Limited (“Uranerz”) in the area in the 1980’s.
Whilst a proposal has been developed to excise granted E28/1898 (that equates to 6% or 160km2 of the 2,700km2 QVSNR) from the reserve by a Reserves Amendment Bill in the WA parliament this proposal is now on hold. The WA state Labor government’s policy of not to approve any new uranium mines, or permit mineral exploration in A Class reserves, suggests there is little likelihood of progressing the exploration and development of the Ponton uranium project over the next four year term of the present WA government.
The Company continues to review a number of M&A proposals and advanced uranium project acquisition opportunities to grow the Company and generate additional shareholder value.
A full review of operations for the Financial Year, together with future prospects that form part of this Report, are presented in the Chairman’s Review and the Review of Operations on pages 2 to 14 of this Annual Report.
SIGNIFICANT CHANGES IN STATE OF AFFAIRS
In the opinion of the Directors there were no significant changes in the state of affairs of the Company that occurred during the Financial Year under review.
MATTERS SUBSEQUENT TO THE END OF THE FINANCIAL YEAR
There has not arisen since the end of the Financial Year any item, transaction or event of a material nature, in the opinion of the Directors of the Company, to affect significantly the operation of the Company, the results of those operations, or the state of affairs of the Company in future Financial Years.
LIKELY DEVELOPMENTS AND EXPECTED RESULTS OF OPERATIONS
There is no likely or expected change to the operations of the Company to systematically explore the Company’s key projects, in particular the Ponton projects. The Company will continue to review all business development opportunities that present themselves in an effort to enhance the exploration and development portfolio. This activity may or may not lead to future acquisitions, divestments, joint ventures and other changes to the Company’s project portfolio.
ENVIRONMENTAL OBLIGATIONS
The Company operates within the resources sector and conducts its business activities with respect for the environment while continuing to meet the expectations of the shareholders, employees and suppliers. The Company’s exploration activities are currently regulated by significant environmental regulation under laws of the Commonwealth and states and territories of Australia. The Company aims to ensure that the highest standard of environmental care is achieved, and that it complies with all relevant environmental legislation. The Directors are mindful of the regulatory regime in relation to the impact of the organisational activities on the environment. There have been no known breaches by the Company during the Financial Year.
In February 2011 Manhattan adopted an Environmental Policy that included an Environmental Management Plan for Queen Victoria Spring Nature Reserve, and included the Environmental Policy in its Corporate Governance Statement. CORPORATE GOVERNANCE
In recognising the need for the highest standards of corporate behaviour and accountability, the Directors of Manhattan support and have adhered to the ASX principles of corporate governance (as appropriate for a company of Manhattan’s size). In accordance with ASX Listing Rule 4.10.3 the Company has elected to publish its Corporate Governance Statement on the Company web site at www.manhattancorp.com.au/corporategovernanceF
or p
erso
nal u
se o
nly

18
DIRECTORS’ REPORT
MANHATTAN CORPORATION LIMITED2017 ANNUAL REPORT
DIRECTORS' REPORT
DIRECTORS AND COMPANY SECRETARY
The following persons held office as Directors and Company Secretary of Manhattan during the year. All Directors, and the Company Secretary, were in office for the entire period unless otherwise stated:
Alan J Eggers Marcello CardaciJohn A G SetonSam Middlemas (Resigned 28 September 2016) John G Ribbons (Appointed 14 October 2016)
PROFILE OF DIRECTORS AND COMPANY SECRETARY
Alan J Eggers B.Sc, B.Sc(Hons), M.Sc, F.S.E.G., MAusIMM, MAIG EXECUTIVE CHAIRMAN
Alan Eggers is a professional geologist with over 35 years of international experience in exploration for uranium, iron ore, base metals, precious metals and industrial minerals. He was the founding director and managing director for 20 years of listed uranium company Summit Resources Limited. He built Summit into an ASX top 200 company with a market capitalisation of $1.2 billion until its takeover by Paladin Energy Ltd in May 2007 when he resigned from the board. His professional experience has included management of mineral exploration initiatives and corporate administration of private and public companies. Alan is a director and Executive Chairman of unlisted Trans-Tasman Resources Limited (1 October 2014 to current), director of Ocean Technologies Limited (19 December 2014 to current), managing director of Wesmin Corporate Pty Ltd, formerly a director of ASX listed Zedex Minerals Limited (resigned January 2010), was a founding director of the Australian Uranium Association and holds a number of directorships in private companies.
Marcello Cardaci B.Juris, LLB, B.Com NON EXECUTIVE DIRECTOR
Marcello Cardaci is a partner in the Australian legal practice of Gilbert + Tobin. Mr Cardaci holds degrees in law and commerce and is experienced in a wide range of corporate and commercial matters with a particular emphasis on public and private equity raisings and mergers and acquisitions. Gilbert + Tobin specialises in the provision of legal advice to companies involved in various industries including resources and manufacturing. Mr Cardaci is a director of Energia Minerals Ltd (7 October 2014 to current) and was formerly a director of Sphere Minerals Limited (2 June 1999 to 17 November 2010), Tianshan Goldfields Limited (2 February 2009 to 13 November 2010), Forge Group Limited (4 June 2007 to 24 October 2013), Lemur Resources Ltd (8 November 2010 to 5 November 2013) and Style Ltd (17 May 2013 to 10 August 2015).
John A G Seton LLM(Hons) NON EXECUTIVE DIRECTOR
John Seton is an Auckland based solicitor with extensive experience in commercial law, stock exchange listed companies and the mineral resource sector. John is a director of Besra Gold Inc (17 November 2016 to current), ASX listed Wolfstrike Rentals Group Ltd (23 June 2016 to current), unlisted Trans-Tasman Resources Limited (1 October 2016 to current), a former director of Besra Gold Inc (July 1999 to February 2012), former director and chairman of ASX listed Summit Resources Limited (until May 2007), Zedex Minerals Limited (resigned January 2010) and NZX listed SmartPay Limited (resigned January 2011). John holds or has held directorships in several companies listed on the ASX and NZX including Kiwi Gold NL, Kiwi International Resources NL, Iddison Group Vietnam Limited and Max Resources NL. John was also the former chief executive of IT Capital Limited, former Chairman of the Vietnam/New Zealand Business Council and former Chairman of The Mud House Wine Group Limited. Mr Seton also holds a number of private company directorships.
COMPANY SECRETARY
John G Ribbons B.Bus., CPA, ACIS COMPANY SECRETARY
John Ribbons was appointed Company Secretary and Chief Financial Officer on 14 October 2016. John is a Chartered Secretary who has worked within the resources industry for over 20 years in the capacity of group financial controller, chief financial officer and company secretary. Mr Ribbons has extensive knowledge and experience with ASX listed exploration and production companies. He has considerable site based experience with operating mines and has been involved with the listing of a number of exploration companies on ASX. Mr Ribbons has experience of capital raising, ASX and TSX compliance and regulatory requirements. Mr Ribbons is currently a director of Montezuma Mining Company Ltd (14 July 2010 to current) and has not held any other directorships in the last three years.
For
per
sona
l use
onl
y

19
DIRECTORS’ REPORT
MANHATTAN CORPORATION LIMITED2017 ANNUAL REPORT
DIRECTORS' REPORT
REMUNERATION REPORT
The Remuneration Report for the Financial Year ended 30 June 2017 is set out under the following main headings:
(A) Principles Used to Determine the Nature and Amount of Remuneration;
(B) Details of Remuneration;
(C) Service Agreements;
(D) Share Based Compensation;
(E) Additional Information; and
(F) Loans to Directors and Executives.
The information provided in this remuneration report has been audited as required by section 308(3C) of the Corporations Act 2001.
(A) Principles Used to Determine the Nature and Amount of Remuneration
The primary functions of the Remuneration Committee are to:
� Make specific recommendations to the Board on remuneration of Director’s and senior officers;
� Recommend the terms and conditions of employment for the Executive Chairman;
� Undertake a review of the Executive Chairman’s performance, at least annually, including setting with the Executive Chairman’s goals for the coming year and reviewing progress in achieving those goals;
� Consider and report to the Board on the recommendations of the Executive Chairman on the remuneration of all Directors and senior officers; and
� Develop and facilitate a process for Board and Director evaluation.
The Board has elected not to establish a remuneration committee based on the size of the organisation and has instead agreed to meet as deemed necessary and allocate the appropriate time at its regular Board meetings.
Non Executive DirectorsFees and payments to Non Executive Directors reflect the demands which are made on, and the responsibilities of, the Directors. Non Executive Directors’ fees and payments are reviewed annually by the Board. The Executive Chairman’s fees are determined independently to the fees of Non Executive Directors based on comparative roles in the external market. The Executive Chairman is not present at any discussions relating to determination of his own remuneration.
Directors’ FeesThe current base remuneration was reviewed in July 2010 in light of current conditions and the cash reserves of the Company. Non Executive Directors’ fees are determined within an aggregate Directors’ fee pool limit, which is periodically recommended for approval by shareholders. The maximum Directors fees approved by shareholders and payable currently stands at $200,000 per annum.
The non executive Director’s fees were reduced in 2014 from $35,000 per annum to $17,500 per annum to conserve the Company’s cash reserves and have applied during the current Financial Year. It is intended these Director’s fees will be reinstated to the original annual rate when the Company’s financial position allows.
Base Fees 2017 2016
Non Executive Directors $17,500 $17,500 Additional Fees
A Director may also be paid fees or other amounts as the Directors determine if a Director performs special duties or otherwise performs services outside the scope of the ordinary duties of a Director. A Director may also be reimbursed for out of pocket expenses incurred as a result of their directorship or any special duties.
For
per
sona
l use
onl
y

20
DIRECTORS’ REPORT
MANHATTAN CORPORATION LIMITED2017 ANNUAL REPORT
DIRECTORS' REPORT
Retirement Allowances for Directors
Superannuation contributions required under the Australian superannuation guarantee legislation (currently 9.5%) are made as part of Directors’ overall fee entitlements.
Executive Pay
The Executive pay and reward framework has two components:
� Base pay and benefits, including superannuation; and
� Long term incentives through issue of share options.
The combination of these comprises the Executive’s total remuneration. The Company revisits its long term equity linked performance incentives for Executives as deemed necessary by the Board. The equity linked performance incentives take the form of share options to provide incentives for the Directors and senior management to drive shareholder value through growth in share price.
Base Pay
Structured as a total employment cost package which may be delivered as a combination of cash and prescribed non financial benefits at the Executives’ discretion. Executives are offered a competitive base pay that comprises the fixed component of pay and rewards. Base pay for Executives is reviewed annually to ensure the Executive’s pay is competitive with the market. An Executive’s pay is also reviewed every 12 months and will be adjusted in line with the Executive’s performance and current market conditions.
Benefits
Executives and Key Management Personnel are entitled to receive additional benefits or allowances.
Long Term Incentives
The Executives are entitled to share options as approved by shareholders.
(B) Details of Remuneration
Amounts of Remuneration
Details of the remuneration of the Key Management Personnel (as defined in AASB 124 Related Party Disclosures) of Manhattan Corporation Limited for the Financial Year are set out in the following tables.
The Key Management Personnel are the Directors and Company Secretary of Manhattan Corporation Limited during the Financial Year which were:
Alan J Eggers Executive Chairman Marcello Cardaci Non Executive Director John A G Seton Non Executive Director Sam Middlemas Company Secretary (Resigned 28 September 2016)
For
per
sona
l use
onl
y

21
DIRECTORS’ REPORT
MANHATTAN CORPORATION LIMITED2017 ANNUAL REPORT
DIRECTORS' REPORT
Directors and Executives Remuneration
EXECUTIVE REMUNERATION SHORT TERM BENEFITS
EQUITY COMPENSATION TOTAL PERCENTAGE
OPTIONS
Cash Salary & Fees Options
30 June 2017
Directors $ $ $ %Alan J Eggers1 210,000 - 210,000 -Marcello Cardaci 17,500 - 17,500 -John A G Seton2 17,500 - 17,500 -Key Management Personnel -Sam Middlemas3 11,760 - 11,760 -Total Compensation 256,760 - 256,760 -
30 June 2016Directors $ $ $ %Alan J Eggers1 210,000 - 210,000 -Marcello Cardaci 17,500 - 17,500 -John A G Seton2 17,500 - 17,500 -Key Management Personnel -Sam Middlemas3 26,650 - 26,650 -Total Compensation 271,650 - 271,650 -
1 Mr Eggers was appointed Executive Chairman on 21 July 2009. All fees were paid under a Consultancy Agreement with Wesmin Corporate Pty Ltd.2 Mr Seton was appointed as a Non Executive Director on 21 July 2009. All fees paid to his private Company Jura Trust Limited.3 Mr Middlemas resigned as Company Secretary on 28 September 2016.
(C) Service Agreements
On appointment to the Board, all Non Executive Directors enter into a service agreement with the Company in the form of a letter of appointment. The letter summarises the Board policies and terms, including compensation, relevant to the office of Director.
Remuneration and other terms of employment for Executive Directors and Key Management Personnel are formalised in service agreements. Each of these agreements provide for the provision of performance related conditions and other benefits including an allocation of options. Other major provisions of the agreements relating to remuneration are set out below.
Alan J Eggers Executive Chairman
� Services provided by consulting company Wesmin Corporate Pty Ltd (“Wesmin”);
� Term of agreement. Continues indefinitely until cancelled by the Company or the Executive;
� Consulting fees of $360,000 per annum plus reimbursement of relevant expenses and costs. In 2014 the consulting fees were reduced to $210,000 per annum to conserve the Company’s cash reserves and have applied during the current Financial Year. It is intended these consulting fees will be reinstated to the original annual rate when the Company’s financial position allows.
� Agreement and fees reviewed by a committee of the Board of Directors on a regular basis; and
� Termination of employment by the Company requires 12 month notice without cause and immediately for cause related events.
For
per
sona
l use
onl
y

22
DIRECTORS’ REPORT
MANHATTAN CORPORATION LIMITED2017 ANNUAL REPORT
DIRECTORS' REPORT
(D) Share Based Compensation
Options
Options over shares in Manhattan are granted to Directors, consultants and employees as consideration and are approved by a general meeting of shareholders. The options are designed to provide long term incentives for Executives and non Executives to deliver long term shareholder returns. Participants are granted options which are granted for no issue price and the exercise prices will be such price as determined by the Board (in its discretion) on or before the date of issue. Options are granted for no consideration.
The terms and conditions of each grant of options (up to 30 June 2017) affecting remuneration in the previous, this or future reporting periods are as follows:
GRANT DATEDATE
VESTED AND EXERCISABLE
EXPIRY DATE EXERCISE PRICE
VALUE PER OPTION AT
GRANT DATEPERCENT VESTED
28 November 2014 28 November 2014 28 November 2019 $0.10 $0.013 100%
4 April 2016 4 April 2016 15 April 2019 $0.001 0.000 100%
Options granted carry no dividend or voting rights.
During the year there were no options provided as remuneration to Directors and Key Management Personnel of the Company. All options issued in 2014 are fully vested. When exercisable, each option is convertible into one ordinary share of Manhattan. There were no new shares issued on exercise of employee incentive options by a Company Director or officer during the Financial Year ended 30 June 2017 (2016: Nil).
Further information on the options is set out in Note 21 to the Financial Statements.
The assessed fair value at grant date of options granted to the individuals is allocated equally over the period from grant date to vesting date, and the amount is included in the remuneration tables above. Fair values at grant date are independently determined using a Black and Scholes option pricing model that takes into account the exercise price, the term of the option, the impact of dilution, the share price at grant date and expected price volatility of the underlying share, the expected dividend yield and the risk free interest rate for the term of the option.
(E) Additional Information
Details of Remuneration: Options
Options are issued to Directors and Executives as part of their remuneration. The options are not issued based on performance criteria, but are issued to the majority of Directors and Executives of Manhattan Corporation Limited to increase goal congruence between Executives, Directors and shareholders. Options issued to Directors and Key Management Personnel as at 30 June 2017 were as follows:
DIRECTORS OF MANHATTAN
YEAR GRANTED
VESTED PERCENTAGE
FINANCIAL YEARS
IN WHICH OPTIONS VESTED
NUMBER OF
OPTIONS ISSUED
MAXIMUM TOTAL
VALUE OF GRANT YET TO VEST
$Alan J Eggers 2014 100 2015 9,000,000 -Marcello Cardaci 2014 100 2015 2,000,000 -John A G Seton 2014 100 2015 2,000,000 -
For
per
sona
l use
onl
y

23
DIRECTORS’ REPORT
MANHATTAN CORPORATION LIMITED2017 ANNUAL REPORT
DIRECTORS' REPORT
(F) Loans to Directors and Executives
There were no loans to Directors and Executives during the Financial Year.
This is the end of the Audited Remuneration Report.
DIRECTORS’ INTERESTS
The relevant interest of each Director in the shares or options issued by the Company as notified by the Directors to the ASX in accordance with S205G(1) of the Corporations Act 2001, at the date of this report are as follows:
DIRECTORS ORDINARY SHARES OPTIONS OVER ORDINARY SHARES
Alan J Eggers 33,420,947 9,000,000
Marcello Cardaci 3,567,241 2,000,000
John A G Seton 24,002,976 2,000,000
SHARES UNDER OPTION
Unissued ordinary shares of Manhattan under option at the date of this Report are as follows:
DATE OPTIONS GRANTED EXPIRY DATE ISSUE PRICE OF
SHARESNUMBER UNDER
OPTION
28 November 2014 28 November 2019 $0.10 13,000,000
4 April 2016 15 April 2019 $0.001 3,000,000
No option holder has any right under the options to participate in any other share issue of the Company or any other entity.
SHARES ISSUED ON THE EXERCISE OF OPTIONS
There were no options exercised during the Financial Year.
DIRECTORS’ MEETINGS
The number of Directors’ board meetings and the number of board meetings attended by each of the Directors of the Company for the time the Director held office during the Financial Year were:
DIRECTORS NUMBER ELIGIBLE TO ATTEND NUMBER ATTENDED
Alan J Eggers 6 6 Marcello Cardaci 6 5 John A G Seton 6 6F
or p
erso
nal u
se o
nly

24
DIRECTORS’ REPORT
MANHATTAN CORPORATION LIMITED2017 ANNUAL REPORT
DIRECTORS' REPORT
PROCEEDINGS ON BEHALF OF THE COMPANY
No person has applied to the Court under section 237 of the Corporations Act 2001 for leave to bring proceedings on behalf of the Company, or to intervene in any proceedings to which the Company is a party, for the purpose of taking responsibility on behalf of the Company for all or part of those proceedings.
No proceedings have been brought or intervened in on behalf of the Company with leave of the Court under section 237 of the Corporations Act 2001.
NON AUDIT SERVICES
The Company may decide to employ the Auditor on assignments additional to their statutory audit duties where the Auditor’s expertise and experience with the Company is important. The Board has considered the position and is satisfied that the provision of non audit services is compatible with the general standard of independence for auditors imposed by the Corporations Act 2001, and would not compromise the Auditor’s independence.
During the year the following fees were paid or payable for services provided by the Auditor of the Company, its related practices and non related audit firms:
AUDIT SERVICES 2017 2016
Rothsay Chartered Accountants $ $ Audit and Review of Financial Statements 24,500 20,000
Tax Work under the Corporations Act 2001 1,000 3,000
Total Remuneration for Audit Services 25,500 23,000
DIRECTORS’ AND OFFICERS INSURANCE
During the Financial Year, Manhattan paid a premium to insure the Directors and the Company Secretary.
The liabilities insured are legal costs that may be incurred in defending civil or criminal proceedings that may be brought against the officers in their capacity as officers of the Company, and any other payments arising from liabilities incurred by the officers in connection with such proceedings. This does not include such liabilities that arise from conduct involving a wilful breach of duty by the officers or the improper use by the officers of their position or of information to gain advantage for themselves or someone else or to cause detriment to the Company. It is not possible to apportion the premium between amounts relating to the insurance against legal costs and those relating to other liabilities.
AUDITORS’ INDEPENDENCE DECLARATION
A copy of the Auditors’ Independence Declaration as required under section 307C of the Corporations Act 2001 is set out on page 28 of the Annual Report.
Rothsay Chartered Accountants are appointed to office in accordance with section 327 of the Corporations Act 2001 .
Signed in accordance with a Resolution of the Directors.
DATED at Perth on 22 September 2017
ALAN J EGGERSExecutive ChairmanF
or p
erso
nal u
se o
nly

25
DIRECTORS’ REPORT
MANHATTAN CORPORATION LIMITED2017 ANNUAL REPORT
DIRECTORS' REPORTAUDITOR’S REPORTF
or p
erso
nal u
se o
nly

26
DIRECTORS’ REPORT
MANHATTAN CORPORATION LIMITED2017 ANNUAL REPORT
DIRECTORS' REPORTAUDITOR’S REPORTF
or p
erso
nal u
se o
nly

27
DIRECTORS’ REPORT
MANHATTAN CORPORATION LIMITED2017 ANNUAL REPORT
DIRECTORS' REPORTAUDITOR’S REPORTF
or p
erso
nal u
se o
nly

28
AUDITOR’S DECLARATION
MANHATTAN CORPORATION LIMITED2017 ANNUAL REPORT
For
per
sona
l use
onl
y

29MANHATTAN CORPORATION LIMITED2017 ANNUAL REPORT
FINANCIAL STATEMENTS
FINANCIAL STATEMENTS
CONSOLIDATED STATEMENT OF COMPREHENSIVE INCOME For the Year Ended 30 June 2017
Note 2017 2016
REVENUE $ $
Revenue from Continuing Operations 5 2,536 3,911
EXPENSES
Expenses Excluding Finance Costs 6 (2,805,771) (523,576)
Finance Costs (391) (381)
Loss Before Income Tax (2,803,626) (520,046)
Income Tax Expense 8 3,975 112,500
Loss For The Year (2,799,651) (407,546)
Total Comprehensive Loss for the Year Attributable to Members of Manhattan Corporation Limited
(2,799,651) (407,546)
Basic and Diluted Loss Per Share 7 (2.05) cents (0.36) cents
The Consolidated Statement of Comprehensive Income should be read in conjunction with the accompanying Notes that form part of these Financial Statements.
FINANCIAL STATEMENTSF
or p
erso
nal u
se o
nly

FINANCIAL STATEMENTS
30MANHATTAN CORPORATION LIMITED2017 ANNUAL REPORT
CONSOLIDATED STATEMENT OF FINANCIAL POSITIONAs at 30 June 2017
Note 2017 2016
ASSETS $ $
Current Assets
Cash and Cash Equivalents 10 187,493 581,494
Trade and Other Receivables 11 10,880 110,827
Total Current Assets 198,373 692,321
Non Current Assets
Exploration and Evaluation Expenditure 12 3,000,000 5,122,934
Total Non Current Assets 3,000,000 5,122,934
TOTAL ASSETS 3,198,373 5,815,255
LIABILITIES
Current Liabilities
Trade and Other Payables 13 77,107 34,338
Total Current Liabilities 77,107 34,338
TOTAL LIABILITIES 77,107 34,338
NET ASSETS 3,121,266 5,780,917
EQUITY
Contributed Capital 14 17,629,441 17,489,441
Reserves 15 4,857,328 4,857,328
Accumulated Losses (19,365,503) (16,565,852)
TOTAL EQUITY 3,121,266 5,780,917
The Consolidated Statement of Financial Position should be read in conjunction with the accompanying Notes that form part of these Financial Statements.
For
per
sona
l use
onl
y

FINANCIAL STATEMENTS
31MANHATTAN CORPORATION LIMITED2017 ANNUAL REPORT
CONSOLIDATED STATEMENT OF CHANGES IN EQUITY For the Year Ended 30 June 2017
Consolidated Note Contributed Equity
Options Reserve
Accumulated Losses Total
$ $ $ $
Balance at 1 July 2015 16,893,633 4,857,328 (16,158,306) 5,592,655
Total Comprehensive Loss - - (407,546) (407,546)
Transactions with Owners in Their Capacity as Owners Shares Issued During the Year 595,808 - - 595,808
Balance at 30 June 2016 17,489,441 4,857,328 (16,565,852) 5,780,917
Total Comprehensive Loss - - (2,799,651) (2,799,651) Transactions with Owners in their Capacity as Owners Shares Issued During the Year 140,000 - - 140,000
Balance at 30 June 2017 17,629,441 4,857,328 (19,365,503) 3,121,266
The Consolidated Statement of Changes in Equity should be read in conjunction with the accompanying Notes that form part of these Financial Statements.
For
per
sona
l use
onl
y

FINANCIAL STATEMENTS
32MANHATTAN CORPORATION LIMITED2017 ANNUAL REPORT
CONSOLIDATED STATEMENT OF CASH FLOWS For the Year Ended 30 June 2017
Note 2017 2016
Cash Flows From Operating Activities $ $ Payments to Suppliers and Employees (233,740) (249,038) Proceeds from R&D Refund 100,328 85,287 Interest Received 4,178 3,910 Net Cash Flows Used In Operating Activities 20 (129,234) (159,841)
Cash Flows From Investing Activities Payments For Exploration and Evaluation (404,767) (293,764) Net Cash Flows Used In Investing Activities (404,767) (293,764)
Cash Flows From Financing Activities Proceeds From Issue of Shares 140,000 595,808 Net Cash Flows From Financing Activities 140,000 595,808
Net (Decrease)/Increase In Cash and Cash Equivalents (394,001) 142,203 Cash and Cash Equivalents at Beginning of Period 581,494 439,291 Cash and Cash Equivalents at End of Period 10 187,493 581,494
The Consolidated Statement of Cash Flows should be read in conjunction with the accompanying Notes that form part of these Financial Statements.
For
per
sona
l use
onl
y

FINANCIAL STATEMENTSNOTES TO THE FINANCIAL STATEMENTS
FOR THE YEAR ENDING 30 JUNE 2017
33
FINANCIAL STATEMENTS
MANHATTAN CORPORATION LIMITED2017 ANNUAL REPORT
NOTES TO THE FINANCIAL STATEMENTSFOR THE YEAR ENDING 30 JUNE 2017
1. SUMMARY OF SIGNIFICANT ACCOUNTING POLICIES
The principal accounting policies adopted in the preparation of the Financial Report are set out below. These policies have been consistently applied to all the years presented, unless otherwise stated.
The Financial Statements are for the consolidated entity consisting of Manhattan Corporation Limited and its subsidiary. The Financial Statements are presented in the Australian currency. Manhattan Corporation Limited is a company limited by shares, domiciled and incorporated in Australia. The Financial Statements were authorised for issue by the Directors on 22 September 2017. The Directors have the power to amend and reissue the Financial Statements.
(a) Basis of Preparation
This general purpose Financial Report has been prepared in accordance with Australian Accounting Standards, other authoritative pronouncements of the Australian Accounting Standards Board, Australian Accounting Interpretations and the Corporations Act 2001.
Compliance with IFRS
The Financial Statements of Manhattan Corporation Limited also complies with International Financial Reporting Standards (“IFRS”) as issued by the International Accounting Standards Board.
Historical Cost Convention
These Financial Statements have been prepared under the historical cost convention.
Critical Accounting Estimates
The preparation of Financial Statements in conformity with AIFRS requires the use of certain critical accounting estimates. It also requires management to exercise its judgement in the process of applying the Company’s accounting policies. The areas involving a higher degree of judgement or complexity, or areas where assumptions and estimates are significant to the Financial Statements are disclosed in Note 2.
Going Concern
The Company incurred a loss for the year of $2,799,651 (2016: $407,546) and a net cash outflow from operating activities of $129,234 (2016: $159,841).
At 30 June 2017 the Group had cash assets of $187,493 (2016: $581,494) and working capital of $121,266 (2016: $657,983).
The Company has reduced operating cash outflow to minimal levels while it assesses the market and opportunities. Based on this fact, the Directors consider it appropriate that the finance report be prepared on a going concern basis.
(b) Basis of Consolidation
The consolidated Financial Statements incorporate the assets and liabilities of the Company’s wholly owned subsidiary Manhattan Resources Pty Ltd as at 30 June 2017 and the results of the subsidiary for the year then ended. Subsidiaries are all those entities (including special purpose entities) over which the Group has the power to govern the financial and operating policies, so as to obtain benefits from its activities, generally accompanying a shareholding of more than one-half of the voting rights. The existence and effect of potential voting rights that are currently exercisable or convertible are considered when assessing whether the Group controls another entity.
For
per
sona
l use
onl
y

FINANCIAL STATEMENTSNOTES TO THE FINANCIAL STATEMENTS
FOR THE YEAR ENDING 30 JUNE 2017
34
FINANCIAL STATEMENTS
MANHATTAN CORPORATION LIMITED2017 ANNUAL REPORT
The Financial Statements of the subsidiaries are prepared for the same reporting period as the Parent Entity, using consistent accounting policies. Accounting policies of subsidiaries have been changed where necessary to ensure consistency with the policies adopted by the Group.
Subsidiaries are fully consolidated from the date on which control is transferred to the Group. They are de-consolidated from the date that control ceases.
Intercompany transactions and balances, income and expenses and profits and losses between Group companies, are eliminated. Minority interests in the net assets of consolidated subsidiaries are identified separately from the Group’s equity therein. Minority interests consist of the amount of those interests at the date of the original business combination and the minority’s share of changes in equity since the date of the combination. Losses applicable to the minority in excess of the minority’s interest in the subsidiary’s equity are allocated against the interests of the Group except to the extent that the minority has a binding obligation and is able to make an additional investment to cover the losses.
Investments in subsidiaries are accounted for at cost in the Statement of Financial Position of the Company.
(c) Segment Reporting
Operating segments are reported in a manner consistent with the internal reporting provided to the chief operating decision maker. The chief operating decision maker, who is responsible for allocating resources and assessing performance of the operating segments, has been identified as the full Board of Directors.
(d) Revenue Recognition
Revenue is measured at the fair value of the consideration received or receivable. Amounts disclosed as revenue are net of returns, trade allowances, rebates and amounts collected on behalf of third parties.
The Group recognises revenue when the amount of revenue can be reliably measured, it is probable that future economic benefits will flow to the entity and specific criteria have been met for each of the Group’s activities as described below. The amount of revenue is not considered to be reliably measurable until all contingencies relating to the sale have been resolved. The Group bases its estimates on historical results, taking into consideration the type of customer, the type of transaction and the specifics of each arrangement.
(e) Income Tax
The income tax expense or revenue for the period is the tax payable on the current period’s taxable income based on the national income tax rate for each jurisdiction adjusted by changes in deferred tax assets and liabilities attributable to temporary differences and to unused tax losses.
Deferred income tax is provided in full, using the liability method, on temporary differences arising between the tax bases of assets and liabilities and their carrying amounts in the Consolidated Financial Statements. However, the deferred income tax is not accounted for if it arises from initial recognition of an asset or liability in a transaction other than a business combination that at the time of the transaction affects neither accounting, nor taxable profit or loss. Deferred income tax is determined using tax rates (and laws) that have been enacted or substantially enacted by the year ending 30 June and are expected to apply when the related deferred income tax asset is realised or the deferred income tax liability is settled.
Deferred tax assets are recognised for deductible temporary differences and unused tax losses only if it is probable that future taxable amounts will be available to utilise those temporary differences and losses. Deferred tax liabilities and assets are not recognised for temporary differences between the carrying amount and tax bases of investments in controlled entities where the parent entity is able to control the timing of the reversal of the temporary differences and it is probable that the differences will not reverse in the foreseeable future.
Deferred tax assets and liabilities are offset when there is a legally enforceable right to offset current tax assets and liabilities and when the deferred tax balances relate to the same taxation authority. Current tax assets and tax liabilities are offset where the entity has a legally enforceable right to offset and intends either to settle on a net basis, or to realise the asset and settle the liability simultaneously. Current and deferred tax balances attributable to amounts recognised directly in equity are also recognised directly in equity.
For
per
sona
l use
onl
y

FINANCIAL STATEMENTSNOTES TO THE FINANCIAL STATEMENTS
FOR THE YEAR ENDING 30 JUNE 2017
35
FINANCIAL STATEMENTS
MANHATTAN CORPORATION LIMITED2017 ANNUAL REPORT
(f) Impairment of Assets
For the purposes of assessing impairment, assets are grouped at the lowest levels for which there are separately identifiable cash inflows which are largely independent of the cash inflows from other assets or company of assets (cash generating units). Non financial assets other than goodwill that suffered impairment are reviewed for possible reversal of the impairment at each reporting date.
(g) Acquisition of Assets
Assets including exploration interests acquired are initially recorded at their cost of acquisition on the date of acquisition, being the fair value of the consideration provided plus incidental costs directly attributable to the acquisition.
When equity instruments are issued as consideration, their market price at the end of acquisition is used as fair value, except where the notional price at which they could be placed in the market is a better indication of fair value.
(h) Cash and Cash Equivalents
For cash flow statement presentation purposes, cash and cash equivalents includes cash on hand, deposits held at call with financial institutions, other short term, highly liquid investments with original maturities of three months or less that are readily convertible to known amounts of cash and which are subject to an insignificant risk of changes in value, and bank overdrafts.
(i) Exploration and Evaluation Expenditure
Exploration, evaluation and development expenditure incurred is accumulated in respect of each identifiable area of interest. These costs are only carried forward to the extent that they are expected to be recouped through the successful development of the area or where activities in the area have not yet reached a stage that permits reasonable assessment of the existence of economically recoverable reserves.
Accumulated costs in relation to an abandoned area are written off in full against profit in the year in which the decision to abandon the area is made.
When production commences, the accumulated costs for the relevant area of interest are amortised over the life of the area according to the rate of depletion of the economically recoverable reserves.
A regular review is undertaken of each area of interest to determine the appropriateness of continuing to carry forward costs in relation to that area of interest.
(j) Trade and Other Payables
These amounts represent liabilities for goods and services provided to the Group prior to the end of Financial Year which are unpaid. The amounts are unsecured and are usually paid within 30 days of recognition.
(k) Contributed Equity
Ordinary shares are classified as equity. Incremental costs directly attributable to the issue of new shares or options are shown in equity as a deduction, net of tax, from the proceeds. Incremental costs directly attributable to the issue of new shares or options for the acquisition of a business are not included in the cost of the acquisition as part of the purchase consideration.
(l) Investments and Other Financial Assets
Financial assets in the scope of AASB 139 Financial Instruments: Recognition and Measurement are classified as either financial assets at fair value through profit or loss, loan and receivables, or available for sale investments, as appropriate. When financial assets are recognised initially they are measured at fair value, plus, in the case of investments not at fair value through profit or loss, directly attributable transaction costs. The Group determines the classification of its financial assets after initial recognition and, when allowed and appropriate, re-evaluates this designation at each financial year end.
For
per
sona
l use
onl
y

FINANCIAL STATEMENTSNOTES TO THE FINANCIAL STATEMENTS
FOR THE YEAR ENDING 30 JUNE 2017
36
FINANCIAL STATEMENTS
MANHATTAN CORPORATION LIMITED2017 ANNUAL REPORT
Financial Assets at Fair Value Through Profit or Loss
This category has two sub-categories: financial assets held for trading, and those designated at fair value through profit or loss on initial recognition. A financial asset is classified in this category if acquired principally for the purpose of selling in the short term or if so designated by management. The policy of management is to designate a financial asset at fair value through profit or loss if there exists the possibility it will be sold in the short term and the asset is subject to frequent changes in value. Derivatives are also categorised as held for trading unless they are designated as hedges. Assets in this category are classified as current assets if they are either held for trading or are expected to be realised within twelve months of the year ending 30 June.
Loans and Receivables
Loans and receivables are non-derivative financial assets with fixed or determinable payments that are not quoted in an active market. They arise when the Group provides money, goods or services directly to a debtor with no intention of selling the receivable. They are included in current assets, except for those with maturities greater than twelve months after the year ending 30 June which are classified as non current assets. Loans and receivables are included in receivables in the year ending 30 June.
Available for Sale Financial Assets
Available for sale financial assets, comprising principally marketable equity securities, are non-derivatives that are either designated in this category or not classified in any of the other categories. They are included in non current assets unless management intends to dispose of the investment within twelve months of the year ending 30 June.
Purchases and sales of investments are recognised on trade date being the date on which the Group commits to purchase or sell the asset. Investments are initially recognised at fair value plus transaction costs for all financial assets not carried at fair value through profit or loss. Financial assets are derecognised when the rights to receive cash flows from the financial assets have expired or have been transferred and the Group has transferred substantially all the risks and rewards of ownership.
Available for sale financial assets and financial assets designated through profit or loss are subsequently carried at fair value. Loans and receivables and held to maturity investments are carried at amortised cost using the effective interest rate method. Realised and unrealised gains and losses arising from changes in the fair value of the “financial assets at fair value through profit or loss” category are included in the income statement in the period in which they arise. Unrealised gains and losses arising from changes in the fair value of non monetary securities classified as available for sale are recognised in equity in the net unrealised gains reserve. When securities classified as available for sale are sold or impaired, the accumulated fair value adjustments previously reported in equity are included in the income statement as gains and losses on disposal of investment securities.
The Group assesses at each balance date whether there is objective evidence that a financial asset or group of financial assets is impaired. In the case of equity securities classified as available for sale, a significant or prolonged decline in the fair value of a security below its cost is considered in determining whether the security is impaired. If any such evidence exists for available for sale financial assets, the cumulative loss, measured as the difference between the acquisition cost and the current fair value, less any impairment loss on that financial asset previously recognised in profit and loss is transferred from equity to the income statement. Impairment losses recognised in the income statement on equity instruments classified as held for sale are not reversed through the income statement.
(m) Goods and Services Tax (GST)
Plant and equipment is stated at historical cost less accumulated depreciation and any accumulated iRevenues, expenses and assets are recognised net of the amount of associated GST, unless the GST incurred is not recoverable from the taxation authority. In this case it is recognised as part of the cost of acquisition of the asset or as part of the expense.
Receivables and payables are stated inclusive of the amount of GST receivable or payable. The net amount of GST recoverable from, or payable to, the taxation authority is included with other receivables or payables in the year ending 30 June.
Cash flows are presented on a gross basis. The GST components of cash flows arising from investing or financing activities which are recoverable from, or payable to the taxation authority, are presented as operating cash flow.
For
per
sona
l use
onl
y

FINANCIAL STATEMENTSNOTES TO THE FINANCIAL STATEMENTS
FOR THE YEAR ENDING 30 JUNE 2017
37
FINANCIAL STATEMENTS
MANHATTAN CORPORATION LIMITED2017 ANNUAL REPORT
(n) Employee Benefit Provisions
Wages and Salaries, Annual Leave and Sick Leave
Liabilities for wages and salaries, including non monetary benefits, annual leave and accumulating sick leave expected to be settled within 12 months of the year ending 30 June are recognised in respect of employees’ services rendered up to the year ending 30 June and measured at amounts expected to be paid when the liabilities are settled. Liabilities for non accumulating sick leave are recognised when leave is taken and measured at the actual rates paid or payable. Liabilities for wages and salaries, and annual leave are included as part of Other Payables.
Long Service Leave
Liabilities for long service leave are recognised as part of the provision for employee benefits and measured as the present value of expected future payments to be made in respect of services provided by employees to the year ending 30 June using the projected unit credit method. Consideration is given to expected future salaries and wages levels, experience of employee departures and periods of service. Expected future payments are discounted using national government bond rates at the year ending 30 June with terms to maturity and currency that match, as closely as possible, the estimated future cash outflows.
Share Based Payments The Group provides benefits to employees (including Directors) in the form of share based payment transactions, whereby employees render services in exchange for shares or options over shares (“equity settled transactions”).
The fair value of options granted is recognised as an employee benefit expense with a corresponding increase in equity (share option reserve). The fair value is measured at grant date and recognised over the period during which the employees become unconditionally entitled to the options. Fair value is determined by an independent valuator using a Black and Scholes option pricing model. In determining fair value, no account is taken of any performance conditions other than those related to the share price of Manhattan (“Market Conditions”).
(o) Earnings Per Share
Basic Earnings Per Share
Basic earnings per share is calculated by dividing profit/(loss) attributable to equity holders of the Group, excluding any costs of servicing equity other than ordinary shares, by the weighted average number of ordinary shares outstanding during the Financial Year, adjusted for bonus elements in ordinary shares issued during the year.
Diluted Earnings Per Share
Diluted earnings per share adjust the figures used in the determination of basic earnings per share to take into account the after income tax effect of interest and other financing costs associated with dilutive potential ordinary shares and the weighted average number of additional ordinary shares that would have been outstanding assuming the conversions of all dilutive potential ordinary shares.
(p) New Accounting Standards and UIG Interpretations
Certain new accounting standards and interpretations have been published that are not mandatory for 30 June 2017 reporting periods and have not been early adopted by the Group. The Group’s assessment of the impact of these new standards and interpretations is set out below. New standards and interpretations not mentioned are considered unlikely to impact on the financial reporting of the Group.
AASB 9 Financial Instruments (applicable for annual reporting periods commencing on or after 1 January 2018).AASB 9 (December 2014) is a new Principal standard which replaces AASB 139. This new Principal version supersedes AASB 9 issued in December 2009 (as amended) and AASB 9 (issued in December 2010) and includes a model for classification and measurement, a single, forward-looking ‘expected loss’ impairment model and a substantially-reformed approach to hedge accounting.
For
per
sona
l use
onl
y
FINANCIAL STATEMENTSNOTES TO THE FINANCIAL STATEMENTS
FOR THE YEAR ENDING 30 JUNE 2017
38
FINANCIAL STATEMENTS
MANHATTAN CORPORATION LIMITED2017 ANNUAL REPORT
AASB 9 is effective for annual reporting periods beginning on or after 1 January 2018. However, the Standard is available for early adoption. The own credit changes can be early applied in isolation without otherwise changing the accounting for financial instruments.
The final version of AASB 9 introduces a new expected-loss impairment model that will require more timely recognition of expected credit losses. Specifically, the new Standard requires entities to account for expected credit losses from when financial instruments are first recognised and to recognise full lifetime expected losses on a timelier basis.
Amendments to AASB 9 (December 2009 & 2010 editions) (AASB 2013-9) issued in December 2013 included the new hedge accounting requirements, including changes to hedge effectiveness testing, treatment of hedging costs, risk components that can be hedged and disclosures.
AASB 9 includes requirements for a simpler approach for classification and measurement of financial assets compared with the requirements of AASB 139.
The main changes are described below.
(a) Financial assets that are debt instruments will be classified based on (1) the objective of the entity’s business model for managing the financial assets; (2) the characteristics of the contractual cash flows.
(b) Allows an irrevocable election on initial recognition to present gains and losses on investments in equity instruments that are not held for trading in other comprehensive income. Dividends in respect of these investments that are a return on investment can be recognised in profit or loss and there is no impairment or recycling on disposal of the instrument.
(c) Financial assets can be designated and measured at fair value through profit or loss at initial recognition if doing so eliminates or significantly reduces a measurement or recognition inconsistency that would arise from measuring assets or liabilities, or recognising the gains and losses on them, on different bases.
(d) Where the fair value option is used for financial liabilities the change in fair value is to be accounted for as follows:
� The change attributable to changes in credit risk are presented in other comprehensive income (OCI); and
� The remaining change is presented in profit or loss.
AASB 9 also removes the volatility in profit or loss that was caused by changes in the credit risk of liabilities elected to be measured at fair value. This change in accounting means that gains caused by the deterioration of an entity’s own credit risk on such liabilities are no longer recognised in profit or loss.
Consequential amendments were also made to other standards as a result of AASB 9, introduced by AASB 2009-11 and superseded by AASB 2010-7, AASB 2010-10 and AASB 2014-1 – Part E.
AASB 2014-7 incorporates the consequential amendments arising from the issuance of AASB 9 in December 2014.
AASB 2014-8 limits the application of the existing versions of AASB 9 (AASB 9 (December 2009) and AASB 9 (December 2010)) from 1 February 2015 and applies to annual reporting periods beginning on or after 1 January 2015.
Based on the financial assets and liabilities currently held, the Group does not anticipate any impact on the Financial Statements upon adoption of this standard. The Group does not presently engage in hedge accounting.
AASB 15 Revenue from Contracts with Customers (applicable for annual reporting periods commencing on or after 1 January 2017).In May 2014, the IASB issued IFRS 15 Revenue from Contracts with Customers, which replaces IAS 11 Construction Contracts, IAS 18 Revenue and related interpretations (IFRIC 13 Customer Loyalty Programmes, IFRIC 15 Agreements for the Construction of Real Estate, IFRIC 18 Transfers of Assets from Customers and SIC-31 Revenue-Barter Transactions Involving Advertising Services). The core
For
per
sona
l use
onl
y

FINANCIAL STATEMENTSNOTES TO THE FINANCIAL STATEMENTS
FOR THE YEAR ENDING 30 JUNE 2017
39
FINANCIAL STATEMENTS
MANHATTAN CORPORATION LIMITED2017 ANNUAL REPORT
principle of IFRS 15 is that an entity recognises revenue to depict the transfer of promised goods or services to customers in an amount that reflects the consideration to which the entity expects to be entitled in exchange for those goods or services. An entity recognises revenue in accordance with that core principle by applying the following steps:
a) Step 1: Identify the contract(s) with a customer
b) Step 2: Identify the performance obligations in the contract
c) Step 3: Determine the transaction price
d) Step 4: Allocate the transaction price to the performance obligations in the contract
e) Step 5: Recognise revenue when (or as) the entity satisfies a performance obligation
Early application of this standard is permitted. AASB 2014-5 incorporates the consequential amendments to a number of Australian Accounting Standards (including Interpretations) arising from the issuance of AASB 15.
There will be no impact on the Group’s financial position or performance.
AASB 16 Leases (applicable for annual reporting periods commencing on or after 1 January 2019).The key features of AASB 16 are as follows:
Lessee accounting:
• Lessees are required to recognise assets and liabilities for all leases with a term of more than 12 months, unless the underlying asset is of low value.
• A lessee measures right-of-use assets similarly to other non-financial assets and lease liabilities similarly to other financial liabilities.
• Assets and liabilities arising from a lease are initially measured on a present value basis. The measurement includes non-cancellable lease payments (including inflation-linked payments), and also includes payments to be made in optional periods if the lessee is reasonable certain to exercise an option to extend the lease, or not to exercise an option to terminate the lease.
• IFRS 16 contains disclosure requirements for lessees.
Lessor accounting:
• AASB 16 substantially carries forward the lessor accounting requirements in AASB 117. Accordingly, a lessor continues to classify its leases as operating leases or finance leases, and to account for those two types of leases differently.
• AASB 16 also requires enhanced disclosures to be provided by lessors that will improve information disclosed about a lessor’s risk exposure, particularly to residual value risk.
The new standard will be effective for annual periods beginning on or after 1 January 2019. Early adoption is permitted, provided the new revenue standard, AASB 15 Revenue from Contracts with Customers, has been applied, or is applied at the same date as AASB 16.
The effect of this amendment on the Group’s Financial Statements has yet to be determined.
2. CRITICAL ACCOUNTING ESTIMATES AND JUDGEMENTS
Estimates and judgements are continually evaluated and are based on historical experience and other factors, including expectations of future events that may have a financial impact on the entity and that are believed to be reasonable under the circumstances.
Key Estimates: Impairment of Exploration and Exploration Expenditure
The Group assesses impairment at each reporting date by evaluating conditions specific to the Group that may lead to impairment of assets. Where an impairment trigger exists, the recoverable amount of
For
per
sona
l use
onl
y

FINANCIAL STATEMENTSNOTES TO THE FINANCIAL STATEMENTS
FOR THE YEAR ENDING 30 JUNE 2017
40
FINANCIAL STATEMENTS
MANHATTAN CORPORATION LIMITED2017 ANNUAL REPORT
the asset is determined by Value in use calculations performed in assessing recoverable amounts and incorporate a number of key estimates. The Group has made an impairment charge for the year which has been recognised in the Income Statement.
Share Based Payment Transactions
The Group measures the cost of equity settled share based payments at fair value at the grant date using the Black and Scholes model taking into account the exercise price, the term of the option, the impact of dilution, the share price at the grant date, the expected volatility of the underlying share, the expected dividend yield and risk free interest rate for the term of the option.
3. SEGMENT INFORMATION
The Group operates in one segment, being mineral resource exploration and assessment of mineral projects in Australia.
4. FINANCIAL RISK MANAGEMENT
The Group’s activities expose it to a variety of financial risks: market risk (including currency risk, interest rate risk and price risk), credit risk and liquidity risk. The Group’s overall risk management program focuses on the unpredictability of the financial markets and seeks to minimise potential adverse effects on the financial performance of the Group. The Group does not use derivative financial instruments, however the Group uses different methods to measure different types of risk to which it is exposed. These methods include sensitivity analysis in the case of interest rate and other price risks and aging analysis for credit risk.
Risk management is carried out by the Board of Directors with assistance from suitably qualified external and internal advisors. The Board provides written principles for overall risk management and further policies will evolve commensurate with the evolution and growth of the Group.
(a) Market Risk
(i) Foreign Exchange Risk
The Group does not currently operate internationally and therefore its exposure to foreign exchange risk arising from currency exposures is limited.
(ii) Price Risk
The Group does not currently hold any equity investments so it is not exposed to equity securities price risk. The Group is not exposed to commodity price risk as the Group is still carrying out exploration.
(iii) Cash Flow and Fair Value Interest Rate Risk
The Group’s only interest rate risk arises from cash and cash equivalents. Term deposits and current accounts held with variable interest rates expose the Group to cash flow interest rate risk. The Group does not consider this to be material to the Group and have therefore not undertaken any further analysis of risk exposure.
(b) Credit Risk
Credit risk is managed by the Board for the Group. Credit risk arises from cash and cash equivalents as well as credit exposure including outstanding receivables and committed transactions. All cash balances held at banks are held at internationally recognised institutions, with minimum independently rated rates of ‘A’. The majority of receivables are immaterial to the Group. Given this the credit quality of financial assets that are neither past due or impaired can be assessed by reference to historical information about default rates.
The maximum exposure to credit risk is the carrying amount of the financial assets of cash and trade and other receivables to the value of $198,373 (2016: $692,321).
The following financial assets of the Group are neither past due or impaired:
For
per
sona
l use
onl
y

FINANCIAL STATEMENTSNOTES TO THE FINANCIAL STATEMENTS
FOR THE YEAR ENDING 30 JUNE 2017
41
FINANCIAL STATEMENTS
MANHATTAN CORPORATION LIMITED2017 ANNUAL REPORT
FINANCIAL ASSETS 2017 2016
$ $
Cash and Cash Equivalents 187,493 581,494
Trade and Other Receivables 10,880 110,827
Total 198,373 692,321
(c) Liquidity Risk
Prudent liquidity risk management implies maintaining sufficient cash and marketable securities, the availability of funding through an adequate amount of committed credit facilities and the ability to close out market positions. The Group manages liquidity risk by continuously monitoring forecast and actual cash flows and matching the maturity profits of financial assets and liabilities. As at reporting date the Group had sufficient cash reserves to meet its requirements. The Group therefore had no credit standby facilities or arrangements for further funding in place.
The financial liabilities of the Group at reporting date were trade payables incurred in the normal course of the business of $77,107 (2016: $34,338). These were non interest bearing and were due within the normal 30 to 60 days terms of creditor payments. The Group had no borrowings during the year and has therefore not undertaken any further analysis of risk exposure.
(d) Fair Value Estimation
The fair value of financial assets and liabilities must be estimated for recognition and measurement or for disclosure purposes.
The carrying value less any required impairment provision of trade receivables and payables are assumed to approximate their fair values due to their short term nature.
5. REVENUES
REVENUES 2017 2016
Other Revenue From Continuing Operations $ $ Interest 2,536 3,911
Total 2,536 3,911
6. EXPENSES
(a) Expenses, Excluding Finance Costs, Included in the Income Statement
EXPENSES 2017 2016
$ $
Legal Fees - 3,825 ASX and Share Registry Fees 45,096 29,730 Consultant Fees 36,560 26,650 Rent 4,473 5,665 Employee Benefits 63,000 60,667 Exploration Impairment 2,546,570 293,764 R&D consultants fees 12,600 12,600 General and Administration Costs 97,472 90,675
Total Expenses, Excluding Finance Costs 2,805,771 523,576
For
per
sona
l use
onl
y
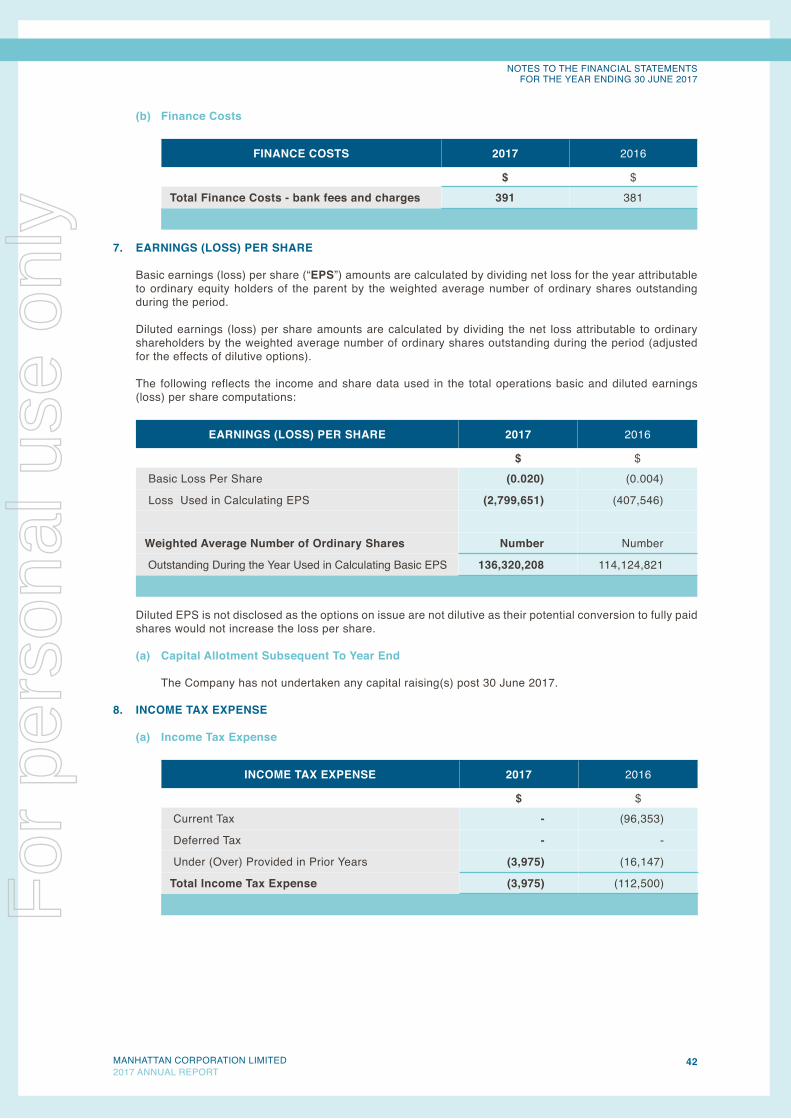
FINANCIAL STATEMENTSNOTES TO THE FINANCIAL STATEMENTS
FOR THE YEAR ENDING 30 JUNE 2017
42
FINANCIAL STATEMENTS
MANHATTAN CORPORATION LIMITED2017 ANNUAL REPORT
(b) Finance Costs
FINANCE COSTS 2017 2016
$ $
Total Finance Costs - bank fees and charges 391 381
7. EARNINGS (LOSS) PER SHARE
Basic earnings (loss) per share (“EPS”) amounts are calculated by dividing net loss for the year attributable to ordinary equity holders of the parent by the weighted average number of ordinary shares outstanding during the period.
Diluted earnings (loss) per share amounts are calculated by dividing the net loss attributable to ordinary shareholders by the weighted average number of ordinary shares outstanding during the period (adjusted for the effects of dilutive options).
The following reflects the income and share data used in the total operations basic and diluted earnings (loss) per share computations:
EARNINGS (LOSS) PER SHARE 2017 2016
$ $
Basic Loss Per Share (0.020) (0.004)
Loss Used in Calculating EPS (2,799,651) (407,546)
Weighted Average Number of Ordinary Shares Number Number
Outstanding During the Year Used in Calculating Basic EPS 136,320,208 114,124,821
Diluted EPS is not disclosed as the options on issue are not dilutive as their potential conversion to fully paid shares would not increase the loss per share.
(a) Capital Allotment Subsequent To Year End
The Company has not undertaken any capital raising(s) post 30 June 2017.
8. INCOME TAX EXPENSE
(a) Income Tax Expense
INCOME TAX EXPENSE 2017 2016
$ $
Current Tax - (96,353)
Deferred Tax - -
Under (Over) Provided in Prior Years (3,975) (16,147)
Total Income Tax Expense (3,975) (112,500)For
per
sona
l use
onl
y

FINANCIAL STATEMENTSNOTES TO THE FINANCIAL STATEMENTS
FOR THE YEAR ENDING 30 JUNE 2017
43
FINANCIAL STATEMENTS
MANHATTAN CORPORATION LIMITED2017 ANNUAL REPORT
(b) Deferred Income Tax Expense Comprises
DEFERRED INCOME TAX EXPENSE 2017 2016
$ $
(Decrease)/Increase in Deferred Tax Asset - -
(Decrease)/Increase in Deferred Tax Liability - -
Total Deferred Income Tax Expense - -
No deferred tax has been recognised in either the Income Statement or directly in equity.
(c) Reconciliation of Income Tax Expense to Prima Facie Tax Payable
RECONCILIATION OF INCOME TAX 2017 2016
$ $
Loss From Continuing Operations Before Income Tax (2,799,651) (520,046)
Tax at the Australian rate of 27.50% (769,904) (156,014)
Tax Effect of Permanent Differences:
Exploration Expenses - (88,129)
R&D Expenses Claimed as an Offset - 75,000
Other Deductions - (6,515)
Benefits of Tax Losses Not Brought to Account 133,590 -
Temporary Differences 640,289 (600)
R&D Tax Offset - (33,750)
Under (Over) Provided in Prior Years (3,975)
Total Tax Payable (3,975) (33,750)
(d) Tax Losses and Other Timing Differences for Which No Deferred Tax Asset has been Recognised
UNRECOGNISED TEMPORY DIFFERENCES 2017 2016
$ $
Carry Forward Tax Losses 4,405,371 4,179,236
Capital Raising Costs 3,275 -
Other Temporary Differences 4,500 -
Capitalised Exploration and Evaluation Expenditure (900,000) -
Net Deferred Tax Assets 3,513,146 4,179,236
The Group has tax losses arising in Australia of $17,443,933 ($3,513,146 at 27.5% tax rate) (2016: $4,179,236) of which no deferred tax asset has been recognised that are available indefinitely for offset against future taxable profits of the Group.F
or p
erso
nal u
se o
nly

FINANCIAL STATEMENTSNOTES TO THE FINANCIAL STATEMENTS
FOR THE YEAR ENDING 30 JUNE 2017
44
FINANCIAL STATEMENTS
MANHATTAN CORPORATION LIMITED2017 ANNUAL REPORT
9. DIVIDENDS PAID OR PROPOSED
There were no dividends paid or proposed during the year.
10. CASH AND CASH EQUIVALENTS
CASH AND CASH EQUIVALENTS 2017 2016
$ $
Cash at Bank and In Hand 187,493 81,494
Deposits at Call - 500,000
Total Cash and Cash Equivalents 187,493 581,494
Cash at bank and in hand earns interest at floating interest rates based on the daily bank rates.
(a) Interest Rate Exposure
The Group’s exposure to interest rate risk is discussed in Note 4.
(b) Reconciliation to Cash at the End of the Year
The above figures represent the cash at the end of the Financial Year as shown in the Statement of Cash Flows.
11. TRADE AND OTHER RECEIVABLES (CURRENT)
TRADE AND OTHER RECEIVABLES 2017 2016
$ $
GST Receivable 10,680 12,632
Tax Receivable - 96,353
Other Debtors 200 1,842
Total Trade and Other Receivables 10,880 110,827
(a) Fair Values and Credit Risk
Due to the short term nature of these receivables the carrying values represent their respective fair values at 30 June 2017.
The maximum exposure to credit risk at the reporting date is the carrying amount of each class of receivables mentioned above. Refer to Note 4 for more information on the risk management policy of the Group and the credit quality of the entity’s receivables.
(b) Other Receivables
These amounts generally arise from transactions outside the usual operating activities of the Group. Collateral is not normally obtained.
12. EXPLORATION AND EVALUATION EXPENDITURE (NON CURRENT)
Recoverability of the carrying amount of exploration assets is dependent upon successful exploration and development or sale of mineral deposits of the respective areas of interest.F
or p
erso
nal u
se o
nly

FINANCIAL STATEMENTSNOTES TO THE FINANCIAL STATEMENTS
FOR THE YEAR ENDING 30 JUNE 2017
45
FINANCIAL STATEMENTS
MANHATTAN CORPORATION LIMITED2017 ANNUAL REPORT
EXPLORATION AND EVALUATION EXPENDITURE 2017 2016
$ $
As at 1 July 5,122,934 5,122,934
Capitalised During the Year 423,636 293,764
Impairment of Exploration Expenditure1 (2,546,570) (293,764)
As at 30 June 3,000,000 5,122,934
1. The carrying value of the Group’s projects was reviewed, and impairment recognised, where the facts and circumstances identified the carrying amount to be greater than the recoverable amount.
The WA state Labor government’s stated policy of not to approve any new uranium mines, and their previously stated policy of not to allow mineral exploration in A Class reserves, suggests there is little likelihood of progressing the exploration and development of the Ponton uranium project over the next four year term of the present WA government.
Although the WA Labor policy is at odds with the four new uranium development projects approved by WA state and Federal environmental authorities at Yeelirrie, Kintyre, Wiluna and Mulga Rock in WA, we do not see any change in the WA government’s stand on uranium approvals or exploration access to A Class reserves in the foreseeable future.
Manhattan will maintain its interests in the key tenement areas at Ponton, with a view that the WA government’s policy on uranium approvals may change in the future and or the Labor government will be replaced by a government that is supportive of the industry. The project is a future low cost development opportunity for Manhattan as the ISR Ponton project now has reported JORC Inferred Resources and Exploration Targets of 57Mlbs to 91Mlbs making it the third largest uranium resource project in WA that positions Ponton as a project of key regional, state and national significance.
Minimal exploration is planned for the Ponton project, which the Directors believe comprises the majority of the enterprise value of the Group. The fair value of the exploration and evaluation assets have been determined for the purpose of impairment testing by reference to the market capitalisation (number of shares on issue multiplied by the quoted market price per share) of the Group on ASX, adjusted for the net assets at reporting date of the Group excluding exploration and evaluation assets. The fair value of exploration and evaluation assets is included in level 3 of the fair value hierarchy.
In the current economic and political climate, the Directors believe it is prudent to align the carrying value of the Group’s exploration and evaluation assets to the market value of the Group as it is perceived by the financial markets (ASX). The Directors consider the carrying value as noted is a fair indication of the potential disposal value of the Group’s projects in the current market.
Given access to new equity funding has been negatively impacted by the current economic climate, the capital markets and the recent WA government pronouncements on Uranium mining, the Group’s ability to advance its projects through further exploration or exploitation has been significantly reduced. As a result the Director’s believe market value to be a reliable measurement methodology.
There is no reasonable change expected in the unobservable input, being the net asset position of the Group.
13. TRADE AND OTHER PAYABLES (CURRENT)
TRADE AND OTHER PAYABLES 2017 2016
$ $
Trade Payables 19,250 -
Other Creditors 57,857 34,338
Total Trade and Other Payables 77,107 34,338
Trade payables and other creditors are non interest bearing and will be settled on 30 to 60 day terms.
For
per
sona
l use
onl
y

FINANCIAL STATEMENTSNOTES TO THE FINANCIAL STATEMENTS
FOR THE YEAR ENDING 30 JUNE 2017
46
FINANCIAL STATEMENTS
MANHATTAN CORPORATION LIMITED2017 ANNUAL REPORT
14. ISSUED CAPITAL
(a) Ordinary Shares
ISSUED CAPITAL NOTE 2017 2016 2017 2016
Ordinary Shares Shares Shares $ $
Issued and Fully paid (b) 140,278,693 136,036,273 17,629,441 17,489,441
Total Contributed Equity 140,278,693 136,036,273 17,629,441 17,489,441
(b) Share Movements During the Year
SHARE MOVEMENTS 2017 2016
Number of Shares $ Number of
Shares $
Beginning of Financial Year 136,036,273 17,489,441 111,476,273 16,893,273
New Shares Issued During Year
Placement of Securities at 3.3 cents 303,030 10,000 6,900,000 172,500
Share Purchase Plan at 3.3 cents 3,939,390 130,000 17,660,000 441,500
Share Issue costs - (18,192)
End of Financial Year 140,278,693 17,629,441 136,036,273 17,489,081
(c) Ordinary Shares
Ordinary shares entitle the holder to participate in dividends and the proceeds on winding up of the Group in proportion to the number of and amounts paid on the shares held. On a show of hands every holder of ordinary shares present at a meeting in person, or by proxy, is entitled to one vote, and upon a poll each share is entitled to one vote. There is no authorised or par value share as prescribed in the Group’s constitution.
(d) Capital Risk Management
The Group’s objectives when managing capital are to safeguard their ability to continue as a going concern, so that they can continue to provide returns to shareholders and benefits for other stakeholders and to maintain an optimal capital structure to reduce the cost of capital.
In order to maintain or adjust the capital structure, the Group may adjust the amount of dividends paid to shareholders, return capital to shareholders, issue new shares or sell assets to reduce debt.
CAPITAL RISK MANAGEMENT 2017 2016
$ $
Total Borrowings - -
Less Cash and Cash Equivalents 10 187,493 581,494
Net Cash 187,493 581,494
Total Equity 3,121,266 5,780,917
Total Capital 3,121,266 5,780,917
For
per
sona
l use
onl
y

FINANCIAL STATEMENTSNOTES TO THE FINANCIAL STATEMENTS
FOR THE YEAR ENDING 30 JUNE 2017
47
FINANCIAL STATEMENTS
MANHATTAN CORPORATION LIMITED2017 ANNUAL REPORT
15. RESERVES
SHARE BASED PAYMENT RESERVE 2017 2016
$ $
Balance at Beginning of the Year 4,857,328 4,857,328
Share Based Payments - -
Total Share Based Payments Reserve 4,857,328 4,857,328
Nature and Purpose of Reserves
The share based payment reserve is used to recognise the fair value of options issued to Directors, consultants and employees.
16. KEY MANAGEMENT PERSONNEL DISCLOSURES
(a) Directors
The following persons were Directors of Manhattan during the Financial Year: Name Position Alan J Eggers Executive Chairman Marcello Cardaci Non Executive DirectorJohn A G Seton Non Executive Director
(b) Key Management Personnel
The following persons were Key Management Personnel of Manhattan during the Financial Year:
Name Position Sam Middlemas Company Secretary (Resigned 28 September 2016)
(c) Key Management Personnel Compensation
KEY MANAGEMENT PERSONNEL COMPENSATION 2017 2016
$ $
Short Term Employee Benefits 256,760 271,650
Post Employment Benefits - -
Share Based Payments - -
Total Compensation 256,760 271,650
(d) Remuneration of Directors and Key Management Personnel
(i) Remuneration of Directors and Key Management Personnel
Options provided as remuneration and shares issued on the exercise of such options, together with the terms and conditions of the options, can be found in Section D of the Remuneration Report.
(ii) Option Holdings
The number of options over ordinary shares in the Company held during the Financial Year by each Director of Manhattan and Key Management Personnel, including their personally related parties, are set out below:
For
per
sona
l use
onl
y

FINANCIAL STATEMENTSNOTES TO THE FINANCIAL STATEMENTS
FOR THE YEAR ENDING 30 JUNE 2017
48
FINANCIAL STATEMENTS
MANHATTAN CORPORATION LIMITED2017 ANNUAL REPORT
Option HoldingsBalance at
Start of YearGranted as
CompensationExercised
Expired or Cancelled
Balance at End
of Year
Vested and Exercisable
Unvested
2017
Directors
Alan Eggers 9,000,000 - - - 9,000,000 9,000,000 -
Marcello Cardaci1 2,000,000 - - - 2,000,000 2,000,000 -
John Seton 2,000,000 - - - 2,000,000 2,000,000 -
Key Management Personnel
Sam Middlemas2 2,000,000 - - (2,000,000) - - -
Total 15,000,000 - - (2,000,000) 13,000,000 13,000,000 -
2016
Directors
Alan Eggers 9,000,000 - - - 9,000,000 9,000,000 -
Marcello Cardaci 2,000,000 - - - 2,000,000 2,000,000 -
John Seton 2,000,000 - - - 2,000,000 2,000,000 -
Key Management Personnel
Sam Middlemas 2,000,000 - - - 2,000,000 2,000,000 -
Total 15,000,000 - - - 15,000,000 15,000,000 -
1. Mr Marcello Cardaci has an indirect interest via a current association with the trustee of Pollara Trust with respect to the Options. Registered holder is Pollara Pty Ltd as trustee of the Pollara Trust.
2. Mr Middlemas resigned 28 September 2016..
(iii) Share Holdings
The numbers of shares in the Company held during the Financial Year by each Director of Manhattan Corporation Limited and Key Management Personnel of the Company, including their personally related parties are set out below. There were no shares granted during the reporting period as compensation.
For
per
sona
l use
onl
y

FINANCIAL STATEMENTSNOTES TO THE FINANCIAL STATEMENTS
FOR THE YEAR ENDING 30 JUNE 2017
49
FINANCIAL STATEMENTS
MANHATTAN CORPORATION LIMITED2017 ANNUAL REPORT
Directors and Officers Share
HoldingsBalance at the
Start of the YearShare
PurchasesShare Sales or Other Changes
Balance at the End of the Year
2017Directors
Alan Eggers 33,057,311 363,636 - 33,420,947
Marcello Cardaci 3,415,726 151,515 - 3,567,241
John Seton 27,858,721 151,515 (4,007,260) 24,002,976
Key Management Personnel Sam Middlemas1 1,450,726 - (1,450,726) -
Total 65,782,484 666,666 (5,457,986) 60,991,164
2016
Directors
Alan Eggers 31,257,311 1,800,000 - 33,057,311
Marcello Cardaci 2,815,726 600,000 - 3,415,726
John Seton 26,658,721 1,200,000 - 27,858,721Key Management Personnel Sam Middlemas 1,160,726 600,000 (310,000) 1,450,726
Total 61,892,484 4,200,000 (310,000) 65,782,484
1. Mr Middlemas resigned 28 September 2016.
(e) Loans to Key Management Personnel
There were no loans made or outstanding to Directors of Manhattan and Key Management Personnel of the Company, including their personally related parties.
(f) Other Transactions with Key Management Personnel
(i) Alan J Eggers
Alan Eggers is a director of Wesmin Corporate Pty Ltd (“Wesmin”). Wesmin has provided his services as Executive Chairman, personnel, office premises and administration staff to a value of $210,000 (2016: $210,000) to Manhattan during the year on normal commercial terms.
(ii) Marcello Cardaci
Marcello Cardaci is a partner in the firm of Gilbert + Tobin Lawyers. Gilbert + Tobin Lawyers has provided legal services of nil (2016: $3,000) to Manhattan during the year on normal commercial terms.
17. NON CASH INVESTING AND FINANCING ACTIVITIES
There were no non cash investing or financing activities during the year ended 30 June 2017.
18. SUBSEQUENT EVENTS AFTER END OF FINANCIAL YEAR Since the end of the Financial Year no matters have arisen that have significantly affected or may significantly affect the operations of the Group, results of those operations or the state of affairs in financial years subsequent to 30 June 2017.
For
per
sona
l use
onl
y
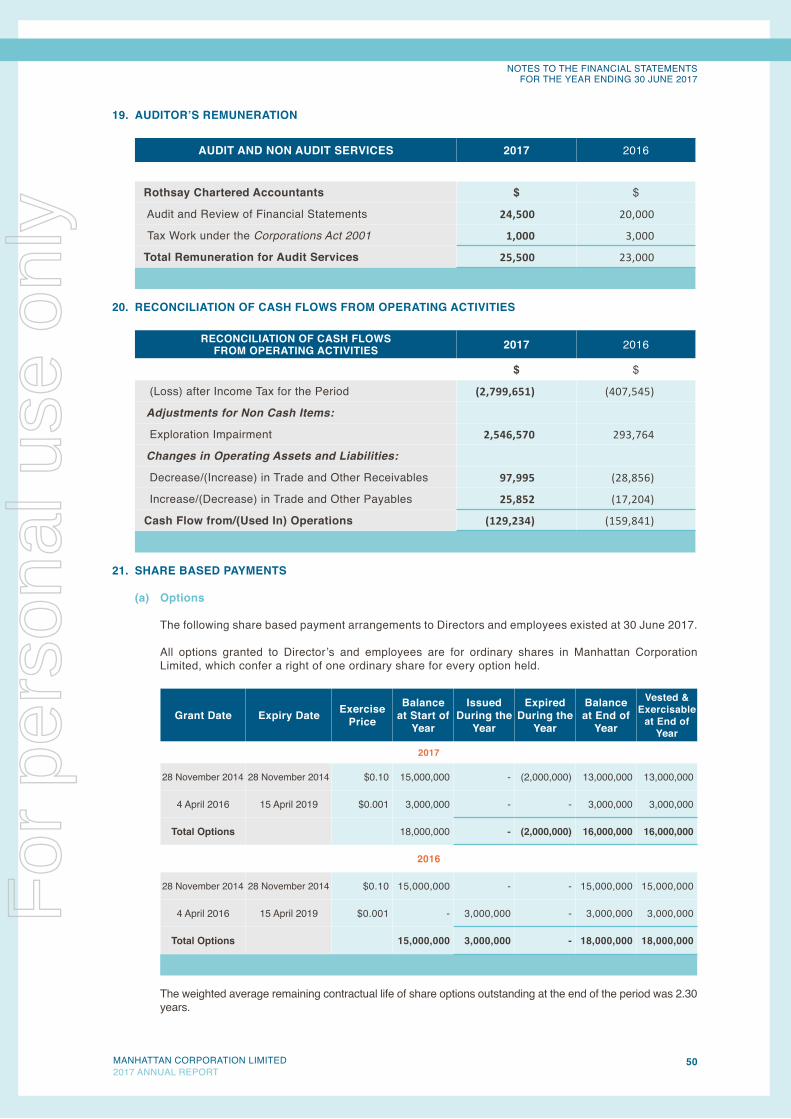
FINANCIAL STATEMENTSNOTES TO THE FINANCIAL STATEMENTS
FOR THE YEAR ENDING 30 JUNE 2017
50
FINANCIAL STATEMENTS
MANHATTAN CORPORATION LIMITED2017 ANNUAL REPORT
19. AUDITOR’S REMUNERATION
AUDIT AND NON AUDIT SERVICES 2017 2016
Rothsay Chartered Accountants $ $
Audit and Review of Financial Statements 24,500 20,000
Tax Work under the Corporations Act 2001 1,000 3,000
Total Remuneration for Audit Services 25,500 23,000
20. RECONCILIATION OF CASH FLOWS FROM OPERATING ACTIVITIES
RECONCILIATION OF CASH FLOWS FROM OPERATING ACTIVITIES 2017 2016
$ $
(Loss) after Income Tax for the Period (2,799,651) (407,545)
Adjustments for Non Cash Items:
Exploration Impairment 2,546,570 293,764
Changes in Operating Assets and Liabilities:
Decrease/(Increase) in Trade and Other Receivables 97,995 (28,856)
Increase/(Decrease) in Trade and Other Payables 25,852 (17,204)
Cash Flow from/(Used In) Operations (129,234) (159,841)
21. SHARE BASED PAYMENTS
(a) Options
The following share based payment arrangements to Directors and employees existed at 30 June 2017.
All options granted to Director’s and employees are for ordinary shares in Manhattan Corporation Limited, which confer a right of one ordinary share for every option held.
Grant Date Expiry Date Exercise Price
Balance at Start of
Year
Issued During the
Year
Expired During the
Year
Balance at End of
Year
Vested & Exercisable
at End of Year
2017
28 November 2014 28 November 2014 $0.10 15,000,000 - (2,000,000) 13,000,000 13,000,000
4 April 2016 15 April 2019 $0.001 3,000,000 - - 3,000,000 3,000,000
Total Options 18,000,000 - (2,000,000) 16,000,000 16,000,000
2016
28 November 2014 28 November 2014 $0.10 15,000,000 - - 15,000,000 15,000,000
4 April 2016 15 April 2019 $0.001 - 3,000,000 - 3,000,000 3,000,000
Total Options 15,000,000 3,000,000 - 18,000,000 18,000,000
The weighted average remaining contractual life of share options outstanding at the end of the period was 2.30 years.
For
per
sona
l use
onl
y

FINANCIAL STATEMENTSNOTES TO THE FINANCIAL STATEMENTS
FOR THE YEAR ENDING 30 JUNE 2017
51
FINANCIAL STATEMENTS
MANHATTAN CORPORATION LIMITED2017 ANNUAL REPORT
(b) Expenses Arising From Share Based Payment Transactions
There were no share based transactions during the year.
22. PARENT ENTITY INFORMATION
PARENT ENTITY INFORMATION 2017 2016
$ $
Current Assets 191,972 589,449
Total Assets 10,396,843 13,109,226
Current Liabilities 77,107 119,579
Total Liabilities 6,056,655 6,099,453
Net Assets 4,340,188 7,009,773
Issued Capital 17,629,441 17,489,441
Share Based Payments Reserve 4,857,328 4,857,328
Accumulated Losses (17,954,609) (15,336,996)
Total Equity 4,532,160 7,009,773
Loss of the Parent Entity (2,617,613) (519,928)
Total Comprehensive Loss of the Parent Entity (2,617,613) (519,928)
In 2009 Manhattan acquired a 100% interest in Manhattan Resources Pty Ltd and this subsidiary has been consolidated since the acquisition on 21 July 2009.
23. COMMITMENTS
(a) Exploration Expenditure
Committed expenditures in accordance with tenement lease grant conditions:
EXPLORATION EXPENDITURE COMMITMENT 2017 2016
$ $ Annual Tenement Rental Obligations 20,322 61,646
Annual Exploration Expenditure Commitments 182,000 425,000
Total Exploration Expenditure Commitment 202,322 486,646
(b) Capital or Leasing Commitments
There are no capital or leasing commitments as at 30 June 2017.
24. CONTINGENT LIABILITIES AND CONTINGENT ASSETS
The Directors are of the opinion that there are no contingent liabilities or contingent assets as at 30 June 2017.
25. INTERESTS IN JOINT VENTURES
Manhattan currently has no Joint Venture interests.
For
per
sona
l use
onl
y

52MANHATTAN CORPORATION LIMITED2017 ANNUAL REPORT
DIRECTORS’ STATEMENT
DIRECTORS’ STATEMENTDIRECTORS’ DECLARATION
In the opinion of the Directors of Manhattan Corporation Limited (“Manhattan”):
(a) The Financial Statements comprising the Consolidated Statements of Comprehensive Income, Financial Position, Cash Flows, Statement of Changes in Equity and the Notes to Accompany the Financial Statements as set out on pages 29 to 51 are in accordance with the Corporations Act 2001, and:
(i) comply with Accounting Standards, the Corporations Regulations 2001 and other mandatory professional reporting requirements; and
(ii) give a true and fair view of the financial position of Manhattan as at 30 June 2017 and of its performance for the Financial Year ended on that date;
(b) In the Directors’ opinion, there are reasonable grounds to believe that Manhattan will be able to pay its debts as and when they become due and payable;
(c) The remuneration disclosures included in the Directors’ Report (as part of the Audited Remuneration Report), for the year ended 30 June 2017, comply with section 300A of the Corporations Act 2001; and
(d) A statement that the attached Financial Statements are in compliance with International Financial Reporting Standards has been included in the Notes to the Financial Statements; and
(e) The Directors have been given the declarations required by section 295A of the Corporations Act 2001 from the Chief Executive and Chief Financial Officers for the Financial Year ended 30 June 2017.
This declaration is made in accordance with a resolution of the Board of Directors and is signed on behalf of the Directors by:
ALAN J EGGERSExecutive Chairman22 September 2017
For
per
sona
l use
onl
y

53
ASX ADDITIONAL INFORMATION
MANHATTAN CORPORATION LIMITED2017 ANNUAL REPORT
ASX ADDITIONAL INFORMATIONAdditional information required by ASX Limited Listing Rules not disclosed elsewhere in this 2017 Annual Report is set out below.
1. ANALYSIS OF SHAREHOLDINGS
As at 22 September 2017 Manhattan Corporation Limited has on issue 140,778,693 ordinary shares. All issued ordinary fully paid shares carry one vote per share. There are six hundred and four (604) holders of fully paid ordinary shares on Manhattan’s share register as at 22 September 2017.
1.1 Top Twenty Shareholders
The names of shareholders in Manhattan’s Top Twenty as at 22 September 2017 are as follows:
TOP 20 SHAREHOLDERS
Rank Holder Number Percentage
1 Minvest Securities (New Zealand) Limited 24,002,976 17.05
2 Nicholas P S Olissoff 11,214,007 7.97
3 Alan J Eggers & Associates 9,417,971 6.69
4 HSBC Custody Nominees (Australia) Limited 8,014,232 5.69
5 Forsyth Barr Custodians Ltd <Forsyth Barr Ltd-Nominee A/C> 5,899,288 4.19
6 Edwin Spruce Arron & Jack Tone Arron <Bikini A/C> 5,632,501 4.00
7 ASB Nominees Limited <123619 A/C> 5,129,000 3.64
8 Custodial Services Limited <Beneficiaries Holding A/C> 4,310,885 3.06
9 Claymore Trustees Limited 4,158,775 2.95
10 M & K Korkidas Pty Ltd <M&K Korkidas P/L S/Fund A/C> 3,663,627 2.60
11 Pollara Pty Ltd <The Pollara A/C> 3,567,241 2.53
12 Sundowner International Limited 2,903,452 2.06
13 Robert Simeon Lord 2,800,000 1.99
14 Clive James Currie 2,554,545 1.81
15 Malcolm Alexander Briody 2,003,070 1.42
16 CS Third Nominees Pty Limited <HSBC Cust Nom Au Ltd 13 A/C> 1,912,827 1.36
17 Residuum Nominees Pty Ltd <The Majestic A/C> 1,250,000 0.89
18 Pershing Australia Nominees Pty Ltd <Patersons Securities A/C> 1,223,000 0.87
19 D A Thorpe + M R Thorpe + A J Thorpe <AJ & Mr Thorpe Family A/C> 1,153,030 0.82
20 John Edward Andrews 1,100,000 0.78
TOTAL 101,910,427 72.39
ASX ADDITIONAL INFORMATIONF
or p
erso
nal u
se o
nly

54
ASX ADDITIONAL INFORMATION
MANHATTAN CORPORATION LIMITED2017 ANNUAL REPORT
1.2 Spread of Security Holders
As at 22 September 2017 Manhattan had 604 holders of ordinary shares with the spread of security holders as follows:
SPREAD OF SECURITY HOLDERS
Size of Holding Number of Holders Shares Held Percentage Held
1 - 1,000 57 31,843 0.02
1,001 - 5,000 135 407,027 0.29
5,001 - 10,000 96 819,865 0.58
10,001 - 100,000 213 8,552,021 6.07
100,001 - Over 103 130,967,937 93.03
TOTAL 604 140,778,693 100.00
1.3 Minimum Holdings and Marketable Parcels
As at 22 September 2017 there were three hundred and eleven (311) holders holding less than a Marketable Parcel of ordinary shares as defined in Chapter 19 of the ASX Listing Rules. A Marketable Parcel is a parcel of securities (ordinary shares) of not less than A$500.00 based on the closing price on SEATS.
1.4 Unlisted Options
The unissued ordinary shares of Manhattan under option as at 22 September 2017 total 16,000,000 options. The options do not carry a right to vote at a general meeting of shareholders. Manhattan’s unlisted option details are as follows:
UNLISTED OPTIONS
Vesting Date Exercise Price
Number of Options
Number of Holders Expiry Date
28 November 2015 $0.10 13,000,000 3 28 November 2019
4 April 2016 $0.00 3,000,000 1 15 April 2019
TOTAL 16,000,000
1.5 Restricted Securities Subject to Escrow Period
As at 22 September 2017 the Company had no ordinary shares or options with rights to acquire ordinary shares the subject of escrow.
1.6 Substantial Shareholders
The following are registered by the Company as at 22 September 2017 as substantial security holders in the Company, having declared the following relevant interests in voting securities in terms of section 671B of the Corporations Act 2001:F
or p
erso
nal u
se o
nly

55
ASX ADDITIONAL INFORMATION
MANHATTAN CORPORATION LIMITED2017 ANNUAL REPORT
SUBSTANTIAL SHAREHOLDERS
SUBSTANCIAL SECURITY HOLDER NUMBER PERCENTAGE
Alan J Eggers and Associates 33,420,947 23.74
John Andrew Gowans Seton and Associates 24,002,976 17.05
Nicholas P S Olissoff 11,214,007 7.97
CQS Asset Management Limited 7,815,900 5.55
TOTAL 76,453,830 54.31
1.7 Share Registrar
Manhattan’s share register is maintained in Perth at:
Computershare Investor Services Pty LtdLevel 2, Reserve Bank Building45 St Georges TerracePERTH WA 6000
Australia: 1300 850 505International: +61 3 9415 4000Facsimile: +61 8 9323 2033Web Site: www.computershare.com.au
1.8 Voting Rights
On a show of hands every shareholder present in person or by a proxy shall have one vote and upon a poll each fully paid ordinary share shall have one vote.
1.9 Stock Exchange Listings
Manhattan’s ordinary shares have been granted quotation on the Australian Stock Exchange Limited (“ASX”). ASX code MHC.
1.10 On Market Buyback
Currently, there is no on market buy back of the Company’s securities.
For
per
sona
l use
onl
y

56
ASX ADDITIONAL INFORMATION
MANHATTAN CORPORATION LIMITED2017 ANNUAL REPORT
2. TENEMENT SCHEDULE
As at 22 September 2017 Manhattan held interests in the following exploration tenements:
WESTERN AUSTRALIA
Tenement Number Project Registered
Holder(s)Manhattan’s
InterestDate
Granted Expiry Date Area Notes
E28/1523 Ponton MHC 100% 26 Nov 2008 25 Nov 2017 20 sub blocks
E28/1898 Ponton MHC 100% 11 Aug 2011 10 Aug 2021 34 sub blocks (1)
E28/2454 Ponton MHC 100% App App 121 sub blocks
NOTES
(1) 22 sub blocks surrendered 20 July 2017
ABBREVIATIONS
E Exploration Licence WA DMP Western Australian Department of Mines and Petroleum
km2 Square Kilometre MHC Manhattan Corporation Limited ABN 61 123 156 089
pp Application Lodged
AREAS
Western Australia 1 Sub block 2.97km2
Ponton Project 175 sub blocks Total Area 520km2
For
per
sona
l use
onl
y
For
per
sona
l use
onl
y

BUSINESS OFFICELevel 233 Colin StreetWEST PERTH WA 6005
PO Box 1038West Perth WA 6872
Telephone : +61 8 9322 6677Facsimile : +61 8 9322 1961
Email : [email protected] : www.manhattancorp.com.au
For
per
sona
l use
onl
y