2017 Annual Results · Final: HK$ 1.28 Full Year: HK$ 1.70 ( 11.1%) 3 Earnings per share HK$ 8.07 (...
19
2017 Annual Results 16 March 2018
Transcript of 2017 Annual Results · Final: HK$ 1.28 Full Year: HK$ 1.70 ( 11.1%) 3 Earnings per share HK$ 8.07 (...

2017 Annual Results 16 March 2018

Disclaimer
Potential investors and shareholders of the Company (the “Potential Investors and Shareholders”) are reminded that information contained in this Presentation comprises extracts of operational data and financial information of the Group. The information included is solely for the use in this Presentation and certain information has not been independently verified. No representations or warranties, expressed or implied, are made as to, and no reliance should be placed on, the fairness, accuracy, completeness or correctness of the information or opinions presented or contained in this Presentation. Potential Investors and Shareholders should refer to the 2017 Annual Results of the Company which are published in accordance with the listing rules of the Stock Exchange of Hong Kong Limited.
The performance and the results of operations of the Group contained within this Presentation are historical in nature, and past performance is no guarantee of the future results of the Group. Any forward-looking statements and opinions contained within this Presentation are based on current plans, estimates and projections, and therefore involve risks and uncertainties. Actual results may differ materially from expectations discussed in such forward-looking statements and opinions. The Group, the Directors, employees and agents of the Group assume (a) no obligation to correct or update the forward-looking statements or opinions contained in this Presentation; and (b) no liability in the event that any of the forward-looking statements or opinions do not materialise or turn out to be incorrect.
Potential Investors and Shareholders should exercise caution when investing in or dealing in the securities of the Company.
2

2017 Annual Results Highlights
HK$ Million 2017 2016 Change %
Revenue 63,780 69,910 9%
Profit before investment property revaluation 20,320 18,032 13%
Investment property revaluation (net of tax) 9,805 1,383
Profit attributable to shareholders 30,125 19,415 55%
Earnings per share before revaluation
HK$ 5.44 ( 16%)
Net book value per share
HK$ 78.85 ( 12%)
Dividend per share
Interim: HK$ 0.42 Final: HK$ 1.28
Full Year: HK$ 1.70 ( 11.1%)
3
Earnings per share
HK$ 8.07 ( 60%)
Payout ratio before revaluation
30.9%

76%
10%
7%
4%
2% 1%
Revenue by Business Segment
Property Sales
Property Rental
Hotel and Serviced Suite Operation
Aircraft Leasing
Infrastructure and Utility Asset Operation
Property and Project Management
Principal Activities Diversification
4
64%
25%
5%
3%
2% 1%
Profit Contribution by Business Segment
Property Sales
Property Rental
Hotel and Serviced Suite Operation
Aircraft Leasing
Infrastructure and Utility Asset Operation
Property and Project Management
Revenue by Principal Activities
67%
81%
12%
11%
2017 2016
Property Sales Property Rental Hotel and Serviced Suite Operation
Aircraft Leasing Infrastructure and Utility Asset Operation Property and Project Management
7%
8% 3% 9%
1%
1% 1% 1%
58% 67%
25% 26%
2017 2016
6% 6% 3%
7%
Recurrent Income Base
Profit Contribution by Principal Activities
Recurrent Income Base
Note: (1) Profit Contribution refers to contribution from principal activities after depreciation and absorption of overhead expenses, but before interest costs and tax.
2017 HK$ 20,929M
(33%)
2016 HK$ 13,106M
(19%)
2017 HK$ 11,930M
(42%)
2016 HK$ 8,644M
(33%)
2016 HK$ 69,910M
2016 HK$26,311M
2017 HK$63,780M
2017 HK$ 28,181M

39%
48%
13%
47%
41%
12%
Hong Kong
The Mainland
Overseas
Geographical Diversification
Revenue by Geography
Profit Contribution by Geography
Note: (1) Profit Contribution refers to contribution from principal activities after depreciation and absorption of overhead expenses, but before interest costs and tax.
5
47% 58%
41% 42%
12%
2017 2016
46%
53% 1%
58%
42%
2017 HK$63,780M
2017 HK$ 28,181M
2016 HK$ 69,910M
2016 HK$26,311M

Property Sales
HK$ Million 2017 2016 Change
Revenue 42,851 56,804 25%
Profit Contribution 16,251 17,667 8%
Margin 37.9% 31.1%
6
Revenue and Profit Contribution by Geography
HK$ Million Revenue Profit Contribution & Margin
2017 2016 2017 2016
Hong Kong 12,792 20,882 4,889 38.2% 7,108 34.0%
The Mainland 29,555 35,914 11,106 37.6% 10,635 29.6%
Overseas 504 8 256 50.8% (76) n/a
Total 42,851 56,804 16,251 37.9% 17,667 31.1%

Property Sales
7
Major Contributors to Revenue and Profit in 2017
Hong Kong The Mainland Overseas
Stars by the Harbour Yuccie Square The Zumurud
La Grande Ville (Beijing) Cape Coral (Guangzhou) The Harbourfront (Qingdao) Millennium Waterfront (Wuhan) Laguna Verona (Dongguan) Hupan Mingdi (Shanghai) The Greenwich (Xian)
Chelsea Waterfront (the United Kingdom)
Property Sales – Contracted Sales Not Yet Recognised
8
Hong Kong
HK$48,427M
Overseas
HK$3,306M
The Mainland
HK$21,028M
Total HK$72,761M

Property Rental
HK$ Million 2017 2016 Change
Revenue 7,830 7,430 5%
Profit Contribution 7,130 6,784 5%
Margin 91.1% 91.3%
9
Profit Contribution by Geography
HK$ Million Profit Contribution
2017 2016
Hong Kong 6,304 6,290
The Mainland 503 398
Overseas 323 96
Total 7,130 6,784
Revenue by Property Type
HK$ Million Revenue
2017 2016
Office 3,223 3,164
Retail 3,354 3,023
Industrial 785 791
Others 468 452
Total 7,830 7,430
Property Rental
10
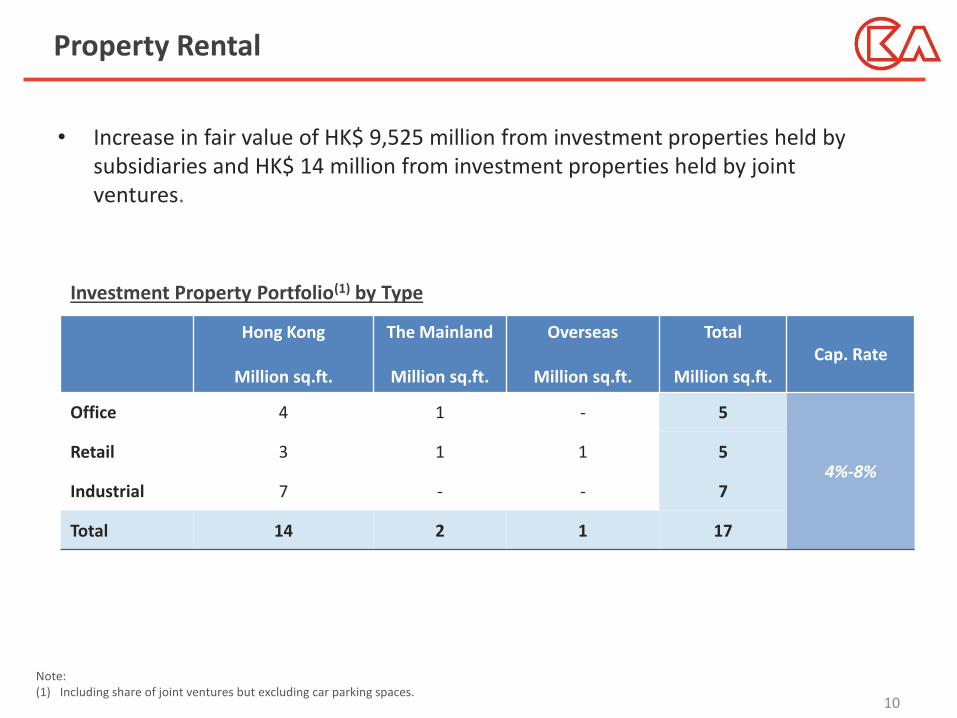
Investment Property Portfolio(1) by Type
Hong Kong
Million sq.ft.
The Mainland
Million sq.ft.
Overseas
Million sq.ft.
Total
Million sq.ft. Cap. Rate
Office 4 1 - 5
4%-8% Retail 3 1 1 5
Industrial 7 - - 7
Total 14 2 1 17
• Increase in fair value of HK$ 9,525 million from investment properties held by subsidiaries and HK$ 14 million from investment properties held by joint ventures.
Note: (1) Including share of joint ventures but excluding car parking spaces.
Hotel and Serviced Suite Operation
11
• The Group’s completed hotel and serviced suite portfolio comprises 16 hotels and serviced suites in Hong Kong, 2 hotels on the Mainland, 1 hotel in The Bahamas and a total of over 15,000 rooms
• In early 2017, the Group’s interests in Harbour Plaza Chongqing and Sheraton Chengdu Lido Hotel were disposed of to Hui Xian Real Estate Investment Trust at a profit of HK$363 million
• The annualised yield on the carrying amount of the Group’s completed hotel and serviced suite properties at the interim period end date was 18.6%.
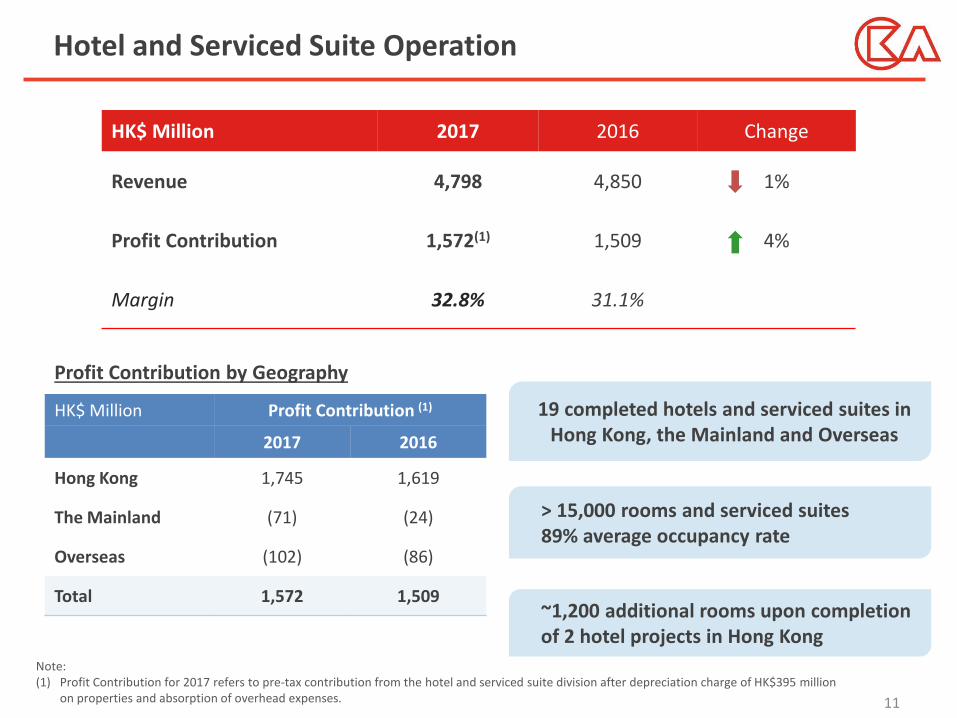
Note: (1) Profit Contribution for 2017 refers to pre-tax contribution from the hotel and serviced suite division after depreciation charge of HK$395 million
on properties and absorption of overhead expenses.
HK$ Million 2017 2016 Change
Revenue 4,798 4,850 1%
Profit Contribution 1,572(1) 1,509 4%
Margin 32.8% 31.1%
Profit Contribution by Geography
HK$ Million Profit Contribution (1)
2017 2016
Hong Kong 1,745 1,619
The Mainland (71) (24)
Overseas (102) (86)
Total 1,572 1,509
19 completed hotels and serviced suites in Hong Kong, the Mainland and Overseas
> 15,000 rooms and serviced suites 89% average occupancy rate
~1,200 additional rooms upon completion of 2 hotel projects in Hong Kong

Property and Project Management
HK$ Million 2017 2016 Change
Revenue 626 620
1%
Profit Contribution 275 267 3%
Margin 43.9% 43.1%
12
Profit Contribution by Geography
HK$ Million Profit Contribution
2017 2016
Hong Kong 210 209
The Mainland 39 35
Overseas 26 23
Total 275 267
• Total floor area of properties under management has reached approximately 269 million sq.ft.

Aircraft Leasing
HK$ Million 2017 2016 Change
Revenue 2,192 206 N/A
Profit Contribution 984(1) 84 N/A
Margin 44.9% 40.8%
13
HK$ Million Profit Contribution
2017 2016
Asia 373 15
Europe 256 6
North America 224 43
Latin America 131 20
Total 984 84
Note: (1) Profit Contribution for 2017 refers to pre-tax contribution from the aircraft leasing business after depreciation charge of HK$1,089 million on
aircraft and absorption of overhead expenses.
86 Aircraft (81 narrow body; 5 wide body)
Average age 5.1 years
Average remaining lease term 5.6 years
Profit Contribution based on Lessee’s Place of Operation
Infrastructure and Utility Asset Operation
14
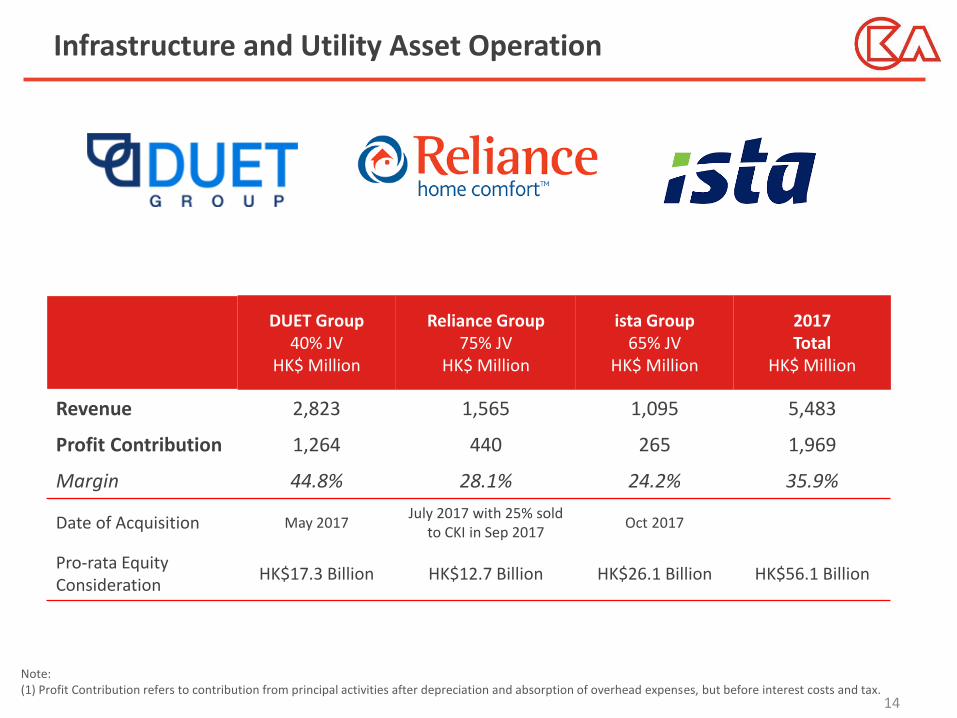
DUET Group 40% JV
HK$ Million
Reliance Group 75% JV
HK$ Million
ista Group 65% JV
HK$ Million
2017 Total
HK$ Million
Revenue 2,823 1,565 1,095 5,483
Profit Contribution 1,264 440 265 1,969
Margin 44.8% 28.1% 24.2% 35.9%
Date of Acquisition May 2017 July 2017 with 25% sold
to CKI in Sep 2017 Oct 2017
Pro-rata Equity Consideration
HK$17.3 Billion HK$12.7 Billion HK$26.1 Billion HK$56.1 Billion
• XXXXXXXXX - In May 2017, the consortium which is held as to 40%, 40% and 20% respectively by the Group, CK Infrastructure Holdings Limited (“CKI”) and Power Assets Holdings Limited completed the acquisition of all the stapled securities in issue of the DUET Group at an adjusted total consideration of approximately AUD7,410 million (equivalent to approximately HK$42,690 million).
• The DUET Group is an owner and operator of energy utility assets in Australia, the United States, the United Kingdom and Europe.
Note: (1) Profit Contribution refers to contribution from principal activities after depreciation and absorption of overhead expenses, but before interest costs and tax.

Infrastructure and Utility Asset Operation
15
Profit Contribution by Geography
Joint Venture Australia
HK$ Million
Europe
HK$ Million
North America
HK$ Million
Others
HK$ Million
2017 Total
HK$ Million
DUET Group 1,238 23 3 - 1,264
Reliance Group - - 440 - 440
ista Group - 262 - 3 265
Total 1,238 285 443 3 1,969
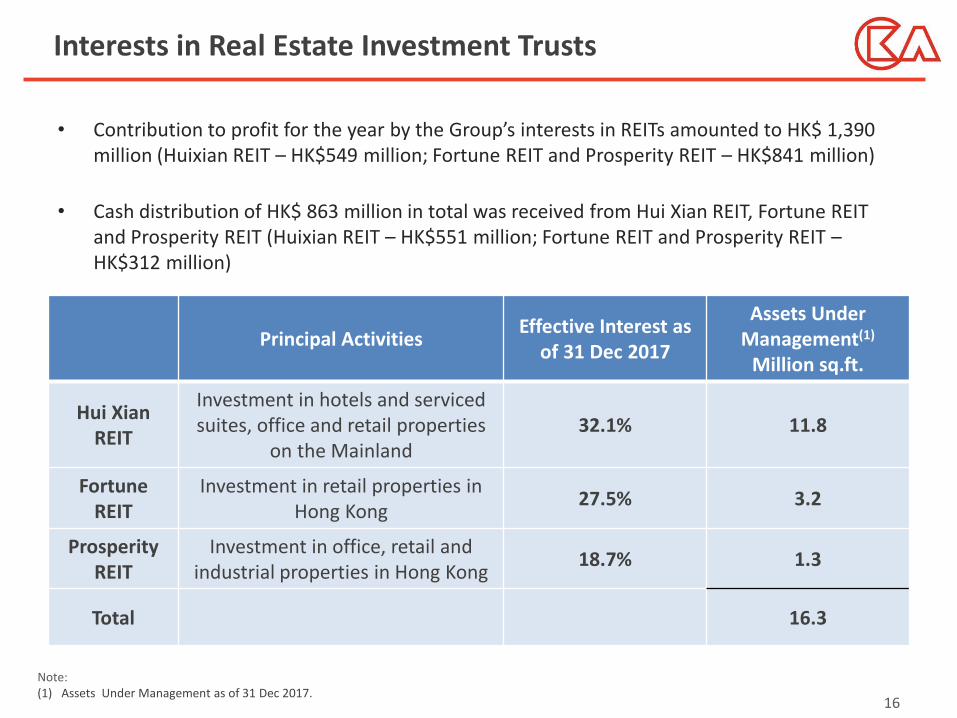
Interests in Real Estate Investment Trusts
• Contribution to profit for the year by the Group’s interests in REITs amounted to HK$ 1,390 million (Huixian REIT – HK$549 million; Fortune REIT and Prosperity REIT – HK$841 million)
• Cash distribution of HK$ 863 million in total was received from Hui Xian REIT, Fortune REIT and Prosperity REIT (Huixian REIT – HK$551 million; Fortune REIT and Prosperity REIT – HK$312 million)
16
Principal Activities Effective Interest as
of 31 Dec 2017
Assets Under Management(1)
Million sq.ft.
Hui Xian REIT
Investment in hotels and serviced suites, office and retail properties
on the Mainland 32.1% 11.8
Fortune REIT
Investment in retail properties in Hong Kong
27.5% 3.2
Prosperity REIT
Investment in office, retail and industrial properties in Hong Kong
18.7% 1.3
Total 16.3
Note: (1) Assets Under Management as of 31 Dec 2017.
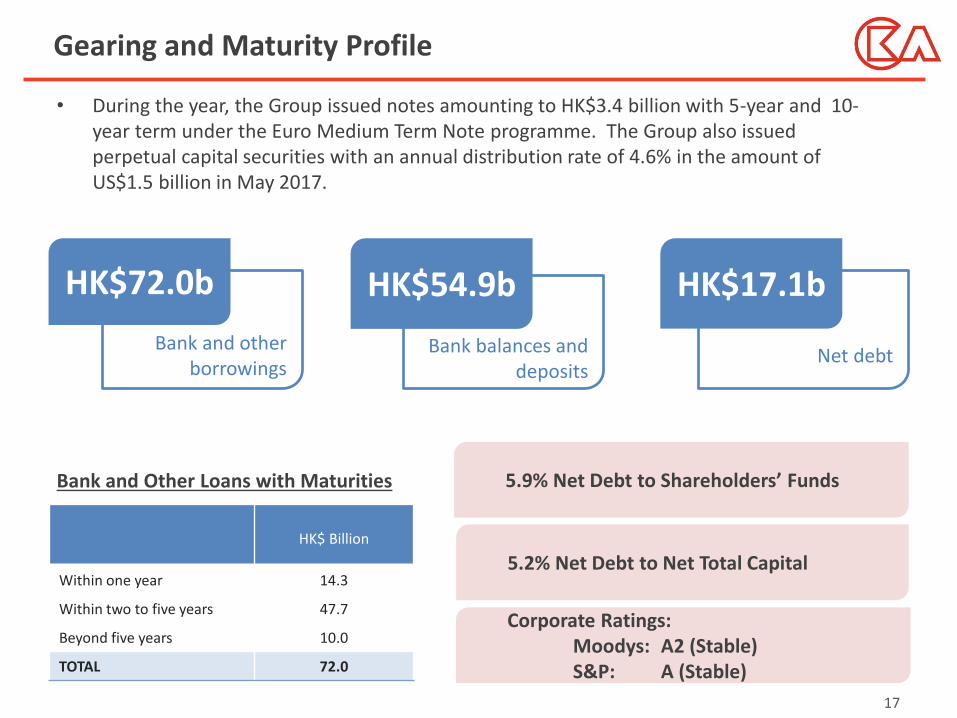
17
Gearing and Maturity Profile
5.9% Net Debt to Shareholders’ Funds
5.2% Net Debt to Net Total Capital
Bank and other borrowings
HK$72.0b
Net debt
HK$17.1b
Bank balances and deposits
HK$54.9b
• During the year, the Group issued notes amounting to HK$3.4 billion with 5-year and 10-year term under the Euro Medium Term Note programme. The Group also issued perpetual capital securities with an annual distribution rate of 4.6% in the amount of US$1.5 billion in May 2017.
HK$ Billion
Within one year 14.3
Within two to five years 47.7
Beyond five years 10.0
TOTAL 72.0
Corporate Ratings: Moodys: A2 (Stable) S&P: A (Stable)
Bank and Other Loans with Maturities

18
Landbank Summary
Note: (1) Development landbank excludes agricultural land, project under planning, land lots in Australia and U.S. and completed properties but includes
developers’ interests in joint development projects.
Hong Kong
6 million sq.ft
Overseas
4 million sq.ft
The Mainland
107 million sq.ft
Total development landbank 117 million sq.ft

Thank you
19