Programme- BLIS Course - Library Classification Year- 2020 ...
2017 ANNUAL REPORT BLIS TECHNOLOGIES LIMITED
www.blis.co.nz
CONTENTSCompany Directory 2
Operations Report 3
Directors’ Report 7
Directors’ Responsibility Statement 10
Statement of Corporate Governance 11
Consolidated Income Statement 14
Consolidated Statement of Comprehensive Income 15
Consolidated Statement of Changes in Equity 16
Consolidated Balance Sheet 17
Consolidated Statement of Cashflows 18
Notes to the Consolidated Financial Statements 19
Additional Stock Exchange Information 37
Independent Auditor’s Report 40
A key highlight for the year includes a net surplus of $585k before interest expense, tax, depreciation and amortisation. This result is on the back of a revenue increase of 16%.
2 BLIS TECHNOLOGIES LIMITED 2017 ANNUAL REPORT
COMPANY DIRECTORYAS AT 31 MARCH 2017
Company Number 1042367
Issued Capital 1,107,653,565 Ordinary Shares
Registered Office Blis Technologies Limited 10 Birch Street Dunedin 9016
Shareholders Listed on the NZX Main Board
Share Registrar Link Market Services Limited P O Box 384 Ashburton
Directors P F Fennessy (Chair) A P Offen (Deputy Chair) V M Aris (Chair Remuneration Committee) G S Boyd A J McKenzie B H Wallace (Chair Audit Committee)1
Chief Executive B D Watson
Auditors Deloitte P O Box 1245 Dunedin
Bankers Bank of New Zealand Dunedin Westpac Banking Corporation Dunedin
Solicitors Anderson Lloyd Private Bag 1959 Dunedin 9054
Downie Stewart Lawyers P O Box 1345 Dunedin
Website www.blis.co.nz
Facebook www.facebook.com/BLISTechnologiesLtd?ref=ts Blis Technologies Limited
www.blis.co.nz
1 Resigned, effective 18 May 2017

OVERVIEW FY 2017 FY 2016 CHANGE $000 $000 $000
2017 ANNUAL REPORT BLIS TECHNOLOGIES LIMITED 3
OPERATIONS REPORTFOR THE YEAR ENDED 31 MARCH 2017
The Blis Technologies Group (made up of Blis Technologies Limited (the “Company”) and its subsidiary, Blis Functional Foods Limited) reports a net deficit of $24k (2016: $816k deficit) and net surplus before interest expense, tax, depreciation and amortisation of $585k (2016: $260k deficit) on total revenue of $6,547k (2016: $5,661k) for the twelve months to 31 March 2017.
Trading revenue increased by $908k (16%) and costs have been managed at a level similar to last year contributing to the $792k improvement in the net deficit.
Key highlights for the year include:
• A $792k reduction in the net deficit compared with the previous year.
• Earnings before interest, tax, depreciation and amortisation (EBITDA) surplus of $586k compared with $260k deficit in the previous year.
• 16% revenue growth over the previous year with growth in Asia, North America and Europe.
• Appointment of key personnel including Chief Financial Officer, Chief Marketing Officer, Science Manager and conversion of contracting roles to staff positions.
• Launch of HoneyBlis® in NZ and Australia.
• Launch of a ToothGuard® and ToothGuard® Junior containing BLIS M18® into NZ retail channels.
• Establishment of a Science Advisory Group to provide expert input and guidance.
• Commissioning of a new Enterprise Resource Planning system, which went live from the start of the 2018 financial year.
Key challenges for the year:
• Deferred orders from two key customers based on their changes of ownership in the last quarter.
• Exchange rate head winds.
• Dealing with regulatory lead times and complexity.
FINANCIAL
The Company reports a consolidated net deficit for the twelve months to 31 March 2017 of $24k (2016: $816k deficit). This includes interest income of $4k received for the period (2016: $33k).
Reporting a further annual net deficit is disappointing and is the result of lost revenue from delayed orders from key overseas customers. For two of our customers there has been a change in ownership which resulted in postponed orders in the last quarter. In both cases, these changes in ownership are seen as positive for Blis and should result in greater focus and investment in building our business in the medium term. Throughout the year, revenue has also been impacted by the strong NZ dollar against our export trading currencies (US dollar and the Euro).
www.blis.co.nz
Revenue
Australasia 1,092 1,164 (72)
Asia, including China 1,322 753 569
Europe 2,316 2,117 199
North America 1,682 1,470 212
Other 124 124 —
Trading revenue 6,536 5,628 908
Other revenue 11 33 (22)
Total revenue 6,547 5,661 886
Net surplus/(deficit) before interest expense, tax, depreciation and
amortisation (EBITDA) 585 (260) 845
Depreciation and amortisation of assets (609) (556) (54)
Net surplus/(deficit) (24) (816) 792

Revenue from ingredients and finished goods are both higher than the previous year. Nutritional sales ($208k) are down from last year ($421k) due to reprioritisation of resources to our core ingredients and finished goods businesses. Asia, North America and Europe revenues continued to grow with revenues of $1,332k (up 76%), $1,682k (up 14%) and $2,316k (up 9%) respectively. Trading revenues for Australasia declined by 6% on the previous year with reduced internet trading and soft domestic sales due to the mild NZ winter. In Asia, Japan was the standout performer, but we also had a small contribution from early trial activity in China as one of our prospective customers prepares for launch activity in FY2018.
Total expenses of $6,571k are in line with last year’s expenses and the contribution margin remained stable at a similar level to last financial year ensuring a reduction in the net deficit of $792k compared with last year.
The deficit against the weighted average number of ordinary shares is (0.00) last year this was (0.07)
Salaries increased by $388k compared with last year as we moved from an over-reliance on contractors to staff. New staff were brought into key permanent roles, including finance, marketing, sales and scientific services. These roles have significantly increased the internal capability of the Company and set us up for the demands of a dynamic growing business.
The Company recorded positive net cash flow from operating activities of $244k (2016: $511k outflow). Capital expenditure for the period totalled $315k (2016: $408k) reflecting the ongoing investment in the manufacturing process and capitalisation of patent costs.
Aggregate cash flows for the year resulted in a decrease in bank balance of $69k (2016: a decrease of $937k). The bank balance held as at 31 March 2017 was $1,140k (2016: $1,209k)
No tax was payable and no dividend will be paid on ordinary shares.
At 31 March 2017, the Company held a net working capital position of $2,254k (2016: $1,927k). The budget prepared by the Company shows that existing cash resources and cash generated from operations should be sufficient to meet the commitments as they fall due. By their nature, budgets are based on assumptions as to customer demand, pricing, costs and exchange rates and actual results may vary from expectations. The Company is investing in upgrading plant to a fully accredited “Good Manufacturing Practice” (GMP) status, regulatory approvals and new product launches. Depending on
progress, the Company may consider options to support its growth and may seek additional capital by way of a placement and/or share plan.
GENERAL COMMENTARY
In FY2017, we focused on establishing the fundamentals for sustainable growth. Considerable effort has been applied to internal processes to support growth and building capability for the future.
New distribution relationships have been progressed within NZ and offshore. New market opportunities have been established in the US, Europe and Japan. In China, we are making good progress with prospective customers who plan to launch in FY2018. These developments have set us up for sustainable profitable growth into the future.
BUSINESS STRATEGY
Management and the Board continue to review our strategy and ensure clarity regarding the commercial focus of the Company. We remain committed to our stated purpose, our value proposition and our strategic priorities.
4 BLIS TECHNOLOGIES LIMITED 2017 ANNUAL REPORT
www.blis.co.nz
CASH FLOWS
FY 2017 FY 2016 Change $000 $000 $000
Operating activities
Trading income and other revenue received 6,574 4,918 1,656
Payments to suppliers and employees (6,330) (5,429) (901)
Net cash inflow/(outflow) from operating activities 244 (511) 755
Investing activities
Capital expenditure (315) (408) 94
Net cash inflow/(outflow) from investing activities (315) (408) 94
Financing activities
Issue of ordinary shares during the year (refer note 14) – – –
Net cash inflows from financing activities – – –
Bank balance year end 1,140 1,209 (69)
Our purpose:
“Leadership in the commercial applications of bacteriocin–producing microbes."
Our value proposition:
Blis Technologies are leaders in the manufacture of advanced probiotic strains that go beyond the gut. We combine innovation with a strong evidence base and the highest quality controls to deliver probiotic solutions for specific health targets.
Our objective
Blis Technologies will become a fully-integrated company, controlling our intellectual property and ensuring the highest quality standards throughout the supply chain.
Our current core internal functions include:
• Probiotic strain development (discovery work).
• Manufacturing of finished good solutions for selected markets.
• Scientific and technical product support.
• Marketing and sales channel development.
Our addressable markets
Probiotics for Human health beyond the gut, targeting a leadership position in:
• ENT (Ear, nose and throat).
• Oral (teeth, gums, halitosis).
• Dermatology (future focus).
Our focus will be on human health supplements based on our strengths today. However, we recognise the potential for licensing opportunities beyond this, including:
• BLIS®-containing functional food solutions.
• BLIS®-containing pet applications and animal health solutions.
Our strategic priorities:
1. Positioning – consistency of value proposition and development of the BLIS® brand
We are moving our focus towards being a supplier of BLIS®-branded finished goods (including prominent co-branding) to help ensure that Blis Technologies is recognised as the source; this is a means of future-proofing the business by developing a closer relationship with customers and consumers.
Progress:
• Appointment of a Chief Marketing Officer and conversion of contract staff to permanent roles in both marketing and sales functions.
• Product portfolio review around key value propositions which are uniquely placed to provide global sales growth.
• Launch of new product offers:
– BLIS M18® products, ToothGuardTM and ToothGuardTM Junior into NZ retail.
– HoneyBlisTM launched in Australia and NZ.
– BLIS EliteProTM (high dose BLIS K12® targeted at athletes) launched, and ongoing collaboration with elite sports organisations.
• Expanded distributor relationships in New Zealand:
– New distributor relationships with Pacific Health targeting health practitioners and Henry Schein NZ for the professional dental channel.
– Updated agreement with Pharmabroker for pharmacy distribution.
• Appointment of a new advertising agency to support marketing and launch activity.
• Website development with launch early in the 2018 financial year, significantly refining both the on-line sales channel and corporate communication.
• Broadening customer base internationally:
– China: key customer progress on launch plans.
– Japan: new co-branded finished product launch.
– Australia: HoneyBlisTM launch.
– EU and US: new launch activity.
2. Supply chain – ensuring quality, capacity and IP protection within our supply chain
We are the core source of knowledge about our BLIS® products, so that we will have the internal expertise and processes all through our supply chain (from the organism to fermentation to formulation to end-products, including regulatory and clinical efficacy right through to the consumer).
Progress:
• Further investment in quality assurance and technical capability to support our customers.
• Continuous improvement initiatives within manufacturing focused on quality and efficiency.
• Establishment of new relationships for future offshore raw ingredient manufacturing to meet capacity and logistical needs.
• Investment in equipment and development of plans to upgrade our manufacturing plant to GMP status.
• IP portfolio management and protection through on-going R&D, patent filings, development and protection of trade secrets, regulatory approvals and trademark registrations towards building a stronger Blis brand.
3. Pipeline – optimising value from our IP
Our library of defined organisms provides the core resource that underpins the future of the Company.
2017 ANNUAL REPORT BLIS TECHNOLOGIES LIMITED 5
www.blis.co.nz

6 BLIS TECHNOLOGIES LIMITED 2017 ANNUAL REPORT
www.blis.co.nz
Progress:
• Further investment in scientific services to accelerate R&D activity.
• New pipeline process for development of new probiotic strains for commercial evaluation.
• Further advances through an early-stage clinical trial of a new strain (BLIS Q24TM) targeting skin applications.
• New product development process with three launches – HoneyBlisTM, BLIS EliteProTM, ToothGuardTM and ToothGuardTM Junior.
• Early-stage evaluation of new food formats for one probiotic strain.
• Recent clinical studies: three clinical trials were published on the efficacy of BLIS K12®.
– One independent study confirmed that application of BLIS K12® combined with standard oral care techniques contributes to an improved breath score compared to standard oral care techniques alone2.
– Another independent trial in Italy investigated the benefit of taking daily BLIS K12® in supporting oral health in children entering an environment where there was an increased chance of catching an oral infection. In this trial, 111 children taking BLIS K12® were found to have a lower incidence of oral diseases such as pharyngitis and otitis media compared to a group of children who did not receive any BLIS K12®3.
– Another trial from the same group in Italy assessed the value of daily BLIS K12® in reducing oral streptococcal diseases in a group of children prone to infection, compared to a group of healthy children. A significant reduction was seen in children taking BLIS K12® for several disease end points4.
• Clinical trials in progress
– Blis supported clinical trials during the year. Two are underway or about to begin. One will investigate the effect of BLIS K12® in reducing streptococcal sore throat (in collaboration with Stratum Nutrition, our US based distributor); a second trial will look at the value of BLIS K12® in reducing otitis media.
– Sinopharm is undertaking clinical trials in China and, as previously advised, we anticipate the results of these will be published within the current calendar year.
• Reviews and mechanistic publications:
– A review of BLIS K12® was published by an independent group5.
– Collaboration with the Murdoch Childrens Research Institute (Melbourne) found that S. salivarius K12 helped to inhibit the binding of pneumococcal bacteria to epithelial cells. This provided evidence as to how BLIS K12® may function to protect against bacterial diseases6.
– The mechanism of action as to how salivaricin B works to kill bacteria has now been defined7.
• Regulatory updates – new approvals, applications submitted:
– The Company has submitted a New Substance Application with intent for a Listed Medicine to the TGA in Australia. Blis Technologies is also preparing regulatory applications for the USA (GRAS for BLIS M18®) and Canada (BLIS M18®).
• Strain development
The Company is investing in the evaluation of new candidate strains in its pipeline. One strain (BLIS Q24TM for skin applications) has progressed to the point of formulation trials.
OUTLOOK
We continue to see strong growth opportunities for both BLIS K12® and BLIS M18® as we enter new markets and open new channels within existing markets.
Solid foundations for the future have been established and we have our cost base clearly defined for future sustainable profitable growth. With prudent investment, we believe there is a good balance between existing business support and pipeline development to realise the potential of our IP.
In the medium term, we expect meaningful sales from China, and from expanded market approvals in Australia and new customer relationships globally. Along with this, we expect that the new probiotic strain targeting skin applications will launch in the 2019 financial year.
Thank you for your ongoing support.
2 Jamali Z et al, Oral Health Prev Dent. 2016;14(4):305-13 Impact of Chlorhexidine Pre-treatment Followed by Probiotic Streptococcus salivarius Strain K12 on Halitosis in Children: A Randomised Controlled Clinical Trial.
3 Di Pierro et al. Eur Rev Med Pharmacol Sci. 2016 Nov;20(21):4601-4606. Effect of administration of Streptococcus salivarius K12 on the occurrence of streptococcal pharyngo-tonsillitis, scarlet fever and acute otitis media in 3 years old children.
4 Di Pierro et al Drug Healthc Patient Saf. 2016 Nov 21;8:77-81. Positive clinical outcomes derived from using Streptococcus salivarius K12 to prevent streptococcal pharyngotonsillitis in children: a pilot investigation.
5 Zupancic et al. Probiotics Antimicrob Proteins. 2017 Feb 24. Influence of Oral Probiotic Streptococcus salivarius K12 on Ear and Oral Cavity Health in Humans: Systematic Review.
6 Manning J et al. BMC Microbiol. 2016 Sep 29;16(1):225. Investigation of Streptococcus salivarius-mediated inhibition of pneumococcal adherence to pharyngeal epithelial cells.
7 Barbour A et al. Sci Rep. 2016 Aug 16;6:31749. New insights into the mode of action of the lantibiotic salivaricin B.
Peter Fennessy Brian WatsonChairman Chief Executive
2017 ANNUAL REPORT BLIS TECHNOLOGIES LIMITED 7
www.blis.co.nz
STATEMENT OF AFFAIRS OF THE COMPANY
The results of operations for the year and the financial position of the Company are detailed in the accompanying financial statements.
PRINCIPAL ACTIVITIES
The principal activities of the Company are research, development and commercialisation of healthcare products based on strains of bacteria that produce bacteriocins, the supply of healthcare ingredients and the manufacture of part and finished goods and other food products for sale in domestic and international markets.
DIVIDEND
The Directors recommend that no dividend be paid.
AUDITORS
It is proposed that the auditors, Deloitte, continue in office in accordance with Section 207T of the Companies Act 1993.
PARTICULARS OF NOTICES OR STATEMENTS GIVEN TO OR APPROVED BY THE BOARD
INTERESTS REGISTER
Directors and officers (as that term is defined in the Companies Act 1993) have declared interest in the following transactions with the Group during the year:
- Mr A P Offen disclosed his interests through his role as Director of Edinburgh Securities Ltd. Edinburgh Securities Ltd has been involved in providing executive services to the Company, the terms of which the other Directors considered fair and reasonable to the Company and its existing shareholders.
- Mr P F Fennessy disclosed his interests in providing professional consulting services to the Company through AbacusBio Limited, the terms of which the other Directors considered fair and reasonable to the Company and its existing shareholders.
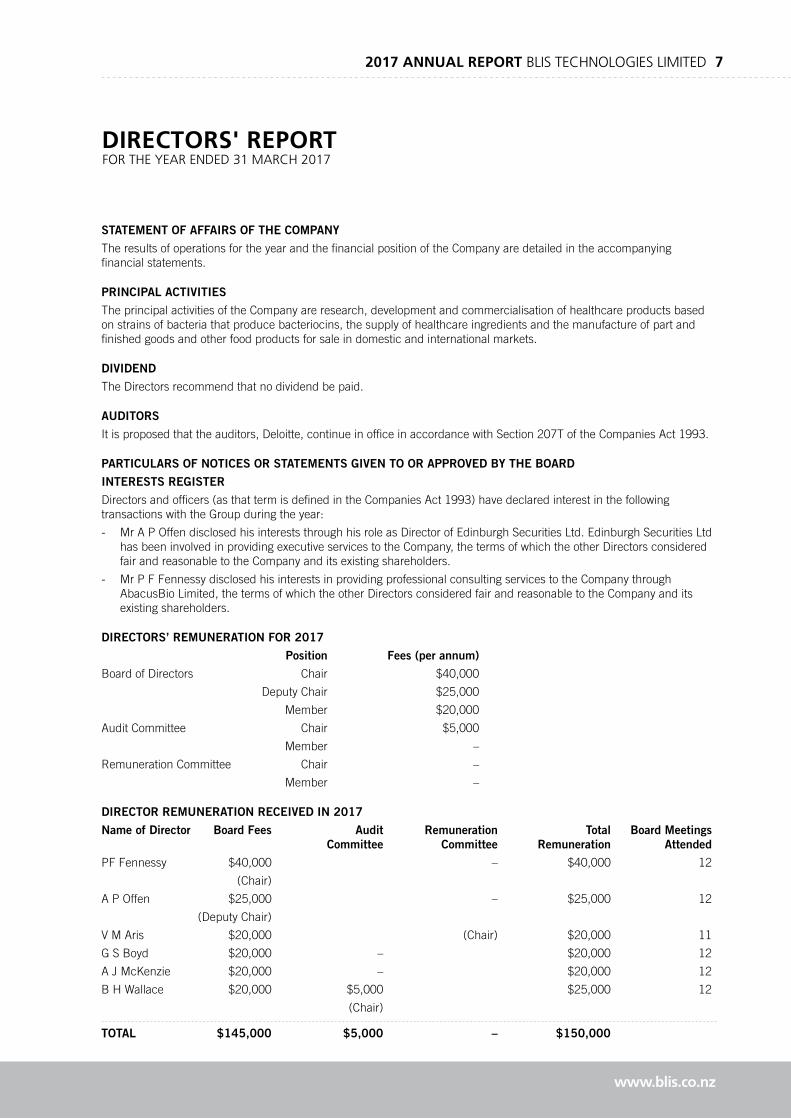
DIRECTORS’ REMUNERATION FOR 2017
Position Fees (per annum)
Board of Directors Chair $40,000
Deputy Chair $25,000
Member $20,000
Audit Committee Chair $5,000
Member –
Remuneration Committee Chair –
Member –
DIRECTOR REMUNERATION RECEIVED IN 2017
Name of Director Board Fees Audit Remuneration Total Board Meetings Committee Committee Remuneration Attended
PF Fennessy $40,000 – $40,000 12
(Chair)
A P Offen $25,000 – $25,000 12
(Deputy Chair)
V M Aris $20,000 (Chair) $20,000 11
G S Boyd $20,000 – $20,000 12
A J McKenzie $20,000 – $20,000 12
B H Wallace $20,000 $5,000 $25,000 12
(Chair)
TOTAL $145,000 $5,000 – $150,000
DIRECTORS' REPORTFOR THE YEAR ENDED 31 MARCH 2017
8 BLIS TECHNOLOGIES LIMITED 2017 ANNUAL REPORT
www.blis.co.nz
DIRECTORS’ LOANS
There were no loans from the Company to Directors.
USE OF COMPANY INFORMATION
The Board received no notices during the year from Directors requesting to use the Company information received in their capacity as Directors which would not have been otherwise available to them.
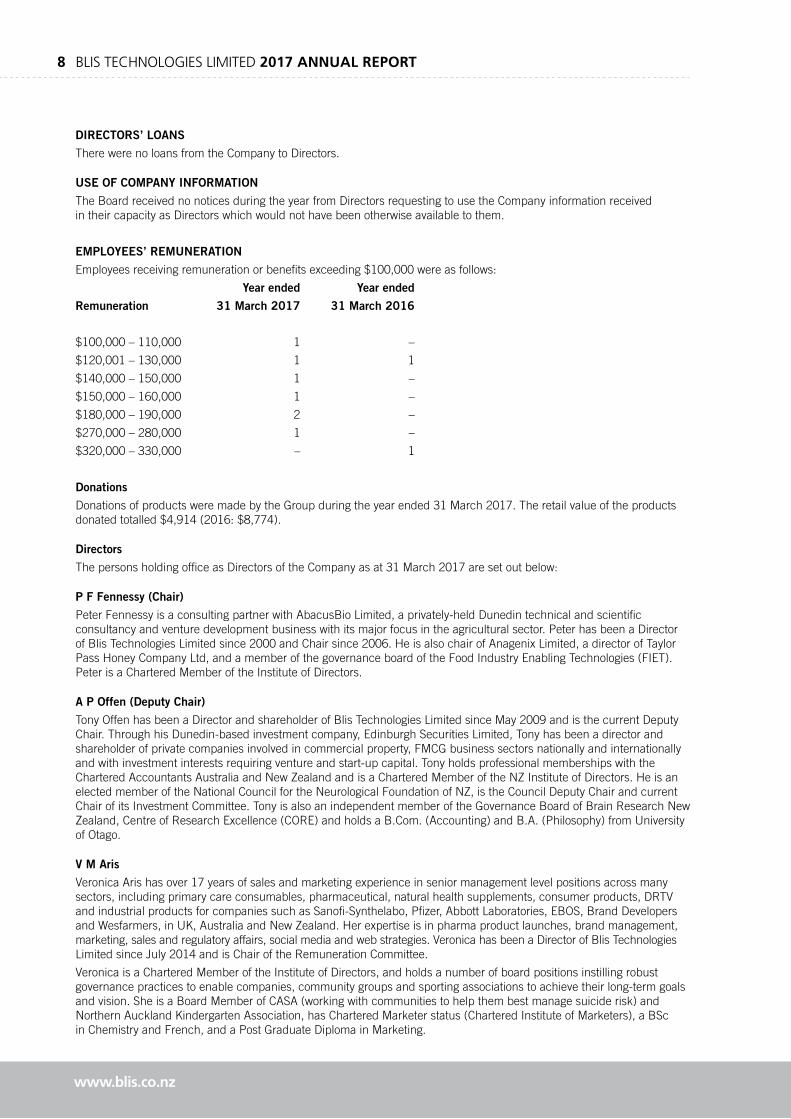
EMPLOYEES’ REMUNERATION
Employees receiving remuneration or benefits exceeding $100,000 were as follows:
Year ended Year ended
Remuneration 31 March 2017 31 March 2016
$100,000 – 110,000 1 –
$120,001 – 130,000 1 1
$140,000 – 150,000 1 –
$150,000 – 160,000 1 –
$180,000 – 190,000 2 –
$270,000 – 280,000 1 –
$320,000 – 330,000 – 1
Donations
Donations of products were made by the Group during the year ended 31 March 2017. The retail value of the products donated totalled $4,914 (2016: $8,774).
Directors
The persons holding office as Directors of the Company as at 31 March 2017 are set out below:
P F Fennessy (Chair)
Peter Fennessy is a consulting partner with AbacusBio Limited, a privately-held Dunedin technical and scientific consultancy and venture development business with its major focus in the agricultural sector. Peter has been a Director of Blis Technologies Limited since 2000 and Chair since 2006. He is also chair of Anagenix Limited, a director of Taylor Pass Honey Company Ltd, and a member of the governance board of the Food Industry Enabling Technologies (FIET). Peter is a Chartered Member of the Institute of Directors.
A P Offen (Deputy Chair)
Tony Offen has been a Director and shareholder of Blis Technologies Limited since May 2009 and is the current Deputy Chair. Through his Dunedin-based investment company, Edinburgh Securities Limited, Tony has been a director and shareholder of private companies involved in commercial property, FMCG business sectors nationally and internationally and with investment interests requiring venture and start-up capital. Tony holds professional memberships with the Chartered Accountants Australia and New Zealand and is a Chartered Member of the NZ Institute of Directors. He is an elected member of the National Council for the Neurological Foundation of NZ, is the Council Deputy Chair and current Chair of its Investment Committee. Tony is also an independent member of the Governance Board of Brain Research New Zealand, Centre of Research Excellence (CORE) and holds a B.Com. (Accounting) and B.A. (Philosophy) from University of Otago.
V M Aris
Veronica Aris has over 17 years of sales and marketing experience in senior management level positions across many sectors, including primary care consumables, pharmaceutical, natural health supplements, consumer products, DRTV and industrial products for companies such as Sanofi-Synthelabo, Pfizer, Abbott Laboratories, EBOS, Brand Developers and Wesfarmers, in UK, Australia and New Zealand. Her expertise is in pharma product launches, brand management, marketing, sales and regulatory affairs, social media and web strategies. Veronica has been a Director of Blis Technologies Limited since July 2014 and is Chair of the Remuneration Committee.
Veronica is a Chartered Member of the Institute of Directors, and holds a number of board positions instilling robust governance practices to enable companies, community groups and sporting associations to achieve their long-term goals and vision. She is a Board Member of CASA (working with communities to help them best manage suicide risk) and Northern Auckland Kindergarten Association, has Chartered Marketer status (Chartered Institute of Marketers), a BSc in Chemistry and French, and a Post Graduate Diploma in Marketing.

2017 ANNUAL REPORT BLIS TECHNOLOGIES LIMITED 9
www.blis.co.nz
G S Boyd
Graeme Boyd joined ICI New Zealand Limited in 1971 and for over 26 years held a variety of positions across the business, including management of the Pharmaceuticals Division, culminating in the role of NZ General Manager from 1990 to 1997. He was appointed CEO of Comvita in 1998 and developed the company from a small privately-owned company to a publicly-listed company centred on marketing natural health products internationally. Graeme left Comvita in 2005 and formed a management consulting business specialising in company turnarounds, growth strategies and international marketing. Graeme has been a director of Blis Technologies Limited since July 2014. He is currently an independent director of Phytomed Medicinal Herbs Limited. Graeme is a professional director, a Chartered Member of the Institute of Directors and holds an MSC (Chemistry) from University of Canterbury.
A J McKenzie
Alan McKenzie is a Dunedin-based business adviser with over 40 years’ experience as a Chartered Accountant working in New Zealand and overseas, in both public practice and industry. Alan has been a director of Blis Technologies Limited since August 2012. He has worked with numerous businesses ranging from new ventures requiring day to day input, to substantial multi-national companies. His focus is advising clients regarding structuring business investment, financing, and related taxation issues. He is a Fellow Chartered Director of the Institute of Directors, a Fellow of the Institute of Chartered Secretaries and a director of several client-owned businesses and investment groups operating within New Zealand and internationally. Alan is a Trustee for several private family groups and local charitable organisations.
B H Wallace (Audit Committee Chair)
Bevan Wallace joined the Board of Directors at Blis Technologies Limited in 2008. He is a former Chartered Accountant, a Fellow of the Institute of Financial Professionals New Zealand (Inc.), a Chartered Member of the Institute of Directors and a member of the Law and Economics Association of New Zealand (Inc.). Bevan is Chair of Efficient Market Services Limited, operator of the Unlisted share trading platform and provides value-based strategic advice though his consultancy, Morgan Wallace Limited. He holds a Master of Commerce with First Class Honours in Economics and Accountancy (University of Canterbury).
SHARE DEALING
During the year, the Directors (or associated entities in which the Directors have relevant interests) acquired/(disposed) of the following equity securities in the Group:
A P Offen (27,100,000) ordinary shares
BLIS FUNCTIONAL FOODS LIMITED
The Company has a wholly-owned subsidiary called Blis Functional Foods Limited which was incorporated on 28 February 2011. The status of the subsidiary since March 2013 is that it is non-trading. The director of this subsidiary as at 31 March 2017 is Anthony Offen. Mr Offen does not receive separate remuneration in relation to his directorship of the subsidiary.
10 BLIS TECHNOLOGIES LIMITED 2017 ANNUAL REPORT
DIRECTORS’ RESPONSIBILITY STATEMENTFOR THE YEAR ENDED 31 MARCH 2017
The Directors of Blis Technologies Limited are pleased to present to shareholders the financial statements for the Group for the year ended 31 March 2017.
The Directors are responsible for presenting financial statements in accordance with New Zealand law and generally accepted accounting practice, which fairly presents the financial position of the Group as at 31 March 2017 and the results of its operations and cash flows for the year ended on that date.
The Directors consider the financial statements of the Group have been prepared using accounting policies which have been consistently applied and supported by reasonable judgements and estimates and that all relevant financial reporting and accounting standards have been followed.
The Directors believe that proper accounting records have been kept which enable with reasonable accuracy, the determination of the financial position of the Group and facilitate compliance of the financial statements with the Financial Reporting Act 2013 and the Financial Markets Conduct Act 2013.
The Directors consider that they have taken adequate steps to safeguard the assets of the Group, and to prevent and detect fraud and other irregularities. Internal control procedures are also considered to be sufficient to provide a reasonable assurance as to the integrity and reliability of the financial statements.
The Financial Statements are signed on behalf of the Board by:
www.blis.co.nz
Anthony Offen Peter Fennessy Director Director
29 May 2017

2017 ANNUAL REPORT BLIS TECHNOLOGIES LIMITED 11
STATEMENT OF CORPORATE GOVERNANCEFOR THE YEAR ENDED 31 MARCH 2017
Board and Management are committed to ensuring that the Company maintains Corporate Governance structures which ensure that the Company operates efficiently and effectively in the best interests of the Company, but at the same time recognises that certain elements of international “best practice” corporate governance are not appropriate for a small company.
This statement of Corporate Governance provides a summary of the Company’s Corporate Governance processes, and the Code of Conduct contained in the Directors' Operations Manual.
The Company’s Corporate Governance policies are based on the nine principles of corporate governance issued by the Financial Markets Authority. The nine principles are:
• Ethical standards
• Board composition and performance
• Use of Board Committees where this would enhance effectiveness
• Reporting and disclosure
• Remuneration
• Risk management
• Auditors
• Shareholder relations
• Stakeholder interest.
FINANCIAL STATEMENTS
The Directors are responsible for ensuring that the Company’s financial statements give a true and fair view of the financial position of the Company and its financial performance and cash flows for the year. The external auditors are responsible for expressing an opinion on the financial statements, based on their review and assessment of the conclusions drawn from evidence obtained in the course of the audit.
The Directors believe that proper accounting records have been kept which enable, with reasonable accuracy, the determination of the financial position of the Company and facilitate compliance of the financial statements with the Financial Markets Conduct Act 2013 and Financial Reporting Act 2013.
ROLE OF THE BOARD OF DIRECTORS
Directors are elected by the shareholders to govern the Company in the Company’s best interests. The Board is the overall and final body of responsibility for all decision making within the Company.
The Directors have a diverse range of expertise and experience, and are committed to use this to benefit the Company. The Board is responsible to shareholders for charting the direction of the Company by participating in the setting of objectives, strategy and key policy areas. The Board is then responsible for monitoring management’s running of the business to ensure implementation is in accordance with the agreed framework. The Board delegates the conduct of the day-to-day affairs of the Company to the Chief Executive Officer within this framework.
The primary responsibilities of the Board include:
• Establishing the long-term goals of the Company and strategic plans to achieve those goals;
• Succession planning for the Chief Executive Officer and the Board;
• Risk management in order to protect its employees, assets, earnings and reputation;
• Reviewing and adopting a plan and operating budget produced annually;
• Monitoring environmental, social and financial performance;
• Ensuring that the Company has implemented adequate systems of internal controls, including internal financial controls together with appropriate monitoring of compliance activities;
• Appointing and monitoring the Chief Executive Officer and other executive managers and determining their remunerations;
• Communicating with shareholders and other stakeholders;
• Approving the annual and half-year financial statements; and
www.blis.co.nz
• Providing the necessary leadership and responsibility for the major decisions that influence health and safety: including the strategic direction, securing and allocating resources and ensuring the Company has appropriate people, systems and equipment.
The Directors appoint a Chair from amongst their members. The Board supports separation of the role of Chair and Chief Executive Officer. The Chair’s role is to provide leadership and to manage the Board effectively.
The Chief Executive Officer is not a Director, the Board will meet without the Chief Executive Officer being present; in this respect, the Board has a practice of Directors only meetings at the time of each Board meeting.
The Board receives reports from management and has access to all of the information necessary for it to effectively discharge its duties.
BOARD MEMBERSHIP & INDEPENDENCE
The Constitution currently sets the size of the Board at a minimum of three and at least two Directors must be resident in New Zealand. The Board currently comprises six Directors, comprising a Chair, Deputy Chair and four Directors appointed for their mix of commercial and technical skills. The Board aims to meet on at least eight occasions in the financial year.
All six Directors are non-executive members and Independent members. A Director is “Independent” when they are not an executive officer of the Company and do not have a ‘Disqualifying Relationship’ (as defined in the NZX Main Board Listing Rules) where for instance he or she has any direct or indirect interest or relationship with the Company which could reasonably influence, in a material way, that Director’s decisions relating to the Company. The Board will consider all relevant circumstances when determining independence.
The Company has no requirement for Directors to hold shares in the Company but actively encourages them to do so.
The Board as a whole is involved with recommending candidates to act as Directors to shareholders. When considering candidates for nomination, the Board will consider, amongst other things, the individual’s experience, qualifications and skills in comparison to the experience, qualifications and skills of other Directors, whether that individual is “Independent” and whether that individual would be able to work effectively with other Directors. The Board has the ability to appoint an individual to fill a casual vacancy on the Board until the Company’s next Annual General Meeting.
The procedures for the appointment and removal of Directors are governed by the Company’s Constitution and the NZX Main Board Listing Rules. One third of the Company’s Directors (rounded, if necessary, to the nearest number) are required to retire and may stand for re-election at every Annual Meeting, with those Directors to retire being those who have been in office longest since they were elected or deemed to be elected.
The total aggregate Directors’ remuneration is fixed and may only be increased by shareholders at the Company’s Annual Meeting, upon the recommendation of the Board as a whole. The Board is responsible for determining the remuneration paid to each Director.
CODE OF CONDUCT
As part of the Board’s commitment to the highest standard of conduct, the Company has adopted a code of conduct as part of a Directors’ Operations Manual to guide Directors and management in carrying out their duties and responsibilities. The Directors’ Operations Manual covers such matters as:
• Corporate governance matters;
• Role of the Board and composition of the Board;
• Director responsibilities;
• Appointment of, responsibilities of and remuneration of a Chief Executive Officer;
• Confidentiality and the safeguarding of company information;
• Compliance with laws and regulations;
• Shareholder participation; and
• Code of ethics.
Newly-elected Directors are required to familiarise themselves with and comply with the Directors’ Operations Manual. Some training is also provided to new and existing Directors where this is required to enable Directors to fulfil their responsibilities.
CONFLICTS OF INTEREST
As part of the Code of Ethics contained in the Directors' Operations Manual there is a procedure to be followed where Directors are faced with a conflict of interest. At all times, a Director must be able to act in the interests of the organisation as a whole and in accordance with all relevant laws, including the NZX Main Board Listing Rules. The interests and associates, individual shareholders and the personal interests of the Director and their family must not be allowed to prevail over those of the Company and its shareholders generally.
12 BLIS TECHNOLOGIES LIMITED 2017 ANNUAL REPORT
www.blis.co.nz
2017 ANNUAL REPORT BLIS TECHNOLOGIES LIMITED 13
AUDIT, RISK MANAGEMENT AND INTERNAL FINANCIAL CONTROL
The Board has overall responsibility for risk management and the Company’s system of internal financial control, for liaising with the Company’s external auditors, and for ensuring the integrity of the Company’s financial reporting. The Board constantly monitors the operational and financial aspects of the Company’s activities and has established procedures and policies that are designed to provide effective internal financial control. Annual budgets and business plans are prepared, and agreed by the Board. Monthly management accounts are prepared and reviewed by the Board throughout the year to monitor performance against budget.
The Board has established an Audit Committee to assist the Board in discharging its responsibilities relative to financial reporting, related regulatory conformance and liaising with the external auditors. The terms of reference for the audit committee are set out in the Directors' Operations Manual. Membership of the audit committee must comprise three Directors, the majority of whom are to be independent and the chair of the Board shall not be the chair of the audit committee. The current members of the audit committee are Bevan Wallace (Independent Chair), Alan McKenzie (Independent) and Graeme Boyd (Independent).
The Board considers the recommendations of the audit committee and advice of external auditors and other external advisors on the operational and financial risks that face the Company. The Board ensures that recommendations made by the audit committee, external auditors and other external advisers are investigated and, where considered necessary, action is taken to ensure that the Company has an appropriate internal control environment in place to manage the key risks identified.
In addition, the Board investigates ways of enhancing existing risk management strategies, including appropriate segregation of duties and the employment and training of suitably qualified and experienced personnel.
Given the size of the Company, an internal audit function is not considered necessary.
REMUNERATION COMMITTEE
The Board has established a remuneration committee to assist the Board in discharging its responsibility for setting the remuneration policy for all members of the senior management team with regard to pay and employment conditions across the Company, especially when determining salary increases.
The terms of reference for this committee are set out in the Directors' Operations Manual.
The committee must comprise three Directors, the majority of whom shall be independent. The Chair of the Board may serve on the committee. Members of the remuneration committee are Veronica Aris (Independent Chair), Peter Fennessy (Independent) and Tony Offen (Independent).
The Board ensures that the recommendations made by the committee are considered and acted on accordingly.
NZX CORPORATE BEST PRACTICE CODE
Given the size and composition of the Board, directors believe that there are no significant benefits in delegating matters in relation to Board nominations.
Other than on this point, the Company’s Corporate Governance processes do not materially differ from the principles set out in the NZX Corporate Governance Best Practice Code.
www.blis.co.nz

14 BLIS TECHNOLOGIES LIMITED 2017 ANNUAL REPORT
CONSOLIDATED INCOME STATEMENTFOR THE YEAR ENDED 31 MARCH 2017
www.blis.co.nz
The accompanying notes form part of these financial statements.
Notes 2017 2016 $’000 $’000 REVENUES Revenue 2a 6,543 5,628Interest received 4 33 6,547 5,661
LESSDistribution expenses 64 48 Marketing expenses 94 50Occupancy expenses 161 159Operating expenses 5,848 5,813Other expenses 404 407 6,571 6,477
SURPLUS/(DEFICIT) BEFORE TAX 2b, 4, 5 (24) (816)Income tax expense 3 - -
SURPLUS/(DEFICIT) FOR THE YEAR (24) (816)
Surplus/(Deficit) for the year is attributable to:Equity holders of the parent (24) (816) (24) (816)
Earnings/(Deficit) per share:Basic (cents per share) 13 (0.00) (0.07)Diluted (cents per share) 13 (0.00) (0.07)
2017 ANNUAL REPORT BLIS TECHNOLOGIES LIMITED 15
www.blis.co.nz
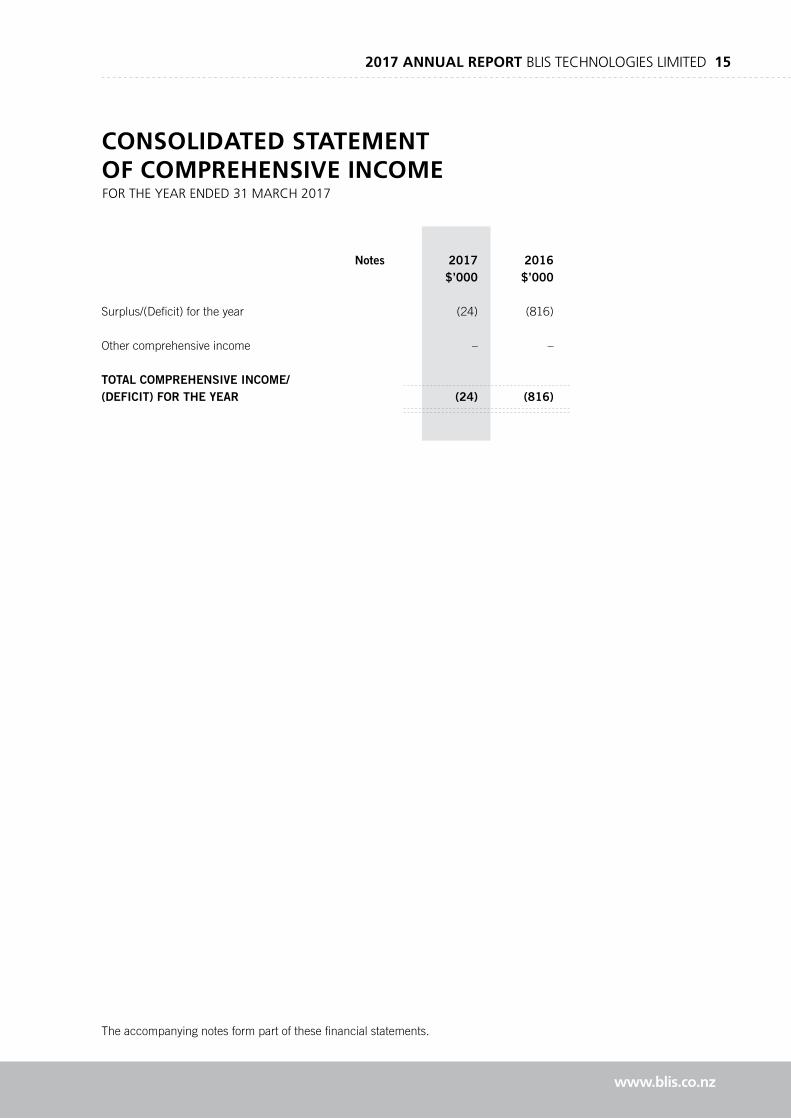
CONSOLIDATED STATEMENTOF COMPREHENSIVE INCOMEFOR THE YEAR ENDED 31 MARCH 2017
The accompanying notes form part of these financial statements.
Notes 2017 2016 $’000 $’000 Surplus/(Deficit) for the year (24) (816)
Other comprehensive income – –
TOTAL COMPREHENSIVE INCOME/(DEFICIT) FOR THE YEAR (24) (816)
16 BLIS TECHNOLOGIES LIMITED 2017 ANNUAL REPORT
www.blis.co.nz
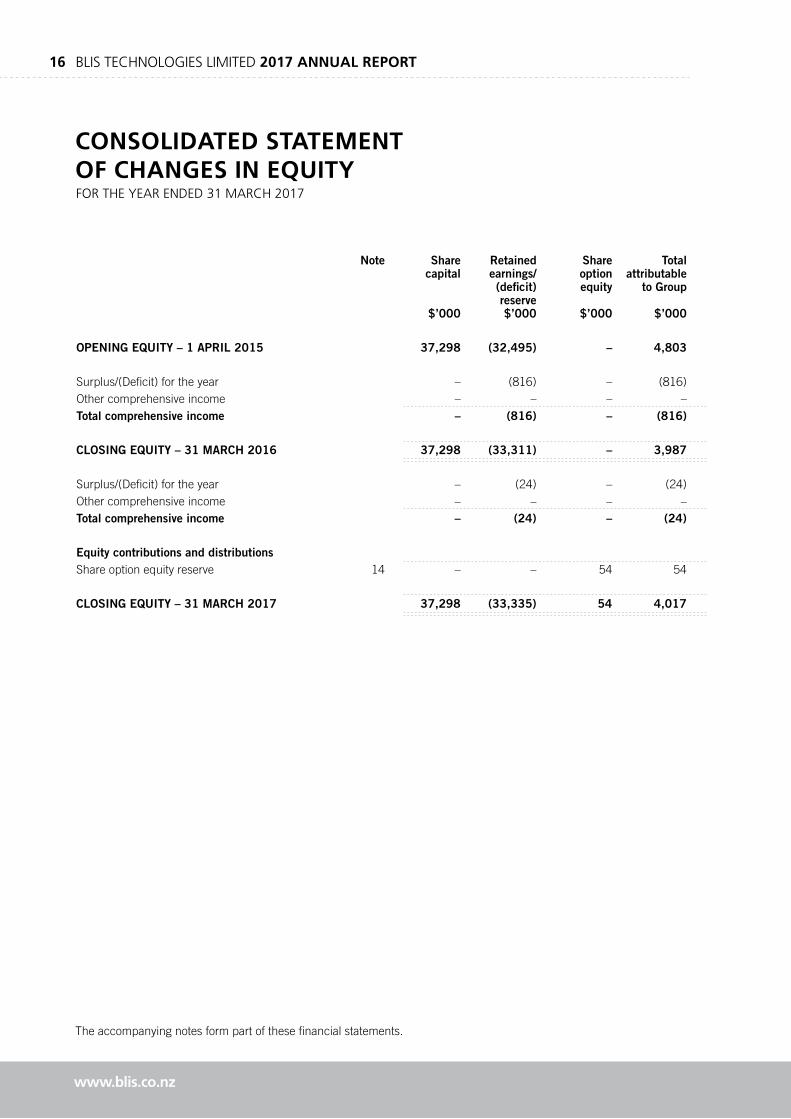
Note Share Retained Share Total capital earnings/ option attributable (deficit) equity to Group reserve $’000 $’000 $’000 $’000
OPENING EQUITY – 1 APRIL 2015 37,298 (32,495) – 4,803 Surplus/(Deficit) for the year – (816) – (816)Other comprehensive income – – – – Total comprehensive income – (816) – (816)
CLOSING EQUITY – 31 MARCH 2016 37,298 (33,311) – 3,987 Surplus/(Deficit) for the year – (24) – (24) Other comprehensive income – – – – Total comprehensive income – (24) – (24) Equity contributions and distributions Share option equity reserve 14 – – 54 54 CLOSING EQUITY – 31 MARCH 2017 37,298 (33,335) 54 4,017
The accompanying notes form part of these financial statements.
CONSOLIDATED STATEMENTOF CHANGES IN EQUITYFOR THE YEAR ENDED 31 MARCH 2017
2017 ANNUAL REPORT BLIS TECHNOLOGIES LIMITED 17
www.blis.co.nz
The accompanying notes form part of these financial statements.
CONSOLIDATED BALANCE SHEETAS AT 31 MARCH 2017
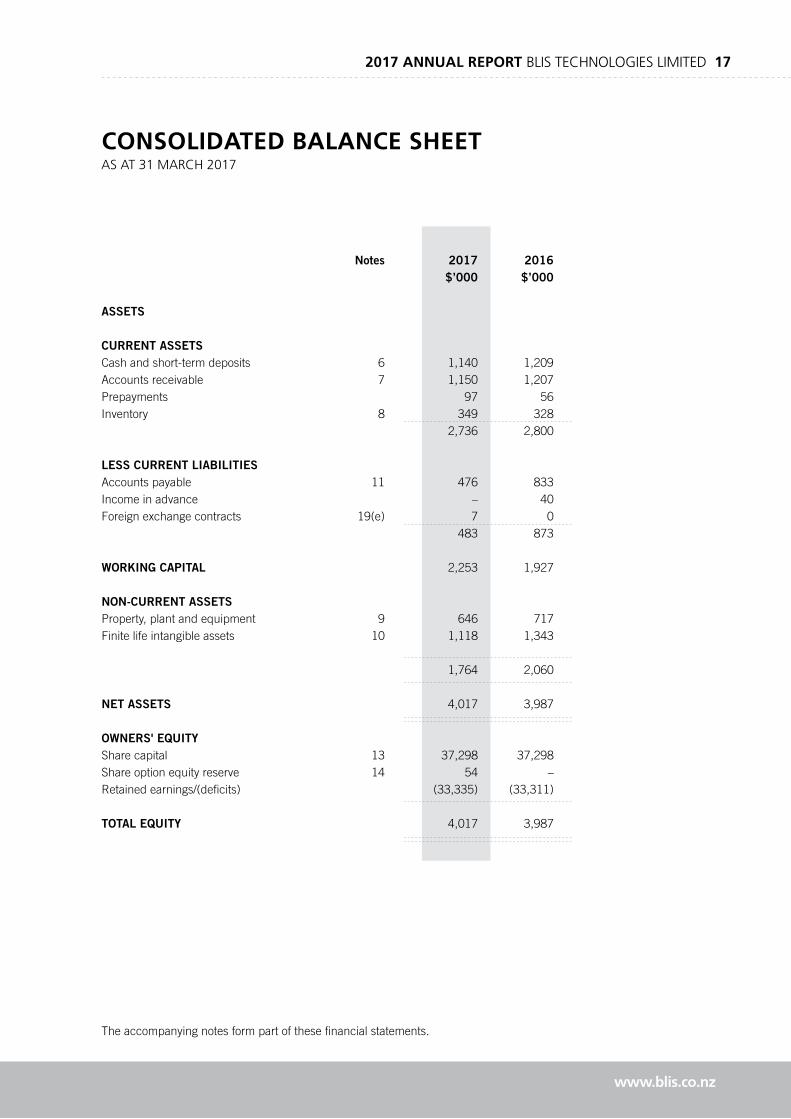
Notes 2017 2016 $’000 $’000 ASSETS
CURRENT ASSETS Cash and short-term deposits 6 1,140 1,209Accounts receivable 7 1,150 1,207Prepayments 97 56Inventory 8 349 328 2,736 2,800
LESS CURRENT LIABILITIESAccounts payable 11 476 833Income in advance – 40Foreign exchange contracts 19(e) 7 0 483 873
WORKING CAPITAL 2,253 1,927
NON-CURRENT ASSETSProperty, plant and equipment 9 646 717Finite life intangible assets 10 1,118 1,343
1,764 2,060
NET ASSETS 4,017 3,987
OWNERS' EQUITYShare capital 13 37,298 37,298Share option equity reserve 14 54 –Retained earnings/(deficits) (33,335) (33,311)
TOTAL EQUITY 4,017 3,987
18 BLIS TECHNOLOGIES LIMITED 2017 ANNUAL REPORT
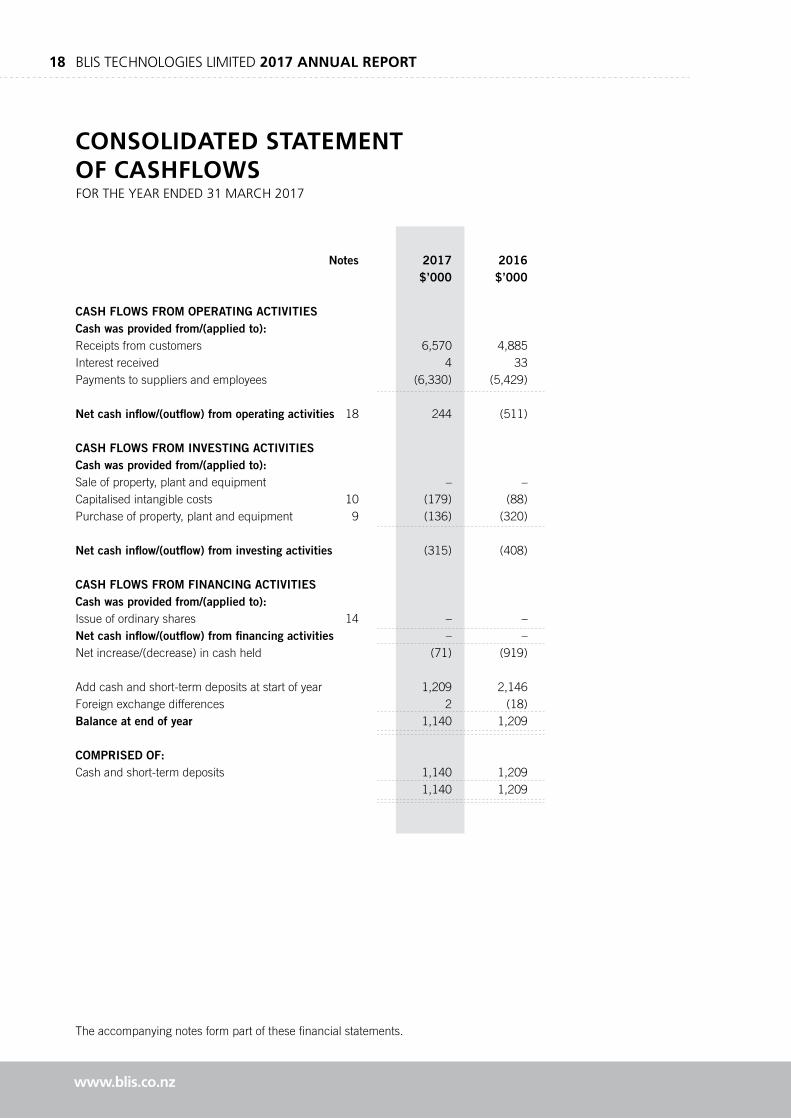
Notes 2017 2016 $’000 $’000 CASH FLOWS FROM OPERATING ACTIVITIESCash was provided from/(applied to):Receipts from customers 6,570 4,885Interest received 4 33Payments to suppliers and employees (6,330) (5,429)
Net cash inflow/(outflow) from operating activities 18 244 (511)
CASH FLOWS FROM INVESTING ACTIVITIES Cash was provided from/(applied to):Sale of property, plant and equipment – –Capitalised intangible costs 10 (179) (88)Purchase of property, plant and equipment 9 (136) (320)
Net cash inflow/(outflow) from investing activities (315) (408)
CASH FLOWS FROM FINANCING ACTIVITIES Cash was provided from/(applied to):Issue of ordinary shares 14 – –Net cash inflow/(outflow) from financing activities – – Net increase/(decrease) in cash held (71) (919)
Add cash and short-term deposits at start of year 1,209 2,146Foreign exchange differences 2 (18) Balance at end of year 1,140 1,209
COMPRISED OF:Cash and short-term deposits 1,140 1,209 1,140 1,209
www.blis.co.nz
The accompanying notes form part of these financial statements.
CONSOLIDATED STATEMENTOF CASHFLOWSFOR THE YEAR ENDED 31 MARCH 2017

2017 ANNUAL REPORT BLIS TECHNOLOGIES LIMITED 19
www.blis.co.nz
NOTES TO THE CONSOLIDATED FINANCIAL STATEMENTSFOR THE YEAR ENDED 31 MARCH 2017
1. BASIS OF REPORTING
Reporting Entity
Blis Technologies Limited (the “Company”) is a profit-oriented entity incorporated and domiciled in New Zealand and is registered under the Companies Act 1993. The principal activity of the Company is developing healthcare products based on strains of bacteria that produce Bacteriocin activity.
The financial statements represented are those for the Company together with Blis Functional Foods Limited (together referred to as the "Group").
The Company is a FMC Reporting Entity under the Financial Markets Conduct Act 2013 and the Financial Reporting Act 2013 and its financial statements comply with these Acts. The Company is listed on the NZX Main Board.
The Financial Statements were approved by the Board of Directors on 29th May 2017.
Statement of Compliance
The financial statements have been prepared in accordance with Generally Accepted Accounting Practice in New Zealand (“NZ GAAP”). They comply with the New Zealand Equivalents to International Financial Reporting Standards (“NZ IFRS”) and other applicable financial reporting standards as appropriate for profit-oriented entities. The financial statements comply with International Financial Reporting Standards (“IFRS”).
The Group is a Tier 1 for profit entity in terms of the External Reporting Board Standard A1: Accounting Standard Framework (For Profit Entities Update).
Basis of Preparation
The financial statements have been prepared on the basis of historical cost except for derivative financial instruments that are measured at fair value at the end of each reporting period as explained in the relevant accounting policies.
Historical cost is based on the fair values of the consideration given in exchange for assets.
Accounting policies are selected and applied in a manner which ensures that the resulting financial information satisfies the concepts of relevance and reliability, thereby ensuring that the substance of the underlying transactions or other events is reported.
The financial statements are presented in thousands of New Zealand dollars. New Zealand dollars is the Parents' functional currency.
Critical Judgements in Applying Accounting Policies
In the application of NZ IFRS, the Directors are required to make judgements, estimates and assumptions about carrying values of assets and liabilities that are not readily apparent from other sources. The estimates and associated assumptions are based on historical experience and various other factors that are believed to be reasonable under the circumstance, the results of which form the basis of making the judgements. Actual results may differ from these estimates. The estimates and underlying assumptions are reviewed on an ongoing basis. Revisions to accounting estimates are recognised in the period in which the estimate is revised if the revision affects only that period or in the period of the revision and future periods if the revision affects both current and future periods.
Key Sources of Estimation Uncertainty and Key Judgements
Judgements made by management in the application of NZ IFRS that have significant effects on the financial statements and estimates with a significant risk of material adjustments in the next year are disclosed, where applicable, in the relevant notes to the financial statements.
Key Sources of Estimation Uncertainty and key judgements include:
• If the product groupings to which the development expenditure relate are not economically viable in the future the development expenditure asset could be overstated.
• The Group determines whether finite life intangibles are impaired at least on an annual basis. Where there is an indication of impairment then an estimation of the recoverable amount of the finite life intangible assets is required.

20 BLIS TECHNOLOGIES LIMITED 2017 ANNUAL REPORT
Determining the recoverable amounts of intangible assets requires judgement in relation to the effects of uncertain future events at balance date. Assumptions are required with respect to future cash flows and discount rates used. Refer Note 10 for sensitivities and assumptions used.
• Tax losses – The recognition of a deferred tax asset arising from current and prior year tax losses is dependent on generating future taxable profits. Despite the improvement in the financial result compared to the previous period, no deferred tax asset has been recognised as at 31 March 2017 as a result of the fact the Group made a loss for the year. The uncertainty relating to the Group’s ability to utilise tax losses is explained in Note 3.
• The Directors have considered the validity of the going concern assumption. Refer to “Going Concern” at the end of Note 1 for judgements relating to this assessment.
• During the year, the Company entered a scheme covered by NZ IFRS 2 Share Based Payments. The application of the accounting standard involves judgement in respect of the nature of the arrangement and complexity in valuation judgements. Refer to Note 14 for further information.
• The Board has determined it is inappropriate to capitalise any further development costs on products which are now in commercial production as the Group focus moves further towards in-market support of its proprietary probiotic strains.
Significant Accounting Policies
The principal accounting policies applied in the preparation and presentation of the financial statements are set out below or in the notes with the item to which they relate, where policies are specific to certain transactions or balances.
These policies have been consistently applied unless otherwise stated.
Basis of Consolidation
The Group financial statements incorporate the financial statements of the Company and all entities controlled by the Company (its subsidiaries) that comprise the Group, being Blis Technologies Limited (the Parent entity) and its subsidiary Blis Functional Foods Limited. Control is obtained when the Company has power over the investee, is exposed to or has rights to variable returns from its investment, and has the ability to use its power to affect returns. Consistent accounting policies are employed in the preparation and presentation of the Group financial statements.
The results of subsidiaries acquired or disposed of during the year are included in the Group Income Statement from the effective date of acquisition or up to the effective date of disposal, as appropriate.
Where necessary, adjustments are made to the financial statements of subsidiaries to bring their accounting policies into line with those used by the Group.
All intra-group transactions, balances, income and expenses are eliminated in full on consolidation.
Foreign Exchange
In the course of normal trading activities, the Group undertakes transactions denominated in foreign currencies, hence exposures to exchange rate fluctuations arise. Accounts receivable, accounts payable, the Euro-denominated bank account and the United States Dollar (USD)-denominated bank account balances are translated at the exchange rates prevailing at the end of each reporting period as sourced from the Reserve Bank of New Zealand. Exchange differences are recognised in the income statement in the period in which they occur.
Goods and Services Tax (GST)
All items in the balance sheet are stated exclusive of GST, with the exception of receivables and payables, which include GST. All items in the income statement are stated exclusive of GST.
The GST component of cash flows arising from investing and financing activities which is recoverable from, or payable to, the taxation authority is classified as operating cash flows.
New Financial Reporting Standards Effective in the Reporting Period
The accounting policies adopted are consistent with those of the previous financial year. The Group has applied the Disclosure Initiative (Amendments to NZ IAS 1) which became effective for the first time in the current year. As a result, a number of notes have been re-ordered and relevant policies included within specific notes. All other mandatory new or amended accounting standards were adopted in the current year. None had a material impact on these financial statements.
New NZ IFRS Standards and Interpretations Issued, but not yet adopted
At the date of authorisation of these financial statements, certain new standards and interpretations to existing standards have been published but are not yet effective, and have not been adopted early by the Group.
www.blis.co.nz

2017 ANNUAL REPORT BLIS TECHNOLOGIES LIMITED 21
Management anticipates that all pronouncements will be adopted in the first accounting period beginning on or after the effective date of the new standard. Information on new standards, amendments and interpretations that are expected to be relevant to the Group financial statements is provided below. Other new standards and interpretations issued but not yet effective, that are not expected to have a material impact on the Group’s financial statements have not been disclosed.
NZ IFRS 9 – Financial Instruments (effective date from 1 January 2018)
NZ IFRS 9 Financial Instruments replaces NZ IAS 39 Financial Instruments: Recognition and Measurement.
The new standard includes a new classification and measurement regime for financial instruments, amendments to hedge accounting and changes in determining and measuring impairment of financial assets.
Management has yet to fully assess the impact, if any, that this standard is likely to have on the financial statements of the Group.
NZ IFRS 15 – Revenue from Contracts with Customers (effective date from 1 January 2018)
The new standard establishes principles for reporting about the nature, amount, timing and uncertainty of revenue arising from an entity's contracts with customers. It prescribes when an entity will recognise revenue, how much revenue to recognise, and what disclosures to make about revenue.
The core principle of the Standard is to recognise revenue for the amount of consideration due to an entity in exchange for the goods and services provided to the customer. This is done by following a 5 step process:
Step 1: Identify the contract with the customer;
Step 2: Identify the performance obligations in the contract;
Step 3: Determine the transaction price;
Step 4: Allocate the transaction price to the performance obligations in the contract; and
Step 5: Recognise revenue when (or as) the entity satisfies a performance obligation by transferring control of an asset to a customer. This may be at a point in time (typically for goods), or over time (typically for services).
Based on the short-period of the average revenue contract entered into by the Group, the new standard is not expected to have a material effect on the timing of revenue recognition. Management has yet to fully assess the impact if any this standard is likely to have on the financial statements of the Group.
NZ IFRS 16 – Leases (effective for annual reporting periods beginning on or after 1 January 2019)
NZ IAS 16: Leases removes the distinction between operating and finance leases and requires a lessee to recognise all leases on balance sheet through:
• An asset representing its right to use the leased item for the lease term;
• A liability for its obligation to pay rentals.
NZ IFRS 16 contains guidance on identification, recognition, measurement, presentation, and disclosure of leases by lessees and lessors. It is our preliminary expectation there would be no material effect on the Income Statement, although management has yet to fully assess the impact this standard is likely to have on the financial statements of the Group.
Going Concern
The financial statements have been prepared based on an assumption of going concern.
The Group has recorded a net deficit of $24,582 (2016: deficit $816,293) for the year ended 31 March 2017.
The Directors believe the going concern assumption is valid, reaching such a conclusion after having regard to the circumstances which they consider reasonably likely to affect the Group during the period of one year from the date these financials statements are approved.
Specifically, the Group held cash reserves of $1,140,058 as at 31 March 2017 which is considered sufficient to meet its working capital requirements. The Company is investing in upgrading plant to a fully accredited “Good Manufacturing Practice” (GMP) status, regulatory approvals and new product launches as part of the Company’s growth strategy. Depending on progress, the Company may consider options to support its growth and may seek additional capital by way of a placement and/or share plan.
Based on management budgets and plans, the Group will be able to meet financial obligations for at least 12 months from the date of approval of the financial statements.
The Directors believe that there is no material uncertainty in respect of the Group ability to continue as a going concern for the period assessed above due to the level of its current cash holdings and ability to generate operating cash flows. Nevertheless, in the event it fails to achieve planned profitability the Group may not be able to continue as a going concern.
www.blis.co.nz

22 BLIS TECHNOLOGIES LIMITED 2017 ANNUAL REPORT
If the Group were unable to continue as a going concern, and pay debts as, and when, they become due and payable, adjustments to the carrying value of assets would have to be made to reflect the situation. In such circumstances, assets may need to be realised and liabilities extinguished, other than in the normal course of business and at amounts which could differ significantly from the amounts at which they are currently recorded in the balance sheet. This situation would likely impact, in particular, on the carrying value of plant and equipment and Intangible assets.
These financial statements do not include any adjustments relating to the classification and recoverability of recorded asset amounts or to the amounts and classification of liabilities that may be necessary should the Group be unable to continue as a going concern.
2. SURPLUS/(DEFICIT) FROM OPERATIONS
Policy
Sale of Goods
Revenue is measured at the fair value of the consideration received or receivable. Revenue from the sale of goods is recognised when the Group has transferred to the buyer the significant risks and rewards of ownership of the goods.
Grant Revenue
Grant revenue is recognised when the Group has met all of the requirements established by the grant. Grant revenue that is receivable as compensation for expenses or losses already incurred or for the purpose of giving immediate financial support to the entity with no future required costs are recognised as revenue of the period in which it becomes receivable.
Income in Advance
Revenue is recognised when all associated obligations have been met. Where income has been received but the associated obligations have not been met, for instance goods have not yet been provided, it will be recognised as Income in Advance on the balance sheet.
Foreign Exchange
In the course of normal trading activities, the Group undertakes transactions denominated in foreign currencies. Hence exposures to exchange rate fluctuations arise. Accounts receivable, accounts payable, the Euro-denominated bank account and the United States Dollar (USD)-denominated bank account balances are translated at the exchange rates prevailing at the end of each reporting period as sourced from the Reserve Bank of New Zealand. Exchange differences are recognised in the income statement in the period in which they occur.
Interest Revenue
Interest revenue is accrued on a time basis, by reference to the principal outstanding and the effective interest rate applicable, which is the rate that exactly discounts estimated future cash receipts through the expected life of the financial asset to that asset’s net carrying amount.
(a) Revenue 2017 2016
$’000 $’000
Revenue consists of the following items:
Sale of goods – domestic sales 970 1,128
Sale of goods – export sales 5,566 4,500
Grant revenue 7 0
6,543 5,628
www.blis.co.nz
2017 ANNUAL REPORT BLIS TECHNOLOGIES LIMITED 23
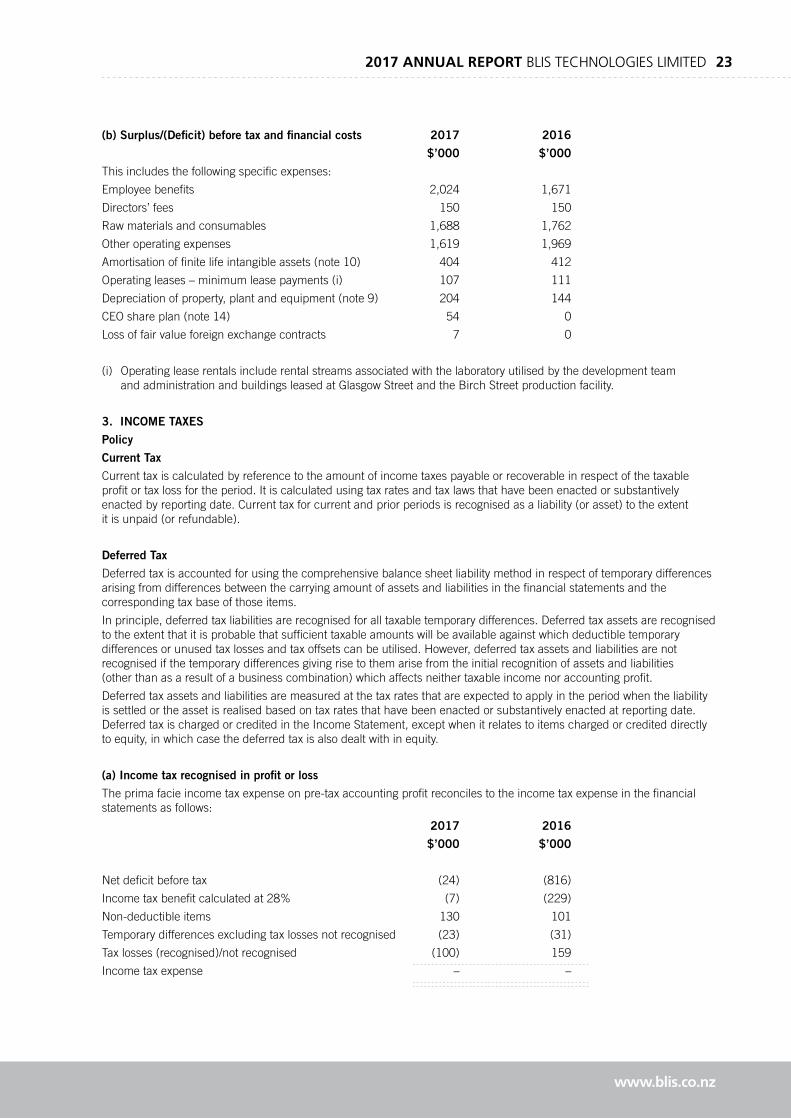
(b) Surplus/(Deficit) before tax and financial costs 2017 2016
$’000 $’000
This includes the following specific expenses:
Employee benefits 2,024 1,671
Directors’ fees 150 150
Raw materials and consumables 1,688 1,762
Other operating expenses 1,619 1,969
Amortisation of finite life intangible assets (note 10) 404 412
Operating leases – minimum lease payments (i) 107 111
Depreciation of property, plant and equipment (note 9) 204 144
CEO share plan (note 14) 54 0
Loss of fair value foreign exchange contracts 7 0
(i) Operating lease rentals include rental streams associated with the laboratory utilised by the development team and administration and buildings leased at Glasgow Street and the Birch Street production facility.
3. INCOME TAXES
Policy
Current Tax
Current tax is calculated by reference to the amount of income taxes payable or recoverable in respect of the taxable profit or tax loss for the period. It is calculated using tax rates and tax laws that have been enacted or substantively enacted by reporting date. Current tax for current and prior periods is recognised as a liability (or asset) to the extent it is unpaid (or refundable).
Deferred Tax
Deferred tax is accounted for using the comprehensive balance sheet liability method in respect of temporary differences arising from differences between the carrying amount of assets and liabilities in the financial statements and the corresponding tax base of those items.
In principle, deferred tax liabilities are recognised for all taxable temporary differences. Deferred tax assets are recognised to the extent that it is probable that sufficient taxable amounts will be available against which deductible temporary differences or unused tax losses and tax offsets can be utilised. However, deferred tax assets and liabilities are not recognised if the temporary differences giving rise to them arise from the initial recognition of assets and liabilities (other than as a result of a business combination) which affects neither taxable income nor accounting profit.
Deferred tax assets and liabilities are measured at the tax rates that are expected to apply in the period when the liability is settled or the asset is realised based on tax rates that have been enacted or substantively enacted at reporting date. Deferred tax is charged or credited in the Income Statement, except when it relates to items charged or credited directly to equity, in which case the deferred tax is also dealt with in equity.
(a) Income tax recognised in profit or loss
The prima facie income tax expense on pre-tax accounting profit reconciles to the income tax expense in the financial statements as follows:
2017 2016
$’000 $’000
Net deficit before tax (24) (816)
Income tax benefit calculated at 28% (7) (229)
Non-deductible items 130 101
Temporary differences excluding tax losses not recognised (23) (31)
Tax losses (recognised)/not recognised (100) 159
Income tax expense – –
www.blis.co.nz

24 BLIS TECHNOLOGIES LIMITED 2017 ANNUAL REPORT
(b) Income Tax Recognised Directly In Equity
There was no current or deferred tax charged/(credited) directly to equity during the period.
(c) Deferred tax balances
The Group has unrecognised deferred income tax assets in relation to temporary differences of $395,865 (2016: $419,189). Furthermore, the Group has unrecognised deferred income tax assets of up to $4,730,384 (2016: $4,830,401) in respect of tax losses amounting to up to $16,894,230 (2016: $17,251,433) that may be able to be carried forward and offset against future taxable income (subject to meeting the requirements of the Income Tax Act 2007). The availability of these tax losses to apply against future income is contingent upon maintaining a minimum level of shareholder continuity and is therefore highly uncertain.
4. REMUNERATION OF AUDITORS
2017 2016
$’000 $’000
Audit of the financial statements 43 35
Other services – 16
43 51
The auditor of Blis Technologies Limited is Deloitte.
Other services include a cyber systems review.
5. KEY MANAGEMENT PERSONNEL COMPENSATION
The compensation of the Chief Executive Officer and other senior management, being the key management personnel of the entity, is set out below:
2017 2016
$’000 $’000
Short-term employee and contractor benefits 1,162 1,082
Share-based option 54 0
1216 1,082
6. CASH AND SHORT-TERM DEPOSITS
Policy
Financial Instruments
Financial assets and financial liabilities are recognised on the Group’s Balance Sheet when the Group becomes a party to the contractual provisions of the instrument.
Cash and Short-Term Deposits
Cash and short-term deposits comprise cash on hand, demand deposits, and other short-term highly liquid investments that are readily convertible to a known amount of cash and are subject to an insignificant risk of changes in value.
2017 2016
$’000 $’000
Cash 1,065 1,134
Short-term deposits (i) 75 75
1,140 1,209
(i) Short-term deposits
Short-term deposits include $75,000 held in a bank account as a bond for the NZX. These funds are held as security and restricted. The carrying amount of cash and cash equivalents approximates their fair value.
www.blis.co.nz
2017 ANNUAL REPORT BLIS TECHNOLOGIES LIMITED 25
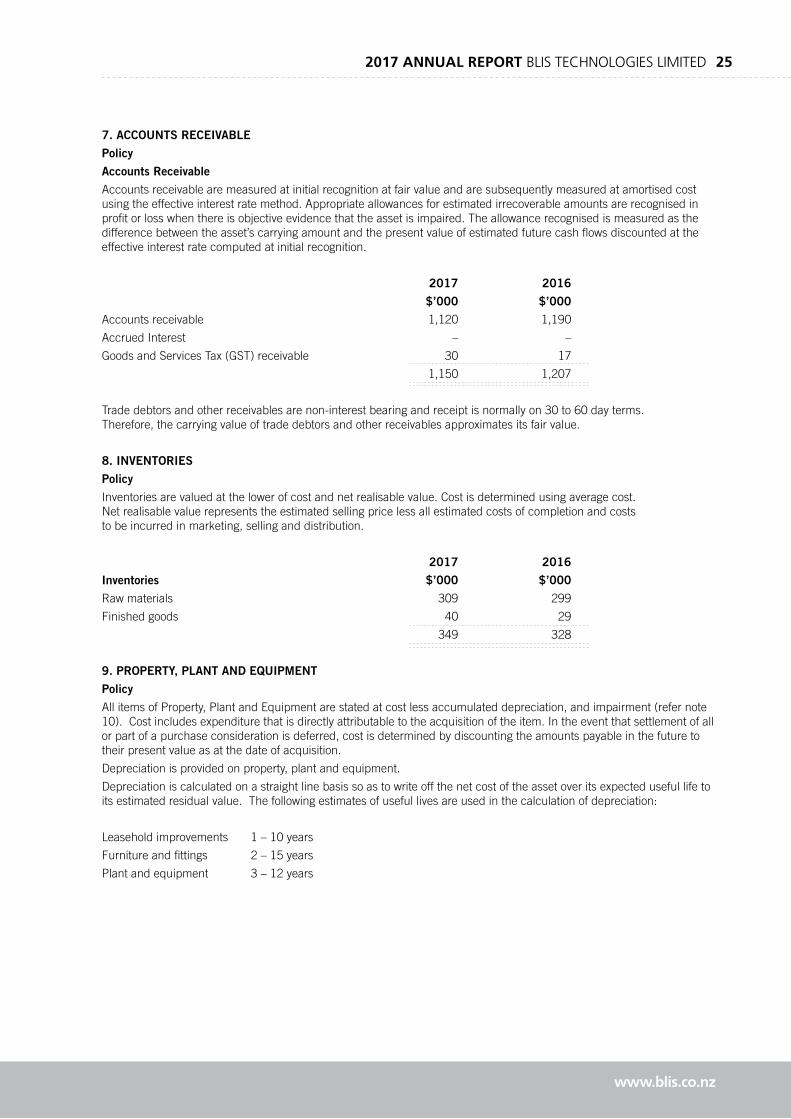
7. ACCOUNTS RECEIVABLE
Policy
Accounts Receivable
Accounts receivable are measured at initial recognition at fair value and are subsequently measured at amortised cost using the effective interest rate method. Appropriate allowances for estimated irrecoverable amounts are recognised in profit or loss when there is objective evidence that the asset is impaired. The allowance recognised is measured as the difference between the asset’s carrying amount and the present value of estimated future cash flows discounted at the effective interest rate computed at initial recognition.
2017 2016
$’000 $’000
Accounts receivable 1,120 1,190
Accrued Interest – –
Goods and Services Tax (GST) receivable 30 17
1,150 1,207
Trade debtors and other receivables are non-interest bearing and receipt is normally on 30 to 60 day terms. Therefore, the carrying value of trade debtors and other receivables approximates its fair value.
8. INVENTORIES
Policy
Inventories are valued at the lower of cost and net realisable value. Cost is determined using average cost. Net realisable value represents the estimated selling price less all estimated costs of completion and costs to be incurred in marketing, selling and distribution.
2017 2016
Inventories $’000 $’000
Raw materials 309 299
Finished goods 40 29
349 328
9. PROPERTY, PLANT AND EQUIPMENT
Policy
All items of Property, Plant and Equipment are stated at cost less accumulated depreciation, and impairment (refer note 10). Cost includes expenditure that is directly attributable to the acquisition of the item. In the event that settlement of all or part of a purchase consideration is deferred, cost is determined by discounting the amounts payable in the future to their present value as at the date of acquisition.
Depreciation is provided on property, plant and equipment.
Depreciation is calculated on a straight line basis so as to write off the net cost of the asset over its expected useful life to its estimated residual value. The following estimates of useful lives are used in the calculation of depreciation:
Leasehold improvements 1 – 10 years
Furniture and fittings 2 – 15 years
Plant and equipment 3 – 12 years
www.blis.co.nz
26 BLIS TECHNOLOGIES LIMITED 2017 ANNUAL REPORT
Property, Plant and Equipment
2017 Cost Additions/ Disposals Cost Accumulated Depreciation Accumulated Transfer Accoumulated Book value 1 April Transfers 31 March depreciation expense depreciation depreciation 31 March 2016 2017 1 April 2016 reversed on 31 March 2017 disposal 2017
$’000 $’000 $’000 $’000 $’000 $’000 $’000 $000 $’000 $’000
Leasehold improvements 318 24 – 342 (178) (66) – – (244) 98
Furniture and fittings 84 8 (2) 90 (67) (3) – – (70) 20
Plant and equipment 1,166 104 – 1,270 (606) (135) – – (742) 528
Total property, plant and equipment 1,568 136 (2) 1,702 (851) (204) – – (1,056) 646
2016 Cost Additions/ Disposals Cost Accumulated Depreciation Accumulated Transfer Accoumulated Book value 1 April Transfers 31 March depreciation expense depreciation depreciation 31 March 2015 2016 1 April 2015 reversed on 31 March 2016 disposal 2016
$’000 $’000 $’000 $’000 $’000 $’000 $’000 $000 $’000 $’000
Leasehold improvements 248 85 15 318 (141) (37) – – (178) 140
Furniture and fittings 70 14 – 84 (66) (1) – – (67) 17
Plant and equipment 1,048 221 103 1,166 (543) (106) 43 – (606) 560
Total property, plant and equipment 1,366 320 118 1,568 (750) (144) 43 – (851) 717
10. FINITE LIFE INTANGIBLE ASSETS
Policy
Intangible assets acquired separately are reported at cost less accumulated amortisation and accumulated impairment losses. Amortisations are charged on a straight-line basis over their estimated useful lives. The estimated useful lives, residual values and amortisation method are reviewed at the end of each reporting period, with the effect of any changes in estimate being accounted for on a prospective basis.
Intellectual Property
The cost of intellectual property is written-off until such time as it becomes clear that future economic benefits attributable to that expenditure will flow to the Group and there is sufficient evidence to support the probability of the expenditure generating sufficient future economic benefits.
Intellectual property including patents, trademarks and licenses are considered finite life intangibles and are recorded at cost less accumulated amortisation and impairment. Amortisation is charged on a straight line basis over the estimated useful life of the intangible asset being 8 to 20 years. The estimated useful life and amortisation method is reviewed at the end of each annual reporting period.
Website
Following the initial investment, which is recorded at cost and amortised over three years, the cost of further website development is expensed as incurred. During the financial year, the Group had undertaken a substantial redevelopment of its website. The total amount spent externally to 31 March 2017 was $114,385 which has been expensed.
Internally-generated Intangible Assets – Capitalised Product Development Expenditure
Expenditure on research activities is recognised as an expense in the period in which it is incurred.
An internally-generated intangible asset arising from development (or from the development phase of an internal project) is recognised if, and only if, all of the following have been demonstrated:
• The technical feasibility of completing the intangible asset so that it will be available for use or sale;
• The intention to complete the intangible asset and use or sell it;
• The ability to use or sell the intangible asset;
• How the intangible asset will generate probable future economic benefits
• The availability of adequate technical, financial and other resources to complete the development and to use or sell the intangible asset; and
• The ability to measure reliably the expenditure attributable to the intangible asset during its development.
www.blis.co.nz
2017 ANNUAL REPORT BLIS TECHNOLOGIES LIMITED 27
The amount initially recognised for internally-generated intangible assets is the sum of the expenditure incurred from the date when the intangible asset first meets the recognition criteria listed above. Where no internally-generated intangible asset can be recognised, development expenditure is charged to profit or loss in the period in which it is incurred.
Subsequent to initial recognition, internally-generated intangible assets are reported at cost less accumulated amortisation and accumulated impairment losses, on the same basis as intangible assets acquired separately. The useful life of internally-generated intangible assets is eight years.
Impairment of Assets
At each balance sheet date, the Group reviews the carrying amounts of its assets to determine whether there is any indication that those assets have suffered an impairment loss. If any such indication exists, the recoverable amount of the asset is estimated in order to determine the extent of the impairment loss (if any). Where the asset does not generate cash flows that are independent from other assets, the Group estimates the recoverable amount of the cash-generating unit to which the asset belongs.
The recoverable amount is the higher of fair value less costs to sell and value in use. In assessing value in use, the estimated future cash flows are discounted to their present value using a pre-tax discount rate that reflects current market assessments of the time value of money and the risks specific to the asset for which the estimates of future cash flows have not been adjusted.
If the recoverable amount of an asset (cash-generating unit) is estimated to be less than its carrying amount, the carrying amount of the asset (cash-generating unit) is reduced to its recoverable amount. An impairment loss is recognised in profit or loss immediately.
Where an impairment loss subsequently reverses, the carrying amount of the asset (cash-generating unit) is increased to the revised estimate of its recoverable amount, but only to the extent that the increased carrying amount does not exceed the carrying amount that would have been determined had no impairment loss been recognised for the asset (cash-generating unit) in prior years.
The group has determined that it is inappropriate to capitalise any further development costs on products that are now in commercial production or website development costs.
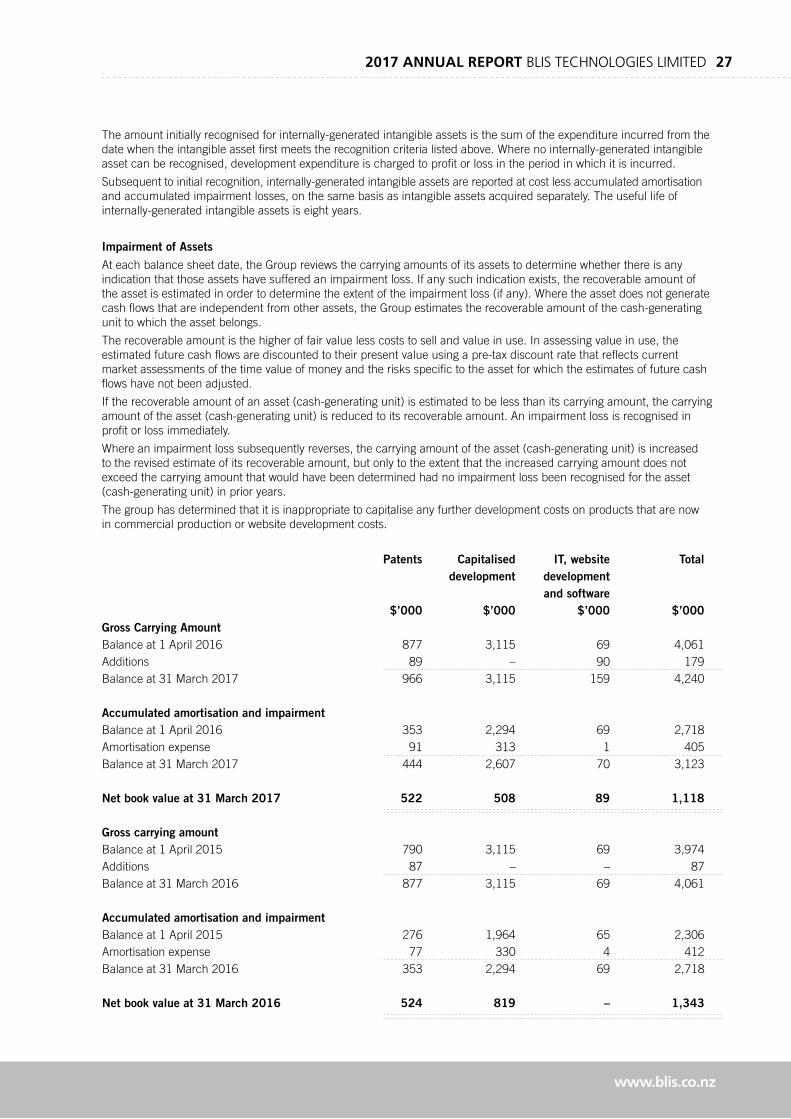
Patents Capitalised IT, website Total development development and software $’000 $’000 $’000 $’000Gross Carrying AmountBalance at 1 April 2016 877 3,115 69 4,061Additions 89 – 90 179Balance at 31 March 2017 966 3,115 159 4,240 Accumulated amortisation and impairment Balance at 1 April 2016 353 2,294 69 2,718Amortisation expense 91 313 1 405Balance at 31 March 2017 444 2,607 70 3,123 Net book value at 31 March 2017 522 508 89 1,118 Gross carrying amountBalance at 1 April 2015 790 3,115 69 3,974Additions 87 – – 87Balance at 31 March 2016 877 3,115 69 4,061 Accumulated amortisation and impairment Balance at 1 April 2015 276 1,964 65 2,306Amortisation expense 77 330 4 412Balance at 31 March 2016 353 2,294 69 2,718 Net book value at 31 March 2016 524 819 – 1,343
www.blis.co.nz

28 BLIS TECHNOLOGIES LIMITED 2017 ANNUAL REPORT
No impairment losses have been recorded in the current year (2016: nil).
Capitalised product development expenditure relates to costs incurred in relation to the development of ingredient, intermediate and food products containing BLIS, and the associated regulatory approval processes.
For the purposes of preparing these accounts, the Board reviewed the intangible assets and have determined that there is no impairment of any intangible assets.
The calculation of the recoverable amounts has been determined based on a value in use calculation that uses cash flow projections based on the financial forecasts prepared by management covering a five year period.
The recoverable amount calculations are most sensitive to assumptions regarding growth rate, contribution margins and the required rate of return. Annual sales growth rate of between 21%-30% (2016: 20%-49%), and contribution margins pre-personnel costs of 67%-70% (2016: 72%-74%) and a post-tax discount rate of 12.5% (2016: 15%) have been applied in these projections. Cash flows beyond the five year period have been extrapolated using a steady 2.5% (2016: 0%) growth rate. The recoverable amount is very sensitive to each of these assumptions. If sales growth and/or contribution margins fall short of projections, it is likely that the recoverable amount of the capitalised product development expenditure will be less than the carrying value
11. ACCOUNTS PAYABLE
Policy
Accounts Payable
Accounts payable are initially measured at fair value and subsequently measured at amortised cost using the effective interest rate method
Employee Benefits
Provision is made for benefits accruing to employees in respects of wages and salaries, annual leave, and sick leave when it is probable that settlement will be required and they are capable of being measured reliably.
Provisions made in respect of employee benefits expected to be settled within 12 months, are measured at their nominal values using the remuneration rate expected to apply at the time of settlement.
Provisions made in respect of employee benefits which are not expected to be settled within 12 months are measured at the present value of the estimated future cash outflows to be made by the Group in respect of services provided by employees up to reporting date
2017 2016
$’000 $’000
Accounts payable 316 712
Employee entitlements 160 121
476 833
12. INVESTMENT IN SUBSIDIARY
Subsidiary Percentage held Percentage held Balance date Principal activity
2017 2016
Blis Functional Foods Limited 100% 100% 31 March Non-trading
13. SHARE CAPITAL 2017 2017 2016 2016 No. of shares $’000 No. of shares $’000
Balance at the beginning of the year (fully paid) 1,102,153,565 37,298 1,102,153,565 37,298Shares issued pursuant to CEO Share plan 5,500,000 – – –
Balance at the end of the year 1,107,653,565 37,298 1,102,153,565 37,298
All 1,107,653,565 ordinary shares are issued and carry equal voting rights. All issued shares participate equally in any dividend distribution or any surplus on winding up of the Company.
On 02 June 2016, 5,500,000 shares were issued to Mr Brian Watson, Chief Executive of the Company. The shares were issued at a price of $0.0299 per share. Details of this transaction is shown in note 14.
www.blis.co.nz

2017 ANNUAL REPORT BLIS TECHNOLOGIES LIMITED 29
Policy
Equity Instruments
Equity instruments issued by the Group are recorded at the proceeds received other than in respect to the CEO share plan refer note 14.
2017 2016
Cents per share Cents per share
Basic earnings (deficit) per share (0.00) (0.07)
The earnings and weighted average number of ordinary issued shares used in the calculation of basic earnings per share are as follows:
$’000 $’000
Net earnings (deficit) (24) (816)
No. No.
Weighted average number of ordinary shares for the purpose of basic earnings per share 1,106,704,250 1,102,153,565
Cents per share Cents per share
Diluted earnings (deficit) per share (0.00) (0.07)
The earnings and weighted average number of issued ordinary shares used in the calculation of diluted earnings per share are as follows:
$’000 $’000
Net earnings (deficit) (24) (816)
No. No.
Weighted average number of ordinary shares for the purpose of diluted earnings per share 1,106,704,250 1,102,153,565
Cents per share Cents per share
Net tangible assets/(liabilities) per share at year end 0.26 0.24
The net tangible assets and number of issued ordinary shares used in the calculation of net tangible assets per share are as follows:
$’000 $’000
Net tangible assets 2,899 2,644
No. No.
Number of ordinary shares held at 31 March 2017 1,107,653,565 1,102,153,565
Net tangible assets
As at 31 March 2017 the net tangible asset per share was 0.26 cents (2016: 0.24 cents).
$’000 $’000
Total assets 4,500 4,860
Less intangible assets (1,118) (1,343)
Less total liabilities (483) (873)
Net tangible assets 2,899 2,644
Number of shares outstanding (‘000) 1,107,654 1,102,153
Net tangible assets per share (cents) 0.26 0.24
www.blis.co.nz
30 BLIS TECHNOLOGIES LIMITED 2017 ANNUAL REPORT
14. RELATED PARTY TRANSACTIONS
During the period the following transactions were entered into with related parties:
Mr A P Offen provided Executive Director services to the Group through Edinburgh Securities Ltd during the year. Payments for these services amounted to $23,728 (2016: $208,434). There was $0 owing at 31 March 2017 (2016: $25,000).
Mr P F Fennessy provided professional consulting services to the Group through AbacusBio Ltd during the year. Payments for these services amounted to $31,200 (2016: $50,875). There was $5,000 owing at 31 March 2017 (2016: $7,763).
Mr T J Mepham, the Chief Financial Officer of the Company, provided professional consulting services to the Group through Rautaki Advisory during the year. Payments for these services amounted to $15,802 (2016: $69,107).
During the year, BLIS products were sold to the following related parties:
Associated Entity Director 2017 2016
P F Fennessy P F Fennessy $78 $779
Edinburgh Securities Ltd A P Offen $609 $117
B H Wallace B H Wallace $824 0
A J McKenzie A J McKenzie $126 0
G S Boyd G S Boyd $49 0
V M Aris V M Aris $58 0
P F Fennessy owed $0 (2016: $134) as at 31 March 2017 for BLIS products.
Product samples are also made available to the staff and Board members for personal use.
CEO share option and Issue of Shares to the CEO
The Company entered into a Subscription Agreement and issued 5,500,000 new ordinary shares to Brian Watson, the Chief Executive Officer (CEO) on 2 June 2016. The shares were issued for cash consideration of 2.99 cents per share being an aggregate $164,500, which was satisfied by way of a contemporaneous interest free loan provided by the Company to the CEO for an aggregate amount equivalent to the subscription price for the shares.
The loan is secured by a lien on the issued shares and repayable in equal annual instalments commencing on the 1st of December 2017 with the final instalment due on 1 December 2021.
The shares were issued at 90% of the volume weighted average share price for the 5 trading days prior to 1 June 2016. The issue price was considered by the Directors of the Company to be equivalent to the price that the tranche of shares would have been issued to an independent third party at the time of issue.
The Subscription Agreement provides security against the loan through a charge on the shares. For accounting treatment only, the Directors have accepted that the appropriate approach consistent with the relevant accounting standard is to treat the entire arrangement as a share option.
Accordingly, the Company took independent professional advice and received an opinion as to the quantum of the expense to bring to bear. The Company was advised that using the Black Scholes option pricing model for the CEO Share Plan at an implied volatility of 32% and referenced to the prevailing share price of 3.32 cents on 2 June 2016 yielded an aggregate option value of $54,517 This amount has been treated as an expense as required under IFRS2.
As a result of the charge to the Income Statement, a CEO Share Option Reserve has been created in the Balance Sheet. Accordingly there is no effect on total equity, in treating the option value as an expense. Upon receipt of each of the scheduled loan repayments the notional option value associated with each tranche will be transferred from the CEO Share Plan Reserve to Retained Earnings and the amount of each loan repayment will be recorded to equity to represent the consideration received for each tranche of shares issued to the CEO.
In the interim accounts to 30 September 2016 the Company did not account for any benefit received by the CEO other than a provision for fringe benefit tax on the notional benefit of the interest free loan. The six month accounts to 30 September 2016 accounted for the transaction as a loan receivable from the CEO and an increase to share capital. This treatment was reversed at 31 March 2017.
Fair Value of Share Options
The fair value of the share options granted during the financial year is $54,517 (2016 Nil). Options were priced using the Black-Scholes option pricing model. Expected volatility is based on the historical share price over the past 5 years, consistent with the options lives, factoring in a step change in the 9 months prior to grant date.
No allowance for early exercise has been incorporated into the fair value calculation as it is assumed that the CEO would exercise the options at the latest exercise date.
There are no market or service conditions.
www.blis.co.nz
2017 ANNUAL REPORT BLIS TECHNOLOGIES LIMITED 31
The fair value model is most susceptible to changes in the expected volatility. Had an expected volatility of 45% been utilised, the fair value of the share options would have been $69,000.
Inputs to the model
Options series 1 2 3 4 5
Grant date weighted average share price $0.0322 $0.0322 $0.0322 $0.0322 $0.0322
Exercise price $0.0299 $0.0299 $0.0299 $0.0299 $0.0299
Expected volatility 31.93% 31.93% 31.93% 31.93% 31.93%
Option life 1.5 years 2.5 years 3.5 years 4.5 years 5.5 years
Dividend yield 0% 0% 0% 0% 0%
Risk-free interest rate 2.07% 2.01% 2.00% 2.06% 2.02%
Final exercise date 1/12/17 1/12/18 1/12/19 1/12/20 1/12/21
15. COMMITMENTS FOR EXPENDITURE
(a) Capital Expenditure Commitments
As at 31 March 2017 there is $23,000 of capital expenditure commitments (2016: $20,000).
(b) Lease Commitments
Non-cancellable operating lease commitments are as follows:
2017 2016
$’000 $’000
Less than 1 year 83 85
1 - 5 years 328 331
Longer than 5 years 208 286
16. CONTINGENT ASSETS AND CONTINGENT LIABILITIES
There were no material contingent assets or contingent liabilities at 31 March 2017 (2016: $Nil).
17. SEGMENTAL REPORTING
17.1 Operating Segments
The Group is internally reported as a single operating segment to the chief operating decision-maker.
17.2 Revenue from major products and services
2017 2016
$’000 $’000
The Group’s revenues from its major products and services were as follows:
BLIS products 6,325 5,378
Non-core business 222 283
Total revenue 6,547 5,661
Non-core revenues mainly include interest received and contract manufacturing revenue of non BLIS branded products.
17.3 Information about geographical areas
The Group operates in four principal geographical areas; Australasia, Asia (including China), Europe and North America.
The Group’s revenue from external customers and information about its assets by geographical location (of the customer) are detailed on the following page.
www.blis.co.nz
32 BLIS TECHNOLOGIES LIMITED 2017 ANNUAL REPORT
17.3 Information about geographical areas – continued
2017 2016 2017 2016
Trading Revenue $’000 $’000 $’000 $’000
Revenue from external customers Non-current assets
Australasia 1,092 1,164 1,764 2,060
Asia, including China 1,322 753 – –
Europe 2,316 2,117 – –
North America 1,682 1,470 – –
Rest of the World 124 124 – –
Total trading revenue 6,536 5,628 1,764 2,060
Interest received 4 33 – –
Grant revenue 7
Total revenue 6,547 5,661 1,764 2,060
Included in revenue are revenues of $2,285,423, $1,670,629 and $1,152,604 (2016: $2,080,894, $1,470,281 and $674,969) which arose from sales to the Group’s three largest customers.
18. RECONCILIATION OF NET DEFICIT WITH CASH FLOWS FROM OPERATING ACTIVITIES
Policy
For the purpose of the cash flow statement, cash and cash equivalents includes cash on hand and in banks and investments in money market instruments net of outstanding bank overdrafts.
The cash flow statement is prepared exclusive of GST, which is consistent with the method used in the income statement.
Definition of terms used in the cash flow statement:
Operating activities include all transactions and other events that are not investing or financing activities.
Investing activities are those activities relating to the acquisition and disposal of current and non-current investments and any other non-current assets.
Financing activities are those activities relating to changes in the equity and debt capital structure of the Group and those activities relating to the cost of servicing the Group’s equity.
2017 2016
$’000 $’000
Net surplus/(deficit) for the year (24) (816)
Adjustments for non-cash items:
Amortisation of capitalised product development costs 313 331
Amortisation of patents 91 77
Amortisation of website development 1 4
CEO share plan costs 54 0
Depreciation 204 145
Foreign exchange loss/(gain) (2) 18
Loss/(Gain) on fair value of foreign exchange contracts 7 0
Loss/(Gain) on disposal of fixed asset 2 75
646 (166)
Movements in working capital
Accounts receivable 57 (743)
Prepayments (41) 17
Inventories (21) (46)
Accounts payable and income in advance (397) 427
(402) (345)
Net cash inflow/(outflow) from operating activities 244 (511)
www.blis.co.nz

2017 ANNUAL REPORT BLIS TECHNOLOGIES LIMITED 33
19. FINANCIAL INSTRUMENTS
All of the Group’s financial assets are recognised as loans and receivables measured at amortised cost.
The Group does not have any financial assets recognised as held to maturity, designated at fair value or available for sale. Foreign exchange contract liabilities are measured at fair value, all of the Group’s other financial liabilities are measured at amortised cost.
(a) Financial Risk Management Objectives
Exposure to credit, interest rate, foreign currency and liquidity risks arises in the normal course of the Group’s business.
The Group does not enter into derivative financial instruments, for speculative purposes. The Group utilises forward cover on confirmed foreign currency transactions. Specific risk management objectives and policies are set out below.
(b) Capital Risk Management
The Group manages its capital to ensure that the Group will be able to continue as a going concern while maximising the return to stakeholders through the optimisation of debt and equity
The capital structure of the Group comprises issued capital and retained earnings as disclosed in the Statement of Changes in Equity.
The Group’s Board of Directors reviews the capital structure on a regular basis.
The Group is not subject to externally imposed capital requirements.
The Group’s overall strategy remains unchanged from FY 2016.
(c) Market Risk
Market risk is the potential for change in the value of financial instruments caused by a change in the value, volatility or relationship between market risks and prices. Market risk arises from the mismatch between assets and liabilities. The Group’s activities expose it primarily to market risk associated with changes in foreign currency rates and interest rates as set out below. These risks are measured using sensitivity analysis. The mechanisms for managing these risks are set out below. In the current year the Group has entered into foreign exchange contracts to manage its exposure to foreign currency transactions, there have been no other changes during the year to the Group’s exposure to such risks or the manner in which the risks are measured and managed.
(d) Interest Rate Risk
The Group is exposed to interest rate risk as from time to time it borrows funds at floating interest rates and also invests cash in short-term deposits at fixed interest rates. Fair value interest rate risk is the risk that the value of a financial instrument will fluctuate due to changes in market interest rates. Investments at fixed interest rates expose the Group to fair value interest rate risk. The Group does not hedge this risk. Cash flow interest rate risk is the risk that the cash flows from a financial instrument will fluctuate because of changes in market interest rates. Borrowings issued at variable interest rates expose the Group to cash flow interest rate risk. The Group does not hedge this risk.
(e) Foreign Exchange Risk
In the course of normal trading activities, the Group undertakes transactions denominated in foreign currencies; hence exposures to exchange rate fluctuations arise. The Group enters into foreign exchange contracts on certain sales in denominated foreign currencies to economically hedge the foreign exchange risk associated with the timing between the date of sale and receipt of payment. The Group has not adopted hedge accounting.
The carrying amount of the Group’s foreign currency denominated monetary assets are as follows:
2017 2016
$’000 $’000
Euro 117 565
United States Dollar 1,091 896
www.blis.co.nz
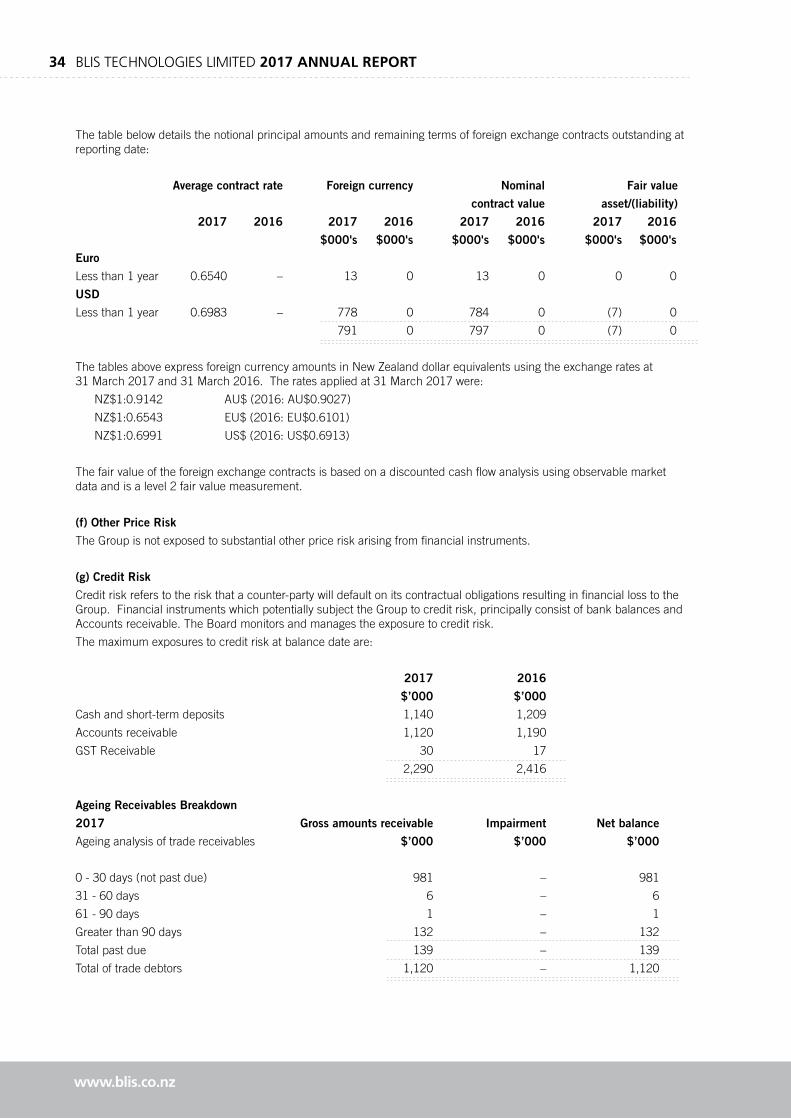
34 BLIS TECHNOLOGIES LIMITED 2017 ANNUAL REPORT
The table below details the notional principal amounts and remaining terms of foreign exchange contracts outstanding at reporting date:
Average contract rate Foreign currency Nominal Fair value
contract value asset/(liability)
2017 2016 2017 2016 2017 2016 2017 2016
$000's $000's $000's $000's $000's $000's
Euro
Less than 1 year 0.6540 – 13 0 13 0 0 0
USD
Less than 1 year 0.6983 – 778 0 784 0 (7) 0
791 0 797 0 (7) 0
The tables above express foreign currency amounts in New Zealand dollar equivalents using the exchange rates at 31 March 2017 and 31 March 2016. The rates applied at 31 March 2017 were:
NZ$1:0.9142 AU$ (2016: AU$0.9027)
NZ$1:0.6543 EU$ (2016: EU$0.6101)
NZ$1:0.6991 US$ (2016: US$0.6913)
The fair value of the foreign exchange contracts is based on a discounted cash flow analysis using observable market data and is a level 2 fair value measurement.
(f) Other Price Risk
The Group is not exposed to substantial other price risk arising from financial instruments.
(g) Credit Risk
Credit risk refers to the risk that a counter-party will default on its contractual obligations resulting in financial loss to the Group. Financial instruments which potentially subject the Group to credit risk, principally consist of bank balances and Accounts receivable. The Board monitors and manages the exposure to credit risk.
The maximum exposures to credit risk at balance date are:
2017 2016
$’000 $’000
Cash and short-term deposits 1,140 1,209
Accounts receivable 1,120 1,190
GST Receivable 30 17
2,290 2,416
Ageing Receivables Breakdown
2017 Gross amounts receivable Impairment Net balance
Ageing analysis of trade receivables $’000 $’000 $’000
0 - 30 days (not past due) 981 – 981
31 - 60 days 6 – 6
61 - 90 days 1 – 1
Greater than 90 days 132 – 132
Total past due 139 – 139
Total of trade debtors 1,120 – 1,120
www.blis.co.nz
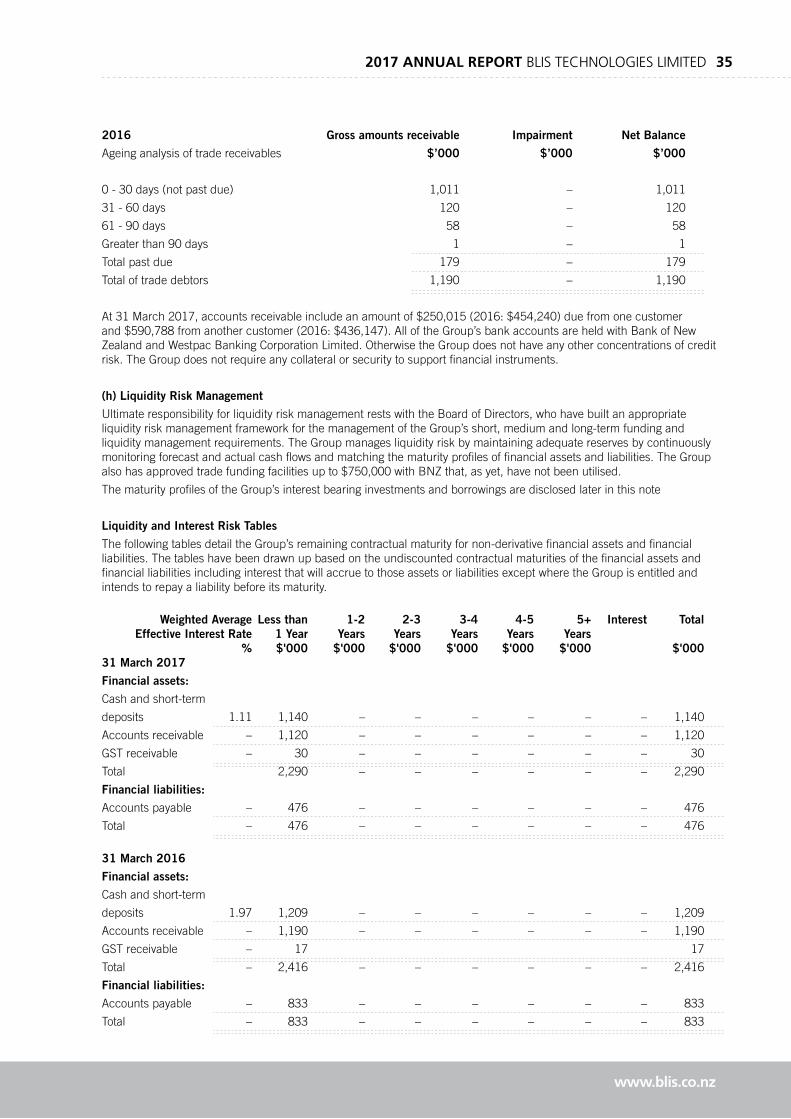
2017 ANNUAL REPORT BLIS TECHNOLOGIES LIMITED 35
2016 Gross amounts receivable Impairment Net Balance
Ageing analysis of trade receivables $’000 $’000 $’000
0 - 30 days (not past due) 1,011 – 1,011
31 - 60 days 120 – 120
61 - 90 days 58 – 58
Greater than 90 days 1 – 1
Total past due 179 – 179
Total of trade debtors 1,190 – 1,190
At 31 March 2017, accounts receivable include an amount of $250,015 (2016: $454,240) due from one customer and $590,788 from another customer (2016: $436,147). All of the Group’s bank accounts are held with Bank of New Zealand and Westpac Banking Corporation Limited. Otherwise the Group does not have any other concentrations of credit risk. The Group does not require any collateral or security to support financial instruments.
(h) Liquidity Risk Management
Ultimate responsibility for liquidity risk management rests with the Board of Directors, who have built an appropriate liquidity risk management framework for the management of the Group’s short, medium and long-term funding and liquidity management requirements. The Group manages liquidity risk by maintaining adequate reserves by continuously monitoring forecast and actual cash flows and matching the maturity profiles of financial assets and liabilities. The Group also has approved trade funding facilities up to $750,000 with BNZ that, as yet, have not been utilised.
The maturity profiles of the Group’s interest bearing investments and borrowings are disclosed later in this note
Liquidity and Interest Risk Tables
The following tables detail the Group’s remaining contractual maturity for non-derivative financial assets and financial liabilities. The tables have been drawn up based on the undiscounted contractual maturities of the financial assets and financial liabilities including interest that will accrue to those assets or liabilities except where the Group is entitled and intends to repay a liability before its maturity.
Weighted Average Less than 1-2 2-3 3-4 4-5 5+ Interest Total Effective Interest Rate 1 Year Years Years Years Years Years % $'000 $'000 $'000 $'000 $'000 $'000 $'00031 March 2017
Financial assets:
Cash and short-term
deposits 1.11 1,140 – – – – – – 1,140
Accounts receivable – 1,120 – – – – – – 1,120
GST receivable – 30 – – – – – – 30
Total 2,290 – – – – – – 2,290
Financial liabilities:
Accounts payable – 476 – – – – – – 476
Total – 476 – – – – – – 476
31 March 2016
Financial assets:
Cash and short-term
deposits 1.97 1,209 – – – – – – 1,209
Accounts receivable – 1,190 – – – – – – 1,190
GST receivable – 17 17
Total – 2,416 – – – – – – 2,416
Financial liabilities:
Accounts payable – 833 – – – – – – 833
Total – 833 – – – – – – 833
www.blis.co.nz

36 BLIS TECHNOLOGIES LIMITED 2017 ANNUAL REPORT
(i) Sensitivity Analysis
The Group is exposed to foreign currency risk arising from sales denominated in currencies other than the Group’s functional currency, arising from normal trading activities.
The majority of foreign currency related exposures relate to accounts receivable. The Group is mainly exposed to the Australian Dollar, the Euro and the United States Dollar.
Exposures to movements in these foreign currency rates are not considered material at balance date. The year-end exposure (and sensitivity to foreign currency rate movements at this time) does not reflect the risk and exposure during the course of the year. The Group’s sensitivity to foreign currency rate movements increased during the year due to an increased proportion of export sales.
Exposure to movement in floating interest rates in respect of cash on deposit is also not considered material at balance date.
(j) Fair Value of Financial Instruments
The fair values of financial assets and financial liabilities are determined as follows:
• The fair value of financial assets and financial liabilities with standard terms and conditions and traded on active liquid markets are determined with reference to quoted market prices; and
• The fair value of other financial assets and financial liabilities (excluding derivative instruments) are determined in accordance with generally accepted pricing models based on discounted cash flow analysis using prices from observable current market transactions and dealer quotes for similar instruments.
The Directors consider that the carrying amount of financial assets and financial liabilities recorded at amortised cost in the financial statements approximates their fair values.
www.blis.co.nz
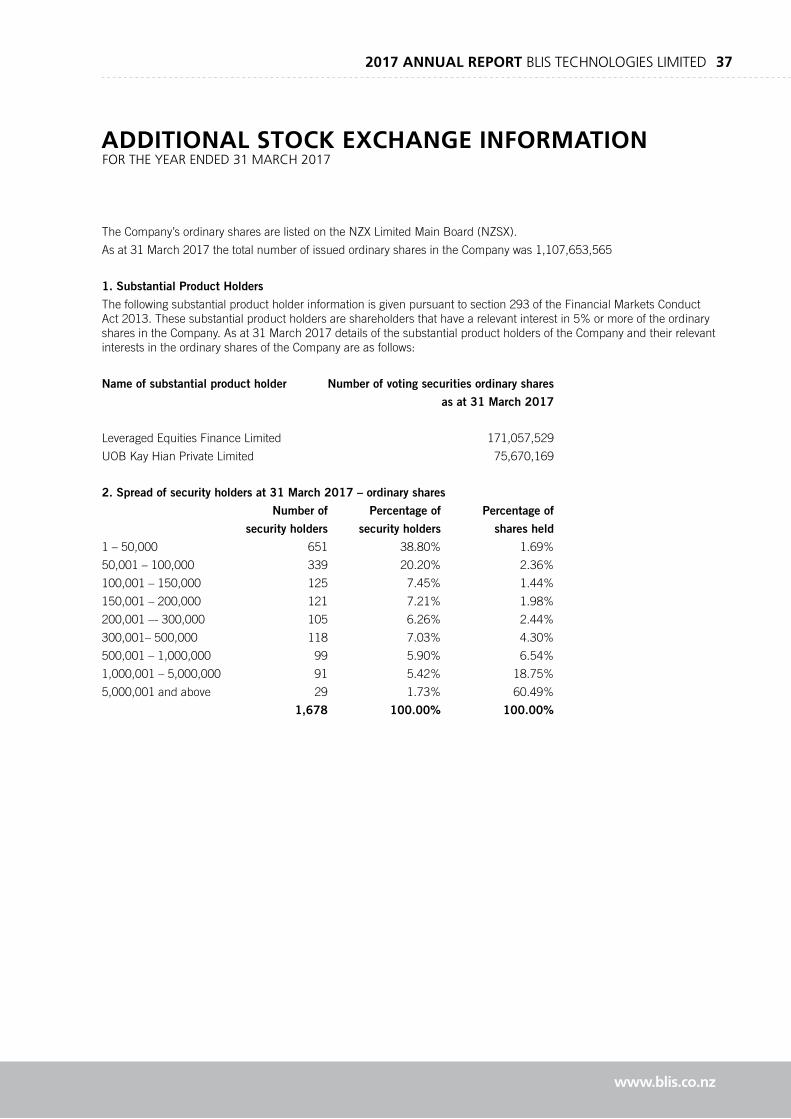
2017 ANNUAL REPORT BLIS TECHNOLOGIES LIMITED 37
www.blis.co.nz
ADDITIONAL STOCK EXCHANGE INFORMATIONFOR THE YEAR ENDED 31 MARCH 2017
The Company’s ordinary shares are listed on the NZX Limited Main Board (NZSX).
As at 31 March 2017 the total number of issued ordinary shares in the Company was 1,107,653,565
1. Substantial Product Holders
The following substantial product holder information is given pursuant to section 293 of the Financial Markets Conduct Act 2013. These substantial product holders are shareholders that have a relevant interest in 5% or more of the ordinary shares in the Company. As at 31 March 2017 details of the substantial product holders of the Company and their relevant interests in the ordinary shares of the Company are as follows:
Name of substantial product holder Number of voting securities ordinary shares
as at 31 March 2017
Leveraged Equities Finance Limited 171,057,529
UOB Kay Hian Private Limited 75,670,169
2. Spread of security holders at 31 March 2017 – ordinary shares
Number of Percentage of Percentage of
security holders security holders shares held
1 – 50,000 651 38.80% 1.69%
50,001 – 100,000 339 20.20% 2.36%
100,001 – 150,000 125 7.45% 1.44%
150,001 – 200,000 121 7.21% 1.98%
200,001 –- 300,000 105 6.26% 2.44%
300,001– 500,000 118 7.03% 4.30%
500,001 – 1,000,000 99 5.90% 6.54%
1,000,001 – 5,000,000 91 5.42% 18.75%
5,000,001 and above 29 1.73% 60.49%
1,678 100.00% 100.00%
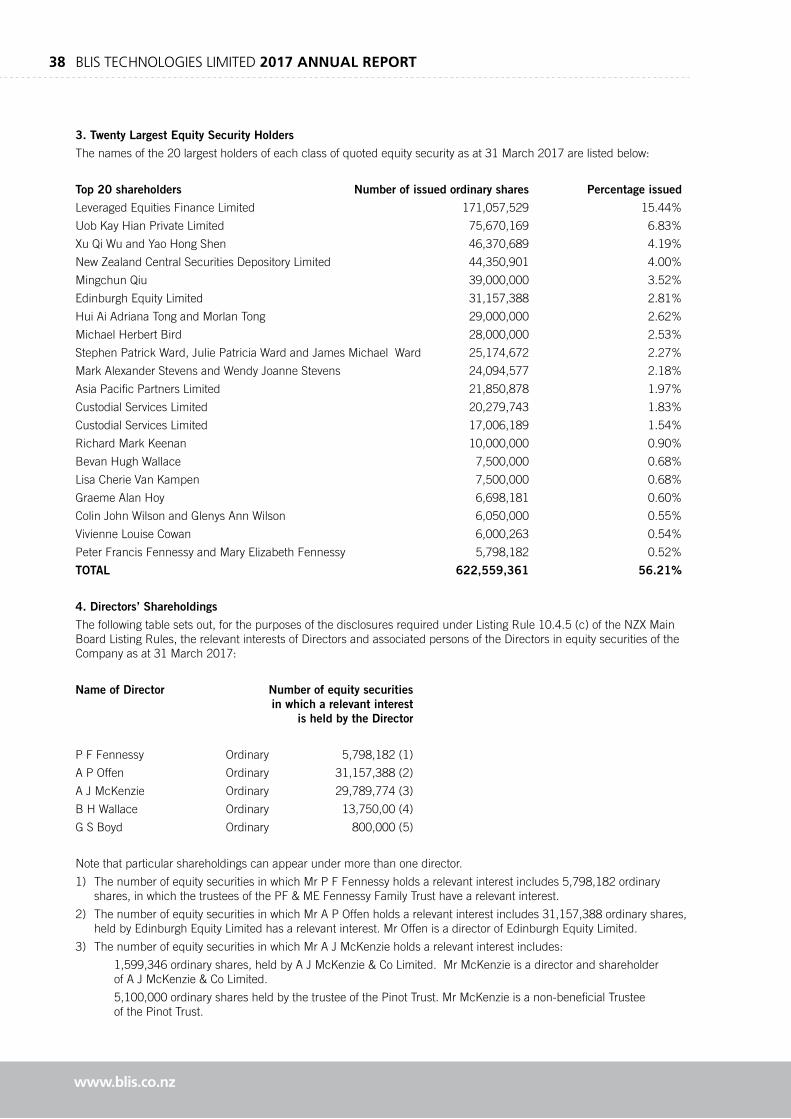
38 BLIS TECHNOLOGIES LIMITED 2017 ANNUAL REPORT
3. Twenty Largest Equity Security Holders
The names of the 20 largest holders of each class of quoted equity security as at 31 March 2017 are listed below:
Top 20 shareholders Number of issued ordinary shares Percentage issued
Leveraged Equities Finance Limited 171,057,529 15.44%
Uob Kay Hian Private Limited 75,670,169 6.83%
Xu Qi Wu and Yao Hong Shen 46,370,689 4.19%
New Zealand Central Securities Depository Limited 44,350,901 4.00%
Mingchun Qiu 39,000,000 3.52%
Edinburgh Equity Limited 31,157,388 2.81%
Hui Ai Adriana Tong and Morlan Tong 29,000,000 2.62%
Michael Herbert Bird 28,000,000 2.53%
Stephen Patrick Ward, Julie Patricia Ward and James Michael Ward 25,174,672 2.27%
Mark Alexander Stevens and Wendy Joanne Stevens 24,094,577 2.18%
Asia Pacific Partners Limited 21,850,878 1.97%
Custodial Services Limited 20,279,743 1.83%
Custodial Services Limited 17,006,189 1.54%
Richard Mark Keenan 10,000,000 0.90%
Bevan Hugh Wallace 7,500,000 0.68%
Lisa Cherie Van Kampen 7,500,000 0.68%
Graeme Alan Hoy 6,698,181 0.60%
Colin John Wilson and Glenys Ann Wilson 6,050,000 0.55%
Vivienne Louise Cowan 6,000,263 0.54%
Peter Francis Fennessy and Mary Elizabeth Fennessy 5,798,182 0.52%
TOTAL 622,559,361 56.21%
4. Directors’ Shareholdings
The following table sets out, for the purposes of the disclosures required under Listing Rule 10.4.5 (c) of the NZX Main Board Listing Rules, the relevant interests of Directors and associated persons of the Directors in equity securities of the Company as at 31 March 2017:
Name of Director Number of equity securities in which a relevant interest is held by the Director
P F Fennessy Ordinary 5,798,182 (1)
A P Offen Ordinary 31,157,388 (2)
A J McKenzie Ordinary 29,789,774 (3)
B H Wallace Ordinary 13,750,00 (4)
G S Boyd Ordinary 800,000 (5)
Note that particular shareholdings can appear under more than one director.
1) The number of equity securities in which Mr P F Fennessy holds a relevant interest includes 5,798,182 ordinary shares, in which the trustees of the PF & ME Fennessy Family Trust have a relevant interest.
2) The number of equity securities in which Mr A P Offen holds a relevant interest includes 31,157,388 ordinary shares, held by Edinburgh Equity Limited has a relevant interest. Mr Offen is a director of Edinburgh Equity Limited.
3) The number of equity securities in which Mr A J McKenzie holds a relevant interest includes:
1,599,346 ordinary shares, held by A J McKenzie & Co Limited. Mr McKenzie is a director and shareholder of A J McKenzie & Co Limited.
5,100,000 ordinary shares held by the trustee of the Pinot Trust. Mr McKenzie is a non-beneficial Trustee of the Pinot Trust.
www.blis.co.nz
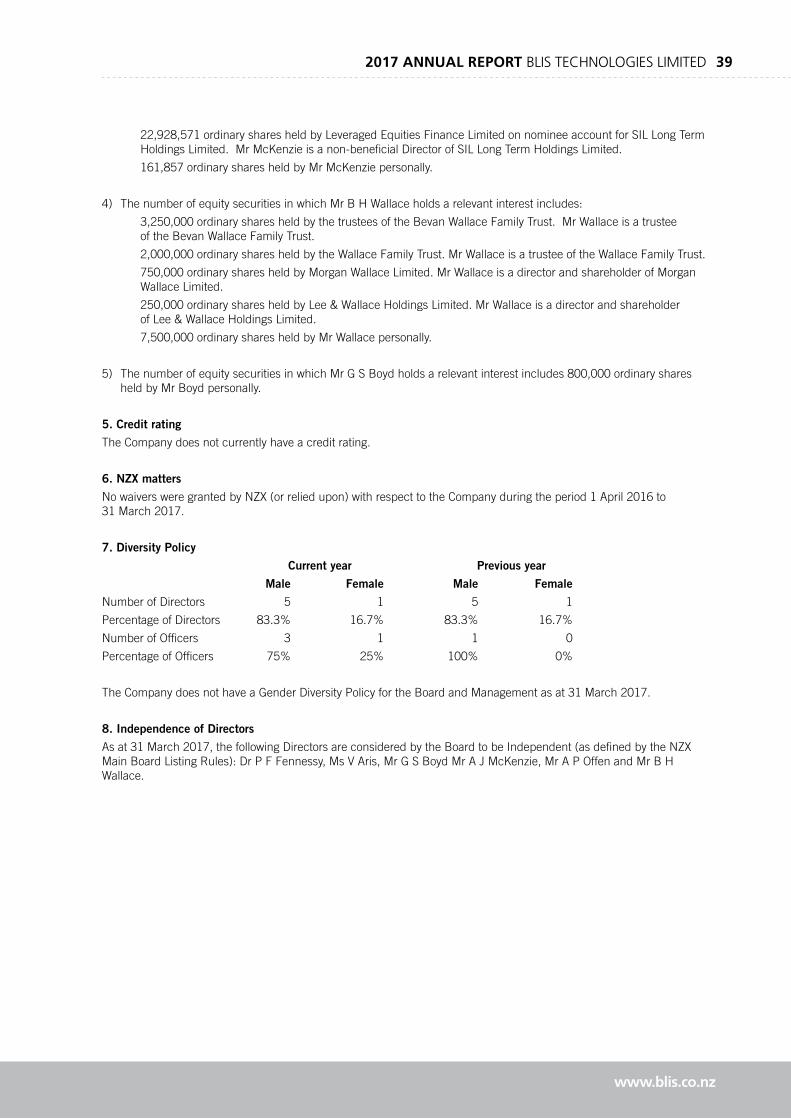
2017 ANNUAL REPORT BLIS TECHNOLOGIES LIMITED 39
22,928,571 ordinary shares held by Leveraged Equities Finance Limited on nominee account for SIL Long Term Holdings Limited. Mr McKenzie is a non-beneficial Director of SIL Long Term Holdings Limited.
161,857 ordinary shares held by Mr McKenzie personally.
4) The number of equity securities in which Mr B H Wallace holds a relevant interest includes:
3,250,000 ordinary shares held by the trustees of the Bevan Wallace Family Trust. Mr Wallace is a trustee of the Bevan Wallace Family Trust.
2,000,000 ordinary shares held by the Wallace Family Trust. Mr Wallace is a trustee of the Wallace Family Trust.
750,000 ordinary shares held by Morgan Wallace Limited. Mr Wallace is a director and shareholder of Morgan Wallace Limited.
250,000 ordinary shares held by Lee & Wallace Holdings Limited. Mr Wallace is a director and shareholder of Lee & Wallace Holdings Limited.
7,500,000 ordinary shares held by Mr Wallace personally.
5) The number of equity securities in which Mr G S Boyd holds a relevant interest includes 800,000 ordinary shares held by Mr Boyd personally.
5. Credit rating
The Company does not currently have a credit rating.
6. NZX matters
No waivers were granted by NZX (or relied upon) with respect to the Company during the period 1 April 2016 to 31 March 2017.
7. Diversity Policy
Current year Previous year
Male Female Male Female
Number of Directors 5 1 5 1
Percentage of Directors 83.3% 16.7% 83.3% 16.7%
Number of Officers 3 1 1 0
Percentage of Officers 75% 25% 100% 0%
The Company does not have a Gender Diversity Policy for the Board and Management as at 31 March 2017.
8. Independence of Directors
As at 31 March 2017, the following Directors are considered by the Board to be Independent (as defined by the NZX Main Board Listing Rules): Dr P F Fennessy, Ms V Aris, Mr G S Boyd Mr A J McKenzie, Mr A P Offen and Mr B H Wallace.
www.blis.co.nz
40 BLIS TECHNOLOGIES LIMITED 2017 ANNUAL REPORT
52
INDEPENDENT AUDITOR’S REPORT To the Shareholders of Blis Technologies Limited
Opinion We have audited the consolidated financial statements of Blis Technologies Limited (the ‘Company’) and its subsidiaries (the ‘Group’), which comprise the consolidated balance sheet as at 31 March 2017, and the consolidated income statement, statement of comprehensive income, statement of changes in equity and statement of cashflows for the year then ended, and notes to the consolidated financial statements, including a summary of significant accounting policies.
In our opinion, the accompanying consolidated financial statements, on pages 14 to 36, present fairly, in all material respects, the consolidated financial position of the Group as at 29 May 2017, and its consolidated financial performance and cash flows for the year then ended in accordance with New Zealand Equivalents to International Financial Reporting Standards (‘NZ IFRS’) and International Financial Reporting Standards (‘IFRS’).
Basis for Opinion We conducted our audit in accordance with International Standards on Auditing (‘ISAs’) and International Standards on Auditing (New Zealand) (‘ISAs (NZ)’). Our responsibilities under those standards are further described in the Auditor’s Responsibilities for the Audit of the Consolidated Financial Statements section of our report.
We believe that the audit evidence we have obtained is sufficient and appropriate to provide a basis for our opinion.
We are independent of the Group in accordance with Professional and Ethical Standard 1 (Revised) Code of Ethics for Assurance Practitioners issued by the New Zealand Auditing and Assurance Standards Board and the International Ethics Standards Board for Accountants’ Code of Ethics for Professional Accountants, and we have fulfilled our other ethical responsibilities in accordance with these requirements.
Other than in our capacity as auditor, we have no relationship with or interests in the Company or any of its subsidiaries, except that partners and employees of our firm deal with the Company and its subsidiaries on normal terms within the ordinary course of trading activities of the business of the Company and its subsidiaries.
Audit Materiality We consider materiality primarily in terms of the magnitude of misstatement in the financial statements of the Group that in our judgement would make it probable that the economic decisions of a reasonably knowledgeable person would be changed or influenced (the ‘quantitative’ materiality). In addition, we also assess whether other matters that come to our attention during the audit would in our judgement change or influence the decisions of such a person (the ‘qualitative’ materiality). We use materiality both in planning the scope of our audit work and in evaluating the results of our work.
We determined materiality for the Group financial statements as a whole to be $95,000.
Key Audit Matters Key audit matters are those matters that, in our professional judgement, were of most significance in our audit of the consolidated financial statements of the current period. These matters were addressed in the context of our audit of the consolidated financial statements as a whole, and in forming our opinion thereon, and we do not provide a separate opinion on these matters.

2017 ANNUAL REPORT BLIS TECHNOLOGIES LIMITED 41
53
Key Audit Matter How our Audit Addressed the Key Audit Matter
and Results
Impairment of Intangible Assets
The Group’s ability to generate revenue is linked to capitalised development costs and patents in respect of ingredients for the Group’s products. These are included in the balance sheet as intangible assets.
The total carrying value of intangible assets at 31 March 2017 is $1.118m as shown in the Consolidated Balance Sheet and note 10, of which $1.03m relates to capitalised development costs and patents.
The carrying value of intangible assets is particularly judgemental given its dependency on forecasts of revenue growth, contribution margins and required rate of return.
We included impairment of intangible assets as a key audit matter because if the Group is unable to generate revenue growth and produce sustainable operating cashflows, this affects the carrying value of its key intangible assets.
Our procedures focused on evaluating the appropriateness of the revenue forecasts and operating cash flows included in the impairment model.
Our procedures included, amongst others:
• Obtaining the Group’s impairment model and gaining an understanding of key assumptions and judgements underlying the model.
• Assessing the impairment model for consistency with the prior year and determining whether any significant changes to the model were appropriate.
• Challenging the reasonableness of the key assumptions including those driving the cash flows underpinning the analysis, by: o Comparing historical budget forecasts against
actual results.
o Comparing forecast growth to business plans approved by the Board, and a market analyst report on the Group.
o Engaging an internal valuation expert to benchmark the discount rate against companies of a similar nature.
• Performing sensitivity analysis on revenue growth assumptions to assess the impact on forecasted cashflows.
Going Concern
The financial statements have been prepared on a going concern basis as discussed in note 1.
Historically, the Group has been loss making, and has raised capital to fund costs during an extended growth phase.
Accumulated losses shown in the Consolidated Balance Sheet totalled $33.3m as at 31 March 2017.
We included the going concern assumption as a key audit matter as it relies on existing cash reserves and revenue growth generating sufficient cashflows to cover necessary expenditure.
In assessing the appropriateness of the going concern assumption used in preparing the financial statements, our procedures included, amongst others:
• Assessing the cash flow requirements of the Group over 15 months from 31 March 2017 based on budgets and forecasts.
• Understanding what forecast expenditure is committed and what could be considered discretionary.
• Considering the liquidity of existing assets on the balance sheet.
42 BLIS TECHNOLOGIES LIMITED 2017 ANNUAL REPORT
54
• Considering the terms of the trade funding facility and the amount available for drawdown.
• Considering potential downside scenarios and the resultant impact on available funds.
Fair Value of Share Options under Subscription Agreement and Related Accounting Treatment
During the year, the Group entered into a Subscription Agreement with the Chief Executive for the issue of shares in Blis Technologies Limited, accounted for as share options in accordance with NZ IFRS 2 Share Based Payments. The details of the arrangement are described in note 14 of the financial statements. An amount of $54,000 has been recognised as an expense during the year in the consolidated income statement and is also shown as a separate component of equity.
Measuring the fair value of the share options under the Subscription Agreement requires judgement to determine an appropriate volatility percentage to apply in the application of the Black-Scholes valuation model, particularly as the shares are thinly traded.
We have included the treatment of the Subscription Agreement as a key audit matter due to it being a new transaction with a member of key management personnel which involves accounting complexity and valuation judgements and due to its significance to the financial statements.
We focused on the appropriateness of the fair value and related accounting treatment of the arrangement for the Chief Executive to acquire the shares. Our procedures included, amongst others:
• Obtaining the Subscription Agreement and discussing with management the accounting applied, the basis for utilising the Black-Scholes model to calculate fair value and key judgements made.
• Assessing the reasonableness of the judgements and assumptions in calculating the fair value. Our testing approach included: o Engaging an internal valuation expert to
assess the reasonableness of the methodology applied and the inputs used, focussing on assumed volatility relative to other companies in similar industries.
o Considering the appropriateness of key inputs to the model, including assessing the appropriateness of a nil dividend rate and comparing interest rates to the NZ Reserve Bank government bond rates for similar time frames.
o Recalculating the fair value of the amount recognised as an expense using the Black-Scholes model.
Other information
The directors are responsible for the other information. The other information comprises the information in the Annual Report that accompanies the consolidated financial statements and the audit report.
Our opinion on the consolidated financial statements does not cover the other information and we do not express any form of assurance conclusion thereon.
Our responsibility is to read the other information and consider whether it is materially inconsistent with the consolidated financial statements or our knowledge obtained in the audit or otherwise appears to be materially misstated. If so, we are required to report that fact. We have nothing to report in this regard.
2017 ANNUAL REPORT BLIS TECHNOLOGIES LIMITED 43
55
Directors’ responsibilities for the consolidated financial statements
The directors are responsible on behalf of the Group for the preparation and fair presentation of the consolidated financial statements in accordance with NZ IFRS and IFRS, and for such internal control as the directors determine is necessary to enable the preparation of consolidated financial statements that are free from material misstatement, whether due to fraud or error.
In preparing the consolidated financial statements, the directors are responsible on behalf of the Group for assessing the Group’s ability to continue as a going concern, disclosing, as applicable, matters related to going concern and using the going concern basis of accounting unless the directors either intend to liquidate the Group or to cease operations, or have no realistic alternative but to do so.
Auditor’s responsibilities for the audit of the consolidated financial statements
Our objectives are to obtain reasonable assurance about whether the consolidated financial statements as a whole are free from material misstatement, whether due to fraud or error, and to issue an auditor’s report that includes our opinion. Reasonable assurance is a high level of assurance, but is not a guarantee that an audit conducted in accordance with ISAs and ISAs (NZ) will always detect a material misstatement when it exists. Misstatements can arise from fraud or error and are considered material if, individually or in the aggregate, they could reasonably be expected to influence the economic decisions of users taken on the basis of these consolidated financial statements.
A further description of our responsibilities for the audit of the consolidated financial statements is located on the External Reporting Board’s website at:
https://www.xrb.govt.nz/standards-for-assurance-practitioners/auditors-responsibilities/audit-report-1
This description forms part of our auditor’s report.
Restriction on use
This report is made solely to the Company’s shareholders, as a body. Our audit has been undertaken so that we might state to the Company’s shareholders those matters we are required to state to them in an auditor’s report and for no other purpose. To the fullest extent permitted by law, we do not accept or assume responsibility to anyone other than the Company’s shareholders as a body, for our audit work, for this report, or for the opinions we have formed.
B E Tomkins, Partner for Deloitte Limited Dunedin, New Zealand 29 May 2017 This audit report relates to the consolidated financial statements of Blis Technologies Limited (the ‘Company’) for the year ended 31 March 2017 included on the Company’s website. The Directors are responsible for the maintenance and integrity of the Company’s website. We have not been engaged to report on the integrity of the Company’s website. We accept no responsibility for any changes that may have occurred to the consolidated financial statements since they were initially presented on the website. The audit report refers only to the consolidated financial statements named above. It does not provide an opinion on any other information which may have been hyperlinked to/from these consolidated financial statements. If readers of this report are concerned with the inherent risks arising from electronic data communication they should refer to the published hard copy of the audited consolidated financial statements and related audit report dated 29 May 2017 to confirm the information included in the audited consolidated financial statements presented on this website.

44 BLIS TECHNOLOGIES LIMITED 2017 ANNUAL REPORT
www.blis.co.nz