2017 Annual Report - todsgroup.com · Arquata del Tronto (AP) - Zona Industriale Pescara del Tronto...
274
2017 Annual Report (Translation of the 2017 Annual Report approved in Italian solely for the convenience of international readers)
Transcript of 2017 Annual Report - todsgroup.com · Arquata del Tronto (AP) - Zona Industriale Pescara del Tronto...

2017 Annual Report (Translation of the 2017 Annual Report approved in Italian solely for the convenience of international readers)

2 0 1 7 A n n u a l R e p o r t
Table of contents
TABLE OF CONTENTS
Company’s data ............................................................................................................................................. 1 Report on operations.. . . . . . . . . . . . . . . . . . . . . . . . . . . . . . . . . . . . . . . . . . . . . . . . . . . . . . . . . . . . . . . . . . . . . . . . . . . . . . . . . . . . . . . . . . . . . . . . . . . . . . . . . . . . . . . . . . . 2 Corporate Governance bodies ........................................................................................................................ 3 TOD’S Group .................................................................................................................................................. 4 Group’s organizational chart ......................................................................................................................... 5 Distribution network as of December 31 s t , 2017 ............................................................................................ 6 Key consolidated financial f igures ................................................................................................................. 7 Highlights of results ...................................................................................................................................... 8 Introduction ................................................................................................................................................ 10 Group’s activity ........................................................................................................................................... 10 Main events and operations during the year of TOD’S Group ....................................................................... 11 The Group’s results in 2017 ......................................................................................................................... 13 Report on operations of parent company TOD’S S.p.A. ................................................................................ 21 Other Information ....................................................................................................................................... 25 Significant events occurred after t he end of the period .............................................................................. 27 Business outlook .......................................................................................................................................... 28 Approval of F inancial Statement and proposal for the allocation of the profit for the period ..................... 28 Consolidated Non-Financial Statement - FY 2017 pursuant to articles 3 and 4 of Italian Legislative Decree no. 254 of 2016 . . . . . . . . . . . . . . . . . . . . . . . . . . . . . . . . . . . . . . . . . . . . . . . . . . . . . . . . . . . . . . . . . . . . . . . . . . . . . . . . . . . . . . . . . . . . . . . . . . . . . . . . . . . . . . . . . . . . . . . . . 29 Letter to stakeholders ................................................................................................................................. 29 Methodological note.................................................................................................................................... 30 1. Approach to sustainabil ity ....................................................................................................................... 32 2. Ethical and responsible business management ....................................................................................... 37 3. Tradition and innovation ........................................................................................................................ 47 4. Ethics ..................................................................................................................................................... 77 5. Solidarity and Ital ian spirit .................................................................................................................... 97 6. Appendixes ........................................................................................................................................... 111 7. Scope and impact of material topics ..................................................................................................... 116 8. GRI Content Index ................................................................................................................................. 118 Independent auditor’s report on the consolidated financial statement ...................................................... 127 Consolidated Financial Statements as at December 31 s t , 2017 . . . . . . . . . . . . . . . . . . . . . . . . . . . . . . . . . . . . . . . . . . . . . . . . . . . . . . . . . . 128
Financial Statements . . . ............................. ................................ ................................ ........ 129 Consolidated Income Statement ................................................................................................................. 130 Consolidated Statement of Comprehensive Income .................................................................................... 131 Consolidated Statement of F inancial Position ............................................................................................. 132 Consolidated Statement of Cash Flows ....................................................................................................... 134 Consolidated Statement of changes in equity ............................................................................................. 135
Notes to the Consolidated Financial Statements . . . ............................. ................................ ..... 136 1. General notes ........................................................................................................................................ 137 2. Basis of preparation ............................................................................................................................... 137 3. Evaluation methods and accounting standards ......................................................................................... 138 4. Scope of Consolidation ......................................................................................................................... 156 5. Segment reporting ................................................................................................................................ 158 6. Management of f inancial r isks ( IFRS 7) ................................................................................................. 160 7. Intangible f ixed assets .......................................................................................................................... 168 8. Tangible f ixed assets ............................................................................................................................. 170 9. Impairment losses ................................................................................................................................. 171 10. Investment property ............................................................................................................................. 173 11. Deferred tax assets and l iabil it ies ......................................................................................................... 173 12. Other non-current assets ...................................................................................................................... 174 13. Inventories............................................................................................................................................ 174 14. Trade receivables and other current assets ........................................................................................... 175 15. Derivative financial instruments ........................................................................................................... 176 16. Cash and cash equivalents .................................................................................................................... 178 17. Assets held for sale ............................................................................................................................... 178 18. Equity ................................................................................................................................................... 178 19. Contingent and potential l iabil it ies an d assets ..................................................................................... 180

2 0 1 7 A n n u a l R e p o r t
Table of contents
20. Employee Benefits ................................................................................................................................ 182 21. F inancial l iabil it ies ................................................................................................................................ 183 22. Other non-current l iabil it ies ................................................................................................................. 186 23. Trade payables and other current l iabil it ies .......................................................................................... 186 24. Revenues .............................................................................................................................................. 186 25. Personnel costs ..................................................................................................................................... 187 26. F inancial income and expenses ............................................................................................................. 187 27. Income or losses from equity investments ............................................................................................ 187 28. Income taxes ......................................................................................................................................... 188 29. Earnings per share ................................................................................................................................ 188 30. Transaction with related parties ........................................................................................................... 189 31. Events and significant non-recurring transactions ................................................................................ 192 32. Items or transactions resulting from unusual and/or exceptional transactions ..................................... 193 33. S ignificant events occurred after the end of the year ........................................................................... 193 Independent auditor’s report ..................................................................................................................... 194 Separate Financial Statements as at December 31 s t , 2017 . . . . . . . . . . . . . . . . . . . . . . . . . . . . . . . . . . . . . . . . . . . . . . . . . . . . . . . . . . . . . . . 195
Financial Statements . . . ............................. ................................ ................................ ........ 196 Income statement ....................................................................................................................................... 197 Statement of Comprehensive Income.......................................................................................................... 198 Statement of F inancial Position .................................................................................................................. 199 Statement of Cash Flows............................................................................................................................. 201 Statement of Changes in Equity .................................................................................................................. 202
Notes to the separate financial statements . . . ............................. ........................................... 203 1. General notes ....................................................................................................................................... 204 2. Basis of preparation ............................................................................................................................... 204 3. Evaluation methods and acc ounting standards ...................................................................................... 205 4. Management of f inancial r isks .............................................................................................................. 221 5. Intangible f ixed assets .......................................................................................................................... 228 6. Tangible f ixed assets ............................................................................................................................. 230 7. Impairment losses ................................................................................................................................. 230 8. Investments property ............................................................................................................................ 232 9. Investments in subsidiaries, joint ventures and associated companies ................................................. 232 10. Deferred taxes ...................................................................................................................................... 233 11. Other non-current assets ...................................................................................................................... 234 12. Inventories............................................................................................................................................ 234 13. Trade receivables and other current assets ........................................................................................... 235 14. Derivative financial instruments ........................................................................................................... 236 15. Cash and cash equivalents .................................................................................................................... 238 16. Shareholders’ equity ............................................................................................................................. 238 17. Provisions and contingent l iabil it ies and assets .................................................................................... 240 18. Employee benefits ................................................................................................................................ 242 19. F inancial l iabil it ies ................................................................................................................................ 243 20. Other non-current l iabil it ies ................................................................................................................. 244 21. Trade payables and other current l iabil it ies .......................................................................................... 245 22. Revenues .............................................................................................................................................. 246 23. Personnel costs ..................................................................................................................................... 246 24. F inancial income and expenses ............................................................................................................. 246 25. Income and expenses from subsidiaries ................................................................................................ 247 26. Income taxes ......................................................................................................................................... 247 27. Earnings per share ................................................................................................................................ 248 28. Transactions with related parties .......................................................................................................... 249 29. Events and significant non-recurring transactions ................................................................................ 254 30. Independent Auditors compensation ..................................................................................................... 254 31. Items or transactions resulting from unusual and/or exceptional transactions ..................................... 254 32. S ignificant events occurring after the end of the fiscal year ................................................................. 254 33. Certif ication of the Separate Financial Statements of TOD’S S.p.A. and the Consolidated Financial Statements of the TOD’S Group pursuant to Article 81 - ter of Consob Regulation no. 11971 of May 14 t h, 1999, as amended ....................................................................................................................................... 255 Independent auditor’s report ..................................................................................................................... 256

2 0 1 7 A n n u a l R e p o r t
1 Company’s data
Company’s data
Registered office
TOD’S S.p.A.
Via Fil ippo Della Valle, 1
63811 Sant'Elpidio a Mare (Fermo) - Italy
Tel. +39 0734 8661
Legal data Parent company
Share capital resolved euro 66,187,078
Share capital subscribed and paid euro 66,187,078
Fiscal Code and registration number on Company Register of Court of Fermo: 01113570442
Registered with the Chamber of Commerce of Fermo under n. 114030 R.E.A.
Offices and Showrooms Munich – Domagkstrasse 1/b, 2
Hong Kong – 35/F Lee Garden one, 33 Hysan Avenue, Causeway Bay
London – Wilder Walk, 1
Milan - Corso Venezia, 30
Milan - Via Savona, 56
Milan - Via Serbelloni, 1-4
New York - 450, West 15t h
Street
Paris – Rue de Faubourg Saint-Honore, 29
Paris – Rue du Général FOY, 22
Paris – Rue de L’Elysée, 22
Seoul – 11/F Pax Tower 609, Eonju-ro, Gangnam-gu
Shanghai - 1717 Nanjing West Road, Wheelock Squa re 45/F
Tokyo – Omotesando Building, 5-1-5 Jingumae
Production facilities Comunanza (AP) - Via Merloni, 7
Comunanza (AP) - Via S.Maria, 2-4-6
Sant'Elpidio a Mare (FM) - Via Fil ippo Della Valle, 1
Bagno a Ripoli, Loc. Vallina (FI) - Via del Roseto, 60
Bagno a Ripoli, Loc. Vallina (FI) - Via del Roseto, 50
Tolentino (MC) - Via Sacharov 41/43
Arquata del Tronto (AP) - Zona Industriale Pescara del Tronto
Durres (Albania) – Rr. Jakov Xoxa Prane - Nish Goma – Shkozet

Report on operations

2 0 1 7 A n n u a l R e p o r t
3 Report on operations
Corporate Governance bodies
Board of directors ( 1)
Diego Della Valle Chairman
Andrea Della Valle Vice - Chairman
Luigi Abete
Maurizio Boscarato
Luigi Cambri
Sveva Dalmasso
Emanuele Della Valle
Romina Guglielmetti
Emilio Macellari
Vincenzo Manes
Cinzia Oglio
Pierfrancesco Saviotti
Michele Scannavini
Stefano Sincini
Executive Committee Diego Della Valle Chairman
Andrea Della Valle
Emilio Macellari
Stefano Sincini
Compensation Luigi Abete Chairman
Committee Sveva Dalmasso
Vincenzo Manes
Control and Risk Luigi Cambri Chairman
Committee Maurizio Boscarato
Romina Guglielmetti
Independent Directors Vincenzo Manes Chairman
Committee Romina Guglielmetti
Pierfrancesco Saviotti
Board of statutory ( 2 )
Giulia Pusterla Chairman
Auditors Enrico Colombo Acting stat. auditor
Fabrizio Redaelli Acting stat. auditor
Myriam Amato Substitute auditor
Gilfredo Gaetani Substitute auditor
Independent Auditors ( 3)
PricewaterhouseCoopers S.p.A.
Manager charged with preparing Rodolfo Ubaldi
a company’s financial report
( 1 ) Term of the off ice: 2015 -2017 (resolut ion of the Shareholders ’ meeting as of Apri l 22 n d , 2015)
( 2 ) Term of the off ice: 2016 -2018 (resolut ion of the Shareholders ’ mee t ing as of Apri l 20 t h , 2016) ( 3 ) Term of the off ice: 2012 -2020 (resolut ion of the Shareholders ’ meeting as of Apri l 19 t h , 2012)

2 0 1 7 A n n u a l R e p o r t
4 Report on operations
TOD’S Group
TOD’S S.p.A. Parent Company, owner of TOD’S, HOGAN and FAY brands Del.Com. S.r . l. Sub-holding for operation of national subsidiaries and DOS in Italy TOD’S International B.V. Sub-holding for operation of international subsidiaries and DOS in The Netherlands An.Del. Usa Inc. Sub-holding for operation of subsidiaries in the United States Del.Pav S.r. l. Company that operates DOS in Italy F ilangieri 29 S.r. l. Company that operates DOS in Italy Gen.del. SA Company that operates DOS in Switzerland TOD’S Belgique S.p.r. l. Company that operates DOS in Belgium TOD’S Deutschland Gmbh Company that distributes and promotes products in Germany and manages DOS in Germany TOD’S Espana SL Company that operates DOS in Spain TOD’S France Sas Company that operates DOS in France TOD’S Japan KK Company that operates DOS in Japan TOD’S Macao Ltd Company that operates DOS in Macao TOD’S Hong Kong Ltd Company that distributes and promotes products in Far East and South Pacific and manages DOS in Hong Kong. Sub-holding for operation of international subsidiaries in Asia TOD’S Korea Inc. Company that distributes and promotes products in Korea and operates DOS in Korea TOD’S Retail India Private Ltd Company that operates DOS in India TOD’S (Shanghai) Trading Co. Ltd Company that distributes and promotes products in China and operates DOS in China
TOD’S Singapore Pte Ltd Company that operates DOS in Singapore TOD’S UK Ltd Company that operates DOS in Great Britain Webcover Ltd Company that operates DOS in Great Britain Cal.Del. Usa Inc. Company that operates DOS in California (USA) Deva Inc. Company that distributes and promotes products in North America, and manages DOS in the State of NY (USA) F lor. Del. Usa Inc. Company that operates DOS in Florida (USA) Hono. Del. Inc. Company that operates DOS in Hawaii (USA) I l . Del. Usa Inc. Company that operates DOS in I l l inois (USA) Neva. Del. Inc. Company that operates DOS in Nevada (USA) Or. Del. Usa Inc. Company that operates DOS in California (USA) TOD’S Tex. Del. Usa Inc. Company that operates DOS in Texas (USA) Holpaf B.V. Real estate company that ope rates one DOS in Japan Alban.Del Sh.p.k. Production company Sandel SA Not operating company Un.Del. Kft Production company Re.Se.Del. S.r . l. Company for services Roger Vivier S.p.A. Owner of ROGER VIVIER brand and sub-holding for operation of international subsidiaries and DOS in Italy Roger Vivier Hong Kong Ltd Company that distributes and promotes products in Far East and South Pacific and manages DOS in Hong Kong. Sub-holding for operation of subsidiaries in Asia Roger Vivier Singapore Pte Ltd Company that operates DOS in S ingapore
Roger Vivier (Shanghai) Trading Co. Ltd Company that operates in China Roger Vivier UK Ltd Company that operates DOS in Great Britain TOD’S Georgia Inc. Company that operates DOS in Georgia (USA) Roger Vivier France Sas Company that operates DOS in France Roger Vivier Korea Inc. Company that operates DOS in Korea and that distributes and promotes products in Korea Roger Vivier Switzerland S.A. Company that operates DOS in Switzerland Roger Vivier Macau Ltd. Company that operates DOS in Macao Roger Vivier Japan KK Company that operates DOS in Japan TOD’S Danmark APS Company that operates DOS in Denmark TOD’S Austria GMBH Company that operates DOS in Austria TOD’S Washington Inc. Company that operates DOS in Washington (USA) Ala Del Inc. Company that operates DOS in Delaware (USA) TOD’S Massachussets Inc. Company that operates DOS in Massachussets (USA) Roger Vivier Paris Sas Company that operates DOS in France Buena Ltd. Company that provides service s

2 0 1 7 A n n u a l R e p o r t
5 Report on operations
Group’s organizational chart

2 0 1 7 A n n u a l R e p o r t
6 Report on operations
Distribution network as of December 31st
, 2017
Au s tr i a
To t al
Gr e at e r C h in a
C h i n a
H o n g K o n g
M a c a u
Ta i wa n
To t al
Re st o f t h e W o r ld
S a u d i Ar a b i a
B a h r a i n
U.A.E.
K u wa i t
Leb a n o n
( D ) = D O S ( F ) = F R A N C H I S E D S T O R E S(D )=D O S(F)=FRAN CHISIN G
RoW (D ) (F)
Ar abia Saudi t a 2
Bahar ain 2
Emir at i Ar abi 5
Kuwai t 1
Libano 2
Q at ar 1
Tot ale 13
USA (D ) (F)
U.S.A. 13
Asia (D ) (F)
Giappone 27 1
Cina 17 6
Cor ea 7 8
Fi l ippine 2
Hong Kong 8 1
India 3
Indonesia 3
Macao 1 1
Malaysia 2
Singapor e 3 1
Taiwan 13
Thai landia 3
U.S.A. 1
Tot ale 66 42
(D)=DO S (F)=FRANCHI SED STO RES
Eu r o p e ( D) ( F )
I ta l y 48 2
Belgium 1
France 21 1
Germany 12 3
Great Britain 6 1
Greece 2
Netherlands 4
Portugal 1
Russia 3
Spain 9 1
Switzerland 4
Turkey 5
Czech Republic 2
Denmark 1
Austria 2 1
Total 108 22
Re s t o f t h e W o r l d( D) ( F )
S a u d i Ar a b i a 3
B a h r a i n 2
U.A.E. 8
K u wa i t 3
Leb a n o n 2
Q a ta r 1
J a p a n 35 1
Korea 23 12
Philippines 2
India 2
Indonesia 5
Malaysia 3
Singapore 3 1
Thailand 4
Guam 1
Azerbaijan 1
Australia 3
Kazakistan 1
Total 63 53
Gr e at e r C h in a ( D) ( F )
C h i n a 65 10
Hong Kong 13 1
Macau 4 4
Taiwan 19
Total 82 34
A m e r icas ( D) ( F )
U.S .A. 22
Brazil 2
Panama 1
Total 22 3
DOS, 2017 new openings Europe Barcellona (Spain) Vienna (Austr ia) Serravalle ( I tal ia) Rome ( I taly) Rome ( I taly) Berl in (Germany)
Greater China Tianj in (China) Nanj ing (China) Shanghai (China) Shenyang (China) Beij ing (China)
Americas San Francisco (USA) Boston (USA)
Rest of the World Seoul (Korea) Daegu (Korea) Fukuoka (Japan)
Franchised stores, 2017 new openings Europe Prague (Czech Republic) Is tanbul (Turkey)
Rest of the World Seoul (Korea) Seoul (Korea) Seoul (Korea) Kuwait C ity (Kuwait)
Greater China J inHan (China) Changchun (China) Kunming (China) Harbin (China) Americas San Paolo (Brazi l) San Paolo (Brazi l)
For a complete l is t of retai l outlets operated by the DOS and franchis ing network, reference should be made to
the corporate web s ite: www.todsgroup.com

2 0 1 7 A n n u a l R e p o r t
7 Report on operations
Key consolidated financial figures
P&L key figures (euro mn)
FY 17 FY 16 FY 15
Revenues 963.3 1,004.0 1,037.0
EBITDA 160.5 16.7% 180.9 18.0% 202.6 19.5%
EBIT 111.8 11.6% 128.4 12.8% 148.6 14.3%
Profi t before tax 101.9 10.6% 115.0 11.5% 137.3 13.2%
Profi t for the period 69.4 7.2% 85.8 8.5% 92.1 8.9%
Main Balance Sheet indicators (euro mn)
Dec. 31st
, 17 Dec. 31st
, 16 Dec. 31st
, 15
Net working capita l (*) 261.3 279.2 316.1
Intangible and tangible fixed assets 802.9 822.5 417.3
Shareholders ' equity 1,087.2 1,090.5 866.1
Net financia l pos i tion 9.3 (35.4) 134.2
Capita l expenditures 36.6 449.9 47.9
(*) Trade receivable + inventories - trade payables
Financial key indicators (euro mn)
Dec. 31st, 17 Dec. 31st, 16 Dec. 31st, 15
Operating cash flow 165.8 212.6 138.2
Net operating cash flow 148.2 149.7 107.7
Cash flow generated/(used) (6.3) 7.9 49.1
2017 Revenues - % by brand
2017 Revenues - % by region
2017 Revenues - % by product
TOD'S53.5%
HOGAN21.2%
FAY6.6%
Roger Vivier18.6%
Other0.1%
Italy31.0%Europe
25.4%
Americ.9,6%
Greater China22.0%
RoW13.5%
Shoes78.7%
Leather goods14.1%
Apparel7.1%
Other0.1%

2 0 1 7 A n n u a l R e p o r t
8 Report on operations
Highlights of results
Revenues: 2017 revenues of 963.3 mill ion euros,
decreased by 4.1% in respect to 2016. The DOS
network had sales of 621.1 mill ion euros ( -1.5%).
EBITDA: this totalled 160.5 mill ion euros (180.9
mill ion euros in 2016). The ratio of EBITDA to
sales is 16.7%.
EBIT: this totalled 111.8 mill ion euros (128.4
mill ion euros in 2016), The ratio of EBITDA to
sales is 11.6%.
Net profit: consolidated profit for FY 2017 was
69.4 mill ion euros, representing 7.2% of
consolidated sales.
Net financial position (NFP): the Group had 221.6
mill ion euros in l iquid assets at December 31s t
,
2017 (227.7 mill ion euros in 2016). The net
f inancial position at the same date was positive
for 9.3 mill ion euros ( in 2016 it was negative for
35.4 mill ion euros).
Capital expenditure: amount to 36.6 mill ion
euros capital expenditures occurred in 2017; they
were 449.9 mill ion euros in 2016 (including 415
mill ion euros related to the acquisition of ROGER
VIVIER brand).
Distribution network: a total of 16 new DOS were
opened during the financial year. At December
31s t
, 2017 the single brand distribution network
comprised 275 DOS and 112 franchised stores .
Revenues (euro mn)
EBITDA (euro mn)
EBIT (euro mn)
NFP (Euro mn)
973.4 963.31,004.0
1,037.0
FY 17 comp. ex.rates basis
FY 17 FY 16 FY 15
163.0 160.5
180.9
202.6
FY 17 comp. ex.rates basis
FY 17 FY 16 FY 15
113.6 111.8
128.4
148.6
FY 17 comp. ex.rates basis
FY 17 FY 16 FY 15
9.3
-35.4
134.2 130.0
FY 17 FY 16 FY 15 FY 14

2 0 1 7 A n n u a l R e p o r t
9 Report on operations
Main stock Market indicators (euro)
Official price at 02.01.2017 62.52
Official price at 29.12.2017 60.90
Minimum price 53.80
Maximum price 73.45
Market capitalization at 02.01.2017 2,069,008,058
Market capitalization at 29.12.2017 2,015,396,591
Dividend per share 2016 1.70
Dividend per share 2015 2.00
Number of outstanding shares at December 31st, 2017 33,093,539
Stock performanceEarning per share (euro)
2.15
2.62
3.03
FY 17 FY 16 FY 15
50.0
55.0
60.0
65.0
70.0
75.0
eu
ro
January- December 2017
FY 17 FY 16 FY 15 FY 14
Year to date 4,627 4,485 4,550 4,297
Average 4,572 4,514 4,464 4,034
EX = executives
WHC = white collar employees
BLC = blue colar employees
2017 Group’s employees The Group's employees
EX1%
WHC70%
BLC29%

2 0 1 7 A n n u a l R e p o r t
10 Report on operations
Introduction
In accordance with article 40 paragraph 2 bis of the Legislative Decree n. 127 of April 9t h
, 1991,
the Parent company has prepared the Report of the Board of Directors on Operations as a single
document for both the separate financial statements of TOD’S S.p.A. a nd the Group consolidated
financial statements.
The Report on Operations must be read together with the Financial Statements and Notes to the
Financial Statements, which are an integral part of both the Consolidated Annual Report and the
separate financial statements. The Report on Operations also includes the additional information
required by CONSOB, pursuant to the orders issued in implementation of Article 9 of Legislative
Decree 38/2005 (Resolutions 15519 and 15520 of July 27t h
, 2006 and memorandum DEM/6064293
of July 28t h
, 2006, as well as all subsequent notices containing provisions regarding financial
disclosures.
In order to strip the effects of changes in exchange rates with respect to the average values for
the previous year from the results for the 2017 financial year, the typical economic reference
indicators (Revenues, EBITDA, and EBIT) have been recalculated by applying the average
exchange rates for 2016, rendering them fully comparable with those for the previous reference
period. Note that on the one hand, these principles for measurement of business performance
represent a key to interpretation of results not envisaged in IFRSs, and on the other hand, must
not be considered as substitutes for what is set out in those standards.
Moreover, the Report on Operations includes non -financial statement related to the fiscal year
2017 in accordance with articles 3 and 4 of the Legislative Decree n. 254 of December 23rd
, 2016.
Group’s activity
TOD’S Group operates in the luxury sector under its own brands TOD’S, HOGAN, FAY and ROGER
VIVIER. It actively creates, produces and distributes shoes, leather goods and accessories, and
apparel.
The Group’s organizational configuration rotates around TOD’S S.p.A. that is at the hear t of the
Group’s organization, its parent company owns TOD’S, HOGAN, FAY and, under a l icense
agreement, ROGER VIVIER brands, the latter owned by the subsidiary Roger Vivier S.p.A. Through
a series of sub-holdings, the organization is rounded out by a ser ies of commercial companies
that are delegated complete responsibility for retail distribution through the DOS network.
Certain of them, strategically located on international markets, are assigned major roles in
product distribution, marketing and promoti on, and public relations processes along the “value

2 0 1 7 A n n u a l R e p o r t
11 Report on operations
chain”, while simultaneously guaranteeing the uniform image that Group brands must have
worldwide.
The Group’s production structure is based on complete control of the production process, from
creation of the collections to production and then distribution of the products. This approach is
considered key to assuring the prestige of its brands.
Shoes and leather goods are produced in Group -owned plants, with partial outsourcing to
specialized workshops. All of these outsourcers are located in areas with a strong tradition of
shoe and leather good production. This preference reflects the fact that an extremely high
standard of professional quality is required to make these items, with a s ignificantly high lev el of
added value contributed to the final product by manual work.
The Group relies exclusively on selected specialized outsourcers, which enables it to exploit their
respective specializations in crafting the individual products sold as part of the appare l l ine.
The prestige of the Group’s brands and the high degree of specialization necessary to offer the
respective products to customers entails distribution through a network of similarly specialized
stores. Accordingly, the Group relies principally on t hree channels: DOS (directly operated
stores), franchised retail outlets, and a series of selected, independent multibrand stores. E -
commerce channel, which was started some years ago, is getting more relevant.
Main events and operations during the year of TOD’S Group
The macroeconomic scenario in which the Group operates continues to be marked by situations
of uncertainty that have long been affecting international markets, making them unstable and
volatile. In particular the luxury sector is in a phase of rapid change, with specific features that
have affected, and will continue to affect, consumption in the various geographical areas of the
global market, which show opposite trends. On the one hand t here was weakness in consumption
in the USA, which was adversely affected by both the uncertain political context and the strong
US Dollar, which continued to limit both domestic demand and tourism consumption, with
greater effects on sales in department s tores, this being a channel that accounts for a substantial
share of this market and that continues to experience a prolonged crisis. On the other hand,
there was an improvement in the Mainland China market, which moved back to growth after
years of decline, mainly thanks to a recovery in local consumption that was also driven by greater
price alignment linked to currency trends in international markets. Furthermore Chinese
customers continued to account for a substantial share of the luxury market l inked t o tourist
f lows. Consumption showed positive signals in the European market too, thanks to both a partial
recovery in domestic consumption and an increase in the abovementioned tourist f lows, which

2 0 1 7 A n n u a l R e p o r t
12 Report on operations
moved back to growth following uncertainties arising from social tensions and above all from
terrorism risks. Consumption also recorded positive trends in the UK market too, driven by fresh
optimism after Brexit.
The Group’s performances during the 2017 financial year were affected by this volatile context,
recording trends in international markets that were substantially in l ine with the
abovementioned general trends, reporting an overall reduction of 4.1%, in terms of revenues,
compared to the previous year and showing an upward trend in the fourth quarter of t he year.
Another important phenomenon that marked the relevant context of the sector more than in the
past concerned the consumer’s greater tendency to high -end brands. Very positive results were
recorded by the ROGER VIVIER brand, which is increasingly be coming a point of reference in the
most exclusive luxury segment: sound growth in sales of the brand in all geographical areas in
which it is distributed, except only for the USA due to the factors commented on above which are
affecting this market.
As regards the Group’s organisation, some changes were made in the team of managers, which
allowed the recruitment of new professionals, with different experience and also coming from
other sectors, with the aim to provide different approaches and to boost deve lopment of
business strategies and future projects.
As regards its business development, the Group continued to definitely invest in digital media, a
key sales and communication channel that is suddenly revolutionising the business model
adopted by all players in the sector, thus significantly increasing the number of events and ways
of interaction with global consumers. The objective is to accompany the customer according to a
360-degree approach, offering an increasingly advanced and rewarding brand exper ience and
making purchase experience more fluid among different channels, both physical and digital. In
this context there also was the renewal of the strategic partnership agreement with Italiantouch
S.r. l. for f ive additional years, for the development o f the Group’s e-commerce channel, in order
to achieve new key targets through digital innovation, the development of already existing
markets and the implementation of the channel in new geographical areas.
The investments made in the year were mainly ded icated to the development of DOS network and
to relocations and renovations of existing stores, as well as to the start -up of pop-up store
projects, characterised by increasingly new and different interiors and approaches, but with an
image consistent with that of the brands. Furthermore, the new plant in Arquata del Tronto was
constructed and inaugurated, which will employ young people working in the area, thus giving
tangible signs of the Group’s commitment in support of the population living in the March e town
and adjacent areas, which were hit by earthquake in August 2016.

2 0 1 7 A n n u a l R e p o r t
13 Report on operations
The Group’s results in 2017
Consolidated sales were 963.3 mill ion euros, decreased by 4.1% in respect to 2016 turnover when
it was 1,004 mill ion euros. The impact of currency fluctuations was negative: at constant exchange
rates, sales revenue would have been 973.4 million euros, showing a reduction of 3.1% in respect to
2016. Operating margins, EBITDA and EBIT, were 160.5 mill ion euros and 111.8 mi ll ion euros
respectively (while at a constant exchange rate would have been 163 and 113.6 million euros).
Consolidated net profit was 69.4 mill ion euros, decreased by 16.4 mill ion euros in respect to 85.8
mill ion euros of the previous year 2016 .
euro 000's
Main economic indicators Year 17 Year 16 Change %
Sales Revenues 963,287 1,004,021 (40,735) (4.1)
EBITDA 160,492 180,908 (20,415) (11.3)
Deprec., amort., write-downs and advances (48,732) (52,547) 3,814 (7.3)
EBIT 111,760 128,361 (16,601) (12.9)
Profit before taxes 101,897 114,967 (13,070) (11.4)
Profit for the period 69,362 85,768 (16,407) (19.1)
Foreign exchange impact on revenues 10,089
Adjusted Sales Revenues 973,376 1,004,021 (30,645) (3.1)
Foreign exchange impact on operating costs (7,604)
Adjusted EBITDA 162,978 180,908 (17,930) (9.9)
Foreign exchange impact on deprec.& amort. (685)
Adjusted EBIT 113,561 128,361 (14,800) (11.5)
EBITDA % 16.7 18.0
EBIT % 11.6 12.8
Adjusted EBITDA % 16.7 18.0
Adjusted EBIT % 11.7 12.8
Tax Rate % 31.9 25.4
In order to get a full comparability of 2017 results with previous year results, note that EBITDA and
EBIT at December 31st
, 2016, net of non-recurring transactions for a net amount of 0.8 million euros,
were 180.1 and 127.6 million euros respectively for a ratio on sales revenue of 17.9% and 12.7%. Note
that non-recurring transactions didn’t occur during the year 2017.

2 0 1 7 A n n u a l R e p o r t
14 Report on operations
euro 000's
Main Balance Sheet Indicators 12.31.17 12.31.16 Change
Net working capital (*) 261,346 279,230 (17,883)
Intangible and tangible fixed assets 802,937 822,523 (19,587)
Other current assets/liabilities 13,530 24,109 (10,579)
Net assets held for sale
Invested capital 1,077,813 1,125,862 (48,049)
Net financial position 9,339 (35,381) 44,720
Shareholders' equity 1,087,152 1,090,481 (3,329)
Capital expenditures 36,627 449,908 (413,281)
Net cash flows from operating activities 148,195 149,684 (1,489)
Cash flow generated/(used) (6,293) 7,929 (14,223)
(*) Trade receivable + inventories - trade payables
Revenues. Tod’s Group consolidated sales were 963.3 million euros in FY 2017, down 4.1% from FY
2016. In Q4 2017, even if the trend was s lightly negative, it is better than in the first nine months of
the year. At constant exchange rates, meaning by using FY 2016 average exchange rates, including the
related effects of hedging derivatives, sales would have been 973.4 million Euros ( -3.1% from the
previous year). In FY 2017, sales through DOS totalled 621.1 million euros, representing approx. two
constant exchange rates registered by the DOS already existing as of January 1st
, 2016, is -2.8% in the
fiscal year. As of December 31st
, 2017 the Group’s distribution network was composed by 275 DOS and
112 franchised stores, compared to 272 DOS and 107 franchised stores as of December 31st
, 2016.
Revenues to third parties totalled 342.2 million euros; the 8.4% decrease from FY 201 6 is due to the
weakness experienced by some important markets, such as Italy and USA.
thirds of consolidated
turnover. The change in
respect to previous year
is -1.5%, while at
constant rates, the value
is broadly in line with the
figure of last year. The
Same Store Sales Growth
(SSSG) rate, calculated as
the worldwide average of
sales growth rates at
(euro mn) FY 17 % FY 16 %% current
exch. rates
% constant
exch. rates
DOS 621.1 64.5 630.3 62.8 (1.5) 0.1
Third Parties (WS) 342.2 35.5 373.7 37.2 (8.4) (8.4)
Total 963.3 100.0 1,004.0 100.0 (4.1) (3.1)
DOS64.5%
Third Parties
(WS)35.5%
DOS DOS
Third Parties
(WS)
Third Parties
(WS)
0
100
200
300
400
500
600
700
800
900
1,000
FY 17 FY 16
DOS64.5%
Third Parties
(WS)35.5%
DOS DOS
Third Parties
(WS)
Third Parties
(WS)
0
200
400
600
800
1,000
FY 17 FY 16

2 0 1 7 A n n u a l R e p o r t
15 Report on operations
203.9 million euros; the decrease is mainly due to the weakness of the Italian market, while the
results abroad are positive, on both the retail and the wholesale channels. ROGER VIVIER totalled
179.3 million euros in sales, up 7.8% from FY 2016 (9.7% at constant exchange rate). Positive results
in all the main markets. Finally, revenues of the FAY brand were 63.5 million euros, up 1.4% from FY
2016. The brand registered positive results both in Italy and in the European countries.
Sales of leather goods and accessories totalled 135.8 million euros, down 3.6% f rom FY 2016 at
constant exchange rate (-4.7% at current exchange rate). Finally, sales of apparel were 68.7 million
TOD’S sales totalled 515.7
million euros in FY 2017;
the 7.7% decrease, as
compared to the previous
year (6.6% at constant
exchange rate), is mainly
due to the trend of shoes,
also penalized by some
delays in deliveries,
which occurred at the
start of the season, and
were not recovered.
HOGAN revenues were
(euro mn) FY 17 % FY 16 %% current
exch. rates
% constant
exch. rates
TOD'S 515.7 53.5 559.0 55.7 (7.7) (6.6)
HOGAN 203.9 21.2 214.2 21.3 (4.8) (4.5)
ROGER VIVIER 179.3 18.6 166.3 16.6 7.8 9.7
FAY 63.5 6.6 62.6 6.2 1.4 1.4
Other 0.9 0.1 1.9 0.2 n.s. n.s.
Total 963.3 100.0 1,004.0 100.0 (4.1) (3.1)
TOD'S53.5%
HOGAN21.2%
ROGER VIVIER18.6%
FAY6.6%
TOD'S TOD'S
HOGANHOGAN
RVRV
FAYFAY
0
200
400
600
800
1,000
FY 17 FY 16
Revenues from shoes
were 757.9 million euros,
down 3.2% at constant
exchange rate from FY
2016, but showing a
visible improvement in
the fourth quarter. Due
to its greater exposure to
the wholesale, this
category is also the most
affected by the weakness
of this channel (-4.2% at
current exchange rate).
(euro mn) FY 17 % FY 16 %% current
exch. rates
% constant
exch. rates
Shoes 757.9 78.7 791.3 78.8 (4.2) (3.2)
Leather goods 135.8 14.1 142.5 14.2 (4.7) (3.6)
Apparel 68.7 7.1 68.3 6.8 0.5 0.6
Other 0.9 0.1 1.9 0.2 n.s. n.s.
Total 963.3 100.0 1,004.0 100.0 (4.1) (3.1)
Shoes78.7%
Leather goods14.1%
App.7.1%
Other0.1%
Shoes Shoes
Leather goods
Leather goods
App.App.
0
200
400
600
800
1,000
FY 17 FY 16

2 0 1 7 A n n u a l R e p o r t
16 Report on operations
euros, broadly in line with 2016 and reflect FAY’s performance. In FY 2017, domestic sales were 298.2
million euros; the 4.3% decrease from FY 2016 is mainly due to the weakness of the wholesale
million euros, down 19.3% from FY 2016. The Group’s revenues in Greater China totalled 212 million
euros, up 3.0% at constant exchange rate from FY 2016. Mainland China, which represents more than
half of this region, registered positive results; Hong Kong and Taiwan are still negative, even if
showing some timid signs of improvement.
Finally, in the area “Rest of the World” the Group’s sales were 130 milli on euros, down 3.5% at
constant exchange rate from FY 2016 (-4.1% at current exchange rate). In the fourth quarter of the
year, Japan recorded a strong improvement in results, while the Korean market remains difficult.
Operating results. In 2017 the Group’s EBITDA came to 160.5 mill ion euros (180.9 mill ion euros
in 2016), accounting for 16.7% of consolidated revenues (18% in 2016).
The exchange rates being equal, or with the application of average cross rates from the previous
period, EBITDA would come to about 163 mill ion euros.
A slight improvement was recorded at gross margin level, which confirmed the excellent
positioning of the Group’s brands in the “high -end” luxury segment and the abi lity to achieve
revenues in product segments and geographical ar eas that generate higher profit margins. This
result, together with the positive effects of the plan to optimise structure costs and to improve
processes, allowed the mitigation of the impact on EBITDA arising from a normal increase in
operating costs in support of growth strategies.
channel, mainly in
secondary cities. In the
rest of Europe, the
Group’s revenues totalled
245.1 million euros,
broadly in line with FY
2016 if compared at
constant exchange rate.
The retail network posted
positive results, while the
wholesale channel was
weak. In the Americas
sales amounted to 78
(euro mn) FY 17 % FY 16 %% current
exch. rates
% constant
exch. rates
Italy 298.2 31.0 311.5 31.0 (4.3) (4.3)
Europe 245.1 25.4 250.0 24.9 (2.0) (0.2)
Americas 78.0 8.1 96.7 9.6 (19.3) (19.1)
Greater China 212.0 22.0 210.3 21.0 0.8 3.0
RoW 130.0 13.5 135.5 13.5 (4.1) (3.5)
Total 963.3 100.0 1,004.0 100.0 (4.1) (3.1)
Italy31.0%
Europe25.4%
Americas8.1%
Greater China22.0%
RoW13.5%
Italy Italy
Europe Europe
Americas AmericasRoW
RoW
Greater China
Greater China
0
100
200
300
400
500
600
700
800
900
1,000
FY 17 FY 16
Italy31.0%
Europe25.4%
Americas8.1%
Greater China22.0%
RoW13.5%
Italy Italy
Europe Europe
Americas AmericasRoW
RoW
Greater China
Greater China
0
100
200
300
400
500
600
700
800
900
1,000
FY 17 FY 16
Italy31.0%
Europe25.4%
Americas8.1%
Greater China22.0%
RoW13.5%
Italy Italy
Europe Europe
Americas AmericasRoW
RoW
Greater China
Greater China
0
100
200
300
400
500
600
700
800
900
1,000
FY 17 FY 16
Italy31.0%
Europe25.4%
Americ.8.1%
Greater China22.0%
RoW13.5%
Italy Italy
Europe Europe
Americas AmericasRoW
RoW
Greater China
Greater China
0
200
400
600
800
1,000
FY 17 FY 16

2 0 1 7 A n n u a l R e p o r t
17 Report on operations
Furthermore, the effects on EBITDA for the period were also positive, which arose from the
property operations connected with some major relocations of DOSs within the framework of the
strengthening of the DOS network.
Costs for leases and rentals ( locations and royalties
payable) came to 118.2 mill ion euros, showing a
slight increase compared to 2016 (117.4 mill ion
euros). The impact on revenues passed from 11.7%
in 2016 to 12.3% of the current period. The
increase is due to the rise of rental costs in the
direct distribution network, which was the obvious
consequence of the expansion of the DOS network
(the number of DOS reported an increase of 16
during the period from December 2016 to
December 2017).
EBITDA (euro mn)
163.0 160.5
180.9
FY 17 comp. ex.rate basis
FY 17 FY 16
Increased the cost incurred for salaries payable to the
personnel working for the Group coming to 191.5
million euros in 2017 against 186.2 million euros in 2016.
The increase in the expense was mainly due to the
number of staff members as a result of the expansion
of the direct distribution network, the strengthening of
Group production capacity and other costs related to
changes occurred among top managers at a corporate
level. At December 31s t
, 2017 the number of
employees are 4,627 showing an increase of 142
people with respect to December 31s t
, 2016,
accounting for 19.9% of the Group revenues in 2017
against 18.5% in 2016.
GROUP’S EMPLOYEES
4,627
4,485
4,550
4,297
FY 17 FY 16 FY 15 FY 14
in 2017 amortisation/depreciation and write -downs of f ixed assets amounted to 46.7 mill ion
euros against 50.6 mill ion euros in 2016, and includ ed write-downs for impairment of f ixed
intangible and tangible assets for 2.5 mill ion euros (4.4 mill ion in 2016 euros). At December 31s t
,
2017 amortisation and depreciation accounted for 4.6% of the Group revenues, substantially in
l ine with the value posted in the previous year (4.6%).

2 0 1 7 A n n u a l R e p o r t
18 Report on operations
Net of additional provisions totalling 1.8 mill ion
euros, EBIT for the period came to 111.8 mill ion
euros (128.4 mill ion euros in 2016), showing a
reduction of 16.6 mill ion euros and accounting for
11.6% of consolidated sa les (12.8% in 2016). The
exchange rates being equal, EBIT or the period
would come to 113.6 euros mill ion.
EBIT (euro mn)
113.6111.8
128.4
FY 17 comp. ex.rate basis
FY 17 FY 16
The balance of f inancial income and costs, which
posted a negative value of 9.2 mill ion euros, was
affected by the performance of cross rates of some
currencies with which the Group operates. Interest
expense on loans decreased from 2.7 mill ion euros in
2016 to 1.6 mill ion euros in 2017 thanks to the step -
by-step reduction of the indebtedness versus
external banks.
FINANCIAL INC/EXP. (euro mn)
-5.3
-1.1
-2.8
Foreign exch. gains& losses
Net interest Other
Income taxes for the year amounted to 32.5 mill ion
euros, including the effects of deferred taxes, at a
tax rate that comes to 31.9%, showing an increase
compared to 25.4% in 2016, which was mainly due to
the impact of the US tax reform and the prudential
write off of some deferred tax assets on previous
year fiscal losses related to some subsidiaries.
Previous year tax rate also benefited of the “patent
box” contribution related to two fiscal years (2015
and 2016).
Tax Rate
31.9%
25.4%
32.9% 33.0%
FY 17 FY 16 FY 15 FY 14

2 0 1 7 A n n u a l R e p o r t
19 Report on operations
At December 31s t
, 2017 the 2017 consolidated profit, equal to 69.4 mill ion euros (against 85.8
mill ion euros in 2016), accounted for 7.2% of consolidated revenues against 8.5% in 2016.
Capital expenditures. Capital expenditures in the 2017 financial year totalled 36.6 mill ion euros
while in the previous year they w ere 34.9 mill ion euros (net of investments for the acquisition of
the ROGER VIVIER brand, equal to 415 mill ion euros).
36.6 34.9 (*)
47.9
64.5
51.4
FY 17 FY 16 FY 15 FY 14 FY 13
Property Plant and Equipment & Intanglible assets Capital expenditures(euro mn)
(*) I t doesn’t inc lude the investment for ROGER VIVIER brand acquis it ion , for 415 mi l l ion euros .
The Group invested an amount of a bout 19.6
mill ion euros (against 18.6 mill ion euros at
December 31s t
, 2016) in the setting up of
new DOS, including the boutique TOD’S in
Vienna (Austria) and Boston (USA) , and in
the renovations and relocations of existing
stores.
Capital expenditures for production amount
to 9.7 mill ion euros, among which it is
highlighted, for relevance, the building up
of the new plant in Arquata del Tronto.
INVESTMENTS BY ALLOCATION
DOS53%
Produc.27%
Other20%

2 0 1 7 A n n u a l R e p o r t
20 Report on operations
The remaining amount of investments for the year was allocated to the normal process of
refurbishment of facil ities and upgrading of industrial equipment (mainly forms, dies and
moulds), as well as to the development of business management systems (software) among which
the ones related to the digital channel.
Net financial position and cash flow. At December 31
s t, 2017 the net f inancial position posted a
positive value of 9.3 mill ion euros ( it was negative for 35.4 mill ion euros at December 31s t
, 2016),
and it is formed by Cash and cash equivalents (cash and bank deposits) for 221.6 mill ion euros
(227.7 mill ion euros at December 31s t
, 2016) and financial l iabilities for 212.3 mill ion euros
(263.1 mill ion euros at December 31s t
, 2016), of which 147.6 mill ion euros as non -current
financial l iabilities (197.1 mill ion euros at December 31s t
, 2016).
euro 000's
Net financial position 12.31.17 12.31.16 Change
Current financial assets
Cash and cash equivalents 221,609 227,706 (6,097)
Cash 221,609 227,706 (6,097)
Current financial liabilities
Current account overdraft (15,910) (15,714) (196)
Current share of medium-long term financing (48,743) (50,234) 1,491
Current financial liabilities (64,654) (65,948) 1,295
Current net financial position 156,956 161,758 (4,802)
Non-current financial liabilities
Financing (147,617) (197,139) 49,523
Non-current financial liabilities (147,617) (197,139) 49,523
Net financial position 9,339 (35,381) 44,720
Gross of distributed dividends the NFP at December 31
s t, 2017 would amount to 65.6 mill ion
euros (+101 mill ion euros compared to the value posted at the beginning of the year).
euro 000's
Statement of cash flows Year 17 Year 16
Net Cash and cash equivalents at the beginning of the period 211,993 204,063
Cash flows from operating activities 165,764 212,587
Interests and taxes collected/(paid) (17,569) (62,903)
Net cash flows from operating activities 148,195 149,684
Cash flow generated (used) in investing activities (35,868) (466,478)
Cash flow generated (used) in financing activities (105,972) 318,273
Translation differences (12,648) 6,450
Net Cash and cash equivalents at the end of the period 205,699 211,993

2 0 1 7 A n n u a l R e p o r t
21 Report on operations
Operating activities during the year generated cash of 165.8 mill ion euros (agains t 212.6 mill ion
euros in 2016). In order to get a full comparability of 2017 results with previous year results, note
that cash flows from operating activities of the year 2016, net of non -recurring transactions,
amounted to 187.6 mill ion euros. Net of tax es and interest expense, Cash Flows from operating
activities amounted to 148.2 mill ion euros (149.7 mill ion euros at December 31s t
, 2016).
Cash flows from investing activities represent cash flows invested in fixed assets. Cash flows from
financing activ ities are related to both the reimbursement of outstanding loans and distribution
of dividends for 56.3 mill ion of euros.
Report on operations of parent company TOD’S S.p.A.
The performances recorded by the Company during the year just ended were affecte d by the
market trends commented on above. Sales during the year came to 662.6 mill ion eurso, recording
an increase of 4.0% compared to 637.2 mill ion euros in 2016. However, revenues for the previous
period included the recognition of a non -recurring item concerning a provision for returns, for
26.3 mill ion euros, relating to some products stocked at the Company’s subsidiaries, as a result
of the redefinition of distribution strategies. Without considering the effects of this non -
recurring transaction, revenues for the 2017 financial year would be substantially in l ine with
those achieved in the previous year. Based on constant exchange -rates, i.e. using the same
average exchange rates prevailing in 2016, revenues would be instead equal to 665.3 mill ion
euros.
EBITDA and EBIT for the year amounted to 132.4 and 112.7 mill ion euros, accounting for 20% and
17%, respectively. Based on constant exchange rates, gross and net operating margins would be
equal to 134.5 and Euro 114.8 mill ion euros, respectively, accou nting for 20.2% and 17.3% of
revenues. Net profit for the year amounted to 85 mill ion euros.
euro 000's
Main economic indicators Year 17 Year 16 Change %
Sales revenues 662,576 637,231 25,345 4.0
EBITDA 132,393 120,279 12,114 10.1
Deprec., amort., write-downs and advances (19,647) (20,324) 677 (3.3)
EBIT 112,746 99,955 12,791 12.8
Profit before taxes 111,866 89,477 22,389 25.0
Profit for the year 84,977 64,180 20,796 32.4
Foreign exchange impact on revenues 2,749
Adjusted sales revenues 665,324 637,231 28,093 4.4
Impact on operating cost (655)
Adjusted EBITDA 134,487 120,279 14,208 11.8
Adjusted EBIT 114,792 99,955 14,837 14.8
EBITDA % 20.0 18.9
EBIT % 17.0 15.7
Adjusted EBITDA % 20.2 18.9
Adjusted EBIT % 17.3 15.7

2 0 1 7 A n n u a l R e p o r t
22 Report on operations
In order to get a full comparability of 2017 results with previous year results, note that EBITDA and
EBIT at December 31st
, 2016, net of non-recurring transactions, were 131.1 and 110.7 million euros
respectively for a ratio on sales revenue of 20.6% and 17.4%. Note that non -recurring transactions
didn’t occur during the year 2017.
euro 000's
Main Balance Sheet indicators 12.31.17 12.31.16 Change
Net working capital (*) 189,840 207,973 (18,133)
Intangible and tangible fixes assets 258,643 261,428 (2,785)
Other current assets/liabilities 533,675 506,480 27,194
Invested capital 982,158 975,882 6,276
Net financial position (73,945) (96,912) 22,967
Shareholders' equity 908,213 878,970 29,243
Capital expenditures 15,687 13,250 2,437
Net operating cash flows 94,490 143,846 (49,355)
Cash flows generated/(used) 12,813 2,294 10,519
(*) Trade receivables + inventories - trade payables
Revenues. In the following table a breakdown of revenues, compared with the previous year, not
including the non-recurring operations of the period for a better comparability:
euro 000's
FY 17 % FY 16 % Change %
Brand
TOD'S 325,709 49.2 332,494 50.1 (6,785) (2.0)
HOGAN 173,416 26.2 180,478 27.2 (7,062) (3.9)
FAY 57,675 8.7 56,431 8.5 1,244 2.2
ROGER VIVIER 100,876 15.2 88,786 13.4 12,089 13.6
Other 4,901 0.7 5,321 0.8 (420) (7.9)
Total 662,576 100.0 663,511 100.0 (935) (0.1)
Product
Shoes 506,876 76.5 512,489 77.2 (5,612) (1.1)
Leather goods 88,403 13.3 85,106 12.8 3,298 3.9
Apparel 62,395 9.4 60,610 9.1 1,785 2.9
Other 4,901 0.7 5,307 0.8 (406) (7.6)
Total 662,576 100.0 663,511 100.0 (935) (0.1)
Region
Italy 253,496 38.3 271,278 40.9 (17,782) (6.6)
Europe 181,206 27.3 187,869 28.3 (6,663) (3.5)
Americas 52,568 7.9 55,123 8.3 (2,555) (4.6)
Greater China 130,755 19.7 104,557 15.8 26,198 25.1
RoW 44,550 6.7 44,683 6.7 (134) (0.3)
Total 662,576 100.0 663,511 100.0 (935) (0.1) In 2017 revenues from TOD’S brand came to 325.7 mill ion euros, showing a decrease of 2%; the
Mainland China market recorded a good performance, in particular in the DOS channel. The
HOGAN brand recorded revenues of 173.4 mill ion euros, with a 3.9% difference compared to
2016, which was mainly l inked to the weakness of the Italian market. The FAY brand r ecorded

2 0 1 7 A n n u a l R e p o r t
23 Report on operations
sales of 57.7 mill ion euros, up by 2.2% compared to 2016 and positive results both in Italy and in
European countries. The ROGER VIVIER brand achieved revenues of 100.9 mill ion euros (88.8
mill ion euros in 2016), showing an increase of 13.6% compar ed to 2016 and confirming its appeal
to international customers.
As regards product categories, sales data confirm the Company’s leading position in the core
business of footwear, whose revenues amounted to 506.9 mill ion euros (512.5 million euros at
December 31s t
, 2016), accounting for 76.5% of turnover, in 2017. Revenues from leather goods
and accessories, which amounted to 88.4 mill ion euros (85.1 mill ion euros at December 31s t
,
2016), recorded an increase of 3.9% compared to the previous year. Sales fr om apparel came to
62.4 mill ion euros (60.6 million euros at December 31s t
, 2016); the performance was the same as
that of the FAY brand.
Revenues from domestic market were affected by the weakness of the wholesale channel, above
all in the cities of the province. In Europe, revenues amounted to 181.2 mill ion euros, recording a
change of 3.5% compared to 187.9 mill ion euros in 2016. Revenues in American markets reported
a fall of 4.6% compared to 2016, while in the Greater China region there was a consider able
increase in revenues from sales (+25.1% compared to 2016), which was positively affected by the
performances recorded in the Mainland China region. The “Rest of the world” area recorded
revenues of 44.5 mill ion euros (44.7 mill ion euros in 2016), subs tantially in l ine with the value
posted in the previous year.
Operating results. In 2017 EBITDA amounted to 132.4 mill ion euros, accounting for 20% of sales,
while the previous year EBITDA was 120.3 mill ion euros, showing a margin of 18.9% (20.6% net of
non-recurring transactions).
The exchange rates trend had a negative impact; based on constant exchange rates, i .e. using the
average exchange rates applied in 2016, EBITDA would come, in fact, to 134.5 mill ion, accounting
for 20.2% of revenues.
Personnel costs amounted to 86.8 mill ion euros (83 mill ion euros in 2016), accounting for a
percentage of revenues from sales of 13.1% in l ine with the previous year when it was 13%.
In 2017 amortisation and depreciation amounted to 17.6 mill ion euros (18.7 mill ion euros in
2016), accounting for 2.7% of revenues (2.9% in 2016). Net of provisions of 2 mill ion euros, EBIT
for the period from January to December 2017 came to112.7 mill ion euros. At December 31s t
EBIT amounted to 17% of the Company’s sales. Based on cons tant exchange rates this ratio
would come to 114.8 mill ion euros, accounting for 17.3% of turnover.
In 2016 operating results had been equal to 100 mill ion euros, accounting for 15.7% of revenues
(17.4% net of non-recurring transactions).
Financial income and costs for the year showed a negative balance for 8.2 mill ion euros, which
was affected by the performance of cross rates of some currencies with which the Company

2 0 1 7 A n n u a l R e p o r t
24 Report on operations
operates and it includes, for about 1.1 mill ion euros, interest expenses on outstandin g loans,
decreased in respect of 2016 (1.9 mill ion euros) thanks to the reduction of the indebtedness
versus banks.
The income from equity investments shows a positive result for 7.3 mill ion euros, mainly thanks
to dividend received for 8.1 mill ion euros and the write off of equity investments for 0.5 mill ion
euros.
After considering a tax effect, for current and deferred income tax, totalling 26.9 mill ion euros (
38.3 mill ion euros in 2016), at a tax rate of 24% against 28.3% in 2016, the net result for the
period came to 85 mill ion euros, against 64.2 mill ion euros in 2016. The tax rate for the year
benefited from the reduction of current applicable rate, in addition to the effect of collected
dividends. At December 31s t
, 2017 net profit accounted for 12.8% of revenues.
Capital expenditures. Capital expenditures made in the 2017 financial year amounted to 15.7
million euros, as against the 13.3 mill ion euros in 2016, mainly invested in the building up of the
new plant in Arquata del Tronto further to t he normal processes of modernisation of facil ities
and industrial equipment. In particular about 4.1 mill ion euros have been invested for the
purchase of additional industrial equipment for the creation of the collections (lasts and moulds ).
A significant quota of investments, 2.5 million euros in the year, was also allocated to the
development of the company information systems.
Net financial position (NFP). At December 31
s t, 2017, the net financial position was negative for
73.9 million euros (against a positive value of 96.9 million at December 31s t
, 2016).
Other current financial assets are related to a loan granted to subsidiary Roger Vivier S.p.A.,
partially reimbursed in advance on January 2017 (for 13 million euros) and on December 2017 (for
23 million euros).
At December 31s t
, 2017 the financial debt included the financial liability relating to the syndicated
loan agreement entered into with Mediobanca and Crédit Agricole in 2014.
euro 000'sNet financial position 12.31.17 12.31.16 ChangeCurrent financial assetsCash and cash equivalents 100,802 87,989 12,813
Other current financial assets 9,000 45,000 (36,000)
Current financial assets 109,802 132,989 (23,187)
Current financial liabilities
Current account overdraft
Current share of medium-long term financing (46,176) (46,289) 114
Current financial liabilities (46,176) (46,289) 114
Current net financial position 63,626 86,700 (23,074)
Non-current financial liabilities
Medium-long term financing (137,572) (183,612) 46,040
Non-current financial liabilities (137,572) (183,612) 46,040
Net financial position (73,945) (96,912) 22,967

2 0 1 7 A n n u a l R e p o r t
25 Report on operations
Operating activities during the year generated cash for 118 .4 million (against 192.6 million euros in
2016). In order to get a full comparability of 2017 results with previous year results, note that cash
flows from operating activities of 2016, net of non-recurring transactions, were 167.6 million euros.
Net of paid taxes and interest expense, net Cash Flows from operating activities amounted to 94.5
million euros (143.8 million euros at December 31s t
, 2016). Cash flows from investing activities,
amounted to 15.2 million euros and represent cash flows invested in fixed assets, while it was
418.4 million euros in 2016 including the capital increase that involved subsidiary Roger Vivier
S.p.A., which was subscribed and paid by TOD’S S.p.A. within the acquisition of the ROGER VIVIER
brand on the part of the subsidiary itself. Cash flows used for financing activities amounted to -66.5
million euros (cash flows generated from financing activities were 276.9 mill ion euros in 2016) and
they are mainly related to the reimbursement of the outstanding loans and distribution of
dividends to the shareholders. euro 000's
Statement of cash flows FY 17 FY 16
Net Cash and cash equivalents at the beginning of the period 87,989 85,696
Cash flows from operating activities 118,375 192,643
Interests and taxes collected/(paid) (23,884) (48,797)
Net cash flows from operating activities 94,490 143,846
Cash flow generated (used) in investing activities (15,169) (418,416)
Cash flow generated (used) in financing activities (66,509) 276,864
Net Cash and cash equivalents at the end of the period 100,802 87,989
Other Information
Statement pursuant to art. 2.6.2 paragraph 8 of the regulations for markets organized and
managed by Borsa Italiana S.p.A. In respect of Art. 36 of CONSOB Regulation no. 16191 of
October 29t h
, 2007 on conditions for the listing of companies that control entities formed or
governed under the laws of countries outside the European Union that are of material
significance to the financial statements, we report that 10 of the company’s direct or indirec t
subsidiaries fall under these provisions (Tod’s Korea Inc., Tod’s Shanghai Trading Co. Ltd, Roger
Vivier Shanghai Trading Co. Ltd, Tod’s Hong Kong Ltd, Roger Vivier Hong Kong Ltd., Tod’s Japan
KK, Deva Inc., An. Del. USA Inc. Flor Del. USA Inc., Cal. Del . Usa Inc.), that suitable procedures
have been adopted to ensure total compliance with said rules, and that the conditions stated in
Art. 36 have been satisfied.
Disclosure pursuant to Consob Resolution no. 17221 of March 12th, 2010 (Related Parties
Regulation). In 2017 the Group did not conclude highly significant transactions with related

2 0 1 7 A n n u a l R e p o r t
26 Report on operations
parties or related party transactions that had a material impact on the assets, l iabilities or net
income of the Group, and there were no modifications or developments in the transactions
described in the 2016 Annual Report that had the same effects.
All the information regarding existing relations with related parties in 2017 are set out in the
supplementary notes.
Management and coordination activities. Although TOD’S S.p.A. is subject to the control
(pursuant to Article 93 of Legislative Decree 58/1998) of DI.VI. Finanziaria di Diego Della Valle &
C. S.r. l. , neither this latter company or any other party has dictated policy or interfered in the
management of TOD’S S.p.A. (or any of the subsidiaries of TOD’S S.p.A.). Indeed, management of
the issuer and its subsidiaries was not subject to any influence by third parties outside the TOD’s
Group.
TOD’S S.p.A. is not subject to management and coordination by the parent co mpany DI.VI.
Finanziaria di Diego Della Valle & C. S.r. l. or any other party pursuant to Sections 2497 et seq.
Italian Civil Code.
Pursuant to the Corporate Governance Code, transactions that have a particularly significant
impact on TOD’s S.p.A. strategy, operations, assets, l iabilities, and financial position are subject
to exclusive review and approval by the Board of Directors of the issuer TOD’S S.p.A. Its members
include independent directors without executive responsibilities at the company, in accor dance
with the rules set out in Article 3 of the Corporate Governance Code.
The expertise and authority of the independent directors without executive responsibilities and
their material impact on decisions taken by the Board of Directors represent a furt her guarantee
that all decisions by the Board of Directors are taken exclusively on behalf of TOD’S S.p.A.
without being influenced by instructions or interference by third parties representing interests
opposed to the Company’s.
All subsidiaries of TOD’S S.p.A. are subject to management and coordination by the issuer. This
activity consists in defining the general strategic policies for the Group, the internal control and
risk management system, and the elaboration of general policies for management of the most
important operating drivers (human, f inancial, productive, marketing and communication
resources), without impairing the complete managerial and operating autonomy of the
subsidiaries.
Research and development. Given the particular nature of the Gro up’s production, research and
development activity consists of continuous technical/stylistic revision of models and constant
improvement of the materials used to realise the product.
Since this activity is exclusively ordinary, the associated costs are ch arged entirely to income in
the year that they are incurred, and thus recognised as normal production costs.

2 0 1 7 A n n u a l R e p o r t
27 Report on operations
Research and development costs, as defined above, have assumed major importance due to
operating realisation of projects connected with expansion o f the existing product l ine with new
types of merchandise that complement current ones. These will increase the number of brands
offered and stimulate increased sales to end customers.
Reconciliation of the result for the period and net equity of the Gro up with the
analogous values of the Parent Company. The following table il lustrates the reconciliation of
the result for the per iod and net equity of the Group with the analogous values of the Parent
Company, in accordance with CONSOB memorandum DEM/6064293 dated July 28t h
, 2006.
euro 000's
Net ProfitShare
equityNet Profit
Share
equity
Parent Company 84,977 908,213 64,180 878,970
(1,360) 244,388 1,063 280,095
(13,685) (13,685)
12,285 12,232
Others (*) (12,609) (64,929) 21,049 (70,401)
Minority interest (1,645) 880 (524) 3,269
Group 69,362 1,087,152 85,768 1,090,481
(*) Mainly dividends and intercompany profits
Goodwill from Business combination Group
12.31.17 12.31.16
Difference between book value of consolidated
Companies and net equity method valutation
Goodwill from Business combination Parent Company
Information on Share Capital. At December 31s t
, 2017 the Company’s share capital was divided
into 33,093,539 shares, with a par value of Euro 2 each, for a total nominal value of Euro
66,187,078, unchanged respect to 2016.
Own shares and shares or quotas of controlling companies. As of December 31
s t, 2017 the
Company did not possess any of its own s hare nor did it possess any shares or quotas of the
controlling companies, neither since the date on which the shares of the Company were listed on
the Milan Stock Exchange, the Company has not been a party to any transactions with reference
to its own shares.
Significant events occurred after the end of the period
In order to raise liquid funds necessary to finance any possible requirements arising from core
commercial operations and general business needs, the Parent Company entered into two loan
agreements with two major banks after the reporting date. On January 26t h
, 2018 a loan
agreement was entered into with Banco BPM S.p.A., which granted a 4 -year revolving credit
facil ity, in a maximum amount of 100 mill ion euros, which had not yet been used at the reporting
date. On January 29t h
, 2018 a loan agreement was entered into with Intesa Sanpaolo S.p.A., in an
2 0 1 7 A n n u a l R e p o r t
28 Report on operations
amount of 100 mill ion euros, which bears no charges and interest, to be repaid in a single
instalment on January 29t h
, 2019.
Business outlook
The results of the year were in l ine with expectations and the net f inancial position came back to
positive amounts thanks to a positive cash generation achieved in conne ction with both an
efficient management of net working capital and a rationalization of f ixed costs.
Very good is the feedback gathered by all the brands during the presentation of the collections of
the next Autumn / Winter which confirm the approval of the market for the creative evolution in
the interpretation of the Group iconic products. These positive signs, in addition to the expected
results from business strategies, lead to believe that the Group is on the right way to catch the
opportunities offered by the market and get back to the path of growth that has always
characterized its management.
Approval of Financial Statement and proposal for the allocation of the profit for
the period
The consolidated financial statements of the TOD’S Group and the separate financial statements
of TOD’S S.p.A. were approved today by the Board of Directors.
It is proposed to the shareholders meeting to approve the separate financi al statements of TOD’S
S.p.A. and the following allocation of the 2017 Company’s profit, which amounts to
84,976,553.79 euro:
i. 37,951,983.78 euros to the extraordinary reserve;
i i. 46,330,954.60 euros, to be distributed to shareholders in the form of a dividend of 1.4 euros
per share for each of the outstanding 33,093,539 shares;
i i i. 693,615.41 euros to the specific reserve for promoting territorial solidarity projects.
Milan, March 13
t h, 2018
The Chairman of the Board of Directors
Diego Della Valle

2 0 1 7 A n n u a l R e p o r t
29 Report on operations
Consolidated Non-Financial Statement - FY 2017 pursuant to articles 3 and 4 of Italian
Legislative Decree no. 254 of 2016
Letter to stakeholders
Last year brought many new developments and challenges that helped to make our Group even
stronger and more cohesive. However, in the current changing environment, the main challenge
is to continue to grow and continually improve, while maintaining a fair, constant and
transparent relationship with all our stakeholders. In this spirit, and in accordance with
regulations established b y Legislative Decree no. 254 of 2016 regarding non -financial
information, we have decided to proceed with one of the most significant developments of 2017,
namely our decision to work towards social accountability.
With our first Non-Financial Statement, relating to the 2017 financial year, we intend to
demonstrate to all our stakeholders our propensity towards sustainable action, an inclination
that has been an integral part of our Group from the outset, distinguishing its work.
Our history has always been based on the values of tradition and innovation, ethics, solidarity
and Italian spirit, core principles that have allowed our Group to grow in a transparent, mindful
manner with an emphasis on continuous improvement.
Over the years, we have applied our founding values to numerous projects and initiatives of
national and international scope for the benefit of our employees, our associates, the local area,
the community and the environment.
We are proud of the significant milestones that were achieved in 2017: f irst of all, we made
sustainability part of our corporate governance by voluntarily assigning the Independent
Directors Committee with the further role of supervising sustainability issues related to the
company’s business and to its interactions w ith all its stakeholders.
Furthermore, this year we continued our old projects and launched new initiatives to benefit our
stakeholders, conscious of our role in the national and international context and of our desire to
work to promote the well -being of all those who interface with our Group.
We are aware that what we have done so far is just the beginning of a journey of continuous
development and improvement: we are embracing this challenge with great pleasure and
commitment in the knowledge that we c an contribute, in our own small way, to building a better
and increasingly sustainable future.

2 0 1 7 A n n u a l R e p o r t
30 Report on operations
Methodological note
TOD’S Group’s (hereinafter also the “Group” or “TOD’S”) f irst Non -Financial Statement is a tool
to transparently and articulately descri be the economic, social and environmental results
achieved by the Group and demonstrates the Group’s commitment to sustainable development,
with the aim of creating value not only for itself, but also for its stakeholders.
This document also responds to the obligation to report non-financial information set out in
Legislative Decree no. 254 of 30 December 2016 (hereinafter “Decree 254”), which TOD’S S.p.A. is
subject to.
This Non-Financial Statement relates to the 2017 financial year (from 1 January to 31 December)
and was prepared in accordance with articles 3 and 4 of Decree 254 and with the GRI
Sustainability Reporting Standards defined in 2016 by the GRI - Global Reporting Initiative,
according to the “In accordance - Core” option. This document also fo llows the “Guidelines on
non-f inancial reporting” (2017/C 215/01) issued by the European Commission on 26 June 2017.
The present document aims to describe to its stakeholders the management model and policies
practised by the Group in relation to sustainab ility, describing the most significant results
achieved in the financial year in question, to the extent necessary to ensure understanding of the
company’s business, performance, results and impact, covering environmental and social issues
and issues relat ing to staff, to respecting human rights and to the fight against active and passive
corruption, which are relevant considering the company’s activities and characteristics and
stakeholders’ expectations, as i l lustrated in the materiality analysis containe d in this document.
The process of collecting data and information to draft this Non -Financial Statement was
managed in collaboration with TOD’S Group’s corporate functions, with the aim of providing a
clear and precise indication of the information consi dered significant for the stakeholders
according to the principles of accuracy, balance, clarity, comparability, reliability and timeliness
set out in the GRI guidelines.
The scope of the data and information reported in this Statement is l imited to the fully
consolidated companies in TOD’S Group as at 31 December 2017, which are grouped into the
following regions: Italy, Europe, Greater China, Americas and Rest of the World1.
Any specifications and exceptions to the reporting scope2 are duly noted in the relevant sections.
This document provides adequate data and information to the extent necessary to ensure
understanding of the Group’s business, performance, results and impact.
1 For more information on the fully consolidated companies in TOD’S Group, please refer to the specific section of
the Group’s Annual Financial Report for 2017. 2 In cases of limitations, the scope coverage was calculated as a percentage of the total number of Group employees
at the end of the reference year.

2 0 1 7 A n n u a l R e p o r t
31 Report on operations
With reference to what is required by article 3, paragraph 2 of Decree 254, some information is
not included in this document because it is deemed not to be relevant to the provision of a non -
f inancial report to the extent necessary to ensure understanding of the Group’s business,
performance, results and impact.
Where available, data relating to previous years is shown for comparative purposes only, in order
to allow an assessment of the performance of the Group’s activities over a longer period of time.
Moreover, the chapters of the Non -Financial Statement report quantitative i nformation for which
estimates have been used.
Finally, to facil itate reading of the document, it should be noted that the following terms have
been used:
“The Parent Company” and “The Company” with reference to TOD’S S.p.A.;
“The Group” with reference to TOD’S Group (Parent Company and fully consolidated
companies);
“Italy” with reference to the area that is home to the business of TOD’S S.p.A., Del.Com. S.r. l.,
Del. Pav. S.r. l. , Filangieri 29 S.r. l. , Re.Se.Del. S.r. l. and Roger Vivier S.p.A.
Envisaging a path of continuous improvement related to sustainability aspects, the Group has
outlined a development plan for project activities over the 2018 -2020 three-year period in the
following areas:
development of a sustainability policy and plan, setting out the Group’s principles, goals and
commitments regarding the relevant issues, by the end of 2018;
definition of the supplier code of conduct, based on international conventions and standards
(ILO, UN) and sharing with the main categories of suppliers (contr actors, external workshops and
relevant suppliers of raw materials and components) by 2019;
planning and conducting of third-party production chain audits focused on environmental and
social issues, human rights, health and safety, and ethical principles, by the end of 2019;
design and implementation of a corporate climate survey, by 2018;
organisation of workshops to spread sustainability culture within the Group, by 2018;
formalisation of policies regarding personnel management issues by the end of 2019 f or
Italian companies and subsequent extension to the Group’s other companies, in order to
standardise actions and behaviour in the various regions in which the Group operates;
formalisation of the Group’s environmental policy by the end of 2019;
start of the implementation of the ISO 14001 environmental management system, by 2019;
start of the implementation of the OHSAS 18001 health and safety management system, by
2020;

2 0 1 7 A n n u a l R e p o r t
32 Report on operations
formalisation of the Group’s anti -corruption policy by 2018.
This document was approved by the TOD’S S.p.A. Board of Directors on 13 March 2018 and, in
accordance with the provisions of Legislative Decree 254 of 2016, was assessed for compliance by
independent auditor PriceWaterhouseCoopers S.p.A. and published on the company’s website
www.todsgroup.com.
To request more information about TOD’S Group’s sustainability strategy and the contents of this
Non-Financial Statement, please contact the following address: [email protected]
1. Approach to sustainability
For TOD’S Group, sustainability means conducting its activities with an eye to the future and
focusing its business strategy on creating value for stakeholders in the medium and long -term.
The Group’s sustainability strategy is geare d around three core values that have always been key
to its identity:
tradition and innovation , the result of over a century of quality and excellence, based on
passion, creativity and the promotion of Made in Italy production, elements that are inseparab le
from the outstanding quality of the products made by the Group’s brands;
ethics , namely the continuous pursuit of honesty, fairness, confidentiality, transparency and
reliability in its relationship with all stakeholders;
solidarity and Italian spirit , in other words responsibility towards the community (with a
focus on the most vulnerable people, both locally and internationally) and towards the area in
which the Group is present (with the aim of enhancing Italy’s image throughout the world).
These values are reflected in numerous annual and long -term sustainability initiatives that the
Group undertakes, evidencing its commitment to its stakeholders and to the context in which it
operates.
Strengthened by its values and aware of its commitment to uph old and continually develop them,
the Group has taken steps towards sustainability reporting in order to demonstrate its economic,
social and environmental impact on the local area and the community, while constantly
monitoring this impact and striving to improve.
1 . 1 I n t e r a c t i o n w i t h s t a k e h o l d e r s
Openness, dialogue and constant interaction with internal and external stakeholders are
essential to the company’s pursuit of its goals. This approach allows the Group not only to

2 0 1 7 A n n u a l R e p o r t
33 Report on operations
understand the needs, interests and expectations of its stakeholders, but also to identify the best
ways to generate shared value in the medium and long -term.
Starting from its own characteristics, activities and awareness of its role in the context in which
it operates, TOD’S Group has carried out internal analysis, which involved the management, to
identify the categories of stakeholders with which it interfaces in the course of its activities. The
results of this analysis, integrated and compared with what emerged from a careful benc hmark
analysis aimed at a mapping current trends, including among its main competitors, and national
and international best practices, led to the identification of 11 categories of stakeholders that
can influence or be influenced by the Group’s activities.
The map of TOD’S Group stakeholders
The Group’s approach to its stakeholders is aimed at implementing various kinds of dialogue and
involvement initiatives that take advantage of the Group’s many interaction channels.
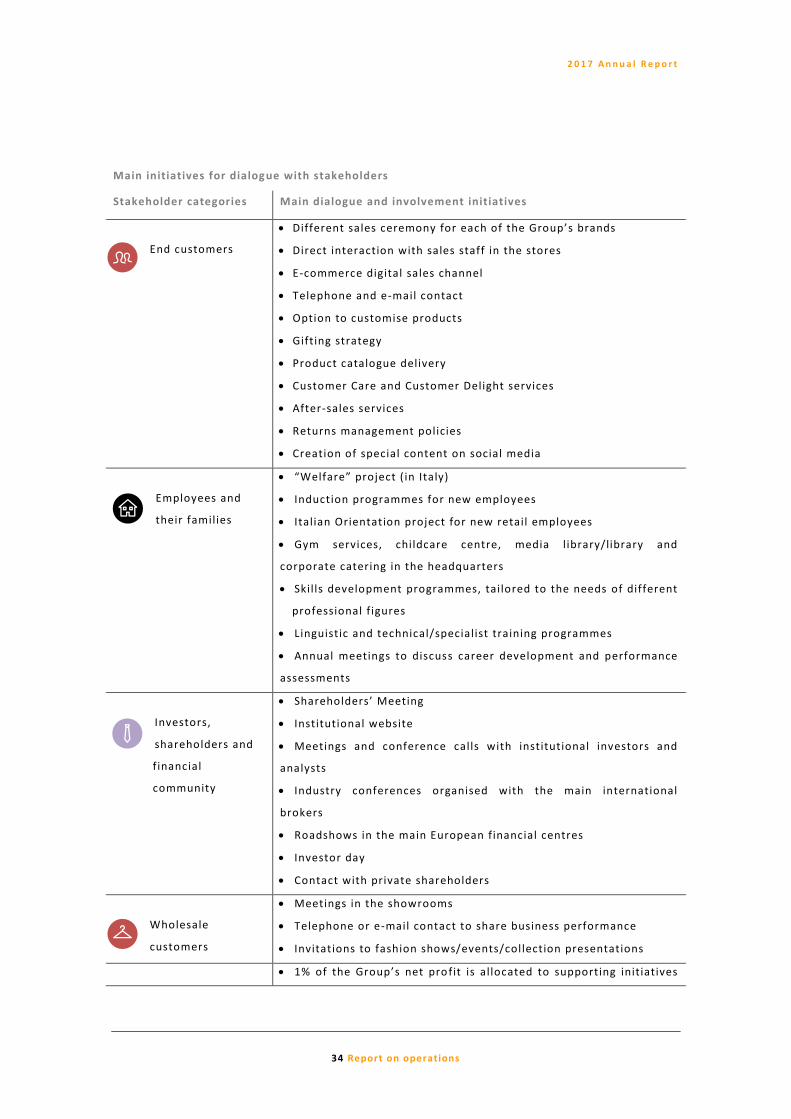
2 0 1 7 A n n u a l R e p o r t
34 Report on operations
Main initiatives for dialogue with stakeholders
Stakeholder categories Main dialogue and involvement initiatives
End customers
Different sales ceremony for each of the Group’s brands
Direct interaction with sales staff in the stores
E-commerce digital sales channel
Telephone and e-mail contact
Option to customise products
Gifting strategy
Product catalogue delivery
Customer Care and Customer Delight services
After-sales services
Returns management policies
Creation of special content on social media
Employees and
their families
“Welfare” project ( in Italy)
Induction programmes for new employees
Italian Orientation project for new retail employees
Gym services, childcare centre, media library/library and
corporate catering in the headquarters
Skills development programmes, tailored to the needs of different
professional f igures
Linguistic and technical/specialist training programmes
Annual meetings to discuss career development and performance
assessments
Investors,
shareholders and
financial
community
Shareholders’ Meeting
Institutional website
Meetings and conference calls with institutional investors and
analysts
Industry conferences organised with the main international
brokers
Roadshows in the main European financial centres
Investor day
Contact with private shareholders
Wholesale
customers
Meetings in the showrooms
Telephone or e-mail contact to share business performance
Invitations to fashion shows/events/collection presentations
1% of the Group’s net pro f it is allocated to supporting initiatives

2 0 1 7 A n n u a l R e p o r t
35 Report on operations
Local area and
community
targeted at members of the local community who require the most
assistance
Collaborations with non-profit organisations to support charitable
initiatives for disadvantaged people
National and international collaborations and initiatives aimed at
the promotion and protection of the Italian spirit worldwide
Media and
influencers
Institutional website
Institutional communication events and initiatives
Conferences
Press releases
Press days
Interviews with top management
Invitations to fashion shows/events
Collaborations with important bloggers and influencers
External workshops
Definition and sharing of technical and quality standards
Visits to start the production process and to monitor product
quality
Sharing of production progress
Dedicated portal/information systems
Suppliers
Daily reports
Definition and sharing of technical, stylistic and quality standards
Supplier portal
PA, government
agencies and audit
bodies
Special periodic meetings
Collaboration to develop initiatives
Industry
associations
Constant dialogue and meetings
Participation in workgroups
Design and development of joint projects
Participation in trade fairs
Schools and
universities
Support for initiatives to facil i tate students’ entry into the world
of work, including through school/work alternation
Participation in career days and job fairs
Organisation of placements and internships
Sharing of expertise
Collaborations with prestigious universities and design schoo ls
Participation in specialised training courses

2 0 1 7 A n n u a l R e p o r t
36 Report on operations
1.2. Materiality analysis
In order to identify economic, social and environmental aspects that are relevant to the Group
and significantly influence or could influence the assessments and decisions of its stakeholders,
in 2017, TOD’S carried out a materiality analysis for the first time, which was translated into the
aspects reported in the Non-Financial Statement.
The process of defining the material aspects, which was carried out according to the GRI
Standards Guidelines published in 2016 by the GRI - Global Reporting Initiative and pursuant to
Legislative Decree 254 of 2016 on non-financial information, was divided into several stages,
which are presented below.
Identification of the relevant issues : f irst, all the issues relevant to the Group and its
stakeholders were identified. These issues were identified through the analysis of internal
documents (Code of Ethics, Annual Financial Report, institutional website, etc.) and external
documents (studies and industry publications), as well as through extensive benchmarking
analysis of best industry practices at a national and international level.
Evaluation of the relevant issues : in order to prioritise the relevant issues, the Group
organised a workshop that involved the participation of the management. The management was
asked to evaluate the relevance of the issues from two different perspectives: on the one hand,
for the Group and, on the other, for the stakeholders, acting as a representative for thei r
opinions and expectations.
Identification of material issues : drawing on the results of the workshop, it was possible to
define TOD’S Group’s f irst materiality matrix, which consists of 23 material themes , including
respect for ethical principles, custo mer satisfaction and the offer of unique, high -quality
products.

2 0 1 7 A n n u a l R e p o r t
37 Report on operations
TOD’S Group’s materiality matrix
The materiality matrix’s synthesis of the company’s approach and the stakeholders’ perspective
is a significant tool for defining and developin g sustainability priorities and continuing to
generate shared value in the medium and long -term.
2.Ethical and responsible business management
Due to its size and the significance of its activities, the TOD’S Group is aware of the significant
role it plays in the community in which it operates and is therefore determined to ensure that its
activities are conducted to the highest degree of correctness, while building and preserving a
relationship of trust with its stakeholders.
For this reason, the Group co nforms to the following ethical standards in the pursuit of its
objectives:
• compliance with the legislative and regulatory provisions applicable in all the countries in
which Group companies operate and observance of the strictest rules, particularly as t hese apply
to relations with the public administration;
• equal and impartial treatment of employees, associates and customers;

2 0 1 7 A n n u a l R e p o r t
38 Report on operations
• transparency and reliability;
• honesty, correctness and good faith;
• confidentiality;
• the value of persons and human resources.
These principles inspire our business conduct and have been an official part of the Group Code of
Ethics since 2008.
Observance of the Code of Ethics is an essential condition underlying the correct operation of the
companies comprising the Group, the protec tion of its reliability, reputation and image, enabling
us to ensure the increasing satisfaction of our customers.
Therefore, all employees and other individuals who are involved in the operations of TOD’S
Group companies are required to know and uphold the principles of the Code of Ethics, each to
the extent of their competence.
To ensure correct application of the principles underlying our Code of Ethics, the Group promotes
knowledge and dissemination thereof through publication on our institutional w ebsite (at the
following address http://www.todsgroup.com/system/document_its/32/ original/TodsSpa_Codice
_Etico.pdf), through specific information and training actions directed to employees and with
specific clauses added to the contracts and agreements w hich the Company or the Group is a
party to.
2.1. Compliance with laws and regulations
To ensure the highest level of correctness and transparency in the pursuit of its business and
within the relative company activities, TOD’S S.p.A. adopted its own Organisation, Management
and Control Model (the “Model” or “Organisational Model”) pursuant to the 30 January 2009
resolution of the Board of Directors, in compliance with the requirements of Legislative Decree
231 of 8 June 2001.
In addition to ensuring appl ication of correct Corporate Governance principles and in accordance
with the ethical and social values underlying the Code of Ethics, the adoption of the
Organisational Model and the Code of Ethics is an effectual instrument with which to regulate the
re lations of all the employees and associates of the Group with the Group’s stakeholders
(suppliers, customers, public administration, partners, etc.) - preventing the risk of committing
the offences included in Legislative Decree 231/2001.
Through its adoption of the Model, the Company intends to pursue the following objectives:

2 0 1 7 A n n u a l R e p o r t
39 Report on operations
render the recipients of the Model aware that by violating the provisions therein, they run the
risk of committing potentially i l legal acts which could involve the application of pe nalties against
them, while administrative fines could be levied against the Company;
reiterate that the Company very strongly disapproves of these forms of i l legal conduct, since
they violate the law and the principles of ethics which it strives to follow in the conduct of its
business;
through monitoring of the areas of operations which are at risk, the Model allows the
Company to immediately intervene or prevent the offences from being committed.
The provisions of the Model are binding upon the director s and all persons whose duties involve
the representation, administration and management, including the de facto management, of the
Company as well as the employees and the external collaborators who are subject to the
direction or supervision of the Compa ny’s management.
The Model is periodically updated by the Board of Directors and is currently being updated and
revised so as to reflect the offences that have been introduced in the meanwhile. Moreover, the
two major Italian subsidiaries are currently as sessing adoption of the Organisational Model as
required by Legislative Decree 231/2001. These companies are: Roger Vivier S.p.A. and Del. Com.
S.r. l.
To ensure the correct implementation and observance of the Model and application of the
necessary updates, the Company has also established a specific Supervisory Body, appointed by
the Board of Directors, with autonomous powers of initiative and control. Currently, this Body
has three members: an independent director (who is the Chairman), a member of the Bo ard of
Statutory Auditors and the Head of the Internal Audit Department.
Upon completing the verif ication work for the period of reference, every half year the Body
submits a report to the Board of Directors.
Moreover, the Body assists other departments/ functions with supervisory duties to observe the
rules of conduct included in the Code of Ethics and the Model adopted pursuant to Legislative
Decree 231/2001.
To afford all the recipients the ability to report acts or facts which could be in violation of the
Model, the Parent Company TOD’S S.p.A. has set up a confidential communications channel which
allows interested parties to contact the Supervisory Body, using an ordinary postal address and
an email address.
The Corporate Governance Model
The Parent Company TOD’S S.p.A. has structured its corporate governance system along the lines
of the principles and application criteria recommended by the Corporate Governance Code for
Listed Companies (the “Code”), distributed by Borsa Italiana.

2 0 1 7 A n n u a l R e p o r t
40 Report on operations
TOD’S S.p.A. follows the traditional corporate governance system, as follows:
The Shareholders’ Meeting is legitimated to make resolutions, whether ordinary or
extraordinary, on the issues placed under its competence by the Law or the Articles of
Association.
The Board of Directors is vested with the broadest powers for the ordinary and extraordinary
management of the Company, without l imitations, and has the power to take all the actions that
it considers necessary for implementation or achievement of the corporate purpo se, except the
powers that the law vests in the Shareholders’ Meeting exclusively.
The Board of Statutory Auditors is legally responsible for monitoring i) observance of the law
and the Articles of Association and compliance with the principles of correc t management; i i) the
adequacy of the Company’s organisational structure insofar as the areas that fall under its
competence, the Company’s internal audit and risk management system and its administrative
and accounting system, as well as the reliability o f the latter insofar as correctly representing the
operating events; i i i) the adequacy of the instructions given by companies belonging to the TOD’S
Group in relation to the information to be provided pursuant to disclosure obligations; iv) the
procedures for implementation of the corporate governance rules as provided in the Corporate
Governance Code for Listed Companies which the Company follows. Legislative Decree 39/2010
also requires the Board of Statutory Auditors to monitor, in particular, the financ ial disclosure
process, the efficacy of the internal control systems, the internal audit system, if applicable, and
the risk management system, the legal audit of the annual accounts and the consolidated
accounts and to ensure that the auditing firm is ind ependent. Moreover, within the scope of the
functions attributed to it by the Law, the Board a of Statutory Auditors shall also monitor
observance of the provisions set forth in Legislative Decree 254/2016.
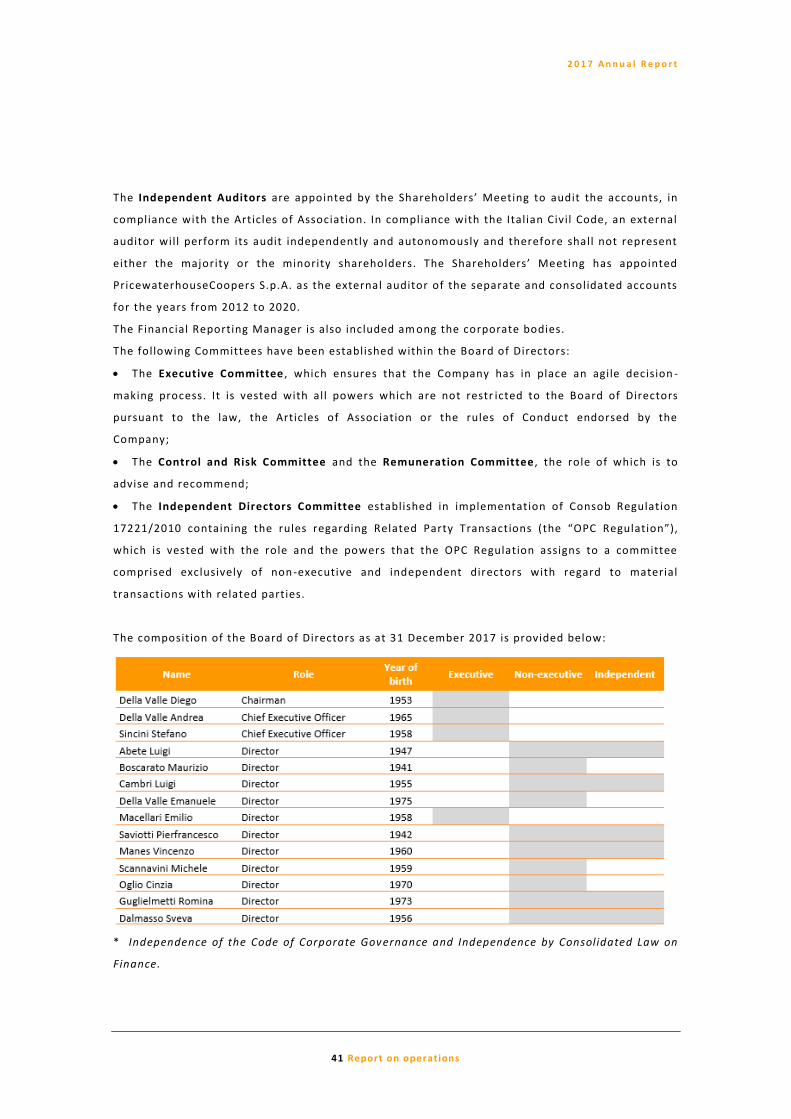
2 0 1 7 A n n u a l R e p o r t
41 Report on operations
The Independent Auditors are appointed by the Shareholders’ Meeting to audit the accounts, in
compliance with the Articles of Association. In compliance with the Italian Civil Code, an external
auditor will perform its audit independently and autonomously and therefore shall not represent
either the majority or the minority shareholders. The Shareholders’ Meeting has appointed
PricewaterhouseCoopers S.p.A. as the external auditor of the separate and consolidated accounts
for the years from 2012 to 2020.
The Financial Reporting Manager is also included am ong the corporate bodies.
The following Committees have been established within the Board of Directors:
The Executive Committee , which ensures that the Company has in place an agile decision -
making process. It is vested with all powers which are not restr icted to the Board of Directors
pursuant to the law, the Articles of Association or the rules of Conduct endorsed by the
Company;
The Control and Risk Committee and the Remuneration Committee , the role of which is to
advise and recommend;
The Independent Directors Committee established in implementation of Consob Regulation
17221/2010 containing the rules regarding Related Party Transactions (the “OPC Regulation”),
which is vested with the role and the powers that the OPC Regulation assigns to a committee
comprised exclusively of non-executive and independent directors with regard to material
transactions with related parties.
The composition of the Board of Directors as at 31 December 2017 is provided below:
* Independence of the Code of Corporate Governance and Independence by Consolidated Law on
Finance.

2 0 1 7 A n n u a l R e p o r t
42 Report on operations
The current composition of the Board of Directors ensures gender balance in compliance with
Law 120/2011 and article 17 of the Company’s Articles of Association.
In further confirmation that corpora te social responsibility is an approach that is shared and
implemented by the highest levels of management, with its resolution on 25 January 2017 and on
an entirely voluntary basis, the Board of Directors assigned to the Independent Directors
Committee the additional duty of supervising issues of sustainability related to the business
operations and the dynamics of its interaction with all the stakeholders and, therefore, the
Independent Directors Committee:
“examines and assesses the sustainability policy to ensure the creation of value over time for
shareholders and for all the other stakeholders in compliance with the principles of sustainable
development and the sustainability guidelines and objectives submitted each year for the review
of the Board of Directors;
examines implementation of the sustainabil ity policy on the basis of the indications provided
by the Board of Directors;
examines and assesses the sustainability initiatives, including in relation to individual
projects;
examines the company’s non-profit strategy and implementation thereof, including in relation
to individual projects, and the non-profit initiatives submitted to it for the review of the Board;
on the request of the Board, expresses its opinion on other issues regarding sustai nability”.
For further information regarding Corporate Governance please see the “Corporate Governance
and Ownership Structure Report” prepared according to article 123 -bis of Legislative Decree 58
of 24 February 1998 (the Consolidated Finance Act or CFA) for f inancial year 2017, approved by
the Board of Directors in its meeting of 13 March 2018: the report explains in detail the
corporate governance system of TOD’S S.p.A. and includes, in addition to the information
required pursuant to article 123-bis par. 2 of the CFA, a comprehensive examination of the
current state of the implementation of the governance principles recommended by the Corporate
Governance Code for Listed Companies, in compliance with the so called “comply or explain”
principle.
The Corporate Governance and Ownership Structure Report which we hereby refer to in full, is
provided to the public together with the Directors’ Report on operations and the financial
statements. It can also be consulted in the “Corporate Governance” section of th e website
www.todsgroup.com.
Again on 13 March 2018, in observance of article 123 -ter of the CFA, article 84-quater of Consob
Resolution 11971/99 (the “Issuers’ Regulation”), as subsequently amended and supplemente d,

2 0 1 7 A n n u a l R e p o r t
43 Report on operations
the Board of Directors of TOD’S S.p.A. approved the Remuneration Report. This Report has two
sections:
( i) the first covers the remuneration policy applicable to the members of the management body,
the general manager and the key managers for 2018, and the procedures followed for adoption
and implementation of this policy;
( i i) the second provides information for each of the items comprising the remuneration report
and describes the compensation paid in 2017 to the members of the management and control
bodies, the general manager and the key managers.
The Report will be submitted for the approval of the Shareholders’ Meeting which has been
scheduled for 19 April 2018. It will be called upon to make a resolution regarding the first
section, which will be non-binding.
The Remuneration Report is available at the registered office of the Company and on its website
at www.todsgroup.com .
It is furthermore noted, that although it is not included under the FTSE -Mib index, the Company,
pursuant to the resolution of its board on 24 October 2016, voluntarily introduced as part of its
internal control and risk management system, an internal reporting system to be used by
personnel for reporting any irregularities or violatio ns of the regulations appl icable and the
internal procedures (so called whistleblowing), in l ine with the best practices domestically and
internationally, providing a specific and confidential information channel, and ensuring the
privacy of the whistleblower.
Integrated risk management
According to the Corporate Governance Code for Listed Companies, the TOD’S Group has in place
a risk management system which ensures that the main risks to which the issuer and its
subsidiaries are exposed are correctly identified, adequately measured, managed and monitored,
while concurrently determining the decree to which these risks are in l ine with management of
the company in pursuit of the identified strategic objectives.
At least on a yearly basis, the Directors in charge of the Internal Control and Risk Management
System will identify the main risks of the company, taking into account the characteristics of the
activities of the Company and its subsidiaries and submit these for examination by the Control
and Risk Committee and the Board of Directors.
It is hereby specified that the risk identification activity is carried out by way of Control and Risk
Self Assessment interviews, in order to obtain a comprehensive overview of the macro types of
risks potentially appl icable (typically “strategic” or external risks) and through the results of the

2 0 1 7 A n n u a l R e p o r t
44 Report on operations
internal audit of the company processes, in relation to the operational, f inancial and compliance
risks.
Once the risk identification has been completed, the risks are assessed . This process streamlines
the internal/external information, allowing management to implement the appropriate actions.
Risks are assessed by means of an assessment process upon completion of which a qualitative
and quantitative rating is assigned. The rat ing process associates, for each risk, the probability
that the event will occur, and the impact that it would have.
These probabilities are also expressed (where possible) in terms of the historical frequency with
which an event has materialised as part of the company operations, taking into account also the
future scenarios involving repetition of the risky event.
The main risk factors affecting the company has been grouped into the following macro
categories, to ensure clarity and simplicity:
strategic: risks which are characteristic of the business (such as for example risks connected
to the demand dynamics of the “luxury goods” sector and the risks inherent in the location of the
reference markets) the correct management of which constitutes a competi tive advantage, or,
otherwise, a reason for failure to reach the medium -long-term objectives for the company.
operational : the risk of losses from inadequacy or inefficiency of the processes, persons or
internal systems or the result of external events (s uch as for example, the timeliness of supplies,
the concentration of suppliers, the handling of contractors/ façons, the risk of fraud, etc.). This
latter category includes the risks involving internally and/or externally induced fraud. As shown
in the previous paragraph, the assessment of internal and/or external risk of fraud should be
supplemented, if it arises, with any reports transmitted through the key communication channels
available within the company and any specific assessments conducted as part o f the updating of
the organisational model pursuant to Legislative Decree 231/2001. Finally, the Audit Plan
Methodology provides for adoption of a systematic and structured process that also includes,
among its various phases, the identification and associ ation of an indication whether the risk
involves IT, f inancial and fraud, with each Audit Object included within the scope of the Plan.
financial: risks that have direct repercussions on the economic results and the equity of the
company and which are main ly connected to external factors such as foreign exchange, credit,
interest rate and liquidity risk.
compliance/regulatory: risks connected to failure to comply with the laws, regulations or
provisions of the law and/or the regulatory and control authoriti es and unfavourable
amendments to the legal framework (such as, for example, any laws applicable to importing and
exporting or which affect the commercial activities and distribution in the markets of reference,
in addition to occupational health and safet y). All the risks included in this latter category are
identified and analysed by management, through preparation of the Risk Evaluation Documents

2 0 1 7 A n n u a l R e p o r t
45 Report on operations
by management pursuant to Legislative Decree 81/08, including the assessment by task/work
performed, the actions in place for the relative prevention and protection system, the procedures
for responding to emergency and first aid situations, etc. The control activities carried out by the
organisational f igures required by the regulation also include the monitorin g activities carried
out by the Supervisory Body pursuant to Legislative Decree 231/2001.
Being aware that handling of ESG issues (environmental, social and governance) is becoming
more and more integral part of its own business system, and is necessary f or creating value over
time while concurrently ensuring ethical, responsible and transparent management of its
activities, from 2017, in addition to updating the risk factors identified previously and in l ine
with best practices, the TOD’S Group has analys ed:
- the correlation of the major “material issues” ( in economic, social and environmental terms),
whether for the Group or for the stakeholders, with the corresponding risk factors identified by
its risk assessment activity;
- The risk factors with the most “reputation impact” in order to verify placement of each risk
factor within the Group.
With regard to ESG, the following risks were mapped: non -compliance with the laws on
occupational health and safety, the administrative responsibility of entities purs uant to
Legislative Decree 231/2001, corruption, non -compliance with applicable laws regarding sales
and distribution, inappropriate measures for forestalling counterfeiting, inadequate quality of
raw materials, workmanship, management of contractors/the s upply chain, the adequacy of the
skil ls of the personnel, location of markets/country risk and reputational risk.
Particularly with regard to the risk of active and passive corruption, we note that the main risk
factors of the Group which are potentially a pplicable (mapped as part of the assessment
activities pursuant to Legislative Decree 231/2001) refer to the following areas: activities
connected with the procurement of goods and services and the management and development of
real estate assets insofar as relations with public entities/local authorities for applications for
permits, authorisations and measures, etc.
With regard to environmental risks, we note that these risks are mapped as part of the
assessment activities for offences included in Legisla tive Decree 231/2001. Given the reference
sector and the business model adopted, this risk is considered negligible insofar as compliance
with the reference regulations.
Finally, in relation to the potential exposure to risks inherent in the supply chain, giving the
typical nature of our sector, there could be cases involving external individuals entering or who
have entered into collaborations with the TOD’S Group but do not comply with the regulatory

2 0 1 7 A n n u a l R e p o r t
46 Report on operations
requirements, in violation of the strict obligations co ntractually undertaken with TOD’S, and/or
who do not respect their contractual obligations, including the principles contained in the Group
Code of Ethics.
Creation of economic value
The economic value statement is a restatement of the consolidated income statement,
representing the wealth produced and distributed by the TOD’S Group among its stakeholders. In
2017, the economic value generated by TOD’S Group was equal to €934.8 mill ion, in l ine with the
economic value generated in 2016 of €932.3 mill ion. The economic value distributed increased
from €902.5 mill ion in 2016 to €911.7 mill ion in 2017. In particular, approximately 97.5% of the
economic value created by TOD’S G roup was distributed to the stakeholders, both internal and
external, while the remaining 2.5% was kept within the Group. Among the stakeholders, in 2017
the suppliers and external workshops was the group to which the largest portion of the economic
value was distributed (69% of the total value); this value has increased from 66.9% in 2016.
Similarly to 2016, in 2017 in addition to suppliers and external workshops, the other two
stakeholder categories to which significant portions of the economic value were distributed were
personnel and shareholders, who respectively received 22% and 5.1% of the economic value
generated by the Group.

2 0 1 7 A n n u a l R e p o r t
47 Report on operations
3.Tradition and innovation
TOD’S Group boasts a history based on solid, enduring foundations, on values that have been
constantly strengthened for over 100 years, so much so that they constitute the essence of the
brand and have brought it international recognition: these values are part of tradition ,
understood as quality, an inherent element of Made in Italy production that is evident in all its
products, and expertise, understood as a set of artisan skil ls handed down from generation to
generation. Bolstered by these values, the Group has always promoted their development and
protection throughout the supply chain and e ncouraged their spread among its customers in order
to create responsible value in the long term.
Though the Group has upheld its values over time, they have not remained static: they have
developed in l ine with the needs of its stakeholders, according to the Group’s desire to always
respond in a new and original way to their needs, combining tradition and innovation and staying
true to its mission: to offer a worldwide clientele products of the highest quality that meet their
functional and aspirational ne eds.

2 0 1 7 A n n u a l R e p o r t
48 Report on operations
3.1 The history of TOD’S Group
Tradition , quality, excellence, craftsmanship and Made in Italy: these values, on which TOD’S
Group has built its history, continue to be passed down and preserved with extreme care. It all
started at the beginning of the 20th century, when Fil ippo Della Valle, the grandfather of Diego
Della Valle, created a small cobbler’s workshop. The work and passion were handed down to sons
who launched the outstanding footwear business that, since from the origins, has always
distinguished the Group.
Over the years, TOD’S has expanded its product range, including through the launch and
acquisition of prestigious brands, but this has never impacted the founding values of its identity,
which, combined with the fundamental component of innovation , have enabled the Group to
establish itself as one of the leading players in the production and marketing of footwear, leather
goods, clothing and luxury accessories.

2 0 1 7 A n n u a l R e p o r t
49 Report on operations
The TOD’S Group brands

2 0 1 7 A n n u a l R e p o r t
50 Report on operations
Today, TOD’S S.p.A. is an operating ho lding company of an internationally -renowned group that
operates through the TOD’S , HOGAN , FAY and ROGER VIVIER brands.
Though they have their own distinct identity, the Group’s brands share the same philosophy
based on a balanced mix of tradition and mode rnity, high quality, creative content and broad
product usability. The high quality of the products is guaranteed by the important role of manual
work in all stages of the production chain:
The TOD’S brand is synonymous with luxury footwear and leather goods. Characterised from the
outset by models that have become cult contemporary lifestyle items, in the world of luxury
accessories it represents the perfect combination of tradition, high quality and modernity. Every
product is made by hand with superior craftsmanship to become, after numerous steps and
checks, an exclusive, recognisable, modern and functional item. Some of the designed products,
such as the Driving Shoe or D-Bag, popular among celebrities and personalities worldwide, have
become icons of a new style of masculine and feminine elegance. Each collection is a different
take on “Contemporary Living”, an iconic l ifestyle imbued with Italian spirit, a value that the
whole world recognises as synonymous with impeccable taste and elegance, hande d down from
generation to generation.
The HOGAN brand was founded in 1986 and is positioned in the luxury market, combining style,
functionality and innovation. HOGAN translates the original vision of the concept of casual luxury
suitable for any occasion into a contemporary lifestyle, in which quality and style are always
appreciated.

2 0 1 7 A n n u a l R e p o r t
51 Report on operations
The brand offers footwear and accessories with a modern, essential design that perfectly
balances versatil ity and elegance. HOGAN products, which are made from extraordi narily high-
quality materials, are iconic objects designed to remain fashionable from season to season.
FAY , a brand launched in the second half of the ‘80s, boasts a range of high -quality clothing
products distinguished by the brand’s specific outerwe ar expertise, by the technical treatment of
its fabrics and by the meticulous design and extreme functionality of its clothes, which stand out
due to their excellence, comfort and durability, combining style, quality and versatil ity.
Every season, the brand presents a menswear/womenswear collection and a junior collection
consisting of both iconic garments, restyled according to current trends and technologies, and
brand new additions to all its product categories.
The brand, which is strongly anchored in Italian vintage fashion, is now taking on the challenge of
communicating its distinct identity to new generations, combining innovative and practical
fabrics with the timeless characteristics of authentic Italian style.

2 0 1 7 A n n u a l R e p o r t
52 Report on operations
ROGER VIVIER, who created the f irst stiletto heel in the ‘50s, designed extravagant and
luxuriously embellished shoes that he described as “sculptures”. A skil led artisan who loved
feminine elegance, Vivier elevated shoes to art objects through the savoir -faire of French
embroidery houses. The artistic heritage and traditional roots of the Vivier fashion house have
now been given a new lease of l ife. Thanks to the Group’s work, ROGER VIVIER’s creativity and
vision live on and new chapters are added to this unique story every season, go ing beyond
footwear expertise to include bags, small leather goods, jewellery and sunglasses. Today, ROGER
VIVIER’s womenswear is sophisticated and elegant, yet slightly eccentric: it is designed for a
woman who tries, through her clothes, to express her t imeless elegance, without forgetting to
add a cheeky, extravagant touch.
Timeless Icons: tribute to timeless elegance
TOD’S and Mondadori have teamed up to produce a stunning book bringing together
gorgeous images of celebrities past and present, celebrating the eternal appeal of the
star names that never cease to radiate sophisticated, timeless style.
The book shines the light on a carefully selected group of iconic f igures from the last
century. It contains some of the best-loved style icons from the red carpet, silver
screen and glossy front pages, including Jane Birkin, Brigitte Bardot, Lauren Hutton,
Audrey Hepburn, James Dean, Marlon Brando and Mick Jagger. There are also a number
of the hottest current stars, not least Gisele Bündchen, Blake Lively, George Clooney
and Leonardo Di Caprio.
The beautiful photographs are a fitting tribute to the exceptional style and charm of
each subject, showcasing once again the timeless elegance so synonymous with the
TOD’S brand.

2 0 1 7 A n n u a l R e p o r t
53 Report on operations
Distribution network and international expansion
The prestige of the distributed brands and the high specialisation required to present the
relevant products to customers make i t necessary to distribute products via a network of highly
specialist stores. To this end, the Group mainly uses three channels: directly operated single -
brand stores (DOS), franchised stores and a series of independent multi -brand stores selected on
the basis of their suitability to the brand’s positioning, their location and the level of service
offered to customers, as well as the visibil ity that they can provide for products ( wholesale
distribution) .
The Group began its international expansion in 1987 w ith the opening of its f irst direct store in
the United States, in New York. Following the consolidation of the market success of its products
in Italy, the Group, in order to guarantee a direct presence on the strategic, respected markets,
advanced its expansion strategy in foreign markets by opening its f irst boutique in France in
1993, in the prestigious Rue Faubourg Saint Honoré in Paris and, subsequently, in several
European markets including in England in 2000. After consolidating its presence in the European
markets, the Group began to penetrate the Asian markets, opening its f irst store in Hong Kong in
2000, followed by openings in Japan and China, respectively in 2002 and 2008.
The Group’s strategic focus has historically centred on the developm ent of the DOS and
franchised store network, since these channels allow greater control of distribution and more
faithful communication of individual brands’ images. Moreover, in some markets, the Group also
has a presence in independent multi -brand stores, a channel that plays a central role for the
Group. As at 31 December 2017, the single -brand store distribution network consisted of a total
of 275 DOS and 112 franchised stores , a slight increase compared to the single -brand store
2 0 1 7 A n n u a l R e p o r t
54 Report on operations
distribution network as at 31 December 2016, which consisted of 272 DOS and 107 franchised
stores.
In addition to traditional sales channels, since 2012 the Group has used e-commerce , an online
marketing channel for products in the current collection of all the brands managed b y TOD’S
Group; currently the Group’s brands’ e -commerce sites operate in 31 countries around the world
(9 of which were added in 2017) with a main focus on the North American, European and Chinese
markets.
3.2 Responsible management of the supply chain
TOD’S Group boasts a long history in the production and marketing of footwear, leather goods
and clothing, distinguished by different brands, all equally characterised by high quality,
exclusivity and a recognisable style.
A distinctive element of the Group ’s production processes, which guarantees the prestige and
exclusiveness of the brands, is its careful internal control of the entire production chain from the
creative stage to the production of prototypes, to the selection and procurement of raw
materials and components, and finally to the creation of products. The production of footwear
and leather goods is carried out in internal facil ities and workshops owned by the Group or in
specialised external workshops. The latter are entirely located in areas th at have a historic
tradition of footwear and leather goods production, a guarantee of professional workmanship
and manual expertise. For the production of its clothing line, the Group relies on selected
specialised external workshops.
The uniqueness of the Group’s products has always been based on values such as craftsmanship,
design, creativity, tradition, innovation, quality and the promotion of Made in Italy.
Over the years, the Group’s product range has evolved in l ine with customer needs and the
values inherent in each of the Group’s brands.

2 0 1 7 A n n u a l R e p o r t
55 Report on operations
Supply chain quality
All the Group’s commercial partners , whether they are suppliers or external workshops , from
the raw material procurement stage to production management and product distr ibution, play a
crucial role in the pursuit of qualitative excellence. To this end, the TOD’S Group carefully selects
its partners, favouring established collaborations and solid, long -lasting relationships aimed at
maintaining the standards of excellence and quality that ha ve always distinguished its products.
Craftsmanship: a value to pass down
Artisan skil ls are not only key to the Group’s creation of high -quality products, but also an
important component of the technical and cultural heritage of Made in Italy productio n. For
this reason, TOD’S Group is committed to preserving this value, encouraging young people to
enter the world of craftsmanship, which stil l offers major employment opportunities in Italy,
combining innovation and tradition.
Following the “Fabbrica del Talento” (Talent Factory) project in 2015, in which a group of
aspiring young artisans undertook an apprenticeship experience that culminated with the
recruitment of a large part of the participants, in September 2016, the Group launched the
“Botteghe dei Mestieri e dell’Innovazione ” (Crafts and Innovation Workshops) project.
This project, which ended in March 2017, involved the participation of ten young people
between the ages of eighteen and thirty -five, who had the opportunity to get an insight into
the world of the “Master of Arts” through an interesting and prestigious training experience,

2 0 1 7 A n n u a l R e p o r t
56 Report on operations
during which they worked alongside the Group’s skil led artisans and oversaw, together with
these craftsmen, the key phases of the manufacturing processes.
This collaboration enabled the transfer of skil ls from experts to young people through first -
hand experience, promoting the dissemination and transmission to new generations of the
undisputed excellence of the Made in Italy tradition.
Outstanding raw materials and promotion of Made in Italy
In order to guarantee excellent products, structured processes are adopted to research and
select the best raw materials ( leather, accessories and fabrics), combining quality, tradition and
innovation.
In its constant pursuit of these values, the Group continues to collaborate with the best
tanneries, as well as researching, where available, new developments and new stylistic trends at
trade fairs.
When selecting raw materials, the Group prefers to establish partnerships with the best suppliers
in Italy . This preference is evidenced by the fact that in 2017, for all the Footwear, Leather
Goods and Accessories and Clothing Divisions, the total cost of the procurement of raw materials
from Italian suppliers amounted to 97% of the total supply budget.
In 2017, the Group, in l ine with 2016, collaborated with a total of 536 suppliers, including 219 for
the Footwear Division, 72 for the Leather Goods and Accessories Division and 245 for the
Clothing Division.
No. of suppliers by geographical area and product category
2017

2 0 1 7 A n n u a l R e p o r t
57 Report on operations
2016
Only when the best raw materials for a single product category are not available in the local
market, the selection process involves the best foreign suppliers (e.g. in France) that are able to
meet the Group’s quality and stylistic expectations, while guaranteeing the highest standards of
technical reliability.
In order to ensure compliance with the common goals of Made in Italy excellence, quality and the
fight against counterfeiting, the Group co nsiders it essential to create and maintain long-lasting
relationships with suppliers .
Suppliers by years of collaboration and product category
2017 - 2016

2 0 1 7 A n n u a l R e p o r t
58 Report on operations
Raw materials purchased by type*
Unit of
measurementQuantity/000
Unit of
measurementQuantity/000
Hides Pq/000 23,840 Pq/000 20,987
Metal accessories and other materials Pieces/000 30,629 Pieces/000 25,633
Fabric for clothing Meters/000 487 Meters/000 475
Fabrics linings for clothing Meters/000 249 Meters/000 278
Bottoms Pairs/000 21,430 Pairs/000 1,937
Accessories Pairs/000 283 Pairs/000 1,002
Typology of raw material
2017 2016
* Purchases include the main raw materials supplied, accord ing to the most representative measurement unit. The purchased raw materials, rather than the raw materials consumed, were reported. 0% of the reported raw materials are renewable.
TOD’S Group monitors substances deemed dangerous for the health and safety of the end
user and harmful to the environment, putting environmental sustainability at the heart of its
production processes.
At the same time, in order to protect and safeguard its image and that of its brands with
regard to checks by the relevant autho rities, TOD’S ensures that its products comply with its
RSLs (Restricted Substances Lists), which were developed in accordance with the guidelines
of the Italian National Chamber of Fashion (CNMI) regarding eco -toxicological requirements,
based on current regulations on the protection of health and safety and respect for the
environment.
To this end, TOD’S requires its suppliers to ensure compliance with the relevant standards
regarding the materials supplied by signing special RSLs (Restricted Substances Lists), which
list the obligations for each supplier and specify the substances and relevant regulatory
restrictions by type of material and final destination.
In addition, TOD’S Group carries out random tests on supplied materials in order to verify
their compliance with current regulations.

2 0 1 7 A n n u a l R e p o r t
59 Report on operations
TOD’S for Ferrari: outstanding level of Made in Italy
In 2017, TOD’S continued its ongoing collaboration with an outstanding Italian company, a
Made in Italy global ambassador: Ferrari . The two brands share the values that l ie at the heart
of the Italian tradition: passion, creativity and craftsmanship. TOD’S for Ferrari is a
collaboration that aims to create a collection of footwear and leather goods of unmistakable
value through the use of f ine materials, high quali ty and elegance. The main star of the
collection is the Gommino model, the TOD’S brand’s modern style icon. Every Gommino
includes up to 35 pieces of different leather, which are treated and checked manually by a
TOD’S craftsman before assembly. Every sing le stage of the production process is performed
by a craftsman with specific skil ls and the TOD’S for Ferrari logo is only applied to the
Gommino after meticulous checks.
High-quality production processes
Though they have their own distinct identity, the Group’s brands share the same philosophy
based on a balanced mix of tradition and modernity, high quality, creative content and broad
product usability.
The high quality of the products is guaranteed by the strong manual component that
characterises all stages of the production chain: every product is made by hand with superior
craftsmanship to become, after numerous steps and checks, an exclusive and recognisable item.
The production process for footwear, leather goods and leather accessories is carried o ut inside
the Group’s facil ities and workshops or in specialised external workshops.
The Group currently has five facil ities for the production of footwear – four in Italy (one in
Sant’Elpidio a Mare, one in Arquata and two in Comunanza) and one in Albani a – , a specialised
workshop in Hungary where certain specific footwear processing sub -phases are conducted, and
three leather goods facil ities in Italy (two in Vallina and one in Tolentino). In particular, it should
be noted that in the course of 2017, in the footwear production division, the Arquata del Tronto
facil ity was built and inaugurated and production capacity was expanded for the Albanian site,
which, up until the previous financial year, only oversaw certain specific processing sub -phases.
The processing stage in the Group’s facil ities is carried out by expert craftsmen who, thanks to
their consolidated working relationships with the Group, possess authentic know -how and artisan
skil ls that are essential to the quality of the products.
The special ised external workshops are located in areas with a long -standing artisan tradition. To
produce its clothing, the Group uses highly specialised external workshops that meet the

2 0 1 7 A n n u a l R e p o r t
60 Report on operations
requirements of technical and qualitative excellence necessary for the creation of the individual
products that make up the clothing line.
In its continuous pursuit of high quality standards, the Group relies on long -term collaborations
with the best, highly-specialised external workshops that ensure high quality standards. When
researching new workshops, the Group adopts structured qualif ication processes that provide
accurate technical and organisational analysis to evaluate the characteristics of the production
structure, the level of specialisation achieved, the company organisa tion and any UNI-ISO
certif ications obtained.
The external workshops that collaborate with TOD’S Group must operate in accordance with
regulatory requirements regarding health and safety in the workplace and must possess all the
qualif ications and permits required by the relevant authorities. When conducting their work, the
workshops are required to apply, in their internal and external working relationships, the
industry’s National Collective Bargaining Agreement and to scrupulously observe its applicatio n
with particular reference to regularity in the recruitment process, the level of wages, periods of
rest and vacation, aspects of protection of individual and collective safety and health, the
absolute prohibition of the use of child labour and staff who are not in compliance with all
applicable regulations.
The external workshops are also required to comply with the Code of Ethics.
Any violation of the aforementioned regulations and/or TOD’S Group’s Code of Ethics may result
in termination of the contractual relationship.
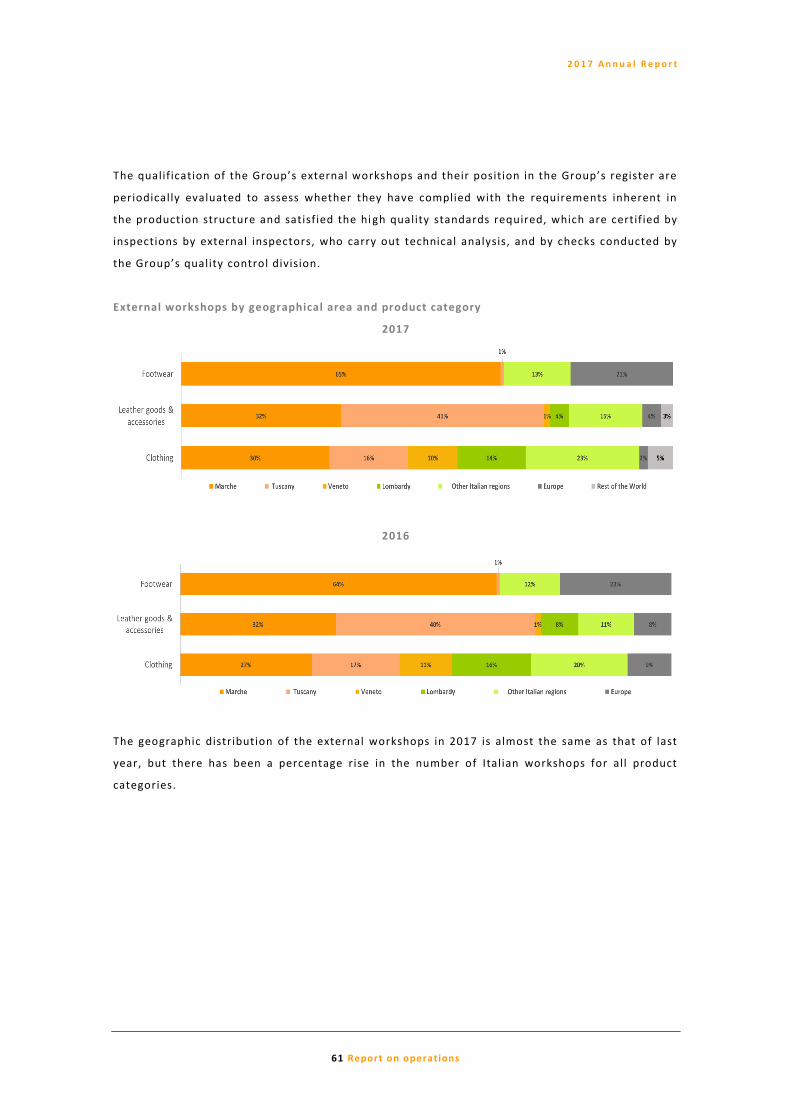
2 0 1 7 A n n u a l R e p o r t
61 Report on operations
The qualif ication of the Group’s external workshops and their position in the Group’s register are
periodically evaluated to assess whether they have complied with the requirements inherent in
the production structure and satisfied the hi gh quality standards required, which are certif ied by
inspections by external inspectors, who carry out technical analysis, and by checks conducted by
the Group’s quality control division.
External workshops by geographical area and product category
2017
2016
The geographic distribution of the external workshops in 2017 is almost the same as that of last
year, but there has been a percentage rise in the number of Italian workshops for all product
categories.

2 0 1 7 A n n u a l R e p o r t
62 Report on operations
External workshops by years of collaboration and product category
2017 - 2016
Product quality and uniqueness
Quality checks
TOD’S Group is renowned throughout the world for the high quality standards of its products and
for the image and prestige of i ts brands. It uses the best suppliers of raw materials and skilled
artisans to guarantee the high standards of excellence for which the Group is known and
appreciated.

2 0 1 7 A n n u a l R e p o r t
63 Report on operations
The process aims to ensure customers the high quality standard traditionally guaranteed by the
TOD’S Group, which is based on structured process controls and systematic product checks. The
process controls permeate the different stages of the design of a new product, from the choice of
material requirements to construction techniques, to indu strialisation, to inspections of the
quality of the raw material, components and semi -finished products, and finally to product
quality checks. The Group’s quality management of its processes is aimed at ensuring compliance
with technical parameters and identifying the risk of any hidden defects that may arise during
the use of the product, which cannot be identified from a “visual” inspection.
During the product design phase, the controls and checks carried out by skil led technical experts
concern the qual ity of the “product design” and therefore include selection and analysis of the
requirements of the best raw materials and components potentially used in the collections and of
the construction and industrialisation techniques suitable to guarantee the req uired standards.
In the raw materials selection stage, the materials are subjected to static analysis and laboratory
tests in order to verify that their characteristics reflect the parameters set out in the company’s
standards, which are intended to ensure that products are suitable and durable. The static
material qualif ication process is followed by a prototyping stage, in which the materials are
subjected to further evaluations from a technical and aesthetic point of view, including with the
help of specific tests that analyse their durability.
If the prototype passes the control stages described above, the raw materials identified are
considered suitable for the production of the products and it is therefore possible to proceed to
the product procurement and production stage.
To ensure compliance with the high quality standards required by TOD’S Group, structured
processes of research, selection and qualif ication of suppliers, raw materials and components are
adopted, in order to ensure that the selected raw materials have innovative elements and high -
quality levels that guarantee durability and permanent aesthetic appeal, functionality and
quality.
Every consignment of supplied leather and fabric is checked, based on specific criteria, when it is
delivered in order to verify compliance with TOD’S requirements. These checks are carried out in
compliance with the approved company procedures and computers are used to guarantee the
traceability of the entire process.
After the raw material controls, the produ ction process begins, involving, at specific key stages,
the identification of control checkpoints.
At the end of the production process, quality controls are carried out on the product, ensuring
that every product has reached the standards and requiremen ts defined at Group level.
In the case of production carried out by external workshops, quality controls are directly carried
out by Quality Inspectors at the external production units, as well as at the Group Logistics
Centre.

2 0 1 7 A n n u a l R e p o r t
64 Report on operations
Main stages of quality control
Chemical safety of products
The quality of products also depends on their chemical safety , ensuring above all
customers’ well-being. TOD’S Group monitors substances deemed dangerous for the end
user and harmful to the environment, putting environme ntal sustainability at the heart of
its production processes.
The RSLs (Restricted Substances Lists), which fully comply with the Guidelines of the
National Chamber of Italian Fashion, are based on the one hand on the main relevant
standards specific to each division and product category, and on the other, on the medium
and long-term goal of gradually eliminating certain chemicals, even though they are
permitted by law.
The RSLs have been drawn up on the basis of the following criteria:
1. compliance with the main international regulations:
European Union regulation no. 1907 of 2006, called REACH, concerning the registration,
evaluation and restriction of chemical substances;
2 0 1 7 A n n u a l R e p o r t
65 Report on operations
Chinese national standards (GB standards), specific to each raw material ( leat her, textiles,
accessories);
Korean Safety Quality Mark Act (KC mark);
US Consumer Product Safety Improvement Act (CPSIA) of 2008, which establishes limits
with respect to the levels of hazardous materials imported or produced in the United States,
especially in relation to their recipients;
principles of the “Proposition 65 Settlement” in California.
2. Gradual elimination of certain chemicals from the production process, even though they
are permitted by law. In this respect, many reference parameters, ex pressly referred to by
TOD’S RSLs, have significantly lower values than those permitted by current regulations.
Chemical checks:
TOD’S Group carries out random tests on supplied materials in order to verify their
compliance with its RSLs .
Further specif ic checks on finished products
During the product quality control stages, TOD’S pays particular attention to compliance,
focusing on the requirements of Chinese and American regulations, which are considered
the most restrictive and exacting. Even on its own products, TOD’S Group carries out
specific tests based on the main global safety and quality standards: QB/Standard, CPSIA
(Consumer Product Safety Improvement Act).
Finally, the Group follows structured and codified processes for the management and
transmission of correct information to the consumer with regard to product safety in
compliance with current regulations in the relevant markets.
Protection and authenticity of products
TOD’S Group, which firmly believes in the uniqueness and quality of i ts brands’ products, has
always devoted abundant resources and energy to the fight against the rampant phenomenon of
counterfeiting. Over the years, alongside activities aimed at combating counterfeits in the offline
world, it has also implemented measures to counter the phenomenon in the online world.
In addition to constant dialogue with law enforcement agencies and support of their work to
seize counterfeit products, with regard to offline anti-counterfeiting initiatives, a widespread
customs monitoring system has been introduced with a focus on the main European countries and
on those where counterfeiting is notoriously prevalent (such as China and Turkey), as well as a
targeted programme in China to identify factories that produce counterfeit products a nd the
definition of subsequent, necessary corrective actions. These law enforcement initiatives are
supported by preventive actions, such as training for customs officers and law enforcement
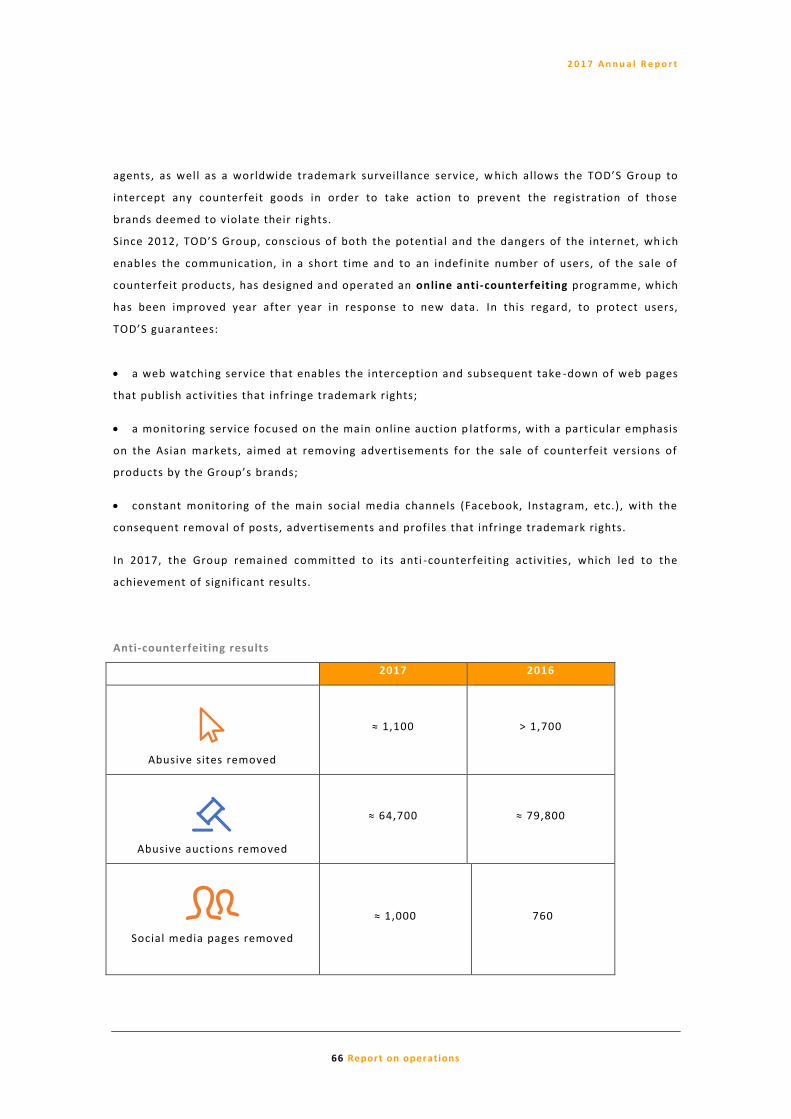
2 0 1 7 A n n u a l R e p o r t
66 Report on operations
agents, as well as a worldwide trademark surveillance service, w hich allows the TOD’S Group to
intercept any counterfeit goods in order to take action to prevent the registration of those
brands deemed to violate their rights.
Since 2012, TOD’S Group, conscious of both the potential and the dangers of the internet, wh ich
enables the communication, in a short time and to an indefinite number of users, of the sale of
counterfeit products, has designed and operated an online anti-counterfeiting programme, which
has been improved year after year in response to new data. In this regard, to protect users,
TOD’S guarantees:
a web watching service that enables the interception and subsequent take -down of web pages
that publish activities that infringe trademark rights;
a monitoring service focused on the main online auction p latforms, with a particular emphasis
on the Asian markets, aimed at removing advertisements for the sale of counterfeit versions of
products by the Group’s brands;
constant monitoring of the main social media channels (Facebook, Instagram, etc.), with the
consequent removal of posts, advertisements and profiles that infringe trademark rights.
In 2017, the Group remained committed to its anti -counterfeiting activities, which led to the
achievement of significant results.
Anti-counterfeiting results
2017 2016
Abusive sites removed
≈ 1,100 > 1,700
Abusive auctions removed
≈ 64,700 ≈ 79,800
Social media pages removed
≈ 1,000 760

2 0 1 7 A n n u a l R e p o r t
67 Report on operations
Goods seized by law enforcement
≈ 35,000 >308,200
Finished goods seized during raids
in China
> 6,800 > 15,100
With regard to the goods seized, there was a significant reduction in the number of cases in 2017
compared to the previous year. In the case of the raids in China, the 55% reduction is consistent
with a declining trend due to over ten years of strict law enforcement activity in the c ountry,
which is beginning to produce good results. The Group is considering initiating further actions in
the coming years in order to counteract the evolution of this phenomenon.
In the case of goods seized by the police, although the 2017 data cannot ye t be considered
definitive (since requests for reports often do not coincide with the seizures and can even be
deferred for months), the current reduction is in l ine with the strategic priorities established
annually by the various commands.
TOD’S Group’s commitment in this f ield is not l imited to the activities described above, but also
takes the form of membership of associations, as well as participation in specific round tables
focused on the fight against counterfeiting, which are also organised in sy nergy with other luxury
sector companies. One of the most notable organisations that the Group is a member of – due to
its authoritativeness on the subject – is INDICAM (Centromarca institute for the fight against
counterfeiting), which has always been at the forefront of every action to combat the threat
posed by counterfeit products, while promoting, from an intersectoral and interprofessional
perspective, an anti -counterfeiting culture. In addition to the fight against counterfeiting, the
Group is committed to preserving the quality and uniqueness of its products by guaranteeing
greater traceability along the entire production chain: with this goal, the Group has started a test
phase to incorporate the use of RFID (Radio Frequency Identification) labels .
The central importance of the customer
Customers are among TOD’S Group’s main stakeholders: understanding their expectations – from
the most obvious to the unexpressed – , customer satisfaction and the desire to build lasting and
trusting relationships with customers are essential objectives for the Group.
The central importance of customers, which underpins the company’s approach, is evident in its
most concrete form when the Group directly interfaces with them. Consequently, TOD’S Group
carefully conducts all the stages of interaction with its customers: from the sales ceremony in

2 0 1 7 A n n u a l R e p o r t
68 Report on operations
boutiques to the shopping experience on the e -commerce platform, from digital communication –
webmail and website – to after-sales services, product customisation services and th e creation of
content on social media, all experiences designed for customers must represent unique,
outstanding moments that are in l ine with the values on which the Group has built its identity.
In order to maximise the benefits of the brand-customer interaction for both parties, it is
essential to have an effective contact strategy, planned on the basis of careful analysis aimed at
identifying prevalent purchasing behaviour and placing customers in a specific stage of the life
cycle of the relationship. With this in mind, in 2015, the Group launched an important project
aimed at the introduction and development of specific tools and processes for the various
customer categories identified. The project involved the collaboration of several departments,
who shared their knowledge and experience in relation to customers, under the guidance of the
Corporate CRM Division within the Corporate Marketing Division.
This collaboration resulted in the launch of the CRM Project, which, since 2016, has enabled the
col lection of personal and contact information and the comparison of customers’ data with sales
information, leading the Group to develop new personalised contact opportunities with the
customers of each of the brands, responding more effectively to their tas tes and personal habits.
The Group has adopted an authentic contact strategy involving initiatives aimed at its best
customers, who are true ambassadors of the various brands. These initiatives include Customer
Delight, which aims to offer non-purchasable experiences and services, while also responding to
the needs of its customers through unique, personal experiences, such as the abil ity to purchase
items in an exclusive preview, private appointments, including outside opening hours,
personalisation services, dedicated customer service, etc.
It has also organised important internal CRM training for sales assistants, which involved all the
Group’s brands on a global level. This training programme covered the following topics: customer
recognition, the introduction of CRM during the sales ceremony and the collection of customer
data, the use of systems and information related to the customer, and the promotion of true self -
efficacy when interacting with customers.
In order to facil itate widespread implementat ion of the new strategy, the Group has also
provided various software to disseminate and preserve the culture of CRM and the central
importance of the customer within the company. Special clienteling software has been
implemented within each individual sto re, where a CRM Specialist has been appointed, who is
responsible for managing the software. Other campaign management, reporting and analytics
tools are centrally implemented and customised for brands, regions, stores and retail, marketing
and digital off ices.
In this last case, it is important to emphasise CRM’s role as “glue” between the onl ine and offline
channel, digital and retail, with a focus on omnichanneling increasingly aimed at the needs of the
end customer. CRM data and tools available to date allow digital to create web-mails according

2 0 1 7 A n n u a l R e p o r t
69 Report on operations
to many variables that can be selected for different needs and to have updated and timely
information on the progress of the various campaigns (open rates, unsubscribe, etc.).
The brands and sales ceremony: cus tomer-oriented differentiation
The Group’s careful attention to the purchasing experience is evidenced by the fact that the
different brands offer different sales ceremonies that reflect their core values, positioning and
peculiar characteristics.
TOD’S views its sales ceremony as a distinctive art that conveys the values of the brand in the
different stages of the relationship with the customer, a unique approach that aims to recognise
the specific characteristics of individual customers and their desires .
In defining the characteristics of the new sales ceremony, the role of sales staff, recognised as
brand ambassadors, was enhanced: to complete the experience in perfect TOD’S style, the
“Ambassadors” can offer interesting ideas to customers, such as sug gestions to spread their
knowledge of Italian lifestyle, of which the brand is a proud representative.
For HOGAN , the sales ceremony is based around taking care of customers. It is not simply a
guideline, but a way to accompany them in their shopping exper ience, receiving them in the
stores as a welcome guest and making them feel at home. Sales staff are therefore required to
convey their passion and engagement with the brand’s values, combining professionalism and
competence and creating an empathic relati onship by adapting to individual customers.
For the FAY brand, although sales are mainly focused on the wholesale channel, in selected
stores the customer is accompanied by a dynamic shopping experience that highlights the
peculiar characteristics of the brand’s style, such as versatil ity and excellence.
Within ROGER VIVIER boutiques, the creation of contact with the customer takes place even
before the actual sales phase. Through an empathetic approach and dialogue, elements that
characterise a visit to the boutiques, the customer is accompanied on a journey to discover the
brand. After initial contact with rare, exclusive luxury, the other distinctive elements of ROGER
VIVIER’s womenswear are gradually brought to light, allowing the customer to progressiv ely
identify with it: womenswear with a highly feminine, impertinent and extravagant attitude that
boasts the timeless elegance of Parisian inspiration.
Since 2014, TOD’S Group has developed targeted training modules in order to align the skil ls and
attitude of sales staff with the essence and exclusivity of the brands.
The corporate app is available for all the brands and contains the history of the company and of
the individual brands, allowing you to travel virtually within the headquarters and produ ction
units.

2 0 1 7 A n n u a l R e p o r t
70 Report on operations
All new employees and sales assistants in the most distant regions can thus learn about and
appreciate the quality expressed throughout the production chain and inform themselves about
the selection and processing of the hides. The corporate a pp is currently available in six
languages.
In addition to this tool, we also constantly organise Italian Orientation weeks to accompany new
directors and a selection of the rest of the store teams to a visit to the headquarters, the
production units and selected stores between Rome and Milan. The programme also includes
visits to monuments and insights into Italian culture, enabling the retail team to more effectively
communicate values related to quality, tradition and Made in Italy.
The mission of the TOD’S brand’s training activities, on a global level, is to be customer centric ,
always putting the customer first. Consequently, in order to improve the professionalism of the
sales staff, including in 2017, the Group has focused its attention on the follow ing areas:
a) Knowledge (knowing): with the aim of helping to improve the sales approach by providing
more details on the inspiration of products and collections, using an increasingly evocative and
emotional language.
The following training modules were provided in this area: iconic gommino, my custom -made
gommino, sartorial touch, womenswear and menswear collection mood, “our leather culture”,
“our heritage and our experience with fine materials”, etc.
b) Professionalism (know-how): with the aim of emphasising the natural elegance that
distinguishes TOD’S style, which is in l ine with the brand’s values and is consistent throughout
the world. The module aims to involve the customer by offering a unique approach in order to
further develop brand loyalty.
The following training modules were provided in this area: how to... bags and shoes presentation,
the art of selling – TOD’S loves Italia, rubber strap - the perfect bow, how to use social networks,
etc.
c) Brand identity (knowing how to express the brand’s values): with the aim of introducing the
company’s characteristics and brand identity to enhance the team’s approach, promoting the
Italian lifestyle and the Made in Italy philosophy with determination and passion.
The following training modules were provi ded in this area: Italian orientation, corporate app,
digital expert, Italian Notes - a guide to the Italian lifestyle, etc.
As described above, the Italian spirit and Made in Italy are values that are inextricably l inked to
the Group’s image. This has led to the development of the “Italian Notes” project.

2 0 1 7 A n n u a l R e p o r t
71 Report on operations
In order to promote sharing of the values that distinguish the brand and to optimise the training
and learning process for retail and corporate personnel, the Group has developed online
tools/platforms:
1. TOD’S Retail Sharepoint: a constantly updated platform containing all the information related
to the world of retail, operations and training.
2. Corporate app: a reference point for the training world, this app is focused on the company’s
history and values and on the brands’ characteristics. It explores issues relating to iconic
products with the aim of enriching the brand story for the customers.
3. Retail app: a reference point for the seasonal training modules containing presentations and
videos. This app allows employees to keep up to date with production phases, fashion shows and
special projects.
4. Intranet: an archive of updated documentation for the provided training modules, the
collections of the previous seasons and the company policies and procedures (“Store Handbook”)
regarding retail operations.
In particular, the additional goal of training is, on the one hand, to make sales staff aware of the
Group’s values , thus guaranteeing their adequate transmission to customers, and on the other
hand, to provide the social skills necessary to excel in the international context in which the
Group operates.
Learning to adapt communication style based on the cultural differences in the behaviour,
traditions and expectations of global customers is funda mental in order to remain competitive.

2 0 1 7 A n n u a l R e p o r t
72 Report on operations
As evidence of its commitment in this regard, it should be noted that in 2017 the Group provided
over 22,200 hours of retail training.
With a view to continuous improvement of the experience offered to customers, sinc e 2014, the
Group has carried out assessments of the level of assistance offered in boutiques through
Mystery Shopping surveys. This initiative enables, through mystery shoppers (“professional
customers” who make incognito purchases), the observation and a nalysis of the strengths and
areas of improvement of sales staff. The activity ends with the completion of a questionnaire by
the mystery shoppers regarding the purchasing experience and the level of assistance that they
received. Based on the results of t he questionnaires, the Group identifies targeted training plans
for sales staff, aimed at enhancing skil ls through training programmes that are as customised as
possible to individual needs.
Over 1,500 visits have been carried out during the last three ye ars; the results of the
investigations have also allowed the Group to plan the sales ceremony in the best possible way,
differentiating it for the different brands in order to better enhance the distinctive
characteristics of each brand.
The Group’s attention to customer needs is also reflected in its focus on after-sales services and
return management policies . For some years, customers have had the opportunity to exchange
goods at any single-brand boutique, regardless of where the purchase was made. Moreover, in
the case of returns due to product defects, company policies have been defined that offer,
following an objective assessment of the defect, the ability to make a return without the need to
present a receipt, or, if the customer does not l ive near a single-brand boutique, the goods can

2 0 1 7 A n n u a l R e p o r t
73 Report on operations
be collected free of charge from the customer and they can make a purchase on the Group’s
website.
Finally, to further improve the level of service and to minimise waiting times for customers who
have made a return, a company policy has been defined that requires customers to be contacted
if the estimated repair time is longer than two working weeks. Customers can therefore choose
whether to wait for the repair of the product or, alternatively, to receive a vouch er to purchase a
new product.
The J.P. TOD’S Sartorial Collection
The J.P. TOD’S Sartorial Collection achieves the admirable feat of paying tribute to the
history of the TOD’S brand whilst bringing it up to date with the addition of the J.P. initials.
J.P. TOD’S is an exclusive collection of men's footwear and bags, all of which can be
customised with different leathers and the option to add the customer’s own initials. The
purchasing experience takes place at sophisticated J.P. Clubs, which are only found in some
of the greatest cities in the world. Right now, the J.P. TOD’S Sartorial Collection is available
in the TOD’s Milano Spiga, Paris Faubourg, Tokyo Omotesando, Shangai IAPM and Los
Angeles Beverly Hills stores. The J.P. TOD’S Sartorial Collection shopping experienc e is all
about sophistication and attention to detail across spaces, furnishings and artwork, while
dedicated consultants are on hand to guide customers through the customisation and
purchasing process. Moreover, the J.P. TOD’S Sartorial Collection’s refi ned range of the
finest leathers - and accompanying colour palette - is brought together in three sample
books, giving customers the chance to experience the elegance and quality of the materials
used first hand.
The first book is dedicated to Nuvolati leathers, an exclusive TOD’S product created through
an expert production process incorporating several phases of hand -dyeing.
The second book focused on a material called English, referring to traditional English sp lit-
grain leather, which is available in f ive colour versions.
Customers have the option to add their own initials to footwear and bags made using the
exclusive Nuvolato leather, in order to bring an even more personal touch to their J.P. TOD’S
Sartorial product.
Two books detailing the production process help the customer to understand all the various
personalisation options. Customers can choose from between one and four letters, with or
without punctuation, either embossed or painted on in silver. The in itials can be placed on
the upper, heel or welt for footwear and on the handles or strap for bags.

2 0 1 7 A n n u a l R e p o r t
74 Report on operations
Digital’s increasingly central role in the TOD’S brand experience
A sales ceremony that l ives up to the Group’s values and customer expectations is just one of the
ways in which TOD’S focuses o n its customers: the group’s primary objective is, in fact, to
accompany the customer throughout their journey, offering an increasingly evolved and
rewarding brand experience. Consequently, the Group is working to achieve ever greater
integration of digital in its strategies , reducing physical distances in its interaction with
customers, allowing them to feel closer and closer, indeed at the very centre of the brand.
In this regard, the group has launched a multi -channel approach, which will lead to the
progressive release of initiatives aimed at creating a more fluid customer experience between
the physical and digital channels, for example by offering customers the possibility to view online
products in the nearest boutique and to reserve products at the most convenient store, or to buy
online from the boutique.
Customisation: the offer of unique products
The utmost expression of the customer’s central importance in the Group’s strategies is
represented by the ability to offer customers the possibility t o design the products they wear:
feeling part of the creation process, the customers enjoy a unique experience, leading them to
identify themselves with the brand.
With this in mind, TOD’S Group offers its customers the possibility to customise certain
products, increasing their intrinsic value and making the shopping experience even more
special.
MyGommino
The iconic Gommino moccasin is one of the stars of the TOD’S brand customisation service.
Available in TOD’S boutiques and online, the “ My Gommino” programme allows customers to
create their own versions from millions of available combinations.
In addition to the material and colour, they can also choose details
such as stitching, the strap or toecap and can even customise shoes
by changing the colour of the rubber or adding their own initials.
The product is handmade with care and passion by TOD’S artisans
and can be picked up at any of the brand’s single -brand stores or
sent directly to the customer’s home.
HOGAN By You
HOGAN By You is a made-to-order service that allows you to
customise iconic models and new projects by choosing their
distinctive elements and adding exclusive details such as symbols,
numbers and letters.

2 0 1 7 A n n u a l R e p o r t
75 Report on operations
From season to season, new talents are involved and invited to express their pe rsonality with
HOGAN By You.
The customisation service is available on the hogan.com website and in all the brand’s single -
brand boutiques thanks to a dedicated web app; initially designed only for women, since
January 2018 it has also been extended to me n’s products.
As part of the digital shopping experience, in 2012, TOD’S single -brand e-commerce channel was
launched in the United States. In 2013, through the TOD’S Group e -commerce platform, managed
by partner Italian Touch Srl, single -brand online stores were also launched for the HOGAN, FAY
and ROGER VIVIER brands. The Group’s brands’ e -commerce sites, which are constantly updated
and offer fast, immediate navigation that aims to perfectly combine the brands’ storytelling with
the presentation of products from the latest collections, operate in 31 countries worldwide (9 of
which were added in 2017) with a main focus on the markets of North America, Europe and
China. Major new openings are planned in Asia in 2018 and 2019. The Group is increasingly
focused on the mobile experience and on providing customers with impeccable assistance
through internally managed customer service.

2 0 1 7 A n n u a l R e p o r t
76 Report on operations
At an organisational level, the Group’s investment in the digital world is growing, with the
gradual addition of highly specialised figures: the number of resources dedicated to digital within
the brand teams is in fact constantly increasing (+20% in 2017 and +30% expected in 2018
between the headquarters and branches). The sales performance of the direct online channel
recorded growth of +100% in the 2015-2017 three-year period.
2 0 1 7 A n n u a l R e p o r t
77 Report on operations
4. Ethics
Ethics are at the heart of all of the TOD’S Group’s business activities, encapsulating all the
principles to which the Group strives to adhere as it pursu es its objectives. Ethical principles are
of fundamental importance for the Group and its stakeholders and represent a vital element in
day-to-day internal and external relations.
These principles enable the Group to operate transparently and safeguard an d protect all people
with whom it interacts and indeed the environment in which it operates.

2 0 1 7 A n n u a l R e p o r t
78 Report on operations
4.1 Human resources
The TOD’S Group is well aware of the importance of its people and recognises that the most
influential factor in the success of any company i s the people that show hard work and
commitment in contributing to the development of the Group and the creation of value in the
medium and long term.
TOD’S has developed a working environment in which the well-being and professional
development of its employees play a vital role in building a relationship founded on trust and
mutual respect - a bond that goes beyond the standard professional relationship. For this reason,
TOD’S works hard to provide a stimulating, professional, meritocratic, healthy and s afe working
environment that allows employees to freely express their talent and feel valued and
appreciated.
Workforce characteristics
As at 31 December 2017, the TOD’S Group employed 4,627 people, a slight increase (+3.2%) on
the previous year. The percentage of employees based in Italy stood at around 46%, confirming
the Group’s strong bond with Italy.
TOD’S Group employees divided by region
Given the very nature of the Group’s activities, the percentage of employees working in retail
activities stood at 47% of the total at the end of 2017.
Women represent 64.2% of the total workforce and generally outnumber men in almost all
professional categories.
The professional category of “white collar workers” has the largest number of staff members
(2,888), followed by blue collar workers (1,373). These proportions are to be expected given the
Group’s sector of operation.

2 0 1 7 A n n u a l R e p o r t
79 Report on operations
The age range into which most employees fall is the 30-50 bracket, which encapsulates 64% of
the total workforce. This is followed by the <30 bracket, demonstrating the Group’s focus on
investing in young talent.
Attracting talent
Attracting talented people is an objective of fundamental importance for the TOD’S Group, given
that this is the only way to ensure that the standard of the company’s day -to-day activities is
maintained. For this reason, the Group takes great care in recruiting and selecting talent,
adopting consolidated company processes designed to clearly define every stage of the
recruitment process.
Over the course of 2017, 1,556 new recruits joined the TOD’S Group , roughly 54% of whom were
under the age of 30. A total of 1,416 employees left the Group, meanwhile, equating to outbound
turnover of 30.6% (a slight decrease on the 30.8% registered in 2016). This f igure rise s to 48.6%
considering solely staff members under the age of 30. In terms of outgoing staff members, there
were 751 voluntary resignations in 2017, equating to a resignation rate of 16%.
The size of these percentages is largely attributable to retail staff joining and leaving the
company, which is an inevitable part of company life given the Group’s sector of operations.
Recruitment and departures of TOD’S Group staff - 2017

2 0 1 7 A n n u a l R e p o r t
80 Report on operations
Attracting young talent: working with schools and universities
Every year the TOD’S Group’s HR Department organises for the company to take part in careers
days and job fairs at leading Italian and international universities, in order to forge contacts with
the most promising talent from the world of schools and academia.
More specifically, the People Excellence department plans strategic partnerships with the world
of academia and the main social recruiting platforms, focusing on geographical areas considered
crucial to the development of the business.
Over the course of 2017, the Group met students at specially organised events at a number of
prestigious Italian and international universities including the Bocconi University, the Marche
Polytechnic University, the University of Bologna and LUISS in Rome. In total, these events saw
the Group come into contact with around 10,000 students, 500 of which it met directly via
presentations and special meetings.
During these events, the Group gathered over 600 CVs and offered students the chance to have
individual meetings, which gave the y oungsters the chance to gain direct insight into the world of
work through an international organisation like TOD’S.
A number of important agreements between the Group and academic institutions continued in
2017. In Italy, the multi -year agreement with the Bocconi University continued. This aims to
support research, educational and institutional activities in the Fashion and Luxury Management
sector and features a number of opportunities for dialogue. As well as seeing TOD’S participate in
all events organised by the university both at the Milan headquarters and around the world, this
agreement allows the Group to plan student visits to its premises and engage with them in
employer branding activities. Also in 2017, the Group organised a number of in -company training
days, as a way of introducing the Group’s brands to the students. Meetings with company
managers helped to convey the essence of TOD’S to the youngsters. These activities were
organised both in the Group’s Italian headquarters and in a number of overseas offices, focusing
on the most important markets such as Hong Kong, Shanghai and Paris.
Through these initiatives, the Group was able to interact with large numbers of young people,
some of whom were offered the chance to enter into a professional relationship with the Group,
with 112 internships offered in 2017.
Over half of the interns who completed an extra -curricula period of work experience with the
Group then joined the company on fixed -term supply contracts or direct employment contracts.
As part of its efforts to bring the professional and academic worlds closer together, the Group
strives to work with universities in order to develop and promote Master’s courses providing
training in business management, fashion and luxury.
One example of this was the MAFED (Master in Fashion Experience and Design Management)
project , which focused on the HOGAN brand and involved devising a penetration strategy for the
EMEA and Chinese markets at a specific target price. The project saw an international work group
team up for a semester, at the end of which their business plan was presented to the Group’s
Board.

2 0 1 7 A n n u a l R e p o r t
81 Report on operations
Over the course of 2017, the Group focused its attention on the new World Bachelorin Business
(WBB) academic project. This four -year study programme incorporates placements at three
different universities in three different continents: Bocconi, Los Angeles California and Hong
Kong.
The Group’s collaboration with the University of Camerino (UNICAM) also continued this year.
As a member of the committee of benefactors, TOD’S has the aim of guiding academic
programmes in the direction of real market needs. This year, TOD’S organised a meeting at its
headquarters with other business figures from Central Italy. Furthermore, the Group trialled
some additional, innovative collaborative projects, one of which saw students from the IT and
Maths Faculty get the chance to study, develop and create complex colour -matching software
for use in footwear manufacturing.
2017 also saw a pilot project around the theme of moving from school to work . The Group
sealed an agreement with a school in the Macerata area with the aim of helping young people
make their way in the world of work. The project saw seven third -year students each spend two
weeks at the company, for a total of around 80 hours.
The initiative was a great success for all involved and, as a result, efforts were made to map out
the areas/company offices which could be added to the project over the coming years. A
timescale was set out for each area/office, b ased on their individual business needs.
In order to attract the creative talent required by the Group, a partnership with the Istituto
Maragoni in Milan was launched in 2017, with a particular focus on students from the
Accessories Management Master’s cou rse. As part of the project, a group of international
students were tasked with reinterpreting some of the company’s most iconic pieces. The
creations were then judged by an internal panel and the best three were awarded scholarships.
In addition to the monetary prize, the overall winner was given the chance to complete an
internship in a design department with one of the Group’s brands.
As regards the Group’s search for excellent and new talent in technical f ields, TOD’S has
important partnerships with Arsutoria in Milan and the CERCAL footwear school in San Mauro
Pascoli. Pattern-makers and product developers from Arsutoria attended courses and technical
seminars focusing on footwear and looking at specific constructions in some depth, while a
number of internships were launched for San Mauro Pascoli’s CERCAL school - another beacon
of excellence in terms of providing technical training in the footwear industry.
Launched in September 2016, the “Workshops” programme - run with support from the
National Active Labour Policy Agency (ANPAL) - is now a central part of the Group’s training
programme (six-month programmes focusing on leather goods and Italian footwear
manufacturing) . The programme was further consolidated over the course of 2017, with a
particular focus on developing the next generation of artisans, partly to prepare for the
upcoming launch of the new Arquata facil ity, which has been built in record time after the

2 0 1 7 A n n u a l R e p o r t
82 Report on operations
earthquake that hit the mountainous areas of the Marche region in 2016. Five workshop s have
been bui lt, two of which are stil l being completed. One workshop, which was created in
collaboration with IAL Marche (a professional development body affil iated with CISL Marche) ,
saw 60 interns obtain a professional qualif ication for them to work i n footwear manufacturing.
Many of the interns involved in the workshop scheme were later hired by the Group.
Last but not least, the Group also took part in Italian Employers Day between April and June.
These recruitment events took place across Europe, or ganised by the European Network of
Public Employment Services
The TOD’S Group believes that it is vitally important to help new recruits as they settle into the
Group, particularly as a way of conveying the core values necessary to uphold the high qualit ative
standards the Group demands. The aim of the TOD’S Group is to spread its core values around
the world. Two of these are the Italian spirit - italianità - and Italian manufacturing - Made in
Italy- , both of which are intrinsically l inked to the TOD’S Group, permeating everything the
organisation does and guiding all corporate and retail activities. All Italian employees are offered
special induction programmes designed to convey these values and strengthen the staff’s sense
of belonging to the Group.
Promoting the Group’s values among new recruits
The challenge of preserving the values of italianità and Italian manufacturing in the markedly
international environment in which the Group operates is a significant one. In order to ensure
that these values can be taken on board and promoted by all employees in equal measure,
regardless of where they come from, TOD’S launched the Italian Orientation programme.
Established a number of years ago, the programme offers new retail recruits the opportunity to
receive company training paired with a cultural programme. For Italian employees, the three -day
programme includes visits to the TOD’S production site in the Marche region and the corporate
offices in Milan, while employees of the Group’s international offices begin with a visit to Rome
- including a trip to the Colosseum - before visiting the Marche production site and Milan
corporate offices and rounding the trip off with a visit to Villa Necchi in Milan. This initiative is
offered to all store managers and the most deserving store manager assistants and sales
assistants. By alternating cultural activities with opportunities for fun and relaxation,
international employees thus have the chance to completely immerse themselves in the Italian
culture and lifestyle, gaining first-hand experience of the values that define the TOD’S approach
to its own activities and how it tackles relationships with customers.
The programme also represents a unique experience for Italian staff, who get the chance to
interact with colleagues from all over the world, promoting mutual cultural exchange. It is an
initiative that underscores the ongoing TOD’S commitment to creating an increasingly cohesive,
international team.

2 0 1 7 A n n u a l R e p o r t
83 Report on operations
Equal opportunities and non-discrimination
The Group bases i ts approach to managing personnel around the principles of diversity and
multiculturalism. The chance to work with people of different nationalities, with diverse cultural
and professional backgrounds, is of vital importance to an international organisatio n like the
TOD’S Group. By promoting these principles, the Group boosts its personnel’s ability to interact
effectively, thus optimising their day -to-day performance. At the same time, the diversity of the
Group represents a precious tool to help the organ isation understand and respond to the unique
needs of different markets.
The Group’s desire to respect these values is underscored in the Code of Ethics , in which the
Group commits to ensuring that diversity and equal opportunities are respected at every level of
the organisation, with the principles of meritocracy upheld and all forms of discrimination
rejected, including those linked to age, gender, sexual orientation, race, language, nationality,
political opinions, trade union affil iations and religiou s beliefs.
As at 31 December 2017, 64.2% of the entire Group workforce was made up of women, as has
already been mentioned. This strong female presence is seen in all regions in which the Group
operates. In the most senior professional categories (executi ves and managers), the split
between men and women is more equal, although there are slightly more women here too (56%).
The Group’s will ingness to offer part-time contracts is another i l lustration of its commitment to
equal opportunities. As at 31 Decemb er 2017, 7.7% of all Group employees were on part -time
contracts.
Moreover, the Group offers its employees the chance to take parental leave , in accordance with
laws and regulations in the various countries.
Finally, as at 31 December 2017 the Group emplo yed 104 people belonging to legally protected
status (up from 96 as at 31 December 2016). The Group has also signed a number of agreements
with Employment Centres in order to progressively incorporate these people into the Group’s
companies.
Remuneration and benefits
The TOD’S Group’s remuneration policies are also centred around the values of equal
opportunities and equity. All policies are designed to reward the skil ls of each employee.
Every year, the Group companies set out meritocratic remuneration policies, with direct
involvement from managers, who are asked to identify personnel deserving of a pay rise.
Moreover, in addition to standard salaries, the Group also sets out variable retribution plans
(Management by Objectives or MBO) on an annual basi s. These are assigned to management
personnel on the basis of targets achieved over the course of the year.

2 0 1 7 A n n u a l R e p o r t
84 Report on operations
As regards the salaries of new recruits , the TOD’S Group offers salaries in l ine or above the
minimums set out by law or collective bargaining agre ements in the various countries in which it
operates. This applies to both men and women.
Ratio between base salary of new recruits 3 and minimum local salary 4, by significant
operational location
* 2016 data refers to 95% of the Group workforce.
** 2017 data refers to 99.9% of the Group workforce.
There are slight differences in the salaries and remuneration of male and female staff across the
various professional categories. This is inevitable given the different roles and re sponsibilities
held by employees. While there are some anomalies in individual regions in terms of both base
salary and overall remuneration, the analysis reveals no particular disparity between men and
3 “Base salary of new recruits” refers to the lowest salary paid to new recruits in the year in question.
4 “Minimum local salary” refers to the minimum salary permitted according to the collective agreement (where applicable) or
regulations valid in the various countries in which the Group operates.

2 0 1 7 A n n u a l R e p o r t
85 Report on operations
women (neither in 2017 nor 2016). In Europe, the USA and Greater China, the reports for both
years show that women earn slightly more than men in the professional category of “white collar
workers”.
Finally, as regards the benefits offered, the Group strives to minimise inequality and standardise
its offering for all staff members, regardless of their contract type or area of expertise. In a
l imited number of cases regarding some of the Group’s companies, additional benefits of a social
and financial nature are available only to full -time staff. These include health and life insurance
and pension contributions.
Talent development
Employee training has a crucial role in the present and future success of the Group. On the one
hand, training is an important means of professional development and enhancement for
employees. On the other, it represents a valuable way of spreading the Group’s values, furthering
its strategies and ensuring its workforce has the necessary skil ls.
In addition to induction programmes offered to new recruits, the Group has always invested in
developing the technical and professional skil ls of all its employees, offering training courses
tailored as closely as possible to the specific needs of both employee and company.
In 2017, the TOD’S Group delivered over 36,700 hours of training (an i ncrease of around 9% on
the total for 2016). Of this, around 39% was made up of corporate training, with the other 61%
consisting of retail training.
Hours of training delivered, by employee gender and type of training (corporate/retail) 2017
and 2016
* 2016 data refers to 98% of the Group workforce and includes 5,122 hours of retail training
which was unable to be divided by gender.
Retail training
The Group has devised a retail training programme known as Sales Gym , the objective of which is
to reinforce brand identity and optimise sales performance. Training is delivered via a coaching -
style approach to strategic f igures such as retail operation managers, store managers and
assistant store managers, with the aim of supporting their management activi ties and developing
2 0 1 7 A n n u a l R e p o r t
86 Report on operations
the resources available to them. Individual action plans are created for each employee, with
shared objectives set and space for feedback.
The issue of multiculturalism has also been tackled in the retail forum through activities desig ned
to optimise staff’s ability to accommodate international customers. The objective of such
activities is to improve staff’s l inguistic abilities within the context of the selling ceremony and -
more importantly - to help staff understand cultural rules better, thus allowing them to build a
closer relationship with customers, with beneficial consequences for both sales and customer
loyalty. These training programmes have been particularly successful in building understanding of
Chinese, Russian and Arabic cultures, with our salespeople gaining a greater understanding of
customer expectations.
In the field of corporate training, the Group continued training activities designed to boost soft
skil ls in 2017. Soft skil ls are useful not only in terms of incr easing employee productivity and
efficiency, but also as regards improving the working environment and interpersonal
relationships. Through these training programmes, which were intensified during 2017, the Group
has focused on the following areas: engagem ent and communication, personnel management,
delegation and leadership and cohesion and team spirit.
Moreover, in 2017 training courses encompassing languages, health and safety and driving safety
were delivered across all company levels. The courses cont ained modules designed to tackle the
specific training needs of the personnel involved.
Training programmes also continued for key figures in the production process, with coaching
sessions an important part of this. The main figures involved were operation al unit managers and
line managers from the Footwear Department, with the aim of supporting their efforts to manage
and develop human resources. The Group also identified and trained other figures from the
artisanal side of the business, using a Train the Trainer scheme designed to help them plan and
create a training plan, thus optimising the learning process for new interns or apprentice
artisans. The main aim of these activities was to share the required qualitative standards in terms
of processing raw materials and semi-finished products. This also helped to keep the company
processes up to date.
Particular focus was placed on the subject of negotiation, with training delivered to staff
members employed in the procurement department. Various methods for negotiating with
suppliers were presented, with the idea of promoting partnerships encouraged over a price -only
approach.
Much of the Group’s training activities in 2017 focused on IT, with the dual objective of boosting
knowledge of IT equipment used with in the business while improving company performance

2 0 1 7 A n n u a l R e p o r t
87 Report on operations
through more widespread sharing of data and targets to be achieved. By way of example, the
Group organised a number of workshops around the fields of digital and e -commerce, in order to
provide training to employees on new processes introduced by the online side of the business,
particularly those linked to merchandising.
In order to monitor the ability of retail employees and ensure constant improvement, the Group
regularly assesses employee performance so as to be able to set individual targets and ensure
necessary development.
In 2017, 52% of all employees underwent performance appraisals (this f igure was 53% in 2016,
which is roughly in l ine with the 2017 figure). The percentage was particularly high f or
management staff, 87% of which underwent appraisals. The Group is currently developing an
integrated appraisal system which is to be piloted on the Italian management team before being
rolled out to the rest of the company (blue collar workers excluded) by 2020. This means that
around 80% of employees will undergo performance appraisals.
In addition to these formal performance appraisals, the Group strives to promote continuous
dialogue between management and employees, in order to encourage an ongoing f low of
information designed to facil itate constant qualitative improvement.
In relation to the performance of retail employees in particular, the Group has adopted an
incentive programme split by region. The aim of this is to create a fair remuneration sy stem for
store staff. The plan features two incentive tools. Sales assistants are entitled to commission,
which is paid every month and dependent on them hitting sales target as set by the regional
management. In addition to this, store management staff ar e eligible for bonuses, which are
awarded on a weekly basis and are linked to performance appraisals and qualitative and
quantitative indicators.
Employee well-being
The TOD’S Group’s success is closely l inked to the happiness of its workforce and - for this reason
- one of its main objectives is to ensure the well-being of its employees , in order to generate
value in the long term. Employee well -being is not just about professional fulfi lment, but also the
ability to ensure a good work-life balance that never oversteps the mark.
The Parent Company TOD’S supports a number of initiatives in this f ield. Firstly, TOD’S offers its
employees a large range of services at the Group headquarters, including:
a free nursery for employees with children between the ages of two and six. Access is reserved
for the first 28 children who qualify based on a ranking system drawn up every year according to
specific criteria;
a free gym that can be accessed by employees between set hours (during the lunch break and
after 18:00), with the option of attending courses running on a weekly schedule;
a company restaurant serving subsidised meals, using organic and km -0 products;

2 0 1 7 A n n u a l R e p o r t
88 Report on operations
a free media library offering books and DVDs.
In 2008, the Group launched its Welfare programme in Ita ly, with the aim of improving the well -
being of employees and their families. In 2017, the project featured a range of initiatives
providing economic support to employees, including:
an annual gross contribution of €1,400 for employees belonging to the Fo otwear Industry
collective bargaining agreement (CCNL);
a contribution towards employee costs relating to the purchase of school and university books
for children ranging from primary school to university age5;
insurance for employees and their immediate families covering the cost of major specialist
operations, dental treatment, contact lenses and glasses, diagnostic tests, specialist visits and
paediatric preventative healthcare6.
For part-time employees, the €1,400 contribution is paid on a pro -rata basis depending on the
number of hours worked.
Health and safety
Employee well-being is also dependant on the provision of adequate health and safety
conditions at the workplace, across all Group facil ities. TOD’S therefore places great importance
on overseeing these issues, in order to prevent and minimise accidents and injuries.
The entire Group adheres to all health and safety laws and regulations, adapting to the specific
legislation in force in the various countries in which it operates. In order to improve the way it
deals with this issue, the Parent Company TOD’S S.p.A. has internal reporting systems around
Health and Safety in the Workplace. These are regularly sent to control bodies. As part of the
Group’s commitment to transparency, the Prevention and Protection Service Manager is
interviewed by control bodies every week.
In 2017, 77 injuries were reported. Of these, 51 were sustained at the workplace, with 26
sustained during travel.
TOD’S S.p.A. works hard to provide guidance and training around health and safety. All
employees benefit from training programmes focusing on the prevention of injuries and work -
related il lnesses and split between classroom learning and e -learning.
5 This contribution was not paid to employees of Del. Pav. S.r.l.
6 This cover is not applicable to employees on fixed-term contracts or employees of Del. Pav. S.r.l., who are covered by the
insurance provided by the relevant collective bargaining agreement.

2 0 1 7 A n n u a l R e p o r t
89 Report on operations
4.2 Environment
The TOD’S Group is committed to respecting and protecting the environment by reducing the
environmental impact of its activities, through the optimisation and rationalisation of all
processes that may have some impact on the ecosyste m.
Every year, TOD’S undertakes a wide range of initiatives in this f ield. More specifically, the Group
is active in devising and developing projects designed to energy saving and efficiency in its
production and commercial sites. This commitment is accom panied by further ambitious
objectives such as the responsible management of water resources, controlling waste production
and the use of recycled materials for the furnishings of its stores.
Responsible management of resources 7
Energy consumption
Over the course of 2017, the TOD’S Group’s electricity consumption was 126,509 GJ (a slight
decrease on the previous year), while consumption of natural gas was equal to 24,456 GJ (a
16.8% increase on 2016 as a result of unfavourable weather conditions affectin g some of the
Group’s production sites in Italy in early 2017).
In addition to reducing energy consumption, the Group has been focusing on using energy from
renewable sources for a number of years. In 2011, TOD’S installed a photovoltaic facil ity at its
headquarters, with almost all of the energy produced consumed by the company. The plant has
an installed capacity of 956.88 kWp. Over the course of 2017, the photovoltaic facil ity produced
around 4,100 GJ of energy (an increase of 10% on the previous year), satisfying over 15% of the
headquarters’ overall energy needs. In 2017, the diesel fuel consumption was 12,800 liters (a
decrase of 14.7 % on the previous year).
TOD’S also has geothermal facil ities at its headquarters which are used to provide sustainabl e
power for its air-conditioning systems.
7 With reference to the availability and materiality of the data, the sample taken into consideration - which equated to 4,627
employees in 2017 - presents the following limitations:
- electricity consumption refers to 99.2% of the sample evaluated;
- water consumption refers to 99.2% of the sample evaluated;
- the production and disposal of waste refers to 99.2% of the sample evaluated;
Where data was not readily available, estimates have been used.

2 0 1 7 A n n u a l R e p o r t
90 Report on operations
Energy consumption by type (2017 - 2016)
*For natural gas, 1m3 = 0.03901 GJ.
**For electricity, 1kWh = 0.0036 GJ.
Furthermore, the Group’s commitment to reducing energy consumption in 2017 was il lustrat ed by
a range of initiatives focusing mainly on Italy, the location of the Group’s headquarters and main
production and logistics facil ities. This process is the natural consequence of the application and
structured management of the energy efficiency acti on plan produced following an Energy Audit
carried out in 2015. In addition to the requirements set out in Legislative Decree 102/2014, this
audit also analyses the energy consumption of all production and logistics sites owned by the
Group. This action al lowed the Group to obtain two results of great importance. The first was the
production of a detailed site-by-site energy overview, achieved through regular checks and
documentation of electricity usage and resource consumption. The second, meanwhile, was the
production of a general overview of energy consumption and management, which allowed the
group to plan and adopt strategic steps designed to achieve increasingly impressive energy
efficiency and optimisation objectives.
At its Italian headquarters, the Group oversees a range of initiatives in l ine with design
guidelines designed to increase the energy performance of company buildings, including
measures such as:
equipping buildings with high-efficiency insulation;
installing photovoltaic systems;
using geothermal systems for air -conditioning and heating;
replacing traditional l ightbulbs with LED bulbs.
These design guidelines, which were already used in 2014 and 2015 in the construction of a
building within the complex encompassing the headquarters, we re again adopted in the
construction of the new facility in Arquata del Tronto in the Marche region (completed in
December 2017). This facil ity was built according to the latest energy sustainability principles:

2 0 1 7 A n n u a l R e p o r t
91 Report on operations
LED lighting only used (internal and externa l spaces);
movement sensors for turning lights on and off;
high-performance heart pumps used for heating, plus high -efficiency condensing boilers
powered by methane for added support during colder periods;
air treatment and aspiration systems fitted wit h inverter motors;
implementation of a surveillance and monitoring system for l ighting and heating systems;
creation of a 50 KwP photovoltaic system.
2017 also saw the completion of the project to add a roof to the production facil ity in
Comunanza, in the Marche region. Similar projects have already been carried out at the
production sites in Montecosaro and Tolentino, both in the Marche region. This has improved
insulation, with benefits in terms of reducing energy consumption and greenhouse gas emissions .
As regards its production sites, the Group has undertaken the significant task of replacing the
majority of its old motors with more modern motors fitted with inverters, a more flexible
technology which enables operators to alter the motors’ function on the basis of actual needs.
Equally extensive efforts continue to be made to boost the energy efficiency of the Group’s
industrial machinery. In 2017, the Group replaced a furnace with “vacuum chamber” installed in
an assembly line in the Comunanza facil ity.
A number of additional interventions are planned for 2018, including the installation of electrical
meters on all main electrical l ines, in order to ensure regular and comprehensive monitoring of
energy consumption at the Group’s industrial sites, headq uarters and main stores and Italian
facil ities.
Finally, the Group is working to reduce its energy consumption in stores by introducing LED
technology to light rooms and display cases in sales areas.
Reducing energy consumption: a long -term commitment
The Group’s commitment to reducing energy consumption is further i l lustrated by the
feasibility studies it is running and the action it has planned for the near future.
One of the Group’s most important projects is that focused on monitoring energy consumption
at industrial sites through special measuring equipment (MID multimeters). This initiative will
allow the Group to quickly monitor and analyse energy consumption and identify appropriate
optimisation work to be carried out.
At its headquarters, the Gro up is working to increase the efficiency of its external lighting
system by replacing all l ightbulbs at all buildings in the complex with LED bulbs. Fluorescent
ceiling lights at the Comunanza production site and Monteprandone logistics site will be
replaced with LED lights.

2 0 1 7 A n n u a l R e p o r t
92 Report on operations
Water consumption
As regards water consumption , the TOD’S Group has always worked hard to ensure this is
constantly monitored and plans technical checks in the event of significant changes to traditional
consumption levels.
Over the course of 2017, the Group’s water consumption levels were equal to 176,771 m3
(a drop
of around 13% in comparison with 2016).
With consideration to the range of activities undertaken by the business, these consumption
levels are almost entirely attributa ble to the Group’s headquarters and production sites, with
only a small percentage deriving from DOSs and showrooms. In terms of water sources used,
around 40% of water resources comes from the subsoil, with the remainder drawn from
aqueducts. The Group’s commitment to responsible water management is formalised in
guidelines adopted by company headquarters. This is further underpinned by the decision to use
water from the subsoil for all irrigation systems (where present).
Over the course of 2017, the overa ll quantity of water released back into the environment was
estimated at 29,200 m3, in l ine with the previous year. This was made possible thanks to the
condensation mechanism of the Group’s refrigeration systems. Once used, water is collected in
f ire-protection tanks. When the tasks reach maximum capacity, the excess water is released back
into the ground.
Water used by source type 8 (2017 - 2016)
In order to rationalise its water usage, the Group has planned measures to increase the efficiency
of the domestic hot water supply at its headquarters.
Production and disposal of waste
The Group recognises the importance of ensuring the responsible management of the waste
produced as a result of its activities. Where possible, it tries to promote recycling in order to
reduce the quantity of waste requiring disposal.
During 2017, the TOD’S Group produced approximately 1,709 tonnes of waste (a drop of around
11% in comparison with 2016). Again, commercial and production sites in Italy account for the
8 Given that water used for the condensation process does not have its properties altered, it is therefore not considered waste water
and thus the quantity of such water released back into the ground is not included in the sample. The figure in the table relating to the
quantity of water drawn from the subsoil has had the quantity of water released back into the ground in m3 subtracted from it.

2 0 1 7 A n n u a l R e p o r t
93 Report on operations
l ion’s share of this. Virtually the entirety of this f igure - 99.8% - is made up of non-hazardous
waste.
As regards disposal methods, over 58% of the waste produced by the Group has been stored with
a view to recycling in the future. Waste disposed of in landfil ls w as generated by stores and
showrooms in other countries.
* R13: storage for recycling at a later date; D15: preliminary deposit ahead of disposal operations; D8 and D9: biological treatment and chemical/physical treatment; R4: metal
recycling; R5: recyc ling/reuse of other non-organic substances.
In addition to the quantities shown in the above table, 2017 saw around 0.2 tonnes of hazardous
waste and around 124 tonnes of non-hazardous waste generated in the Group’s production sites
in Albania and Hungary. Considering the activities undertaken at these sites, the quantities of
waste generated mainly consist of leather and packaging waste.
Material consumption
Given the Group’s area of operations, significant quantities of office materials and product
packaging materials are used. Therefore, the Group’s places great importance on carefully
managing the consumption of such materials as part of its strategy to minimise and rationalise
environmental impacts l inked to this.
The Group prioritises sustainable materials, particularly those that can be recycled and that come
from responsible sources. It also checks whether its suppliers hold relevant certif ications.

2 0 1 7 A n n u a l R e p o r t
94 Report on operations
Main materials used by type (2017 - 2016)
0% of the reported materials is renewable.
Greenhouse gas emissions9
The main objective of the Group’s strategy as regards environmental protection and reducing the
impact of its activities is to reduce polluting emissions in the atmosphere.
The Group recently began to monitor its greenhouse gas emissions. This enables the Group to
plan future initiatives and projects to ensure ongoing reductions in environmental impacts.
The table below details the main emissions generated by the Group. In compliance with the
Greenhouse Gas (GHG) protocol, the principal emissions reporting standard, the Group’s
emissions have been divided up by type. Scope 1 emissions derive from the Group’s direct
resource consumption, Scope 2 emissions are associated with electricity generation and Scope 3
emissions are linked to employee mobility.
9 With reference to the availability and materiality of the data, the sample taken into consideration - which equated to 4,485
employees in 2016 and 4,627 employees in 2017 - presents the following limitations:
- emissions deriving from electricity consumption (Scope 2) refer to 99.2% of the sample analysed for both years;
- emissions deriving from fuel consumption in hire cars (Scope 3) in 2016 refer to 98.8% of the sample analysed;
- emissions deriving from kilometres travelled by train and aeroplane as part of work trips (Scope 3) refer to 98.8% of the sample analysed for 2016.
Where data was not readily available, estimates have been used.

2 0 1 7 A n n u a l R e p o r t
95 Report on operations
CO2 emissions (2017 - 2016)10
Scope 1 2,189 2,021
Scope 2 15,288 15,614
Scope 3 3,340 3,532
Totale footprint di CO₂ 20,817 21,168
Footprint (Ton CO₂) 2017 2016
As can be seen from the table above, which shows the Group’s greatest impact in terms of C02
emissions, for both years, with reference to Scope 211
, it was equal to 73% in 2017 and 74% in
2016.
As regards production facil ities, an external body was used to calculate Volatile Organic
Compounds (VOC) deriving from production, combining channelled emissions and emissions
released. For the purposes of this calculation, the body an alysed all Italian production sites
included in the mass balance sheets, which are used to create the Solvent Management Plan. The
2017 figure amounts to around 26.6 tonnes of VOCs, down from 32.5 tonnes in 2016.
Transport and logistics12
Given the highly international nature of the Group, whose extensive distribution network
encompasses all the main countries in the world, transport and logistics play an essential role in
product procurement and distribution activities. The Group works hard to minimise the
environmental impacts associated with these aspects, while striving to ensure the standard of the
service offered remains constant given that this area has a significant bearing on customer
satisfaction.
10 Conversion factors used:
- for diesel and natural gas (Scope 1), conversion factors developed by the European Environment Agency were used
[EMEP/EEA Air Pollutant Emission Inventory Guidebook - 2016].
- for petrol and diesel (Scope 1 and Scope 3), conversion factors developed by the European Environment Agency
were used [EMEP/EEA Air Pollutant Emission Inventory Guidebook - 2016] and the conversion factors calculated by
DEFRA [ghg-conversion-factors-2016update].
- for electricity (Scope 2) conversion factors by Terna [International comparisons – 2015] were used for calculation
with the location-based method. However, with reference to the market-based method, emission factors relating to the
“residual mix” were used (Source: AIB – 2016 European Residual Mix) where available; elsewhere, the same
emission factors used for calculation with the location-based method were used.
- for air and rail transport (included in Scope 3), conversion factors calculated by DEFRA were used [ghg-
conversion-factors-2016update]. 11 CO2 emissions calculated with the “location-based method”. However, for the calculation of Scope 2 CO2
emissions, both the methods provided by the GRI Sustainability Reporting Standards were used. With reference to
the “market-based method”, the total emissions of Scope 2 total 24,254 tons for 2016 and 17,472 tons for 2017. 12 Where data was not readily available, estimates have been used.

2 0 1 7 A n n u a l R e p o r t
96 Report on operations
As regards the distribution of f inished products, in 2017 the overall amount of goods dispatched
was equal to around 9,400 tonnes, an increase of approximately 6% on the 2016 figure. The
Group works with leading logistics partners for product deliveries via air, sea and - most
extensively - road.
In order to plan more precise measures to increase consumption efficiency in the area of
transport and logistics, the TOD’S Group is working hard to intensify its monitoring of
environmental impacts stemming from transport and logistics, partly in collaboration w ith its
logistics partners. Where possible, these efforts include a greater focus on vehicles with reduced
environmental impacts.
In terms of the materials used for packaging, the TOD’S Group is examining a range of innovative
solutions designed to progressively reduce environmental impacts in this f ield. As regards the
HOGAN brand, the Group is looking into the possibility of using a special card in its boxes made
using seeds. This type of card is 100% biodegradable . Once the cardboard is “planted”, it ha s the
ability to grow into new plants, thus reducing the environmental impact of the packaging and
ideally offsetting part of the Group’s overall environmental impact.

2 0 1 7 A n n u a l R e p o r t
97 Report on operations
5.Solidarity and Italian spirit
More than anything else, the idea of Italian spirit - Italianità - has always been intrinsic to the
very essence of the Group. TOD’S has forged its world -renowned reputation by drawing values
from the country of Italy, using care and skil l to make them its own. The Group is hugely grateful
for what Italy has given it and thus strives to give back to local areas, providing support for local
communities, particularly the most vulnerable in our society, and promoting art and culture in
Italy.
The Group’s solidarity efforts are not just l imited to the Italian peninsula, however, despite this
being the place in which its roots are firmly set. Given the strong international dimension of the
Group, TOD’S is passionate about the well -being of people all over the world and thus works hard
to share the excellence it has achieved and the value it has generated over so many years through
a range of global projects and initiatives.

2 0 1 7 A n n u a l R e p o r t
98 Report on operations
5.1 Supporting local areas and the country as a whole
The TOD’S Group has always played an active role in supporting the local areas in which it
operates and indeed the country as a whole, with both of these elements having made a vital
contribution to its history and values.
The many initiatives in which the TOD’S Group has participated have always been characterised
by the following themes, which continue to have a significant influence over the spirit behind
such projects:
a sense of responsibility to give back part of its profits to the local community through
participation and acts of gratitude. TOD’S constantly relies on local are as for resources,
energy and artisanal skil ls;
a commitment to take an active role in the promotion and protection of the Italian spirit and
Italian culture around the world, both of which are essential factors in Italian manufacturing
and the handmade feel that defines the craftsmanship behind TOD’S products;
a sense of responsibility deriving from the feeling of belonging to a broad collective and of
knowing that it is in a position to help those most in need by supporting organisations and
associations operating in Italy and around the world.
Supporting local areas
The Group has supported a range of initiatives designed to make a tangible contribution to and
strengthen its strong bond with local communities. A particularly important measure wa s the
decision made at the Shareholders’ Meeting of Parent Company TOD’S S.p.A. in 2012 to use 1% of
the Group’s net profits to support initiatives designed to help the most vulnerable sections of
local society.
Through this initiative - which was launched in 2012 - the Group has been able to collaborate
with a range of volunteer associations, providing financial and operational support for their
projects and participating actively and passionately in order to promote their work over time.
These associations show profound dedication and work ceaselessly to deliver projects across a
wide range of areas, including promoting the education and training of young people, helping
disadvantaged population sectors and supporting families.
The main projects launched or continued in 2017 with help from TOD’S Group are set out below.

2 0 1 7 A n n u a l R e p o r t
99 Report on operations
Family initiatives
Since 2015, the Group has launched a series of initiatives designed to
support families in difficult situations through partnerships with local
religious and non-religious associations and regional institutions, who
have taken part in the Group’s “solidarity meetings”. The Group
organises “poverty meetings” in local areas in order to coordinate the
work of all participating associations working to help citizens o r family
experiencing situations of diff iculty. Tutoring services are also
provided. This initiative is active in Fermo, Civitanova Marche, Comunanza, Comunità Montana
dei Sibil l ini, Tolentino and San Severino Marche.
The Group is active in a range of f ields, including food support, covering medical expenses,
purchasing medicines, paying domestic bil ls, contributing to rent costs and providing support in
emergency situations such as evictions, as well as initiatives designed to help young people and
promote social and professional integration.
In the realm of food support , the Group helps to finance a fund whose aim is to help the “ Banco
delle opere di carità Marche” (Marche charity food bank) association, which has been a presence
in the Marche region sinc e 2013. The charity food bank, which brings together a range of
volunteer associations (over 80 in the Marche region), helps needy families by providing a
monthly supply of basic foodstuffs.
In 2017, a total of 660,000kg of foodstuffs and 2,470,000kg of f ruit and vegetables were
distributed.
In the field of healthcare , TOD’S supports associations working to cover the medical costs of
families in diff icult situations. The Group has set up a fund with the objective of helping
disadvantaged local families to maintain an adequate standard of health and - more importantly -
to deal with exceptional and sudden situations. The Group has signed a memorandum of
understanding with the local public ASUR health facil ity designed to cover the minimum costs of
all healthcare services, with free participation from medical staff on a freelance basis. The aim of
this is to ensure that healthcare is effectively supplied to those most in need. The associations
are the parties responsible for identifying and proposing the be neficiaries of the initiatives.
50
S p e c i a l i s t v i s i t s p r o v i d e d f r e e o f
c h a r g e
10
D i a g n o s t i c r a d i o l o g y t e s t s
a v a i l a b l e
135 M e d i c a l t e s t s a n d t r a n s p o r t s e r v i c e s
p r o v i d e d
20
O r t h o d o n t i c e q u i p m e n t d o n a t e d
≈ 15,000
b e n e f i c i a r i es o f d o n a t i o n s o f b as i c f o o d s t u f f s i n 2 0 1 7

2 0 1 7 A n n u a l R e p o r t
100 Report on operations
Planned healthcare support measures
The “Il volo delle farfalle” (Flight of the Butterflies) project, meanwhile, is oriented towards
disabled people and their families. The project encompasses a series of measures desi gned and
run in partnership with the local “La Crisalide” association. The association provides support to
around 160 families residing largely in the areas around the Group’s headquarters in Sant’Elpidio
a Mare. The Group’s work with the association - which was launched in 2002 - includes the
organisation of a range of activities, all of which are focused on promoting the social integration
of disabled people. The initiative organises a range of activities, including music therapy, courses
encompassing reading and writing, acting, IT, dancing, cooking, singing, rhythmics, music,
creative painting and bricolage. The project also helps disabled people create allotments and
gardens and organises group outings at weekends, in addition to offering occupation the rapy and
appointments with pedagogical specialists.
Social integration - disabled people: main results achieved
(period: September 2016 - September 2017)
As regards gender-based violence , the Group financed a range of activities promoted by th e anti-
violence centre “Percorsi Donna” (Female Journeys) in the province of Fermo in 2017. The
centre’s sites in Sant’Elpidio a Mare, Porto Sant’Elpidio and Fermo took part in the project, in
collaboration with the On The Road association.
Along with the help of a number of regional funds, the Group’s support made it possible to
reinforce and broaden the scope of existing services. The main objectives of all initiatives
designed to combat gender-based violence is to support women and encourage them to rep ort
abuse, to l isten to them and to provide tangible legal, psychological and economic support.
The centres also work to facil itate - where necessary - contact between victims of violence and
local services and law enforcement agencies.
A shelter was set up in 2017 to offer protection and accommodation to women who are suffering
from violence and find themselves forced to leave their homes and live in situations of danger
that endanger both themselves and their children.
≈ 280 P e o p l e i n v o l v e d b y
a c t i v i t y
≈ 570 M e e t i n g s b y a c t i v i t y
≈ 4,430
S e r v i c e s s u p p l i e d
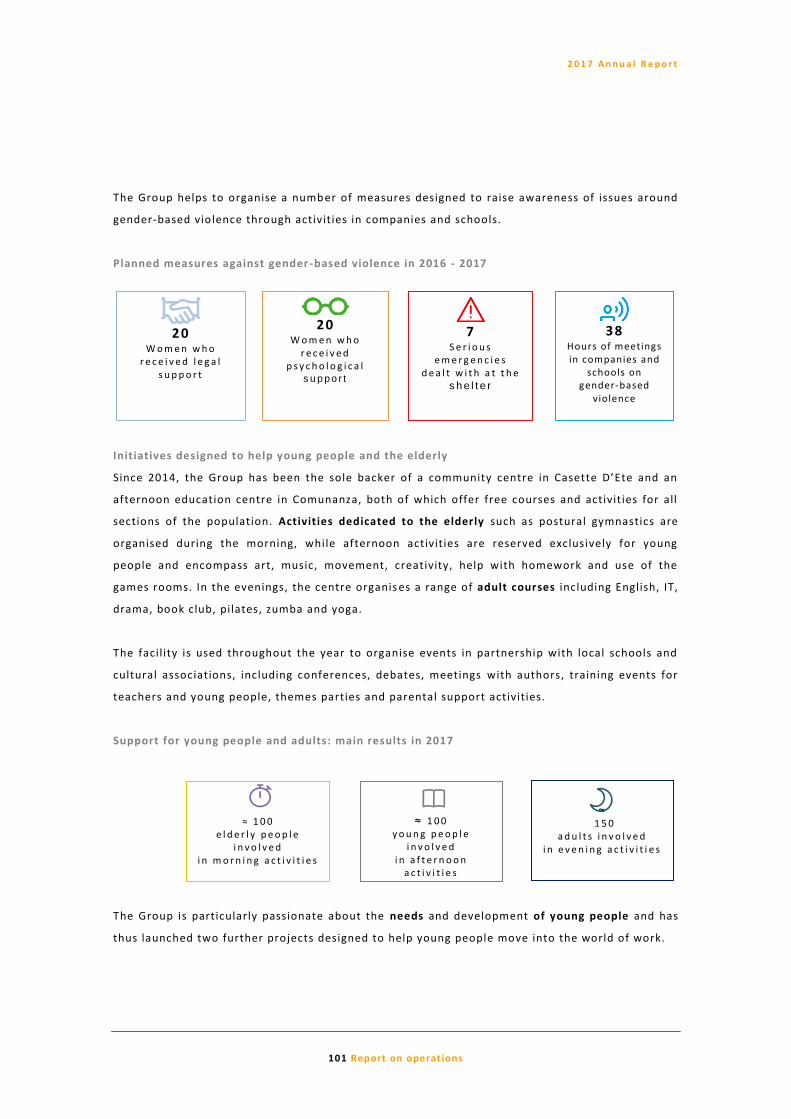
2 0 1 7 A n n u a l R e p o r t
101 Report on operations
The Group helps to organise a number of measures designed to raise awareness of issues around
gender-based violence through activities in companies and schools.
Planned measures against gender -based violence in 2016 - 2017
Initiatives designed to help young people and the elderly
Since 2014, the Group has been the sole backer of a community centre in Casette D’Ete and an
afternoon education centre in Comunanza, both of which offer free courses and activities for all
sections of the population. Activities dedicated to the elderly such as postural gymnastics are
organised during the morning, while afternoon activities are reserved exclusively for young
people and encompass art, music, movement, creativity, help with homework and use of the
games rooms. In the evenings, the centre organis es a range of adult courses including English, IT,
drama, book club, pilates, zumba and yoga.
The facil ity is used throughout the year to organise events in partnership with local schools and
cultural associations, including conferences, debates, meetings with authors, training events for
teachers and young people, themes parties and parental support activities.
Support for young people and adults: main results in 2017
The Group is particularly passionate about the needs and development of young people and has
thus launched two further projects designed to help young people move into the world of work.
20 W o m e n w h o
r e c e i v e d l e g a l s u p p o r t
38
Hours of meetings in companies and
schools on gender-based
violence
7 S e r i o u s
e m e r g e n c i e s d e a l t w i t h a t t h e
s h e l t e r
20 W o m e n w h o
r e c e i v e d p s y c h o l o g i c a l
s u p p o r t
≈ 1 0 0 e l d e r l y p e o p l e
i n v o l v e d i n m o r n i n g a c t i v i t i e s
≈ 1 0 0 y o u n g p e o p l e
i n v o l v e d i n a f t e r n o o n
a c t i v i t i e s
≈
1 5 0 a d u l t s i n v o l v e d
i n e v e n i n g a c t i v i t i e s

2 0 1 7 A n n u a l R e p o r t
102 Report on operations
The first project offers the most deserving students from a hospitality
institute the chance to perfect the skil ls they have obtained in the
classroom by spending a few weeks working on the ground in
prestigious restaurants and hotels in a number of European capitals.
The Group covers 100% of the students’ travel and accommodation
costs. In addition to academic training in the classroom and on-the-job
training, the young people are also able to take part in workshops and exercises designed to
ensure the ongoing development of their abilities.
The same students also take part in a second project, which includes
cooking workshops teaching them how to make authentic, healthy
food that they then serve up for lunch at the institute to vulnerable
elderly people who have been flagged up by Sant’Elpidio a Mare social
services. TOD’S purchases all the raw ingredients needed to prepare
the food and covers all costs relating to kitting out the room used to
accommodate the elderly people.
In addition to representing a great training opportunity for the young people, this project
ensures that guests are eating properly thanks to special menus prepared by the youngsters and
their teachers.
Staying on the subject of school projects, during the 2016/17 school year a number of students
and teachers from the hospitality institute helped to prepare meals for students of other courses
attending afternoon lessons. On average, 40 meals were provided every day. The aim of the
project was to give the students as realistic a taste of the restaurant industry as possible while at
the same time providing a useful service to the school.
Providing support to the elderly is another important objective which the Group continues to
pursue through a series of projects designed to make a tangible contribution to the elderly across
a number of areas including: information, communication, services, assistance and promotions.
The Group organises initiatives in this area in collaboration with Senior Italia Federcentri,
working in close partnership with the provincial and regional coordination centres and with
public bodies such as ASUR and INCRA (National Institute for the Rest and Care of the Elderly).
Over the course of 2017, the Group took part in a project involving many of the 75 social centres
in the province of Ascoli Piceno and Fermo. The project saw a range of initiatives organised in
order to promote the physical and psychological well-being of the elderly, to raise awareness in
local communities of issues relating to the elderly and to encourage social activities.
2 0 / 2 5 s t u d e n t s
u n d e r t a k i n g e x p e r i e n c e s a b r o a d
e v e r y y e a r
≈ 4 0
m e a l s p r e p a r e d b y s t u d e n t s p e r d a y

2 0 1 7 A n n u a l R e p o r t
103 Report on operations
The Group didn’t just provide economic support to the social centres, but also purchased means
of transport to help elderly people travel to and from the centres and make it easier for them to
take part in the activities organised.
The interesting “La fattoria sociale Montepacini” (Montepacini Social Farm) project was also
launched in 2017. This multi-year social experiment sees participation from parents, volunteers
and a range of associations operating in the areas of biodiversity, short -chain systems and food
sustainability. The Group co -funds the project, ensuring that many of the initiatives ca n go
ahead, including a rehabilitative social/educational centre working with 16 disabled young people
and adults, a summer centre in the countryside for over 200 children, agricultural activities and
farmyard livestock rearing, work to salvage and preserv e ancient and rare seeds and efforts to
get young political asylum seekers involved in the activities (15 young people from the Protection
System for Asylum Seekers and Refugees (SPRAR)). Among the many activities organised, there is
also a football team made up of youngsters from the centre. The team competes in a league.
The initiative represents a way of bringing people together, promoting socialising while
celebrating the values of collaboration and volunteering.
Tangible support: the Arquata del Tron to facility
Another concrete example of the TOD’S Group’s commitment to supporting the local community
l ies in its decision to help the population of the town of Arquata del Tronto and the surrounding
areas in the Marche region after the devastating earthq uake of 24 August 2016. As a way of
sending out a clear message of hope and possibility, TOD’S chose to build a new facility in
Arquata and get local young people involved. The Group’s inspiration for the project was drawn
from the history of Made in Italy , which has always been a guiding factor for the organisation in
that it is synonymous with quality and beauty - but also tradition, culture and sharing.
The facil ity was built on a site of around 5,000 square metres and was inaugurated on 20
December 2017. It can accommodate around 100 production staff. Built in the space of just one
year, the facil ity is initially employing over 30 people - giving them a chance to rebuild a future in
1,800
Elderly people involved in the
“Missione benessere” (Mission well -being) project in both 2016
and 2017
82
Activities organised for elderly people, including courses, workshops and
conferences in both 2016 and 2017.

2 0 1 7 A n n u a l R e p o r t
104 Report on operations
their local area, which was devastated by the violent earthquake in 201 6.
The young people began training activities well before the official opening of the factory. The
project allows the Group to make a tangible contribution to efforts to keep the local community
alive and working following the earthquake, but also sends ou t a message of hope to local
people, who are stil l l iving with the far -reaching consequences of the earthquake.

2 0 1 7 A n n u a l R e p o r t
105 Report on operations
Aware of its role in this area, the Group has placed particular importance on this project. One of
its objectives was to set an example for other businesses and show that it wants to invest in the
local area. In addition to providing a positive response to such a terrible situation as the one
affecting these communities, the project is a way of sending out a strong message to the world
that this is an economy that is reacting and bouncing back from adversity.
Initiatives supporting Italy’s artistic and cultural heritage
Supporting Italian culture , celebrating the Italian spirit and promoting the image of Italy around
the world are further important objectives for the TOD’S Group, which is active in a range of
initiatives designed to protect and promote Italy’s historical and cultural heritage. The aim of
such projects is to consolidate the country ’s wonderful reputation, promote its image and spread
its values. In 2011, the Group teamed up with the Ministry of Cultural Heritage and Activities and
the Special Superintendency for the Archaeological Heritage of Rome to fund a series of
restoration measures involving the Colosseum , of a total value of €25 mill ion. In 2016, the first
phase of the measures came to a close with the completion of the restoration of the north and
south sides and the installation of perimeter fences. These measures saw the ancient splendour
of one of the most important and well-known symbols of Italy’s artistic and cultural heritage
restored. To coincide with the completion of the first phase of the works, TOD’S launched the
“Un’arena di luci e colori ” (An Arena of Light and Colour) initiative in partnership with the
Special Superintendency for the Colosseum and Rome’s main archaeological areas. The project -
which was organised in order to ensure the whole community was able to make the most of the
Colosseum - consisted of a stunning light show inside the Colosseum itself. Around 7,000 people
from various federations, Confartigianato, Confesercenti, Confcommercio, accredited personal
services organisations, Caritas, hospitals, schools, universities and law enforcement attended the
event, which offered up an unforgettable ex perience in one of the most iconic monuments for
the promotion of Italian culture around the world.
As part of its attempts to celebrate Italian culture, manufacturing and contemporary art, the
TOD’S Group supports two emblems of Italian culture in Milan: the La Scala Theatre and the
Padiglione di Arte Contemporanea (PAC) . The Group is proud to be a Permanent Founding
Member of the La Scala Theatre Foundation , a prestigious and vitally important international
institution working to celebrate the historical and cultural heritage of the theatre. The
foundation also provides an opportunity to support an exquisite schedule of artistic events and
contribute to the objective of promoting musical culture around the world.
As regards the Padiglione di Arte Contemporanea (PAC) , the Group has a four-year agreement
with the Municipality of Milan designed to support the completion and promotion of research
activities and projects run by the Padiglione, a vital institution in the international contemporary
art panorama. The Padiglione plays host to unique, globally relevant exhibitions and attracts an

2 0 1 7 A n n u a l R e p o r t
106 Report on operations
average of 20,000 visitors to every exhibition. During 2016, TOD’S helped to create and promote -
in its role as technical sponsor - an important photography exhibition ent itled So Far So Goude .
The exhibition was dedicated to Jean Paul Goude, the unmistakeable photographer behind some
of the most iconic images of recent decades. Part of the proceeds from the exhibition were
donated to the PAC itself for maintenance, protect ion and restoration work, with additional
profits being donated to Don Mazzi’s Exodus charity to support a project focusing on providing
training and combating school dropouts. In February, for the third year running, the TOD’S Group
made a contribution to the PAC to help organise the “Riscatti” photography exhibition, which this
year focused on 29 young people being treated at the National Cancer Institute of Milan (INT) as
they set about learning the art of photography. Proceeds from the sale of the image s displayed,
which were taken by artists from all over the world, were used to fund further initiatives in the
Progetto Giovani (Youth Project), which is run by the Bianca Garavaglia Association in the
paediatric ward at the INT.
VB Handmade - Performance by Vanessa Beecroft
On 26 February 2016, the day of the unveiling of the brand’s new collection, the TOD’S Group
teamed up with the artists Vanessa Beecroft, who organised a performance at the PAC in Milan.
Beecroft’s performance interpreted some of the Group’s core values, celebrating the quality, art
and savoir faire of the TOD’S artisans and channelling this into contemporary art. “The people
around the table were able to see leather become transformed into a sensual dress around the
muse Karlie Kloss.”
Wrapping - Performance by Thomas De Falco
On 24 February 2017, the TOD’S Group teamed up with the artist Thomas De Falco in order to pay
tribute to the art of craftsmanship. The performance, which again took place at the PAC in Milan,
showcased the artist’s famous knots, which on this occasion were made from leather in white and
brown, draped around the bodies of a number of models, including Naomi Campbell.
This fusion of leather and skin, brought together in a unique performance, showed the public a
new way of combining art and craftsmanship, celebrating the timeless elegance that has always
been at the heart of the TOD’S Group ethos.

2 0 1 7 A n n u a l R e p o r t
107 Report on operations
TOD’S again teamed up with Vanessa Beecroft - one of the undisputed stars of the international
art scene - for two unique performances, once held in the courtyard of Palazzo Strozzi and the
other in the Sala della Niobe at the Uffizi Gallery. Both performances combined ancient and
contemporary music in some of the most prestigious and beautiful locations in Florence as part
of the “Firenze suona contemporanea” festival, which ran from 28 September to 2 October 2017.

2 0 1 7 A n n u a l R e p o r t
108 Report on operations
By renting out Milan’s Villa Necchi to present its collections, TOD’S continued to support the
mission of the Fondo Ambiente Italiano (FAI) . Launched in 1975, the non-profit organisation
invests great passion and enthusiasm in order to save some of the most important parts of Italy’s
art heritage and natural wonders from decline. The fund also undertakes restoration work and
ensures the Italian public can enjoy these assets, while raising awareness among institutions and
the general public on how to protect them.
By way of i l lustration of the Group’s commitment to bringing fashion and art closer together, the
Group has donated a number of pieces from its collection to the Veneranda Fabbrica del Duomo
organisation in order to fund restoration work on Milan’s Duomo . Together with pieces from
other fashion brands, the TOD’S products were auctioned off at an event held on 19 April 2016.
Community work
The Group also supports those most in need through contributions to a range of non -
governmental associations operating in Italy and around the world. For example, TOD’S has for
many years worked with Save The Children on a range of projects such as the “ I lluminiamo il
futuro” (Light up the Future) campaign, which aims to fight economic and educational poverty by
supporting the education of children living in poverty. The project features the creation of
facil ities known as “Punto Luce” (Light Points). These educational spaces are set up in
disadvantaged areas, with the aim of engaging with children and adolescents.
As part of this project, the TOD’S Group worked with Save the Children to set up a Punto Luce in
Naples’ Barra area. The 4,500 square metre space was designed to be used by local young people
and their parents and represents a haven of education and culture for children and adolescents.
The aim is for the space to become a “hub of local education services”, allowing schools, social
services, other local associations and even the young people themselves to get involved in
planning Punto Luce activities, thus offering them development support and facil itating their
social inclusion and integration. The centre - which was completely renovated by Save the
Children, with TOD’S making another contribution in 2017 - hosts a range of free activities for
children and young people between the ages of six and 16: physical activity and sports, creative
workshops, circus and theatre workshops, music, study support, e ducational sessions about how
to use new media responsibly and a l ibrary.
Another important partnership is with the San Patrignano rehabilitation community, which
welcomes young men and women for free. The Group has been working with San Patrignano since
2016 to create a special collection. The Group provided free raw materials and sent skil led
artisans to give the young people a chance to create a collection of bags and leather goods at
the community. The project is a wonderful opportunity to underline the importance of
professional development, which is one of the community’s primary objectives.

2 0 1 7 A n n u a l R e p o r t
109 Report on operations
All proceeds from the initiative, which were raised through the sale of the products created by
the community residents on San Patrignano through the e -commerce website and at the outlet
store at the Group’s headquarters, were donated back to the community, which used them to
fund and run more projects. Overall, the project provided invaluable training and provided much -
needed motivation to the young people of San P atrignano.
HOGAN Junior and FAY Junior team up with the Istituto Marangoni for the Francesca Rava
Foundation
In 2017, HOGAN Junior and FAY Junior teamed up with the Istituto Marangoni on an important
charity project. During Pitti Immagine Bimbo , the brands unveiled a project supporting the
Francesca Rava Foundation.
The Francesca Rava Foundation is an international humanitarian organisation that has been
working to support orphaned and abandoned children and guide them through the education
process for over 60 years.
As part of the sustainability project, HOGAN and FAY worked with the prestigious fashion event
to create an educational initiative for the students of the institute, who were asked to create a
series of artwork. Six pieces were then selected to be made into a l imited-edition t-shirt
collection.

2 0 1 7 A n n u a l R e p o r t
110 Report on operations
The t-shirts went on sale in stores and online on 23 June, with all proceeds donated to the
Francesca Rava Foundation to support the “Scuole di Strada” (Street Schools) project in Haiti.
Finally, in addition to the main initiatives already described, the Group also took part in a
number of fundraising dinners in 2017, donating many products for charity auctions. The Group
worked with around 15 charitable organisations in this way, including the Anla ids Foundation,
ANT Italia Onlus, Charity Star, Dynamo Camp, Save the Children and Telethon.

2 0 1 7 A n n u a l R e p o r t
111 Report on operations
6.Appendixes
Breakdown of employees by professional category and gender
Breakdown of employees by professional category and age range
Breakdown of employees by contract type and gender
Breakdown of employees by professional category and gender

2 0 1 7 A n n u a l R e p o r t
112 Report on operations
Breakdown of employees by type (corporate/retail) and gender
Breakdown of employees by type (corporate/retail) and age range
Employees covered by collective bargaining agreements*
Data as at 31 December 2016 refers to 99.5% of the Group workforce.
* These percentages are calculated on the basis of the total number of employees as at 31
December 2016 and 31 December 2017, rega rdless of collective bargaining agreements in the
countries in which the Group operates.
Employees incoming - 2017

2 0 1 7 A n n u a l R e p o r t
113 Report on operations
Employees incoming - 2016
Employees outgoing - 2017
Employees outgoing - 2016
Type of injuries recorded – 2017*
* This data does not include external collaborators.

2 0 1 7 A n n u a l R e p o r t
114 Report on operations
Rate of injury - 2017*
* The Group’s rate of injury refers to 89.4% of the sample analysed.
(a) The severity index is the ratio between the total number of days lost due to injury and work-
related il lnesses and the total number of eligible work hours in the same period, multiplied by
200,000.
(b) The rate of injury is the ratio between the total number of injuries and the total number of
hours worked in the same period, multiplied by 2 00,000.
(c) The rate of work-related il lness is the ratio between the total number of cases of work -related
il lnesses and the total number of hours worked in the same period, multiplied by 200,000.
(d) The rate of absenteeism is the ratio between the tot al number of days’ absence and the total
number of eligible work days in the same period, expressed as a percentage.
* This data does not include external collaborators.
Ratio between base salary for men and women - 2017
Ratio between base salary for men and women - 2016
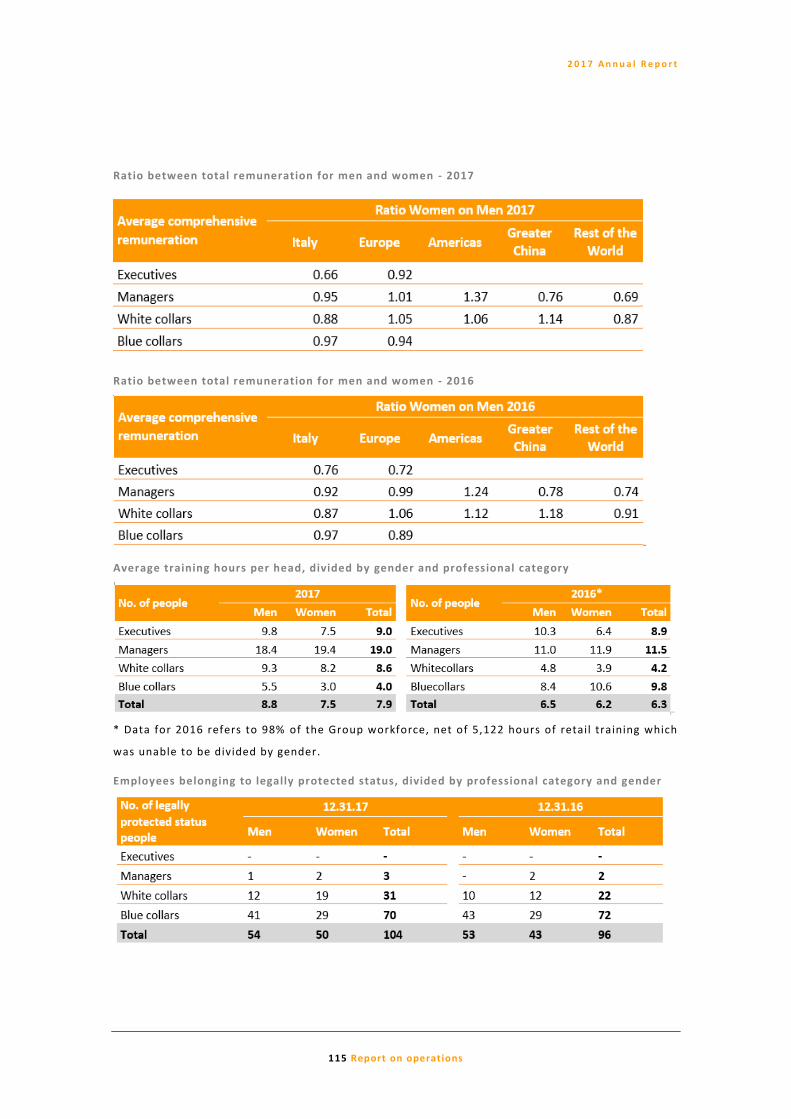
2 0 1 7 A n n u a l R e p o r t
115 Report on operations
Ratio between total remuneration for men and women - 2017
Ratio between total remuneration for men and women - 2016
Average training hours per head, divided by gender and professional category
* Data for 2016 refers to 98% of the Group workforce, net of 5,122 hours of retail training which
was unable to be divided by gender.
Employees belonging to legally protected status, divided by professional category and gender

2 0 1 7 A n n u a l R e p o r t
116 Report on operations
7.Scope and impact of material topics
Material topic Correlation with topic-specific disclosures
Scope of material topic
Type of impact
Customer satisfaction
N/A
TOD’S Group,
suppliers, external
workshops
Caused by the Group
and directly connected
to its activities
Ethics and integrity
Anti-corruption;
Environmental
compliance;
Non-discrimination
TOD’S Group Caused by the Group
Health and safety Occupational health
and safety
TOD’S Group,
suppliers, external
workshops
Caused by the Group
and directly connected
to its activities
Product quality and
uniqueness N/A
TOD’S Group,
suppliers, external
workshops
Caused by the Group
and directly connected
to its activities
Economic performance Economic performance TOD’S Group Caused by the Group
Brand identify and
enhancement N/A TOD’S Group Caused by the Group
Support for local
communities Local communities TOD’S Group Caused by the Group
Respect for human
rights
Supplier social
assessment
TOD’S Group,
suppliers, external
workshops
Caused by the Group
and directly connected
to its activities
Well-being of
employees and their
families
Employment TOD’S Group Caused by the Group
Raw materials and
responsible
manufacturing
Materials
TOD’S Group,
suppliers, external
workshops
Caused by the Group
and directly connected
to its activities
Training and
enhancement Training and education TOD’S Group Caused by the Group
Risk management N/A TOD’S Group Caused by the Group

2 0 1 7 A n n u a l R e p o r t
117 Report on operations
Sustainable
procurement practices Procurement practices
TOD’S Group,
suppliers, external
workshops
Caused by the Group
and directly connected
to its activities
Environmental
responsibility
Environmental
compliance TOD’S Group Caused by the Group
Presence on the
market
Presence on the
market TOD’S Group Caused by the Group
Production and
disposal of waste Effluents and waste
TOD’S Group,
suppliers, external
workshops , end
customers, wholesale
customers
Caused by the Group
and directly connected
to its activities
Equal opportunities
and non-discrimination
Diversity and equal
opportunities;
Non-discrimination
TOD’S Group Caused by the Group
Protecting art and
culture Local communities TOD’S Group Caused by the Group
Responsible
consumption
Materials; Energy;
Water
TOD’S Group,
suppliers, external
workshops
Caused by the Group
and directly connected
to its activities
Sustainable business
strategy N/A TOD’S Group Caused by the Group
Greenhouse gas
emissions Emissions
TOD’S Group,
suppliers, external
workshops
Caused by the Group
and directly connected
to its activities
Responsible marketing Marketing and
labelling
TOD’S Group,
suppliers, external
workshops
Caused by the Group
and directly connected
to its activities
Labour management
relations
Labour management
relations TOD’S Group Caused by the Group

2 0 1 7 A n n u a l R e p o r t
118 Report on operations
8. GRI Content Index
The TOD’S Group’s Non -Financial Statement for 2017 was produced in accordance w ith GRI
Standards (Core Option). The following table shows Group data based on GRI Standards, with
reference to the materiality analysis. For each piece of data shown, the relevant page number in
the Non-Financial Statement (DNF) and/or Annual Financial Re port (RFA) is shown.
GRI
Standard Disclosure Page No.
GENERAL DISCLOSURE 2016
Organisational profile
102-1 Name of the organisation DNF pp. 30-32
102-2 Primary brands, products and services DNF pp. 48-52
102-3 Location of headquarters DNF pp. 30-33;
RFA p. 1
102-4 Location of operations DNF pp. 53-54;
RFA pp. 4, 6
102-5 Ownership and legal form DNF pp. 39-43;
RFA pp. 1, 4-5
102-6 Markets served DNF pp. 53-54;
RFA p. 6
102-7 Scale of the organisation DNF pp. 46, 78;
RFA pp. 7-9
102-8 Information on employees and other workers DNF pp. 78, 103, 111
102-9 Description of the supply chain DNF pp. 54-65
102-10 Significant changes to the organisation’s size, structure,
ownership, or supply chain during the reporting peri od
There were no significant changes to the size, structure, ownership or supply chain during reporting period
102-11 Application of precautionary approach to risk
management DNF pp. 43-46
102-12
Adherence to or adoption of codes of conduct, princip les
and charters developed by external bodies/associations
relating to economic, social and environmental
performance
DNF pp. 37-38, 58, 67
102-13 Membership of associations or organisations promoting
sustainability in Italy or around the world.
DNF pp. 35, 58, 64-65,
67
Strategy
102-14 Statement from senior decision-maker DNF p. 29

2 0 1 7 A n n u a l R e p o r t
119 Report on operations
102-15 Description of key impacts, risks and opportunities DNF pp. 43-46
Ethics and integrity
102-16 Values, principles, standards and norms of behaviour DNF pp. 37-39, 43, 64-
65, 67
102-17 Descriptions of mechanisms for advice about unethical
or unlawful behaviour DNF pp. 39, 43
Governance
102-18 Governance structure DNF pp. 39 -43;
RFA p. 3
Stakeholder engagement
102-40 List of stakeholder groups engaged DNF pp. 33-35
102-41 Collective bargaining agreements DNF p. 112
102-42 Identifying and selecting stakeholders DNF pp. 33-35
102-43 Approach to stakeholder engagement DNF pp. 33-35
102-44 Key topics and concerns raised through stakeholder
engagement DNF pp. 33-35
Profile of Non-Financial Statement
102-45 Entities included in the consolidated financial
statements
DNF pp. 30-32;
RFA pp. 4-5
102-46 Defining Non-Financial Statement content and
Boundaries DNF pp. 36-37, 116-117
102-47 Material topics identified DNF pp. 36-37, 116-117
102-48 Restatements of information This is the TOD’S Group’s f irst Non -Financial Statement
102-49 Significant changes from the previous reporting period This is the TOD’S Group’s f irst Non -Financial Statement
102-50 Reporting period DNF pp. 30-32
102-51 Publication date of the most recent Non -Financial
Statement
This is the TOD’S Group’s f irst Non -Financial Statement
102-52 Reporting cycle
This is the TOD’S Group’s f irst Non -Financial Statement. Further editions will be released annually
102-53 Contact point for questions regarding the financial
statements and their content DNF p. 32
102-54 Indication of the selected “in accordance” option DNF pp. 30-32 , 118
102-55 GRI content index DNF pp. 118-126

2 0 1 7 A n n u a l R e p o r t
120 Report on operations
102-56 External assurance
This Non-Financial Statement has undergone external assurance.
GRI
Standard Disclosure Page No. Omission
MATERIAL TOPICS (all material topics have been assessed according to topic -specific disclosures relating to 2016)
Economic performance
103-1 Explanation of material topics DNF pp. 36-37,
116-117
103-2 Management approach DNF p. 46;
RFA pp. 7-9
103-3 Evaluation of the management approach DNF p. 46;
RFA pp. 7-9
201-1 Direct economic value generated and
distributed DNF p. 46
Presence on the market
103-1 Explanation of material topics DNF pp. 36-37,
116-117
103-2 Management approach DNF pp. 78, 84,
120
103-3 Evaluation of the management approach DNF pp. 78, 84,
120
202-1 Ratios of standard entry level wage by gender
compared to local minimum wage DNF p. 84
202-2 Proportion of senior management hired from
the local community
In 2017, 82.7% of senior managers in the Group’s companies were hired from local communities (down from 83.7% in 2016)
Procurement practices
103-1 Explanation of material topics DNF pp. 36-37,
116-117
103-2 Management approach DNF pp. 54-64
103-3 Evaluation of the management approach DNF pp. 54-64
204-1 Proportion of spending on local suppliers DNF p. 56
Anti-corruption
103-1 Explanation of material topics DNF pp. 36-37,
116-117
103-2 Management approach DNF pp. 37-38,
43

2 0 1 7 A n n u a l R e p o r t
121 Report on operations
103-3 Evaluation of the management approach DNF pp. 37-38,
43
205-3 Confirmed incidents of corruption and actio ns
taken
The Group registered no incidents of corruption in 2016 and 2017
Materials
103-1 Explanation of material topics DNF pp. 36-37,
116-117
103-2 Management approach DNF pp. 56-64, 93-94
103-3 Evaluation of the management approach DNF pp. 56-64, 93-94
301-1 Materials used by weight or volume DNF pp. 58, 94
The raw materials analysed (page 58) refer to raw materials purchased, and not raw materials consumed. This information is not available due to confidentiality issues.
Energy
103-1 Explanation of material topics DNF pp. 36-37,
116-117
103-2 Management approach DNF pp. 89-91
103-3 Evaluation of the management approach DNF pp. 89-91
302-1 Energy consumption within the Group DNF p. 90
Water
103-1 Explanation of material topics DNF pp. 36-37,
116-117
103-2 Management approach DNF pp. 89, 92
103-3 Evaluation of the management approach DNF pp. 89, 92
303-1 Total water withdrawal by source DNF p. 92
Emissions
103-1 Explanation of material topics DNF pp. 36-37,
116-117
103-2 Management approach DNF pp. 89, 94-
95

2 0 1 7 A n n u a l R e p o r t
122 Report on operations
103-3 Evaluation of the management approach DNF pp. 89, 94-
95
305-1 Direct (Scope 1) GHG emissions DNF pp. 94-95
305-2 Energy indirect (Scope 2) GHG emissions DNF pp. 94-95
305-6 Emissions of ozone-depleting substances (ODS) DNF pp. 94-95
305-7 Nitrogen oxides (NOX), sulphur oxides (SOX),
and other significant air emissions DNF pp. 94-95
Effluents and waste
103-1 Explanation of material topics DNF pp. 36-37,
116-117
103-2 Management approach DNF pp. 89, 92-
93
103-3 Evaluation of the management approach DNF pp. 89 , 92 -
93
306-2 Waste by type and disposal method DNF p. 93
Environmental compliance
103-1 Explanation of material topics DNF pp. 36-37,
116-117
103-2 Management approach DNF p. 89
103-3 Evaluation of the management approach DNF p. 89
307-1
Monetary value of significant f ines and total
number of non-monetary sanctions for non-
compliance with environmental laws and
regulations
The Group received no significant f ines or non-monetary sanctions deriving from non-compliance with environmental laws and regulations during 2016 and 2017
Employment
103-1 Explanation of material topics DNF pp. 36-37,
116-117
103-2 Management approach DNF pp. 78-82,
85, 87-88
103-3 Evaluation of the management approach DNF pp. 78-82,
85, 87-88
401-1 Total number of new employee hires and
turnover rate
DNF pp. 78-79,
112-113
401-2 Benefits provided to full -time employees that
are not provided to temporary or part-time
DNF pp. 85, 87-
88

2 0 1 7 A n n u a l R e p o r t
123 Report on operations
employees
Labour management relations
103-1 Explanation of material topics DNF pp. 36-37,
116-117
103-2 Management approach DNF pp. 78, 112
103-3 Evaluation of the management approach DNF pp. 78, 112
402-1 Minimum notice periods regarding operational
changes
The minimum notice period is set out in collective bargaining agreements, where present, and by laws in force in the countries in which the Group operates.
Occupational health and safety
103-1 Explanation of material topics DNF pp. 36-37,
116-117
103-2 Management approach DNF pp. 78, 88
103-3 Evaluation of the management approach DNF pp. 78, 88
403-2
Types of injury and rates of injury, occupational
diseases,
lost days and absenteeism, and number of
work-related fatalities, divided by region and
employee gender
DNF pp. 113-114
A system of data collection for injuries and the main injury indicators will be developed by the end of the 2019 reporting period
Training and education
103-1 Explanation of material topics DNF pp. 36-37,
116-117
103-2 Management approach DNF pp. 78-82,
85-87
103-3 Evaluation of the management approach DNF pp. 78-82,
85-87
404-1 Average hours of training per year per
employee DNF pp. 85, 115
Diversity and equal opportunities
103-1 Explanation of material topics DNF pp. 36-37,
116-117

2 0 1 7 A n n u a l R e p o r t
124 Report on operations
103-2 Management approach DNF pp. 78, 83
103-3 Evaluation of the management approach DNF pp. 78, 83
405-1 Diversity indicators in governance bodies and
employees
DNF pp. 42, 111,
115
405-2 Ratio of basic salary and remuneration of
women to men DNF pp. 114-115
Non-discrimination
103-1 Explanation of material topics DNF pp. 36-37,
116-117
103-2 Management approach DNF pp. 78, 83
103-3 Evaluation of the management approach DNF pp. 78, 83
406-1 Total number of incidents of discrimination and
action taken
The Group registered no incidents of discrimination in 2016 and 2017
Local communities
103-1 Explanation of material topics DNF pp. 36-37,
116-117
103-2 Management approach DNF pp. 97-110
103-3 Evaluation of the management approach DNF pp. 97-110
413-1
Operations with local community engagement,
impact assessments, and development
programmes
DNF pp. 97-110
Supplier social assessment
103-1 Explanation of material topics DNF pp. 36-37,
116-117
103-2 Management approach DNF pp. 54-64
103-3 Evaluation of the management approach DNF pp. 54-64
414-1 New suppliers that were screened using social
criteria DNF pp. 60-61
By the end of 2019, the Group will begin planning and carrying out audits of third parties in its production chains in relation to issues relating to the environment, society, human rights,
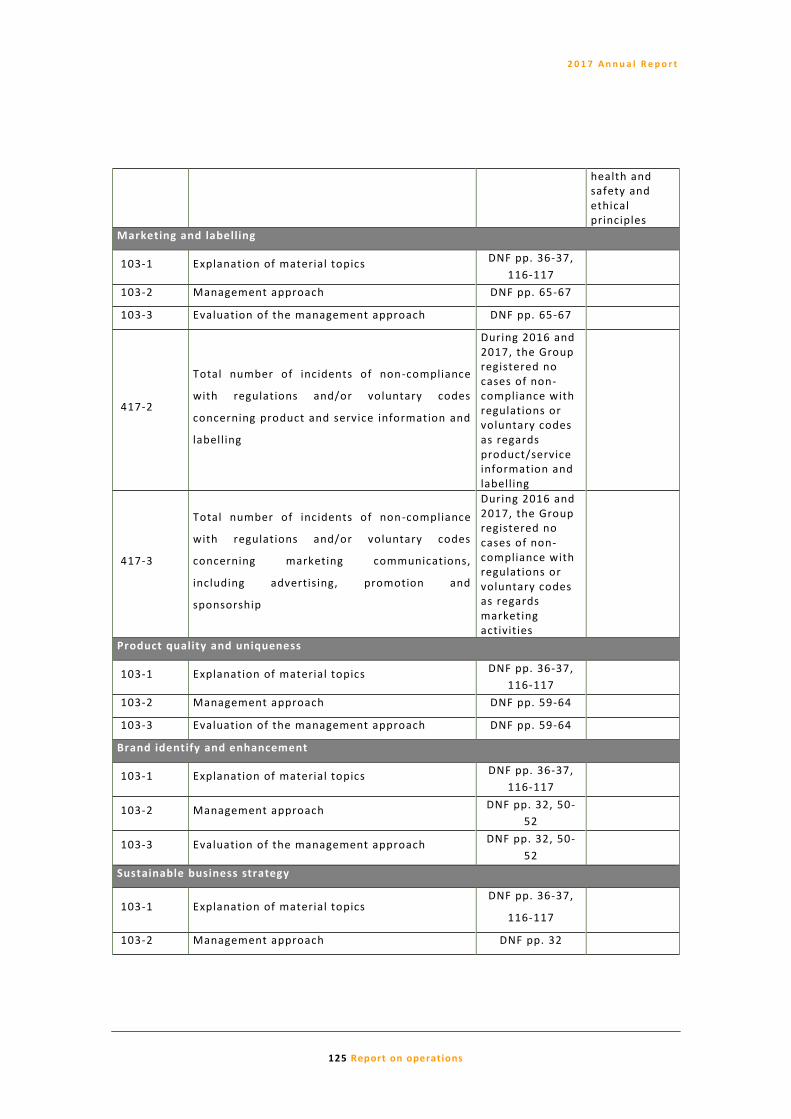
2 0 1 7 A n n u a l R e p o r t
125 Report on operations
health and safety and ethical principles
Marketing and labelling
103-1 Explanation of material topics DNF pp. 36-37,
116-117
103-2 Management approach DNF pp. 65-67
103-3 Evaluation of the management approach DNF pp. 65-67
417-2
Total number of incidents of non-compliance
with regulations and/or voluntary codes
concerning product and service information and
labelling
During 2016 and 2017, the Group registered no cases of non-compliance with regulations or voluntary codes as regards product/service information and labelling
417-3
Total number of incidents of non-compliance
with regulations and/or voluntary codes
concerning marketing communications,
including advertising, promotion and
sponsorship
During 2016 and 2017, the Group registered no cases of non-compliance with regulations or voluntary codes as regards marketing activities
Product quality and uniqueness
103-1 Explanation of material topics DNF pp. 36-37,
116-117
103-2 Management approach DNF pp. 59-64
103-3 Evaluation of the management approach DNF pp. 59-64
Brand identify and enhancement
103-1 Explanation of material topics DNF pp. 36-37,
116-117
103-2 Management approach DNF pp. 32, 50-
52
103-3 Evaluation of the management approach DNF pp. 32, 50-
52
Sustainable business strategy
103-1 Explanation of material topics DNF pp. 36-37,
116-117
103-2 Management approach DNF pp. 32

2 0 1 7 A n n u a l R e p o r t
126 Report on operations
103-3 Evaluation of the management approach DNF pp. 32
Customer satisfaction
103-1 Explanation of material topics DNF pp. 36-37,
116-117
103-2 Management approach DNF pp. 67-73
103-3 Evaluation of the management approach DNF pp. 67-73

Independent auditor's report on the consolidated non‐financial statement

2 of 4
Independent auditor’s report on the consolidated non-financial statement pursuant to article 3, paragraph 10, of Legislative Decree No. 254/2016 and article 5 of CONSOB Regulation No. 20267 To the Board of Directors of Tod’s SpA Pursuant to article 3, paragraph 10 of the Legislative Decree 254 of 30 December 2016 (the “Decree”) and to article 5 of CONSOB Regulation No. 20267, we have performed a limited assurance engagement on the Consolidated non-financial statement of Tod’s SpA and its subsidiaries (hereafter the “group”) for the year ended 31 December 2017, in accordance with article 4 of the Decree and approved by the Board of Directors on 13 March 2018 (hereafter the “NFS”). Responsibility of the directors and of the board of statutory auditors for the NFS
Directors are responsible for the preparation of the NFS in accordance with article 3 and 4 of the Decree and with the “Global Reporting Initiative Sustainability Reporting Standards” defined in 2016 by the GRI - Global Reporting Initiative (“GRI Standards”). Directors are responsible, in the terms prescribed by law, for such internal control as management determines is necessary to enable the preparation of a NFS that is free from material misstatement, whether due to fraud or error. Directors are responsible for identifying the content of the NFS, within the matters mentioned in article 3, paragraph 1, of the Decree, considering the activities and characteristics of the group and to the extent necessary to ensure an understanding of the group’s activities, its performance, its results and related impacts. Directors are responsible for defining the business and organisational model of the group and, with reference to the matters identified and reported in the NFS, for the policies adopted by the group and for the identification and management of risks generated and/or faced by the group. The board of statutory auditors is responsible for overseeing, in the terms prescribed by law, compliance with the Decree. Auditor’s Independence and Quality Control
We are independent in accordance with the principles of ethics and independence set out in the Code of Ethics for Professional Accountants published by the International Ethics Standards Board for Accountants, which are based on the fundamental principles of integrity, objectivity, competence and professional diligence, confidentiality and professional behaviour. Our audit firm adopts International Standard on Quality Control 1 (ISQC Italy 1) and, accordingly, maintains an overall quality control system which includes processes and procedures for compliance with ethical and professional principles and with applicable laws and regulations.

3 of 4
Auditor’s responsibilities
We are responsible for expressing a conclusion, on the basis of the work performed, regarding the compliance of the NFS with the Decree and with the GRI Standards. We conducted our engagement in accordance with International Standard on Assurance Engagements 3000 (Revised) – Assurance Engagements Other than Audits or Reviews of Historical Financial Information (hereafter “ISAE 3000 Revised”), issued by the International Auditing and Assurance Standards Board (IAASB) for limited assurance engagements. The standard requires that we plan and apply procedures in order to obtain limited assurance that the NFS is free of material misstatement. The procedures performed in a limited assurance engagement are less in scope than those performed in a reasonable assurance engagement in accordance with ISAE 3000 Revised, and, therefore, do not provide us with a sufficient level of assurance that we have become aware of all significant facts and circumstances that might be identified in a reasonable assurance engagement. The procedures performed on the NFS were based on our professional judgement and consisted in interviews, primarily of company personnel responsible for the preparation of the information presented in the NFS, analyses of documents, recalculations and other procedures designed to obtain evidence considered useful. In particular, we performed the following procedures: 1. analysis of the relevant matters reported in the NFS relating to the activities and characteristics of
the company, in order to assess the reasonableness of the selection process used, in accordance with article 3 of the Decree and the with the reporting standard adopted;
2. analysis and assessment of the criteria used to identify the consolidation area, in order to assess their compliance with the Decree;
3. comparison of the financial information reported in the NFS with the information reported in the group’s consolidated financial statements;
4. understanding of the following matters: o Business and organisational model of the group, with reference to the management of the
matters specified by article 3 of the Decree; o Policies adopted by the group with reference to the matters specified in article 3 of the
Decree, actual results and related key performance indicators; o Main risks, generated and/or faced by the group, with reference to the matters specified in
article 3 of the Decree. With reference to those matters, we compared the information obtained with the information presented in the NFS and carried out the procedures described under point 5 a) below.
5. understanding of the processes underlying the preparation, collection and management of the significant qualitative and quantitative information included in the NFS. In particular, we held meetings and interviews with the management and with the personnel of Tod’s SpA, and we performed limited analyses of documentary evidence, to gather information about the processes and procedures for the collection, consolidation, processing and submission of the non-financial information to the function responsible for the preparation of the NFS. Moreover, for material information, considering the activities and characteristics of the Tod’s group: - at a group level,

4 of 4
a) with reference to the qualitative information included in the NFS, and in particular to the business model, the policies adopted and the main risks, we carried out interviews and acquired supporting documentation to verify their consistency with available evidence;
b) with reference to quantitative information, we performed analytical procedures as well as limited tests, in order to assess, on a sample basis, the accuracy of consolidation of the information;
- for the plant of Sant’Elpidio a Mare (Italy) which was selected on the basis of its activities, its contribution to the performance indicators at a consolidated level and its location, we carried out site visits during which we met local management and gathered supporting documentation regarding the correct application of the procedures and calculation methods used for the key performance indicators.
Conclusions
Based on the work performed, nothing has come to our attention that causes us to believe that the NFS of Tod’s group as of 31 December 2017 has not been prepared, in all material respects, in compliance with articles 3 and 4 of the Decree and with the GRI Standards. Other aspects
The comparative information presented in the NFS in relation to the financial year ended 31 December 2016 has not been subjected to any procedures. Bologna, 29 March 2018 PricewaterhouseCoopers SpA Signed by Edoardo Orlandoni Paolo Bersani (Partner) (Authorized signatory) This report has been translated from the Italian original solely for the convenience of international readers.

TOD'S Group Annual Report as of December 31st, 2017
Financial Statements

T O D ’ S G r o u p
2 0 1 7 A n n u a l r e p o r t
130 Financial Statements
Consolidated Income Statement
euro 000's
Note Year 17 Year 16
Revenues
Sales revenues (1) 24 963,287 1,004,021
Other income 24 19,451 36,026
Total revenues and income 982,738 1,040,047
Operating Costs
Change in inventories of work in progress and finished goods (2) 12,871 (55,346)
Cost of raw materia ls , suppl ies and materia ls for consumption (2) (255,290) (238,625)
Costs for services (237,871) (228,894)
Costs of use of third party assets 19 (118,229) (117,370)
Personnel costs 25 (191,540) (186,208)
Other operating charges (32,188) (32,698)
Total operating costs (822,245) (859,140)
EBITDA 160,492 180,908
Amortisation, depreciation and write-downs
Amortisation of intangible assets 7 (8,814) (9,209)
Depreciation of tangible assets 8 (35,405) (36,956)
Other adjustments 9 (2,453) (4,431)
Total amortisation, depreciation and write-downs (46,672) (50,596)
Provis ions 14-19 (2,060) (1,951)
EBIT 111,760 128,361
Financial income and expenses
Financia l income 26 17,341 20,184
Financia l expenses 26 (26,541) (33,579)
Total financial income (expenses) (9,199) (13,395)
Income (losses) from equity investments 27 (664)
Profit before taxes 101,897 114,967
Income taxes (3) 11-28 (32,535) (29,198)
Profit/(loss) for the period 69,362 85,768
Non-control l ing interests 1,645 524
Profit/(loss) of the Group 71,007 86,292
EPS (in euro) 29 2.15 2.62
EPS di luted (in euro) 29 2.15 2.62 N o t e s :
( 1 )O f w h i c h n o n - r e c u r r i n g f o r 2 5 m i l l i o n e u r o s i n F Y 2 0 1 6 .
( 2 )O f w h i c h n o n - r e c u r r i n g f o r - 2 4 . 2 m i l l i o n e u r o s i n F Y 2 0 1 6 .
( 3 )O f w h i c h n o n - r e c u r r i n g f o r - 0 . 3 m i l l i o n e u r o s i n F Y 2 0 1 6 .

T O D ’ S G r o u p
2 0 1 7 A n n u a l r e p o r t
131 Financial Statements
Consolidated Statement of Comprehensive Income
euro 000's
Note Year 17 Year 16
Profit (loss) for the period (A) 69,362 85,768
Other comprehensive income that will be reclassified subsequently to profit and loss:
Gains/(Losses) on derivative financial instruments (cash flow hedge) 18 750 4,410
Gains/(Losses) on currency translation of foreign subsidiaries 18 (19,992) 8,339
Gains/(Losses) on net investments in foreign operations 18 4,275 (4,216)
Total other comprehensive income that will be reclassified subsequently to profit and
loss (B) (14,967) 8,533
Other comprehensive income that will not be reclassified subsequently to profit and
loss:
Cumulated actuarial gains/(losses) on defined benefit plans 20 (12) (288)
Total other comprehensive income that will not be reclassified subsequently to profit
and loss (C) (12) (288)
Total Comprehensive Income (A) + (B) + (C) 54,383 94,013
Of which:
Attributable to Shareholders of the Parent company 56,123 94,669
Attributable to non-controlling interests (1,739) (656)

T O D ’ S G r o u p
2 0 1 7 A n n u a l r e p o r t
132 Financial Statements
Consolidated Statement of Financial Position
euro 000's
Note 12.31.17 12.31.16
Non current assets
Intangible fixed assets
Assets with indefini te useful l i fe (1) 7 565,934 565,881
Key money 7 14,427 15,847
Other intangible assets 7 21,644 23,907
Total Intangible fixed assets 602,005 605,635
Tangible fixed assets
Bui ldings and land 8 109,966 114,467
Plant and machinery 8 13,124 12,452
Equipment 8 10,800 12,180
Leasehold improvement 8 34,259 40,454
Others 8 32,783 37,336
Total Tangible fixed assets 200,932 216,888
Other assets
Investment properties 10 22 25
Equity investments 20
Deferred tax assets 11 50,411 58,885
Others 12 18,547 21,367
Total other assets 68,979 80,298
Total non current assets 871,916 902,821
Current assets
Inventories 13 312,263 291,892
Trade receivables 14 107,471 118,142
Tax receivables 14 29,805 28,646
Derivative financia l instruments 15 2,763 2,857
Others 14 38,706 36,635
Cash and cash equiva lents 16 221,609 227,706
Total current assets 712,618 705,879Assets held for sa le
Total assets 1,584,534 1,608,700
To be continued
N o t e s :
( 1 )T h i s f i g u r e i n c l u d e s , f o r 4 1 5 m i l l i o n e u r o s , t h e a m o u n t o f R O G E R V I V I E R b r a n d
a c q u i r e d t h r o u g h a r e l a t e d p a r t y t r a n s a c t i o n o c c u r r e d o n J a n u a r y 2 0 1 6 .

T O D ’ S G r o u p
2 0 1 7 A n n u a l r e p o r t
1 3 3 Financial Statements
continuing
euro 000's
Note 12.31.17 12.31.16
Equity
Share capita l 18 66,187 66,187
Capita l reserves 18 416,588 416,588
Treasury s tock 18
Hedging and trans lation reserves 18 6,360 25,505
Other reserves 18 526,130 492,640
Profi t/(loss ) attributable to the Group 18 71,007 86,292
Total Equity attributable to the Group 1,086,272 1,087,212
Non-controlling interests
Share capita l and reserves 2,526 3,793
Profi t/(loss ) attributable to non-control l ing interests (1,645) (524)
Total Equity attributable to non-controlling interests 880 3,269
Total Equity 1,087,152 1,090,481
Non-current liabilities
Provis ions for ri sks 19 5,385 4,517
Deferred tax l iabi l i ties 11 37,968 32,739
Employee benefi ts 20 13,157 14,787
Others 22 15,795 15,910
Derivative financia l instruments 15 1,197 2,687
Bank borrowings 21 147,617 197,139
Total non-current liabilities 221,119 267,779
Current liabilities
Trade payables 23 158,388 130,804
Tax payables 23 7,932 8,241
Derivative financia l instruments 15 2,459 8,046
Others 23 38,205 35,859
Banks 21 64,654 65,948
Provis ions for ri sks 19 4,626 1,543
Total current liabilities 276,263 250,440
Total Equity and liabilities 1,584,534 1,608,700

T O D ’ S G r o u p
2 0 1 7 A n n u a l r e p o r t
1 3 4 Financial Statements
Consolidated Statement of Cash Flows
euro 000's
Note Year 17 Year 16
Profit/(Loss) for the period 69,362 85,768
Amortizat., deprec., revaluat., and write-downs 7-8-9-13-14 48,274 81,801
Other non monetary expenses/(income) 15-18-19 1,756 125
Income taxes for the period 28 32,535 29,198
Changes in operating assets and liabilities:
Trade receivables 14 9,898 (7,059)
Inventories 13 (21,200) 28,647
Tax receivables and tax payables 14-23 (3,919) 15,147
Trade payables 23 27,584 (15,054)
Other assets and liabilities 12-14-22-23 3,116 (8,176)
Change in reserve for employee 20 (1,641) 2,190
Cash flows from operating activities 165,764 212,587
Interests (paid)/collected (1,189) (1,767)
Income taxes (paid)/refunded (16,380) (61,136)
Net cash flows from operating activities (A) 148,195 149,684
Net investments in intangible and tangible assets 7-8 (35,868) (34,181)
Acquisition of Roger Vivier brand (415,000)
Acquisition of Roger Vivier Paris Sas legal entity net of cash and cash equivalents (17,297)
Other changes in fixed assets
Cash flows generated (used) in investing activities (B) (35,868) (466,478)
Dividends paid 18 (56,259) (66,187)
Capital increase 207,500
Others change in Equity
Changes in other financial l iabilities
Repayments of financial l iabilities 21 (49,713) (123,040)
Proceeds from financial l iabilities 300,000
Cash flows generated (used) in financing (C) (105,972) 318,273
Translation differences (D) (12,648) 6,450
Cash flows from continuing operations (E)=(A)+(B)+(C)+(D) (6,293) 7,929
Cash flow from assets held for sale (F)
Cash flows generated (used) (G)=(E)+(F) (6,293) 7,929
Net cash and cash equivalents at the beginning of the period 211,993 204,063
Net cash and cash equivalents at the end of the period 205,699 211,993
Change in net cash and cash equivalents (6,293) 7,929
Adjustments to reconcile net profit (loss) to net cash provided by
(used in) operating activities:

T O D ’ S G r o u p
2 0 1 7 A n n u a l r e p o r t
1 3 5 Financial Statements
Consolidated Statement of changes in equity
Year 2017
euro 000's
Share
Capital
Capital
reserves
Hedging and
reserve for
translation
Retained
earnings
Group
interests
Non-
controlling
interests Total
Balances as of 01.01.17 66,187 416,588 25,505 578,932 1,087,212 3,269 1,090,481
Profi t & Loss account 71,007 71,007 (1,645) 69,362
Directly in equity (19,145) 4,261 (14,884) (94) (14,978)
Total Comprehensive Income (19,145) 75,268 56,123 (1,739) 54,383
Dividend paid (56,259) (56,259) (56,259)
Capita l increase
Share based payments
Other (1) (804) (804) (649) (1,453)
Balances as of 12.31.17 66,187 416,588 6,360 597,137 1,086,272 880 1,087,152
Year 2016
euro 000's
Share
Capital
Capital
reserves
Hedging and
reserve for
translation
Retained
earnings
Group
interests
Non-
controlling
interests Total
Balances as of 01.01.16 61,219 214,055 12,630 574,127 862,032 4,048 866,081
Profi t & Loss account 86,292 86,292 (524) 85,768
Directly in equity 12,875 (4,498) 8,377 (132) 8,245
Total Comprehensive Income 12,875 81,794 94,669 (656) 94,013
Dividend paid (66,187) (66,187) (66,187)
Capita l increase 4,968 202,532 207,500 207,500
Share based payments
Other (10,802) (10,802) (123) (10,925)
Balances as of 12.31.16 66,187 416,588 25,505 578,932 1,087,212 3,269 1,090,481
Notes :
(1) They include both the use of the specific reserve for promoting territorial solidarity projects and the effects of the
additional acquisition of 50% company shares representing the share capital of the company Webcover Ltd. (already
consolidated with the integral global method).

Notes to the Consolidated Financial Statements
T O D ’ S G r o u p
2 0 1 7 A n n u a l r e p o r t
1 3 7 Notes to the Consolidated Financial Statem ents
1 . G e n e r a l n ot e s
The TOD’S Group operates in the luxury sector under its proprietary brands (TOD’S, HOGAN, FAY
and ROGER VIVIER). It actively creates, produces and distributes shoe s, leather goods and
accessories, and apparel. The firm’s mission is to offer global customers top -quality products that
satisfy their functional requirements and aspirations.
The parent company TOD’S S.p.A., registered office in Sant’Elpidio a Mare (Fermo ) at Via Fil ippo
Della Valle 1, is l isted on Mercato Telematico Azionario (MTA) of Borsa Italiana S.p.A.
At December 31s t
, 2017 TOD’S S.p.A. share capital is owned by DI.VI. FINANZIARIA of DIEGO DELLA
VALLE & C. S.r. l. for 50.291%.
The consolidated financ ial statements has been prepared by the Board of Directors of TOD’S
S.p.A. on March 13t h
, 2018 and it is subject to PricewaterhouseCoopers S.p.A. audit.
2 . B a s i s o f p r e p a r a t i o n
The Consolidated Financial Statements were prepared in accordance with IAS/IF RS (International
Accounting Standards – IAS -, and International Financial Reporting Standards – IFRS) issued by
IASB, based on the text published on the Gazzetta Ufficiale of European Union (G.U.C.E.).
IAS/IFRS refers also to all revised International Accounting Standards ( IAS) and all interpretative
documents issued by the IFRIC (International Financial Reporting Interpretations Committee ) ,
previously nominated Standing Interpretations Committee (SIC).
The Notes have been supplemented by the additional information required by CONSOB and its
implementing measures of Article 9 of Legislative Decree 38/2005 (Resolutions 15519 and 15520
of July 27t h
, 2006 and memorandum DEM/6064293 of July 28t h
, 2006, pursuant to article 114(5) of
the Consolidated Law on Finance-TUF), article 78 of the Issuer Regulation, the EC document of
November 2003 and, when applicable, the Italian Civil Code. Consistently with the financial
statements for the previous year, certain information is provided in the Report by the Board of
Directors on Operations.
The consolidated financial statements has been prepared on the going concern basis, and it
includes the statement of f inancial position, the income statement, statement of comprehensive
income, the statement of cash flows and the st atement of changes in equity of TOD’S S.p.A. and
its Italian and foreign subsidiaries, which are jointly referred to as the TOD’S Group. The
consolidated financial statements is prepared in euro currency, on the basis of draft Financial
Statements at December 31s t
, 2017 (January 1s t
– December 31s t
) approved by the respective
boards of directors or, if there was no board of directors, by the sole directors, of the legal
entities included in the consolidation scope. Because the closing date of its f iscal ye ar does not
coincide with the reference date of the consolidated financial statements, Tod’s India Retail Pte.

T O D ’ S G r o u p
2 0 1 7 A n n u a l r e p o r t
1 3 8 Notes to the Consolidated Financial Statem ents
Ltd was included on the basis of interim financial statements for twelve months, referring to the
date of the consolidated financial statements.
For presentation of its operating income, the Group adopted the presentation of the profit and
loss by nature. The format of representing revenues and costs by nature is followed, indicating
the EBITDA and EBIT results as in the past, since they are consid ered representative indicators of
company performance. In addition, it has been prepared the statement of comprehensive income
which include transactions that are outside the income statement but they produce their effects
directly to equity. Transactions represented in the statement of comprehensive income are net of
tax effects, if applicable.
The statement of f inancial position shows current items, for which it is supposed that they will be
realized or closed during the normal operating cycle, separately from non-current items (both
assets and liabilities).
The financial statements schemes, joined with both report on operations and supplementary
notes, are considered to be the those that provide the best organized representation of the
Group’s f inancial position and income. If it proves necessary or appropriate to amend items in
the financial statements as a result of the application of a new accounting standard, a change in
the nature of a transaction or an accounts review, in order to provide reliable and more relevant
information for the users of the financial statements, the comparative data will be reclassif ied
accordingly in order to improve the comparability of the information between one financial year
and another. In this case, if the changes are significant, they will be suitably disclosed in the
notes to the financial statements .
3 . Ev a l u a t i o n m e t h o d s a n d a c c o un t i n g s t a n d a r d s
The accounting standards and principles of consolidation applied to the preparation of these
Consolidated Financial Statements are consistent with those applied to the preparation of the
Consolidated Financial Statements at December 31s t
, 2016, also taking into account the
information reported below in relation to any amendments, interpretations and new accounting
standards applicable from January 1s t
, 2017.
Accounting standards, amendments and interpretations endorsed by the European Union, which
will be applicable from January 1s t
, 2017 and which were first adopted in the TOD’S Group’s
consolidated financial statements at December 31s t
, 2017

T O D ’ S G r o u p
2 0 1 7 A n n u a l r e p o r t
1 3 9 Notes to the Consolidated Financial Statem ents
• Amendments to IAS 12: “Income taxes”. These amendments, which were published by the IASB
on January 19t h
, 2016, clarify how to account for deferred tax assets relating to debt instruments
measured at fair value. The application of this standard had no significant impact on the Group.
• Amendments to IAS 7: Statement of Cash Flows. These amendments, which were issued by the
IASB on January 29t h
, 2016, require information to be provided in the financial statements about
changes in f inancial l iabilities, aimed at improving the disclosures provided to investors in order
to help them to better understand the changes recorded in said payables. The application of this
standard had no significant impact on the Group.
• “Annual improvements to IFRS Standards”, IFRS 12: “Disclosure of Interests in Other Entities”,
which were issued by the IASB on December 18t h
, 2014. This amendment provides for an
investment entity, which prepares the financial statements in which all of its subsidiaries ar e
measured at fair value through profit or loss, to provide the disclosure required for investment
entities according to IFRS 12. The application of this standard had no impact on the Group.
Accounting standards, amendments and interpretations endorsed b y the European Union, which
will be applicable from January 1s t
, 2018 or later and which have not been adopted early by the
TOD’S Group.
• IFRS 15 – “Revenue from Contracts with Customers”. On May 28th, 2014 the IASB published a
document which requires an entity to recognise revenue at the time the control of goods or
services is transferred to the customer in an amount that reflects the consideration to which the
entity expects to be entitled in exchange for these goods or services. The new revenue
recognition model sets out a process in f ive steps:
1) Identifying the contract with a customer;
2) Identifying the performance obligations;
3) Determining the transaction price;
4) Allocating the transaction price to the performance obligations;
5) Recognising revenue when the entity satisfy a performance obligation.
The new standard also requires additional disclosures regarding the nature, amount, timing and
uncertainty relating to revenues and cash flows arising from these contracts with customers. The
IASB expects to adopt it from 2018, while the European Union endorsed it on September 22n d
,
2016. Furthermore, on April 12t h
, 2016 the IASB published amendments to the standard:
Clarif ications to IFRS 15 Revenue from Contracts with Customers, which are also ap plicable as
from January 1s t
, 2018. These amendments are aimed at clarifying the procedures to identify an

T O D ’ S G r o u p
2 0 1 7 A n n u a l r e p o r t
1 4 0 Notes to the Consolidated Financial Statem ents
entity as a “Principal” or as an “Agent” and to establish whether revenues from licences must be
deferred throughout the term thereof.
The future adoption of this standard will not have any significant impact on the Group’s f inancial
statements.
•IFRS 9 – “Financial Instruments”. On July 24t h
, 2014 the IASB published the final document
constituting the conclusion of the process, divided into three pha ses: “Classif ication and
Measurement, Impairment and General Hedge Accounting”, entirely revising IAS 39. The
document introduces new requirements for classifying and measuring financial assets and
liabilities. Specifically, as regards financial assets, th e new standard adopts a single approach
based on how the financial instruments are managed and on the contractual cash flow
characteristics of the financial assets themselves in order to determine the related valuation
method, aiming at eventually replacin g the various rules laid down under IAS 39. As regards
financial l iabilities, the main amendment concerns the method of accounting for fair value
changes in a f inancial l iabili ty designated as at fair value through profit or loss, which are due to
own credit of the financial liability itself. According to the new standard, these changes must be
recognised in other comprehensive income, without affecting profit or loss. The main
developments relating to hedge accounting are:
- Changes in the type of transac tions that qualify for hedge accounting; specifically, a more
extensive range of risks has been introduced for non -financial assets/liabilities that qualify for
hedge accounting;
- A change in the method of accounting for forward contracts and options inc luded in a hedge
accounting relationship, in order to reduce profit or loss volatil ity;
- Changes in the effectiveness test by replacing the current methods based on the 80 -125% range
with the principle of the “economic relationship” between the hedged it em and the hedging
instrument; furthermore, entities are no longer required to perform an assessment of the
retrospective effectiveness of the hedging relationship;
- A greater f lexibility of the accounting methods is offset by improved disclosures on the risk
management activities carried out by entities.
The new document includes a single model for the impairment of f inancial assets based on
expected losses.
The IASB expects to adopt it from 2018, while the European Union endorsed it on November 22n d
,
2016. The future adoption of this standard will not have any significant impact on the Group’s
f inancial statements.
• IFRS 16: Leases: In January 2016 the IASB published a document for the initial recognition,
measurement, presentation and disclosure of lea se agreements for both the parties to a contract,

T O D ’ S G r o u p
2 0 1 7 A n n u a l r e p o r t
1 4 1 Notes to the Consolidated Financial Statem ents
aimed at replacing IAS 17 Leasing. The document is not applicable to service contracts but only to
lease agreements or to the leasing components of other contracts. The standard defines the lease
as an agreement that transfers the right of use of an asset to the customer ( lessee) for a certain
period of time and in exchange for a consideration. The new standard eliminates the
classif ication based on finance and operating leases and introduces a single accoun ting method
that provides for the recognition of assets and liabilities for all the leases with a term of more
than 12 months and the separate recognition of amortisation, depreciation and interest expense
through profit or loss. As regards the lessor, no significant changes were made to the accounting
method with respect to the provisions that are currently set out under IAS 17. IFRS 16 was
endorsed by the European Union on October 31s t
, 2017 and will become effective from January
1s t
, 2019. An internal analysis was started in relation to the major contracts in place, which was
aimed at gathering information required to outline their foreseeable effects in f inancial and
economic terms.
• Amendments to IFRS 4: “Applying IFRS 9 Financial Instruments with IF RS 4 Insurance Contracts”.
These amendments were issued by the IASB on September 12t h
, 2016, endorsed by the European
Union on November 3rd
, 2017 and became applicable with the effective date being expected on
January 1s t
, 2018. The amendments were intended to address concerns about the application of
IFRS 9 on financial instruments before the introduction of the new insurance contract standards.
Furthermore, the amendments provide two options for entities that enter into insurance
contracts within the scope of IFRS 4: i) an option that would permit entities to reclassify, from
profit or loss to comprehensive income, some of the income or expenses arising from designated
financial assets; and (ii) an optional temporary exemption from applying IFRS 9 for ent ities whose
predominant activity is issuing contracts within the scope of IFRS 4. The future adoption of this
standard will not have any significant impact on the Group’s f inancial statements.
• Amendments to IFRS 2: “Clarif ications of Classif ication and Measurement of Share-based
Payment Transactions”. These amendments, which were published by the IASB on June 20t h
,
2016, provide some clarif ications relating to the method of accounting for the effects of vesting
conditions in the case of cash-settled share-based payments, the classif ication of share -based
payments on a net settlement basis and any change in the terms and conditions of a share -based
payment implying its reclassif ication from cash -settled to equity-settled items. The amendments
will become applicable from January 1s t
, 2018. The possible future adoption of this standard will
not have any significant impact on the Group’s f inancial statements.

T O D ’ S G r o u p
2 0 1 7 A n n u a l r e p o r t
1 4 2 Notes to the Consolidated Financial Statem ents
Accounting standards, amendments and interpretations published by the IASB but not yet
endorsed by the European Union.
• Amendments to IAS 40: regarding transfers of investment property. These amendments were
issued by the IASB on December 8t h
, 2016, with the effective date being expected on January 1s t
,
2018.
The amendment provides as follows: i) para graph 57 of IAS 40 has been amended to state that an
entity shall transfer a property to, or from, investment property when, and only when, there is
evidence of a change in use; i i) the list of evidence in paragraph 57(a) – (d) is designated as non-
exhaustive list of examples. Based on a preliminary analysis, the possible future adoption of this
standard should not have any significant impact on the Group’s f inancial statements.
• Amendment to IFRIC 22: Foreign Currency Transactions and Advance Considerat ion. This
interpretation, which was issued by the IASB on December 8th, 2016, covers foreign currency
transactions when an entity recognises a non -monetary asset or non-monetary liability arising
from the payment or receipt of advance consideration before the entity recognises the related
asset, expense or income. The interpretation need not be applied to income taxes, insurance
contracts or reinsurance contracts. The IASB expects to adopt it from January 1s t
, 2018. Based on
a preliminary analysis, the poss ible future adoption of this interpretation should not have any
significant impact on the Group’s f inancial statements.
• Annual improvements to IFRS Standards: 2014 -2016 Cycle. This document was issued by the
IASB on December 8t h
, 2016, the effective date being expected on January 1s t
, 2018. This session
concerned the following topics: i) IFRS 1: short -term exemptions provided for in paragraphs E3 -E7
are eliminated, since the reasons for their provision have ceased to exist; i i) IAS 28: it is clarif ied
that it is possible to make the decision to measure, at fair value through profit or loss, any
investment in a subsidiary or a joint venture held by a venture capital company, in relation to
each investment in subsidiaries or joint ventures since their init ial recognition. Based on a
preliminary analysis, the possible future adoption of this standard should not have any significant
impact on the Group’s f inancial statements.
• IFRIC 23 “Uncertainty over Income Tax Treatments”. On June 7t h
,2017 the IASB issued IFRIC 23
“Uncertainty over Income Tax Treatments”, providing instructions to account for (current and/or
deferred) tax assets and liabilities relating to income tax as a result of uncertainties in the
application of tax regulations. The provisions of IF RIC 23 will be effective for periods beginning
on or after January 1s t
, 2019. Based on a preliminary analysis, the possible future adoption of this
standard should not have any significant impact on the Group’s f inancial statements.
• Amendments to IFRS 9 “Prepayment features with negative compensation”. On October 12t h
,

T O D ’ S G r o u p
2 0 1 7 A n n u a l r e p o r t
1 4 3 Notes to the Consolidated Financial Statem ents
2017 the IASB issued Amendments to IFRS 9 to deal with some issues concerning the applicability
and classif ication of IFRS 9 “Financial Instruments” as to certain financial assets, whose e arly
repayment is permitted. Furthermore, the IASB clarif ies some issues concerning the accounting
for f inancial l iabilities following changes in the same. The provisions of Amendments to IFRS 9
will be effective for periods beginning on or after January 1s t
, 2019. Based on a preliminary
analysis, the possible future adoption of this standard should not have any significant impact on
the Group’s f inancial statements.
• Amendments to IAS 28 “Long -term Interests in Associates and Joint Ventures”. On October 12t h
,
2017 the IASB issued Amendments to IAS 28 to clarify the application of IFRS 9 'Financial
Instruments' for long-term interests in subsidiaries or joint ventures included in investments in
these entities for which the equity method is not applied. The provisions of Amendments to IAS
28 will be effective for periods beginning on or after January 1s t
, 2019. Based on a preliminary
analysis, the possible future adoption of this standard should not have any significant impact on
the Group’s f inancial statements.
• “Annual improvements to IFRSs: 2015 -2017 Cycle”. The IASB has published the Annual
Improvements to IFRSs, 2015-2017 Cycle, which include amendments to IAS 12 Income Taxes, IAS
23 Borrowing Costs, IFRS 3 Business Combinations and IFRS 11 Joint Arra ngements. The
amendments will become effective from January 1s t
, 2019. Early application is permitted. Based
on a preliminary analysis, the possible future adoption of this standard should not have any
significant impact on the Group’s f inancial statements .
• IFRS 17 “Insurance Contracts”. On May 18t h
, 2017 the IASB issued IFRS 17 “Insurance
contracts”, which sets out the principles for the recognition, measurement, presentation and
disclosure of insurance contracts included in the standard. The objective of IFRS 17 is to ensure
that an entity provides relevant information that faithfully represents those contracts, in order
to give a basis for users of financial statements to assess the effect that insurance contracts have
on the entity’s f inancial positio n, f inancial performance and cash flows. The provisions of IFRS 17
will become effective from periods beginning on or after January 1s t
, 2021. Based on a
preliminary analysis, the possible future adoption of this standard should not have any significant
impact on the Group’s f inancial statements.
• Amendments to IAS19, “Employee benefits’ - Plan amendment, Curtailment or settlement”. On
February 7t h
, 2018 the IASB issued these amendments to clarify how to calculate pension costs
when there is a change in defined-benefit plans. The provisions of Amendments to IAS 19 will
become effective from periods beginning on or after January 1s t
, 2019. Based on a preliminary
analysis, the possible future adoption of this standard should not have any significant impact on
the Group’s f inancial statements.

T O D ’ S G r o u p
2 0 1 7 A n n u a l r e p o r t
1 4 4 Notes to the Consolidated Financial Statem ents
3.1 Use of estimates. Preparation of the financial statements and notes in conformity with
IFRS requires that management make judgments, estimates and assumptions which impact on the
values reported for assets and liabilities , as well as disclosures relating to contingent assets and
liabilities at the balance sheet date. Estimates and assumptions are based on historical data and
other elements deemed significant, as at the end of the accounting period of reference.
3.2 Consolidation principles. A subsidiary is an investee over which the TOD’S Group has
control when it is exposed, or has rights, to variable returns from its involvement with the
investee and has the ability to affect those returns through its power over the investee , as
defined by IFRS 10 – Consolidated Financial Statements .
The financial statements of subsidiaries are included in the consolidated financial statements
from the date when control is acquired until such control terminates.
Acquisitions of subsidiaries are recognized according to the acquisition method. The
considerations transferred in a business combination is represented by the aggregate sum, at the
acquisition date, of the fair values of the acquired assets, the liabilities incurred or assumed, and
the equity interest issued in exchange for control of the acquired entity.
The identifiable assets, l iabilities, and potential l iabilities of the acquired entity that satisfy the
recognition criteria envisaged in IFRS 3 are recognised at their fair value o n the acquisition date,
with the exception of non-current assets (or groups available to sale) that are classif ied as held
for sale in accordance with IFRS 5.
Goodwill is measured as the excess of the aggregate of the consideration transferred, the amount
of any non-controlling interests over the net amounts of the identifiable assets acquired and
liabilities assumed pursuant to the acquisition. Should the aforesaid difference be negative, the
excess is immediately booked in the income statement.
Once control of an entity has been acquired, the transactions where the controlling entity
acquires or transfers additional non-controlling interests without altering control over the
subsidiary are transactions with shareholders and are thus recognised in equity.
Subsidiaries are consolidated according to the line -by-line method from the date on which
control is transferred to the Group. They are deconsolidated starting on the date when such
control ceases. The scope of consolidation and the related changes respe ct to the previous year
are represented in the Note 4.
Intercompany transactions and the profits and losses generated by transactions between
consolidated enterprises are eliminated from both the balance sheet and the profit and loss
account. Unrealised losses arising from intercompany transactions are considered when the
transaction entails an impairment in the value of the transferred asset.

T O D ’ S G r o u p
2 0 1 7 A n n u a l r e p o r t
1 4 5 Notes to the Consolidated Financial Statem ents
When necessary, the balance sheets and profit and loss accounts of the subsidiaries are adjusted
in order to bring the applied accounting policies in l ine with those used by the Group.
3.3 Non-controlling interests. Non-controlling interests are indicated under shareholders’
equity as “Non-controlling interests ” The non-controlling interests in the acquired business is
initially determined in an amount equal to their share of the fair value of the assets, l iabilities,
and potential l iabilities recorded on the date of the original acquisition date and subsequently
adjusted according to the changes in shareholde rs’ equity. L ikewise, this account reflects the
changes in non-controlling interests and any losses allocable to them.
3.4 Transactions in foreign currency.
i. Functional and reporting currency. All accounts recognised on the financial statements of
the subsidiaries are measured by using the currency of the principal economic environment in
which the entity operates (i.e. its functional currency). The Consolidated Financial Statements
are stated in euro (rounded to the nearest thousand), since this is the cu rrency in which most
Group transactions are executed.
i i. Transactions in foreign currency. The financial statements of the individual Group entities
are prepared in the functional currency of each individual company. When the individual
f inancial statements are prepared, the foreign currency transactions of Group companies are
translated into the functional currency (currency of the primary economic environment in which
each entity operates) by applying the exchange rate in effect at the date of the transac tion.
Monetary assets and liabilities denominated in foreign currencies at the date of the financial
statements are translated by using the exchange rate in effect at the closing date. Non -monetary
assets and liabilities are valued at their historic cost in foreign currency and translated by using
the exchange rate in effect at the transaction date.
The foreign exchange differences arising upon settlement of these transactions or translation of
cash assets and liabilities are recognized on the profit and loss account.
i i i. Net investment in foreign operation. A monetary item receivable from or payable to a
foreign operation for which the settlement is neither planned nor l ikely to occur in the
foreseeable future is, in substance, a part of the net investment i n that foreign operation. Such
monetary items may include long-term receivables or loans. They do not include trade
receivables or trade payables.

T O D ’ S G r o u p
2 0 1 7 A n n u a l r e p o r t
1 4 6 Notes to the Consolidated Financial Statem ents
In the consolidated financial statements that include the foreign operation the exchange
differences shall be recognised initially in other comprehensive income and reclassif ied from
equity to profit or loss on disposal of the net investment.
iv. Presentation of financial statements drafted in foreign currency. In order to present the
financial statements of conso lidated entities that are expressed in a functional currency different
from the consolidation currency, the balance sheet items are translated using the exchange rates
in effect at the end of the period, while items on the profit and loss account are trans lated using
the average exchange rate for the period. The difference between the result for the period
resulting from translation at the average exchange rates and the result of translation at the end
of period rates, on the one hand, and the impact on as sets and liabilities of changes in the
exchange rate relationships between the beginning and end of the period, on the other hand, are
recognized under shareholders’ equity in a special “Translation reserve” through the recognition
in the other comprehensive income.
The translation differences recognized under shareholders’ equity are transferred to the profit
and loss account at the time of disposal or l iquidation of the controlled entity.
The rates applied to translation, compared with those used in th e previous year, are indicated in
the following table:
Exch. rates
as of year
end
Average
exch. rate
Exch. rates
as of year
end
Average
exch. rate
U.S. dollar 1.199 1.129 1.054 1.106
British pound 0.887 0.876 0.856 0.816
Swiss franc 1.170 1.112 1.074 1.090
Hong Kong dollar 9.372 8.801 8.175 8.586
Japanese yen 135.010 126.655 123.400 120.065
Hungarian forint 310.330 309.273 309.830 311.432
Singapor dollar 1.602 1.558 1.523 1.527
Korean won 1,279.610 1,275.830 1,269.360 1,283.419
Macao pataca 9.653 9.065 8.420 8.845
Chinese renmimbi 7.804 7.626 7.320 7.348
Indian rupee 76.606 73.498 71.594 74.330
Albanian lek 133.580 134.130 135.631 137.317
Brazilian real 3.973 3.604 3.431 3.836
Canadian dollar 1.504 1.464 1.419 1.465
Australian dollar 1.535 1.473 1.460 1.487
Danish krone 7.445 7.439 7.434 7.445
Year 2017 Year 2016
3.5 Derivative financial instruments. The fundamental characteristics of the derivative
financial instruments are set out in the paragraph on Derivative financial instruments (Note 15).
T O D ’ S G r o u p
2 0 1 7 A n n u a l r e p o r t
1 4 7 Notes to the Consolidated Financial Statem ents
The TOD’S Group uses derivatives to hedge foreign currency risks arising from its operations and
to hedge risks associated with changes in interest rates on loans, with no speculative or trading
purposes consistently with the treasury management strategy policies recomm ended by the
Board of Directors.
As derivatives transactions are carried out to hedge risks arising from changes in expected cash
flows (forecast transactions), they are accounted for according to cash flow hedge rules until the
transaction is reported in the financial statements; subsequently, derivatives are treated
according to fair value hedge rules since they may be described as instruments to hedge changes
in the value of assets/liabilities recognised in the financial statements.
According to hedge accounting rules, derivatives are recognised in the balance sheet at fair
value; how fair value changes are reported differs according to the type of hedge on the
measurement date:
- any changes in the fair value of derivatives that hedge forecast transaction s ( i.e. cash flow
hedge) are recognised directly in the appropriate equity reserve, except for the portion of
the change related to the ineffective part of the hedge, which is recognised under financial
income and charges in the income statement; the diffe rences in fair value already directly
recognised in the appropriate equity reserve are fully recognised in the income statement,
as an adjustment to operating margins, when the assets/liabilities relating to the hedged
items are recognised. As regards deri vatives used to hedge risks associated with changes in
interest rates on loans, the fair value differences already recognised in the equity reserve
are, on the other hand, allocated to adjusting the amounts of f inancial income and costs
when the positive or negative differentials are settled;
- any differences in the fair value of derivatives that hedge assets and l iabilities reported in
the financial statements ( i.e. fair value hedge) are fully recognised under financial income
and charges in the income sta tement. Additionally, the carrying amount of the hedged item
(asset/liability) is adjusted by the change in its value that is attributable to the hedged risk,
against an entry under financial income and charges.
3.6 Intangible fixed assets.
i. Goodwill. All business combinations are recognized by applying the acquisition method.
Goodwill is measured at the acquisition date as the excess of the assets and liabilities and the
fair value of consideration transferred including the amount of any non -controlling interests
recognised. For acquisitions prior to January 1s t
, 2004, the date of transition to IAS/IFRS,

T O D ’ S G r o u p
2 0 1 7 A n n u a l r e p o r t
1 4 8 Notes to the Consolidated Financial Statem ents
goodwill retained the values recognized on the basis of the previous Italian GAAP, net of
accumulated amortization up to the transition date.
Goodwill is recognized on the financial statements at its cost adjusted for impairment losses. It
is not subject to amortization, but the adequacy of the values is annually subjected to the
impairment test, in accordance with the rules set forth in the section Impairment losses.
i i. Trademarks. These are recognized according to the value of their cost and/or acquisition, net
of accumulated amortization at the date of transition to IAS/IFRS. TOD’S, HOGAN, FAY and ROGER
VIVIER trademarks are classif ied as intangible fixed asset s with an indefinite useful l ife and thus
are not amortized, insofar as:
they play a primary role in the Group’s strategy and are an essential driver thereof;
the corporate structure, construed as organized property, plant, and equipment, and
organization itself in a f igurative sense, is closely correlated with and dependent on
dissemination and development of the trademarks on the markets;
the trademarks are proprietary, properly registered, and constantly protected pursuant to
law, with options for renewal of legal protection, upon expiration of the registration periods,
that are not burdensome, easily implemented, and without external impediments;
the products sold by the Group with these trademarks are not subject to particular
technological obsolescence, which is characteristic of the luxury market in which the Group
operates; on the contrary, they are consistently perceived by the market as being innovative in
the national and/or international context characteristic of each trademark, they are distingui shed
by market positioning and notoriety that ensures their dominance of the respective market
segments, being constantly associated and compared with benchmark brands;
in the relative competitive context, it can be affirmed that the investments made for
maintenance of the trademarks are proportionately modest with respect to the large forecast
cash flows.
The adequacy of the values is annually subjected to the impairment test, in accordance with the
rules set forth in the section Impairment losses.
i i i. Key Money. Key money, represent the amounts paid for this purpose by the Group to take
over certain leases of commercial spaces where some DOS operate. They are recognized at cost,
which consider the cost net of cumulated depreciations and impairment losses.
iv. Research and development costs. The research costs for a project are charged fully to the
profit and loss account of the period in which they are incurred.
The development costs of an activity are instead capitalized if the technical and commercial
feasibility of the relative activity and economic return on the investment are certain and definite,
and the Group has the intention and resources necessary to complete the development.

T O D ’ S G r o u p
2 0 1 7 A n n u a l r e p o r t
1 4 9 Notes to the Consolidated Financial Statem ents
The capitalized costs include the costs for materials, labor, and an adequate p ortion of indirect
costs. They are recognized at cost, net of accumulated amortization and depreciation (see
below) and impairment losses.
v. Other intangible fixed assets. These are identifiable non-monetary intangible assets under
the control of the company and capable of causing the Group to realize future economic benefits.
They are initially recognized at their purchase cost, including expenses that are directly
attributable to them during preparation of the asset for its intended purpose or production, if
the conditions for capitalization of expenses incurred for internally generated expenses are
satisfied.
The cost method is used for determining the value reported on subsequent statements, which
entails posting the asset at its cost net of accumulated a mortization and write-downs for
impairment losses.
vi. Subsequent capitalization. The costs incurred for these intangible fixed assets after purchase
are capitalized only to the extent that they increase the future economic benefits of the specific
asset they refer to. All the other costs are charged to the profit and loss account in the fiscal
year in which they are incurred.
vii. Amortization. Intangible fixed assets (excluding those with an indefinite useful l ife) are
amortized on a straight-line basis over the period of their estimated useful l ife, starting from the
time the assets are available for use.
3.7 Tangible assets and investment properties
i. Property, plant, and equipment owned by the company. They are first recognized at their
purchase cost or at the cost recalculated at the date of transition to IFRS, including any directly
attributable ancillary expenses.
Following first-time recognition, these assets are reported net of their accumulated depreciation
and impairment losses ( i.e. in accordance with t he cost model).
For those assets whose depreciation must be calculated using the component approach, the
portions of cost allocable to the individual significant components characterized by a different
useful l ife are determined. In this case, the value o f land and buildings is kept separate, with
only buildings being depreciated.
i i. Leasing. Lease agreements in which the Group assumes all the risks and benefits deriving
from ownership of the asset are classif ied as f inance leasing. The assets (real estate, p lant, and
machinery) possessed pursuant to these agreements are recorded under property, plant, and
equipment at the lesser of their fair value on the date the agreement was made, and the current
value of the minimum payments owed for leasing, net of accum ulated depreciation and any
impairment losses (according to the rules described in the section Impairment losses). A financial

T O D ’ S G r o u p
2 0 1 7 A n n u a l r e p o r t
1 5 0 Notes to the Consolidated Financial Statem ents
payable for the same amount is recognized instead under liabilities, while the component of
interest expenses for f inance leasing payments is reported on the profit and loss account
according to the effective interest method.
i i i. Subsequent capitalizations. The costs incurred for property, plant, and equipment after
purchase are capitalized only to the extent that they increase the fut ure economic benefits of the
asset. All the other costs are charged to the profit and loss account in the fiscal year in which
they are incurred.
iv. Investment property. Investment property are originally recognized at cost, and then
recognized at their cost as adjusted for accumulated depreciation and impairment losses.
Depreciation is calculated on a systematic, straight -line basis according to the estimated useful
l ife of the buildings.
v. Depreciation. Property, plant, and equipment were systematically depre ciated at a steady
rate according to the depreciation schedules defined on the basis of their estimated useful l ife.
Land is not depreciated. The principal depreciation rates applied are as follows:
% depreciation
Industrial buildings 2.5% - 3%
Machinery and plant 12.5%
Equipments 25%
Forms and punches, clichés, molds and stamp 25%
Furniture and furnishings 12%
Office machines 20%
Cars and transport vehicles 20% - 25%
The photovoltaic plant recognised by the parent compa ny is depreciated over a period of 20
years.
The costs for leasehold improvements, which mainly include the costs incurred for set up and
modernization of the DOS network and all the other real estate that is not owned but used by the
Group (and thus instrumental to its activity) are depreciated according to the term of the lease
agreement or the useful l ife of the asset, if this is shorter.
3.8 Impairment losses. In the presence of indicators, events, or changes in circumstances that
presume the existence of impairment losses, IAS 36 envisages subjecting intangible fixed assets
and property, plant and equipment to the impairment test in order to assure that assets with a
value higher than the recoverable value are not recognized on the financial statement s. This test
is performed at least once annually for non -current assets with an indefinite l ife in the same way
as that used for non-current assets that have not yet been placed in service.
Confirmation of the recoverability of the values recognized on the balance sheet is obtained by
comparing the book value at the reference date and the fair value less costs to sale ( if available)

T O D ’ S G r o u p
2 0 1 7 A n n u a l r e p o r t
1 5 1 Notes to the Consolidated Financial Statem ents
or value in use. The value in use of a tangible or intangible fixed asset is determined according
to the estimated future financial f lows expected from the asset, as actualized through use of a
discount rate net of taxes, which reflects the current market value of the current value of the
cash and risks related to Group’s activity.
If it is not possible to estimate an independen t financial f low for an individual asset, the cash
generating unit to which the asset belongs and with which it is possible to associate future cash
flows that can be objectively determined and independent from those generated by other
operating units is identified. Identification of the cash generating units was carried out
consistently with the organizational and operating architecture of the Group.
If the impairment test reveals an impairment loss for an asset, its book value is reduced to the
recoverable value by posting a charge on the profit and loss account, unless the asset is revalued.
In that case, the write-down is recognized in the revaluation reserve.
When the reasons for a write-down cease to exist, the book value of the asset (or the cash
generating unit), with the exception of goodwill, is increased to the new value resulting from the
estimate of its recoverable value, but not beyond the net book value that the asset would have
had if the impairment loss had not been charged. The restored v alue is recognized immediately
on the profit and loss account, unless the asset is revalued, in which case the restored value is
recognized in the revaluation reserve .
3.9 Financial assets. These are recognized and cancelled on the balance sheet according to the
trading date and are initially valued at fair value which generally correspond to the cost,
including costs directly related with the acquisition.
At the subsequent financial statement dates, the financial assets that the Group intends and is
able to hold until maturity (securities held to maturity) are recognized at the amortized cost
according to the effective interest method, net of impairment losses.
Financial assets other than those held to maturity are classif ied as held for trading or available
for sale, and are recognized at their fair value at the end of each period. When the financial
assets are held for trading, the profits and losses deriving from changes in the fair value are
recognized in the profit and loss account for the period. In the case of f inancial assets available
for sale, the profits and losses deriving from changes in the fair value are recognized directly in
shareholders’ equity until they are sold or have sustained a loss in value. At that time, the
aggregate profits or losses that were previously recognized in shareholders’ equity are
recognized on the profit and loss account of the period.
3.10 Inventories. These are recognized at the lower of purchase cost and their assumed

T O D ’ S G r o u p
2 0 1 7 A n n u a l r e p o r t
1 5 2 Notes to the Consolidated Financial Statem ents
disposal value. The net disposal value represents the best estimate of the net sales price that can
be realized through ordinary business processes, net of any production costs not yet incurred and
direct sales costs.
The cost of inventories is based on the weighted average cost method. The production cos t is
determined by including all costs that are directly allocable to the products, regarding – for work
in progress and/or semi-finished products – the specific stage of the process that has been
reached. The values that are thus obtained do not differ a ppreciably from the current production
costs referring to the same classes of assets.
A special depreciation reserve is set aside for the portion of inventories that are no longer
considered economically useable, or with a presumed disposal value that is l ess than the cost
recognized on the financial statements.
3.11 Trade receivables and other receivables. These are initially recognised at fair value,
including transaction costs, and subsequently measured at amortized cost. The measurement
considers the recoverable amount of the assets through the recognition of a specific allowance
for doubtful accounts determined as follows:
receivables under litigation, with certain and precise evidence documenting the impossibility
of collecting them, have been analytica lly identified and then written down;
for other bad debts, prudent allowances for write -downs have been set aside, estimated on
the basis of information updated at the date of this document.
3.12 Cash and cash equivalents. This includes cash on hand, bank dem and deposits, and
financial investments with a maturity of no more than three months. These assets are highly
l iquid, easily convertible into cash, and subject to a negligible risk of change in value.
3.13 Assets and liabilities held for sale. Non-current assets (or disposal groups) are c lassif ied
as held for sale when their carrying amount is recovered through a sale transaction rather than
through continuing use. They are not depreciated and are measured at the lower of carrying
amount and fair value, less c osts to sell. Assets held for sale and related l iabilities are presented
separately from other assets and liabilities in the statement of f inancial position. TOD’S Group
doesn’t held any assets and liabilities held for sale as at December 31s t
, 2017.
3.14 Benefits for employees. Employee benefits include (i) short -term employee benefits such
as wages, salaries and related social security contributions, accrued but not yet paid, paid annual
leave and paid sick leave, etc.; ( i i) post -employment benefits, such as pensions or retirement

T O D ’ S G r o u p
2 0 1 7 A n n u a l r e p o r t
1 5 3 Notes to the Consolidated Financial Statem ents
benefits; ( i i i) other long-term benefits; and (iv) termination benefits.
Short-term benefits are recognised periodically on an accruals basis and are made up of l iabilities
to employees that have not been settled by the reporting da te.
Post-employment benefits are divided into two categories:
i. Defined contribution plans. Payments for any defined contribution plans are recognised in
the income statement in the period in which they are due.
i i. Defined benefit plans. The costs of defined benefit plans are calculated using the Projected
Unit Credit Method, carrying out the actuarial measurements at the end of each financial year.
Past service costs are recognised immediately to the extent that these benefits have already
accrued; otherwise they are amortised on a straight -line basis within the average period within
which the benefits are expected to accrue. The financial costs that have accrued on the basis of
the annual discounting rate are recognised in the income statement immediately. Actu arial gains
and losses are now recognised through other changes in comprehensive income under the
specific equity item.
Liabilities for post-employment benefits recognised in the financial statements represent the
present value of l iabilities for defined b enefit plans. On the other hand, there are no other long -
term employee benefits or termination benefits in the financial statements .
i i i. Share based payments. The payments based on shares are assessed at their fair value on the
assignment date. This value is recognized on the profit and loss account on a straight -line basis
throughout the period of accrual of the rights. This allocation is made on the basis of a
management estimate of the stock options that will actually accrue in favor of vested employees,
considering the conditions for use thereof not based on their market value.
The fair value is determined by using the binomial method. No share based payments result in
the current consolidated financial statements.
3.15 Payables.
i. Bank overdrafts and financing. Interest-bearing financing and bank overdrafts are initially
recognized at fair value, net of transaction costs, and subsequently valued at the amortized cost,
using the effective interest method.
i i. Trade payables and other payables. These are measured at fair value which generally
correspond to their nominal value.
3.16 Provision for risks. These are certain or probable liabilities that have not been determined
at the date they occurred and in the amount of the economic resources to be used for fulfi l l i ng

T O D ’ S G r o u p
2 0 1 7 A n n u a l r e p o r t
1 5 4 Notes to the Consolidated Financial Statem ents
the obligation, but which can nonetheless be reliably estimated. They are recognized on the
balance sheet in the event of an existing obligation, legal or constructive, resulting from a past
event, and it is l ikely that the Group will be asked to satisf y the obligation.
If the effect is significant, and the date of the presumed discharge of the obligation can be
estimated with sufficient reliability, the provisions are recognized on the balance sheet
discounting future cash flows.
The provisions that can be reasonably expected to be discharged twelve months after the
reference date are classif ied on the financial statements under non -current l iabilities. Instead,
the provisions for which the use of resources capable of generating economic benefits is
expected to take place in less than twelve months after the reference date are recognized as
current l iabilities.
3.17 Share capital.
i. Share capital. The total value of shares issued by the parent company is recognized entirely
under shareholders’ equity, as they are the instruments representing its capital.
i i. Treasury stock. The consideration paid for buy -back of share capital (treasury stock),
including the expenses directly related to the transaction, is subtracted from shareholders’
equity. In particular, the par value of the shares reduces the share capital, while the excess
value is recognized as an adjustment to additional paid -in capital.
3.18 Dividends. The allocation of dividends to persons possessing instruments representing
share capital after the reference date of the financial statement is not recognized under financial
l iabilities on the same reference date.
3.19 Revenues recognition. Revenues are recognized on the profit and loss account when the
significant risks and benefits connected with owners hip of the transferred assets are transferred
to the buyer. In reference to the main transactions realized by the Group, revenues are
recognized on the basis of the following principles :
i. Sales of goods – retail. The Group operates in the retail channel t hrough its DOS network.
Revenues are recognised when the goods are delivered to customers. Sales are usually collected
in the form of cash or through credit cards.
i i. Sales of goods – wholesale. The Group distributes products on the wholesale market . These
revenues are recognised when the goods are shipped and considering the estimated effects of
returns at the end of the year.

T O D ’ S G r o u p
2 0 1 7 A n n u a l r e p o r t
1 5 5 Notes to the Consolidated Financial Statem ents
i i i. Provision of services. These revenues are accounted for in proportion to the stage of
completion of the service rendered at the re ference date and in accordance with contractual
provisions.
iv. Royalties. These are recognised on the financial statements on accrual basis.
3.20 Financial income and expenses. These include all f inancial items recognized on the profit
and loss account for the period, including interest expenses accrued on financial payables
calculated by using the effective interest method (mainly current account overdrafts, medium -
long term financing), foreign exchange gains and losses, gains and losses on derivative financial
instruments (according to the previously defined accounting principles), received dividends, the
portion of interest expenses deriving from accounting treatment of assets held under finance
leasing (IAS 17) and employee reserves (IAS 19).
Interest income and expenses are recognized on the profit and loss account for the period in
which they are realized/incurred, with the exception of capitalized expenses (IAS 23).
Dividend income contributes to the result for the period in which the Group accrues the righ t to
receive the payment.
3.21 Income taxes. The income taxes for the period include determination both of current taxes
and deferred taxes. They are recognized entirely on the profit and loss account and included in
the result for the period, unless they are generated by transactions recognized directly to
shareholders’ equity during the current or another period. In this case, the relative deferred tax
liabilities are also recognized under shareholders’ equity.
Current taxes on taxable income for the period represent the tax burden determined by using the
tax rates in effect at the reference date, and any adjustments to the tax payables calculated
during previous periods. Deferred tax liabilities refer to the temporary differences between the
book values of assets and liabilities on the balance sheets of consolidated companies and the
associated values relevant for determination of taxable income.
The tax liability of all temporary taxable differences, with the exception of l iabilities deriving
from initial recognition of an asset or l iability in a transaction other than a business combination
that, at the time of the transaction, does not influence either the income (loss) reported on the
financial statements or taxable income (tax loss). Deferred tax assets and liabi lities are only
offset if there is a legally enforceable right to set off the related current taxes and if the deferred
tax assets and liabilities consist of income tax levied by the same tax authority.
Deferred tax assets that derive from temporary deductible differences are recognized on the
financial statements only to the extent that it is l ikely that taxable income will be realized for

T O D ’ S G r o u p
2 0 1 7 A n n u a l r e p o r t
1 5 6 Notes to the Consolidated Financial Statem ents
which the temporary deductible difference can be used. No recognition is envisaged if the
difference between the carrying amount and the tax base results from a business combinations,
or from the initial posting of an asset or l iability in a transaction, other than a business
combination.
The tax benefits resulting from tax losses are recognised in the financial statements in the period
when those benefits are accrued, if it is l ikely that the Group’s entity which recognised the tax
loss will have sufficient taxable income before the right to use that benefit expires. The taxes in
question (deferred tax assets and liabilities) are determined on the basis of a forecast of the
assumed percentage weight of the taxes on the income of the fiscal years in which the taxes will
occur, taking into account the specific nature of taxability and deductibility. The effect of c hange
in tax rates is recognized on the profit and loss account of the fiscal year in which this change
takes place.
Tax provisions that could be generated from transfers of non -distributable profits from
subsidiaries are recognised only when there is a real intention to transfer such profits.
3.22 Statement of cash flows. The statement of cash flows is drafted using the indirect method.
The net f inancial f lows of operating activity are determined by adjusting the result for the period
of the effects deriving from change to net operating working capital, non -monetary items, and all
the other effects connected with investment and financing activities.
Cash flows from investing and financing activities are represented net of exchange rate
differences, which are represented in a separate line of the statement of cash flows. Net cash
and cash equivalents are made up cash and cash equivalents net of bank overdrafts.
4. Scope of Consolidation
Changes in the scope of consolidation at December 31s t
, 2017 in respect to December 31s t
, 2016
are due to:
-On May 4t h
, 2017 it has been closed the transfer of 100% of shares representing the share
capital of TOD’S Brazil Ltda, for a consideration of 2,682 thousand euros. Expenses and
income of the transferred entity have been included in the consolidated income statement
at December 31s t
, 2017 up to March 31s t
, 2017 instead of up to the date of which the loss of
control occurred. That did not caused any significant effects on the result for the period;
-On May 11t h
, 2017, the company TOD’S UK Ltd. acquired, for 469 thousand GBP, the
additional 50% of company shares representing the share capital of the company Webcover
Ltd. (already consolidated with the integral global method), which manages the store
located in London at S loane Street. The difference between the consideration paid and the

T O D ’ S G r o u p
2 0 1 7 A n n u a l r e p o r t
1 5 7 Notes to the Consolidated Financial Statem ents
carrying amount of minority interests, amounting to 118 thousand euros, has been
represented as an increase of group equity in accordance with IFRS 3. In connection with the
above mentioned acquisition, on May 11t h
, 2017, TOD’S UK Ltd., in addition, acquired 100%
of company shares representing the share capital of Buena Ltd., for a consideration paid
amounting to 1,600 thousand GBP, referred to the key money related to the store managed
by Webcover Ltd.
These operations represent the only changes in the scope of consolidation from the Consolidated
Financial Statements at December 31s t
, 2016.
The scope of consolidation, complete details of which are provided hereunder, has not
undergone other changes:
Parent Company TOD’S S.p.A. S .E lp id io a Mare - I ta ly Share Capita l (S .C. ) - euro 66,187,078 Direct Subsidiaries TOD’S Deutsch. Gmbh TOD’S France Sas An.Del. USA Inc. TOD’S International BV Munich - Germany Par is - F rance New York - U.S .A Amsterdam – Nether lands S .C . - euro 153,387.56 S .C . - euro 780,000 S .C . - Usd 3,700,000 S .C . - euro 2 ,600,200 % held: 100% % held: 100% % held: 100% % held: 100% Del.Com S.r. l. Holpaf B.V. Roger V iv ier S .p.A. TOD’S Danmark APS S .E lp id io a Mare - I ta ly Amsterdam – Nether lands S .E lp id io a Mare – I ta ly Copenhagen - Denmark S .C . - euro 31,200 S .C . - euro 5,000,000 S .C . – euro 10,000,000 S .C . – Dkk 500,000 % held: 100% % held: 100% % held: 100% % held: 100% TOD’S Austr ia Gmbh Vienna - Austr ia S .C . – euro 50,000 % held: 100%
Indirect subsidiaries Cal.Del. USA Inc. TOD’S Tex Del USA Inc. Deva Inc. F lor.Del. USA Inc. Bever ly H i l ls, Ca - U.S .A . Dal las, Tx - U.S .A Wilmington, De – U .S .A. Ta l lahassee, F l - U.S.A. S .C . - Usd 10,000 S .C . - Usd 10,000 S .C . - Usd 500,000 S .C . - Usd 10,000 % held: 100% % held: 100% % held: 100% % held: 100%
Hono.Del. Inc. I l .Del. USA Inc. Neva.Del. Inc. Or.Del. USA Inc. Honolulu, H i - U.S.A. Spr ingf ie ld, I l - U.S .A . Carson C ity, Nv - U.S .A. Sacramento, Ca - U.S .A. S .C . - Usd 10,000 S .C . - Usd 10,000 S .C . - Usd 10,000 S .C . - Usd 10,000 % held: 100% % held: 100% % held: 100% % held: 100%
Gen.Del SA Sandel SA TOD’S Belgique S.p.r. l. TOD’S Espana SL Zur ich - Switzer land San Marino Bruxel les - Belg ium Madrid – Spain S .C . - Chf 200,000 S .C . - euro 258,000 S .C . - euro 300,000 S .C . - euro 500,000 % held: 100% % held: 100% % held: 100% % held: 100%
TOD’S Hong Kong Ltd TOD’S Japan KK Alban.Del Sh.p.k. TOD’S India Retail Pte Ltd Hong Kong Tokyo - Japan T irana - A lbania Mumbai - India S .C . - Usd 16,550,000 S .C . - Jpy 100,000,000 S .C . - euro 720,000 S .C . - Inr 193,900,000 % held: 100% % held: 100% % held: 100% % held: 100%

T O D ’ S G r o u p
2 0 1 7 A n n u a l r e p o r t
1 5 8 Notes to the Consolidated Financial Statem ents
Indirect subsidiaries
TOD’S Singapore Pte Ltd Un.Del Kft TOD’S UK Ltd Webcover Ltd S ingapore Tata - Hungary London - Great Br i ta in London - Great Br i ta in S .C . - Sgd 300,000 S .C . - Huf 42,900,000 S .C . - Gbp 350,000.00 S .C .- Gbp 2 % held: 100% % held: 100% % held: 100% % held : 100%
Roger Vivier Paris Sas TOD’S Korea Inc. TOD’S Macao Ltd TOD’S (Shanghai) Tr. Co. Paris - F rance Seoul - Korea Macau Shanghai - China S .C . - euro 6,700,000 S .C . - Won 2,000,000,000 S .C . - Mop 20,000,000 S .C . - Usd 32,000,000 % held: 100% % held: 100% % held: 100% % held: 100% Re.Se.Del. S.r . l. Del.Pav. S.r. l. F ilangieri 29 S.r. l. Roger V iv ier Japan KK S .E lp id io a Mare - I ta ly S .E lp id io a Mare - I ta ly S .E lp id io a Mare - I ta ly Tokyo – Japan S .C . - euro 25,000.00 S .C . - euro 50,000 S .C . - euro 100,000 S .C . – Jpy 10,000,000 % held: 100% % held: 50% % held: 50%% % held: 100% Roger Vivier Hong Roger Vivier Sing. Roger Vivier (Shan.) Roger Vivier UK Ltd Kong Ltd PTE Ltd Tr.Co. Hong Kong S ingapore Shanghai – China London – Great Br i ta in S .C . – Hkd 1,000,000 S .C . – Sgd 200,000 S .C . – Rmb 75,000,000 S .C . – Gbp 150,000 % held: 100% % held: 100% % held: 100% % held: 100% TOD’S Georgia Inc. Roger Vivier France SaS Roger Vivier Korea Inc. Roger V iv ier Switzer land Norcross, GA – USA Par is – F rance Seoul – Korea Lugano – Switzer land S .C . – Usd 10,000 S .C . – euro 3 ,507,500 S .C . – Won 1,200,000,000 S .C. – Chf 2,000,000 % held: 100% % held: 100% % held: 100% % held: 100% Roger V iv ier Macau Lda TOD’S Washington Inc. A la. Del. Inc. Tod’s Massachussets Inc Macau Tumwater, Wa – U.S.A . Wi lmington, De – U .S .A. Boston, Ma – U .S.A. S .C . – Mop 500,000 S .C . – Usd 10,000 S .C . – Usd 10,000 S .C . – Usd 10,000 % held: 100% % held: 100% % held: 100% % held: 100% Buena Ltd. London – Great Br i ta in S .C . – Gbp 1 % held: 100% It is assumed that the Group controls those companies in which it does not own more than 50%
of the capital, and thus disposes of the same percentage of voting power at the Shareholders’
Meeting, where the Group is exposed, or has r ights, to variable returns from its involvement with
the investee and has the ability to affect those returns through its power over the investee, as
defined by IFRS 10 – Consolidated Financial Statements .
5 . Segment reporting
The search for higher levels of operating efficiency has identified as key element for maximising
profitability via the sharing of a significant portion of service activities (f irst and foremost
production), both at the central and peripheral levels; on the contrary, segmentation of the
business appears uneconomical, under current circumstances.
At the operating level, the Group’s organisation is based on an articulated matrix structure
according to the different functions/activities in the value chain, alternatively according to
brand, product, channel and geographical area. The overall organisation envisages a unified
strategic vision of the business.

T O D ’ S G r o u p
2 0 1 7 A n n u a l r e p o r t
1 5 9 Notes to the Consolidated Financial Statem ents
This type of organisation is reflected in the ways in which management monitors and strategically
focuses the Group’s activities.
In order to have a more detailed examination, the Report of the Board of Directors, to which
reference is made, includes operating information, including a breakdown of consolidated
revenues by BRAND, CHANNEL, PRODUCT and REGION . Below are provided some further details
for completion.
2017 Capital expenditures
By investment allocation (euro mn) By region (euro mn)
1.9
17.7
9.7
7.3
18.6
6.3
10.0
Key money DOS Produc. Other
FY 2017 FY 201626.5
2.4 2.6 2.2 2.9
17.1
5.9
2.5
5.1 4.3
Italy Europe Americas Greater China RoW
FY 2017 FY 2016
The tables i l lustrated above, for the year 2016, don’t include both the amount of the acquired
brand ROGER VIVIER (415 mill ion euros) and the tangible and intangible assets of the company
Roger Vivier Paris sas (about 3.6 mill ion euros).
Distribution network
TOD'S Group - Distribution channel
Year 17 Year 16
Italy DOS 48 48
FRANCHISED STORES 2 2
Europe DOS 60 58
FRANCHISED STORES 20 19
Americas DOS 22 22
FRANCHISED STORES 3 2
Greater China DOS 82 83
FRANCHISED STORES 34 31
RoW DOS 63 61
FRANCHISED STORES 53 53
Total DOS 275 272
Total FRANCHISED STORES 112 107

T O D ’ S G r o u p
2 0 1 7 A n n u a l r e p o r t
1 6 0 Notes to the Consolidated Financial Statem ents
The table below, which shows the breakdown of the distribution network by brand, doesn’t
include the DOS which sell products of more than one brand of the Group.
TOD'S HOGAN
FAYROGER
VIVIER
145
86
148
84
DOS Franchising
FY 2017 FY 2016
26
18
28
15
DOS Franchising
FY 2017 FY 2016
10
0
10
1
DOS Franchising
FY 2017 FY 2016
39
8
37
7
DOS Franchising
FY 2017 FY 2016
6. Management of f inancial risks (IFRS 7)
The TOD’S Group has implemented a system for monitoring its f inancial risks in accordance with
the guidelines set out in the Corporate Governance Code of Listed Companies. As part of this
policy, the Group constantly monitors the fi nancial risks connected with its operations, in order
to assess their potential negative impact and undertake appropriate action to mitigate them.
The following analysis of f inancial risks faced by the TOD’S Group highlights the Group’s level of
exposure. It also includes a sensitivity analysis designed to quantify the potential impact of
hypothetical f luctuations in benchmark parameters on final results.
i. Credit risk
Credit risk represents the exposure of the TOD’S Group to potential losses stemming from f ailure
to discharge its obligations towards trading counterparties. Sales revenues for 2017 resulting
from wholesale distribution channel are 35.5% of total sales. The Group subjects these revenues

T O D ’ S G r o u p
2 0 1 7 A n n u a l r e p o r t
1 6 1 Notes to the Consolidated Financial Statem ents
to a hedging policy designed to streamline credit manageme nt and reduction in the associated
risk. In particular, the Group’s policy does not envisage granting credit to customers, with
periodic analyses of the creditworthiness of all customers, both long -standing and potential ones,
in order to monitor and prevent possible solvency crises.
The following table il lustrates the ageing of trade receivables outstanding at December 31s t
, 2017
gross of allowance for doubtful accounts:
In euro 000's Overdue
Current 0 > 60 60 > 120 Over Total
From third parties 76,635 24,417 2,486 10,479 114,017
The prudent estimate of losses on the entire credit mass existing at December 31s t
, 2017 was 6.5
mill ion euros. The total amount of overdue receivables at December 31s t
, 2017 for 37.4 mill ion
euros is now about 12.4 million euros.
i i. Liquidity risk
The liquidity risk represents the risk stemming from the unavailability of f inancial resources as
necessary to meet the short -term commitments assumed by the Group and its own financial
requirements.
The main factors that determine the Group’s degree of l iquidity are the resources generated or
used by operating and investment activities a nd, on the other hand, the due dates or renewal
dates of its payables or the liquidity of its f inancial investments and market conditions.
This risk is l imited by taking actions aimed at ensuring a balanced structure of the Group’s capital
and by maintaining such a level of cash and cash equivalents as is required to meet its f inancial
debt requirements at the relevant maturity dates in an adequate manner.
The table below shows the credit l ines already used and available at December 31s t
, 2017
compared with December 31s t
, 2016:
Credit lines
euro 000's Cash Credit linesSelf-liquidating
Credit lines
Financial
Credit linesTotal
12.31.17
Credit lines 65,613 161,300 300,000 526,913
Utilizations (15,816) (94) (15,910)
Credit lines available as of 12.31.17 49,797 161,206 300,000 511,003
12.31.16
Credit lines 67,912 160,041 300,000 527,953
Utilizations (15,713) (15,713)
Credit lines available as of 12.31.16 52,199 160,041 300,000 512,240
Furthermore, it should be noted that, the Company, in order to borrow the liquid funds needed
to meet any possible requirement connected with ordinary sales and general corporate

T O D ’ S G r o u p
2 0 1 7 A n n u a l r e p o r t
1 6 2 Notes to the Consolidated Financial Statem ents
operation, entered into three loan agreements, by w hich have been granted three medium/long -
term revolving credit facil ities respectively by: i) Crédit Agricole Corporate and Investment Bank
and Cassa di Risparmio di Parma e Piacenza S.p.A. (Crédit Agricole Group), signed on January 27th
2016, for a maximum amount of 100 mill ion euros, i i) Unicredit S.p.A., signed on November 9th
2016, for a maximum amount of 100 mill ion euros and ii i) B.N.L. S.p.A., signed on November 28th
2016, for a maximum amount of 100 mill ion euros. These credit facil ities will be ava ilable for a
period of 3 years. At December 31s t
, 2017 no amount has been used in connection with the above
mentioned credit facil ities.
The table below shows the maturity of the outstanding financial l iabilities at December 31s t
, 2017
and 2016:
euro 000'sWithin 1 year
Between 1 and 5
yearsBeyond 5 years Total
12.31.17
Bank borrowings 147,617 147,617
Other non-current liabilities 10,287 10,287
Trade payables 158,388 158,388
Bank 64,654 64,654
Derivative financial instruments 2,459 1,197 3,656
Other current liabilities 1,063 1,063
Total 226,564 159,101 385,665
12.31.16
Bank borrowings 197,139 197,139
Other non-current liabilities 9,973 9,973
Trade payables 130,804 130,804
Bank 65,948 65,948
Derivative financial instruments 8,046 2,687 10,733
Other current liabilities 1,464 1,464
Total 206,262 209,799 416,061
Particular attention is paid to the definition of the credit counterparty that is considered to be
suitable for cash operations and that is identified according to increasingly selective liquidity,
security and yield criteria and in l ine with the Management’s ins tructions.
Considering the Company profitability and its capacity to generate cash, it’s reasonable to
believe that l iquidity risk is not significant. Moreover, it should be noted that such capacity of
generating cash may allow Company to meet these commit ments in a period of time that is
potentially shorter than that in which the loans and credit facil ities are expected to be available.
Finally, as regards financial assets, the Group’s policy is to continue to invest all of its available
l iquid funds in sight bank deposits or in short -term liquidity, without making use of f inancial
instruments, including those of the money market, and dividing its deposits among an adequate
number of banks, which are carefully selected by taking account of f inancial soundne ss and
reliability parameters, geographical location and level of remuneration offered.

T O D ’ S G r o u p
2 0 1 7 A n n u a l r e p o r t
1 6 3 Notes to the Consolidated Financial Statem ents
i i i. Market risk
IFRS 7 includes in this category all risks that are directly or indirectly connected with the
fluctuation in prices on physical and financial markets to wh ich the company is exposed:
– exchange rate risk;
– interest rate risk;
– commodity risk, connected with the volatil ity of prices for the raw materials used in the
production process.
The TOD’S Group is exposed to exchange rate and interest rate risk, si nce there is no physical
market subject to actual fluctuations in the purchase prices for raw materials used in the
production process.
The following paragraphs analyse the individual risks, using sensitivity analysis as necessary to
highlight the potentia l risk on final results stemming from hypothetical f luctuations in benchmark
parameters. As envisaged by IFRS 7, these analyses are based on simplif ied scenarios applied to
the final results for the periods referred to. By their very nature, they cannot be considered
indicators of the actual effects of future changes in benchmark parameters of a different asset
and liability structure and financial position different market conditions, nor can they reflect the
interrelations and complexity of the reference markets.
Exchange rate risk. Due to its commercial operations, the Group is exposed to fluctuations in the
exchange rates for currencies in which some of its commercial transactions are denominated
(particularly USD, GBP, CHF and Far East countries), again st a cost structure that is concentrated
principally in the eurozone. The TOD’S Group realises greater revenues than costs in all these
currencies; therefore, changes in the exchange rate between the euro and the aforementioned
currencies can impact the Group’s results.
Moreover, due to the geographical composition of the Group structure, which is formed by
subsidiaries with different currencies, the Group is exposed to exchange rate risk related to
intercompany financial f lows (mainly dividends, loans, tr ansactions on share capital).
Finally, the Group is exposed to “translation risk”. This risk stems from the fact that the assets
and liabilities of consolidated companies whose functional currency is different from the euro
can have different countervalues in euros according to changes in foreign exchange rates. The
measured amount of this risk is recognised in the “translation reserve” in equity.
The Group monitors the changes in the exposure. No hedges of this risk existed at the reporting
date. Governance of individual foreign currency operations by the Group’s subsidiaries is highly
simplif ied by the fact that they are wholly owned by the parent company.

T O D ’ S G r o u p
2 0 1 7 A n n u a l r e p o r t
1 6 4 Notes to the Consolidated Financial Statem ents
The Group’s risk management policy, in connection to the exchange rate risk on commercial
transactions, aims to ensure that the average countervalue in euros of receipts on transactions
denominated in foreign currencies for each collection (Spring/Summer and Fall/Winter) is equal
to or greater than what would be obtained by applying the pre -set target exchange rates. The
Group pursues these aims by entering into forward contracts for each individual currency to
hedge a specific percentage of the expected revenue (and cost) volumes in the individual
currencies other than the functional currency. These pos itions are not hedged for speculative or
trading purposes, consistently with the strategic policies adopted for prudent management of
cash flows. Consequently, the Group might forego opportunities to realise certain gains, but it
avoids running the risks of speculation.
The Group defines its exchange risk a priori according to the budget for the reference period and
then gradually hedges this r isk upon acquisition of orders, in the amount according to which they
correspond to budget forecasts.
The process of hedging exchange rate risk inside the Group is broken down into a series of
activities that can be grouped into the following distinct phases:
• definition of operating limits;
• identification and quantification of exposure;
• implementation of hedges;
• monitoring of positions and alert procedures.
In connection with the exchange rate risk on financial intercompany transactions, the Group
monitors the risk underlying outstanding liabilities ( loans) and forecast l iabilities (dividends and
capital increases), in view of guaranteeing that no material operating and financial impact for the
entities involved results from these transactions in relation to fluctuations in exchange rates.
These goals are pursued by the Group through monitoring the foreign exchan ge rate trends
related to outstanding or expected capital transactions and entering into forward contracts if
they will have material contingent effects. These forward contracts are made to hedge the
individual transactions, and not for speculation or trad ing. This is consistent with the strategic
policies focused on prudent management of cash flows. The breakdown of forward currency
contracts (for sale and purchase) made by the Group is i l lustrated in Note 15.
The balance sheet accounts denominated in fore ign currency were identified for the sensitivity
analysis. In order to determine the potential impact on final results, the potential effects of
f luctuations in the exchange rate for the euro against the principal currencies to which the Group
is exposed were analysed. The following table il lustrates the sensitivity to reasonably l ikely
changes in exchange rates on pre-tax profit (due to changes in the value of current assets and

T O D ’ S G r o u p
2 0 1 7 A n n u a l r e p o r t
1 6 5 Notes to the Consolidated Financial Statem ents
l iabilities denominated in foreign currency for expected transactions) and Gro up equity (due to
changes in the fair value of foreign exchange risk hedge instruments on forecast transactions) :
Euro
Currency Country FY 2017 FY 2016 FY 2017 FY 2016
CAD Canada 9,124.4 (20,955.3) 10,084.9 23,161.1
CHF Switzerland 371.4 (1,604.1) (410.5) 1,772.9
GBP UK 120.8 10,802.5 (133.5) (11,939.6)
HKD Hong Kong 203,823.5 317,402.7 225,278.6 (350,813.5)
JPY Japan 46,474.5 9,199.4 (51,366.6) (10,167.7)
KRW South Korea 479.1 (366.6) (529.5) 405.2
RMB China (1,244,900.0) (116,117.1) 1,375,942.1 128,339.9
SGD Singapore (35,538.3) 16,038.6 39,279.1 (17,726.8)
USD USA 277,794.0 74,799.4 (307,035.5) (82,673.0)
EUR Europe 415,263.4 15,996.1 (458,975.3) (17,680.0)
Other n.a. (494,560.9) (238,359.1) 75,893.0 263,449.5
Total (821,548.0) 66,836.5 908,026.8 (73,872.0)
Impact on pre-tax profit 5%
writedown of the foreign
currency
Impact on pre-tax profit 5%
revaluation of the foreign
currency
euro 000's Revaluation / Writedown
foreign currency
Impact on pre-tax
profit
Impact on
Shareholders' equity
5% (0.8) (4,522.8)
-5% 0.9 4,196.3FY 2017
The impact on equity showed in the previous table is mainly related to the cash flow hedge
reserve gross of tax effects.
The analysis did not include assets, l iabilities and future commercial f lows that were hedged,
since fluctuations in exchange rates impact income in an amount equal to what is recognised in
the fair value of adopted hedging instruments.
Interest rate risk. The TOD’S Group is exposed to interest rate fluctuations, l imited to its
variable-rate debt instruments. Interest rate risk is managed in conformity to long -established
practice with the aim of cutting down the risk of interest rate volatil ity, at the same time
pursuing the goal of reducing the financial costs involved to a minimum.
TOD’S S.p.A. has a syndicated loan signed with Mediobanca and Crédit Agricole, definitively
drawn for 300 mill ion euros, with variable interest rate equal to EURIBOR 3M + 55 basis points
(the reduction from 80 basis points to 55 basis points occurred last November 2017). To hedge
the risk of possible changes in the interest rates on the loan, two derivative contracts ( interest
rate swaps - IRSs), have been signed, for a notional amount equ al to the amount drawn for the
loan. These derivatives protect the Company from the risk of a generalised rise in interest rates,

T O D ’ S G r o u p
2 0 1 7 A n n u a l r e p o r t
1 6 6 Notes to the Consolidated Financial Statem ents
swapping the variable rate on the loan for a contractually f ixed rate (a quarterly rate of 0.748%).
Such transactions have be en recognised in accordance with cash flow hedge methodology
provided by IAS39.
In addition to the above mentioned syndicated loan, TOD’S S.p.A. entered into two loan
agreements with BNL S.p.A. (BNP Paribas Group) and Intesa San Paolo S.p.A. respectively, for an
amount of 25 mill ion euros each; the reimbursements will be respectively in four years with a
payment of 16 instalments at the end of every quarter and one -shot with a single payment at the
expiry date. Interests rates are variables and equal to t he EURIBOR 3m + 0.42% and EURIBOR 3m
+0.5% respectively (Note 21). Considered the current financial markets situation and the current
EURIBOR reference rate, the Group doesn’t believe necessary to put in place hedging derivatives
for such loans. The financial market trend and the related benchmark interests rates are
constantly monitored by the Group, and, in case there could be an increase of risks in connection
with the above mentioned loans, the Group will put in place appropriate hedging instruments in
accordance with the strengthened Group practice.
The sensitivity analysis carried out on interest rates has shown in addition that a hypothetically
unfavourable change of 10% in short -term interest rates applicable to the adjustable rate
financial l iabili ties existing at December 31s t
, 2017 would have a net pre-tax impact of about 11
thousand euros in additional expenses (FY 2016: 13 thousand euros).
Finally, the financial l iability (Notes A2) issued by the subsidiary Holpaf B.V. (Note 21) is subject
to a f ixed rate of 3.239%.
6.1 Categories of measurement at fair value
In accordance with IFRS 7, the financial instruments carried at fair value have been classif ied
according to a hierarchy of levels that reflects the materiality of the inputs used to estimate their
fair value. The following levels have been defined:
Level 1 – quoted prices obtained on an active market for the measured assets or l iabilities;
Level 2 – inputs other than the quoted prices indicated hereinabove, which are observable either
directly (prices) or indirectly (derived from prices) on the market;
Level 3 – inputs that are not based on observable market data.
The tables below show the breakdown of f inancial assets and liabilities between each financial
category and the fair value hierarchy level at December 31s t
, 2017 and 2016:

T O D ’ S G r o u p
2 0 1 7 A n n u a l r e p o r t
1 6 7 Notes to the Consolidated Financial Statem ents
2017
euro 000's
Other non-current assets 16,136 16,136
Total other non-current assets 16,136 16,136
Trade receivables 107,471 107,471
Derivative financial instruments 2,763 2,763 2,763 2,763
Bank 221,609 221,609
Total other current assets 329,080 2,763 331,843 2,763 2,763
Total Level 1 Level 2
Assets
Loans and
receivables at
amortized
cost
Available
for sales
Financial
assets at
fair value
Level 3 Total
2017
euro 000's
Bank borrowings 147,617 147,617
Other non-current liabilities 10,287 10,287
Derivative financial instruments 1,197 1,197 1,197 1,197
Total other non-current liabilities 157,904 1,197 159,101 1,197 1,197
Trade payables 158,388 158,388
Bank 64,654 64,654
Derivative financial instruments 2,459 2,459 2,459 2,459
Other current liabilities 1,063 1,063
Total other current liabilities 224,105 2,459 226,564 2,459 2,459
Level 3 TotalLevel 2
Liabilities
Financial
liabilities at
amortized
cost
Financial
liabilities at
fair value
Total Level 1
2016
euro 000's
Other non-current assets 18,472 18,472
Total other non-current assets 18,472 18,472
Trade receivables 118,142 118,142
Derivative financial instruments 2,857 2,857 2,857 2,857
Bank 227,706 227,706
Total other current assets 345,848 2,857 348,705 2,857 2,857
Assets
Total Level 1 Level 2
Loans and
receivables at
amortized
cost
Available
for sales
Financial
assets at
fair value
Level 3 Total
2016
euro 000's
Bank borrowings 197,139 197,139
Other non-current liabilities 9,973 9,973
Derivative financial instruments 2,687 2,687 2,687 2,687
Total other non-current liabilities 207,112 2,687 209,799 2,687 2,687
Trade payables 130,804 130,804
Bank 65,948 65,948
Derivative financial instruments 8,046 8,046 8,046 8,046
Other current liabilities 1,464 1,464
Total other current liabilities 198,216 8,046 206,262 8,046 8,046
Level 3
LiabilitiesFinancial
liabilities at
amortized
cost
Financial
liabilities at
fair value
Total Level 1 TotalLevel 2
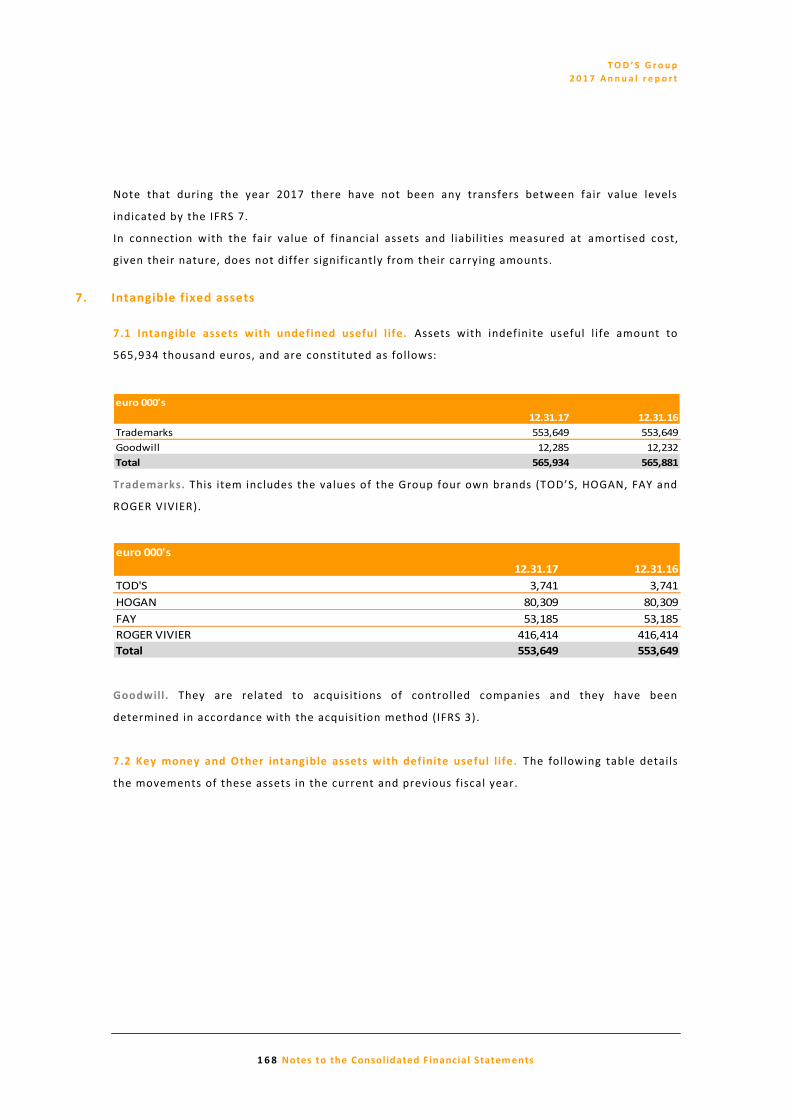
T O D ’ S G r o u p
2 0 1 7 A n n u a l r e p o r t
1 6 8 Notes to the Consolidated Financial Statem ents
Note that during the year 2017 there have not been any transfers between fair value levels
indicated by the IFRS 7.
In connection with the fair value of f inancial assets and liabilities measured at amortised cost,
given their nature, does not differ significantly from their carrying amounts.
7. Intangible fixed assets
7.1 Intangible assets with undefined useful life. Assets with indefinite useful l ife amount to
565,934 thousand euros, and are constituted as follows:
euro 000's
12.31.17 12.31.16
Trademarks 553,649 553,649
Goodwill 12,285 12,232
Total 565,934 565,881
Trademarks. This item includes the values of the Group four own brands (TOD’S, HOGAN, FAY and
ROGER VIVIER).
euro 000's
12.31.17 12.31.16
TOD'S 3,741 3,741
HOGAN 80,309 80,309
FAY 53,185 53,185
ROGER VIVIER 416,414 416,414
Total 553,649 553,649
Goodwill. They are related to acquisitions of controlled companies and they have been
determined in accordance with the acquisition method (IFRS 3).
7.2 Key money and Other intangible assets with definite useful life. The following table details
the movements of these assets in the current and previous fiscal year.

T O D ’ S G r o u p
2 0 1 7 A n n u a l r e p o r t
1 6 9 Notes to the Consolidated Financial Statem ents
euro 000's
Key
money
Other
trade
marks Software
Other
assets Total
Balance as of 01.01.16 14,938 4,186 7,745 14,456 26,387
Translation differences (8) 1 4 5
Increases 568 3,804 567 4,939
Decreases (216) (216)
Impairment losses (Note 9) (22) (22)
Other changes 2,940
Amortization for the period (2,023) (804) (3,669) (2,712) (7,186)
Balance as of 12.31.16 15,847 3,949 7,859 12,099 23,907
Translation differences 3 (13) (14) (26)
Increases 1,885 475 2,687 1,144 4,306
Decreases (1) (1)
Impairment losses (Note 9) (1,072)
Other changes 36 36
Amortization for the period (2,237) (852) (3,199) (2,527) (6,577)
Balance as of 12.31.17 14,427 3,572 7,335 10,737 21,644
Other Intangible assets
Key money, represent the amounts paid for this pu rpose by the Group to take over certain leases
of commercial spaces where some DOS operate. The increase for the period relates to the key
money paid in connection with the acquisition of Buena Ltd., occurred on May 2017, related to
the store located in London Sloane Street (Note 4). Impairment losses are related to the write
off of a key money related to a store which has been relocated (Note 9).
The increase of Other trademarks relates to long -term charges with a defined useful l ife incurred
to protect the brands owned by the Group which are classif ied as assets with an undefined useful
l ife.
The increase of Software mainly relates to resources designated by the parent company for the
development of IT systems.
The increase recorded in Other Assets i s mainly due to long-term investments made for the
network of corners, franchise stores and the development of the digital channel.
The item Other assets includes 7,098 thousand euros for the value of the intangible asset
recognised in relation to the agreement made with the Ministry of Cultural Affairs (“Ministero
per i Beni e le Attività Culturali”) and the Special Archaeological Service of Rome
(“Soprintendenza speciale per i beni archeologici di Roma”), with which the parent company has
undertaken to finance the entire cost of restoration work on the Coliseum. The asset was
formerly recognised in the balance sheet for an amount equal to the discounted value of the

T O D ’ S G r o u p
2 0 1 7 A n n u a l r e p o r t
1 7 0 Notes to the Consolidated Financial Statem ents
f inancial outlays that are reasonably foreseeable on the basis of the multi -year plan for
restoration work available at the moment of the initial recognition, and amortised over the
useful l ife determined according to the provisions of the agreement. The accrual for amortisation
allocable to the financial year is about 1.1 mill ion euros.
8. Tangible fixed assets
At December 31s t
, 2017 the net residual value of Group’s tangible fixed assets was a 200.9 mill ion
euros (FY 2016: 216.9 mill ion euros).
euro 000's Land and
buildings
Plant and
machin. Equip.
Leasehold
improv. Others Total
Balance as of 01.01.16 110,928 13,206 14,258 45,573 42,538 226,504
Translation differences 3,346 3 1 (44) (245) 3,062
Increases 2,359 1,466 4,954 11,059 8,716 28,554
Decreases (19) (248) (54) (154) (475)
Impairment losses (Note 9) (134) (3,835) (440) (4,409)
Other changes 3 124 478 605
Amortization for the period (2,167) (2,204) (6,655) (12,370) (13,556) (36,953)
Balance as of 12.31.16 114,467 12,452 12,180 40,454 37,336 216,888
Translation differences (4,890) 4 (161) (2,047) (1,756) (8,849)
Increases 2,638 3,099 4,818 8,899 10,981 30,435
Decreases (14) (18) (123) (124) (481) (759)
Impairment losses (Note 9) (1,381) (1,381)
Other changes
Amortization for the period (2,236) (2,412) (5,915) (11,542) (13,298) (35,402)
Balance as of 12.31.17 109,966 13,124 10,800 34,259 32,783 200,932
Land and Buildings mainly include the real estate assets consisting of the Parent Compan y’s
operating headquarters and the building located in Omotesando in Tokyo, the location of the
subsidiary TOD’S Japan’s administrative offices and of the most important TOD’S flagship store in
Japan. The increase in the value of Land and Buildings and Pla nt and machinery mainly include
the investments done for the construction of the new plant located in Arquata del Tronto.
The increase in Equipment is due to the investments, made mainly by the parent company, in the
framework of the normal processes of modernisation of industrial facil ities and equipment
(mainly lasts and moulds), and to the investments done for the enlargement of production
capacity related to Albanian plant of the Group. The increase in Leasehold Improvements and
Others mainly consist of the costs incurred for f itting out DOS, among which the first boutique
TOD’S in Vienna (Austria) and Boston (USA), and for the renovation activities of the existing
stores. Depreciation from continuing use of the fixed assets during the year amount to 35.4

T O D ’ S G r o u p
2 0 1 7 A n n u a l r e p o r t
1 7 1 Notes to the Consolidated Financial Statem ents
million euros, while write-downs for impairment recognized through profit and loss amount to
1.4 mill ion euros (Note 9).
9. Impairment losses
The recoverability of the residual value of intangible assets with an indefinite useful l ife (brands
and goodwill) was determined to ensure that assets with a value higher than the recoverable
value were not recognised on the financial statements, which refers to their “value in use”. The
criterion used to determine “value in use” is based on the provision s of IAS 36, and is based on
the current value of expected future cash flows (Discounted cash -flow analysis - DCF), which is
presumed to derive from the continual use and disposal of an asset at the end of its useful l ife,
discounted at a net discounting rate that reflects current market rates for borrowing money and
the specific risk associated with the individual cash generating unit.
In application of the method prescribed by IAS 36, the TOD’S Group has identified the cash
generating units (CGU) that represent the smallest, identifiable group of assets that can generate
cash flows and which are fully independent on the consolidated financial statements. The
organisational structure and type of business was considered in determining the CGU. The TOD’S
Group subsequently identified only one CGU, at a Group level, and it has been tested the net
invested capital of the Group. This approach is based on the unified view of the business (also
see Note 5 Segment reporting), organised as a matrix structure, which m ay be alternatively
broken down by brand, product, channel and region, according to the different
functions/activities on the value chain, where the transverse nature of many central and
peripheral service activities (especially the supply chain, sales and distribution, f inance and
administration, legal, human resources and information technology), ensure maximisation of the
levels of profitability . The recoverability of the amounts recognised on the financial statements
was verif ied by comparing the net bo ok value of the net invested capital with the recoverable
value (value in use). The value in use is represented by the discounted value of future cash flows
that are expected from continuous use of the assets associated with the cash generating unit and
by the terminal value attributable to them.
The discounted cash flow analysis was carried out by using the FY 2018 budget as its basis. That
budget was prepared and approved by the Board of Directors of the parent company TOD’S S.p.A.
on the assumption that the Group would be a going concern for the foreseeable future. The
Board of Directors f irst assessed the methods and assumptions used in developing the model. In
particular:
i . medium-term budget data are forecast over a time horizon of four additional yea rs using a
5% mean sales growth rate, a constant EBITDA margin and a constant tax rate, equal to 30%.

T O D ’ S G r o u p
2 0 1 7 A n n u a l r e p o r t
1 7 2 Notes to the Consolidated Financial Statem ents
Assumptions regarding the medium-term sales growth rate are made on the basis of reasonable
growth estimates which also take into account the growth trend s in the luxury sector as a whole
in the foreseeable future;
i i . The terminal value was determined as perpetuity, using, for future forecasts, a prudential
long term growth rate in l ine with the macro -economics estimates performed by the International
Monetary Fund .
i i i . To determine the “value in use,” a WACC, net of taxes, of 8.50% was used (the WACC rate
used at December 31s t
, 2016 was 8.30%), determined by referring to the discounting rates used
by a series of international analysts in f inancial repor ts on the Group, including a specific beta
attributable to it.
An expected overall cash flow figure far higher than the total amount of net invested capital
(cover) emerged from the analyses of the recoverability of the Group’s intangible assets with an
indefinite useful l ife (of which 553.6 mill ion euros are made up of the owned trademarks and
12.2 mill ion euros are made up of goodwill from business combination).
The sensitivity analysis performed on the impairment test in accordance with IAS 36, in orde r to
reveal the effects produced on the “value in use” by a reasonable change in the basic
assumptions (WACC, growth rates, EBITDA margin) and determination of the terminal value
(disposal value of Group assets), did not reveal an appreciable impact on det ermination of the
“value in use” and cover. Given the significant value assumed by the cover, it would be necessary
to make unrealistic base assumptions to render the “value in use” equal to the book value of
Group assets (the breakeven hypothesis).
Furthermore, in accordance with IAS 36, an estimate has been made of the recoverable value of
each Company-owned brand, intangible assets with an indefinite useful l ife. The recoverable
value is calculated by using, in principle, a market valuation approach, con sisting of the
application of the royalties method and using the same assumptions as those stated above in
terms of growth rates, tax rate, WACC and terminal value. As regards the ROGER VIVIER brand,
the royalties method has been based, for obvious reasons of uniformity and consistency with the
estimation of the value to be attributed to the abovementioned balance sheet item upon
acquisition, on income evaluation approaches; these have the objective of quantifying the
contribution that the brand gives to th e overall business profitability, on the basis of the
business plan prepared for the foreseeable future, by discounting the income that can be directly
or indirectly associated with the brand for a specific period of time. From the analysis carried out
no impairment losses arose, as the net book value of brands fell within the range of values set
for the recoverable value.

T O D ’ S G r o u p
2 0 1 7 A n n u a l r e p o r t
1 7 3 Notes to the Consolidated Financial Statem ents
Finally, the Group conducted an analysis to assess the recoverability of the tangible and
intangible fixed assets attributable to the i ndividual directly operated stores (DOS). Impairment
indicators emerged from this analysis for some DOS whose assets were therefore written down by
a total of 2.5 mill ion euros, of which 1.1 mill ion euros related to key money, as the recovery of
their value by means of future cash flows is not reasonably foreseeable as matters stand.
10. Investment property
This account refers to a property owned by the Group as a real estate investment and leased to
third parties.
euro 000's
Historic cost 115
Accumulated depreciation (89)
Balance as of 01.01.17 25
Increases
Decreases
Depreciation for the period (3)
Balance as of 12.31.17 22
No changes in the fair value of t his investment, about 250 thousand euros, have been recognised
since this previous financial year. This estimate is based on the market prices for similar
properties in terms of location and condition .
11. Deferred tax assets and liabilities
At the report ing date, recognition of the effects of deferred tax assets, determined on the basis
of temporary differences between the carrying amount of assets/liabilities and its tax base, lead
to the following tax assets and liabilities :
euro 000's
12.31.17 12.31.16 Change
Deferred tax assets 50,411 58,885 (8,474)
Deferred tax liabilities (37,968) (32,739) (5,229)
Net Balance 12,442 26,146 (13,704)
When determining future tax impact, reference was made to the presumed percentage weight of
the taxes that will be imposed on income in the years when those taxes will be charged,
according to current tax laws in the various countries involved and any changes in tax rates
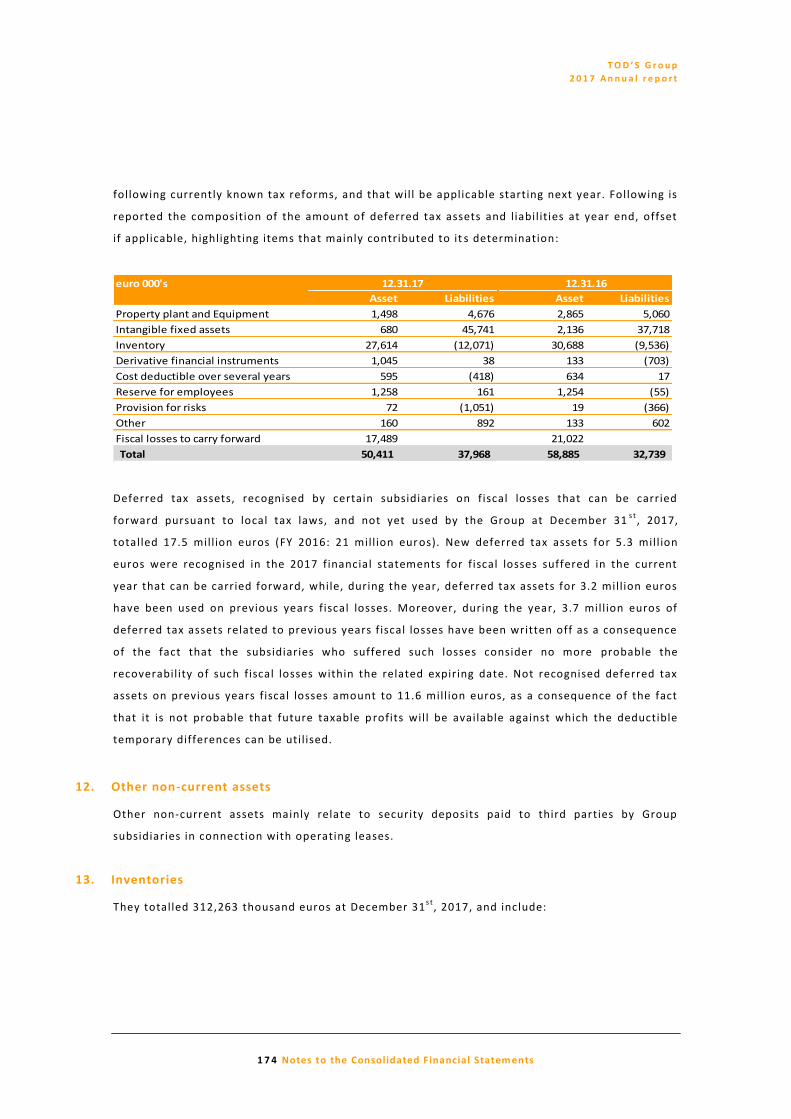
T O D ’ S G r o u p
2 0 1 7 A n n u a l r e p o r t
1 7 4 Notes to the Consolidated Financial Statem ents
following currently known tax reforms, and that will be applicable starting next year. Following is
reported the composition of the amount of deferred tax assets and liabilities at year end, offset
if applicable, highlighting items that mainly contributed to it s determination:
euro 000's
Asset Liabilities Asset Liabilities
Property plant and Equipment 1,498 4,676 2,865 5,060
Intangible fixed assets 680 45,741 2,136 37,718
Inventory 27,614 (12,071) 30,688 (9,536)
Derivative financial instruments 1,045 38 133 (703)
Cost deductible over several years 595 (418) 634 17
Reserve for employees 1,258 161 1,254 (55)
Provision for risks 72 (1,051) 19 (366)
Other 160 892 133 602
Fiscal losses to carry forward 17,489 21,022
Total 50,411 37,968 58,885 32,739
12.31.1612.31.17
Deferred tax assets, recognised by certain subsidiaries on fiscal losses that can be carried
forward pursuant to local tax laws, and not yet used by the Group at December 31s t
, 2017,
totalled 17.5 mill ion euros (FY 2016: 21 mill ion eur os). New deferred tax assets for 5.3 mill ion
euros were recognised in the 2017 financial statements for f iscal losses suffered in the current
year that can be carried forward, while, during the year, deferred tax assets for 3.2 mill ion euros
have been used on previous years f iscal losses. Moreover, during the year, 3.7 mill ion euros of
deferred tax assets related to previous years f iscal losses have been written off as a consequence
of the fact that the subsidiaries who suffered such losses consider no more probable the
recoverability of such fiscal losses within the related expiring date. Not recognised deferred tax
assets on previous years f iscal losses amount to 11.6 mill ion euros, as a consequence of the fact
that it is not probable that future taxable p rofits will be available against which the deductible
temporary differences can be util ised.
12. Other non-current assets
Other non-current assets mainly relate to security deposits paid to third parties by Group
subsidiaries in connection with operating leases.
13. Inventories
They totalled 312,263 thousand euros at December 31s t
, 2017, and include:

T O D ’ S G r o u p
2 0 1 7 A n n u a l r e p o r t
1 7 5 Notes to the Consolidated Financial Statem ents
euro 000's
12.31.17 12.31.16 Change
Raw materials 63,460 54,157 9,303
Semi-finished products 10,636 9,384 1,252
Finished products 291,873 281,227 10,646
Write-down (53,706) (52,877) (828)
Total 312,263 291,892 20,372
The allowance for inventory write -downs reasonably reflects the technical and stylistic
obsolescence of the Group’s inventories at December 31s t
, 2017.
euro 000's
12.31.17 12.31.16
Opening balance 52,877 22,333
Increase 6,948 32,130
Utilization (6,030) (1,586)
Reversal
Exchange rate effects (89)
Closing balance 53,706 52,877
14. Trade receivables and other current assets
14.1 Trade receivables: they represent Group’s exposure in consequence of its wholesale
distribution activity.
euro 000's
12.31.17 12.31.16 Change
Trade receivables 114,017 123,915 (9,898)
Allowances for doubtful accounts (6,546) (5,773) (773)
Net trade receivables 107,471 118,142 (10,672)
The allowances for doubtful accounts represent the reasonable estimate of impairment due to
the specific and generic risk of not being able to collect the trade receivables recognised on the
financial statements. The amount accrued for FY 2017 totalled 1,209 thousand euros. The
following schedule shows the changes during the year in the a llowances for doubtful accounts :
euro 000's
12.31.17 12.31.16
Opening balance 5,773 5,112
Increases 1,209 1,047
Used during year (436) (386)
Closing balance 6,546 5,773

T O D ’ S G r o u p
2 0 1 7 A n n u a l r e p o r t
1 7 6 Notes to the Consolidated Financial Statem ents
14.2 Tax receivables: these total 29,805 thousand euros (FY 2016: 28,646 thousand euros) and
are mainly comprised of receivables for income taxes and value added tax claimed by the Group
from the tax authorities of the count ries where it operates.
14.3 Other current assets:
euro 000's
12.31.17 12.31.16 Change
Deferred costs 8,402 8,802 (400)
Others 30,304 27,833 2,471
Total other current assets 38,706 36,635 2,071
The item “Others” mainly relates to receivables versus manufacturers for the raw materials sold
in connection with manufacturing activities, receivables for credit cards and other receivables to
be collected next year.
15. Derivative financial instruments
The TOD’S Group, characterised by its major presence on international markets, is exposed to
both exchange rate risk, mainly for revenues denominated in currencies other than the euro (see
Note 6), and interest rate risk l imited to its variable -rate debt instruments. In order to realise the
objectives envisaged by the Risk Management policy, the Group enters in derivative contracts
with primary banks for the hedging of the above mentioned risks; in particular, in connection
with exchange rate risk, the Group entered in sell and/or buy foreign currency contracts
(forward), while for the hedging of a variable interest rate risk, the Group entered in interest
rate swaps agreements. Moreover, due to the geographical composition of the Group structure,
which is formed by subsidiaries with different currencies, the Group is exposed to exchange rate
risk related to intercompany financial f lows (Note 6). These risks are managed by the Group
through a monitoring activity of the foreign exchange rate trends related to outstanding or
expected capital transactions and entering into forward contracts if they will have material
contingent effects. Forward contracts have been put in place, for each individual currency, to
hedge a specific percentage of the expected revenue (and cost) volumes in the individual
currencies other than the functional currency.
At the closing date of the financial statements, the notional amount of the currency forward
agreements (sale and purchase) entered into by the Group are summarized as follows:

T O D ’ S G r o u p
2 0 1 7 A n n u a l r e p o r t
1 7 7 Notes to the Consolidated Financial Statem ents
Currency 000's
Notional in
currency
Notional in
euro
Notional in
currency
Notional in
euro
US dol lar 28,030 23,372
HK dol lar 550,000 58,685
Japanese yen 970,000 7,185 3,770,000 27,924
Bri tish pound 26,500 29,868
Swiss franc 7,620 6,512
Chinese renmimbi 350,000 44,846
Singapore dol lar 2,780 1,735
Euro 1,140 1,140 10,170 10,170
Canadian dol lar 5,150 3,424
Austra l ian dol lar 1,510 984
Total 177,752 38,094
Sales Purchases
All derivative contracts will expire during the year 2018.
Below is summarized the composition of the outstanding derivatives at December 31s t
, 2017 and
2016, with information related to carrying amounts, current and non-current, in connection with
fair value and cash flow hedge reserve, the latter presented net of its related tax effects:
euro 000's
Assets Liabilities
Hedging
Reserve Assets Liabilities
Hedging
Reserve
Non-current
Interest rate swaps - cash flow
hedges 1,197 (909) 2,687 (2,042)
Forward foreign exchange contracts -
cash flow hedges
Forward foreign exchange contracts -
fair value hedges
Total non-current 1,197 (909) 2,687 (2,042)
Current
Interest rate swaps - cash flow hedges 1,467 (879) 1,906 (1,135)
Forward foreign exchange contracts -
cash flow hedges 1,357 776 3,602 1,726 3,693 4,241
Forward foreign exchange contracts -
fair value hedges 1,406 216 1,131 2,447
Total current 2,763 2,459 2,723 2,857 8,046 3,106
Total 2,763 3,656 1,814 2,857 10,733 1,064
12.31.17 12.31.16
Cash flow hedge reserve includes even some intercompany transactions, positive for 859
thousand euros net of tax effect (118 thousand euros in 2016), for which derivatives have been
T O D ’ S G r o u p
2 0 1 7 A n n u a l r e p o r t
1 7 8 Notes to the Consolidated Financial Statem ents
expired at December 31s t
, 2017, that will be transferred to the income statement when sales
versus third customers or when forecast transactions will be realized.
Moreover, the transfer of the effect of the hedging transactions to the income statement was
equal to 5,371 thousand euros, of which 5,440 thousand euros were represented as an increase
of revenues and 69 thousand euros as an increase of costs.
The overall effect recognised in the income statement in connection with derivatives for the
hedging of interest rate risk amounted to 1,840 thousand euros, totally represented in the
financial expenses.
16. Cash and cash equivalents
Cash and cash equivalents are related to cash and bank deposits for 221,609 mill ion euros
(227,706 mill ion euros at December 31s t
, 2016). For further information see the statement of
cash flow.
17. Assets held for sale
The Group did not have any held for sale assets at December 31s t
, 2017.
18. Equity
18.1 Share capital. At December 31s t
, 2017, the Parent company share capital totalled
66,187,078 euros (66,187,078 euros at December 31s t
, 2016), and was divided into 33,093,539
shares having a par value of 2 euros each, fully subscribed and pai d in. All shares have equal
voting rights at the general meeting and participation in profits.
At December 31s t
, 2017 Mr. Diego Della Valle, president of the Board of Directors, hold, directly
and indirectly, 60.663% of TOD’S S.p.A. share capital. At Dece mber 31s t
, 2017 the Group did not
own treasury shares in the parent TOD’S S.p.A., and it did not execute any transactions on those
shares during the year.
18.2 Capital reserves. Capital reserves are exclusively related to share premium reserve,
amounting to 416,588 thousand of euros unchanged in respect to the previous year.
18.3 Hedging and translation reserves. The following schedule il lustrates the changes occurred
in 2017 for the Group:

T O D ’ S G r o u p
2 0 1 7 A n n u a l r e p o r t
1 7 9 Notes to the Consolidated Financial Statem ents
euro 000's
Total
Balance as of 01.01.16 15,976 (3,346) 12,630
Increase in fair value of hedging derivatives 805 805
Exchange differences 8,465 38 8,503
Transfer to P&L Account of hedging derivatives 3,567 3,567
Others
Balance as of 01.01.17 24,441 1,064 25,505
Increase in fair value of hedging derivatives 3,581 3,581
Exchange differences (19,895) (65) (19,960)
Transfer to P&L Account of hedging derivatives (2,766) (2,766)
Others
Balance as of 12.31.17 4,546 1,814 6,360
Translation
Reserve
Hedging
Reserve
For comments related to the changes of hedging reserve please see Note 15.
18.4 Other reserves and profit of the period. These reserves include the equity reserves of the
parent company TOD’S S.p.A., the difference between the shareholders’ equity of the
subsidiaries, and the carrying values of the equity investments, as well as the effects of
consolidation adjustments on Group equity.
euro 000's
Balance as of 01.01.16 481,392 92,735 574,128
Allocation of 2015 result 26,548 (26,548)
Dividends (66,187) (66,187)
Profit for the period 86,292 86,292
Other changes (15,300) (15,300)
Balance as of 01.01.17 492,640 86,292 578,932
Allocation of 2016 result 30,033 (30,033)
Dividends (56,259) (56,259)
Profit for the period 71,007 71,007
Other changes 3,457 3,457
Balance as of 12.31.17 526,130 71,007 597,137
Profit (loss)
of the
period
Other
reserves
Total
Other changes for the year 2017 are mainly related to both the use of the specific reserve for
promoting territorial solidarity projects, for 0.9 mill ion euros and to exchange gains from ne t
investment in foreign operations for 4.3 mill ion euros.

T O D ’ S G r o u p
2 0 1 7 A n n u a l r e p o r t
1 8 0 Notes to the Consolidated Financial Statem ents
1 8 . 5 D i v i d e n d s . In execution of a resolution by the Shareholders' Meeting of April 21s t
, 2017,
the parent company TOD’S S.p.A. paid the shareholders dividends in May for the net income
realised in 2016. The aggregate amount of the dividends paid is 56,259,016.30 euros, at the rate
of 1.7 euros for each of the 33,093,539 shares representing the share capital at the coupon
detachment date (May 23rd
, 2017).
The Board of Directors of the parent compa ny TOD’S S.p.A. has proposed that the net profit for
2017 be distributed with payment of a dividend of 1.4 euros per share. The dividend is subject to
approval by the annual Shareholders’ Meeting, and was not included among the liabilities
reported on this balance sheet. The proposed dividend, totalling 46,330,954.60 euros on the
basis of the currently outstanding shares, is payable to all shareholders entered on the register
of shareholders at the coupon detachment date.
19. Contingent and potential liabilities and assets
19.1 Provisions for risks. They include the estimate of l iabilities, with uncertain maturity date
or amount, on which the Group might incur in case of a legal or constructive obligation in
connection with a past event. The figure mainly include provisions related to both legal and tax
lawsuits, risks and costs for employees and reinstatement costs.
euro 000's
12.31.17 12.31.16
Provisions for risks - non current
Opening balance 4,517 3,530
Increase 1,099 1,091
Utilization (87) (149)
Reversal (4)
Exchange rate effects (143) 48
Closing balance 5,385 4,517
Provisions for risks - current
Opening balance 1,543 1,955
Increase 4,056 799
Utilization (878) (1,211)
Reversal (95)
Exchange rate effects
Closing balance 4,626 1,543
19.2 Contingent liabilities and other commitments.
i. Guarantees granted to third parties. At December 31s t
, 2017 the Group had provided
guarantees amounting to 5,589 thousand euros (compared to 5,424 thousand euros in 2016)

T O D ’ S G r o u p
2 0 1 7 A n n u a l r e p o r t
1 8 1 Notes to the Consolidated Financial Statem ents
against the contract commitments undertaken by some Group companies. The guarantees mainly
consist of a surety of 3,629 thousand euros (same amounts in 2016) issued ag ainst the
commitment to finance the Colosseum restoration works, the financial l iability of which has been
recognised in full in the accounts (Notes 7 and 22).
i i. Guarantees received from third parties. Guarantees received by the TOD’S Group from banks
as security for contractual commitments totalled 15,657 thousand euros (15,494 thousand euros
in 2016).
iii. Mortgages. Group real estate has been encumbered by the following mortgages:
Tokyo building – As collateral for two bonds issued by the subsidiary Holpaf B.V. (Note 21), a f irst
mortgage in favour of Intesa San Paolo for JPY 1,000 mill ion (7.4 mill ion euros), and a first
mortgage in favour of Société Européenne de Banque for JPY 5,652.8 mill ion (41.9 mill ion euros),
both as collateral for the principal and all expenses resulting from the loan agreement.
iv. Other guarantees. As additional security for repayment of the bonds indicated at sub -indent
i i i . hereinabove, the parent company TOD’S S.p.A. (when taking over the contractual obligations
assumed by the previous guarantor, Holpaf B.V., vis -à-vis the subscribing banks), issued the
following additional guarantees:
a) Property Purchase Option : a put option granted to Intesa San Paolo Bank Ireland PLC on the
Omotesando property, which may be exercised only if Holpaf B.V. defaults during the term of the
bonds and the creditor demands payment of the mortgage. In this scenario, TOD’S S.p.A. must
purchase the property at a specific price that varies over the term of the option (decreasing
price, equal to the amount of the residual debt of the two bonds not repaid by Holpaf B.V. at the
time of default).
b) Earthquake Indemnity Letter ; TOD’S S.p.A. has undertaken to hold harmless the rights to
repayment of the bonds held by Intesa San Paolo Bank Ireland PLC and Société Européenne de
Banque even in the event of damage or destruction of the property in an earthquake;
c) All Risks Indemnity Letter ; TOD’S S.p.A. has undertaken to hold harmless the rights to
repayment of the bonds held by Intesa San Paolo and Socié té Européenne de Banque even in the
event of damage or destruction of the property due to any event;
d) Pledge on the fire insurance policy; in the event of loss due to building fire, any
reimbursement by the insurance company constitutes a pledge in guara ntee of the bonds whose
value has not yet been repaid to Intesa Sanpaolo Bank Ireland PLC and Société Européenne de
Banque.
At December 31s t
2017, the residual face value of the principal for the bond amounted to JPY
1,602 mill ion euros (11.9 mill ion euros ).

T O D ’ S G r o u p
2 0 1 7 A n n u a l r e p o r t
1 8 2 Notes to the Consolidated Financial Statem ents
19.3 Lease agreements. The leases entered into by the Group are for rental of spaces used as
offices, production plants, and DOS. At the reporting date, the minimum lease payments stil l
owed by the Group under current agreements were as follows:
euro mn
2017 2016
2017 99.5
2018 92.8 84.3
2019 75.5 63.0
2020 62.3 53.6
2021 50.1 43.2
2022 41.0
Over 5 years 137.2 116.6
Total 458.9 460.2
Operating lease instalments, included in the Costs of use of third party assets, totalled 112.8
mill ion euros in the year 2017, including contingent rent.
20. Employee Benefits
20.1 Defined contribution plans. The Group has a defined contribution retirement pla n
(employee severance indemnities – TFR) in favor of employees at Group’s Italian companies with
more than 50 employees (see the following section in this regard) and the Japanese and Korean
subsidiaries. At December 31s t
, 2017, the liability accrued vis-à-vis employees was 3,808
thousand euros (December 31s t
, 2017: 3,467 thousand euros), and relating only to the four Asian
companies, since the amounts accrued in favour of Italian employees have all been transferred to
funds outside the Group. The amount charged to profit and loss for the period totals 1,079
thousand euros.
20.2 Defined benefit plans. Following the statutory amendments introduced beginning January
1s t
, 2007, employee severance indemnities, a deferred payment plan in favor of all employees of
the Group’s Italian companies, were classif ied as a defined benefits plan (IAS 19) only for f irms
with less than 50 employees, for which the Group’s obligation is not related with payment of the
contributions accrued on the paid compensation, but extends unt il the end of the employment
relationship, or, for companies with more than 50 employees, for the liability accrued until
2007(13)
. For these types of plans, the principle requires that the accrued amount be projected
13 The statutory amendment envisaged that for firms with more than 50 employees, the employee severance indemnities accrued from 1 st January 2007 had to be allocated to supplemental retirement plans (pe nsion funds) or, alternatively, to a Treasury Fund set up at the INPS (Italian National Social Security Institute). Since all obligations of firms towards their employees ceased starting on 1 st January 2007, all accrued employee severance

T O D ’ S G r o u p
2 0 1 7 A n n u a l r e p o r t
1 8 3 Notes to the Consolidated Financial Statem ents
into the future in order to determine t he amount to be paid upon termination of the employment
relationship, with an actuarial assessment that accounts for the rate of rotation of employees,
expected evolution of compensation, and other factors.
The main actuarial assumptions used for the valu ation are summarized below:
Discounting rate: 1.3%
It is related to the average yield curve from IBOXX Eurozone Corporates AA of December
2017.
Inflation rate: 1.50%;
TFR incremental rate: 2.625%.
The table below shows the variation of the liability occur red in 2017:
euro 000's
Year 2017 Year 2016
Opening balance 9,329 9,230
Service costs 113 119
Interest costs 124 190
Benefits paid (556) (516)
Actuarial (gains)/losses 4 307
Other
Closing balance 9,014 9,329
Employee benefits include even other long term employee benefits.
21. Financial liabilities
The Group’s f inancial l iabilities at December 31s t
, 2017 are broken down as follows:
euro 000's
12.31.17 12.31.16 Change
Current account overdraft 15,910 15,714 (196)
Financing and other financial liabilities- short term 48,743 50,234 1,491
Total financial liabilities short-term 64,654 65,948 1,294
Financing and other financial liabilities - long term 147,617 197,139 49,523
Total financial liabilities 212,270 263,087 50,817
Total Financing - and other financial liabilities (short/long term) 196,360 247,373 51,013 Financing and other financial liabilities. At December 31
s t, 2017 financing and other financial
l iabilities were represented by the following medium-long term position:
indemnities are covered by the rules governing defined contribution plans for the liability accrued from such date.

T O D ’ S G r o u p
2 0 1 7 A n n u a l r e p o r t
1 8 4 Notes to the Consolidated Financial Statem ents
Currency 000's
Type Counterpart Currency Maturity
Medium and long term bank pool loan Mediobanca - Crédit Agricole Eur 2021 149,372 149,372
Medium and long term loan Banca Nazionale del lavoro S.p.A. Eur 2019 9,381 9,381
Medium and long term loan Intesa SanPaolo S.p.A. Eur 2019 24,994 24,994
Notes A-2 Société Européenne de Banque Jpy 2021 1,602,126 11,867
Total financing 195,614
Other financial liabilities Inr n.a. 57,139 746
Total financing and other financial liabilities 196,360
Res. Debt in
currency
Res. Debt in
Euro
The medium and long term bank pool loan is related to the financing agreement signed on July
2014 by TOD’S S.p.A. and Mediobanca/Crédit Agricole. Such loan has a variable interest rate
equal to EURIBOR 3M + 55 basis points (the reduction from 80 basis points to 55 basis points
occurred last November 2017) which was hedged with two derivative contracts ( interest rate
swaps - IRSs) for the same notional amount and duration. The duration of such loan is 7 years
from the signing date and it will be refunded quarterly.
The medium and long term loans are related to two loan agreements signed in 2015 between the
parent company TOD’S S.p.A. and BNL S.p.A. (BNP Paribas Group) and Intesa San Paolo S.p.A.
respectively, for an amount of 25 mill ion euros each; the reimbursements will be respectively in
four years with a payment of 16 instalments at the end of every quarter and one -shot with a
single payment at the expiry date. Interests rates are variables and equal to the EURIBOR 3m
+0.42% and EURIBOR 3m +0.5% respectively.
These loans contains, among others, specific f inancial covenants; in particular, it is requested to
respect the following parameters computed at a Group level:
Bank Financial covenants
Mediobanca/Crédit Agricole Net financial liabilities/EBITDA ≤ 3.5
Banca Nazionale del lavoro S.p.A. Net financial liabilities/EBITDA ≤ 3.5
Intesa SanPaolo S.p.A. Net financial liabilities/EBITDA ≤ 3
Limit at 31st
December
The parameters indicated above are constantly monitored by the Group, and all f inancial
covenants are fulfi l led at December 31s t
, 2017.
The financial l iabilities indicated as Notes A -2 represent an amortised, non-convertible fixed-rate
(3.239%) bond denominated in JPY, issued in 2006 by the subsidiary Holpaf B.V. to refinance the
debt assumed for purchase of the land and construction of the building in Omotesando. Note that
the bond related to Notes A1 have been fully reim bursed with the final payment done on August
2017. The debt referred to Notes A-2 includes the residual debt for principal amount of 11,564
thousand euros, the interest accrued for the year for 143 thousand euros and the effect of fair
value measurement upon initial recognition for 160 thousand euros which is measured at
amortized cost.
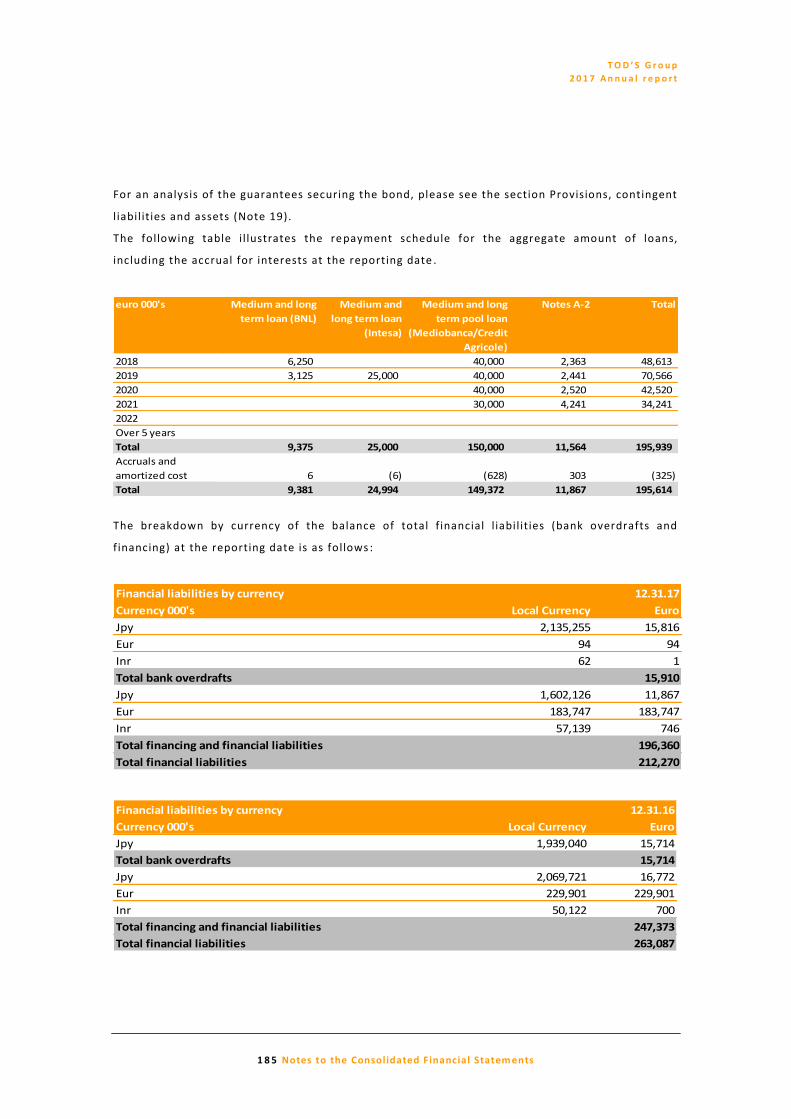
T O D ’ S G r o u p
2 0 1 7 A n n u a l r e p o r t
1 8 5 Notes to the Consolidated Financial Statem ents
For an analysis of the guarantees securing the bond, please see the section Provisions, contingent
l iabilities and assets (Note 19).
The following table il lustrates the re payment schedule for the aggregate amount of loans,
including the accrual for interests at the reporting date .
euro 000's Medium and long
term loan (BNL)
Medium and
long term loan
(Intesa)
Medium and long
term pool loan
(Mediobanca/Credit
Agricole)
Notes A-2 Total
2018 6,250 40,000 2,363 48,613
2019 3,125 25,000 40,000 2,441 70,566
2020 40,000 2,520 42,520
2021 30,000 4,241 34,241
2022
Over 5 years
Total 9,375 25,000 150,000 11,564 195,939
Accruals and
amortized cost 6 (6) (628) 303 (325)
Total 9,381 24,994 149,372 11,867 195,614
The breakdown by currency of the balance of total f inancial l iabilities (bank overdrafts and
financing) at the reporting date is as follows :
Financial liabilities by currency 12.31.17
Currency 000's Local Currency Euro
Jpy 2,135,255 15,816
Eur 94 94
Inr 62 1
Total bank overdrafts 15,910
Jpy 1,602,126 11,867
Eur 183,747 183,747
Inr 57,139 746
Total financing and financial liabilities 196,360
Total financial liabilities 212,270
Financial liabilities by currency 12.31.16
Currency 000's Local Currency Euro
Jpy 1,939,040 15,714
Total bank overdrafts 15,714
Jpy 2,069,721 16,772
Eur 229,901 229,901
Inr 50,122 700
Total financing and financial liabilities 247,373
Total financial liabilities 263,087

T O D ’ S G r o u p
2 0 1 7 A n n u a l r e p o r t
1 8 6 Notes to the Consolidated Financial Statem ents
For interest rate sensitivity analysis ( IFRS 7), and the disclosure for the 3 further financing
agreements related to credit l ines available for the Group but not used yet at December 31s t
,
2017 see Note 6.
22. Other non-current liabilities
The balance for this item, 15,795 thousand euros, refers mainly to the liability recognised in
relation to the agreement made for f inancing of restoration work on the Coliseum (Note 7) for
10,287 mill ion euros (9,973 mill ion euros at December 31s t
, 2016). This l iability was recognised
at the discounted value of the financial outlays that are reasonably foreseeable on the basis of
the multi-year plan for restoration work.
23. Trade payables and other current liabilities
euro 000's
12.31. 17 12.31. 16 Change
Trade payables 158,388 130,804 27,584
Tax payables 7,932 8,241 (309)
Other liabilities
Payables due to employees 11,730 11,093 636
Social security institutions 6,844 6,999 (155)
Other 19,632 17,766 1,865
Total other liabilities 38,205 35,859 2,347
The increase of trade payables is due to the normal business trend.
The payables to employees consist of amounts accrued in favour of employees ( including the
portion of unused holiday leave) and not paid at the reporting date.
“Other” mainly includes advances from customers, the current por tion of the returns estimates at
the end of the year, deferred revenues and other current l iabilities.
24. Revenues
Revenues of the Group during the year are 963,3 million euros (1,004 mill ion euros in 2016),
decreased for 4.1% in respect to the previous y ear.
For further details related to revenues see the comments provided in the report on operations.
The item “Other income” amounts to 19.5 million euros (36 million euros in 2016) and it mainly
includes active royalties, income from property management a nd insurance reimbursements.

T O D ’ S G r o u p
2 0 1 7 A n n u a l r e p o r t
1 8 7 Notes to the Consolidated Financial Statem ents
25. Personnel costs
The personnel costs incurred by the Group in FY 2017 as compared with those for FY 2016 are
il lustrated as follows:
The following table il lustrates the breakdown of Group’s employees by category:
12.31.17 12.31.16 Average 17 Average 16
Executives 52 49 49 49
White-collar Employees 3,202 3,222 3,198 3,254
Blue-collar Employees 1,373 1,214 1,325 1,211
Total 4,627 4,485 4,572 4,514
26. Financial income and expenses
The breakdown of f inancial income and expenses in f iscal 2017 is as follows:
euro 000's
Year 17 Year 16 Change
Income
Interest income on current account 546 958 (412)
Foreign exchange gains 16,650 18,929 (2,279)
Other 146 298 (152)
Total income 17,341 20,184 (2,843)
Expenses
Interest on medium-long term financing (1,557) (2,579) 1,021
Interest on short term borrowings (135) (145) 10
Foreign exchange losses (21,953) (24,282) 2,329
Other (2,896) (6,573) 3,678
Total expenses (26,541) (33,579) 7,038
Total net income and expenses (9,199) (13,395) 4,195
27. Income or losses from equity investments
The figure mainly includes the negative result from the sales of TOD’S Brasil Ltda equity
investment (Note 4).
euro 000's
Year 2017 Year 2016 Change 2017 2016
Wages and salaries 145,251 143,787 1,464 15.1 14.3
Social security contributions 40,347 36,566 3,781 4.2 3.6
Employee sev. Indem. (service cost) 5,941 5,855 86 0.6 0.6
Total 191,540 186,208 5,331 19.9 18.5
% on sales

T O D ’ S G r o u p
2 0 1 7 A n n u a l r e p o r t
1 8 8 Notes to the Consolidated Financial Statem ents
28. Income taxes
Tax expenses allocable to FY 2017, including deferred taxes, totalled 32.5 mill ion euros, and are
broken down into current and deferred taxes as follows :
euro 000's
Year 17 Year 16
Current taxes 23,086 30,618
Deferred taxes 9,449 (1,420)
Total 32,535 29,198
Tax rate (31.9%) (25.4%)
The parent company’s theoretical tax rate for FY 2017 was 2 4%.
The following schedule reconciles theoretical taxes, calculated by using the theoretical tax rate
of the parent company, and the taxes actually charged to income :
euro mn
Taxes Rate %
Theoretical income taxes at the rate of parent company 24.5 24.0
IRAP effect 3.9 3.9
Previous year taxes 4.9 4.8
Permanent differences 2.3 2.3
Patent box tax effect (3.2) (3.2)
Effect connected with the different rates of the foreign subsidiaries 0.2 0.2
Effective income taxes 32.5 31.9 Previous year taxes mainly include the negative impact on deferred tax assets of the US tax
reform, for 1.5 mill ion euros, and the prudent write off, for 3.6 mill ion euros, of deferred tax
assets on fiscal losses, previously recognized by some Group subsidiaries. Previous year tax rate
had moreover benefited from the recognition of the ec onomic contribution deriving from the so -
called “patent box” as it relates to two fiscal years (2015 and 2016).
29. Earnings per share
The calculation of base and diluted earnings per share is based on the following:
i. Reference Profit
euro 000's
For continuing and discontinued operations Year 17 Year 16
Profit used to determine basic earning per share 71,007 86,292
Dilution effects
Profit used to determine diluted earning per share 71,007 86,292

T O D ’ S G r o u p
2 0 1 7 A n n u a l r e p o r t
1 8 9 Notes to the Consolidated Financial Statem ents
euro 000's
For continuing operations Year 17 Year 16
Profit for the year 71,007 86,292
Income (Loss) from discontinued operations
Profit used to determine basic earning per share 71,007 86,292
Dilution effects
Profit used to determine diluted earning per share 71,007 86,292
In both fiscal 2017 and 2016, there were no dilutions of net consolidated earnings, partly as a
result of activities that were discontinued during the periods in question.
i i. Reference number of shares
Year 17 Year 16
Weighted average number of shares to determine basic earning per share 33,093,539 32,916,587
Share Options
Weighted average number of shares to determine diluted earning per share 33,093,539 32,916,587
i i i . Base earnings per share. Calculation of the base earning per share for f iscal year 2017 is
based on the net profit attributable to holders of ordinary shares of the parent company TOD’S
S.p.A., totalling 71,007 thousand euros (86,292 thousand euros in 2016), and on the average
number of ordinary shares outstanding during the same period, totalling 33,093,539 (32,916,587
in 2016).
i v . Diluted earnings per share. Calculation of the diluted earnings per share for the period
January-December 2017 coincides with calculation of earnings per share, due to the fact that
there are no items which produce dilution effects .
30. Transaction with related parties
The Group's related parties transactions were executed in compliance with the procedural
sequence and implementing procedures set out in the Related Parties Transactio ns Procedure
approved by the TOD'S S.p.A. Board of Directors in implementation of the Related Parties
Regulation adopted by CONSOB with Resolution no. 17221 of March 12t h
2010, as subsequently
amended. In accordance with market best practices, significant related party transactions are
subject to an in-depth review involving, inter alia:
( i) complete, prompt transmission of material information to the delegated Board of Directors
committees (the Control and Risk Committee and the Independent Directors Comm ittee, each
within the ambit of their delegated responsibilities, where the majority or all members of these

T O D ’ S G r o u p
2 0 1 7 A n n u a l r e p o r t
1 9 0 Notes to the Consolidated Financial Statem ents
committees are independent directors), who in the performance of their functions also avail
themselves of the assistance of independent experts;
( i i) the issuance of an opinion (either binding or non -binding, as applicable) before approval of
the transaction by the Board of Directors (or, if appropriate, by the body delegated to resolve on
the transaction). All transactions – which are connected with the normal operations of TOD’S
Group companies – were executed solely on behalf of the Group by applying contractual
conditions consistent with those that can theoretically be obtained on an arm’s length basis.
Most significant transactions concluded du ring the period
On June 29t h
, 2017 the strategic partnership agreement in place with Italiantouch S.r. l. , a
company controlled by Directors Diego Della Valle and Andrea Della Valle and owned by the
former, was renewed for f ive additional years for the dev eloment of the Group’s e -commerce
channel. The agreement concerns the sales of products under all four brands owned by the
Group, through the e-commerce platform of the partner, and provides for the development of
already esisting markets under the previou s agreement and the implementation of the channel in
new geographical areas.
Related party transactions at December 31
s t, 2017
Further to the information quoted above, TOD’S Group continued to maintain a series of
contractual relationship with related par ties (directors/controlling or significant shareholders) in
2017. The principal object of the transactions of the year was the sale of products and lease of
sales spaces, show rooms and offices.
i. Commercial transactions with related parties – Revenues
euro 000's
Year 2017
Parent Company (*) 13,263 5
Directors
Exec. with strat. respons.
Total 13,263 - - 5 -
Year 2016
Parent Company (*) 11,051 4 5
Directors
Exec. with strat. respons.
Total 11,051 4 - 5 -
Rendering
of services
Sales of
products Royalties
Operating
lease
Other
operations
(*) Companies directly or indirectly controlled by Chairman of the Board of Directors Diego Della Valle

T O D ’ S G r o u p
2 0 1 7 A n n u a l r e p o r t
1 9 1 Notes to the Consolidated Financial Statem ents
i i. Commercial transactions with related parties – Costs
euro 000's
Year 2017
Parent Company (*) 275 292 4,529 254
Directors
Exec. with strat. respons.
Total 275 292 - 4,529 254
Year 2016
Parent Company (*) 272 447 4,497 194
Directors
Exec. with strat. respons.
Total 272 447 - 4,497 194
Operating
lease
Costs of
products
Rendering
of services Royalties
Other
operations
(*) Companies directly or indirectly controlled by Chairman of the Board of Directors Diego De lla Valle
i i i. Commercial transactions with related parties – Receivables and payables
Receivables and payables
euro 000's Receivables Payables Receivables Payables
Parent Company (*) 2,882 564 2,915 252
Directors
Exec. with strat. respons.
Total 2,882 564 2,915 252
12.31.17 12.31.16
(*) Companies directly or indirectly controlled by Chairman of the Board of Directors Diego Della Valle
Due to the fact that the above mentioned amounts are not si gnificant, the disclosure hasn’t been
provided separately in the face of the financial statements in accordance with CONSOB resolution
n. 155519 of July 27t h
, 2006.
Transactions between Group companies included in the scope of consolidation have been
eliminated from the consolidated financial statements. Consequently, they have not been
highlighted in these notes.
Compensation of Directors, Statutory Auditors, and General Managers
The following table il lustrates the compensation accrued in the year 2017 b y each of the
Directors, Statutory Auditors, Executives with Strategic Responsibilities of TOD’S S.p.A. ( including
for the activities that they performed at subsidiaries) for any reason and in any form:

T O D ’ S G r o u p
2 0 1 7 A n n u a l r e p o r t
1 9 2 Notes to the Consolidated Financial Statem ents
euro 000's
Compensation
for office
Compensat.
for part. in
Commit.
Non cash
benefits
Bonus and
other
incentives
Compens.
as employ.
Other
compens.
Directors
Diego Della Valle (*) 1,832.1 8.7
Andrea Della Valle (**) 1,232.1 8.7
Luigi Abete 31.8 7.8
Maurizio Boscarato 32.1 9.3 220.0 (2)
Luigi Cambri 32.1 9.3 9.0 (4)
Sveva Dalmasso 32.1 7.8
Emanuele Della Valle 30.6
Romina Guglielmetti 32.1 17.4
Emilio Macellari (****) 247.1 8.7 480.0 (2)
Vincenzo Manes 32.1 15.9
Cinzia Oglio 32.1 2.9 28.8 147.7
Pierfrancesco Saviotti 31.5 7.5
Michele Scannavini 32.1
Stefano Sincini (***) 448.1 8.7 3.9 516.2 111.0 (1)
Total 4,078.0 109.8 6.7 28.8 663.9 820.0
Statutory Auditors
Giulia Pusterla (*****) 90.0
Enrico Colombo 60.0 58.5 (3) (4)
Fabrizio Redaelli 60.0
Total 210.0 58.5
Executives with strategic responsibilities (******) 7.0 63.0 972.2 126.0 (1)
Legend ( * ) Chairman of Board of Directors ( 1 ) Director of subsidiary ( * * ) Vice Chairman of Board of Directors ( 2 ) Consultant TOD’S S.p.A. ( * * * ) Chief Executive Officer ( 3 ) Statutory Auditor of subsidiary ( * * * *) Member of Executive Committee ( 4 ) Member of Compliance Program Supervisory Board ( * * * ** ) Chairman of the Statutory Board ( * * * ** * ) Includes General Directors salaries limited
to compensation for the employment relationship.
The table above does not include the indemnities for termination of the office as a Director and
for the employment relationship of the Chief Executive Officer and General Manager Dott.
Stefano Sincini for which reference is made to the press release published on the website
www.todsgroup.com on March 13t h
, 2018.
No severance indemnity is provided for Dir ectors and Executives with Strategic Responsibilities.
31. Events and significant non-recurring transactions
P u r s u a n t t o C o n s o b C o m m u n i c a t i o n N o . D E M / 6 0 6 4 2 9 3 o f J u l y 2 8t h
, 2 0 0 6 , t h e G r o u p d i d
n o t c a r r y o u t a n y s i g n i f i c a n t n o n - r e c u r r i n g o p e r a t i o n s i n 2 0 1 7 .

T O D ’ S G r o u p
2 0 1 7 A n n u a l r e p o r t
1 9 3 Notes to the Consolidated Financial Statem ents
32. Items or transactions resulting from unusual and/or exceptional transactions
There were no items or transactions resulting from unusual and/or exceptional transactions
during the year.
33. Significant events occurred after the end of the year
In order to raise liquid funds necessary to finance any possible requirements arising from core
commercial operations and general business needs, the Parent Company entered into two loan
agreements with two major banks after the reporting date. On January 26t h
, 2018 a loan
agreement was entered into with Banco BPM S.p.A., which granted a 4 -year revolving credit
facil ity, in a maximum amount of 100 mill ion euros, which had not yet been used at the r eporting
date. On January 29t h
, 2018 a loan agreement was entered into with Intesa Sanpaolo S.p.A., in an
amount of 100 mill ion euros, which bears no charges and interest, to be repaid in a single
instalment on January 29t h
, 2019.

Independent auditor's report

Independent auditor’s report in accordance with article 14 of Legislative Decree No. 39 of 27 January 2010 and article 10 of Regulation (EU) No. 537/2014
To the shareholders of TOD’S SpA Report on the Audit of the Consolidated Financial Statements Opinion We have audited the consolidated financial statements of TOD’S SpA and its subsidiaries (hereinafter also the “TOD’S Group”), which comprise the consolidated statement of financial position as of 31 December 2017, the consolidated income statement, statement of comprehensive income, statement of changes in equity and statement of cash flows for the year then ended, and notes to the consolidated financial statements, including a summary of significant accounting policies. In our opinion, the consolidated financial statements give a true and fair view of the financial position of the TOD’S Group as of 31 December 2017, and of the result of its operations and cash flows for the year then ended in accordance with International Financial Reporting Standards as adopted by the European Union, as well as with the regulations issued to implement article 9 of Legislative Decree No. 38/05. Basis for Opinion We conducted our audit in accordance with International Standards on Auditing (ISA Italia). Our responsibilities under those standards are further described in the Auditor’s Responsibilities for the Audit of the Consolidated Financial Statements section of this report. We are independent of TOD’S SpA (the Company) pursuant to the regulations and standards on ethics and independence applicable to audits of financial statements under Italian law. We believe that the audit evidence we have obtained is sufficient and appropriate to provide a basis for our opinion. Key Audit Matters Key audit matters are those matters that, in our professional judgment, were of most significance in our audit of the consolidated financial statements of the current period. These matters were addressed in the context of our audit of the consolidated financial statements as a whole, and in forming our opinion thereon, and we do not provide a separate opinion on these matters.

2 of 6
Key Audit Matters Auditing procedures performed in response to key audit matters
Allowance for inventory write-downs (See note no. 13 to the consolidated financial statements) Final inventories of raw materials, semi-finished and finished products, amounting to Euro 312 million at 31 December 2017, are carried net of an allowance for inventory write-downs of Euro 54 million, which is about 15 per cent of the value of final inventories. The allowance for inventory write-downs is estimated centrally by the Parent Company’s management with reference to raw materials on the basis of their possibility of use within the production process and as regards finished products based on the ageing of collections in stock and their foreseeable usage through the Group distribution channels. We focused on the allowance for inventory write-downs taking account of its relevance in absolute terms and the complexity of the estimates performed by TOD’S SpA’s management to evaluate it.
We obtained the calculation of the consolidated allowance for inventory write-downs prepared by TOD’S management and we verified its mathematical accuracy. In relation to raw materials, we evaluated the adequacy of the allowance by checking the adequacy of the write-down percentages used by the Parent Company that we compared for consistency with those of the previous years, with historical data and with products scrapped in the year, as well as by performing analysis targeted on no- or slow-moving raw material categories. With reference to finished products we evaluated the adequacy of the allowance by verifying the adequacy of the write-down percentages used by the Parent Company on unsold items referred to one season/collection, checking the consistency of these percentages with the previous years, analysing the historical sale trend of non-current collections over the TOD’S Group distribution channels and products scrapped in the year, as well as by verifying the adequacy throughout the years of the amount of the allowance for inventory write-downs initially accrued in relation to each season/collection. In order to ascertain whether additional write-downs needed to be made, we also carried out analyses on the sales with negative margins realised in the subsequent year.

3 of 6
Key Audit Matters Auditing procedures performed in response to key audit matters
Roger Vivier brand (See notes no.7.1 and 9 to the consolidated financial statements) The Roger Vivier brand, which was acquired by the Group in January 2016, is recognised among the intangible assets of the consolidated balance sheet at 31 December 2017 in an amount of Euro 416 million, accounting for about 26 per cent of consolidated assets. This brand is recognised at acquisition cost and is not amortised since it is considered with an indefinite useful life. Accordingly, a test is performed at least once a year in order to verify if the recoverable amount of the brand, determined as the higher of the asset's fair value less costs of disposal and its value in use, is higher than its carrying amount (impairment test). Specifically, in accordance with the applicable accounting standards and with the impairment test procedure approved by the Board of Directors on 6 March 2018, the Company compared the book value of the Roger Vivier brand at 31 December 2017 with its value in use determined applying the same evaluation methods used on its acquisition.
We focused our attention on the Roger Vivier brand because it consists of a significant amount, its valuation process is complex and it requires a high degree of professional judgement, especially in estimating the expected cash flows and in determining the discount and growth rates.
We obtained the impairment test performed by management on the Roger Vivier brand and the related supporting documentation. We verified the reasonableness of the Roger Vivier 2018 budget and the additional economic projections for the explicit period of the impairment test, as well as the reasonableness of the underlying key assumptions. In particular, we focused our attention on the reasonability of the increase in revenue checking its consistency with the historical growth trend of revenue. We also evaluated the reliability of the projections made by management, verifying that the 2017 budget had been achieved and analysing the actual data in the first two months of 2018. Moreover, we verified, with the support of PwC network experts in evaluations, the consistency of the impairment model adopted by the Company with the standard evaluation practice, as well as the adequacy of the key assumptions used by management and the accuracy of the calculations. Finally, our controls also covered the notes to the consolidated financial statements in order to verify the adequacy and completeness of the disclosures therein.
Responsibilities of Management and Those Charged with Governance for the Consolidated Financial Statements Management is responsible for the preparation of the consolidated financial statements that give a true and fair view in accordance with International Financial Reporting Standards as adopted by the European Union, as well as with the regulations issued to implement article 9 of Legislative Decree No. 38/05 and, in the terms prescribed by law, for such internal control as management determines is necessary to enable the preparation of consolidated financial statements that are free from material misstatement, whether due to fraud or error.

4 of 6
Management is responsible for assessing the Group’s ability to continue as a going concern and, in preparing the consolidated financial statements, for the appropriate application of the going concern basis of accounting, and for disclosing matters related to going concern. In preparing the consolidated financial statements, management uses the going concern basis of accounting unless management either intends to liquidate TOD’S SpA or to cease operations, or has no realistic alternative but to do so. Those charged with governance are responsible for overseeing, in the terms prescribed by law, the Group’s financial reporting process. Auditor’s Responsibilities for the Audit of the Consolidated Financial Statements Our objectives are to obtain reasonable assurance about whether the consolidated financial statements as a whole are free from material misstatement, whether due to fraud or error, and to issue an auditors’ report that includes our opinion. Reasonable assurance is a high level of assurance but is not a guarantee that an audit conducted in accordance with International Standards on Auditing (ISA Italia) will always detect a material misstatement when it exists. Misstatements can arise from fraud or error and are considered material if, individually or in the aggregate, they could reasonably be expected to influence the economic decisions of users taken on the basis of the consolidated financial statements. As part of an audit conducted in accordance with International Standards on Auditing (ISA Italia), we exercised professional judgement and maintained professional scepticism throughout the audit. Furthermore: • We identified and assessed the risks of material misstatement of the consolidated financial
statements, whether due to fraud or error; we designed and performed audit procedures responsive to those risks; we obtained audit evidence that is sufficient and appropriate to provide a basis for our opinion. The risk of not detecting a material misstatement resulting from fraud is higher than for one resulting from error, as fraud may involve collusion, forgery, intentional omissions, misrepresentations, or the override of internal control;
• We obtained an understanding of internal control relevant to the audit in order to design audit procedures that are appropriate in the circumstances, but not for the purpose of expressing an opinion on the effectiveness of the Group’s internal control;
• We evaluated the appropriateness of accounting policies used and the reasonableness of accounting estimates and related disclosures made by management;
• We concluded on the appropriateness of management’s use of the going concern basis of accounting and, based on the audit evidence obtained, whether a material uncertainty exists related to events or conditions that may cast significant doubt on the Group’s ability to continue as a going concern. If we conclude that a material uncertainty exists, we are required to draw attention in our auditor’s report to the related disclosures in the consolidated financial statements or, if such disclosures are inadequate, to modify our opinion. Our conclusions are based on the audit evidence obtained up to the date of our auditor’s report. However, future events or conditions may cause the Group to cease to continue as a going concern;
• We evaluated the overall presentation, structure and content of the consolidated financial statements, including the disclosures, and whether the consolidated financial statements represent the underlying transactions and events in a manner that achieves fair presentation.

5 of 6
• We obtained sufficient appropriate audit evidence regarding the financial information of the entities or business activities within the Group to express an opinion on the consolidated financial statements. We are responsible for the direction, supervision and performance of the group audit. We remain solely responsible for our audit opinion on the consolidated financial statements.
We communicated with those charged with governance, identified at an appropriate level as required by ISA Italia regarding, among other matters, the planned scope and timing of the audit and significant audit findings, including any significant deficiencies in internal control that we identified during our audit. We also provided those charged with governance with a statement that we complied with the regulations and standards on ethics and independence applicable under Italian law and communicated with them all relationships and other matters that may reasonably be thought to bear on our independence, and where applicable, related safeguards. From the matters communicated with those charged with governance, we determined those matters that were of most significance in the audit of the consolidated financial statements of the current period and are therefore the key audit matters. We described these matters in our auditor’s report. Additional Disclosures required by Article 10 of Regulation (EU) No 537/2014 On 19 April 2012, the shareholders of TOD’S SpA in general meeting engaged us to perform the statutory audit of the Company’s and the consolidated financial statements for the years ending 31 December 2012 to 31 December 2020. We declare that we did not provide any prohibited non-audit services referred to in article 5, paragraph 1, of Regulation (EU) No. 537/2014 and that we remained independent of the Company in conducting the statutory audit. We confirm that the opinion on the consolidated financial statements expressed in this report is consistent with the additional report to those charged with governance, in their capacity as audit committee, prepared pursuant to article 11 of the aforementioned Regulation. Report on Compliance with other Laws and Regulations Opinion in accordance with Article 14, paragraph 2, letter e), of Legislative Decree No. 39/10 and Article 123-bis, paragraph 4, of Legislative Decree No. 58/98 Management of TOD’S SpA is responsible for preparing a report on operations and a report on the corporate governance and ownership structure of the TOD’S Group as of 31 December 2017, including their consistency with the relevant consolidated financial statements and their compliance with the law.

6 of 6
We have performed the procedures required under auditing standard (SA Italia) No. 720B in order to express an opinion on the consistency of the report on operations and of the specific information included in the report on corporate governance and ownership structure referred to in article 123-bis, paragraph 4, of Legislative Decree No. 58/98, with the consolidated financial statements of the TOD’S Group as of 31 December 2017 and on their compliance with the law, as well as to issue a statement on material misstatements, if any. In our opinion, the report on operations and the specific information included in the report on corporate governance and ownership structure mentioned above are consistent with the consolidated financial statements of TOD’S SpA as of 31 December 2017 and are prepared in compliance with the law. With reference to the statement referred to in article 14, paragraph 2, letter e), of Legislative Decree No. 39/10, issued on the basis of our knowledge and understanding of the Company and its environment obtained in the course of the audit, we have nothing to report. Statement in accordance with article 4 of Consob’s Regulation implementing Legislative Decree No. 254 of 30 December 2016 Management of TOD’S SpA is responsible for the preparation of the non-financial statement pursuant to Legislative Decree No. 254 of 30 December 2016. We have verified that management approved the non-financial statement. Pursuant to article 3, paragraph 10, of Legislative Decree No. 254 of 30 December 2016, the non-financial statement is the subject of a separate statement of compliance issued by ourselves. Bologna, 29 March 2018 PricewaterhouseCoopers SpA signed by Edoardo Orlandoni (Partner) This report has been translated into English from the original, which was issued in Italian language, solely for the convenience of international readers.

TOD'S S.p.A. Annual Report as of December 31st, 2017
s.p.a.
Financial Statements
s.p.a.

T O D ’ S S . p . A .
2 0 1 7 A n n u a l R e p o r t
1 9 7 Financial Statements
Income statement
euro 000's
Notes Year 17 Year 16
Revenues
Sales revenues (1) 22 662,576 637,231
Other income (2) 22 7,807 32,657
Total revenues and income 670,383 669,888
Operating costs
Change in inventories of work in progress and finished goods (3) 3,665 (29,875)
Cost of raw materials, supplies and material for consumption (3) (232,158) (219,440)
Costs for services (178,984) (170,429)
Costs of use of third party assets 17.3 (24,859) (23,889)
Personnel costs 23 (86,823) (83,011)
Other operating charges (18,831) (22,965)
Total operating costs (537,990) (549,609)
EBITDA 132,393 120,279
Amortisation, depreciation and write-downs
Amortisation of intangible assets 5 (6,501) (7,119)
Depreciation of tangible assets 6-7 (11,145) (11,601)
Other adjustment
Total amortisation, depreciation and write-downs (17,645) (18,720)
Provisions 13-17 (2,002) (1,604)
EBIT 112,746 99,955
Financial income and expenses
Financial income 24 10,556 13,372
Financial expenses 24 (18,719) (22,008)
Total financial income (expenses) (8,164) (8,636)
Income (losses) from equity investments 25 7,283 (1,843)
Profit before taxes 111,866 89,477
Income taxes (4) 10-26 (26,889) (25,296)
Profit for the period 84,977 64,180
EPS (euro) 2.57 1.95
EPS diluted (euro) 2.57 1.95
Note:
(1) Sales revenues include transactions with the Group’s entities for 277.8 and 280.9 mill ion
euros, respectively, in the fiscal year 2017 and 2016. In the FY 2016 the item includes, moreover,
non-recurring operations, as reduction of revenues, for 26.3 mill ion euros .
( 2 ) O f w h i c h n o n - r e c u r r i n g f o r 2 5 m i l l i o n e u r o s i n t h e F Y 2 0 1 6 .
( 3 ) O f w h i c h n o n - r e c u r r i n g f o r a t o t a l o f - 9 . 3 m i l l i o n e u r o s i n t h e F Y 2 0 1 6 .
( 4 ) O f w h i c h n o n - r e c u r r i n g f o r 2 . 1 m i l l i o n e u r o s i n t h e F Y 2 0 1 6 .

T O D ’ S S . p . A .
2 0 1 7 A n n u a l R e p o r t
1 9 8 Financial Statements
Statement of Comprehensive Income
euro 000's
Notes Year 17 Year 16
Profit/(loss) for the period (A) 84,977 64,180Other Comprehensive Income that will be reclassified
subsequently to profit and loss:
Gain/(Losses) on derivative financial instruments (cash flow
hedge) 16.3 1,400 2,770
Total other Comprehensive Income that will be reclassified
subsequently to profit and loss (B) 1,400 2,770
Other Comprehensive Income that will not be reclassified
subsequently to profit and loss:
Cumultated actuarial gains/(losses) on defined benefit plans 18 (17) (238)Total other Comprehensive Income that will not be reclassified
subsequently to profit and loss (C) (17) (238)
Total Comprehensive Income (A)+(B)+(C) 86,360 66,712

T O D ’ S S . p . A .
2 0 1 7 A n n u a l R e p o r t
1 9 9 Financial Statements
Statement of Financial Position
euro 000's
Notes 12.31.17 12.31.16
Non current assets
Intangible fixed assets
Assets with indefinite useful l ife 5 150,919 150,919
Others 5 20,949 23,392
Total intangible fixed assets 171,868 174,311
Tangible fixed assets
Buildings and land 6 57,602 56,866
Plant and machinery 6 12,050 11,639
Equipment 6 8,559 9,626
Leasehold improvement 6 3,662 3,882
Others 6 4,902 5,104
Total property, plant and equipment 86,776 87,117
Other assets
Investments properties 8 22 25
Investments in subsidiaries 9 583,059 583,145
Deferred tax assets 10
Others 11 2,588 2,654
Total other assets 585,669 585,824
Total non-current assets 844,312 847,253
Current assets
Inventories 12 164,421 150,882
Trade receivables (1) 13 182,687 188,569
Tax receivables 13 16,267 10,986
Derivative financial instruments 14 2,688 2,034
Others 13 35,213 68,269
Cash and cash equivalents 15 100,802 87,989
Total current assets 502,078 508,729Assets held for sale
Total assets 1,346,390 1,355,981
to be continued
Note:
(1) Trade receivables include receivables from Group’s entities for 99.9 and 99.3 mill ion euros,
respectively, at December 31s t
, 2017 and December 31s t
, 2016.

T O D ’ S S . p . A .
2 0 1 7 A n n u a l R e p o r t
2 0 0 Financial Statements
continuing
euro 000's
Notes 12.31.17 12.31.16
Shareholders' equity
Share Capital 16 66,187 66,187
Capital reserves 16 416,507 416,507
Treasury stock 16
Hedging reserve 16 (186) (1,586)
Other reserves 16 340,728 333,681
Profit/(Loss) for the period 16 84,977 64,180
Shareholders' equity 908,213 878,970
Non-current liabilities
Provisions for risks 17 5,210 4,328
Deferred tax l iabilities 10 13,241 8,443
Employee benefits 18 7,370 8,845
Derivative financial instruments 14 1,197 2,687
Bank borrowings 19 137,572 183,612
Other 20 14,340 13,269
Total non-current liabilities 178,928 221,183
Current liabilities
Trade payables (2) 21 157,268 131,478
Tax payables 21 3,767 3,201
Derivative financial instruments 14 2,020 7,239
Other 21 46,533 66,944
Bank 19 46,176 46,289
Provisions for risks 17 3,485 678
Total current liabilities 259,250 255,828
Total Shareholders’ equity and liabilities 1,346,390 1,355,981
Note:
(2) Trade payables include payables to Group’s entities for 19.2 and 20.5 mill ion eur os,
respectively, at December 31s t
, 2017 and December 31s t
, 2016.

T O D ’ S S . p . A .
2 0 1 7 A n n u a l R e p o r t
2 0 1 Financial Statements
Statement of Cash Flows
euro 000's
Note 12.31.17 12.31.16
Profit/(Loss) for the period 84,977 64,180
Amortizat., deprec., revaluat., and write-downs 5-6-7-8-10-12-13 27,543 38,671
Other non monetary expenses/(income) 14-16-17 (1,755) 710
Income taxes for the period 26 26,889 25,296
Changes in operating assets and liabilities:
Trade receivables 13 5,378 24,317
Inventories 12 (22,469) 17,577
Tax receivables and tax payables 13-21 (3,441) 5,719
Trade payables 21 25,791 (3,453)
Other assets and liabilities 13-21 (23,046) 18,695
Change in reserve for employee 18 (1,492) 930
Cash flows from operating activities 118,375 192,643
Interests (paid)/collected (518) (284)
Income taxes (paid)/refunded (23,366) (48,513)
Net cash flows from operating activities (A) 94,490 143,846
Net investments in intangible and tangible assets 5-6 (14,857) (12,904)
(Increase) decrease of equity investments 9 (378) (405,498)
Reduction (increase) of other non-current assets 11 66 (14)
Cash flows generated (used) in investing activities (B) (15,169) (418,416)
Dividends paid 16 (56,259) (66,187)
Capital increase 16 207,500
Others change in Equity
Loans to subsidiaries 28 36,000 (45,000)
Repayments of financial l iabilities 19 (46,250) (119,449)
Proceeds from financial l iabilities 19 300,000
Cash flows generated (used) in financing (C) (66,509) 276,864
Translation differences (D)
Cash flows from continuing operations (E)=(A)+(B)+(C)+(D) 12,813 2,294
Cash flow from assets held for sale (F)
Cash flows generated (used) (G)=(E)+(F) 12,813 2,294
Net cash and cash equivalents at the beginning of the period 87,989 85,696
Net cash and cash equivalents at the end of the period 100,802 87,989
Change in net cash and cash equivalents 12,813 2,294
Adjustments to reconcile net profit (loss) to net cash provided by
(used in) operating activities:

T O D ’ S S . p . A .
2 0 1 7 A n n u a l R e p o r t
2 0 2 Financial Statements
Statement of Changes in Equity
Year 2017
euro 000's
Share capitalCapital
reserves
Hedging
reserve
Retained
earningsTotal
Balances as of 01.01.17 66,187 416,507 (1,586) 397,862 878,970
Profit & Loss account 84,977 84,977
Directly in equity 1,400 (17) 1,383
Total Comprehensive Income 1,400 84,960 86,360
Dividends (56,259) (56,259)
Capital increase
Share based payments
Other (1) (858) (858)
Balances as of 12.31.17 66,187 416,507 (186) 425,705 908,213
Year 2016
euro 000's
Share capitalCapital
reserves
Hedging
reserve
Retained
earningsTotal
Balances as of 01.01.16 61,219 213,975 (4,356) 401,028 671,866Profit/(Loss) recognized in the period
Profit & Loss account 64,180 64,180
Directly in equity 2,770 (238) 2,531
Total Comprehensive Income 2,770 63,942 66,712
Dividends (66,187) (66,187)
Capital increase 4,968 202,532 207,500
Share based payments
Other (921) (921)
Balances as of 12.31.16 66,187 416,507 (1,586) 397,862 878,970 Note: (1) They include the use of the specific reserve for promoting territorial solidarity projects.

Notes to the Separate Financial Statements
s.p.a.

T O D ’ S S . p . A .
2 0 1 7 A n n u a l R e p o r t
2 0 4 Notes to the Separate Financial Statements
1. General notes
The parent company TOD’S S.p.A., registered office in Sant’Elpidio a Mare (Fermo) at Via Fil ippo
Della Valle 1, is l isted on Mercato Telematico Azionario ( MTA) of Borsa Italiana S.p.A..
At December 31s t
, 2017 TOD’S S.p.A. share capital is owned by DI.VI. FINANZIARIA of DIEGO DELLA
VALLE & C. S.r. l. for 50.291%.
The Separate financial statements has been prepared by the Board of Directors of TOD’S S.p.A. on
March 13t h
, 2018 for the approval of the shareholders meeting on April 19t h
, 2018 and it is
subject to PricewaterhouseCoopers S.p.A. audit.
2. B a s i s o f p r e p a r a t i on
The Separate Financial Statements were prepared in accordance with IAS/IFRS (Internatio nal
Accounting Standards – IAS -, and International Financial Reporting Standards – IFRS) issued by
IASB, based on the text published on the Gazzetta Ufficiale of European Union (G.U.C.E.).
IAS/IFRS refers also to all revised International Accounting Stand ards (IAS) and all interpretative
documents issued by the IFRIC (International Financial Reporting Interpretations Committee),
previously nominated Standing Interpretations Committee (SIC).
The Notes have been supplemented by the additional information req uired by CONSOB and its
implementing measures of Article 9 of Legislative Decree 38/2005 (Resolutions 15519 and 15520
of July 27t h
, 2006 and memorandum DEM/6064293 of July 28t h
, 2006, pursuant to Article 114(5)
of the Consolidated Law on Finance -TUF), Article 78 of the Issuer Regulation, the EC document of
November 2003 and, when applicable, the Italian Civil Code. Consistently with the financial
statements for the previous year, certain information is provided in the Report by the Board of
Directors on Operations.
The separate financial statements has been prepared on the going concern basis, and it includes
the statement of f inancial position, the income statement, statement of comprehensive income,
the statement of cash flows and the statement of changes in equity of TOD’S S.p.A. The separate
f inancial statements is prepared in euro currency.
For presentation of its operating income, the Company adopted the presentation of the profit
and loss by nature. The format of representing revenues and costs by natu re is followed,
indicating the EBITDA and EBIT results as in the past, since they are considered representative
indicators of company performance. In addition, it has been prepared the statement of
comprehensive income which include transactions that are o utside the income statement but
they produce their effects directly to equity. Transactions represented in the statement of
comprehensive income are net of tax effects.

T O D ’ S S . p . A .
2 0 1 7 A n n u a l R e p o r t
2 0 5 Notes to the Separate Financial Statements
The statement of f inancial position shows current items, for which it is supposed that they will be
realized or closed during the normal operating cycle, separately from non -current items (both
assets and liabilities).
The financial statements schemes, joined with both report on operations and supplementary
notes, are considered to be those that provide the best organized representation of the
Company’s f inancial position and income. In case, for the application of a new accounting
standards, there is a change in the nature of the operations or re -examination of the financial
statements and it is necessary or more appropriate to modify some figures to provide a clearer
information to the stakeholders, the comparative figures will be reclassif ied in order to improve
the comparability of the information between the years. In such a case, if si gnificant, appropriate
information in the notes to the separate financial statements will be provided. In accordance
with art. 3 of Consob resolution n. 18079 of January 20t h
, 2012 the Company adopt the waiver
resulting in art. 70 c. 8 and 71 c. 1 -bis of Consob regulation n. 11971/99 (and subsequent
modifications) in connection with making available, to third parties, all the documents related to
mergers, corporate splits, capital increases, acquisitions and disposals in the corporate
headquarter.
3. Evaluation methods and accounting standards
The accounting standards applied to the preparation of the Separate Financial Statements are
consistent with those applied to the preparation of the Separate Financial Statements at
December 31s t
, 2016, except for the information reported below in relation to any amendments,
interpretations and new accounting standards applicable from January 1s t
, 2017.
Accounting standards, amendments and interpretations endorsed by the European Union, which
are applicable from January 1s t
, 2017 and which were first adopted in TOD’S S.p.A. separate
financial statements at December 31s t
, 2017
• Amendments to IAS 12: Income taxes. These amendments, which were published by the IASB on
January 19t h
, 2016, clarify how to account for deferred tax assets relating to debt instruments
measured at fair value. The application of this standard had no significant impact on the
Company.
• Amendments to IAS 7: Statement of Cash Flows. These amendments, which were issued by the
IASB on January 29t h
, 2016, require information to be provided in the financial statements about
changes in f inancial l iabilities, aimed at improving the disclosures provided to investors in order

T O D ’ S S . p . A .
2 0 1 7 A n n u a l R e p o r t
2 0 6 Notes to the Separate Financial Statements
to help them to better understand the changes recorded in said payables. Th e application of this
standard had no significant impact on the Company.
• “Annual improvements to IFRS Standards”, IFRS 12: “Disclosure of Interests in Other Entities”,
which were issued by the IASB on April 18t h
, 2014. This amendment provides for an inv estment
entity, which prepares the financial statements in which all of its subsidiaries are measured at
fair value through profit or loss, to provide the disclosure required for investment entities
according to IFRS 12. The application of this standard had no impact on the Company.
Accounting standards, amendments and interpretations endorsed by the European Union, which
will be applicable from January 1s t
, 2018 or later and not early adopted by TOD’S S.p.A.
• IFRS 15 – Revenue from Contracts with Customers. On May 28t h
, 2014 the IASB published a
document which requires an entity to recognise revenue at the time the control of goods or
services is transferred to the customer in an amount that reflects the consideration to which the
entity expects to be entitled in exchange for these goods or services. The new revenue
recognition model sets out a process in f ive steps
1) Identifying the contract with a customer;
2) Identifying the performance obligations;
3) Determining the transaction price;
4) Allocating the transaction price to the performance obligations;
5) Recognising revenue when the entity satisfy a performance obligation.
The new standard also requires additional disclosures regarding the nature, amount, timing and
uncertainty relating to revenues and cash flows arising from these contracts with customers. The
IASB expects to adopt it from 2018, while the European Union endorsed it on September 22n d
,
2016. Furthermore, on April 12t h
, 2016 the IASB published amendments to the standard:
Clarif ications to IFRS 15 Revenue from Contracts with Customers, which are also applicable as
from January 1s t
, 2018. These amendments are aimed at clarifying the procedures to identify an
entity as a “Principal” or as an “Agent” and to establish whether revenues from l icences must be
deferred throughout the term thereof.
The future adoption of this standard will not have any significant impact on the Company’s
f inancial statements.
•IFRS 9 – Financial Instruments. On July 24t h
, 2014 the IASB published the final docume nt
constituting the conclusion of the process, divided into three phases: Classif ication and
Measurement, Impairment and General Hedge Accounting, entirely revising IAS 39. The document

T O D ’ S S . p . A .
2 0 1 7 A n n u a l R e p o r t
2 0 7 Notes to the Separate Financial Statements
introduces new requirements for classifying and measuring financial as sets and liabilities.
Specifically, as regards financial assets, the new standard adopts a single approach based on how
the financial instruments are managed and on the contractual cash flow characteristics of the
financial assets themselves in order to de termine the related valuation method, aiming at
eventually replacing the various rules laid down under IAS 39. As regards financial l iabilities, the
main amendment concerns the method of accounting for fair value changes in a f inancial l iability
designated as at fair value through profit or loss, which are due to own credit of the financial
l iability itself. According to the new standard, these changes must be recognised in other
comprehensive income, without affecting profit or loss. The main developments relating to hedge
accounting are:
- Changes in the type of transactions that qualify for hedge accounting; specifically, a more
extensive range of risks has been introduced for non -financial assets/liabilities that qualify for
hedge accounting;
- A change in the method of accounting for forward contracts and options included in a hedge
accounting relationship, in order to reduce profit or loss volatil ity;
- Changes in the effectiveness test by replacing the current methods based on the 80 -125% range
with the principle of the “economic relationship” between the hedged item and the hedging
instrument; furthermore, entities are no longer required to perform an assessment of the
retrospective effectiveness of the hedging relationship;
- A greater f lexibility of the accounting methods is offset by improved disclosures on the risk
management activities carried out by entities.
The new document includes a single model for the impairment of f inancial assets based on
expected losses.
The IASB expects to adopt it from 2018, while the European Union endorsed it on November 22n d
,
2016. The future adoption of this standard will not have any significant impact on the Company’s
f inancial statements.
• IFRS 16: Leases: In January 2016 the IASB published a document for the initial recognition,
measurement, presentation and disclosure of lease agreements for both the parties to a contract,
aimed at replacing IAS 17 Leasing. The document is not applicable to service contracts but only to
lease agreements or to the leasing com ponents of other contracts. The standard defines the lease
as an agreement that transfers the right of use of an asset to the customer ( lessee) for a certain
period of time and in exchange for a consideration. The new standard eliminates the
classif ication based on finance and operating leases and introduces a single accounting method
that provides for the recognition of assets and liabilities for all the leases with a term of more
than 12 months and the separate recognition of amortisation, depreciation an d interest expense
T O D ’ S S . p . A .
2 0 1 7 A n n u a l R e p o r t
2 0 8 Notes to the Separate Financial Statements
through profit or loss. As regards the lessor, no significant changes were made to the accounting
method with respect to the provisions that are currently set out under IAS 17. IFRS 16 was
endorsed by the European Union on October 31s t
, 2017 and will become effective from January
1s t
, 2019. An internal analysis was started in relation to the major contracts in place, which was
aimed at gathering information required to outline their foreseeable effects in f inancial and
economic terms.
• Amendments to IFRS 4: Applying IFRS 9 Financial Instruments with IFRS 4 Insurance Contracts.
These amendments were issued by the IASB on September 12t h
, 2016, endorsed by the European
Union on November 3rd
, 2017 and became applicable with the effective da te being expected on
January 1s t
, 2018. The amendments were intended to address concerns about the application of
IFRS 9 on financial instruments before the introduction of the new insurance contract standards.
Furthermore, the amendments provide two opti ons for entities that enter into insurance
contracts within the scope of IFRS 4: i) an option that would permit entities to reclassify, from
profit or loss to comprehensive income, some of the income or expenses arising from designated
financial assets; and (ii) an optional temporary exemption from applying IFRS 9 for entities whose
predominant activity is issuing contracts within the scope of IFRS 4. The future adoption of this
standard will not have any significant impact on the Company’s f inancial statem ents.
• Amendments to IFRS 2: Clarif ications of Classif ication and Measurement of Share -based
Payment Transactions. These amendments, which were published by the IASB on June 20t h
, 2016,
provide some clarif ications relating to the method of accounting for the effects of vesting
conditions in the case of cash-settled share-based payments, the classif ication of share -based
payments on a net settlement basis and any change in the terms and conditions of a share -based
payment implying its reclassif ication from cash-settled to equity-settled items. The amendments
will become applicable from January 1s t
, 2018. The possible future adoption of this standard will
not have any significant impact on the Group’s f inancial statements.
Accounting standards, amendments a nd interpretations published by the IASB but not yet
endorsed by the European Union.
• Amendments to IAS 40: regarding transfers of investment property. These amendments were
issued by the IASB on December 8t h
, 2016, with the effective date being expected on January 1s t
,
2018.

T O D ’ S S . p . A .
2 0 1 7 A n n u a l R e p o r t
2 0 9 Notes to the Separate Financial Statements
The amendment provides as follows: i) paragraph 57 of IAS 40 has been amended to state that an
entity shall transfer a property to, or from, investment property when, and only when, there is
evidence of a change in use; i i) the list of evidence in paragraph 57(a) – (d) is designated as non-
exhaustive list of examples. Based on a preliminary analysis, the possible future adoption of this
standard should not have any significant impact on the Company’s f inancial statements.
• Amendment to IFRIC 22: Foreign Currency Transactions and Advance Consideration. This
interpretation, which was issued by the IASB on December 8t h
, 2016, covers foreign currency
transactions when an entity recognises a non -monetary asset or non-monetary liability arising
from the payment or receipt of advance consideration before the entity recognises the related
asset, expense or income. The interpretation need not be applied to income taxes, insurance
contracts or reinsurance contracts. The IASB expects to adopt it from January 1s t
, 2018. Based on
a preliminary analysis, the possible future adoption of this interpretation should not have any
significant impact on the Company’s f inancial statements.
• Annual improvements to IFRS Standards: 2014 -2016 Cycle. This document was issued by the
IASB on December 8t h
, 2016, the effective date being expected on January 1s t
, 2018. This session
concerned the following topics: i) IFRS 1: short -term exemptions provided for in paragraphs E3 -E7
are eliminated, since the reasons f or their provision have ceased to exist; i i) IAS 28: it is clarif ied
that it is possible to make the decision to measure, at fair value through profit or loss, any
investment in a subsidiary or a joint venture held by a venture capital company, in relation to
each investment in subsidiaries or joint ventures since their initial recognition. Based on a
preliminary analysis, the possible future adoption of this standard should not have any significant
impact on the Company’s f inancial statements.
• IFRIC 23 “Uncertainty over Income Tax Treatments”. On June 7t h
, 2017 the IASB issued IFRIC 23
“Uncertainty over Income Tax Treatments”, providing instructions to account for (current and/or
deferred) tax assets and liabilities relating to income tax as a result of uncertainties in the
application of tax regulations. The provisions of IFRIC 23 will be effective for periods beginning
on or after January 1s t
, 2019. Based on a preliminary analysis, the possible future adoption of this
standard should not have any signif icant impact on the Company’s f inancial statements.
• Amendments to IFRS 9 “Prepayment features with negative compensation”. On October 12t h
,
2017 the IASB issued Amendments to IFRS 9 to deal with some issues concerning the applicability
and classif ication of IFRS 9 “Financial Instruments” as to certain financial assets, whose early
repayment is permitted. Furthermore, the IASB clarif ies some issues concerning the accounting
for f inancial l iabilities following changes in the same. The provisions of Amendme nts to IFRS 9
will be effective for periods beginning on or after January 1s t
, 2019. Based on a preliminary

T O D ’ S S . p . A .
2 0 1 7 A n n u a l R e p o r t
2 1 0 Notes to the Separate Financial Statements
analysis, the possible future adoption of this standard should not have any significant impact on
the Company’s f inancial statements.
• Amendments to IAS 28 “Long -term Interests in Associates and Joint Ventures”. On October 12t h
,
2017 the IASB issued Amendments to IAS 28 to clarify the application of IFRS 9 'Financial
Instruments' for long-term interests in subsidiaries or joint ventures included in investments in
these entities for which the equity method is not applied. The provisions of Amendments to IAS
28 will be effective for periods beginning on or after January 1s t
, 2019. Based on a preliminary
analysis, the possible future adoption of this st andard should not have any significant impact on
the Company’s f inancial statements.
• “Annual improvements to IFRSs: 2015 -2017 Cycle”. The IASB has published the Annual
Improvements to IFRSs, 2015-2017 Cycle, which include amendments to IAS 12 Income Tax es, IAS
23 Borrowing Costs, IFRS 3 Business Combinations and IFRS 11 Joint Arrangements. The
amendments will become effective from January 1s t
, 2019. Early application is permitted. Based
on a preliminary analysis, the possible future adoption of this stan dard should not have any
significant impact on the Company’s f inancial statements.
• IFRS 17 “Insurance Contracts”. On May 18t h
, 2017 the IASB issued IFRS 17 “Insurance
contracts”, which sets out the principles for the recognition, measurement, presentati on and
disclosure of insurance contracts included in the standard. The objective of IFRS 17 is to ensure
that an entity provides relevant information that faithfully represents those contracts, in order
to give a basis for users of financial statements to assess the effect that insurance contracts have
on the entity’s f inancial position, f inancial performance and cash flows. The provisions of IFRS 17
will become effective from periods beginning on or after January 1s t
, 2021. Based on a
preliminary analysis, the possible future adoption of this standard should not have any significant
impact on the Company’s f inancial statements.
• Amendments to IAS19, “Employee benefits’ - Plan amendment, Curtailment or settlement”. On
February 7t h
, 2018 the IASB issued these amendments to clarify how to calculate pension costs
when there is a change in defined-benefit plans. The provisions of Amendments to IAS 19 will
become effective from periods beginning on or after January 1s t
, 2019. Based on a preliminary
analysis, the possible future adoption of this standard should not have any significant impact on
the Company’s f inancial statements.
3.1 Use of estimates. Preparation of the financial statements and notes in conformity with
IFRS requires that management make judgments , estimates and assumptions which impact on the
values reported for assets and liabilities, as well as disclosures relating to contingent assets and
liabilities at the balance sheet date. Estimates and assumptions are based on historical data and

T O D ’ S S . p . A .
2 0 1 7 A n n u a l R e p o r t
2 1 1 Notes to the Separate Financial Statements
other elements deemed significant, as at the end of the accounting period of reference.
3.2 Transactions in foreign currency. The functional currency (the currency used in the
principal economic area where the company operates) used to present the financial statemen ts is
the euro. Foreign currency transactions are translated into the functional currency by applying
the exchange rate in effect at the date of the transaction. Monetary assets and liabilities
denominated in foreign currencies at the date of the financial statements are translated by using
the exchange rate in effect at the closing date. Non -monetary assets and liabilities are valued at
their historic cost in foreign currency and translated by using the exchange rate in effect at the
transaction date.
The foreign exchange differences arising upon settlement of these transactions or translation of
cash assets and liabilities are recognized on the profit and loss account.
3.3 Derivative financial instruments. The fundamental characteristics of the derivative
financial instruments are set out in the paragraph on Financial Assets and in the paragraph on
Loans. The company uses derivate financial instruments (mainly currency futures contracts) to
hedge the risks stemming from foreign exchange exposure and to hed ge interest rate risks
deriving from its operating activity, without any speculative or trading purposes, and consistently
with the strategic policies of centralized cash management dictated by the Board of Directors.
When derivative transactions refer to a risk connected with the variability of forecast transaction
cash flow, they are recognized according to the rules for cash flow hedge until the transaction is
recorded on the books. Subsequently, the derivatives are treated in accordance with fair value
hedge rules, insofar as they can be qualif ied as instruments for hedging changes in the value of
assets or l iabilities carried on the balance sheet.
The hedge accounting method is used at every financial statement closing date. This method
envisages posting derivatives on the balance sheet at their fair value. Posting of the changes in
fair value varies according to the type of hedging at the valuation date:
for derivatives that hedge forecast transactions ( i.e. cash flow hedge), the changes are
recognized in shareholders’ equity, while the portion for the ineffective amount is
recognized on the profit and loss account, under financial income and expenses;
differences in fair value already recognized on specific reserves are booked in profit and
loss, adjusting operating margins, once hedged items (trade receivables/payables) have
been already recognized. For hedging derivatives related to interest rate risks on loans,
the change in fair value, already recognized in the cash flow hedge reserve, are book ed

T O D ’ S S . p . A .
2 0 1 7 A n n u a l R e p o r t
2 1 2 Notes to the Separate Financial Statements
in profit and loss, adjusting financial income/charges once hedged items (financial
receivables/liabilities) have been already recognized;
for derivatives that hedge receivables and payables recognized on the balance sheet ( i.e.
fair value hedge), the fair value differences are recognized entirely on the profit and loss
account, under financial income and expenses. Furthermore, the value of the hedged
item (receivables/payables) is adjusted for the change in value attributable to the
hedged risk, using the item financial income and expenses as a contra -entry.
3.4 Intangible fixed assets.
i. Goodwill. All business combinations are recognized by applying the acquisition method.
Goodwill is measured at the acquisition date as the excess of the assets and lia bili ties recognised
in accordance with IFRS 3 and the fair value of consideration transferred including the amount of
any non-controlling interests recognised.
If the company’s interest in the fair value of assets, l iabilities, and identifiable potential
l iabilities exceeds the cost of the acquisition (negative goodwill) after redetermination of these
values, the excess is immediately recognized on the profit and loss account.
For acquisitions prior to January 1s t
, 2005, the date of transition to IAS/IFR S, goodwill retained
the values recognized on the basis of the previous Italian GAAP, net of accumulated amortization
up to the transition date.
Goodwill is recognized on the financial statements at its cost adjusted for impairment losses. It
is not subject to amortization, but the adequacy of the values is annually subjected to the
impairment test, in accordance with the rules set forth in the section Impairment losses .
i i. Trademarks. These are recognized according to the value of their cost and/or acqu isition, net
of accumulated amortization at the date of transition to IAS/IFRS. Trademarks TOD’S, HOGAN and
FAY are classif ied as intangible fixed assets with an indefinite useful l ife and thus are not
amortized, insofar as:
they play a primary role in company strategy and are an essential driver thereof;
the corporate structure, construed as organized property, plant, and equipment, and
organization itself in a f igurative sense, is closely correlated with and dependent on
dissemination and development of t he trademarks on the markets;
the trademarks are proprietary, properly registered, and constantly protected pursuant to
law, with options for renewal of legal protection, upon expiration of the registration periods,
that are not burdensome, easily implemen ted, and without external impediments;

T O D ’ S S . p . A .
2 0 1 7 A n n u a l R e p o r t
2 1 3 Notes to the Separate Financial Statements
the products sold by the company with these trademarks are not subject to particular
technological obsolescence, which is characteristic of the luxury market in which the company
operates; on the contrary, they are co nsistently perceived by the market as being innovative and
trendy, to the point of being models for imitation or inspiration;
in the national and/or international context characteristic of each trademark, they are
distinguished by market positioning and no toriety that ensures their dominance of the respective
market segments, being constantly associated and compared with benchmark brands;
in the relative competitive context, it can be affirmed that the investments made for
maintenance of the trademarks are proportionately modest with respect to the large forecast
cash flows.
The adequacy of the values is annually subjected to the impairment test, in accordance with the
rules set forth in the section Impairment losses .
i i i. Research and development costs. The research costs for a project are charged fully to the
profit and loss account of the period in which they are incurred.
The development costs of an activity are instead capitalized if the technical and commercial
feasibility of the relative activity and eco nomic return on the investment are certain and definite,
and the company has the intention and resources necessary to complete the development.
The capitalized costs include the costs for materials, labor, and an adequate portion of indirect
costs. They are recognized at cost, net of accumulated amortization and depreciation (see below)
and impairment losses.
iv. Other intangible fixed assets. These are identifiable non-monetary intangible assets under
the control of the company and capable of causing the comp any to realize future economic
benefits.
They are initially recognized at their purchase cost, including expenses that are directly
attributable to them during preparation of the asset for its intended purpose or production, if
the conditions for capitaliz ation of expenses incurred for internally generated expenses are
satisfied.
The cost method is used for determining the value reported on subsequent statements, which
entails posting the asset at its cost net of accumulated amortization and write -downs for
impairment losses.
v. Subsequent capitalization. The costs incurred for these intangible fixed assets after
purchase are capitalized only to the extent that they increase the future economic benefits of the

T O D ’ S S . p . A .
2 0 1 7 A n n u a l R e p o r t
2 1 4 Notes to the Separate Financial Statements
specific asset they refer to. All the other cos ts are charged to the profit and loss account in the
fiscal year in which they are incurred.
vi. Amortization. Intangible fixed assets (excluding those with an indefinite useful l ife) are
amortized on a straight-line basis over the period of their estimated u seful l ife, starting from the
time the assets are available for use.
3.5 Tangible fixed assets and Investments properties.
i. Property, plant, and equipment owned by the company. They are first recognized at their
purchase cost or at the cost recalculated at the date of transition to IFRS, including any directly
attributable ancillary expenses.
Following first-time recognition, these assets are reported net of their accumulated depreciation
and impairment losses ( i.e. in accordance with the Cost Model).
For those assets whose depreciation must be calculated using the component approach, the
portions of cost allocable to the individual significant components characterized by a different
useful l ife are determined. In this case, the value of land and buildings i s kept separate, with
only buildings being depreciated.
i i. Leasing. Lease agreements in which the Company assumes all the risks and benefits deriving
from ownership of the asset are classif ied as f inance leasing. The assets (real estate, plant, and
machinery) possessed pursuant to these agreements are recorded under property, plant, and
equipment at the lesser of their fair value on the date the agreement was made, and the current
value of the minimum payments owed for leasing, net of accumulated depreciatio n and any
impairment losses (according to the rules described in the section Impairment losses). A financial
payable for the same amount is recognized instead under liabilities, while the component of
interest expenses for f inance leasing payments is repo rted on the profit and loss account
according to the effective interest method.
i i i. Subsequent capitalizations. The costs incurred for property, plant, and equipment after
purchase are capitalized only to the extent that they increase the future economic bene fits of the
asset. All the other costs are charged to the profit and loss account in the fiscal year in which
they are incurred.
iv. Investments properties. Real estate investments are originally recognized at cost, and then
recognized at their cost as adjusted for accumulated depreciation and impairment losses.

T O D ’ S S . p . A .
2 0 1 7 A n n u a l R e p o r t
2 1 5 Notes to the Separate Financial Statements
Depreciation is calculated on a systematic, straight -line basis according to the estimated useful
l ife of the buildings.
v. Depreciation. Property, plant, and equipment were systematically depreciated at a steady
rate according to the depreciation schedules defined on the basis of their estimated useful l ife.
Land is not depreciated. The principal depreciation rates applied are as follows :
% depreciation
Industrial buildings 3%
Machinery and plant 12,5%
Equipments 25%
Forms and punches, clichés, molds and stamp 25%
Furniture and furnishings 12%
Office machines 20%
Car and transport vehicles 20%-25%
The photovoltaic plant is depreciated over a period of 20 y ears. The costs for leasehold
improvements, which mainly include the costs incurred for set up and modernization of the DOS
network and all the other real estate that is not owned but used by the company (and thus
instrumental to its activity) are deprecia ted according to the term of the lease agreement or the
useful l ife of the asset, if this is shorter.
3.6 Impairment losses. In the presence of indicators, events, or changes in circumstances that
presume the existence of impairment losses, IAS 36 envisa ges subjecting intangible fixed assets
and property, plant and equipment to the impairment test in order to assure that assets with a
value higher than the recoverable value are not recognized on the financial statements. This test
is performed at least once annually for non-current assets with an indefinite l ife in the same way
as that used for non-current assets that have not yet been placed in service.
Confirmation of the recoverability of the values recognized on the balance sheet is obtained by
comparing the book value at the reference date and the fair value less costs to sale ( if available)
or value in use. The value in use of a tangible or intangible fixed asset is determined according
to the estimated future financial f lows expected from the asset, as actualized through use of a
discount rate net of taxes, which reflects the current market value of the current value of the
cash and risks related to Group’s activity.
If it is not possible to estimate an independent financial f low for an individual as set, the cash
generating unit to which the asset belongs and with which it is possible to associate future cash
flows that can be objectively determined and independent from those generated by other
operating units is identified. Identification of the cash generating units was carried out
consistently with the organizational and operating architecture of the Group.

T O D ’ S S . p . A .
2 0 1 7 A n n u a l R e p o r t
2 1 6 Notes to the Separate Financial Statements
If the impairment test reveals an impairment loss for an asset, its book value is reduced to the
recoverable value by posting a charge on the pr ofit and loss account.
When the reasons for a write-down cease to exist, the book value of the asset (or the cash
generating unit), with the exception of goodwill, is increased to the new value resulting from the
estimate of its recoverable value, but n ot beyond the net book value that the asset would have
had if the impairment loss had not been charged. The restored value is recognized immediately
on the profit and loss account .
3.7 Investments in subsidiaries and associated companies. The investments in subsidiaries,
joint ventures, and associated companies that are not classif ied as held for sale in compliance
with IFRS 5 are recognised at their historic cost. The value recognised on the financial statements
is subjected to the impairment test, in case o f trigger events, as envisaged by IAS 36, and
adjusted for any impairment losses; the write -off are reversed in case the conditions determining
the adjustment no longer exists or has decreased.
3.8 Financial assets. These are recognized and cancelled on the balance sheet according to the
trading date and are initially valued at fair value which generally correspond to the cost,
including costs directly related with the acquisition.
At the subsequent financial statement dates, the financial assets that the com pany intends and is
able to hold until maturity (securities held until maturity) are recognized at the amortized cost
according to the effective interest method, net of impairment losses.
Financial assets other than those held to maturity are classif ied as held for trading or available
for sale, and are recognized at their fair value at the end of each period. When the financial
assets are held for trading, the profits and losses deriving from changes in the fair value are
recognized on the profit and loss account for the period. In the case of f inancial assets available
for sale, the profits and losses deriving from changes in the fair value are recognized directly in
shareholders’ equity until they are sold or have sustained a loss in value. At that time, the
aggregate profits or losses that were previously recognized in shareholders’ equity are
recognized on the profit and loss account of the period.
3.9 Inventories. These are recognized at the lower of purchase cost and their assumed
disposal value. The net disposal value represents the best estimate of the net sales price that can
be realized through ordinary business processes, net of any production costs not yet incurred and
direct sales costs.

T O D ’ S S . p . A .
2 0 1 7 A n n u a l R e p o r t
2 1 7 Notes to the Separate Financial Statements
The cost of inventories is based on the weighted average co st method. The production cost is
determined by including all costs that are directly allocable to the products, regarding – for work
in progress and/or semi-finished products – the specific stage of the process that has been
reached. The values that are thus obtained do not differ appreciably from the current production
costs referring to the same classes of assets.
A special depreciation reserve is set aside for the portion of inventories that are no longer
considered economically useable, or with a pre sumed disposal value that is less than the cost
recognized on the financial statements.
3.10 Trade receivables and other receivables. These are initially recognised at fair value,
including transaction costs, and subsequently measured at amortized cost. The m easurement
considers the recoverable amount of the assets through the recognition of a specific allowance
for doubtful accounts determined as follows:
receivables under litigation, with certain and precise evidence documenting the impossibility
of collecting them, have been analytically identified and then written down;
for other bad debts, prudent allowances for write -downs have been set aside, estimated on
the basis of information updated at the date of this document.
3.11 Cash. This includes cash on hand, bank demand deposits, and financial investments with a
maturity of no more than three months. These assets are highly l iquid, easily convertible into
cash, and subject to a negligible risk of change in value.
3.12 Assets and liabilities held for sale. Non-current assets (or disposal groups) are c lassif ied
as available for sale when their carrying amount is recovered through a sale transaction rather
than through continuing use. They are not depreciated and are measured at the lower of carrying
amount and fair value, less costs to sell. Assets available for sale and related liabilities are
presented separately from other assets and liabilities in the statement of f inancial position.
TOD’S Group doesn’t held any assets and liabilities held for sale.
3.13 Reserve for employee. Employee benefits include (i) short -term employee benefits such as
wages, salaries and related social security contributions, accrued but not yet paid, paid annual
leave and paid sick leave, etc.; ( i i) post -employment benefits, such as pensi ons or retirement
benefits; ( i i i) other long-term benefits; and (iv) termination benefits.
Short-term benefits are recognised periodically on an accruals basis and are made up of l iabilities
to employees that have not been settled by the reporting date.

T O D ’ S S . p . A .
2 0 1 7 A n n u a l R e p o r t
2 1 8 Notes to the Separate Financial Statements
Post-employment benefits are divided into two categories:
i. Defined contribution plans. The payments for eventual defined contribution plans are
charged to the profit and loss account in the period that they are owed .
i i. Defined benefit plans. The costs of def ined benefit plans are calculated using the Projected
Unit Credit Method, carrying out the actuarial measurements at the end of each financial year.
Past service costs are recognised immediately to the extent that these benefits have already
accrued; otherwise they are amortised on a straight -line basis within the average period within
which the benefits are expected to accrue. The financial costs that have accrued on the basis of
the annual discounting rate are recognised in the income statement immediatel y. Actuarial gains
and losses are recognised through other changes in comprehensive income under the specific
equity item. Liabilities for post -employment benefits recognised in the financial statements
represent the present value of l iabilities for define d benefit plans. On the other hand, there are
no other long-term employee benefits or termination benefits in the financial statements .
i i i. Share based payments. The payments based on shares are assessed at their fair value on the
assignment date. This value is recognized on the profit and loss account on a straight -line basis
throughout the period of accrual of the rights. This allocation is made on the basis of a
management estimate of the stock options that will actually accrue in favor of vested employee s,
considering the conditions for use thereof not based on their market value.
The fair value is determined by using the binomial method. No share based payments result in
the current consolidated financial statements.
3.14 Payables.
i. Bank overdrafts and financing. Interest-bearing financing and bank overdrafts are initially
recognized at fair value net of transaction costs, and subsequently valued at the amortized cost,
using the effective interest method.
i i. Trade payables and other payables. These are measured at fair value which generally
correspond to their nominal value .
3.15 Provisions for risks. These are certain or probable liabilities that have not been determined
at the date they occurred and in the amount of the economic resources to be used fo r fulfi l l ing
the obligation, but which can nonetheless be reliably estimated. They are recognized on the
balance sheet in the event of an existing obligation, legal or constructive, resulting from a past
event, and it is l ikely that the company will be as ked to satisfy the obligation.

T O D ’ S S . p . A .
2 0 1 7 A n n u a l R e p o r t
2 1 9 Notes to the Separate Financial Statements
If the effect is significant, and the date of the presumed discharge of the obligation can be
estimated with sufficient reliability, the provisions are recognized on the balance sheet
discounting future cash flows.
The provisions that can be reasonably expected to be discharged twelve months after the
reference date are classif ied on the financial statements under non-current l iabilities. Instead,
the provisions for which the use of resources capable of generating economic b enefits is
expected to take place in less than twelve months after the reference date are recognized as
current l iabilities.
3.16 Share capital.
i. Share capital. The total value of shares issued by the parent company is recognized entirely
under shareholders’ equity, as they are the instruments representing its capital.
i i. Treasury stock. The consideration paid for buy -back of share capital (treasury stock),
including the expenses directly related to the transaction, is subtracted from shareholders’
equity. In particular, the par value of the shares reduces the share capital, while the excess
value is recognized as an adjustment to additional paid -in capital.
3.17 Dividends. The allocation of dividends to persons possessing instruments representing
share capital after the reference date of the financial statement is not recognized under financial
l iabilities on the same reference date.
3.18 Revenues recognition. Revenues are recognized on the profit and loss account when the
significant risks and benefits connected with o wnership of the transferred assets are transferred
to the buyer. In reference to the main transactions realized by the company, revenues are
recognized on the basis of the following principles :
a. Sales of goods – retail. The company operates in the retail c hannel through its DOS network.
Revenues are recognised when the goods are delivered to customers. Sales are usually collected
in the form of cash or through credit cards;
b. Sales of goods – wholesale. The company distributes products on the wholesale mark et.
These revenues are recognised when the goods are shipped and considering the estimated effects
of returns at the end of the year ;
c. Provision of services. These revenues are accounted for in proportion to the stage of
completion of the service rendered at the reference date and in accordance with contractual
provisions;
d. Royalties. These are recognised on the financial statements on accrual basis.

T O D ’ S S . p . A .
2 0 1 7 A n n u a l R e p o r t
2 2 0 Notes to the Separate Financial Statements
3.19 Financial income and expenses . These include all f inancial items recognized on the profit
and loss account for the period, including interest expenses accrued on financial payables
calculated by using the effective interest method (mainly current account overdrafts, medium -
long term financing), foreign exchange gains and losses, gains and losses on deriva tive financial
instruments (according to the previously defined accounting principles), received dividends, the
portion of interest expenses deriving from accounting treatment of assets held under finance
leasing (IAS 17) and employee reserves (IAS 19).
Interest income and expenses are recognized on the profit and loss account for the period in
which they are realized/incurred, with the exception of capitalized expenses (IAS 23).
Dividend income contributes to the result for the period in which the company accrues the right
to receive the payment.
3.20 Income taxes. The income taxes for the period include determination both of current taxes
and deferred taxes. They are recognized entirely on the profit and loss account and included in
the result for the period, unless they are generated by transactions recognized directly to
shareholders ’ equity during the current or another period. In this case, the relative deferred tax
liabilities are also recognized under shareholders ’ equity.
Current taxes on taxable income for the period represent the tax burden determined by using the
tax rates in effect at the reference date, and any adjustments to the tax payables calculated
during previous periods.
Deferred tax liabilities refer to the temporary differences betwe en the book values of assets and
liabilities on the balance and the associated values relevant for determination of taxable income.
For all temporary taxable differences, it is recognized the tax liability with the exception of
l iabilities deriving from in itial recognition of an asset or l iability in a transaction other than a
business combination that, at the time of the transaction, does not influence either the income
(loss) reported on the financial statements or taxable income (tax loss).
Deferred tax assets and liabilities are compensated if and only if there is an executive right to
compensate the related current taxes and if deferred tax assets and liabilities are related to
income taxes applied by the same tax authority.
Deferred tax assets deriving from temporary deductible differences are recognized on the
financial statements only to the extent that it is l ikely that taxable income will be realized for
which the temporary deductible difference can be used. No recognition is posted in case the
difference between the carrying amounts and the tax bases relate to goowill arising from
business combinations.

T O D ’ S S . p . A .
2 0 1 7 A n n u a l R e p o r t
2 2 1 Notes to the Separate Financial Statements
The taxes in question (deferred tax assets and liabil ities) are determined on the basis of a
forecast of the assumed percentage weight of the ta xes on the income of the fiscal years in which
the taxes will occur, taking into account the specific nature of taxability and deductibility. The
effect of change in tax rates is recognized on the profit and loss account of the fiscal year in
which this change takes place. The accrual for taxes that could arose from the transfer of non -
distributed profits from subsidiaries are posted only when there is the real intention to transfer
such profits.
3.21 Statement of cash flows. The statement of cash flows is drafted using the “indirect”
method. The net f inancial f lows of operating activity are determined by adjusting the result for
the period of the effects deriving from change to net operating working capital, non -monetary
items, and all the other effects connected with investment and financing activities.
Net cash and cash equivalents are made up cash and cash equivalents net of bank overdrafts.
4. Management of financial risks
The company has implemented a system for monitoring its f inancial risks in acc ordance with the
guidelines set out in the Corporate Governance Code of Listed Companies. As part of this policy,
the financial risks connected with its operations are constantly monitored in order to assess their
potential negative impact and undertake ap propriate action to mitigate them. These risks are
analysed as follows, highlighting the company’s level of exposure. It also includes a sensitivity
analysis designed to quantify the potential impact of hypothetical f luctuations in benchmark
parameters on final results.
i. Credit risk
Credit risk represents the exposure to potential losses stemming from failure to discharge
obligations towards trading counterparties. The company generates its revenues through three
main channels: Group companies (directly ope rated store network), franchisees and customers
(multi-brand). There is practically no credit risk on receivables from the Company, since almost
all the entities belonging to the TOD’S Group are wholly owned by the Group. The receivables
from independent customers (franchisee e wholesale), are subject to a hedging policy designed to
streamline credit management and reduce the associated risk. In particular, company policy does
not envisage granting credit to customers, while the creditworthiness of all cust omers, both long-
standing and potential ones, is periodically analysed in order to monitor and prevent possible
solvency crises.

T O D ’ S S . p . A .
2 0 1 7 A n n u a l R e p o r t
2 2 2 Notes to the Separate Financial Statements
The following table shows the ageing of trade receivables to third parties (and thus excluding
intercompany positions) outstanding at December 31s t
, 2017 gross of allowances for doubtful
accounts:
euro 000's Overdue
Current 0>60 60>120 Over Total
Third Parties 57,838 20,940 2,082 8,160 89,020
The prudent estimate of losses on the entire credit mass existing at December 31s t
, 2017 was 6.2
mill ion euros. The total amount of overdue receivables at December 31s t
, 2017 for 31.2 mill ion
euros is now about 10 mill ion euros.
i i. Liquidity risk
The liquidity risk represents the risk stemming from the unavailability of f inancial resources as
necessary to meet the short -term commitments assumed by the Company and its own financial
requirements. The main factors that determine the degree of l iquidity are the resources
generated or used by operating and investment activities and, on the other hand, the due dates
or renewal dates of its payables or the liquidity of its f inancial investments and market
conditions.
This risk is l imited by taking actions aimed at ensuring a balanced structure of the Company’s
capital and by maintaining such a level of cash and cash equivalents as is required to meet its
f inancial debt requirements at the releva nt maturity dates in an adequate manner. Particular
attention is paid to the definition of the credit counterparty that is considered to be suitable for
cash operations and that is identified according to increasingly selective liquidity, security and
yield criteria and in l ine with the Management’s instructions.
The table below shows the credit l ines already used and available at December 31s t
, 2017
compared with December 31s t
, 2016:
Credit lines
euro 000's Cash Credit linesSelf-liquidating
Credit lines
Financial
Credit linesTotal
12.31.17
Credit lines 41,000 161,000 300,000 502,000
Utilizations
Credit lines available as of 12.31.17 41,000 161,000 300,000 502,000
12.31.16
Credit lines 41,000 160,741 300,000 501,741
Utilizations
Credit lines available as of 12.31.16 41,000 160,741 300,000 501,741

T O D ’ S S . p . A .
2 0 1 7 A n n u a l R e p o r t
2 2 3 Notes to the Separate Financial Statements
Furthermore, it should be noted that, the Company, in order to borrow the liquid funds needed
to meet any possible requirement connected with ordinary sales and general corporate
operation, entered into three loan agreements, by which have been granted three medium/long -
term revolving credit facil ities respectively by: i) Crédit Agricole Corporate and Investment Bank
and Cassa di Risparmio di Parma e Piacenza S.p.A. (Crédit Agricole Group), signed on January 27th
2016, for a maximum amount of 100 mill ion euros, i i) Unicredit S.p.A., signed on November 9th
2016, for a maximum amount of 100 mill ion euros and i i i) B.N.L. S.p.A., signed on November 28th
2016, for a maximum amount of 100 mill ion euros. These credit facil ities will be available for a
period of 3 years. At December 31s t
, 2017 no amount has been used in connection wit h the above
mentioned credit facil ities.
The table below shows the maturity of the outstanding financial l iabilities at December 31s t
, 2017
and 2016:
euro 000's
Within
1 year
Between
1 and 5 years
Beyond
5 yearsTotal
12.31.17
Bank borrowings 137,572 137,572
Other non-current liabilities 10,287 10,287
Trade payables 157,268 157,268
Bank 46,176 46,176
Derivative financial instruments 2,020 1,197 3,217
Other current liabilities 1,063 1,063
Total 206,527 149,056 355,583
12.31.16
Bank borrowings 183,612 183,612
Other non-current liabilities 9,973 9,973
Trade payables 131,478 131,478
Bank 46,289 46,289
Derivative financial instruments 7,239 2,687 9,926
Other current liabilities 1,464 1,464
Total 186,470 196,272 382,742
Considering the Company profitability and its capacity to generate cash, it’s reasonable to
believe that l iquidity risk is not significant. Moreover, it should be noted that such capacity of
generating cash may allow Company to meet these commitments in a period of time that is
potentially shorter than that in which the loans and credit facil ities are expe cted to be available.
As regards financial operations, the corporate policy is to continue to invest all of its available
l iquid funds in sight bank deposits, without making use of f inancial instruments, including those
T O D ’ S S . p . A .
2 0 1 7 A n n u a l R e p o r t
2 2 4 Notes to the Separate Financial Statements
of the money market, and dividing i ts deposits among an adequate number of banks, which are
carefully selected by taking account of the remuneration of deposits, as well as on the basis of
their reliability.
i i i. Market risk
IFRS 7 includes in this category all risks that are directly or indir ectly connected with the
fluctuation in prices on physical and financial markets to which the company is exposed:
– exchange rate risk;
– interest rate risk;
– commodity risk, connected with the volatil ity of prices for the raw materials used in the
production process.
The company is exposed to exchange rate and interest rate risk, since there is no physical market
subject to actual f luctuations in the purchase prices for raw materials used in the production
process.
The following paragraphs analyse the individua l risks, using sensitivity analysis as necessary to
highlight the potential risk on final results stemming from hypothetical f luctuations in benchmark
parameters. As envisaged by IFRS 7, these analyses are based on simplif ied scenarios applied to
the final results for the periods referred to. By their very nature, they cannot be considered
indicators of the actual effects of future changes in benchmark parameters of a different asset
and liability structure and financial position different market conditions , nor can they reflect the
interrelations and complexity of the reference markets.
Exchange rate risk. Due to its commercial operations, the company is exposed to fluctuations in
the exchange rates for currencies in which some of its commercial transaction s are denominated
(particularly USD, GBP, CHF and those of certain countries in the Far East), against a cost
structure that is concentrated principally in the Eurozone. The company realises greater revenues
than costs in all these currencies; therefore, c hanges in the exchange rate between the euro and
the aforementioned currencies can impact the company’s results.
Moreover, due to the geographical composition of the Company’s subsidiaries, the Company is
exposed to exchange rate r isk related to intercomp any financial f lows (mainly dividends, loans,
transactions on share capital).
The company’s risk management policy aims to ensure that the average countervalue in euros of
receipts on transactions denominated in foreign currencies for each collection (Spri ng/Summer
and Fall/Winter) is equal to or greater than what would be obtained by applying the pre -set
target exchange rates. The company pursues these aims by entering into forward contracts for
each individual currency to hedge a specific percentage of th e expected revenue (and cost)
T O D ’ S S . p . A .
2 0 1 7 A n n u a l R e p o r t
2 2 5 Notes to the Separate Financial Statements
volumes in the individual currencies other than the functional currency. These positions are not
hedged for speculative or trading purposes, consistently with the strategic policies adopted for
prudent management of cash flows. Consequently, the company might forego opportunities to
realise certain gains, but it avoids running the risks of speculation.
The company defines its exchange risk a priori according to the reference period budget for the
reference period and then gradually hedges this risk upon acquisition of orders, in the amount
according to which they correspond to budget forecasts. The process of hedging exchange rate
risk is broken down into a series of activities that can be grouped into the following distinct
phases:
• definition of operating limits;
• identification and quantification of exposure;
• implementation of hedges;
• monitoring of positions and alert procedures.
The Company monitors foreign exchange r isk in intercompany financial transactions by
monitoring the risk underlying outstanding liabilities ( loans) and forecast l iabilities (dividends
and capital increases), in view of guaranteeing that no material operating and financial impact
for the entities involved results from these transactions in relatio n to fluctuations in exchange
rates. These goals are pursued by the Company through monitoring the foreign exchange rate
trends related to outstanding or expected capital transactions and entering into forward
contracts if they will have material contingen t effects. These forward contracts are made to
hedge the individual transactions, and not for speculation or trading. This is consistent with the
strategic policies focused on prudent management of cash flows.
The breakdown of forward currency contracts (f or sale and purchase) outstanding at December
31s t
, 2017 is i l lustrated in Note 14.
The assets and liabilities that are denominated in foreign currency are identified as part of the
sensitivity analysis of exchange rates . In order to determine the potentia l impact on final results,
the potential effects of f luctuations in the cross rates for the euro and major non -EU currencies
have been analysed. The following table il lustrates the sensitivity to reasonably l ikely changes in
exchange rates on pre-tax profit (due to changes in the value of current assets and liabilities
denominated in foreign currency) while holding all other variables constant :

T O D ’ S S . p . A .
2 0 1 7 A n n u a l R e p o r t
2 2 6 Notes to the Separate Financial Statements
euro
Currency Country FY 2017 FY 2016 FY 2017 FY 2016
CAD Canada (9,124.4) (20,955.3) 10,084.9 83,652.6
CHF Switzerland 371.4 (1,604.1) (410.5) 674.7
GBP UK 129.6 10,802.5 (143.3) 11,508.4
HKD Hong Kong (12,587.9) 65,679.1 13,913.0 92,985.7
JPY Japan (12,236.3) 5,999.9 13,524.3 27,539.4
KRW Korea 57.8 58.1 (63.9) 5.1
RMB China (191,751.2) 40,874.5 211,935.6 (31,252.0)
SGD Singapore (16,001.6) (13,510.5) 17,685.9 10,743.5
USD USA 173,995.4 74,465.3 (192,310.7) 58,117.3
Other n.a. (10,004.1) (1,208.8) 11,057.1 11,741.3
Total (77,151.3) 160,600.5 85,272.6 265,716.0
Impact on pre-tax profit 5%
writedown of the foreign
currency
Impact on pre-tax profit 5%
revaluation of the foreign
currency
euro 000's Revaluation/Writedown
foreign currency
Impact on pre-tax
profit
Impact on
Shareholders' equity
5% (77.2) (5,155.9)
-5% 85.3 4,971.9FY 2017
The impact on equity shown above relates to the effects on hedging reserve gross of tax effects.
The analysis did not include assets, l iabilities and future commercial f lows that were not hedged,
since fluctuations in exchange rates impact income in an amount equal to what is recognised in
the fair value of adopted hedge instruments.
Interest rate risk. The Company is exposed to interest rate fluctuations, l imited to its variable -
rate debt instruments. Interest rate risk is managed in conformity to long -established practice
with the aim of cutting down the risk of interest rate volatil ity, at the same time pur suing the
goal of reducing the financial costs involved to a minimum. TOD’S S.p.A. has a syndicated loan
signed with Mediobanca and Crédit Agricole with variable interest rate equal to EURIBOR 3M + 55
basis points (the reduction from 80 basis points to 55 basis points occurred last November 2017).
To hedge the risk of possible changes in the interest rates on the loan, two derivative contracts
( interest rate swaps - IRSs), have been signed, for a notional amount equal to the amount drawn
for the loan. These derivatives protect the Company from the risk of a generalised rise in interest
rates, swapping the variable rate on the loan for a contractually f ixed rate (a quarterly rate of
0.748%). Such transactions have been recognised in accordance with cash flow hedge
methodology provided by IAS39.

T O D ’ S S . p . A .
2 0 1 7 A n n u a l R e p o r t
2 2 7 Notes to the Separate Financial Statements
In addition to the above mentioned syndicated loan, TOD’S S.p.A. entered into two loan
agreements with BNL S.p.A. (BNP Paribas Group) and Intesa San Paolo S.p.A. respectively, for an
amount of 25 mill ion euros each; t he reimbursements will be respectively in four years with a
payment of 16 instalments at the end of every quarter and one -shot with a single payment at the
expiry date. Interests rates are variables and equal to the EURIBOR 3m + 0.42% and EURIBOR 3m
+0.5% respectively (Note 19). Considered the current financial markets situation and the current
EURIBOR reference rate, the Company doesn’t believe necessary to put in place hedging
derivatives for such loans. The financial market trend and the related benchm ark interests rates
are constantly monitored by the Company, and, in case there could be an increase of risks in
connection with the above mentioned loans, the Company will put in place appropriate hedging
instruments in accordance with the strengthened Co mpany’s practice.
The sensitivity analysis carried out on interest rates has shown in addition that a hypothetically
unfavourable change of 10% in short -term interest rates applicable to the adjustable rate
financial l iabilities existing at December 3 1s t
, 2017 would not have any impact on the pre -tax
result, mainly due to the hedging instruments entered by the Company.
4 . 1 C a t e g o r i e s o f m e a s u r e m e n t a t f a i r v a l u e
In accordance with IFRS 7, the financial instruments carried at fair value have been cla ssif ied
according to a hierarchy of levels that reflects the materiality of the inputs used to estimate their
fair value. The following levels have been defined:
Level 1 – quoted prices obtained on an active market for the measured assets or l iabilities;
Level 2 – inputs other than the quoted prices indicated hereinabove, which are observable either
directly (prices) or indirectly (derived from prices) on the market;
Level 3 – inputs that are not based on observable market data.
The tables below show the breakdown of f inancial assets and liabilities between each financial
category and the fair value hierarchy level at December 31s t
, 2017 and 2016:
2017
euro 000's
Other non-current assets 302 302
Total other non-current assets 302 302
Trade receivables 182,687 182,687
Derivative financial instruments 2,688 2,688 2,688 2,688
Other current assets 9,000 9,000
Bank 100,802 100,802
Total other current assets 292,489 2,688 295,177 2,688 2,688
Assets
Loans and
receivables at
amortized
cost
Available
for sales
Financial
assets at
fair value
Total Level 1 Level 2 Level 3 Total

T O D ’ S S . p . A .
2 0 1 7 A n n u a l R e p o r t
2 2 8 Notes to the Separate Financial Statements
2017
euro 000's
Bank borrowings 137,572 137,572
Other non-current liabilities 10,287 10,287
Derivative financial instruments 1,197 1,197 1,197 1,197
Total other non-current liabilities 147,859 1,197 149,056 1,197 1,197
Trade payables 157,268 157,268
Bank 46,176 46,176
Derivative financial instruments 2,020 2,020 2,020 2,020
Other current liabilities 1,063 1,063
Total other current liabilities 204,507 2,020 206,527 2,020 2,020
Liabilities
Financial
liabilities at
amortized
cost
Financial
liabilities at
fair value
Total Level 1 Level 2 Level 3 Total
2016
euro 000's
Other non-current assets 325 325
Total other non-current assets 325 325
Trade receivables 188,569 188,569
Derivative financial instruments 2,034 2,034 2,034 2,034
Other current assets 45,000 45,000
Bank 87,989 87,989
Total other current assets 321,558 2,034 323,592 2,034 2,034
Assets
Loans and
receivables at
amortized
cost
Available
for sales
Financial
assets at
fair value
Total Level 1 Level 2 Level 3 Total
2016
euro 000's
Bank borrowings 183,612 183,612
Other non-current liabilities 9,973 9,973
Derivative financial instruments 2,687 2,687 2,687 2,687
Total other non-current liabilities 193,585 2,687 196,272 2,687 2,687
Trade payables 131,478 131,478
Bank 46,289 46,289
Derivative financial instruments 7,239 7,239 7,239 7,239
Other current liabilities 1,464 1,464
Total other current liabilities 179,231 7,239 186,470 7,239 7,239
Liabilities
Level 3 Total
Financial
liabilities at
amortized
cost
Financial
liabilities at
fair value
Total Level 1 Level 2
Note that during the year 2017 there have not been any transfers between fair value levels
indicated by the IFRS 7.
In connection with the fair value of f inancial assets and liabilities measured at amortised cost,
given their nature, does not differ significantly from their carrying amounts.
5. Intangible fixed assets
5 . 1 I n t a n g i b l e a s s e t s w i t h i n d e f i n i t e u s e f u l l i f e . These include 137,235 thousand euros for
the value of Group owned brands and goodwill from business combinations for 13,685 thousand

T O D ’ S S . p . A .
2 0 1 7 A n n u a l R e p o r t
2 2 9 Notes to the Separate Financial Statements
euros recognised in accordance with the acquisition method (IFRS 3). The value of Brands is
broken down amongst the various brands owned by the Company (TOD’S, HOGAN and FAY):
euro 000's
12.31.17 12.31.16
TOD'S 3,741 3,741
HOGAN 80,309 80,309
FAY 53,185 53,185
Total 137,235 137,235
5 . 2 O t h e r a s s e t s . The following table details the movements of these assets in the current and
previous fiscal year:
euro 000's
Other
trademarks Software
Other
assets Total
Balance as of 01.01.16 4,186 7,600 13,569 25,355
Increases 300 3,753 1,110 5,162
Decreases (6) (6)
Impairment losses
Other changes
Amortisation of the period (777) (3,629) (2,712) (7,119)
Balance as of 12.31.16 3,708 7,724 11,960 23,392
Increases 328 2,632 1,098 4,058
Decreases (1) (1)
Impairment losses
Other changes
Amortisation of the period (810) (3,163) (2,527) (6,501)
Balance as of 12.31.17 3,226 7,193 10,530 20,949
The increase of “Other trademarks” relates to long -term charges with a defined useful l ife
incurred to protect the brands owned by the Company which are classif ied as assets with an
undefined useful l ife.
The increase of “Software” mainly relates to the development of the Company’s information
systems, while the increase of the figure “Other assets” mainly relates to long-term investments
made for the network of corners, franchise stores and the development of the digital channel.

T O D ’ S S . p . A .
2 0 1 7 A n n u a l R e p o r t
2 3 0 Notes to the Separate Financial Statements
Other assets includes 7,098 thousand euros as the value of the intangible asset re cognised in
relation to the agreement made with the Ministry of Cultural Affairs (“Ministero per i Beni e le
Attività Culturali”) and the Special Archaeological Service of Rome (“Soprintendenza speciale per
i beni archeologici di Roma”), with which the Com pany has undertaken to finance the entire cost
of restoration work on the Coliseum.
The amortisation of the asset has been done in accordance with its useful l ife based on the
agreement provisions, and the amount recognised for the period is about 1.1 mil l ion euros.
6. Tangible fixed assets
The following table il lustrates the changes during the current and previous fiscal year.
euro 000's Land and
buildings
Plant and
machin. Equip.
Leasehold
improv. Others Total
Balance as of 01.01.16 56,732 12,241 11,352 4,623 6,019 90,967
Increases 1,951 1,404 4,124 150 451 8,080
Decreases (10) (177) (11) (136) (334)
Impairment losses
Other changes
Depreciation of the period (1,817) (1,996) (5,674) (879) (1,232) (11,597)
Balance as of 12.31.16 56,866 11,639 9,626 3,882 5,103 87,117
Increases 2,632 2,604 4,235 663 1,496 11,629
Decreases (14) (24) (318) (1) (468) (825)
Impairment losses
Other changes
Depreciation of the period (1,882) (2,169) (4,983) (882) (1,229) (11,145)
Balance as of 12.31.17 57,602 12,050 8,559 3,662 4,902 86,776
The increase in the value of Land and Buildings and Plant and machinery is mainly due to
investments done for the construction o f the new plant located in Arquata del Tronto.
Equipments’ increase is mainly related to the industrial tools acquisition for the creation of new
collections ( lasts and moulds). Depreciations of the period, related to properties plant and
equipments are 11.1 mill ion euros.
7. Impairment losses
The recoverability of the residual value of intangible assets with an indefinite useful l ife (brands
and goodwill) was determined to ensure that assets with a value higher than the recoverable
value were not recognised on the financial statements, which refers to their “value in use.” The
criterion used to determine “value in use” is based on the provisions of IAS 36, and is based on

T O D ’ S S . p . A .
2 0 1 7 A n n u a l R e p o r t
2 3 1 Notes to the Separate Financial Statements
the current value of expected future cash flows ( discounted cash-flow analysis - DCF), which is
presumed to derive from the continual use and disposal of an asset at the end of its useful l ife,
discounted at a net discounting rate (net of taxes) that reflects current market rates for
borrowing money and the specific risk associated wit h the individual cash generating unit.
The recoverability of Assets was verif ied by comparing the net book value with the recoverable
value (value in use). The value in use is represented by the discounted value of future cash flows
that are expected from Assets and by the terminal value attributable to them. In connection with
the recoverability of Assets, the Company has identified only one CGU and it has been tested the
net invested capital.
The discounted cash flow analysis was carried out by using the FY 2018 budget as its basis. That
budget was prepared and approved by the Board of Directors on the assumption that the
Company would be a going concern for the foreseeable future: the Board of Directors f irst
assessed the methods and assumptions used in d eveloping the model. In particular:
i . The medium-term projection of budget figures for FY 2018 was carried out on a time horizon
of further 4 years, using an average rate of sales growth of 5%, a constant EBITDA margin and a
constant tax rate equal to 28% . The assumptions related to the sales growth in the middle term
reflect reasonable estimates of growth which consider even the development trend of the whole
luxury sector in the foreseeable future;
i i . The terminal value was determined as perpetuity, us ing, for future forecasts, a prudential
long term growth rate in l ine with the macro -economics estimates performed by the International
Monetary Fund.
i i i . To determine the “value in use,” a WACC, net of taxes, of 8.50% was used (the WACC rate
used at December 31s t
, 2016 was 8.30%), determined by referring to the discounting rates used
by a series of international analysts in f inancial reports on the TOD’S Group.
The analyses carried out on the recoverability of Company assets ( including 137.2 mill ion euro s
represented by proprietary brands and 13.7 mill ion by goodwill from business combinations)
showed an expected overall cash flow figure far higher than the total amount of net invested
capital (cover).
The sensitivity analysis performed on the impairment test in accordance with IAS 36, in order to
reveal the effects produced on the “value in use” by a reasonable change in the basic
assumptions (WACC, growth rates, EBITDA margin) and determination of the terminal value
(disposal value), did not reveal an a ppreciable impact on determination of the “value in use” and
its coverage. Given the significant value assumed by the cover, it would be necessary to make
unrealistic base assumptions to render the “value in use” equal to the book value of tested assets
(the break-even hypothesis).

T O D ’ S S . p . A .
2 0 1 7 A n n u a l R e p o r t
2 3 2 Notes to the Separate Financial Statements
Furthermore, it’s been performed an estimate of the recoverable amount of equity investments
in subsidiaries (worth 583.1 mill ion euros at December 31s t
, 2017), in accordance with IAS 36,
regarding the investments with impairmen t indicators . Based on results, the carrying amount of
the investment in Tod’s Danmark APS has been impaired for 464 thousand euros because it’s not
reasonably predictable, as of today, to recover the carrying amount with future cash flows.
Finally, in accordance with IAS 36, it’s been performed an estimate of the recoverable amount of
brands using the royalty method with the same assumptions indicated above in terms of growth
rates, tax rate, WACC and terminal value. From such analysis, no impairment ind icators arose,
considered that the brands recoverable value is higher than their book value.
8. Investments property
The residual value of investment property at December 31s t
, 2017 was 22 thousand euros. It
consisted exclusively of real estate leased to third parties. The fair value of these investments is
estimated to be 250 thousand euros, according to the market prices for similar properties
available for rent at similar conditions.
The following table details the values of these investment property:
euro 000's
Historic cost 115
Accumulated depreciation (89)
Balance as of 01.01.17 25
Increases
Decreases
Amortisation of the period (3)
Balance as of 12.31.17 22
9. Investments in subsidiaries, joint ventures and associated companies
Information about the subsidiaries follows below, together with a comparison between the
carrying amount of the investments in subsidiaries and the respective value determined
according to the equity method:

T O D ’ S S . p . A .
2 0 1 7 A n n u a l R e p o r t
2 3 3 Notes to the Separate Financial Statements
euro 000's a) b) a) - b)
Investments in subsidiaries
Percentage of
share
investment
Share capital
Measurement
using equity
method
adjustmens
of which
profit/(loss)Carrying amount Difference
Investments in subsiadiries
TOD'S Deutschland Gmbh 100% 153 14,323 1,179 3,153 11,170
TOD'S France Sas 100% 780 20,695 745 4,800 15,895
TOD'S Hong Kong Ltd 1% 12,209 1,119 (4,804) 129 990
Holpaf B.V. 100% 5,897 40,556 23 36,834 3,722
Un. Del. Kft 10% 163 48 (87) 18 30
Del. Com. S.r.l. 100% 31 41,656 411 51,108 (9,452)
TOD'S Macao Lda. 1% 1,846 43 (1,860) 19 24
TOD'S International BV 100% 2,600 181,964 7,513 36,171 145,794
An.Del. Inc. 100% 3,056 41,832 1,556 34,656 7,176
Roger Vivier S.p.A. 100% 10,000 479,038 20,860 415,479 63,559
TOD'S Danmark APS 100% 67 523 (411) 511 12
TOD'S Austria Gmbh 100% 50 286 131 50 236
Total 822,083 25,256 582,928 239,155
Investments in other entities
Other investments n.s. 131
Total 131
Total investments 583,059
Changes in Investments in subsidiaries in year 2017 have been the following:
- Transfer of the share of TOD’S Brazil Ltda, occurred on May 4t h
, 2017. The negative result
arose from such transfer has been equal to about 319 thousand euros which was computed as a
difference between the selling price and the carrying amount of the equity investment sold,
- Payment on account of share premium reserve, for a total amount of 400 mill ion JPYs, in the
subsidiary Holpaf B.V. (equal to 3,130,678.33 euros, inclusive of hedging exchange effects),
- Conclusion of Polimoda S.r.l. l iquidation process, ended last June 2017, and recognition of a
loss for about 15 thousand euros as a consequence of the closing of its quota.
Furthermore based on results of the impairment test the carrying amount of the equity
investment in Tod’s Danmark APS has been impaired for 464 thousand euros (Note 7).
10. Deferred taxes
At the reporting date, recognition of the effects of deferred tax assets/liabilities, shows a net
balance (liability) of 13,241 thousand euros (FY 2016: l iability for 8,443 thousand euros) .
When determining future tax impact, reference was made to the presumed percentage weight of
the taxes that will be imposed on income in the years when those t axes will be charged. The
balance of deferred tax assets and liabilities is shown in the following table, highlighting those
components that contributed to their formation :

T O D ’ S S . p . A .
2 0 1 7 A n n u a l R e p o r t
2 3 4 Notes to the Separate Financial Statements
euro 000's
Net liabilities Net liabilities
Property, plant and equipment (2,345) (2,502)
Intangible fixed assets (33,489) (31,916)
Inventory (devaluation) 13,270 10,764
Derivative financial instruments 59 501
Costs deductible over several years 8,295 13,423
Reserves for employees (163) 123
Provisions for risks and charges 1,051 366
Other 82 797
Total (13,241) (8,443)
12.31.17 12.31.16
11. Other non-current assets
The item Other non-current assets is mainly related to receivables versus tax authorities to be
refunded.
12. Inventories
T h e f o l l o w i n g t a b l e s h o w s t h e b o o k v a l u e o f t h e i n v e n t o r i e s :
euro 000's
12.31.17 12.31.16 Change
Raw materials 63,174 53,858 9,317
Semi-finished goods 10,040 9,003 1,037
Finished products 138,482 126,367 12,116
Write-downs (47,275) (38,346) (8,930)
Total 164,421 150,882 13,538
The allowance for inventory write -downs reasonably reflects the technical and stylistic
obsolescence of the Group’s invent ories at December 31s t
, 2017. The table below shows changes
occurred during the year of the inventory write -down provision:
euro 000's
12.31.17 12.31.16
Opening balance 38,346 20,850
Increase 14,355 18,847
Utilization (5,426) (1,351)
Reversal
Closing balance 47,275 38,346

T O D ’ S S . p . A .
2 0 1 7 A n n u a l R e p o r t
2 3 5 Notes to the Separate Financial Statements
13. Trade receivables and other current assets
13.1 Trade receivables.
euro 000's
12.31.17 12.31.16 Change
Third parties 89,020 94,943 (5,923)
Subsidiaries 99,862 99,317 545
Allowances for doubtful accounts (6,194) (5,691) (504)
Net trade receivables 182,687 188,569 (5,882)
Receivables from third parties. These represent the credit exposure stemming from sales made
through the wholesale channel.
Receivables from subsidiaries. They include the Company’s receivables from Group entities and
stem primarily from commercial transactions and, to a lesser extent, provision of services.
Allowances for bad debts. The amount of the adjustment to the face value of the receivables
represents the best estimate of the loss determined against the specific and generic risk of
inability to collect identified in the receivables recognised on the bala nce sheet, The changes in
the allowances for bad debts are il lustrated as follows :
euro 000's12.31.17 12.31.16
Balance as of 01.01.17 5,691 5,077
Increase 900 1,000
Decrease (396) (387)
Balance as of 12.31.17 6,194 5,691 13.2 Tax receivables. Totalling 16,267 thousand euros (FY 2016: 10,986 thousand euros), they
are mainly represented by receivables for income taxes and value added tax VAT.
13.3 Other. euro 000's
12.31.17 12.31.16 Change
Prepaid expenses 2,140 2,125 15
Financial assets 9,000 45,000 (36,000)
Others 24,073 21,143 2,930
Total 35,213 68,269 (33,056)
The item “Others” mainly relates to receivables versus manufacturers for the raw materials sold
in connection with manufacturing activities, to receivables for credit cards and other current
receivables.

T O D ’ S S . p . A .
2 0 1 7 A n n u a l R e p o r t
2 3 6 Notes to the Separate Financial Statements
Financial assets are comprised exclusively by loans granted to the Group’s companies :
euro 000's
12.31.17 12.31.16 Change
Financing within 12 months 9,000 45,000 (36,000)
Current account overdraft
Total current assets 9,000 45,000 (36,000)
Financing beyond 12 months - - -
Total financial assets 9,000 45,000 (36,000)
The amount for 9 mill ion euros related to the outstanding amount of a loan granted to subsidiary
Roger Vivier S.p.A. on January 27t h
, 2016 for a total amount of 130 mill ion euros. The loan has
been renewed, l imited to the outstanding amount, for further 12 months. The loan has been
partially reimbursed in advance during the year for 36 mill ion euros.
14. Derivative financial instruments
The Company is exposed to both exchange rate risk, principally for reven ues denominated in
currencies other than the euro (see Note 4), and interest rate risk l imited to its variable -rate
debt instruments. The principal currencies that pose this risk are the U.S. dollar, Chinese yuan,
Hong Kong dollar, Swiss franc, and Britis h pound. In order to realise the objectives envisaged by
the Risk Management policy, the Company enters in derivative contracts with primary banks for
the hedging of the above mentioned risks; in particular, in connection with exchange rate risk,
the Company entered in sell and/or buy foreign currency contracts (forward), while for the
hedging of a variable interest rate risk, the Group entered in interest rate swaps agreements.
Moreover, the Company is exposed to exchange rate risk related to intercompany financial f lows
with subsidiaries with functional currencies different from euro (Note 4). These risks are
managed by the Company through monitoring the foreign exchange rate trends related to
outstanding or expected capital transactions and entering into forward contracts if they will have
material contingent effects.
Forward contracts have been put in place, for each individual currency, to hedge a specific
percentage of the expected revenue (and cost) volumes in the individual currencies other than
the functional currency.
At the closing date, the notional amount of the currency forward sales agreements are
summarized as follows:

T O D ’ S S . p . A .
2 0 1 7 A n n u a l R e p o r t
2 3 7 Notes to the Separate Financial Statements
Currency 000's
Notional
currency
Notional
euro
Notional
currency Notional euro
US Dol lar 28,030 23,372
Hong Kong Dol lar 475,000 50,683
Japanese Yen 1,770,000 13,110
Bri tish Pound 26,500 29,868
Swiss Franc 7,620 6,512
Chinese Renmimbi 350,000 44,846
Canadian Dol lar 5,150 3,424
Total 158,706 13,110
Sale Purchase
All derivative contracts will expire during the year 2018.
Below is summarized the composition of the outstanding der ivatives at December 31s t
, 2017 and
2016, with information related to carrying amounts, current and non -current, in connection with
fair value and cash flow hedge reserve, the latter presented net of its related tax effects.
euro 000's
Assets Liabilities
Hedging
Reserve Assets Liabilities
Hedging
Reserve
Non-current
Interest rate swaps - cash flow hedges 1,197 (909) 2,687 (2,042)
Forward foreign exchange contracts -
cash flow hedges
Forward foreign exchange contracts -
fair value hedges
Total non-current 1,197 (909) 2,687 (2,042)
Current
Interest rate swaps - cash flow hedges 1,467 (880) 1,906 (1,135)
Forward foreign exchange contracts -
cash flow hedges 1,318 532 1,603 1,304 2,973 1,591
Forward foreign exchange contracts -
fair value hedges 1,370 21 730 2,360
Total current 2,688 2,020 723 2,034 7,239 456
Total 2,688 3,217 (186) 2,034 9,926 (1,586)
12.31.17 12.31.16
The cash flow hedge reserve used for the exchange rate risk was equal to 6,796 thousand euros,
of which 6,641 thousand euros were represented as an increase of revenues and 156 thousand
euros as an increase of investments in subsidiaries.
The overall effect recognised in the income statement in connection with derivatives for the
hedging of interest rate risk amounted to 1,840 thousand euros, totally represented in the
financial expenses.

T O D ’ S S . p . A .
2 0 1 7 A n n u a l R e p o r t
2 3 8 Notes to the Separate Financial Statements
15. Cash and cash equivalents
Cash and cash equivalents are related to cash and bank deposits for 1 00,802 thousand euros
(87,989 thousand euros at December 31s t
, 2016). For further information see the statement of
cash flows.
16. Shareholders’ equity
16.1 Share Capital. At December 31s t
, 2017, the Company share capital totalled 66,187,078
euros (unchanged in respect of December 31s t
, 2016), and was divided into 33,093,539 shares
having a par value of 2 euros each, fully subscribed and paid in. All shares have equal voting
rights at the general meeting and participation in profits. At December 31s t
, 2017, Mr. Diego
Della Valle, President of the Board of Directors, hold, directly and indirectly, 60.663% of TOD’S
S.p.A. share capital. At December 31s t
, 2017 the Company did not own treasury shares, and it did
not execute any transactions on those shares during the ye ar.
16.2 Capital reserves. Capital reserves are exclusively related to share premium reserve,
amounting to 416,507 thousand of euros as of December 31s t
, 2017 (416,507 thousand of euros
as of December 31s t
, 2016).
16.3 Hedging reserve. The following schedule il lustrates the changes occurred in 2017 :
euro 000'sHedging reserve
Balance as of 01.01.16 (4,356)
Change in fair value of hedging derivatives 587
Transfer to Profit and Loss Account of hedging derivates 2,182
Other
Balance as of 01.01.17 (1,586)
Change in fair value of hedging derivatives 5,167
Transfer to Profit and Loss Account of hedging derivates (3,767)
Other
Balance as of 12.31.17 (186)
For comments related to the changes of hedging reserve please see Note 14.
16.4 Other reserves and profit of the period. The following schedule il lustrates the changes in
f iscal 2017:

T O D ’ S S . p . A .
2 0 1 7 A n n u a l R e p o r t
2 3 9 Notes to the Separate Financial Statements
euro 000's
Other
reserves
Profit (loss) of
the period Total
Balance as of 01.01.16 315,364 85,663 401,028
Allocation of 2015 result 19,476 (19,476)
Dividends (66,187) (66,187)
Profit for the period 64,180 64,180
Other changes (1,159) (1,159)
Balance as of 01.01.17 333,681 64,180 397,862
Allocation of 2016 result 7,921 (7,921)
Dividends (56,259) (56,259)
Profit for the period 84,977 84,977
Other changes (874) (874)
Balance al 31.12.17 340,728 84,977 425,705
Other changes for the year 2017 are mainly related to both the use of the specific reserve for
promoting territorial solidarity projects, for 858 thousand euros and to the recognition of
cumulated actuarial gains/(losses) for the period (IAS 19).
16.5 Information on distributable reserves. The following table provides information on the
possible use and distribution of each specific account under shareholders’ equity and their
possible use during the past three years:
euro/000
Nature/Description Amount Possibility of
use
Available
amount
Not available
amount
coverage of
losses
others
Share capital 66,187 66,187
Capital reserves
Share premium reserve 416,507 A,B,C (1) 416,507
Retained earnings reserves
Legal reserve 13,237 B 13,237 13,237
Retained earnings 328,525 A,B,C 328,525 212,797
Other profits/(losses) in OCI (1,220) (1,220)
Total share capital and reserves 823,236 758,270 78,204
Non-distributable reserves
Residual distributable reserves 758,270
Use in the previous 3 years
Legend:
( 1 ) Pursuant to section 2431 Ital ian Civi l code, to enti re amount of the reserve may be distributed only when the legal reserve has reached the l imits set forth in Section 2430 Ital ian Civi l code
A – for capital increase. B – for coverage of losses. C – for distribution to shareholders.
Tax suspension reserves. The following information is provided on reserves in shareholders’
equity that, if distributed, will constitute taxable income for the company, in connection with the

T O D ’ S S . p . A .
2 0 1 7 A n n u a l R e p o r t
2 4 0 Notes to the Separate Financial Statements
situation following the capital transactions carried out pursuant to the August 5t h
, 2000
resolution of the extraordinary Shareholders’ Meeting:
a. for the reserves in equity, only the extraordinary reserve remains; formed with income that
was regularly subjected to taxation, it would not constitute taxable income for the company were
it to be distributed;
b. previously defined reserves have been converted into the form of share capital, as follows:
euro
Reserve for adjustments art. 15 c. 10 DL 429/82 149,256.04
Reserve for greater reduction of VAT 508.19 Reserve for inflation adjustments pursuant to Law n. 72/’83 81,837.76 Reserve for deduction art. 14 c. 3 – Law n. 64/’86 5,783.80
for a total of euro 237,385.80, which, if distributed, would represent taxable income for the
company.
16.6 Dividends. During 2017, the parent company TOD’S S.p.A. paid to the shareholders
dividends for the net income realised in 2016. The aggregate amount of paid dividends is 56.3
mill ion euros, at the rate of 1.7 euros for each of the 33,093,539 shares representing the share
capital at the coupon detachment date (May 23rd
, 2017). Regarding the net profit for FY 2017,
totalling 84,976,553.79 the Board of Directors has proposed to distribute a dividend for 1.40
euros per share, totalling 46,330,954.60 euros in accordance with the current shares. The
dividend is subject to approval by the annual Shareholders’ Meeting in April 19t h
, 2018, and was
not included among the liabilities reported on this balance sheet.
17. Provisions and contingent liabilities and assets
17.1 Provisions. They include the estimate of l iabil ities, with uncertain maturity date or amount,
on which the Company might incur in case of a legal or constructive obligation in connection with
a past event. The figures mainly include provisions related to both legal and tax lawsuits and
risks and costs for employees. The table below shows the changes of provisions occurred during
the period:

T O D ’ S S . p . A .
2 0 1 7 A n n u a l R e p o r t
2 4 1 Notes to the Separate Financial Statements
euro 000's
12.31.17 12.31.16
Provisions for risks - non current
Opening balance 4,328 3,628
Increase 882 700
Utilization
Reversal
Closing balance 5,210 4,328
Provisions for risks - current
Opening balance 678 1,797
Increase 3,090 383
Utilization (208) (1,502)
Reversal (75)
Closing balance 3,485 678
17.2 Contingent liabilities and other commitments.
i. Guarantees granted to others. A total of euro 49,849 thousand euros been granted to others at
December 31s t
, 2017 (52,395 thousand euros in 2016). The amount is mainly related to
guarantees granted to secure the contractual commitments of subsidiaries, comprised for 44,260
thousand euros to bank credit l ines provided to the subsidiaries, for which the company acts as
guarantor (FY 2016: 46,971 thousand euros).
ii. Guarantees received from third parties. Guarantees received by the company from banks as
security for contractual commitments totalled 5,471 thousand euros (6,282 thousand euros in
2016).
i i i. Other guarantees. TOD’S S.p.A. is guarantor (by taking over from the previous guarantor for
the contractual obligations assumed by Holpaf B.V.) in favour of the banks that subscribed the
two non-convertible, amortised and fixed-rate bond loans (Intesa San Paolo Bank Ireland PLC and
Société Européenne de Banque) , issued in 2006 by the subsidiary Holpaf B.V. to refinance the
debt assumed to purchase the land and construction of the building in Omotesando, Tokyo. In
detail, these covenants concern:
a) Property Purchase Option : a put option granted to Intesa San Paolo Bank Ireland PLC on the
Omotesando property, which may be exercised only if Holpaf B.V. defaults during the term of the
bonds and the creditor demands payment of the mortgage. In this scenario, TOD’S S.p.A. must
purchase the property at a specific price that varies over the term of the option (decreasing
price, equal to the amount of the residual debt of the two bonds not repaid by Holpaf B.V. at the
time of default);
b) Earthquake Indemnity Letter : TOD’S S.p.A. has undertaken to hold harmless the rights to
repayment of the bonds held by Intesa San Paolo Bank Ireland PLC and Société Européenne de
Banque even in the event of damage or destruction of the property in an earthquake.

T O D ’ S S . p . A .
2 0 1 7 A n n u a l R e p o r t
2 4 2 Notes to the Separate Financial Statements
c) All Risks Indemnity Letter: TOD’S S.p.A. has undertaken to hold harmless the rights to
repayment of the bonds held by Intesa San Paolo Bank Ireland PLC and Société Européenne de
Banque even in the event of damage or destruction of the property due to any event.
d) Pledge on the fire insurance policy : in the event of loss due to building fire, any
reimbursement by the insurance company constitutes a pledge in guarantee of the bonds whose
value has not yet been repaid to Intesa Sanpaolo Bank Ireland PLC and Société Européenne de
Banque.
At December 31s t
2017, the outstanding face value of the principal for the bond amounted to JPY
1,581 mill ion (11.7 mill ion euros).
17.3 Operating lease agreements. The operating leases entered into by the Company are for use
of properties used to conduct its operating activities (offices, production plants). The amount of
minimum lease payments pursuant to these agreements is as follows :
euro millions
2017 2016
2017 6.1
2018 6.4 4.5
2019 5.5 3.4
2020 5.0 3.2
2021 4.4 3.1
2022 4.0
Over 5 years 2.8 3.1
Total 28.1 23.4
Operating lease instalments, included in the item Costs of use of third party assets, totalled
euros 7.9 mill ion in fiscal year 2017 (FY 2016: 7.6 mill ion euros).
18. Employee benefits
The main actuarial assumptions used for the computation of TFR (termination benefit provided by
Italian law on behalf of the Company employees) are summarized below:
Discounting rate: 1.3%
It is related to the average yield curve from IBOXX Eurozone Corporates AA of December
2017.
Inflation rate: 1.5%;
TFR incremental rate: 2.625%.
The table below shows the variation of the liability occurred in 2017:

T O D ’ S S . p . A .
2 0 1 7 A n n u a l R e p o r t
2 4 3 Notes to the Separate Financial Statements
euro 000's
Year 2017 Year 2016
Opening balance 7,642 7,676
Service costs
Interest costs 101 157
Benefits paid (421) (429)
Actuarial (gains)/losses 17 238
Other
Closing balance 7,339 7,642
Employee benefits include even other long term employee benefits.
19. Financial liabilities
euro 000's
12.31.17 12.31.16 Change
Current account overdraft
Financing 183,747 229,901 (46,154)
Total 183,747 229,901 (46,154)
Currency 000's
Type Counterpart Currency Maturity
Medium and long term bank pool loan Mediobanca - Crédite Agricole Eur 2021 149,372 149,372
Medium and long term loan Banca Nazionale del lavoro S.p.A. Eur 2019 9,381 9,381
Medium and long term loan Intesa SanPaolo S.p.A. Eur 2019 24,994 24,994
Total financing 183,747
Res. Debt in
currency
Res. Debt in
euros
The medium and long term bank pool loan is related to the financing agreement signed on July
2014 by TOD’S S.p.A. and Mediobanca/Crédit Agricole, which has a variable interest rate equal to
EURIBOR 3M + 55 basis points. The loan was hedged with two derivative contracts ( interest rate
swaps - IRSs) for the same notional amount and duration (Note 14). The duration of such loan is 7
years from the signing date (July 2014) and it will be refun ded on a quarterly basis.
The medium and long term loans are related to two loan agreements signed in 2015 between the
Company and BNL S.p.A. (BNP Paribas Group) and Intesa San Paolo S.p.A. respectively, for an
amount of 25 mill ion euros each; the reimburs ements will be respectively in four years with a
payment of 16 instalments at the end of every quarter and one -shot with a single payment at the
expiry date. Interests rates are variables and equal to the EURIBOR 3m +0.42% and EURIBOR 3m
+0.5% respectively.
These loans contains, among others, specific f inancial covenants; in particular, it is requested to
respect the following parameters computed at a Group level:

T O D ’ S S . p . A .
2 0 1 7 A n n u a l R e p o r t
2 4 4 Notes to the Separate Financial Statements
Bank Financial covenants
Mediobanca/Crédit Agricole Net financial liabilities/EBITDA ≤ 3.5
Banca Nazionale del lavoro S.p.A. Net financial liabilities/EBITDA ≤ 3.5
Intesa SanPaolo S.p.A. Net financial liabilities/EBITDA ≤ 3
Limit at 31st
December
The parameters indicated above are constantly monitored by the Company, and all f inancial
covenants are fulfi l led at December 31s t
, 2017.
The table below il lustrates the breakdown of f inancial l iabilities, which include the accrual for
interests at the reporting date:
euro 000's Medium and long
term loan (BNL)
Medium and
long term loan
(Intesa)
Medium and long
term pool loan
(Mediobanca/Credit
Agricole)
Total
2018 6,250 40,000 46,250
2019 3,125 25,000 40,000 68,125
2020 40,000 40,000
2021 30,000 30,000
2022 -
Over 5 years
Total 9,375 25,000 150,000 184,375
Accruals and
amortized cost 6 (6) (628) (628)
Total 9,381 24,994 149,372 183,747
For the sensitivity analysis on interest rates (IFRS 7) and the disclos ures on three further
financing agreements related to credit l ines available for the Company, but not yet used at
December 31s t
, 2017, see Note 4.
20. Other non-current liabilities
The balance for this item, 14.3 mill ion euros (13.3 million euros at Decemb er 31s t
, 2016), refers
for about 10.3 mill ion euros to the liability recognised in relation to the agreement made for
f inancing of restoration work on the Coliseum (Note 5), for 2.6 mill ion euros to the non -current
part of the return reserve and for 1.4 mi ll ion euros to other non-current l iabilities. The liability in
relation to the Coliseum was recognised at the discounted value of the financial outlays that are
reasonably foreseeable on the basis of the multi -year plan for restoration work.

T O D ’ S S . p . A .
2 0 1 7 A n n u a l R e p o r t
2 4 5 Notes to the Separate Financial Statements
21. Trade payables and other current liabilities
2 1 . 1 T r a d e p a y a b l e s . euro 000's
12.31.17 12.31.16 Change
Third parties 138,055 110,970 27,085
Subsidiaries 19,213 20,507 (1,294)
Total 157,268 131,478 25,791
The increase of trade payables is due to the normal business trend.
To Third parties. These stem exclusively from commercial transactions as part of ordinary
processes for purchase of goods and servic es.
To subsidiaries. These represent payables to Group entities, principally for provision of services.
21.2 Tax payable .
At December 31s t
, 2017 tax payables are 3,767 thousand euros and they mainly relate to
withholding taxes on income of employees (3,201 thousand euros in 2016).
2 1 . 3 O t h e r .
euro 000's
12.31. 17 12.31. 16 Change
Payables to employees 6,453 5,773 681
Social security institutions 4,318 4,253 65
Others 35,762 56,919 (21,157)
Total 46,533 66,944 (20,411)
Payables to employees reflected amounts accrued in their favor ( including unused holiday leave)
that had not yet been paid at the reporting date. Other l iabilities is mainly related to advance
from customers for 3.9 mill ion euros, the current portion of estimated returns at the end of the
financial year for 27 mill ion euros, and other l iabilities versus subsidiaries for 4.9 mill ion euros.
The change compared to the previous year was mainly attributable to util isation o f the estimated
returns related to products branded ROGER VIVIER -branded already recognised in the previous
year following the redefinit ion of distribution strategies, mainly as a result of the acquisition of
the ROGER VIVIER brand.

T O D ’ S S . p . A .
2 0 1 7 A n n u a l R e p o r t
2 4 6 Notes to the Separate Financial Statements
22. Revenues
Net sales during the year totalled 662.6 mill ion euros (637.2 mill ion euros in 2016). For further
comments on sales revenues see the report on operations.
For further details related to revenues see the comments provided in the report on operations.
The item “Other revenues and income” amounts 7.8 million euros (32.7 million euros in 2016) and it
mainly includes royalties, extraordinary income and insurance reimbursements. The decrease in
respect of the previous year is mainly related to the recognition, occurred last year, of the
payment of an indemnity for 25 mill ion euros in connection with ROGER VIVIER brand acquisition.
23. Personnel costs
The personnel costs incurred by the Group in FY 2017 as compared with those for FY 2016 are
il lustrated as follows:
euro 000's
Year 2017 Year 2016 Change 2017 2016
Wages and salaries 61,577 60,476 1,101 9.3 9.5
Social security contribution 21,225 18,517 2,709 3.2 2.9
Employee sev. indemn. 4,021 4,018 3 0.6 0.6
Total 86,823 83,011 3,812 13.1 13.0
% on revenues
The following table il lustrates the breakdown of the Group’s employees by category:
12.31.17 12.31.16 Aver. 17 Aver. 16
Executives 42 40 39 39
White-collar Employees 862 816 814 799
Blue-collar Employees 865 839 891 908
Total 1,769 1,695 1,743 1,746
24. Financial income and expenses
The breakdown of f inancial income and expenses in f iscal FY 2017 is as follows: euro 000's
Year 2017 Year 2016 Change
Income
Interest income on current account 302 771 (469)
Foreign exchange gains 9,749 11,466 (1,717)
Other 504 1,135 (630)
Total income 10,556 13,372 (2,816)
Expenses
Interest on medium-long term financing (1,126) (1,891) 764
Foreign exchange losses (14,873) (13,185) (1,688)
Other (2,720) (6,932) 4,212
Total expenses (18,719) (22,008) 3,288
Total net income and expenses (8,164) (8,636) 472

T O D ’ S S . p . A .
2 0 1 7 A n n u a l R e p o r t
2 4 7 Notes to the Separate Financial Statements
25. Income and expenses from subsidiaries
During the year, the Company received dividends from subsidiaries Tod’s Hong Kong Ltd. and
Tod’s International B.V. for 81 thousand euros and 8.000 thousand euros respectively.
It is highlighted that, as a consequence of the impairment test on investments in subsidi aries of
controlled entities, the Company written off the investment in the controlled entity TOD’S
Danmark APS for a total amount of 464 thousand euros (Note 7).
The Company registered costs from investments in subsidiaries for a total amount of 333.8
thousand euros related to both the sales of TOD’S Brasil Ltda and the conclusion of the
l iquidation process of Polimoda S.r. l. (Note 9).
26. Income taxes
The tax liability for f iscal 2017 (current and deferred) was 26.9 mill ion euros, giving a tax rate of
24% (FY 2016: 28.3%), Income taxes for the period are broken down into current and deferred
taxes, as follows:
euro 000's
Year 17 Year 16 Change
Current taxes 22,534 34,795 (12,261)
Deferred taxes 4,355 (9,499) 13,854
Total 26,889 25,296 1,593
The theoretical tax rate for FY 2017 was 24% computed applying the current rates for IRES
( income tax on company’s profits). The following sc hedule reconciles theoretical taxes and the
taxes actually charged to income:
euro 000’s
Taxes Rate % % Theoretical income taxes 26,848 24.0%
IRAP effect 3,924 3.5%
Tax effects of non-deductible or partial ly deductible costs 282 0.3%
Non-taxable income (2,342) (2.1%)
Other 1,217 1.1%
Previous year taxes 176 0.2%
“Patent box” IRES tax effect (3,216) (2.9%) Effective income taxes 26,889 24.0%
The tax effect of the so-called “Patent box” is related to the agreement signed by the Parent
company on December 23rd
, 2016 with the competent office of the Italian Tax Authorities, with
which it’s been defined the methods and criteria used to calculate the amount of the quot a of
income exempt from income taxes for the purpose of the so -called "Patent box" regime. This is a

T O D ’ S S . p . A .
2 0 1 7 A n n u a l R e p o r t
2 4 8 Notes to the Separate Financial Statements
tax relief regime for the benefit of Italian companies that produce income through the direct use
or the licensing to third parties of intellectual propert y rights.
Tax consolidation program. The company, exercising the option envisaged by the new version of
the TUIR and the implementing decree pursuant to ex Art. 129, together with the Italian
subsidiaries that are presumably subject to a controlling relationship pursuant to ex Art. 120
TUIR, decided to have the Group participate in the national tax consolidation program for IRES.
According to this law, TOD’S S.p.A., as controlling company, has aggregated its income with that
of the subsidiaries participating in the national tax consolidation program since fiscal 2004, It
does so by fully offsetting all the positive and negative taxable amounts, thereby benefiting from
any losses contributed by the subsidiaries and assuming the expenses transferred from th ose
subsidiaries with positive taxable income.
TOD’S S.p.A. essentially acts as a “clearing house” for taxable income (profits and losses) of all
Group companies participating in the tax consolidation program, as well as f inancial relationships
with revenue agency offices. At the same time, it recognizes l iabilities or credits vis -à-vis those
subsidiaries that produced tax losses and those that, on the contrary, transferred taxable income.
Independently of the taxes that are paid, the company’s net result is impacted exclusively by the
income taxes accrued on its own taxable income.
27. Earnings per share
The calculation of base and diluted earnings per share is based on the following: i . Reference profit .
euro 000's
For continuing operations Year 17 Year 16
Profit used to determine basic earning per share 84,977 64,180
Dilution effects
Profit used to determine diluted earning per share 84,977 64,180
euro 000's
For continuing operations Year 17 Year 16
Net profit of the year 84,977 64,180
Income (loss) from discontinued operations
Profit used to determine basic earning per share 84,977 64,180
Dilution effects
Profit used to determine diluted earning per share 84,977 64,180
In both fiscal 2017 and 2016, there were no dilu tions of net consolidated earnings, partly as a
result of activities that were discontinued during the periods in question.

T O D ’ S S . p . A .
2 0 1 7 A n n u a l R e p o r t
2 4 9 Notes to the Separate Financial Statements
i i . Reference number of shares .
Year 17 Year 16
Weighted average number of shares to determine basic earning per share 33,093,539 32,916,587
Share Options
Weighted average number of shares to determine diluted earning per share 33,093,539 32,916,587
i i i. Base earnings per share . Calculation of the base earning per share for f iscal year 2017 is
based on the net profit attributable to holders of ordinary shares of the company TOD’S S.p.A.,
totalling 84,977 thousand euros (64,180 thousand euros in 2016), and on the average number of
ordinary shares outstanding during the same period, totalling 33,0 93,539 (32,916,587 in 2016).
iv. Diluted earnings per share. Calculation of the diluted earnings per share for the period
January-December 2017 is the same as the base earnings per share, due to the fact that there are
no items which produce dilution eff ects.
28. Transactions with related parties
The Company's related parties transactions were executed in compliance with the procedural
sequence and implementing procedures set out in the Related Parties Transactions Procedure
approved by the TOD'S S.p.A. Boar d of Directors in implementation of the Related Parties
Regulation adopted by CONSOB with Resolution no. 17221 of March 12t h
, 2010, as subsequently
amended.
In accordance with market best practices, significant related party transactions are subject to an
in-depth review involving, inter alia:
( i) complete, prompt transmission of material information to the delegated Board of Directors
committees (the Control and Risk Committee and the Independent Directors Committee, each
within the ambit of their delega ted responsibilities, where the majority or all members of these
committees are independent directors), who in the performance of their functions also avail
themselves of the assistance of independent experts;
( i i) the issuance of an opinion (either bindi ng or non-binding, as applicable) before approval of
the transaction by the Board of Directors (or, if appropriate, by the body delegated to resolve on
the transaction). Without prejudice to the principles of procedural fairness cited hereinabove, no
unusual related party transactions, or other related party transactions that might compromise
corporate assets or the completeness and fairness of company accounting and other information
were executed during the financial year.

T O D ’ S S . p . A .
2 0 1 7 A n n u a l R e p o r t
2 5 0 Notes to the Separate Financial Statements
All transactions – which are connected with the normal operations of TOD’S S.p.A. – were
executed solely on behalf of the company by applying contractual conditions consistent with
those that can theoretically be obtained on an arm’s length basis.
Most significant transactions concluded during the year
On June 29t h
, 2017 the strategic partnership agreement in place with Italiantouch S.r. l., a
company controlled by Directors Diego Della Valle and Andrea Della Valle and owned by the
former, was renewed for f ive additional years for the dev eloment of the Group’s e -commerce
channel. The agreement concerns the sales of products under all four brands owned by the
Group, through the e-commerce platform of the partner, and provides for the development of
already esisting markets under the previou s agreement and the implementation of the channel in
new geographical areas.
Related party transactions pending at December 31s t
, 2017
In continuation of contractual relationships already existing in 2016, the Company continued to
maintain a series of contractual relationship with related parties (directors/controlling or
significant shareholders) in 2017. The principal object of the transactions of the year was the sale
of products and lease of sales spaces, show rooms and offices.
i. Commercial transact ions with related parties – Revenues
( * ) Companies directly or indirectly controlled by Chairman of the Board of Directors Diego Della Valle
euro 000's
Year 2017
Parent Company (*) 9,739 5
Directors
Executives with strat. resp.
Other related parties
Total 9,739 - - - 5 -
Year 2016
Parent Company (*) 7,635 4 5
Directors
Executives with strat. resp.
Other related parties
Total 7,635 4 - - 5 -
Sales of
Products
Sales
of assets Royalties
Operating
leases
Other
operations
Rendering
of services

T O D ’ S S . p . A .
2 0 1 7 A n n u a l R e p o r t
2 5 1 Notes to the Separate Financial Statements
i i. Commercial transactions with related parties – Costs
euro 000's
Year 2017
Parent Company (*) 275 271 3,786 252
Directors
Executives with strat. resp.
Other related parties
Total 275 271 - - 3,786 252
Year 2016
Parent Company (*) 272 435 3,740 192
Directors
Executives with strat. resp.
Other related parties
Total 272 435 - - 3,740 192
Operating
leases
Purchases
of products
Rendering
of services Royalties
Other
operations
Purchases
of assets
( * ) Companies directly or indirectly controlled by Chairman of the Board of Directors Diego Della Valle
i i i. Commercial transactions with related parties – Receivables and payables
euro 000's Receivables Payables Receivables Payables
Parent Company (*) 2,001 550 2,095 252
DirectorsExecutives with strat. resp.
Exec. with strat. respons.
Total 2,001 550 2,095 252
12.31.17 12.31.16
( * ) Companies directly or indirectly controlled by Chairman of the Board of Directors Diego Della Valle
Due to the fact that the above mentioned amounts are not significant, the disclosure hasn’t been
provided separately in the face of the financial statements in accordance with CONSOB resolution
n. 155519 of July 27t h
, 2006.
Compensation of Directors, Statutory Auditors , and General Managers
The following table il lustrates the compensation accrued in fiscal 2017 by each of the Directors,
Statutory Auditors, Executives with Strategic Responsibilities of TOD’S S.p.A. ( including for the
activities that they performed at sub sidiaries) for any reason and in any form:

T O D ’ S S . p . A .
2 0 1 7 A n n u a l R e p o r t
2 5 2 Notes to the Separate Financial Statements
euro 000's
Compensation
for office
Compensat.
for part. in
Commit.
Non cash
benefits
Bonus and
other
incentives
Compens.
as employ.
Other
compens.
Directors
Diego Della Valle (*) 1,832.1 8.7
Andrea Della Valle (**) 1,232.1 8.7
Luigi Abete 31.8 7.8
Maurizio Boscarato 32.1 9.3 220.0 (2)
Luigi Cambri 32.1 9.3 9.0 (4)
Sveva Dalmasso 32.1 7.8
Emanuele Della Valle 30.6
Romina Guglielmetti 32.1 17.4
Emilio Macellari (****) 247.1 8.7 480.0 (2)
Vincenzo Manes 32.1 15.9
Cinzia Oglio 32.1 2.9 28.8 147.7
Pierfrancesco Saviotti 31.5 7.5
Michele Scannavini 32.1
Stefano Sincini (***) 448.1 8.7 3.9 516.2 111.0 (1)
Total 4,078.0 109.8 6.7 28.8 663.9 820.0
Statutory Auditors
Giulia Pusterla (*****) 90.0
Enrico Colombo 60.0 58.5 (3) (4)
Fabrizio Redaelli 60.0
Total 210.0 58.5
Executives with strategic responsibilities (******) 7.0 63.0 972.2 126.0 (1)
Legend ( * ) Chairman of Board of Directors ( 1 ) Director of subsidiary ( * * ) Vice Chairman of Board of Directors ( 2 ) Consultant TOD’S S.p.A. ( * * * ) Chief Executive Officer ( 3 ) Statutory Auditor of subsidiary ( * * * *) Member of Executive Committee ( 4 ) Member of Compliance Program Supervisory Board ( * * * ** ) Chairman of the Statutory Board ( * * * ** * ) Includes General Directors salaries limited to compensation for the employment relationship. ____________________________________________
The table above does not include the indemnities for termination of the office as a Director and
for the employment relationship of the Chief Executive Officer and General Manager Stefano
Sincini for which reference is made to the press release published on the website
www.todsgroup.com on March 13t h
, 2018.
No severance indemnity is provided for Directors and Executives with Strategic Responsibilities.
Intercompany transactions
TOD’S S.p.A. has commercial and financial relati onships with the companies in which it directly or
indirectly owns a controlling equity interest. The transactions executed with them substantially
involve the exchange of goods, provision of services and the provision of f inancial resources.
They involve ordinary operations and are settled on an arm’s length basis. The following table
shows the country breakdown of the value of commercial relationships with subsidiaries in 2017 :

T O D ’ S S . p . A .
2 0 1 7 A n n u a l R e p o r t
2 5 3 Notes to the Separate Financial Statements
Euro/000
N° Companies Receivables Payables
Net revenues /
(costs) Receivables Payables
Net revenues /
(costs)
Italy 5 21,791 14,645 34,767 16,485 18,547 32,953
Albania 1 352 (2,442) 160 (1,767)
Austria 1 3,193 4,199 998 2,703
France 3 4,897 3,191 10,284 7,466 1,496 14,158
Germany 1 2,909 536 9,686 3,788 555 9,546
Great Britain 4 7,000 397 20,185 5,300 312 16,384
Denmark 1 123 1 254 146 7 287
Netherlands 2 1,533 305 5,625 1,331 12 5,519
Switzerland 2 3,272 11 9,982 3,503 17 11,558
Spain 1 1,215 74 5,132 772 55 4,046
Hungary 1 - 570 (1,353) 3 726 (1,263)
Belgium 1 207 19 487 62 6 369
Usa 13 8,983 1,982 17,465 8,440 2,220 23,253
Japan 2 172 5 649 187 364 375
Hong Kong 2 18,051 1,044 58,984 16,562 1,664 72,857
Singapore 2 13 5 78 29 1 82
Korea 2 8,235 21 20,704 9,112 184 22,893
Macao 2 14 74 11 70
China 2 22,458 2,421 45,186 24,919 7,312 26,262
Brazil 1 - - 103 85 616 35
India 1 154 5 28 125 4 29
Total 50 104,222 25,584 240,076 99,324 34,260 240,351
12.31.17 12.31.16
The receivables and payables recognised by the Italian companies include the receivables and
payables resulting from the tax consolidation programme, totalling 2 thousand euros and 4,031
thousand euros, respectively.
Following below are the details of the financial and capital transactions :
euro 000's
12.31.17 12.31.16
ROGER VIVIER S.p.A. 9,000 45,000
Total 9,000 45,000
Financing
Other current financial assets are related to a loan granted to subsidiary Roger Vivier S.p.A.,
partially reimbursed in advance on January 2017 (for 13 million euros) and on December 2017 (for
23 million euros). The loan was renewed, only for the outstanding amount, for an additional year ,
expiring on January 27th
, 2019 and accrues interest at arm’s length.

T O D ’ S S . p . A .
2 0 1 7 A n n u a l R e p o r t
2 5 4 Notes to the Separate Financial Statements
29. Events and significant non-recurring transactions
Pursuant to Consob Communication No. DEM/6064293 of July 28t h
, 2006, the Company did not
carry out any significant non-recurring operations in 2017.
30. Independent Auditors compensation
Pursuant to Article 149-duodecies of the Issuers Regulation, the compensation received in FY
2017 by the independent auditor PricewaterhouseCoopers S.p.A. and the companies belonging to
its network are il lustrated below, as broken down into auditing services and the provision of
other services:
Type of service Company Receiver Fees euro's 000
Auditing services PricewaterhouseCoopers S.p.A. TOD'S S.p.A. 151
Other services PricewaterhouseCoopers S.p.A. TOD'S S.p.A. 23
Auditing services PricewaterhouseCoopers S.p.A. Subsidiaries 33
Total PricewaterhouseCoopers S.p.A. 206
Auditing services PricewaterhouseCoopers (Network) Subsidiaries 162
Other services PricewaterhouseCoopers (Network) TOD'S S.p.A. 41
Other services PricewaterhouseCoopers (Network) Subsidiaries 118
Total PricewaterhouseCoopers Network 321
31. Items or transactions resulting from unusual and/or exceptional transactions
There were no items or transactions resulting from unusual and/or exceptional trans actions
during the year.
32. Significant events occurring after the end of the fiscal year
In order to raise liquid funds necessary to finance any possible requirements arising from core
commercial operations and general business needs, the Company entered in to two loan
agreements with two major banks after the reporting date. On January 26t h
, 2018 a loan
agreement was entered into with Banco BPM S.p.A., which granted a 4 -year revolving credit
facil ity, in a maximum amount of 100 mill ion euros, which had not y et been used at the reporting
date. On January 29t h
, 2018 a loan agreement was entered into with Intesa Sanpaolo S.p.A., in an
amount of 100 mill ion euros, which bears no charges and interest, to be repaid in a single
instalment on January 29t h
, 2019.
T O D ’ S S . p . A .
2 0 1 7 A n n u a l R e p o r t
2 5 5 Notes to the Separate Financial Statements
33. Certification of the Separate Financial Statements of TOD’S S.p.A. and the Consolidated
Financial Statements of the TOD’S Group pursuant to Article 81 -ter of Consob
Regulation no. 11971 of May 14t h
, 1999, as amended
1. The undersigned Stefano Sincini, Chi ef Executive Officer of TOD’S S.p.A., and Rodolfo Ubaldi,
manager responsible for the drawing up of the financial reports of TOD’S S.p.A., certify, in
accordance with the provisions of Article 154 -bis, subsections 3 and 4, of Legislative Decree no.
58 of February 24t h
, 1998:
• the adequacy in terms of the company’s characteristics and
• effective application
of administrative and accounting procedures for preparation of the Separate Financial
Statements and Consolidated Financial Statements during the per iod January 1s t
, 2017 to
December 31s t
, 2017.
2. They also certify that the Separate Financial Statements and Consolidated Financial
Statements:
a) have been prepared in compliance with the International Financial Reporting Standards
recognised in the European Union pursuant to Regulation EC 1606/2002 of the European
Parliament and Council of July 19t h
2002;
b) correspond with the account books and ledger entries;
c) give a true and fair view of the assets, l iabilities, income and financial position of the issuer
and entities included in the scope of consolidation.
3. Report on operations provides a reliable analysis of the issuer’s operating performance and
income, as well as the financial position of the issuer and all the businesses included in the scop e
of consolidation, together with a description of the principal risks and uncertainties to which
they are exposed.
Milan, March 13t h
, 2018
Stefano Sincini Rodolfo Ubaldi Chief Executive Officer Manager responsible for the drawing up of the financial reports

Independent auditor's report
s.p.a.

Independent auditor’s report in accordance with article 14 of Legislative Decree No. 39 of 27 January 2010 and article 10 of Regulation (EU) No. 537/2014
To the shareholders of TOD’S SpA
Report on the Audit of the Financial Statements Opinion We have audited the financial statements of TOD’S SpA (the “Company”), which comprise the statement of financial position as of 31 December 2017, the income statement, the statement of comprehensive income, the statement of changes in equity and the statement of cash flows for the year then ended, and notes to the financial statements, including a summary of significant accounting policies. In our opinion, the financial statements give a true and fair view of the financial position of the Company as of 31 December 2017, and of the result of its operations and cash flows for the year then ended in accordance with International Financial Reporting Standards as adopted by the European Union, as well as with the regulations issued to implement article 9 of Legislative Decree No. 38/05. Basis for Opinion We conducted our audit in accordance with International Standards on Auditing (ISA Italia). Our responsibilities under those standards are further described in the Auditor’s Responsibilities for the Audit of the Financial Statements section of this report. We are independent of the Company pursuant to the regulations and standards on ethics and independence applicable to audits of financial statements under Italian law. We believe that the audit evidence we have obtained is sufficient and appropriate to provide a basis for our opinion. Key Audit Matters Key audit matters are those matters that, in our professional judgment, were of most significance in our audit of the financial statements of the current period. These matters were addressed in the context of our audit of the financial statements as a whole, and in forming our opinion thereon, and we do not provide a separate opinion on these matters.

2 of 6
Key Audit Matters Auditing procedures performed in response to key audit matters
Allowance for inventory write-downs (See note 12 to the separate financial statements)
Final inventories of raw materials, semi-finished and finished products, amounting to Euro 164 million at 31 December 2017 (about 12 per cent of total assets), are carried net of an allowance for inventory write-downs of Euro 47 million, which is about 22 per cent of the value of final inventories.
The allowance for inventory write-downs is estimated with reference to raw materials on the basis of their possibility of use within the production process and as regards finished products based on the ageing of collections in stock and their foreseeable usage through the TOD’S Group distribution channels. We focused on the allowance for inventory write-downs taking account of its relevance in absolute terms and the complexity of the estimates performed by TOD’S management to evaluate it.
We obtained the calculation of the allowance for inventory write-downs prepared by the management of TOD’S and we verified its mathematical accuracy.
In relation to raw materials, we evaluated the adequacy of the allowance by checking the adequacy of the write-down percentages used by the Company that we compared for consistency with those of the previous years, with historical data and products scrapped in the year, as well as by performing analysis targeted on no- or slow-moving raw material categories.
With reference to finished products we evaluated the adequacy of the allowance by verifying the adequacy of the write-down percentages used by the Company on unsold items referred to one season/collection, checking the consistency of these percentages with the previous years, analysing the historical sale trend of non-current collections over the TOD’S Group distribution channels and the products scrapped in the year, as well as by verifying the adequacy throughout the years of the amount of the inventory write-down allowance initially accrued in relation to each season/collection.
In order to ascertain whether additional write-downs needed to be made, we also carried out analyses on the sales with negative margins realised in the subsequent year.

3 of 6
Key Audit Matters Auditing procedures performed in response to key audit matters
Equity investment in Roger Vivier (See note no.9 to the separate financial statements) The investment in Roger Vivier SpA, fully owned by TOD’S SpA, is recorded in the separate financial statements as at 31 December 2017 at the historical cost of Euro 415 million, accounting for about 31 per cent of total assets. The investment is valued at historical cost and tested for impairment, i.e. a testing aimed to verify if the recoverable amount is higher than its carrying amount, when impairment indicators exist. Specifically, in order to identify any impairment indicator, the Company verified that the impairment test performed in the financial statements of Roger Vivier SpA at 31 December 2017 on the Roger Vivier brand, recognised for Euro 415 million, did not highlight the need to make any write-downs. We focused our attention on the investment in Roger Vivier SpA because it consists of a significant amount, its valuation process is complex and it requires a high degree of professional judgement, since the recoverability of its value is closely connected with that of the Roger Vivier brand.
We verified if any impairment indicators existed in relation to the investment in Roger Vivier SpA by reviewing the results of the impairment test performed on the Roger Vivier brand by TOD’S management. Within this context, we verified the reasonableness of the Roger Vivier 2018 budget and the additional projections for the explicit period of the impairment test, as well as the reasonableness of the underlying key assumptions. In particular, we focused our attention on the reasonability of the increase in revenue checking its consistency with the historical growth trend of revenue. We also evaluated the reliability of the projections made by management, verifying that the 2017 budget had been achieved and analysing the actual data in the first two months of 2018. Finally, we verified, with the support of PwC network experts in evaluations, the consistency of the impairment model adopted by the Company with the standard evaluation practice, as well as the adequacy of the key assumptions used by management and the accuracy of the calculations.
Responsibilities of Management and Those Charged with Governance for the Financial Statements Management is responsible for the preparation of the financial statements that give a true and fair view in accordance with International Financial Reporting Standards as adopted by the European Union, as well as with the regulations issued to implement article 9 of Legislative Decree No. 38/05 and, in the terms prescribed by law, for such internal control as management determines is necessary to enable the preparation of financial statements that are free from material misstatement, whether due to fraud or error.

4 of 6
Management is responsible for assessing the Company’s ability to continue as a going concern and, in preparing the financial statements, for the appropriate application of the going concern basis of accounting, and for disclosing matters related to going concern. In preparing the financial statements, management uses the going concern basis of accounting unless management either intends to liquidate the Company or to cease operations, or has no realistic alternative but to do so. Those charged with governance are responsible for overseeing, in the terms prescribed by law, the Company’s financial reporting process. Auditor’s Responsibilities for the Audit of the Financial Statements Our objectives are to obtain reasonable assurance about whether the financial statements as a whole are free from material misstatement, whether due to fraud or error, and to issue an auditors’ report that includes our opinion. Reasonable assurance is a high level of assurance but is not a guarantee that an audit conducted in accordance with International Standards on Auditing (ISA Italia) will always detect a material misstatement when it exists. Misstatements can arise from fraud or error and are considered material if, individually or in the aggregate, they could reasonably be expected to influence the economic decisions of users taken on the basis of the financial statements. As part of an audit conducted in accordance with International Standards on Auditing (ISA Italia), we exercised our professional judgement and maintained professional scepticism throughout the audit. Furthermore: We identified and assessed the risks of material misstatement of the financial statements,
whether due to fraud or error; we designed and performed audit procedures responsive to those risks; we obtained audit evidence that is sufficient and appropriate to provide a basis for our opinion. The risk of not detecting a material misstatement resulting from fraud is higher than for one resulting from error, as fraud may involve collusion, forgery, intentional omissions, misrepresentations, or the override of internal control;
We obtained an understanding of internal control relevant to the audit in order to design audit procedures that are appropriate in the circumstances, but not for the purpose of expressing an opinion on the effectiveness of the Company’s internal control;
We evaluated the appropriateness of accounting policies used and the reasonableness of accounting estimates and related disclosures made by management;
We concluded on the appropriateness of management’s use of the going concern basis of accounting and, based on the audit evidence obtained, whether a material uncertainty exists related to events or conditions that may cast significant doubt on the Company’s ability to continue as a going concern. If we conclude that a material uncertainty exists, we are required to draw attention in our auditor’s report to the related disclosures in the financial statements or, if such disclosures are inadequate, to modify our opinion. Our conclusions are based on the audit evidence obtained up to the date of our auditor’s report. However, future events or conditions may cause the Company to cease to continue as a going concern;
We evaluated the overall presentation, structure and content of the financial statements, including the disclosures, and whether the financial statements represent the underlying transactions and events in a manner that achieves fair presentation.

5 of 6
We communicated with those charged with governance, identified at an appropriate level as required by ISA Italia, regarding, among other matters, the planned scope and timing of the audit and significant audit findings, including any significant deficiencies in internal control that we identified during our audit. We also provided those charged with governance with a statement that we complied with the regulations and standards on ethics and independence applicable under Italian law and communicated with them all relationships and other matters that may reasonably be thought to bear on our independence, and where applicable, related safeguards. From the matters communicated with those charged with governance, we determined those matters that were of most significance in the audit of the financial statements of the current period and are therefore the key audit matters. We described these matters in our auditor’s report. Additional Disclosures required by Article 10 of Regulation (EU) No 537/2014 On 19 April 2012, the shareholders of TOD’S SpA in general meeting engaged us to perform the statutory audit of the Company’s and consolidated financial statements for the years ending 31 December 2012 to 31 December 2020. We declare that we did not provide any prohibited non-audit services referred to in article 5, paragraph 1, of Regulation (EU) No. 537/2014 and that we remained independent of the Company in conducting the statutory audit. We confirm that the opinion on the financial statements expressed in this report is consistent with the additional report to those charged with governance, in their capacity as audit committee, prepared pursuant to article 11 of the aforementioned Regulation. Report on Compliance with other Laws and Regulations Opinion in accordance with Article 14, paragraph 2, letter e), of Legislative Decree No. 39/10 and Article 123-bis, paragraph 4, of Legislative Decree No. 58/98 Management of TOD’S SpA is responsible for preparing a report on operations and a report on the corporate governance and ownership structure of TOD’S SpA as of 31 December 2017, including their consistency with the relevant financial statements and their compliance with the law. We have performed the procedures required under auditing standard (SA Italia) No. 720B in order to express an opinion on the consistency of the report on operations and of the specific information included in the report on corporate governance and ownership structure referred to in article 123-bis, paragraph 4, of Legislative Decree No. 58/98, with the financial statements of TOD’S SpA as of 31 December 2017 and on their compliance with the law, as well as to issue a statement on material misstatements, if any.

6 of 6
In our opinion, the report on operations and the specific information included in the report on corporate governance and ownership structure mentioned above are consistent with the financial statements of TOD’S SpA as of 31 December 2017 and are prepared in compliance with the law. With reference to the statement referred to in article 14, paragraph 2, letter e), of Legislative Decree No. 39/10, issued on the basis of our knowledge and understanding of the Company and its environment obtained in the course of the audit, we have nothing to report. Bologna, 29 March 2018 PricewaterhouseCoopers SpA signed by Edoardo Orlandoni (Partner) This report has been translated into English from the original, which was issued in Italian language, solely for the convenience of international readers.