2017 ANNUAL REPORT - norbord.com€¦ · 2 NORBORD 2017 ANNUAL REPORT 2017 was a record year for...
82
2017 ANNUAL REPORT
Transcript of 2017 ANNUAL REPORT - norbord.com€¦ · 2 NORBORD 2017 ANNUAL REPORT 2017 was a record year for...
2017 ANNUALREPORT
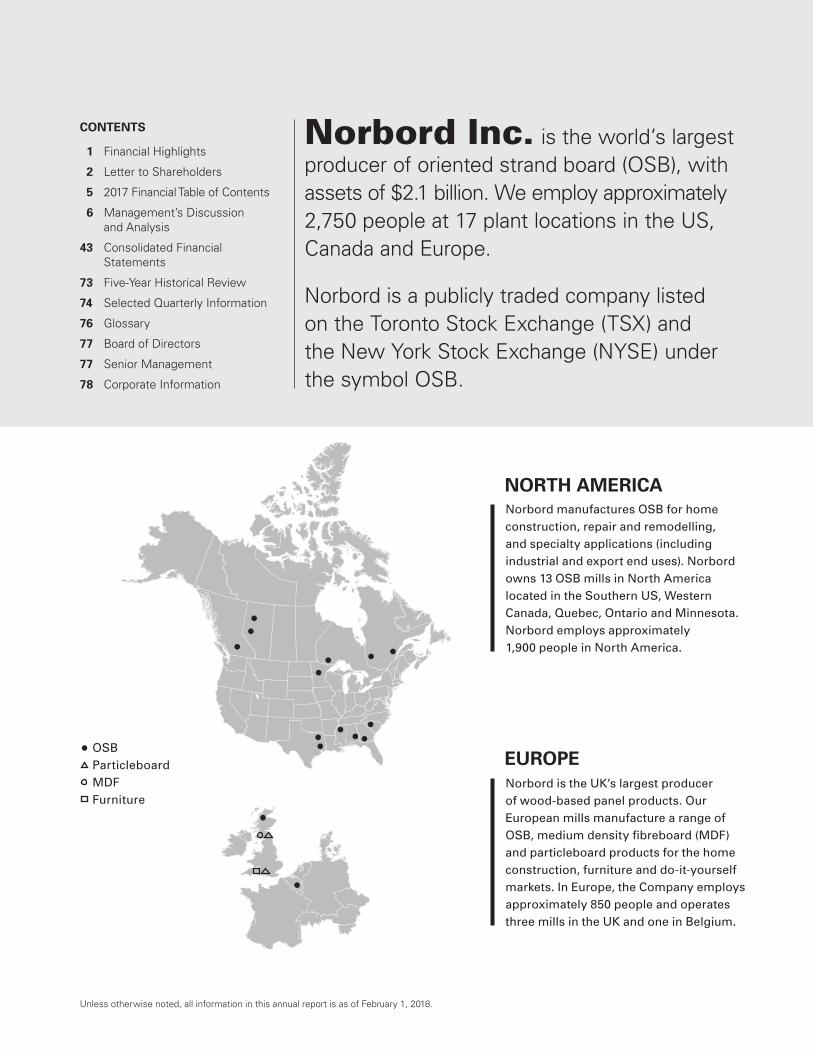
Norbord is the UK’s largest producer of wood-based panel products. Our European mills manufacture a range of OSB, medium density fibreboard (MDF) and particleboard products for the home construction, furniture and do-it-yourself markets. In Europe, the Company employs approximately 850 people and operates three mills in the UK and one in Belgium.
Norbord manufactures OSB for home construction, repair and remodelling, and specialty applications (including industrial and export end uses). Norbord owns 13 OSB mills in North America located in the Southern US, Western Canada, Quebec, Ontario and Minnesota. Norbord employs approximately 1,900 people in North America.
NORTH AMERICA
EUROPE
Unless otherwise noted, all information in this annual report is as of February 1, 2018.
CONTENTS
1 Financial Highlights
2 Letter to Shareholders
5 2017 Financial Table of Contents
6 Management’s Discussion and Analysis
43 Consolidated Financial Statements
73 Five-Year Historical Review
74 Selected Quarterly Information
76 Glossary
77 Board of Directors
77 Senior Management
78 Corporate Information
Norbord Inc. is the world’s largest producer of oriented strand board (OSB), with assets of $2.1 billion. We employ approximately 2,750 people at 17 plant locations in the US, Canada and Europe.
Norbord is a publicly traded company listed on the Toronto Stock Exchange (TSX) and the New York Stock Exchange (NYSE) under the symbol OSB.
OSBParticleboardMDFFurniture

NORBORD 2017 ANNUAL REPORT 1
Financial HighlightsYears ended December 31(US $ millions, except per share information, unless otherwise noted) 2017 2016 2015
SALES AND EARNINGS
Sales 2,177 1,766 1,509
Operating income 549 280 31
Adjusted EBITDA(1) 672 385 125
Earnings (loss) 436 183 (56)
Adjusted earnings (loss)(1) 389 174 (12)
PER COMMON SHARE EARNINGS
Earnings (loss), basic(2) 5.06 2.14 (0.66)
Adjusted earnings (loss), basic(1,3) 4.51 2.03 (0.14)
Dividends declared(4) 1.50 0.40 0.70
BALANCE SHEET
Total assets 2,103 1,799 1,633
Long-term debt(5) 548 746 745
Net debt for financial covenant purposes(1) 333 619 751
Net debt to capitalization, market basis(1) 11% 25% 32%
Net debt to capitalization, book basis(1) 21% 41% 51%
KEY STATISTICS
Shipments (MMsf– 3/8")North America 6,066 5,888 5,497
Europe 1,867 1,779 1,740
Indicative average OSB priceNorth Central ($/Msf–7/16") 353 269 209
South East ($/Msf–7/16") 330 245 187
Western Canada ($/Msf–7/16") 326 234 169
Europe (€/m3)(6) 239 233 224
KEY PERFORMANCE METRICS
Return on capital employed (ROCE)(1) 45% 27% 9%
Return on equity (ROE)(1) 47% 30% (2)%
Cash provided by operating activities 608 313 24
Cash provided by operating activities per share(1) 7.05 3.66 0.28
Stock price (TSX) (C $)
High 51.75 35.67 29.07
Low 31.38 19.90 19.14
Close 42.55 33.91 26.95
Average daily stock TSX trading volume (in thousands) 233 177 222
Average daily stock NYSE trading volume (in thousands)(7) 46 12 —(1) Non-IFRS measure; see the Non-IFRS Financial Measures section on page 37.(2) Basic and diluted earnings (loss) per share are the same except diluted earnings per share for 2017 is $5.03 and 2016 is $2.13.(3) Basic and diluted Adjusted earnings (loss) per share are the same except diluted Adjusted earnings per share for 2017 is $4.49 and 2016 is $2.02.(4) Dividends declared per share stated in Canadian dollars.(5) Includes current and non-current long-term debt. (6) European indicative average OSB price represents the gross delivered price to the largest continental market.(7) Norbord listed its shares on NYSE effective February 19, 2016.
2 NORBORD 2017 ANNUAL REPORT
2017 was a record year for Norbord. Our full-year Adjusted EBITDA of $672 million was a 75% improvement over our 2016 result. Our success last year was a function of solid operational performance and ongoing growth in OSB demand which resulted in strong markets in both North America and Europe.
During the year, we continued to invest in our mills to ensure we will be able to
meet our growing customer demand, permanently paid down long-term debt
and increased our quarterly dividend three times. Our strong performance was
reflected in our share price, with our stock trading approximately 25% higher
year-over-year.
2017 IN REVIEW: DELIVERING ON OUR STRATEGYAgainst a backdrop of strong OSB demand, we remained focused on the
efficient operation of our mills and continued to allocate capital according to
our priorities of reinvesting in the business, optimizing our capital structure and
returning cash to shareholders.
Production – We increased total production volume by 4%, with annual records
at nine of our 15 operating mills.
Costs – Although manufacturing costs this year were negatively impacted by
higher resin costs, the start of production at our expanded Inverness, Scotland
mill and the restart of our curtailed Huguley, Alabama mill, Norbord remains the
industry cost leader.
Growth – We invested more than $250 million in our mills, including the
completion of two significant capital projects at Inverness and Huguley that
each produced first board in September. Once fully ramped up, this additional
capacity will help us meet growing customer demand in both of our core
geographies. Building on the flexibility of our three continuous presses, we also
made progress on our North American specialty products strategy. Our specialty
product shipments increased 17%, including a 22% increase in exports to Asia
and the commercialization of several new products. I’m pleased to report that all
our incremental volume this year went into non-commodity product sales.
Balance Sheet – We significantly reduced our financial leverage in 2017,
permanently paying down $200 million in long-term debt and reducing our net
debt to capitalization ratio from 41% to 21%. We added more than $80 million
in cash to the balance sheet, even after our substantial debt repayment, capital
investments and dividend payments.
To Our Shareholders
NORBORD 2017 ANNUAL REPORT 3
Shareholder Value – The quarterly dividend was increased
three times during the year to C $0.60 per share, paying
out a total of $101 million in 2017 and providing a 5% yield
on our current share price.
We were also happy to see improved safety performance
across our mill portfolio. In 2017, we matched our best-
ever safety result (as measured by recordable injuries)
with an Occupational Safety and Health Administration
rate of 0.74. We believe that safety performance is an
indicator of operational effectiveness and are pleased
that our employees have demonstrated a commitment to
safety while improving mill productivity and delivering on
our two significant strategic capital projects at Inverness
and Huguley.
Our excellent year was the result of strong performance in
both of our key markets. In North America, benchmark OSB
prices increased 31% year-over-year and reached multi-year
highs on the strength of continued economic growth and
solid market fundamentals. US housing starts, the largest
single end use of OSB, increased 3% over last year to
1.2 million, with the pace of the single-family component
reaching its highest level in six years. We also saw
significant growth in our specialty products sales volumes,
a key component of our long-term diversification strategy.
Our specialty sales, which include industrial and export,
now represent the equivalent of three mills’ worth of
annual production at Norbord. These are encouraging steps
forward as part of our long-term goal to have specialty
products represent 50% of our North American volume.
In Europe, our panel business delivered record panel sales
volume. We also saw strong price momentum for all our
panel products across our core markets, supported by
ongoing demand growth and currency-aided substitution
of OSB for plywood, which offset higher input costs,
particularly resin. OSB substitution continues to accelerate
in Europe, with its share of the structural panel market
increasing from approximately 30% a decade ago to almost
50% today. Full-year European Adjusted EBITDA was in line
with 2016 and continues to provide valuable stability to our
company-wide earnings.
LOOKING AHEAD: MAINTAINING MOMENTUM IN 2018We expect 2018 to be another strong year for Norbord,
building on the outstanding results in 2017. The
fundamentals in our key markets remain favourable and
we look forward to further growth from all segments of
our business. We continue to invest in our mills so that we
are well positioned to benefit from increasing near-term
demand while also pursuing our longer-term objective
to reduce earnings volatility by growing our specialty
product volumes.
In North America, US housing starts are expected to
increase by approximately 7%, led by continued strength
in the single-family component as millennials are now
becoming first-time home buyers. Combined with further
growth in other OSB end uses and limited volumes
expected from capacity restarts in ramp-up mode, we
believe that the industry demand-to-capacity ratio will
remain firm.
We also expect our European business to have an excellent
year. While production from our expanded Inverness mill
will not increase markedly from 2017 as we shift from the
old lines to the new, we believe we will see further price
momentum in 2018. Looking ahead to 2019 and beyond,
the additional capacity at Inverness will position us to
benefit from ongoing demand growth and the trend of
OSB substitution for plywood.
“ We expect 2018 to be another strong year for Norbord, building on the outstanding results in 2017. The fundamentals in our key markets remain favourable and we look forward to further growth from all segments of our business.”

4 NORBORD 2017 ANNUAL REPORT
For a number of years, we have focused our strategy
to ensure we are positioned to benefit from increasing
OSB demand, and are pleased to see solid results from
this strategy in the past year. As we look ahead at the
continuing strong demand forecast, we are optimistic about
our ability to generate robust results for our shareholders.
We will continue to reinvest in our mills in 2018. We have
plans for $175 million in capital investments which include
a range of upgrades to enable us to continue improving
mill productivity, reduce manufacturing costs and expand
production of specialty products. The budget also includes
higher maintenance investments to ensure our mills
can operate reliably in the current high OSB demand
environment. The preliminary engineering work at our
Chambord, Quebec mill is progressing and we expect to
begin investing in certain long lead-time items to prepare
it for an eventual restart. A restart decision has not yet
been made and, similar to our approach at Huguley, we
will continue to evaluate the timing of a comprehensive
investment at Chambord based on demand from our
key customers.
We are also committed to having a more flexible balance
sheet this cycle. We’ve already made significant progress
in the past year and our next opportunity to significantly
reduce debt will be our $240 million bond maturity in 2020.
Finally, we remain committed to returning excess cash to
shareholders. To-date, we have accomplished this through
our variable dividend policy and continue to evaluate all
other options.
In closing, I would like to recognize Mike Dawson who
retired as Senior Vice President of Sales, Marketing and
Logistics at the end of January. Mike spent 27 years with
Norbord and made a number of lasting contributions to our
company and our relationships with customers. On behalf
of everyone at Norbord, I would like to thank Mike for his
service and wish him well for the future. I would also like to
welcome Bruce Alexander as Mike’s successor. Bruce is a
seasoned executive with over 25 years of experience in the
wood products industry, having worked in various corporate
development, operations management, and sales and
marketing roles. We are pleased to have Bruce on our team
and are confident he will maintain Norbord’s reputation for
best-in-class customer service.
Thank you for your continuing support of Norbord.
Peter Wijnbergen President and Chief Executive Officer
This letter includes forward-looking statements, as defined by applicable securities legislation, including statements related to our strategy, projects, plans, future financial or operating performance, market outlook, and other statements that express management’s expectations or estimates of future performance. Often, but not always, forward-looking statements can be identified by the use of words such as “expect,” “suggest,” “support,” “believe,” “should,” “potential,” “likely,” “continue,” “forecast,” “plan,” “indicate,” “consider,” “future,” or variations of such words and phrases or statements that certain actions “may,” “could,” “must,” “would,” “might,” or “will” be undertaken, occur or be achieved. Forward-looking statements involve known and unknown risks, uncertainties and other factors that may cause the actual results, performance or achievements of Norbord to be materially different from any future results, performance or achievements expressed or implied by the forward-looking statements. See the cautionary language in the Forward-Looking Statements section of the 2017 Management’s Discussion and Analysis dated February 1, 2018 on page 42.
See the Non-IFRS Financial Measures on page 37.
NORBORD 2017 ANNUAL REPORT 5
2017 Financial Table of ContentsMANAGEMENT’S DISCUSSION AND ANALYSIS
Introduction 6
Business Overview 7
Merger with Ainsworth 8
Strategy 8
Summary 10
2016 Comparison Against 2015 12
Outlook for 2018 13
Results of Operations 13
Finance Costs, Depreciation and Amortization,
and Income Tax 17
Liquidity and Capital Resources 18
Investments 20
Capitalization 21
Transactions with Related Parties 23
Selected Quarterly Information 24
Fourth Quarter Results 27
Financial Policies 29
Changes in Accounting Policies 30
Future Changes in Accounting Policies 30
Significant Accounting Policies, Judgements
and Estimates 31
Risks and Uncertainties 33
Assessment of and Changes in Internal Controls and
Disclosure Controls over Financial Reporting 37
Non-IFRS Financial Measures 37
Forward-Looking Statements 42
CONSOLIDATED FINANCIAL STATEMENTS
Management’s Responsibility for the
Financial Statements 43
Independent Auditors’ Report 44
Management’s Report on Internal Control over
Financial Statements 45
Independent Auditors’ Report on Internal Control 46
Consolidated Balance Sheets 47
Consolidated Statements of Earnings 48
Consolidated Statements of Comprehensive Income 48
Consolidated Statements of Changes in
Shareholders’ Equity 49
Consolidated Statements of Cash Flows 50
Notes to the Consolidated Financial Statements 51

6 NORBORD 2017 ANNUAL REPORT
FEBRUARY 1, 2018
Management’s Discussion and Analysis
INTRODUCTION This Management’s Discussion and Analysis (MD&A) provides a review of the significant developments that impacted Norbord’s performance during 2017 relative to 2016. The information in this section should be read in conjunction with the audited consolidated financial statements as at and for the years ended December 31, 2017 and 2016.
In this MD&A, “Norbord” or “the Company” means Norbord Inc. and all of its consolidated subsidiaries and affiliates, unless the context implies otherwise. “Brookfield” means Brookfield Asset Management Inc. or any of its consolidated subsidiaries and affiliates, a related party by virtue of holding a significant equity interest in the Company.
Additional information on Norbord, including the Company’s annual information form and other documents publicly filed by the Company, is available on the Company’s website at www.norbord.com, the System for Electronic Document Analysis and Retrieval (SEDAR) administered by the Canadian Securities Administrators (the CSA) at www.sedar.com and on the Electronic Data Gathering, Analysis and Retrieval System (EDGAR) section of the US Securities and Exchange Commission (the SEC) website at www.sec.gov/edgar.shtml.
Some of the statements included or incorporated by reference in this MD&A constitute forward-looking statements within the meaning of applicable securities legislation. Forward-looking statements are based on various assumptions and are subject to various risks. See the cautionary statement contained in the Forward-Looking Statements section.
The Company has prepared this MD&A with reference to National Instrument 51-102 – Continuous Disclosure Obligations of the CSA. The Company is an eligible issuer under the Multijurisdictional Disclosure System (MJDS) and complies with the US reporting requirements by filing its Canadian disclosure documents with the SEC. As an MJDS issuer, the Company is permitted to prepare this MD&A in accordance with the disclosure requirements of the CSA, whose requirements are different from those of the SEC.
To enhance shareholders’ understanding, certain three-year historical financial and statistical information is presented. Norbord’s significant accounting policies and other financial disclosures are contained in the audited financial statements and accompanying notes. All financial references in the MD&A are stated in US dollars unless otherwise noted.
In evaluating the Company’s business, management uses non-International Financial Reporting Standards (IFRS) financial measures which, in management’s view, are important supplemental measures of the Company’s performance and believes that they are frequently used by investors, securities analysts and other interested persons in the evaluation of Norbord and other similar companies. In this MD&A, the following non-IFRS financial measures have been used: Adjusted EBITDA, Adjusted earnings (loss), Adjusted earnings (loss) per share, cash provided by operating activities per share, operating working capital, total working capital, capital employed, return on capital employed (ROCE), return on equity (ROE), net debt for financial covenant purposes, tangible net worth, net debt to capitalization, book basis, and net debt to capitalization, market basis. These non-IFRS financial measures are described in the Non-IFRS Financial Measures section. Non-IFRS financial measures do not have any standardized meaning prescribed by IFRS and are therefore unlikely to be comparable to similar measures presented by other companies that may have different financing and capital structures and/or tax rates. Where appropriate, a quantitative reconciliation of the non-IFRS financial measure to the most directly comparable IFRS measure is also provided. Certain prior period figures for Adjusted EBITDA and Adjusted earnings have been adjusted to conform to the revised definitions of these non-IFRS financial measures currently used by Norbord.

NORBORD 2017 ANNUAL REPORT 7
BUSINESS OVERVIEW Norbord is a leading global manufacturer of wood-based panels with 17 mills in the United States (US), Canada and Europe. Norbord is the largest global producer of oriented strand board (OSB) with annual capacity of 8.4 billion square feet (Bsf) (3⁄8-inch basis). In North America, Norbord owns 13 OSB mills located in the Southern region of the US, Western Canada, Quebec, Ontario and Minnesota. In Europe, the Company operates an OSB mill, two particleboard production facilities and one medium density fibreboard (MDF) production facility in the United Kingdom (UK) and one OSB mill in Belgium, and is the UK’s largest panel producer. The Company reports its operations in two geographic segments, North America and Europe, with 77% of its panel production capacity in North America and 23% in Europe. Norbord’s business strategy is focused entirely on the wood-based panels sector – in particular OSB – in North America, Europe and Asia. Norbord employed approximately 2,750 people at December 31, 2017.
The table below summarizes the estimated annual production capacity (installed capacity), in millions of square feet (MMsf) (3⁄8-inch basis), at year-end for each mill:
(MMsf–3/8")
Estimated Annual Capacity
at Year-End 2017
OSB 100 Mile House, British Columbia 440 Barwick, Ontario 510
Bemidji, Minnesota 470 Chambord, Quebec(1) 470 Cordele, Georgia 990 Genk, Belgium 450
Grande Prairie, Alberta 730 Guntown, Mississippi 450 High Level, Alberta 860
Huguley, Alabama(2) 500 Inverness, Scotland(3) 720 Jefferson, Texas 415
Joanna, South Carolina 650 La Sarre, Quebec 375 Nacogdoches, Texas 380
8,410
Particleboard Cowie, Scotland 405 South Molton, England 160
565
MDF Cowie, Scotland 380
380
Total Panels 9,355
(1) In November 2016, Norbord exchanged ownership of its Val-d’Or OSB mill for Louisiana-Pacific Corporation’s curtailed Chambord OSB mill (the Asset Exchange). Production at Chambord has been curtailed since the third quarter of 2008.
(2) In January 2009, Norbord indefinitely curtailed production at its Huguley, Alabama OSB mill. The mill subsequently resumed operations in October 2017. (3) During the fourth quarter of 2017, the estimated annual capacity increased from 395 MMsf–3/8" based on the substantial completion of the Inverness expansion project.

8 NORBORD 2017 ANNUAL REPORT
MERGER WITH AINSWORTH On March 31, 2015, Norbord completed its merger with Ainsworth Lumber Co. Ltd. (Ainsworth) (the Merger). The Merger created the largest global OSB producer and brought together Norbord’s manufacturing cost leadership with Ainsworth’s track record of innovation in product development. It also allows Norbord to better serve the Company’s North American customers as well as gain access to growing Asian markets.
In 2015, the Company elected not to account for the Merger as a business combination under IFRS 3, Business Combinations, as the transaction represents a combination of entities under common control of Brookfield. Accordingly, the book values of the two entities were combined and no adjustments were made to reflect fair values or to recognize any new assets or liabilities of either entity.
Post-Merger, Norbord and Ainsworth operate as a single company; this MD&A reviews the combined company’s performance for the years ended December 31, 2015, 2016 and 2017.
STRATEGY Norbord’s business strategy is focused entirely on the wood panels sector – in particular OSB – in North America and Europe. Norbord’s financial goal is to achieve top-quartile ROCE among North American forest products companies over the business cycle and the Company believes it has met this goal.
Protecting the balance sheet is an important element of Norbord’s financing strategy. Management believes that its record of superior operational performance, disciplined capital allocation and prudent balance sheet management will enable it to access public and private capital markets (subject to financial market conditions). In this regard, Norbord accomplished the following in 2017:
Financial Goal 2017 Accomplishments
1. Generate cash. • Achieved Adjusted EBITDA of $672 million and ROCE of 45%. • Increased North American Adjusted EBITDA to $638 million from $352 million in
2016, benefiting from 31% higher average North Central benchmark OSB prices during the year.
• European Adjusted EBITDA was steady at $41 million despite significantly higher resin prices and start-up of the new Inverness, Scotland line.
• Generated operating cash flow of $608 million, almost double from $313 million in 2016.
2. Protect the balance sheet. • Moody’s Investors Service upgraded the Company’s issuer credit rating from Ba2 to Ba1 and Standard & Poor’s Ratings Services upgraded from BB- to BB. DBRS confirmed at BB and upgraded its outlook from Negative to Stable.
• Ended the year with unutilized liquidity of $592 million (including $241 million in cash and cash equivalents), net debt to capitalization on a book basis of 21% and tangible net worth of $1,248 million.

NORBORD 2017 ANNUAL REPORT 9
The table below summarizes the six key components of Norbord’s business strategy and its performance in each area in 2017:
Strategic Priority 2017 Performance
1. Develop a world-class safety culture.
• Completed Occupational Safety and Health Administration (OSHA) recordable injury-free year at four mills (Genk, Belgium; Huguley, Alabama; Jefferson, Texas; and La Sarre, Quebec).
• Recertified Bemidji, Minnesota; Nacogdoches, Texas and Cowie, Scotland mills under Norbord’s Safety Star program.
• Achieved an overall OSHA injury rate of 0.74 for 2017, matching best-ever performance.
2. Pursue growth in OSB. • Increased production volume at North American OSB and European panel mills by 4% and 3%, respectively, over 2016.
• Set annual production records at nine of 15 operating mills: Bemidji, Minnesota; Cordele, Georgia; Grande Prairie, Alberta; High Level, Alberta; Jefferson, Texas; La Sarre, Quebec; Nacogdoches, Texas; Genk, Belgium and Cowie, Scotland.
• Substantially completed construction of European OSB capacity modernization and expansion in Inverness, Scotland in the fourth quarter of 2017. The new line started up in October 2017, with no disruption to existing production capacity.
• Restarted previously curtailed Huguley, Alabama mill in October 2017 to meet customer demand.
• Secured long-term wood supply and eight-year labour contract for curtailed Chambord, Quebec mill. Evaluating capital investment required to prepare mill for eventual restart when warranted by customer demand.
3. Own high-quality assets with low-cost positions.
• Completed fifth year of capital reinvestment strategy, focused on improving productivity and reducing manufacturing costs.
• North American and European panel cash production costs per unit (excluding mill profit share) increased by 5% and 11%, respectively, as improved productivity and raw material usage were more than offset by higher resin prices and the pre-operating costs at Huguley, Alabama and Inverness, Scotland.
4. Maintain a margin-focused operating culture.
• Generated $12 million in Margin Improvement Program (MIP) gains across the Company from improved productivity and lower raw material usage, despite offset from higher maintenance costs incurred to ensure mill production reliability in strong markets.
5. Focus on growth customers through best-in-class service and product development.
• Increased North American shipments by 3% with 17% growth in specialty products volume.
• Specialty products, which encompass industrial and export end uses, now represent 25% of total shipments, up from 22% in 2016.
• Increased European OSB shipments by 5% with key UK and German market volumes up by 7% and 4%, respectively.
6. Allocate capital with discipline.
• Invested $253 million in capital projects (including $101 million for Inverness expansion and $37 million for Huguley restart) to maintain the Company’s assets and high standards for environmental and safety performance, improve production efficiency and reduce manufacturing costs.
• Increased quarterly dividend three times (from C $0.10 to C $0.60) during the year and paid dividends of $101 million.
• Permanently repaid $200 million senior secured debt at maturity in February 2017.
10 NORBORD 2017 ANNUAL REPORT
SUMMARY
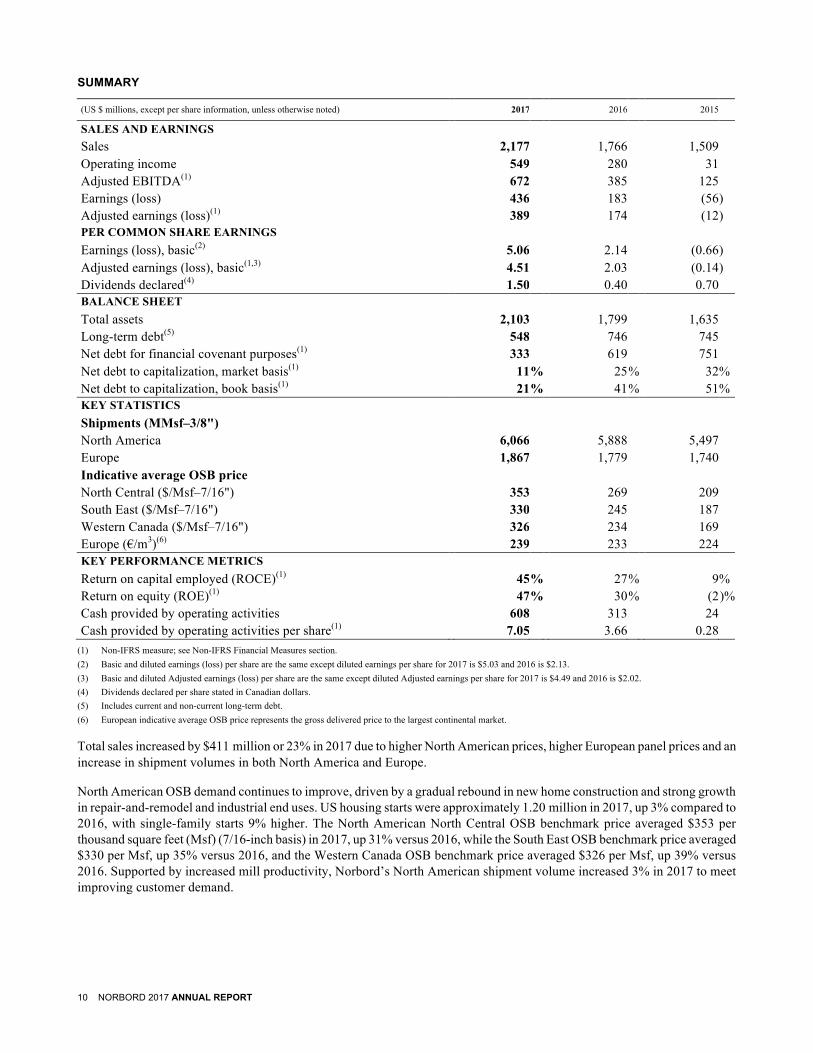
(US $ millions, except per share information, unless otherwise noted) 2017 2016 2015 SALES AND EARNINGS Sales 2,177 1,766 1,509 Operating income 549 280 31 Adjusted EBITDA(1) 672 385 125 Earnings (loss) 436 183 (56 ) Adjusted earnings (loss)(1) 389 174 (12 ) PER COMMON SHARE EARNINGS Earnings (loss), basic(2) 5.06 2.14 (0.66 ) Adjusted earnings (loss), basic(1,3) 4.51 2.03 (0.14 ) Dividends declared(4) 1.50 0.40 0.70 BALANCE SHEET Total assets 2,103 1,799 1,635 Long-term debt(5) 548 746 745 Net debt for financial covenant purposes(1) 333 619 751 Net debt to capitalization, market basis(1) 11 % 25 % 32 % Net debt to capitalization, book basis(1) 21 % 41 % 51 % KEY STATISTICS Shipments (MMsf–3/8") North America 6,066 5,888 5,497 Europe 1,867 1,779 1,740 Indicative average OSB price North Central ($/Msf–7/16") 353 269 209 South East ($/Msf–7/16") 330 245 187 Western Canada ($/Msf–7/16") 326 234 169 Europe (€/m3)(6) 239 233 224 KEY PERFORMANCE METRICS Return on capital employed (ROCE)(1) 45 % 27 % 9 % Return on equity (ROE)(1) 47 % 30 % (2 )% Cash provided by operating activities 608 313 24 Cash provided by operating activities per share(1) 7.05 3.66 0.28
(1) Non-IFRS measure; see Non-IFRS Financial Measures section. (2) Basic and diluted earnings (loss) per share are the same except diluted earnings per share for 2017 is $5.03 and 2016 is $2.13. (3) Basic and diluted Adjusted earnings (loss) per share are the same except diluted Adjusted earnings per share for 2017 is $4.49 and 2016 is $2.02. (4) Dividends declared per share stated in Canadian dollars. (5) Includes current and non-current long-term debt. (6) European indicative average OSB price represents the gross delivered price to the largest continental market.
Total sales increased by $411 million or 23% in 2017 due to higher North American prices, higher European panel prices and an increase in shipment volumes in both North America and Europe.
North American OSB demand continues to improve, driven by a gradual rebound in new home construction and strong growth in repair-and-remodel and industrial end uses. US housing starts were approximately 1.20 million in 2017, up 3% compared to 2016, with single-family starts 9% higher. The North American North Central OSB benchmark price averaged $353 per thousand square feet (Msf) (7/16-inch basis) in 2017, up 31% versus 2016, while the South East OSB benchmark price averaged $330 per Msf, up 35% versus 2016, and the Western Canada OSB benchmark price averaged $326 per Msf, up 39% versus 2016. Supported by increased mill productivity, Norbord’s North American shipment volume increased 3% in 2017 to meet improving customer demand.
NORBORD 2017 ANNUAL REPORT 11
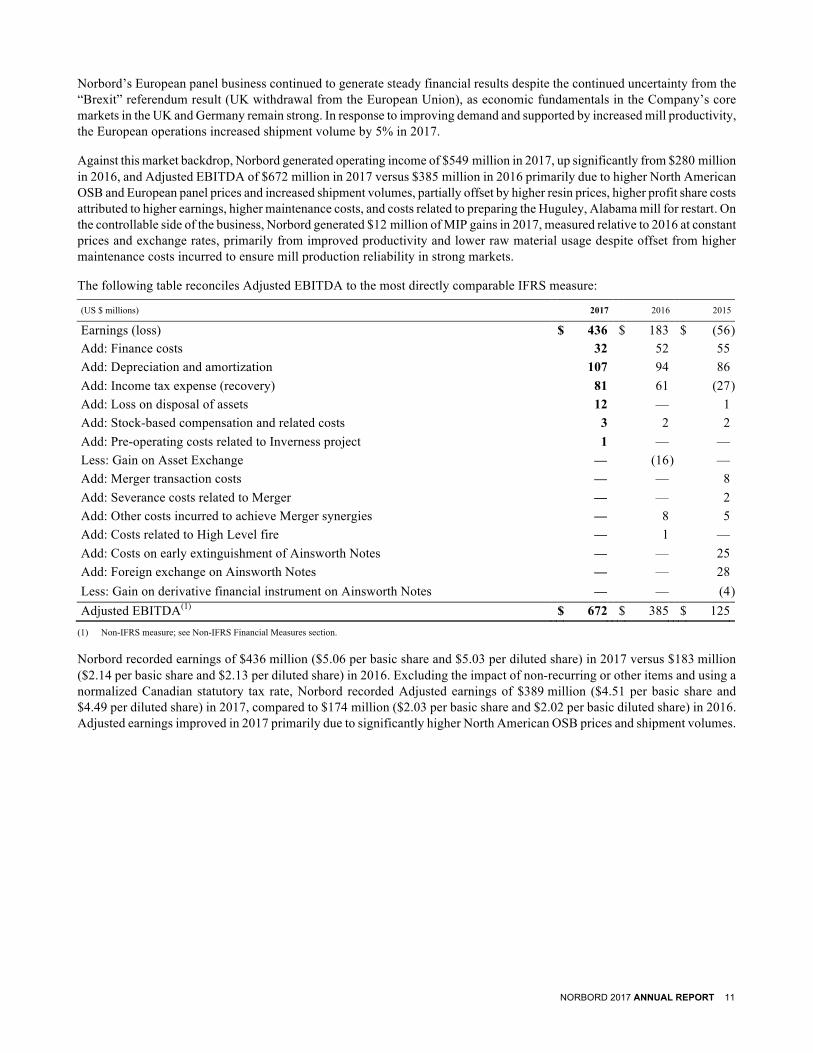
Norbord’s European panel business continued to generate steady financial results despite the continued uncertainty from the “Brexit” referendum result (UK withdrawal from the European Union), as economic fundamentals in the Company’s core markets in the UK and Germany remain strong. In response to improving demand and supported by increased mill productivity, the European operations increased shipment volume by 5% in 2017.
Against this market backdrop, Norbord generated operating income of $549 million in 2017, up significantly from $280 million in 2016, and Adjusted EBITDA of $672 million in 2017 versus $385 million in 2016 primarily due to higher North American OSB and European panel prices and increased shipment volumes, partially offset by higher resin prices, higher profit share costs attributed to higher earnings, higher maintenance costs, and costs related to preparing the Huguley, Alabama mill for restart. On the controllable side of the business, Norbord generated $12 million of MIP gains in 2017, measured relative to 2016 at constant prices and exchange rates, primarily from improved productivity and lower raw material usage despite offset from higher maintenance costs incurred to ensure mill production reliability in strong markets.
The following table reconciles Adjusted EBITDA to the most directly comparable IFRS measure:
(US $ millions) 2017 2016 2015
Earnings (loss) $ 436 $ 183 $ (56 ) Add: Finance costs 32 52 55 Add: Depreciation and amortization 107 94 86 Add: Income tax expense (recovery) 81 61 (27 ) Add: Loss on disposal of assets 12 — 1 Add: Stock-based compensation and related costs 3 2 2 Add: Pre-operating costs related to Inverness project 1 — — Less: Gain on Asset Exchange — (16 ) — Add: Merger transaction costs — — 8 Add: Severance costs related to Merger — — 2 Add: Other costs incurred to achieve Merger synergies — 8 5 Add: Costs related to High Level fire — 1 — Add: Costs on early extinguishment of Ainsworth Notes — — 25 Add: Foreign exchange on Ainsworth Notes — — 28 Less: Gain on derivative financial instrument on Ainsworth Notes — — (4 ) Adjusted EBITDA(1) $ 672 $ 385 $ 125
(1) Non-IFRS measure; see Non-IFRS Financial Measures section.
Norbord recorded earnings of $436 million ($5.06 per basic share and $5.03 per diluted share) in 2017 versus $183 million ($2.14 per basic share and $2.13 per diluted share) in 2016. Excluding the impact of non-recurring or other items and using a normalized Canadian statutory tax rate, Norbord recorded Adjusted earnings of $389 million ($4.51 per basic share and $4.49 per diluted share) in 2017, compared to $174 million ($2.03 per basic share and $2.02 per basic diluted share) in 2016. Adjusted earnings improved in 2017 primarily due to significantly higher North American OSB prices and shipment volumes.

12 NORBORD 2017 ANNUAL REPORT
The following table reconciles Adjusted earnings (loss) to the most directly comparable IFRS measure:
(US $ millions) 2017 2016 2015
Earnings (loss) $ 436 $ 183 $ (56 ) Add: Loss on disposal of assets 12 — 1 Add: Stock-based compensation and related costs 3 2 2 Add: Pre-operating costs related to Inverness project 1 — — Less: Gain on Asset Exchange — (16 ) — Add: Merger transaction costs — — 8 Add: Severance costs related to Merger — — 2 Add: Other costs incurred to achieve Merger synergies — 8 5 Add: Costs related to High Level fire — 1 — Add: Costs on early extinguishment of Ainsworth Notes — — 25 Add: Foreign exchange on Ainsworth Notes — — 28 Less: Gain on derivative financial instrument on Ainsworth Notes — — (4 ) Add: Reported income tax expense (recovery) 81 61 (27 ) Adjusted pre-tax earnings (loss) 533 239 (16 ) Less: Income tax (expense) recovery at statutory rate(1) (144 ) (65 ) 4 Adjusted earnings (loss)(2) $ 389 $ 174 $ (12 )
(1) Represents Canadian combined federal and provincial statutory rate. (2) Non-IFRS measure; see Non-IFRS Financial Measures section.
Pre-tax ROCE was 45% compared to 27% in the prior year. ROCE is a non-IFRS measurement of financial performance, focusing on cash generation and the effective use of capital. As Norbord operates in a cyclical commodity business, it interprets ROCE over the cycle as a useful means of comparing businesses in terms of efficiency of management (see Non-IFRS Financial Measures section). Over the past three years, Norbord’s ROCE has ranged from 9% to 45% and has averaged 24% over the past 15 years. Norbord remains well positioned to benefit from the continued US housing market recovery and growing demand in the Company’s core European markets in the years ahead.
2016 COMPARISON AGAINST 2015 In 2016, sales increased by $257 million or 17% from 2015. In North America, sales increased by 29% due to higher prices and a 7% increase in shipment volumes. Average North Central, South East and Western Canada OSB benchmark prices increased by $60, $58 and $65 per Msf, respectively, which represent increases of 29%, 31% and 38%, respectively, compared to 2015. In Europe, sales decreased by 11% due primarily to the foreign exchange impact of a weaker Pound Sterling relative to the US dollar and lower panel prices, offset partially by an increase in shipment volumes.
Against this market backdrop, Norbord generated operating income of $280 million in 2016, up significantly from $31 million in 2015, and Adjusted EBITDA of $385 million in 2016 versus $125 million in 2015 primarily due to higher North American OSB prices, increased shipment volumes, lower resin and energy prices, and improved raw material usages partially offset by higher profit share costs attributed to higher earnings and higher supplies and maintenance costs. On the controllable side of the business, Norbord generated $15 million of MIP gains in 2016, measured relative to 2015 at constant prices and exchange rates, primarily from improved productivity and lower raw material usage despite offset from higher maintenance-related costs.
Norbord recorded earnings of $183 million ($2.14 per basic share and $2.13 per diluted share) in 2016 versus a loss of $56 million ($0.66 loss per basic and diluted share) in 2015. Excluding the impact of non-recurring items (which includes the gain on the Asset Exchange, costs related to the Ainsworth Notes, which were redeemed prior to maturity in the second quarter of 2015, severance and other costs incurred to achieve Merger synergies, and Merger transaction costs) or other items, and using a normalized Canadian statutory tax rate, Norbord recorded Adjusted earnings of $174 million ($2.03 per basic share and $2.02 per diluted share) in 2016 compared to an Adjusted loss of $12 million ($0.14 per basic and diluted share) in 2015. Adjusted earnings improved in 2016 primarily due to significantly higher North American OSB prices and shipment volumes.
NORBORD 2017 ANNUAL REPORT 13
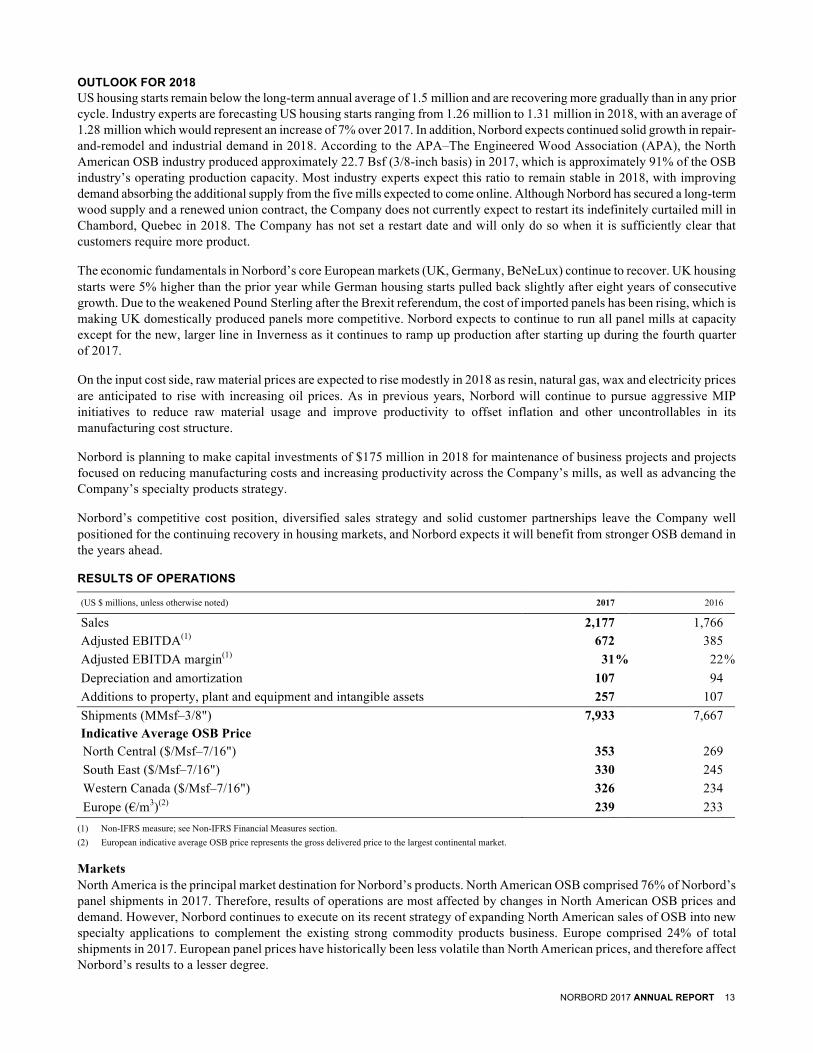
OUTLOOK FOR 2018 US housing starts remain below the long-term annual average of 1.5 million and are recovering more gradually than in any prior cycle. Industry experts are forecasting US housing starts ranging from 1.26 million to 1.31 million in 2018, with an average of 1.28 million which would represent an increase of 7% over 2017. In addition, Norbord expects continued solid growth in repair-and-remodel and industrial demand in 2018. According to the APA–The Engineered Wood Association (APA), the North American OSB industry produced approximately 22.7 Bsf (3/8-inch basis) in 2017, which is approximately 91% of the OSB industry’s operating production capacity. Most industry experts expect this ratio to remain stable in 2018, with improving demand absorbing the additional supply from the five mills expected to come online. Although Norbord has secured a long-term wood supply and a renewed union contract, the Company does not currently expect to restart its indefinitely curtailed mill in Chambord, Quebec in 2018. The Company has not set a restart date and will only do so when it is sufficiently clear that customers require more product.
The economic fundamentals in Norbord’s core European markets (UK, Germany, BeNeLux) continue to recover. UK housing starts were 5% higher than the prior year while German housing starts pulled back slightly after eight years of consecutive growth. Due to the weakened Pound Sterling after the Brexit referendum, the cost of imported panels has been rising, which is making UK domestically produced panels more competitive. Norbord expects to continue to run all panel mills at capacity except for the new, larger line in Inverness as it continues to ramp up production after starting up during the fourth quarter of 2017.
On the input cost side, raw material prices are expected to rise modestly in 2018 as resin, natural gas, wax and electricity prices are anticipated to rise with increasing oil prices. As in previous years, Norbord will continue to pursue aggressive MIP initiatives to reduce raw material usage and improve productivity to offset inflation and other uncontrollables in its manufacturing cost structure.
Norbord is planning to make capital investments of $175 million in 2018 for maintenance of business projects and projects focused on reducing manufacturing costs and increasing productivity across the Company’s mills, as well as advancing the Company’s specialty products strategy.
Norbord’s competitive cost position, diversified sales strategy and solid customer partnerships leave the Company well positioned for the continuing recovery in housing markets, and Norbord expects it will benefit from stronger OSB demand in the years ahead.
RESULTS OF OPERATIONS
(US $ millions, unless otherwise noted) 2017 2016 Sales 2,177 1,766 Adjusted EBITDA(1) 672 385 Adjusted EBITDA margin(1) 31 % 22 % Depreciation and amortization 107 94 Additions to property, plant and equipment and intangible assets 257 107 Shipments (MMsf–3/8") 7,933 7,667 Indicative Average OSB Price North Central ($/Msf–7/16") 353 269 South East ($/Msf–7/16") 330 245 Western Canada ($/Msf–7/16") 326 234 Europe (€/m3)(2) 239 233
(1) Non-IFRS measure; see Non-IFRS Financial Measures section. (2) European indicative average OSB price represents the gross delivered price to the largest continental market.
Markets North America is the principal market destination for Norbord’s products. North American OSB comprised 76% of Norbord’s panel shipments in 2017. Therefore, results of operations are most affected by changes in North American OSB prices and demand. However, Norbord continues to execute on its recent strategy of expanding North American sales of OSB into new specialty applications to complement the existing strong commodity products business. Europe comprised 24% of total shipments in 2017. European panel prices have historically been less volatile than North American prices, and therefore affect Norbord’s results to a lesser degree.
14 NORBORD 2017 ANNUAL REPORT
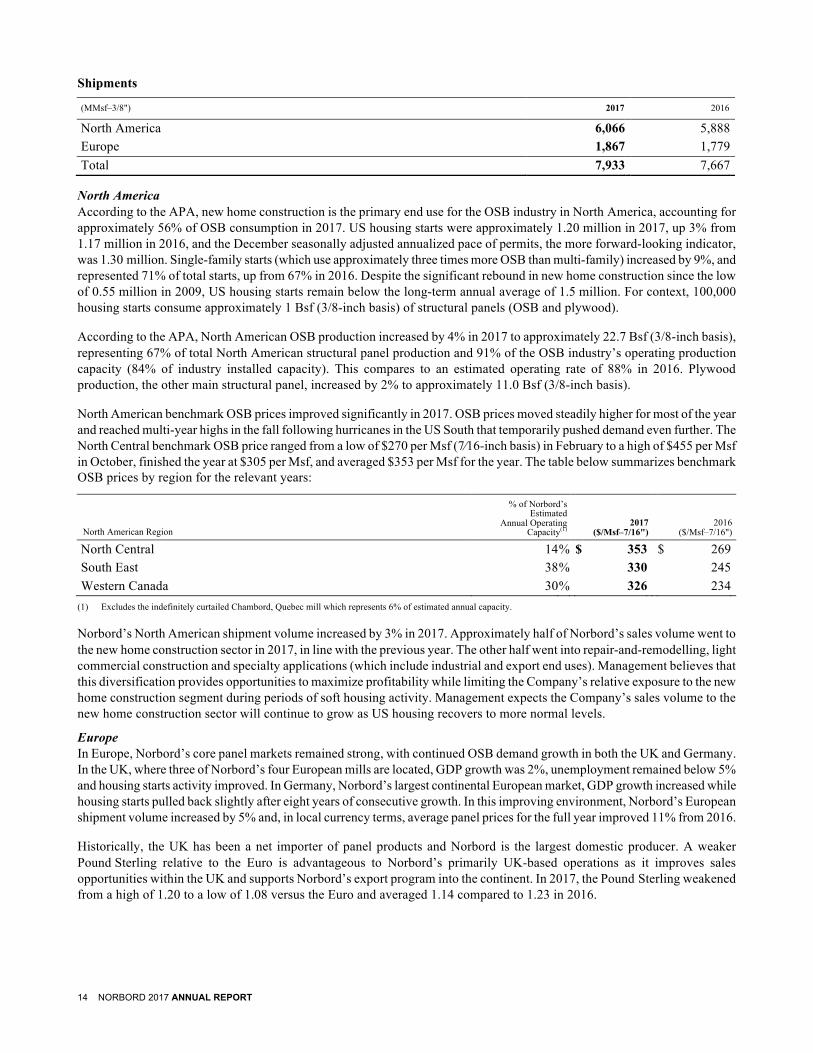
Shipments
(MMsf–3/8") 2017 2016
North America 6,066 5,888 Europe 1,867 1,779 Total 7,933 7,667
North America According to the APA, new home construction is the primary end use for the OSB industry in North America, accounting for approximately 56% of OSB consumption in 2017. US housing starts were approximately 1.20 million in 2017, up 3% from 1.17 million in 2016, and the December seasonally adjusted annualized pace of permits, the more forward-looking indicator, was 1.30 million. Single-family starts (which use approximately three times more OSB than multi-family) increased by 9%, and represented 71% of total starts, up from 67% in 2016. Despite the significant rebound in new home construction since the low of 0.55 million in 2009, US housing starts remain below the long-term annual average of 1.5 million. For context, 100,000 housing starts consume approximately 1 Bsf (3/8-inch basis) of structural panels (OSB and plywood).
According to the APA, North American OSB production increased by 4% in 2017 to approximately 22.7 Bsf (3/8-inch basis), representing 67% of total North American structural panel production and 91% of the OSB industry’s operating production capacity (84% of industry installed capacity). This compares to an estimated operating rate of 88% in 2016. Plywood production, the other main structural panel, increased by 2% to approximately 11.0 Bsf (3/8-inch basis).
North American benchmark OSB prices improved significantly in 2017. OSB prices moved steadily higher for most of the year and reached multi-year highs in the fall following hurricanes in the US South that temporarily pushed demand even further. The North Central benchmark OSB price ranged from a low of $270 per Msf (7⁄16-inch basis) in February to a high of $455 per Msf in October, finished the year at $305 per Msf, and averaged $353 per Msf for the year. The table below summarizes benchmark OSB prices by region for the relevant years:
North American Region
% of Norbord’s Estimated
Annual Operating Capacity(1)
2017 ($/Msf–7/16")
2016 ($/Msf–7/16")
North Central 14 % $ 353 $ 269 South East 38 % 330 245 Western Canada 30 % 326 234
(1) Excludes the indefinitely curtailed Chambord, Quebec mill which represents 6% of estimated annual capacity.
Norbord’s North American shipment volume increased by 3% in 2017. Approximately half of Norbord’s sales volume went to the new home construction sector in 2017, in line with the previous year. The other half went into repair-and-remodelling, light commercial construction and specialty applications (which include industrial and export end uses). Management believes that this diversification provides opportunities to maximize profitability while limiting the Company’s relative exposure to the new home construction segment during periods of soft housing activity. Management expects the Company’s sales volume to the new home construction sector will continue to grow as US housing recovers to more normal levels.
Europe In Europe, Norbord’s core panel markets remained strong, with continued OSB demand growth in both the UK and Germany. In the UK, where three of Norbord’s four European mills are located, GDP growth was 2%, unemployment remained below 5% and housing starts activity improved. In Germany, Norbord’s largest continental European market, GDP growth increased while housing starts pulled back slightly after eight years of consecutive growth. In this improving environment, Norbord’s European shipment volume increased by 5% and, in local currency terms, average panel prices for the full year improved 11% from 2016.
Historically, the UK has been a net importer of panel products and Norbord is the largest domestic producer. A weaker Pound Sterling relative to the Euro is advantageous to Norbord’s primarily UK-based operations as it improves sales opportunities within the UK and supports Norbord’s export program into the continent. In 2017, the Pound Sterling weakened from a high of 1.20 to a low of 1.08 versus the Euro and averaged 1.14 compared to 1.23 in 2016.
NORBORD 2017 ANNUAL REPORT 15
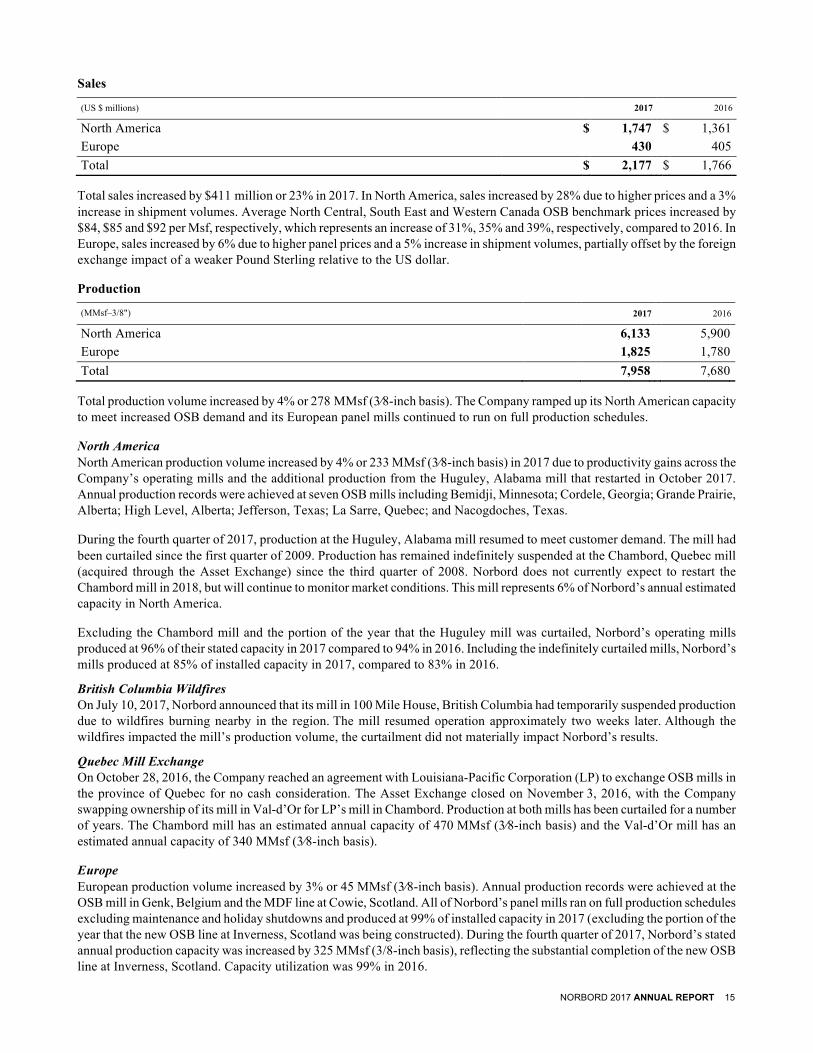
Sales
(US $ millions) 2017 2016
North America $ 1,747 $ 1,361 Europe 430 405 Total $ 2,177 $ 1,766
Total sales increased by $411 million or 23% in 2017. In North America, sales increased by 28% due to higher prices and a 3% increase in shipment volumes. Average North Central, South East and Western Canada OSB benchmark prices increased by $84, $85 and $92 per Msf, respectively, which represents an increase of 31%, 35% and 39%, respectively, compared to 2016. In Europe, sales increased by 6% due to higher panel prices and a 5% increase in shipment volumes, partially offset by the foreign exchange impact of a weaker Pound Sterling relative to the US dollar.
Production
(MMsf–3/8")
2017 2016
North America 6,133 5,900 Europe 1,825 1,780 Total 7,958 7,680
Total production volume increased by 4% or 278 MMsf (3⁄8-inch basis). The Company ramped up its North American capacity to meet increased OSB demand and its European panel mills continued to run on full production schedules.
North America North American production volume increased by 4% or 233 MMsf (3⁄8-inch basis) in 2017 due to productivity gains across the Company’s operating mills and the additional production from the Huguley, Alabama mill that restarted in October 2017. Annual production records were achieved at seven OSB mills including Bemidji, Minnesota; Cordele, Georgia; Grande Prairie, Alberta; High Level, Alberta; Jefferson, Texas; La Sarre, Quebec; and Nacogdoches, Texas.
During the fourth quarter of 2017, production at the Huguley, Alabama mill resumed to meet customer demand. The mill had been curtailed since the first quarter of 2009. Production has remained indefinitely suspended at the Chambord, Quebec mill (acquired through the Asset Exchange) since the third quarter of 2008. Norbord does not currently expect to restart the Chambord mill in 2018, but will continue to monitor market conditions. This mill represents 6% of Norbord’s annual estimated capacity in North America.
Excluding the Chambord mill and the portion of the year that the Huguley mill was curtailed, Norbord’s operating mills produced at 96% of their stated capacity in 2017 compared to 94% in 2016. Including the indefinitely curtailed mills, Norbord’s mills produced at 85% of installed capacity in 2017, compared to 83% in 2016.
British Columbia Wildfires On July 10, 2017, Norbord announced that its mill in 100 Mile House, British Columbia had temporarily suspended production due to wildfires burning nearby in the region. The mill resumed operation approximately two weeks later. Although the wildfires impacted the mill’s production volume, the curtailment did not materially impact Norbord’s results.
Quebec Mill Exchange On October 28, 2016, the Company reached an agreement with Louisiana-Pacific Corporation (LP) to exchange OSB mills in the province of Quebec for no cash consideration. The Asset Exchange closed on November 3, 2016, with the Company swapping ownership of its mill in Val-d’Or for LP’s mill in Chambord. Production at both mills has been curtailed for a number of years. The Chambord mill has an estimated annual capacity of 470 MMsf (3⁄8-inch basis) and the Val-d’Or mill has an estimated annual capacity of 340 MMsf (3⁄8-inch basis).
Europe European production volume increased by 3% or 45 MMsf (3⁄8-inch basis). Annual production records were achieved at the OSB mill in Genk, Belgium and the MDF line at Cowie, Scotland. All of Norbord’s panel mills ran on full production schedules excluding maintenance and holiday shutdowns and produced at 99% of installed capacity in 2017 (excluding the portion of the year that the new OSB line at Inverness, Scotland was being constructed). During the fourth quarter of 2017, Norbord’s stated annual production capacity was increased by 325 MMsf (3/8-inch basis), reflecting the substantial completion of the new OSB line at Inverness, Scotland. Capacity utilization was 99% in 2016.
16 NORBORD 2017 ANNUAL REPORT
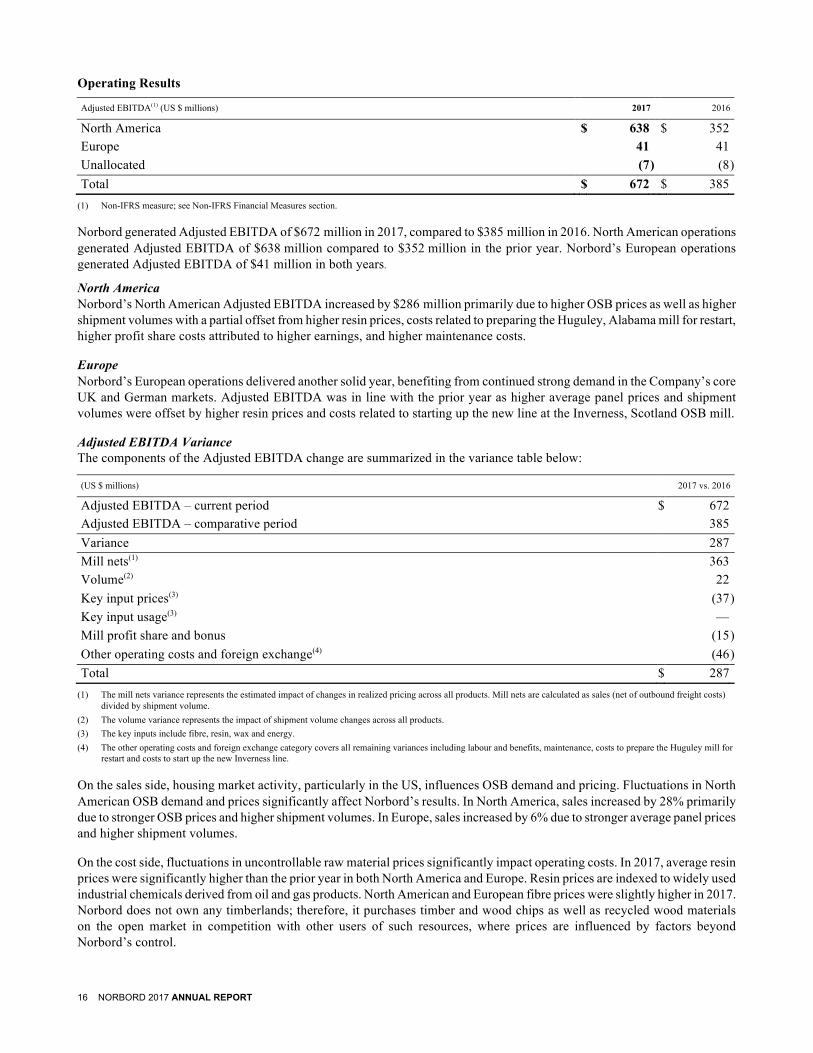
Operating Results
Adjusted EBITDA(1) (US $ millions) 2017 2016
North America $ 638 $ 352 Europe 41 41 Unallocated (7 ) (8 ) Total $ 672 $ 385
(1) Non-IFRS measure; see Non-IFRS Financial Measures section.
Norbord generated Adjusted EBITDA of $672 million in 2017, compared to $385 million in 2016. North American operations generated Adjusted EBITDA of $638 million compared to $352 million in the prior year. Norbord’s European operations generated Adjusted EBITDA of $41 million in both years.
North America Norbord’s North American Adjusted EBITDA increased by $286 million primarily due to higher OSB prices as well as higher shipment volumes with a partial offset from higher resin prices, costs related to preparing the Huguley, Alabama mill for restart, higher profit share costs attributed to higher earnings, and higher maintenance costs.
Europe Norbord’s European operations delivered another solid year, benefiting from continued strong demand in the Company’s core UK and German markets. Adjusted EBITDA was in line with the prior year as higher average panel prices and shipment volumes were offset by higher resin prices and costs related to starting up the new line at the Inverness, Scotland OSB mill.
Adjusted EBITDA Variance The components of the Adjusted EBITDA change are summarized in the variance table below:
(US $ millions) 2017 vs. 2016
Adjusted EBITDA – current period $ 672 Adjusted EBITDA – comparative period 385 Variance 287 Mill nets(1) 363 Volume(2) 22 Key input prices(3) (37 ) Key input usage(3) — Mill profit share and bonus (15 ) Other operating costs and foreign exchange(4) (46 ) Total $ 287
(1) The mill nets variance represents the estimated impact of changes in realized pricing across all products. Mill nets are calculated as sales (net of outbound freight costs) divided by shipment volume.
(2) The volume variance represents the impact of shipment volume changes across all products. (3) The key inputs include fibre, resin, wax and energy. (4) The other operating costs and foreign exchange category covers all remaining variances including labour and benefits, maintenance, costs to prepare the Huguley mill for
restart and costs to start up the new Inverness line.
On the sales side, housing market activity, particularly in the US, influences OSB demand and pricing. Fluctuations in North American OSB demand and prices significantly affect Norbord’s results. In North America, sales increased by 28% primarily due to stronger OSB prices and higher shipment volumes. In Europe, sales increased by 6% due to stronger average panel prices and higher shipment volumes.
On the cost side, fluctuations in uncontrollable raw material prices significantly impact operating costs. In 2017, average resin prices were significantly higher than the prior year in both North America and Europe. Resin prices are indexed to widely used industrial chemicals derived from oil and gas products. North American and European fibre prices were slightly higher in 2017. Norbord does not own any timberlands; therefore, it purchases timber and wood chips as well as recycled wood materials on the open market in competition with other users of such resources, where prices are influenced by factors beyond Norbord’s control.
NORBORD 2017 ANNUAL REPORT 17
The Company realized MIP gains of $12 million in 2017 measured relative to 2016 at constant prices and exchange rates. Contributions to MIP included improved productivity and lower raw material usage partially offset by higher maintenance costs incurred to ensure mill production reliability in strong markets as well as costs associated with executing on strategic initiatives. These costs include adding in-house technical and engineering expertise to support the execution of capital projects, in addition to investing in sales, marketing and production resources and capabilities to execute on the Company’s North American specialty products strategy.
In 2017, Norbord’s North American OSB cash production costs per unit (excluding mill profit share) increased 5% over the prior year as improved productivity gains were more than offset by higher resin prices and the costs to prepare the Huguley, Alabama mill for restart.
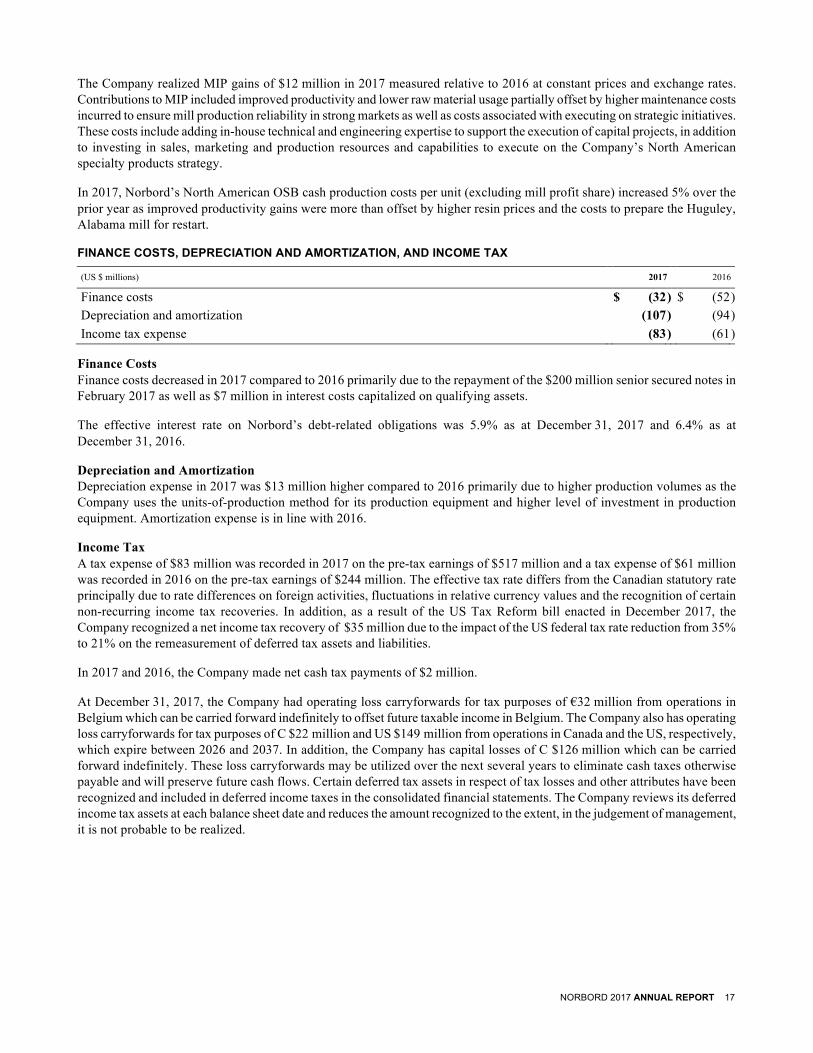
FINANCE COSTS, DEPRECIATION AND AMORTIZATION, AND INCOME TAX
(US $ millions) 2017 2016
Finance costs $ (32 ) $ (52 ) Depreciation and amortization (107 ) (94 ) Income tax expense (83 ) (61 )
Finance Costs Finance costs decreased in 2017 compared to 2016 primarily due to the repayment of the $200 million senior secured notes in February 2017 as well as $7 million in interest costs capitalized on qualifying assets.
The effective interest rate on Norbord’s debt-related obligations was 5.9% as at December 31, 2017 and 6.4% as at December 31, 2016.
Depreciation and Amortization Depreciation expense in 2017 was $13 million higher compared to 2016 primarily due to higher production volumes as the Company uses the units-of-production method for its production equipment and higher level of investment in production equipment. Amortization expense is in line with 2016.
Income Tax A tax expense of $83 million was recorded in 2017 on the pre-tax earnings of $517 million and a tax expense of $61 million was recorded in 2016 on the pre-tax earnings of $244 million. The effective tax rate differs from the Canadian statutory rate principally due to rate differences on foreign activities, fluctuations in relative currency values and the recognition of certain non-recurring income tax recoveries. In addition, as a result of the US Tax Reform bill enacted in December 2017, the Company recognized a net income tax recovery of $35 million due to the impact of the US federal tax rate reduction from 35% to 21% on the remeasurement of deferred tax assets and liabilities.
In 2017 and 2016, the Company made net cash tax payments of $2 million.
At December 31, 2017, the Company had operating loss carryforwards for tax purposes of €32 million from operations in Belgium which can be carried forward indefinitely to offset future taxable income in Belgium. The Company also has operating loss carryforwards for tax purposes of C $22 million and US $149 million from operations in Canada and the US, respectively, which expire between 2026 and 2037. In addition, the Company has capital losses of C $126 million which can be carried forward indefinitely. These loss carryforwards may be utilized over the next several years to eliminate cash taxes otherwise payable and will preserve future cash flows. Certain deferred tax assets in respect of tax losses and other attributes have been recognized and included in deferred income taxes in the consolidated financial statements. The Company reviews its deferred income tax assets at each balance sheet date and reduces the amount recognized to the extent, in the judgement of management, it is not probable to be realized.

18 NORBORD 2017 ANNUAL REPORT
LIQUIDITY AND CAPITAL RESOURCES
(US $ millions, except per share information, unless otherwise noted) 2017 2016 Cash provided by operating activities $ 608 $ 313 Cash provided by operating activities per share(1) 7.05 3.66 Operating working capital 127 118 Total working capital 295 278 Additions to property, plant and equipment and intangible assets 257 107 Net debt to capitalization, market basis(1) 11 % 25 % Net debt to capitalization, book basis(1) 21 % 41 %
(1) Non-IFRS measure; see Non-IFRS Financial Measures section.
At year-end, the Company had unutilized liquidity of $592 million, comprising $241 million in cash and cash equivalents, $226 million in revolving bank lines and $125 million undrawn under its accounts receivable securitization program. Norbord has no investments in, or other direct exposure to, US sub-prime mortgages, US auction rate securities or Canadian asset-backed commercial paper.
The Company’s outstanding long-term debt has a weighted average term of 4.3 years. Norbord’s net debt for financial covenant purposes was $333 million at December 31, 2017, which includes long-term debt of $555 million less cash and cash equivalents of $241 million plus letters of credit of $19 million.
Senior Secured Notes Due 2017 In February 2017, the Company permanently repaid its $200 million senior secured notes upon maturity using cash on hand and temporary drawings on the accounts receivable securitization program which were repaid in the second quarter.
Senior Secured Notes Due 2020 The Company’s $240 million senior secured notes due December 2020 bear an interest rate of 5.375%.
Senior Secured Notes Due 2023 The Company’s $315 million senior secured notes due April 2023 bear an interest rate of 6.25%.
Revolving Bank Lines The Company has an aggregate commitment of $245 million which bears interest at money market rates plus a margin that varies with the Company’s credit rating. The maturity date of the aggregate commitment is May 2019. The bank lines are secured by a first lien on the Company’s North American OSB inventory and property, plant and equipment. This lien is shared pari passu with the holders of the 2020 and 2023 senior secured notes.
The bank lines contain two quarterly financial covenants: minimum tangible net worth of $500 million and maximum net debt to total capitalization, book basis, of 65%. For the purposes of the tangible net worth calculation, the following adjustments have been made as at year-end:
• the IFRS transitional adjustments to shareholders’ equity of $21 million at January 1, 2011 are added back; • changes to other comprehensive income subsequent to January 1, 2011 are excluded; • intangible assets (other than timber rights and software acquisition and development costs) are excluded; and • the impact of the change in functional currency of Ainsworth on shareholders’ equity of $155 million is excluded.
Net debt for financial covenant purposes includes total debt, principal amount excluding any drawings on the accounts receivable securitization program, less cash and cash equivalents, plus letters of credit issued and any bank advances. At year-end, the Company’s tangible net worth was $1,248 million and net debt for financial covenant purposes was $333 million. Net debt to capitalization, book basis, was 21%. The Company was in compliance with the financial covenants at year-end.
NORBORD 2017 ANNUAL REPORT 19
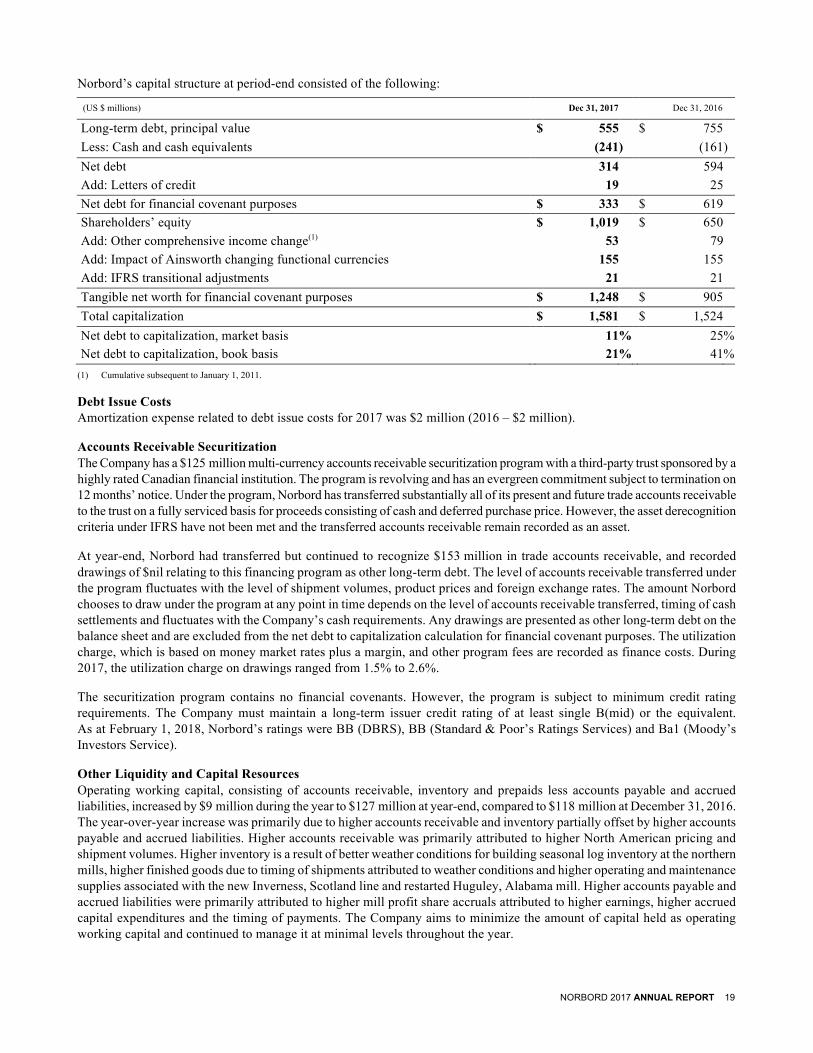
Norbord’s capital structure at period-end consisted of the following:
(US $ millions) Dec 31, 2017 Dec 31, 2016
Long-term debt, principal value $ 555 $ 755 Less: Cash and cash equivalents (241 ) (161 ) Net debt 314 594 Add: Letters of credit 19 25 Net debt for financial covenant purposes $ 333 $ 619 Shareholders’ equity $ 1,019 $ 650 Add: Other comprehensive income change(1) 53 79 Add: Impact of Ainsworth changing functional currencies 155 155 Add: IFRS transitional adjustments 21 21 Tangible net worth for financial covenant purposes $ 1,248 $ 905 Total capitalization $ 1,581 $ 1,524 Net debt to capitalization, market basis 11 % 25 % Net debt to capitalization, book basis 21 % 41 %
(1) Cumulative subsequent to January 1, 2011.
Debt Issue Costs Amortization expense related to debt issue costs for 2017 was $2 million (2016 – $2 million).
Accounts Receivable Securitization The Company has a $125 million multi-currency accounts receivable securitization program with a third-party trust sponsored by a highly rated Canadian financial institution. The program is revolving and has an evergreen commitment subject to termination on 12 months’ notice. Under the program, Norbord has transferred substantially all of its present and future trade accounts receivable to the trust on a fully serviced basis for proceeds consisting of cash and deferred purchase price. However, the asset derecognition criteria under IFRS have not been met and the transferred accounts receivable remain recorded as an asset.
At year-end, Norbord had transferred but continued to recognize $153 million in trade accounts receivable, and recorded drawings of $nil relating to this financing program as other long-term debt. The level of accounts receivable transferred under the program fluctuates with the level of shipment volumes, product prices and foreign exchange rates. The amount Norbord chooses to draw under the program at any point in time depends on the level of accounts receivable transferred, timing of cash settlements and fluctuates with the Company’s cash requirements. Any drawings are presented as other long-term debt on the balance sheet and are excluded from the net debt to capitalization calculation for financial covenant purposes. The utilization charge, which is based on money market rates plus a margin, and other program fees are recorded as finance costs. During 2017, the utilization charge on drawings ranged from 1.5% to 2.6%.
The securitization program contains no financial covenants. However, the program is subject to minimum credit rating requirements. The Company must maintain a long-term issuer credit rating of at least single B(mid) or the equivalent. As at February 1, 2018, Norbord’s ratings were BB (DBRS), BB (Standard & Poor’s Ratings Services) and Ba1 (Moody’s Investors Service).
Other Liquidity and Capital Resources Operating working capital, consisting of accounts receivable, inventory and prepaids less accounts payable and accrued liabilities, increased by $9 million during the year to $127 million at year-end, compared to $118 million at December 31, 2016. The year-over-year increase was primarily due to higher accounts receivable and inventory partially offset by higher accounts payable and accrued liabilities. Higher accounts receivable was primarily attributed to higher North American pricing and shipment volumes. Higher inventory is a result of better weather conditions for building seasonal log inventory at the northern mills, higher finished goods due to timing of shipments attributed to weather conditions and higher operating and maintenance supplies associated with the new Inverness, Scotland line and restarted Huguley, Alabama mill. Higher accounts payable and accrued liabilities were primarily attributed to higher mill profit share accruals attributed to higher earnings, higher accrued capital expenditures and the timing of payments. The Company aims to minimize the amount of capital held as operating working capital and continued to manage it at minimal levels throughout the year.

20 NORBORD 2017 ANNUAL REPORT
Total working capital, which includes operating working capital plus cash and cash equivalents and taxes receivable less taxes payable, was $295 million as at December 31, 2017, compared to $278 million at December 31, 2016. The increase is primarily attributed to the higher cash balance and operating working capital, partially offset by the higher taxes payable.
Operating activities generated $608 million of cash or $7.05 per share in 2017, compared to $313 million or $3.66 per share in 2016. The significantly higher cash generation is mainly attributed to the higher Adjusted EBITDA in 2017.
The following table summarizes the aggregate amount of future cash outflows for contractual obligations:
Payments Due by Period
(US $ millions) 2018 2019 2020 2021 2022 Thereafter Total
Long-term debt, including interest $ 33 $ 33 $ 273 $ 19 $ 19 $ 325 $ 702 Purchase commitments 100 76 11 5 5 5 202 Operating leases 5 4 3 2 1 2 17 Reforestation obligations 2 — — — — 1 3 Total $ 140 $ 113 $ 287 $ 26 $ 25 $ 333 $ 924
Note: The above table does not include pension and post-employment benefits plan obligations, which are discussed in the Risks and Uncertainties – Defined Benefit Pension Plan Funding section.
INVESTMENTS Investment in Property, Plant and Equipment
(US $ millions) 2017 2016
Increased productivity and cost reduction $ 103 $ 38 Inverness project 101 33 Maintenance of business 34 21 Environmental and safety 8 8 Capitalized interest 7 1 Total $ 253 $ 101
The focus of the Company’s capital reinvestment strategy is to improve production efficiency, reduce manufacturing costs and maintain the Company’s assets and high standards for environmental and safety performance. Investment in property, plant and equipment in 2017 was $253 million ($257 million including intangible assets) including $7 million of capitalized interest, representing approximately 236% of depreciation and amortization (107% excluding the capital expenditure on the Inverness, Scotland project and the Huguley, Alabama restart).
Key 2017 projects included the Inverness project (described below), completion of the investment to restart the Huguley, Alabama mill in October 2017, and completion of the fines screening project at the La Sarre, Quebec mill. Key 2016 projects included the Inverness project, fines screening projects at the La Sarre, Quebec and Joanna, South Carolina mills, the finishing end upgrade at the High Level, Alberta mill and additional work to rebuild the press line at the then-curtailed Huguley, Alabama mill.
Norbord is planning to make capital investments of $175 million in 2018 for maintenance of business projects and projects focused on reducing manufacturing costs and increasing productivity across the mills. It will also include investments to support the Company’s strategy to increase the production of specialty products for industrial and export end uses. These investments will be funded with cash on hand, cash generated from operations and, if necessary, drawings under the Company’s accounts receivable securitization program or committed revolving bank lines.
Inverness Project In January 2016, the Board of Directors approved the investment of $135 million over the subsequent two years to modernize and expand the Company’s Inverness, Scotland OSB mill, including moving the unused second press from the Grande Prairie, Alberta mill. The project was substantially completed and the new line started up in the fourth quarter of 2017, with no disruption to existing production capacity. Capital spending of $101 million was invested in 2017 ($134 million to-date). During the year, $13 million of the Highlands & Islands Enterprise development grant was received or receivable ($16 million to-date) which offsets the Company’s investment. The investment was funded with cash on hand and cash generated from operations.

NORBORD 2017 ANNUAL REPORT 21
Investment in Intangible Assets In 2017, investment in intangible assets was $4 million and consisted of the investment in software acquisition and development costs. In 2016, investment in intangible assets was $6 million and consisted of the investment in software acquisition and development costs.
CAPITALIZATION Common Share Information
At December 31 2017 2016
Shares outstanding (millions) 86.4 85.8 Dividends (US $ millions) $ 101 $ 26 Market price at year-end (C $) $ 42.55 $ 33.91
The increase in shares outstanding during 2017 was primarily related to stock option exercises. At February 1, 2018, there were 86.4 million common shares outstanding. The average daily volume traded on the Toronto Stock Exchange (TSX) during 2017 was approximately 233,000 shares compared to approximately 177,000 shares in 2016, and the average daily volume traded on the New York Stock Exchange (NYSE) was approximately 46,000 shares, up from approximately 12,000 shares since listing on February 19, 2016 to December 31, 2016.
Normal Course Issuer Bid In October 2017, Norbord renewed its normal course issuer bid (NCIB) in accordance with TSX rules. Under the bid, Norbord may purchase up to 5,142,773 of its common shares, representing 10% of the Company’s public float of 51,427,739 common shares as of October 20, 2017, pursuant to TSX rules (a total of 86,387,210 common shares were issued and outstanding as of such date).
Purchases under the bid will terminate on the earlier of November 2, 2018, the date Norbord completes its purchases pursuant to the notice of intention to make a NCIB filed with the TSX or the date of notice by Norbord of termination of the bid. Purchases will be made on the open market by Norbord through the facilities of the TSX, the NYSE or Canadian or US alternative trading systems, if eligible, in accordance with the requirements of the TSX and applicable securities laws. The price that Norbord will pay for any such common shares will be the market price of such shares at the time of acquisition. Common shares purchased under the bid will be cancelled. Daily purchases of common shares will not exceed 50,457 subject to the Company’s ability to make “block” purchases under the rules of the TSX. Under its prior bid that commenced on November 3, 2016 and expired on November 2, 2017, Norbord previously sought and received approval from the TSX to repurchase up to 4,280,997 common shares. Norbord did not acquire any common shares under such bid in the past 12 months.
Norbord believes that the market price of its common shares at certain times may be attractive and that the purchase of these common shares from time to time would be an appropriate use of Norbord’s funds in light of potential benefits to remaining shareholders.
From time to time, when Norbord does not possess material non-public information about itself or its securities, it may enter into an automatic purchase plan with its broker to allow for the purchase of common shares at times when Norbord ordinarily would not be active in the market due to its own internal trading blackout periods, insider trading rules or otherwise. Any such plans entered into with Norbord’s broker will be adopted in accordance with applicable Canadian securities laws.

22 NORBORD 2017 ANNUAL REPORT
Dividends Norbord’s variable dividend policy targets the payment to shareholders of a portion of free cash flow based upon the Company’s financial position, results of operations, cash flow, capital requirements and restrictions under the Company’s revolving bank lines, as well as the market outlook for the Company’s principal products and broader market and economic conditions, among other factors. Under this policy, the Board of Directors has declared the following dividends:
(C $) Quarterly Dividend Declared
per Common Share
Q2 2013 to Q4 2014 $ 0.60 Q1 2015 & Q2 2015 0.25 Q3 2015 to Q1 2017 0.10 Q2 2017 0.30 Q3 2017 0.50 Q4 2017 0.60
The dividend level was decreased twice during 2015 to maintain flexibility in the Company’s capital structure as well as to fund growth and other attractive capital investment opportunities. The dividend level was increased three times during 2017, reflecting the strength in North American benchmark OSB prices last year and resulting robust operating cash flow for the Company, the positive market outlook for the Company’s products and the continuing expectation that free cash flow will be sufficient to fund current growth and other capital investment commitments for the foreseeable future.
The Board retains the discretion to amend the Company’s dividend policy in any manner and at any time as it may deem necessary or appropriate in the future. For these reasons, as well as others, the Board in its sole discretion can decide to increase, maintain, decrease, suspend or discontinue the payment of cash dividends in the future.
Stock Options As at December 31, 2017, options on 1.4 million common shares were outstanding, with 59% vested. The exercise prices for the outstanding options range from C $6.50 to C $60.90, with expiry on various dates up to 2027. In 2017, 0.6 million stock options were exercised (2016 – 0.4 million stock options) resulting in the issuance of 0.6 million common shares (2016 – 0.4 million common shares) for total proceeds of $7 million (2016 – $4 million).
Secondary Offering On August 2, 2017, Brookfield and the Company entered into an agreement with a syndicate of underwriters to complete a bought deal secondary offering of Norbord’s common shares (the Offering). Under the Offering, the syndicate agreed to purchase 3.6 million common shares from Brookfield at a purchase price of C $42.35 per common share. On August 9, 2017, upon the completion of the Offering, Brookfield owned, directly and indirectly, approximately 49% of Norbord’s common shares. Norbord did not receive any proceeds from the Offering.
In-kind Distribution On October 13, 2017, Brookfield completed an in-kind distribution (the Distribution) of an aggregate of 7.1 million common shares of Norbord to investors in certain of its funds. Upon completion of the Distribution, Brookfield owned and controlled approximately 40% of Norbord common shares.
NORBORD 2017 ANNUAL REPORT 23
TRANSACTIONS WITH RELATED PARTIES In the normal course of operations, the Company enters into various transactions with related parties which have been measured at exchange value and recognized in the consolidated financial statements. The following transactions have occurred between the Company and its related parties during 2017:
Brookfield As at December 31, 2017, total future costs related to a 1999 asset purchase agreement between the Company and Brookfield, for which Norbord provided an indemnity, are estimated at less than $1 million and are included in other liabilities in the consolidated balance sheets.
The Company periodically engages the services of Brookfield for various financial, real estate and other business services. In 2017, the fees for services rendered were less than $1 million (2016 – less than $1 million).
In August 2017, upon completion of the secondary offering (see Capitalization), Brookfield’s ownership decreased from approximately 53% to 49% of common shares outstanding. In October 2017, upon completion of the Distribution (see Capitalization), Brookfield’s ownership was reduced to approximately 40% of common shares outstanding.
Other Sales to Asian markets are handled by Interex Forest Products Ltd. (Interex), a cooperative sales company over which Norbord, as a 25% shareholder, has significant influence. In 2017, net sales of $78 million (2016 – $62 million) were made to Interex. At year-end, $3 million (December 31, 2016 – $2 million) due from Interex was included in accounts receivable. At year-end, the investment in Interex was less than $1 million (December 31, 2016 – less than $1 million).
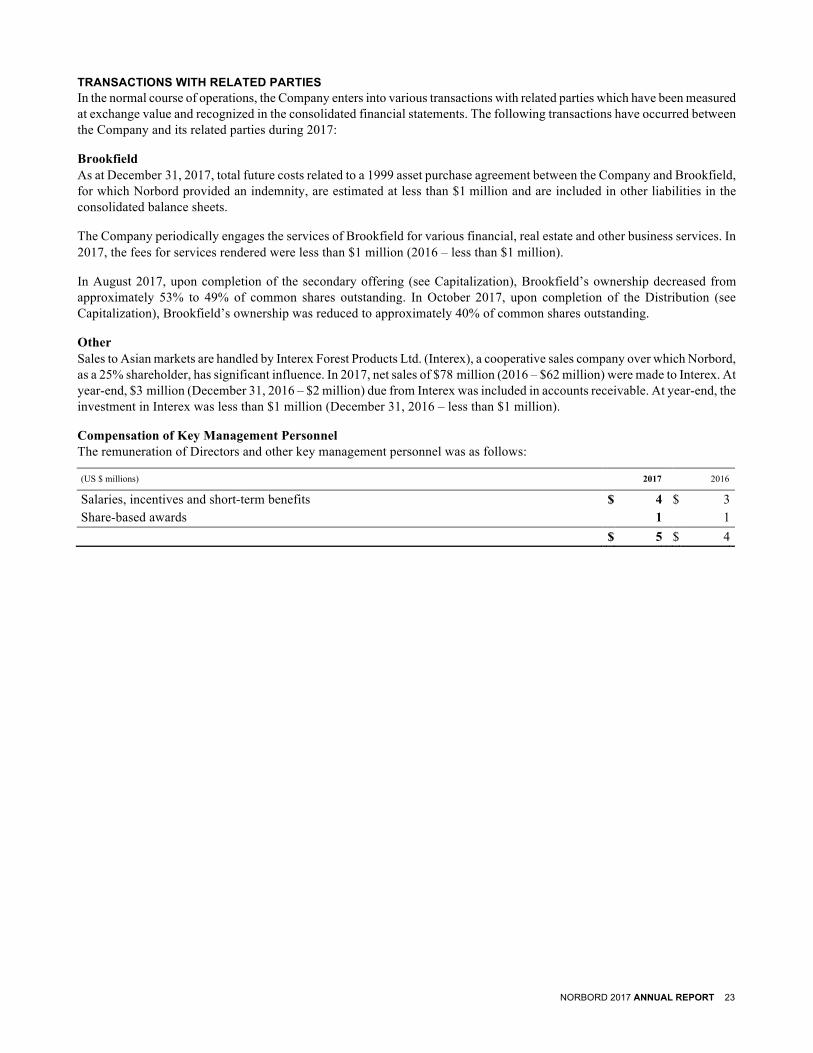
Compensation of Key Management Personnel The remuneration of Directors and other key management personnel was as follows:
(US $ millions) 2017 2016
Salaries, incentives and short-term benefits $ 4 $ 3 Share-based awards 1 1
$ 5 $ 4

24 NORBORD 2017 ANNUAL REPORT
SELECTED QUARTERLY INFORMATION
2017 2016 (US $ millions, except per share
information, unless otherwise noted) Q4 Q3 Q2 Q1 Q4 Q3 Q2 Q1
SALES AND EARNINGS Sales 596 578 536 467 482 453 447 384
Operating income 172 169 135 73 87 87 67 39
Adjusted EBITDA(1) 204 200 165 103 115 115 94 61
Earnings 160 130 97 49 61 55 44 23
Adjusted earnings(1) 123 121 95 50 55 58 41 20
PER COMMON SHARE EARNINGS
Earnings, basic(2) 1.85 1.51 1.13 0.57 0.71 0.64 0.51 0.27
Adjusted earnings, basic(1,3) 1.42 1.40 1.10 0.58 0.64 0.68 0.48 0.23
Dividends declared(4) 0.60 0.50 0.30 0.10 0.10 0.10 0.10 0.10
BALANCE SHEET Total assets 2,103 1,951 1,772 1,725 1,799 1,718 1,654 1,670
Long-term debt(5) 548 548 547 547 746 746 745 745
Net debt for financial covenant purposes(1) 333
449
567
580
619
705
751
749
Net debt to capitalization, market basis(1) 11 % 15 % 20 % 22 % 25 % 29 % 31 % 32 %
Net debt to capitalization, book basis(1) 21 % 28 % 36 % 38 % 41 % 45 % 48 % 50 %
KEY STATISTICS Shipments (MMsf–3/8") North America 1,562 1,537 1,536 1,431 1,601 1,463 1,487 1,337 Europe 440 474 474 479 447 438 459 435 Indicative average OSB price North Central ($/Msf–7/16") 379 409 330 293 285 301 264 226 South East ($/Msf–7/16") 355 354 320 292 263 256 245 215 Western Canada ($/Msf–7/16") 328 388 324 265 236 265 242 191 Europe (€/m3)(6) 262 233 230 226 230 235 237 230 KEY PERFORMANCE METRICS Return on capital employed
(ROCE)(1) 52 % 52 % 44 % 29 % 30 % 32 % 26 % 18 % Return on equity (ROE)(1) 51 % 58 % 51 % 30 % 34 % 41 % 31 % 16 % Cash provided by operating
activities
222
203
144
39
130
97
83
3
Cash provided by operating activities per share(1) 2.57
2.36
1.67
0.45
1.52
1.13
0.97
0.04
(1) Non-IFRS measure; see Non-IFRS Financial Measures section. (2) Basic and diluted earnings per share are the same except diluted earnings per share for Q4 2017 is $1.84, Q3 2017 is $1.50 and Q2 2017 is $1.12. (3) Basic and diluted Adjusted earnings per share are the same except diluted Adjusted earnings per share for Q4 2017 is $1.41, Q3 2017 is $1.39 and Q3 2016 is $0.67. (4) Dividends declared per share stated in Canadian dollars. (5) Includes current and non-current long-term debt. (6) European indicative average OSB price represents the gross delivered price to the largest continental market.

NORBORD 2017 ANNUAL REPORT 25
Quarterly results are impacted by seasonal factors such as weather and building activity. Market demand varies seasonally, as homebuilding activity and repair-and-remodelling work – the principal end uses of Norbord’s products – are generally stronger in the spring and summer months. Adverse weather can also limit access to logging areas, which can affect the supply of fibre to Norbord’s operations. OSB shipment volumes and prices are affected by these factors as well as by global supply and demand conditions.
Operating working capital is typically built up in the first quarter of the year due primarily to log inventory purchases in the northern regions of North America and Europe. This inventory is generally consumed in the spring and summer months.
The demand for and the price of OSB in North America are significant variables affecting the comparability of Norbord’s results over the past eight quarters. Fluctuations in earnings during that time mirror fluctuations in the demand for and the price of OSB in North America. The Company estimates that the annualized impact on Adjusted EBITDA of a $10 per Msf (7⁄16-inch basis) change in the realized North American OSB price, when operations are running at full capacity, is approximately $59 million or $0.68 per basic share (approximately $50 million or $0.58 per basic share based on the last 12 months of production). Regional pricing variations, particularly in the Southern US and Western Canada, make the North Central benchmark price a useful, albeit imperfect, proxy for overall North American OSB pricing. Similarly in Europe, regional pricing variations and product mix also make the European OSB indicative price a useful, albeit imperfect, proxy for overall European OSB pricing. Further, premiums obtained on value-added products, the pricing lag effect of maintaining an order file, and volume and trade discounts cause realized prices to differ from the benchmarks for both North America and Europe.
Global commodity prices affect the prices of key raw material inputs, primarily wood fibre, resin, wax and energy, which had been increasing as the broader US economic recovery gained traction. Prices for resin, a petroleum-based product, generally follow global oil prices which had been trending down until the third quarter of 2016 and then trending gradually higher for the four subsequent quarters. Resin prices stabilized in the third quarter of 2017.
Norbord has significant exposure to the Canadian dollar with approximately 36% of its global panel production capacity located in Canada. The Company estimates that the favourable impact of a one-cent (US) decrease in the value of the Canadian dollar would positively impact annual Adjusted EBITDA by approximately $5 million when all six of Norbord’s Canadian OSB mills operate at full capacity.
Items not related to ongoing business operations that had a significant impact on quarterly results include:
Loss on Disposal of Assets – As a result of the increase in investments in production equipment which were placed in service in 2017, included in the fourth quarter of 2017 is a $3 million ($0.03 per basic and diluted shares) non-cash loss primarily related to maintenance parts for decommissioned production equipment. Included in the third quarter of 2017 is a $2 million ($0.02 per basic and diluted share) non-cash loss of similar costs. Included in the second quarter of 2017 is a $2 million ($0.02 per basic and diluted share) non-cash loss related to decommissioned production equipment. Included in the first quarter of 2017 is a $5 million ($0.06 per basic and diluted share) non-cash loss of similar costs (see Investment in Property, Plant and Equipment).
Stock-based Compensation and Related Costs – Included in the third quarter of 2017 is $1 million ($0.01 per basic and diluted share) of stock-based compensation and related revaluation costs. Included in the second quarter of 2017 is $1 million ($0.01 per basic and diluted share), $1 million ($0.01 per basic and diluted share) in the first quarter of 2017, $1 million ($0.01 per basic and diluted share) in the fourth quarter of 2016 and $1 million ($0.01 per basic and diluted share) in the third quarter of 2016 of similar costs.
Costs Related to Inverness Expansion Project – Included in the third quarter of 2017 is $1 million ($0.01 per basic and diluted share) of pre-operating costs related to the Inverness expansion project.
Gain on Asset Exchange – Included in the fourth quarter of 2016 is a $16 million ($0.19 per basic and diluted share) gain recognized on the Quebec Asset Exchange transaction (see Quebec Mill Exchange).

26 NORBORD 2017 ANNUAL REPORT
Other Costs Incurred to Achieve Merger Synergies – Included in the fourth quarter of 2016 is $1 million ($0.01 per basic and diluted share) of other costs incurred to achieve synergies from the Merger including consulting and professional fees. Included in the third quarter of 2016 is $4 million ($0.05 per basic and diluted share) of other costs incurred to achieve synergies from the Merger, including consulting and professional fees, and costs expensed to dismantle certain idle equipment at the Grande Prairie, Alberta mill which was moved to be used in the Inverness project. Included in the second quarter of 2016 is $2 million ($0.02 per basic and diluted share) of other costs incurred to achieve synergies from the Merger including consulting and professional fees. Included in the first quarter of 2016 is $1 million ($0.01 per basic and diluted share) of similar costs (see Merger with Ainsworth).
Costs Related to High Level Fire – Included in the second quarter of 2016 is a $1 million ($0.01 per basic and diluted share) insurance claim deductible related to the High Level fire that occurred during the quarter.
The following table reconciles Adjusted earnings to the most directly comparable IFRS measure:
(US $ millions) Q4 2017 Q3
2017 Q2 2017 Q1
2017 Q4 2016 Q3
2016 Q2 2016 Q1
2016
Earnings $ 160 $ 130 $ 97 $ 49 $ 61 $ 55 $ 44 $ 23
Add: Loss on disposal of assets 3 2 2 5 — — — —
Add: Stock-based compensation and related costs
—
1
1
1
1
1
—
—
Add: Pre-operating costs related to Inverness project
—
1
—
—
—
—
—
—
Less: Gain on Asset Exchange — — — — (16 ) — — —
Add: Other costs incurred to achieve Merger synergies
—
—
—
—
1
4
2
1
Add: Costs related to High Level fire
—
—
—
—
—
—
1
—
Add: Reported income tax expense
6
32
30
13
29
19
10
3
Adjusted pre-tax earnings 169 166 130 68 76 79 57 27
Less: Income tax expense at statutory rate(1) (46 ) (45 ) (35 ) (18 ) (21 ) (21 ) (16 ) (7 )
Adjusted earnings $ 123 $ 121 $ 95 $ 50 $ 55 $ 58 $ 41 $ 20
(1) Represents Canadian combined federal and provincial statutory rate.

NORBORD 2017 ANNUAL REPORT 27
The following table reconciles Adjusted EBITDA to the most directly comparable IFRS measure:
(US $ millions) Q4 2017 Q3
2017 Q2 2017 Q1
2017 Q4 2016 Q3
2016 Q2 2016 Q1
2016
Earnings $ 160 $ 130 $ 97 $ 49 $ 61 $ 55 $ 44 $ 23
Add: Finance costs 6 7 8 11 13 13 13 13
Add: Depreciation and amortization
29
27
27
24
26
23
24
21
Add: Income tax expense 6 32 30 13 29 19 10 3
Add: Loss on disposal of assets 3 2 2 5 — — — —
Add: Stock-based compensation and related costs —
1
1
1
1
1
—
—
Add: Pre-operating costs related to Inverness project —
1
—
—
—
—
—
—
Less: Gain on Asset Exchange — — — — (16 ) — — —
Add: Other costs incurred to achieve Merger synergies
—
—
—
—
1
4
2
1
Add: Costs related to High Level fire
—
—
—
—
—
—
1
—
Adjusted EBITDA $ 204 $ 200 $ 165 $ 103 $ 115 $ 115 $ 94 $ 61
FOURTH QUARTER RESULTS Sales in the quarter were $596 million, compared to $578 million in the third quarter of 2017 and $482 million in the fourth quarter of 2016. Quarter-over-quarter, sales increased by $18 million primarily due to higher North American OSB prices and shipment volumes. Year-over-year, sales increased by $114 million primarily due to higher North American OSB prices, partially offset by a decrease in North American shipment volumes due to fewer fiscal days.
In the fourth quarter, North Central benchmark OSB prices averaged $379 per Msf (7⁄16-inch basis). The table below summarizes benchmark OSB prices by region for the relevant quarters:
North American Region
% of Norbord’s Estimated
Annual Operating Capacity(1)
Q4 2017 ($/Msf–7/16")
Q3 2017 ($/Msf–7/16")
Q4 2016 ($/Msf–7/16")
North Central 14 % $ 379 $ 409 $ 285
South East 38 % 355 354 263
Western Canada 30 % 328 388 236
(1) Excludes the indefinitely curtailed Chambord, Quebec mill which represents 6% of estimated annual capacity.
In local currency terms, European average panel prices improved by 4% quarter-over-quarter and 17% year-over-year.
In North America, shipments were 2% higher than the prior quarter due to improved OSB demand supported by increased mill productivity. Shipments were down 2% compared to the same quarter last year due to six fewer fiscal days in the current quarter. In Europe, shipment volumes were down by 7% compared to the prior quarter primarily due to seasonality. European shipments were 2% lower compared to the same quarter last year due to fewer fiscal days.
Norbord’s North American OSB operating mills produced at 94% of capacity in the fourth quarter of 2017 (excluding the portion of the quarter that the Huguley mill was curtailed), compared to 97% in the third quarter of 2017 and 94% in the fourth quarter of 2016. Norbord’s European mills produced at 94% of capacity in the fourth quarter of 2017 (excluding the portion of the quarter that the new OSB line at Inverness, Scotland was being constructed), compared to 100% in the third quarter of 2017 and 95% in the fourth quarter of 2016.
Norbord recorded operating income of $172 million in the fourth quarter of 2017, $169 million in the third quarter of 2017 and $87 million in the fourth quarter of 2016. Norbord’s Adjusted EBITDA for the fourth quarter was up $4 million from the third quarter of 2017 and up $89 million from the fourth quarter of 2016. Operating income and Adjusted EBITDA have increased versus both comparative periods primarily due to higher North American OSB prices.

28 NORBORD 2017 ANNUAL REPORT
Adjusted EBITDA changes are summarized in the variance table below:
(US $ millions) Q4 2017
vs. Q3 2017
Q4 2017 vs.
Q4 2016
Adjusted EBITDA – current period $ 204 $ 204 Adjusted EBITDA – comparative period 200 115
Variance 4 89 Mill nets(1) 21 115 Volume(2) — (5 ) Key input prices(3) (1 ) (11 ) Key input usage(3) (8 ) (2 ) Mill profit share and bonus — (4 ) Other operating costs and foreign exchange(4) (8 ) (4 ) Total $ 4 $ 89
(1) The mill nets variance represents the estimated impact of changes in realized pricing across all products. Mill nets are calculated as sales (net of outbound freight costs) divided by shipment volume.
(2) The volume variance represents the impact of shipment volume changes across all products. (3) The key inputs include fibre, resin, wax and energy. (4) The other operating costs and foreign exchange category covers all remaining variances including labour and benefits, maintenance, costs to prepare the Huguley mill for
restart and costs to start up the new Inverness line.
Adjusted EBITDA is generated from the following geographic segments:
(US $ millions) Q4 2017 Q3 2017 Q4 2016
North America $ 195 $ 184 $ 108 Europe 12 14 10 Unallocated (3 ) 2 (3 ) Total $ 204 $ 200 $ 115
Norbord’s North American operations generated Adjusted EBITDA of $195 million in the fourth quarter of 2017 versus $184 million in the third quarter of 2017 and $108 million in the fourth quarter of 2016. Quarter-over-quarter, the increase of $11 million was primarily attributed to higher OSB prices, improved productivity and lower input prices partially offset by the timing of annual maintenance shuts and seasonally higher raw material usages. The year-over-year increase of $87 million was primarily attributed to significantly higher OSB prices and improved productivity partially offset by the impact of fewer fiscal days, higher mill profit share costs attributed to higher earnings, higher resin prices, and costs to ramp up the restarted Huguley, Alabama mill.
In the fourth quarter, Norbord’s North American OSB cash production costs per unit (excluding mill profit share) increased 1% versus the third quarter of 2017 due to seasonally higher raw material usages and the timing of annual maintenance shuts, partially offset by lower input prices. Unit costs increased by 4% versus the fourth quarter of 2016 due to costs to ramp up the restarted Huguley, Alabama mill, fewer fiscal days and higher resin prices.
Norbord’s European operations generated Adjusted EBITDA of $12 million in the fourth quarter of 2017 which is $2 million lower than the third quarter of 2017 and $2 million higher than the same quarter last year. Quarter-over-quarter, higher average panel prices were more than offset by costs to start up the new Inverness line and seasonally higher raw material usages and prices. Year-over-year, higher average panel prices were only partially offset by costs to start up the new Inverness line and higher raw material prices and usages.
Unallocated costs were higher than the third quarter of 2017 and in line with the fourth quarter of 2016. The positive Adjusted EBITDA in the third quarter of 2017 is a result of the change in policy to reclassify gains and losses on the translation of foreign currency-denominated tax balances from general and administrative expenses to income tax expense (see Changes in Accounting Policies).

NORBORD 2017 ANNUAL REPORT 29
Norbord recorded earnings of $160 million ($1.85 per basic share and $1.84 per diluted share) in the fourth quarter of 2017, up from $130 million ($1.51 per basic share and $1.50 per diluted share) in the third quarter of 2017 and $61 million ($0.71 per basic and diluted share) in the fourth quarter of 2016. Included in the fourth quarter of 2017 is a $35 million net income tax recovery due to the impact of the US federal tax rate reduction from 35% to 21% on the remeasurement of deferred tax assets and liabilities.
Excluding the impact of non-recurring items and using a normalized Canadian statutory tax rate, Norbord recorded Adjusted earnings of $123 million ($1.42 per basic share and $1.41 per diluted share) in the fourth quarter of 2017 compared to $121 million ($1.40 per basic share and $1.39 per diluted share) in the prior quarter and $55 million ($0.64 per basic and diluted share) in the fourth quarter of 2016. Adjusted earnings increased versus both comparative periods primarily due to the higher Adjusted EBITDA.
FINANCIAL POLICIES Capital Allocation Norbord considers effective capital allocation to be critical to its success. Capital is invested only when Norbord expects returns to exceed pre-determined thresholds, taking into consideration both the degree and magnitude of the relative risks and rewards and, if appropriate, strategic considerations in the establishment of new business activities or maintenance of existing business activities. Post-investment reviews are conducted on capital investment decisions to assess the results against planned project returns.
Liquidity Norbord strives to maintain sufficient financial liquidity at all times in order to participate in attractive investment opportunities as they arise, and to withstand sudden adverse changes in economic circumstances. Management forecasts cash flows for its current and subsequent fiscal years in order to identify financing requirements. These requirements are then addressed through a combination of committed credit facilities and access to capital markets.
At year-end, the Company had unutilized liquidity of $592 million, comprising $241 million in cash and cash equivalents, $125 million undrawn under its accounts receivable securitization program and $226 million in unutilized committed revolving bank lines with nine international financial institutions, available to support its liquidity requirements.
Credit Ratings Maintaining a stable balance sheet is an important element of Norbord’s financing strategy. Norbord believes that its record of superior operational performance and prudent balance sheet management will enable it to access public and private capital markets (subject to financial market conditions).
At February 1, 2018, Norbord’s long-term debt and issuer ratings were:
DBRS Standard & Poor’s Ratings
Services Moody’s Investors
Service
Secured notes BB BB+(1) Ba1(2) Issuer BB BB(1) Ba1(2) Outlook Stable(3) Stable(1) Stable
(1) Ratings on both the secured notes and the issuer were upgraded from BB- and the Outlook was revised from Positive in August 2017. (2) Ratings on both the secured notes and the issuer were upgraded from Ba2 in March 2017. (3) Outlook upgraded from Negative in May 2017.
Credit ratings are intended to provide investors with an independent measure of the credit quality of any securities issue. The credit ratings accorded to debt securities by the rating agencies are not recommendations to purchase, hold or sell the debt securities, as such ratings do not comment on market price or suitability for a particular investor. There is no assurance that any rating will remain in effect for any given period of time or that any rating will not be revised or withdrawn entirely by a rating agency in the future if, in its judgement, circumstances warrant.
30 NORBORD 2017 ANNUAL REPORT
Use of Financial Instruments Norbord uses derivative financial instruments solely for the purpose of managing its interest rate, foreign exchange and commodity price exposures, as further detailed in the Risks and Uncertainties section. These activities are governed by Board-approved financial policies that cover risk identification, tolerance, measurement and reporting. Derivative transactions are executed only with approved high-quality counterparties under master netting agreements. Derivative contracts that are deemed to be highly effective in offsetting changes in the fair value, net investment or cash flows of hedged items are designated as hedges of specific exposures and, accordingly, all gains and losses on these instruments are recognized in the same manner as the item being hedged.
CHANGES IN ACCOUNTING POLICIES (i) Income Taxes
In January 2016, the International Accounting Standards Board (IASB) issued amendments to clarify the requirements for recognizing deferred tax assets on unrealized losses. The amendments clarify the accounting for deferred tax where an asset is measured at fair value and that fair value is below the asset’s tax base. They also clarify certain other aspects of accounting for deferred tax assets. The amendments became effective for the Company on January 1, 2017 and did not have a material impact on its financial statements.
(ii) Cash Flow Statement Disclosure In January 2016, the IASB issued an amendment to IAS 7, Statement of Cash Flows, introducing additional disclosure requirements for liabilities arising from financing activities. The amendment became effective for the Company on January 1, 2017 and the additional disclosure has been included in the supplemental cash flow information (note 16) accordingly.
(iii) Foreign Currency Translation Effective April 2, 2017, the Company changed its policy on the classification of gains and losses on translation of foreign currency-denominated deferred tax assets and liabilities, taxes payable and receivable, and investment tax credit receivable. Gains and losses on these items are included in earnings and reported as income tax expense (previously reported as general and administrative expenses). The effect of this classification change on prior period comparative balances was $1 million and the balances were not required to be restated.
FUTURE CHANGES IN ACCOUNTING POLICIES (i) Financial Instruments
In July 2014, the IASB issued the final publication of IFRS 9, Financial Instruments (IFRS 9), superseding IAS 39, Financial Instruments. IFRS 9 includes amended guidance for the classification and measurement of financial assets by introducing a fair value through other comprehensive income category for certain debt instruments. It also includes a new general hedge accounting standard which will align hedge accounting more closely with risk management and contains a new impairment model which could result in earlier recognition of losses. Norbord intends to adopt IFRS 9 in its financial statements for the annual period beginning on January 1, 2018. Norbord has assessed its financial instruments and does not expect the standard to have a material impact on its financial statements or accounting policies.
(ii) Revenue from Contracts with Customers In May 2014, the IASB issued IFRS 15, Revenue from Contracts with Customers (IFRS 15), which replaces the existing revenue recognition guidance with a new framework to determine the timing of revenue recognition and the measurement of revenue. In September 2015, the IASB formalized a one-year deferral of the effective date to the year beginning on or after January 1, 2018. In April 2016, the IASB issued an amendment clarifying the guidance on identifying performance obligations, licences of intellectual property and principal versus agent, and to provide additional practical expedients upon transition. Norbord intends to adopt IFRS 15 and the clarifications in its financial statements for the annual period beginning on January 1, 2018. Norbord has undertaken a comprehensive review of its significant contracts in accordance with the five-step model in IFRS 15 to determine the impact on the timing and measurement of its revenue recognition. Based on this review, Norbord does not expect the standard to have a material impact on its financial statements or accounting policy.
NORBORD 2017 ANNUAL REPORT 31
(iii) Share-based Payment In June 2016, the IASB issued an amendment to IFRS 2, Share-based Payment, clarifying the accounting for certain types of share-based payment transactions. The amendment provides requirements on accounting for the effects of vesting and non-vesting conditions of cash-settled share-based payments, withholding tax obligations for share-based payments with a net settlement feature, and when a modification to the terms of a share-based payment changes the classification of the transaction from cash-settled to equity-settled. Norbord intends to adopt the amendment to IFRS 2 in its financial statements for the annual period beginning on January 1, 2018. Norbord has assessed its share-based payment transactions and does not expect the amendment to have a material impact on its financial statements or accounting policy.
(iv) Foreign Currency Transactions and Advance Consideration In December 2016, the IFRS Interpretations Committee of the IASB issued IFRIC 22, Foreign Currency Transactions and Advance Consideration (IFRIC 22). The interpretation addresses how to determine the date of the transaction when applying IAS 21, The Effects of Changes in Foreign Exchange Rates. The date of transaction determines the exchange rate to be used on initial recognition of the related asset, expense or income. Norbord intends to adopt IFRIC 22 in its financial statements for the annual period beginning on January 1, 2018. Norbord has assessed its foreign currency transactions and does not expect the interpretation to have a material impact on its financial statements or accounting policy.
(v) Leases In January 2016, the IASB issued IFRS 16, Leases (IFRS 16), which replaces the existing lease accounting guidance. IFRS 16 requires all leases to be reported on the balance sheet unless certain criteria for exclusion are met. Norbord intends to adopt IFRS 16 in its financial statements for the annual period beginning on January 1, 2019. The Company is currently assessing the impact of IFRS 16 on its financial statements.
(vi) Uncertainty over Income Tax Treatments In June 2017, the IFRS Interpretations Committee of the IASB issued IFRIC 23, Uncertainty over Income Tax Treatments (IFRIC 23). The interpretation provides guidance on the accounting for current and deferred tax liabilities and assets in circumstances in which there is uncertainty over income tax treatments. The interpretation is effective for the annual period beginning on January 1, 2019. The Company is currently assessing the impact of IFRIC 23 on its financial statements.
SIGNIFICANT ACCOUNTING POLICIES, JUDGEMENTS AND ESTIMATES The preparation of financial statements in conformity with IFRS requires management to select appropriate accounting policies to make estimates and assumptions that affect the reported amounts of assets and liabilities and disclosure of contingent assets and liabilities at the date of the financial statements, and the reported amounts of revenues and expenses during the reporting period. In particular, significant accounting policies, judgements and estimates utilized in the normal course of preparing the Company’s financial statements require management to make critical determinations that affect the reported amounts of assets, liabilities, revenues, expenses and disclosure of contingent assets and liabilities. Actual results could materially differ from those estimates. For further information on the Company’s significant accounting policies, refer to note 2 of the consolidated financial statements.
In making estimates and judgements, management relies on external information and observable conditions where possible, supplemented by internal analysis as required. These estimates and judgements have been applied in a manner consistent with prior periods and there are no known trends, commitments, events or uncertainties that we believe will materially affect the methodology or assumptions utilized in making these estimates and judgements in these financial statements. The significant estimates and judgements used in determining the recorded amount for assets and liabilities in the financial statements include the following:
Judgements Management’s judgements made in applying accounting policies that have the most significant effect on the amounts recognized in the consolidated financial statements are:
(i) Functional Currency The Company assesses the relevant factors related to the primary economic environment in which its entities operate to determine the functional currency.
32 NORBORD 2017 ANNUAL REPORT
(ii) Income Taxes In the normal course of operations, judgement is required in assessing tax interpretations, regulations and legislation and in determining the provision for income taxes, deferred tax assets and liabilities. To the extent that a recognition or derecognition of a deferred tax asset is required, current period earnings or other comprehensive income (OCI) will be affected.
Estimates Assumptions and estimation uncertainties that have a significant risk of resulting in a material adjustment in the year ended December 31, 2017 are:
(i) Inventory The Company estimates the net realizable value of its finished goods and raw material inventory using estimates regarding future selling prices. The net realizable value of operating and maintenance supplies inventory uses estimates regarding replacement costs.
(ii) Property, Plant and Equipment and Intangible Assets When indicators of impairment are present and the recoverable amount of property, plant and equipment and intangible assets needs to be determined, the Company uses the following critical estimates: the timing of forecasted revenues; future selling prices and margins; future sales volumes; maintenance and other capital expenditures; discount rates; useful lives; and residual values.
(iii) Employee Benefit Plans The net obligations associated with the defined benefit pension plans are actuarially valued using: the projected unit credit method; management’s best estimates for salary escalation, inflation and life expectancy; and a current market discount rate to match the timing and amount of pension payments.
(iv) Income Taxes Current income tax assets and liabilities are measured at the amount expected to be paid to tax authorities, net of recoveries, based on the tax rates and laws enacted or substantively enacted at the balance sheet date.
Deferred income tax assets are recognized for all deductible temporary differences, carryforward of unused tax credits and unused tax losses, to the extent that it is probable that the deductions, tax credits and tax losses can be utilized. Deferred income tax assets and liabilities are measured at the tax rates that are expected to apply to the year when the asset is realized or the liability settled, based on the tax rates and laws that have been enacted or substantively enacted at the balance sheet date.
(v) Financial Instruments The critical assumptions and estimates used in determining the fair value of financial instruments are: equity and commodity prices; future interest rates; the relative creditworthiness of the Company to its counterparties; estimated future cash flows; discount rates; and volatility utilized in option valuations.

NORBORD 2017 ANNUAL REPORT 33
RISKS AND UNCERTAINTIES Norbord is exposed to a number of risks and uncertainties in the normal course of its business which could have a material adverse effect on the Company’s business, financial position, operating results and cash flows. A discussion of some of the major risks and uncertainties follows.
Product Concentration and Cyclicality OSB accounts for approximately 90% of Norbord’s panel production capacity. The price of OSB is one of the most volatile in the wood products industry. Norbord’s concentration on OSB increases its sensitivity to product pricing and may result in a high degree of sales and earnings volatility.
Norbord’s financial performance is principally dependent on the selling price of its products. Most of Norbord’s products are traded commodities for which no liquid futures markets exist. The markets for most of Norbord’s products are highly cyclical and characterized by periods of supply and demand imbalance, during which its product prices have tended to fluctuate significantly. In addition, since many of Norbord’s products are used for new home construction, seasonal and annual weather changes can affect demand and sales volumes. These imbalances, which may affect different areas of Norbord’s business at different times, are influenced by numerous factors that are beyond Norbord’s control and include: changes in global and regional production capacity for a particular product or group of products; changes in the end use of those products, or the increased use of substitute products; a significant increase in longer-term interest rates; changes in the availability of mortgage financing; and the overall level of economic activity in the regions in which Norbord conducts business. In the past, Norbord has been negatively affected by declines in product pricing and has taken production downtime to manage working capital and minimize cash losses. Severe and prolonged weakness in the markets for Norbord’s products, particularly OSB, could seriously harm the Company’s financial position, operating results and cash flows, including the ability to satisfy interest and principal payments on outstanding debt.
Based on operations running at full capacity, the following table shows the approximate annualized impact of changes in realized product prices on Adjusted EBITDA:
Sensitivity Factor Impact on Adjusted EBITDA
(US $ millions)
OSB – North America $10 per Msf–7/16" $59 OSB – Europe €10 per m3 12
Liquidity Norbord relies on long-term borrowings, access to revolving bank lines and an accounts receivable securitization program to fund its ongoing operations. The Company’s ability to refinance or renew such facilities is dependent upon financial market conditions. Although Norbord has notes maturing in 2020 and 2023 and has bank lines that are committed to May 2019, financing may not be available when required or may not be available on commercially favourable or otherwise satisfactory terms in the future.
Competition The wood-based panels industry is a highly competitive business environment in which companies compete, to a large degree, on the basis of price. Norbord’s principal market is the US, where it competes with North American and, in some instances, foreign producers. Norbord’s European operations compete primarily with other European producers. Certain competitors may have lower-cost facilities than Norbord. Norbord’s ability to compete in these and other markets is dependent on a variety of factors, such as manufacturing costs, availability of key production inputs, continued free access to markets, customer service, product quality, financial resources and currency exchange rates. In addition, competitors could develop new cost-effective substitutes for Norbord’s wood-based panels, or building codes could be changed making the use of Norbord’s products less attractive for certain applications.
Customer Dependence Norbord sells its products primarily to major retail chains, contractor supply yards and industrial manufacturers, and faces strong competition for the business of significant customers. In 2017, Norbord had one customer whose purchases represented greater than 10% of total sales. Norbord generally does not have contractual assurances of future sales. As a result, the loss of a significant customer or any significant customer order cancellations could negatively affect the Company’s sales and earnings. Continued consolidation in the retail industry could expose Norbord to increased concentration of customer dependence and increase customers’ ability to exert pricing pressure on Norbord.

34 NORBORD 2017 ANNUAL REPORT
Cross Border Trade Norbord’s future performance is dependent upon international trade and, in particular, cross border trade between Canada and the United States and between the United Kingdom and European Union. Access to markets in the United States and other countries may be affected from time to time by various trade-related events. The Company’s financial condition and results of operations could be materially adversely affected by trade rulings, the failure to reach or adopt trade agreements, the imposition of customs duties or other tariffs, or an increase in trade restrictions in the future.
Manufacturing Inputs Norbord is exposed to commodity price risk on most of its manufacturing inputs, which principally comprise wood fibre, resin, wax and energy. These manufacturing inputs are purchased primarily on the open market in competition with other users of such resources, and prices are influenced by factors beyond the Company’s control. Norbord may not be able to hedge the purchase price of manufacturing inputs or pass increased costs on to its customers.
Fibre Resource Fibre for Norbord’s OSB mills comes from roundwood logs while the MDF and particleboard mills source fibre in the form of roundwood logs, wood chips, sawdust and recycled wood. Norbord’s wood fibre supply comes from several different sources. In the US, roundwood logs are primarily sourced from private and industry-owned woodlands. In Canada, Norbord holds forest licences and agreements to source roundwood logs from Crown timberlands, which are supplemented by open market and private purchases. In Europe, wood fibre is purchased from government and private landowners.
When Norbord purchases timber, wood chips, fibre and other wood recycled materials on the open market, it is in competition with other uses of such resources, where prices are influenced by factors beyond Norbord’s control. Fibre supply could also be influenced by natural events, such as forest fires, severe weather conditions, insect epidemics and other natural disasters, which may increase wood fibre costs, restrict access to wood fibre or force production curtailments. In addition, Norbord’s supply and cost of fibre may be negatively impacted by increased demand resulting from market-based or legislative initiatives to use wood-based biomass materials in the production of heat, electricity or other bio-based products.
In Canada, the Crown licences and agreements require the payment of stumpage fees for the timber harvested and compliance with specified operating, rehabilitation and silviculture management practices. They can be revoked or cancelled for non-performance and contain terms and conditions that could, under certain circumstances, result in a reduction of annual allowable timber that may be harvested by Norbord without any compensation. The Company may not be able to renew or replace the Crown licences when they come due. Any changes to government regulations and policies governing forest management practices could adversely affect the Company’s access to, or increase the cost of, wood fibre.
Aboriginal groups have claimed substantial portions of land in various Canadian provinces over which they claim aboriginal title, or in which they have a traditional interest, and for which they are seeking compensation from various levels of government. The results of these claims and related forest policy mechanisms may adversely affect the supply of wood fibre and the commercial terms of supply agreements with provincial governments.
Currency Exposures Norbord reports its financial results in US dollars. A portion of Norbord’s product prices and costs are influenced by relative currency values (particularly the Canadian dollar, Pound Sterling and Euro). Significant fluctuations in relative currency values could negatively affect the cost competitiveness of the Company’s facilities, the value of its foreign investments, the results of its operations and its financial position.
Norbord’s foreign exchange exposure arises from the following sources:
• net investments in foreign operations, limited to Norbord’s investment in its European operations which transact in both Pounds Sterling and Euros;
• net Canadian dollar-denominated monetary assets and liabilities; and
• committed or anticipated foreign currency-denominated transactions, primarily Canadian dollar costs in Norbord’s Canadian operations and Euro revenues in Norbord’s UK operations.
NORBORD 2017 ANNUAL REPORT 35
Third-Party Transportation Services Norbord relies on third-party transportation services for delivery of products to customers as well as for delivery of raw materials from suppliers. The majority of products manufactured and raw materials used are transported by rail or truck, which are highly regulated. Transportation rates and fuel surcharges are influenced by factors beyond Norbord’s control. Any failure of third-party transportation providers to deliver finished goods or raw materials in a timely manner, including failure caused by adverse weather conditions, could harm the Company’s reputation, negatively affect customer relationships or disrupt production at the Company’s mills.
Employee Retention and Labour Relations Norbord’s success depends in part on its ability to attract and retain senior management and other key employees. Competition for qualified personnel depends on economic and industry conditions, competitors’ hiring practices and the effectiveness of Norbord’s compensation programs. The loss of, or inability to recruit and retain, any such personnel could impact the Company’s ability to execute on its strategy.
Norbord’s US employees are non-unionized while its UK, Belgian and most of its Canadian mill employees are unionized – representing approximately 35% of the workforce. All of Norbord’s UK and Belgian union contracts are evergreen. Canadian union contracts typically cover a three- to five-year term, and the current contracts with Unifor representing members at the OSB mills in La Sarre, Quebec and Chambord, Quebec expire June 30, 2021 and June 1, 2026, respectively. The contract with Unifor representing members at the Barwick, Ontario mill expired on July 31, 2017 and is currently being renegotiated. The contract with the Pulp, Paper and Woodworkers of Canada (PPWC) representing members at the OSB mill in 100 Mile House, British Columbia expired on June 30, 2017 and is currently being renegotiated. Strikes or work stoppages could result in lost production and sales, higher costs or supply constraints if Norbord is unable to negotiate acceptable contracts with its various trade unions upon expiry.
Environmental and Other Regulations Norbord’s operations are subject to a range of general and industry-specific laws and regulations that apply to most of the Company’s business activities. This includes environmental laws and regulations relating to air emissions, wastewater discharges, solid and hazardous waste management, plant and wildlife protection and site remediation. Further, the Company is required to obtain approvals, permits and licences for the operation of its manufacturing facilities which impose conditions that must be complied with. Failure to comply with applicable laws and regulations could result in fines, penalties or other enforcement actions that could impact Norbord’s production capacity or increase its production costs. The Company has incurred, and expects to continue to incur, capital expenditures and operating costs to comply with applicable laws and regulations. In addition, laws and regulations could become more stringent or subject to different interpretation in the future.
International Sales A portion of the Company’s sales are exported to customers in developing markets. International sales present a number of risks and challenges, including but not limited to the effective marketing of the Company’s products in foreign countries, collectability of accounts receivable, tariffs and other barriers to trade and recessionary environments in foreign economies. Although the Company purchases credit insurance on all export sales, revenues could be negatively impacted by any customer losses.
Product Liability and Legal Proceedings Norbord produces a variety of wood-based panels that are used in new home construction, repair-and-remodelling of existing homes, furniture and fixtures, and industrial applications. In the normal course of business, the end users of Norbord’s products have in the past made, and could in the future make, claims with respect to the fitness for use of its products or claims related to product quality or performance issues. In addition, Norbord has been in the past and may in the future be involved in legal proceedings related to antitrust, negligence, personal injury, property damage and other claims against the Company or its predecessors. Norbord could face increased costs if any future claims exceed purchased insurance coverage.
Capital Intensity The production of wood-based panels is capital intensive. There can be no assurance that key pieces of equipment will not need to be repaired or replaced, or that operation of the Company’s manufacturing facilities could not otherwise be disrupted unexpectedly, for example by adverse weather, power outages, fire, explosion or other hazards. In certain circumstances, the costs of repairing or replacing equipment, and the associated downtime of the affected production line, may not be insurable.
36 NORBORD 2017 ANNUAL REPORT
Tax Exposures In the normal course of business, Norbord takes various positions in the filing of its tax returns, and there can be no assurance that tax authorities will not challenge such filing positions. In addition, Norbord is subject to further uncertainties concerning the interpretation and application of tax laws in various operating jurisdictions. Norbord provides for known estimated tax exposures in all jurisdictions. These exposures are settled primarily through the closure of audits with the jurisdictional taxing authorities. However, future settlements could differ materially from the Company’s estimated liabilities.
Potential Future Changes in Tax Laws The Company’s structure is based on prevailing taxation law and practice in the local jurisdictions in which it operates. The Company is aware that new taxation rules could be enacted or that existing rules could be applied in a manner that subjects its profits to additional taxation or otherwise has a material adverse effect on its profitability, results of operations, financial condition or the trading price of its securities. Management is continually monitoring changes in tax policy, tax legislation (including in relation to taxation rates), and the interpretation of tax policy or legislation or practice that could have such an effect.
US Tax Reform Legislation On December 22, 2017, the US government enacted H.R. 1, An Act to provide for reconciliation pursuant to titles II and V of the concurrent resolution on the budget for fiscal year 2018 (informally titled the Tax Cuts and Jobs Act). Among a number of significant changes to the US federal income tax laws, the Tax Cuts and Jobs Act reduces the marginal US corporate income tax rate from 35% to 21%, limits the deduction for net interest expense, shifts the US toward a modified territorial tax system, and imposes new taxes to combat erosion of the US federal income tax base. Although the Company has recognized a net income tax recovery due to the reduction of the income tax rate, the long-term tax effect of the Tax Cuts and Jobs Act on Norbord, whether adverse or favourable, is uncertain, and may not become evident for some period of time.
Defined Benefit Pension Plan Funding Although Norbord’s defined benefit pension plans are largely closed to new entrants, the Company continues to be subject to market risk on the plan assets and obligations related to existing members. Defined benefit pension plan funding requirements are based on actuarial valuations that make assumptions about the long-term expected rate of return on assets, salary escalation, life expectancy and discount rates. The Company’s latest funding valuations indicate the plans are in a solvency deficit position and therefore Norbord is required to make cash funding contributions. If actual experience differs from these assumptions or any of these assumptions change such that the solvency deficit increases, the Company would be required to increase cash funding contributions, reducing the availability of such funds for other corporate purposes.
Information Technology Infrastructure In order to optimize performance, the Company regularly implements business process improvement initiatives and invests capital to upgrade its information technology infrastructure. These initiatives may involve risks to the operations and the Company may experience difficulties during the transition to these new or upgraded systems and processes. Difficulties in implementing new or upgraded information systems or significant system failures could disrupt operations and have a material adverse effect on the business.
Cyber Security Norbord relies on information technology to support the Company’s operations and to maintain business records. Some systems are internally managed and some are maintained by third-party service providers. Norbord and its service providers employ what the Company believes are adequate security measures. A security failure of that technology, security breaches of company, customer, employee and vendor information as well as a disruption of business resulting from a natural disaster, hardware or software corruption, failure or error, telecommunications system failure, service provider error, intentional or unintentional personnel actions or other disruptions could disrupt operations and have a material adverse effect on the business. Further, such disruptions could expose the Company to potential liability or other proceedings by affected individuals, business partners and/or regulators. As a result, Norbord could face increased costs if any future claims exceed purchased insurance coverage.

NORBORD 2017 ANNUAL REPORT 37
ASSESSMENT OF AND CHANGES IN INTERNAL CONTROLS AND DISCLOSURE CONTROLS OVER FINANCIAL REPORTING In accordance with the requirements of National Instrument 52-109, Certification of Disclosure in Issuers’ Annual and Interim Filings (NI 52-109), the Company’s management, including the Chief Executive Officer (CEO) and Chief Financial Officer (CFO), has evaluated the operating effectiveness of the Company’s internal control over financial reporting. Management of Norbord is responsible for establishing and maintaining adequate internal control over financial reporting. Internal control over financial reporting is a process designed by, or under the supervision of, the CEO and CFO, and it is effected by management and other personnel to provide reasonable assurance regarding the reliability of financial reporting and the preparation of financial statements for external purposes in accordance with IFRS as issued by the IASB.
Management assessed the effectiveness of the Company’s internal control over financial reporting as of December 31, 2017 and management believes that the Company’s internal control over financial reporting is operating effectively. Management’s assessment was based on the framework established in Internal Control–Integrated Framework (2013) issued by the Committee of Sponsoring Organizations of the Treadway Commission. Based on this evaluation, the CEO and CFO have concluded that Norbord’s internal control over financial reporting, as defined in NI 52-109, is designed and operating effectively. There have been no changes in Norbord’s internal control over financial reporting during the year ended December 31, 2017 that have materially affected, or are reasonably likely to materially affect, its internal control over financial reporting.
Disclosure controls and procedures are designed to provide reasonable assurance that all relevant information is gathered and reported to senior management, including the CEO and CFO, on a timely basis so that appropriate decisions can be made regarding annual and interim financial statement disclosure. An evaluation of the effectiveness of the design and operation of disclosure controls and procedures was conducted as of December 31, 2017 by Norbord’s management, including the CEO and CFO. Based on this evaluation, the CEO and CFO have concluded that Norbord’s disclosure controls and procedures, as defined in NI 52-109, are effective.
NON-IFRS FINANCIAL MEASURES The following non-IFRS financial measures have been used in this MD&A. Non-IFRS financial measures do not have any standardized meaning prescribed by IFRS and are therefore unlikely to be comparable to similar measures presented by other companies. Each non-IFRS financial measure is defined below. Where appropriate, a quantitative reconciliation of the non-IFRS financial measure to the most directly comparable IFRS measure is provided.
Adjusted earnings (loss) is defined as earnings (loss) determined in accordance with IFRS before unusual or non-recurring items and using a normalized income tax rate. Non-recurring items include the gain on the Quebec Asset Exchange, costs related to the Merger, pre-operating costs related to the Inverness expansion project, foreign exchange on the Ainsworth Notes and fair value movements on the financial instrument associated with the Ainsworth Notes, and costs on early debt extinguishment. Other items include a non-cash loss on disposal of assets and stock-based compensation and related revaluation costs. The actual income tax expense (recovery) is added back (deducted) and a tax expense (recovery) calculated at the Canadian combined federal and provincial statutory rate is (deducted) added. Adjusted earnings (loss) per share is Adjusted earnings (loss) divided by the weighted average number of common shares outstanding.
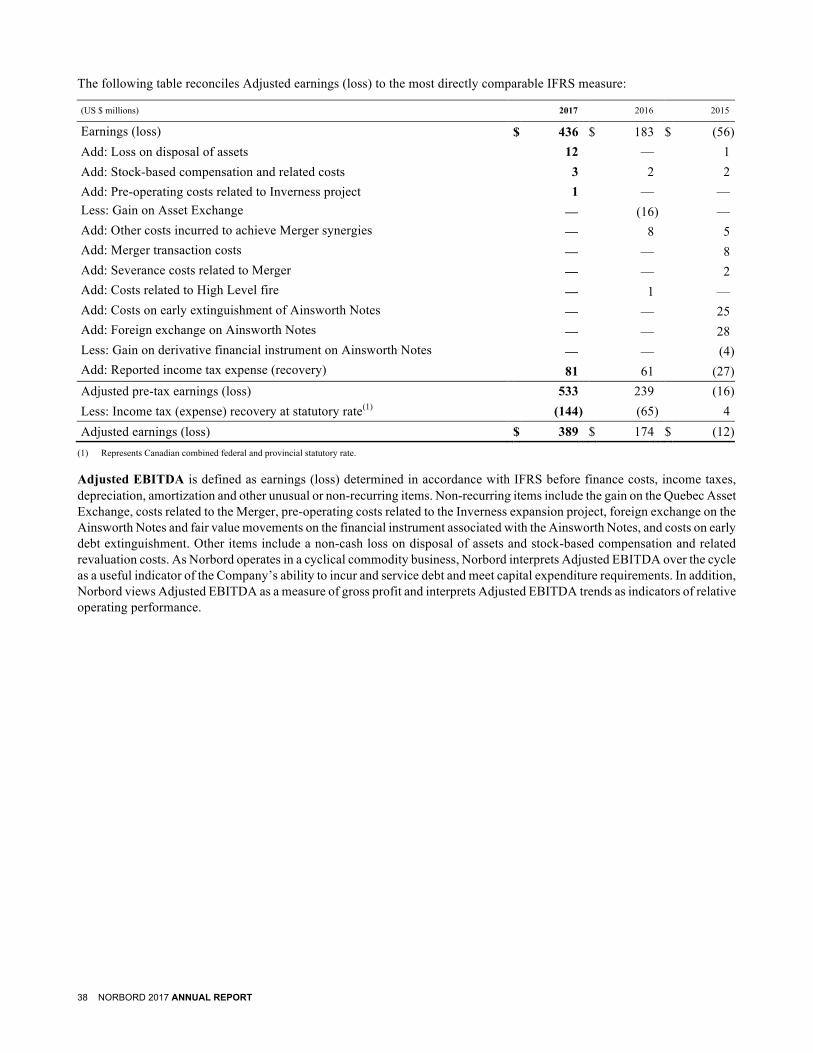
38 NORBORD 2017 ANNUAL REPORT
The following table reconciles Adjusted earnings (loss) to the most directly comparable IFRS measure:
(US $ millions) 2017 2016 2015
Earnings (loss) $ 436 $ 183 $ (56 ) Add: Loss on disposal of assets 12 — 1
Add: Stock-based compensation and related costs 3 2 2
Add: Pre-operating costs related to Inverness project 1 — —
Less: Gain on Asset Exchange — (16 ) —
Add: Other costs incurred to achieve Merger synergies — 8 5
Add: Merger transaction costs — — 8
Add: Severance costs related to Merger — — 2
Add: Costs related to High Level fire — 1 —
Add: Costs on early extinguishment of Ainsworth Notes — — 25
Add: Foreign exchange on Ainsworth Notes — — 28
Less: Gain on derivative financial instrument on Ainsworth Notes — — (4 ) Add: Reported income tax expense (recovery) 81 61 (27 ) Adjusted pre-tax earnings (loss) 533 239 (16 ) Less: Income tax (expense) recovery at statutory rate(1) (144 ) (65 ) 4
Adjusted earnings (loss) $ 389 $ 174 $ (12 ) (1) Represents Canadian combined federal and provincial statutory rate.
Adjusted EBITDA is defined as earnings (loss) determined in accordance with IFRS before finance costs, income taxes, depreciation, amortization and other unusual or non-recurring items. Non-recurring items include the gain on the Quebec Asset Exchange, costs related to the Merger, pre-operating costs related to the Inverness expansion project, foreign exchange on the Ainsworth Notes and fair value movements on the financial instrument associated with the Ainsworth Notes, and costs on early debt extinguishment. Other items include a non-cash loss on disposal of assets and stock-based compensation and related revaluation costs. As Norbord operates in a cyclical commodity business, Norbord interprets Adjusted EBITDA over the cycle as a useful indicator of the Company’s ability to incur and service debt and meet capital expenditure requirements. In addition, Norbord views Adjusted EBITDA as a measure of gross profit and interprets Adjusted EBITDA trends as indicators of relative operating performance.
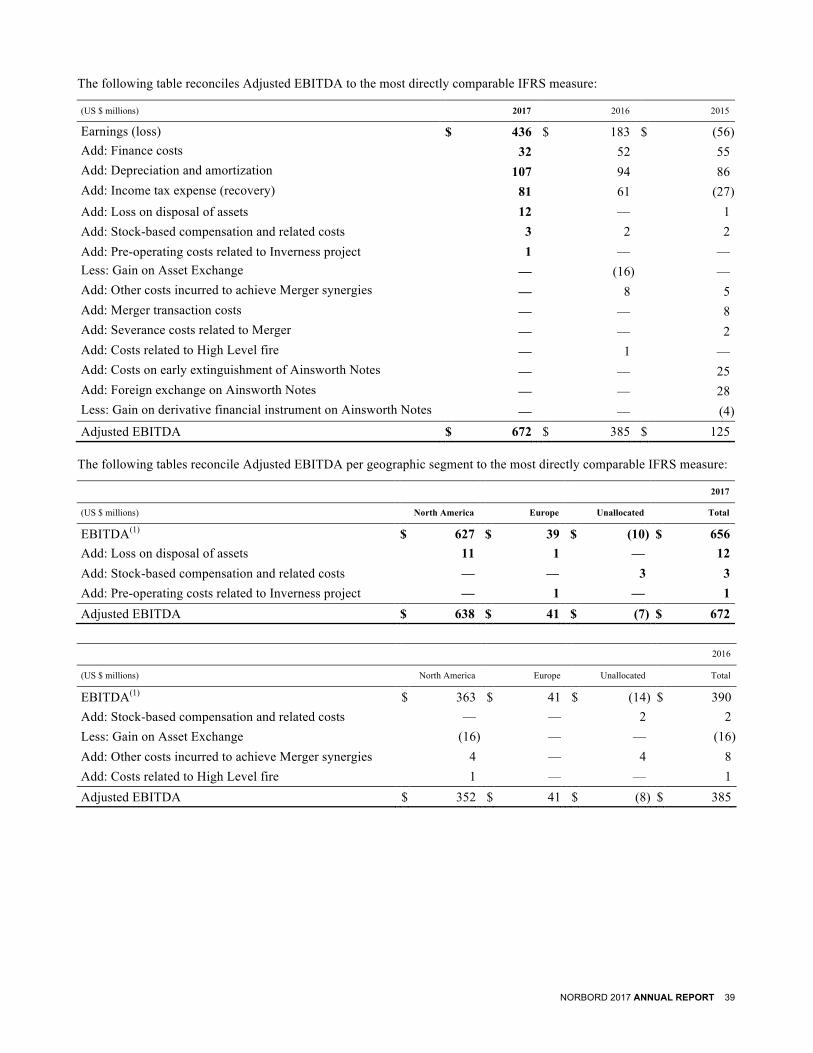
NORBORD 2017 ANNUAL REPORT 39
The following table reconciles Adjusted EBITDA to the most directly comparable IFRS measure:
(US $ millions) 2017 2016 2015
Earnings (loss) $ 436 $ 183 $ (56 ) Add: Finance costs 32 52 55
Add: Depreciation and amortization 107 94 86
Add: Income tax expense (recovery) 81 61 (27 ) Add: Loss on disposal of assets 12 — 1
Add: Stock-based compensation and related costs 3 2 2
Add: Pre-operating costs related to Inverness project 1 — —
Less: Gain on Asset Exchange — (16 ) —
Add: Other costs incurred to achieve Merger synergies — 8 5
Add: Merger transaction costs — — 8
Add: Severance costs related to Merger — — 2
Add: Costs related to High Level fire — 1 —
Add: Costs on early extinguishment of Ainsworth Notes — — 25
Add: Foreign exchange on Ainsworth Notes — — 28
Less: Gain on derivative financial instrument on Ainsworth Notes — — (4 ) Adjusted EBITDA $ 672 $ 385 $ 125
The following tables reconcile Adjusted EBITDA per geographic segment to the most directly comparable IFRS measure:
2017
(US $ millions) North America Europe Unallocated Total
EBITDA(1) $ 627 $ 39 $ (10 ) $ 656 Add: Loss on disposal of assets 11 1 — 12
Add: Stock-based compensation and related costs — — 3 3
Add: Pre-operating costs related to Inverness project — 1 — 1
Adjusted EBITDA $ 638 $ 41 $ (7 ) $ 672
2016
(US $ millions) North America Europe Unallocated Total
EBITDA(1) $ 363 $ 41 $ (14 ) $ 390 Add: Stock-based compensation and related costs — — 2 2
Less: Gain on Asset Exchange (16 ) — — (16 ) Add: Other costs incurred to achieve Merger synergies 4 — 4 8
Add: Costs related to High Level fire 1 — — 1
Adjusted EBITDA $ 352 $ 41 $ (8 ) $ 385

40 NORBORD 2017 ANNUAL REPORT
2015
(US $ millions) North America Europe Unallocated Total
EBITDA(1) $ 95 $ 38 $ (75 ) $ 58 Add: Stock-based compensation and related costs — — 2 2
Add: Loss on disposal of assets 1 — — 1
Add: Other costs incurred to achieve Merger synergies — — 5 5
Add: Merger transaction costs — — 8 8
Add: Severance costs related to Merger — — 2 2
Add: Costs on early extinguishment of Ainsworth Notes — — 25 25
Add: Foreign exchange on Ainsworth Notes — — 28 28
Add: Gain on derivative financial instrument on Ainsworth Notes
—
—
(4 ) (4 )
Adjusted EBITDA $ 96 $ 38 $ (9 ) $ 125 (1) EBITDA is defined as earnings before finance costs, income tax, depreciation and amortization.
EBITDA margin (%) is defined as Adjusted EBITDA as a percentage of sales. When compared with industry statistics and prior periods, Adjusted EBITDA margin can be a useful indicator of operating efficiency and a company’s ability to compete successfully with its peers. Norbord interprets Adjusted EBITDA margin trends as indicators of relative operating performance.
Operating working capital is defined as accounts receivable plus inventory plus prepaids less accounts payable and accrued liabilities. Operating working capital is a measure of the investment in accounts receivable, inventory, prepaids, accounts payable and accrued liabilities required to support operations. The Company aims to minimize its investment in operating working capital; however, the amount will vary with seasonality and with sales expansions and contractions.
(US $ millions) 2017 2016
Accounts receivable $ 174 $ 141 Inventory 224 185 Prepaids 11 10 Accounts payable and accrued liabilities (282 ) (218 ) Operating working capital $ 127 $ 118
Total working capital is operating working capital plus cash and cash equivalents and taxes receivable less bank advances, if any, and taxes payable.
(US $ millions) 2017 2016
Operating working capital $ 127 $ 118 Cash and cash equivalents 241 161 Taxes receivable 1 — Taxes payable (74 ) (1 ) Total working capital $ 295 $ 278

NORBORD 2017 ANNUAL REPORT 41
Capital employed is defined as the sum of property, plant and equipment, intangible assets and operating working capital. Capital employed is a measure of the total investment in a business in terms of property, plant and equipment, intangible assets and operating working capital.
(US $ millions) 2017 2016
Property, plant and equipment $ 1,421 $ 1,262 Intangible assets 24 22 Accounts receivable 174 141 Inventory 224 185 Prepaids 11 10 Accounts payable and accrued liabilities (282 ) (218 ) Capital employed $ 1,572 $ 1,402
ROCE (return on capital employed) is Adjusted EBITDA divided by average capital employed. ROCE is a measurement of financial performance, focusing on cash generation and the effective use of capital. As Norbord operates in a cyclical commodity business, it monitors ROCE over the cycle as a useful means of comparing businesses in terms of efficiency of management. Norbord targets top-quartile ROCE among North American forest products companies over the cycle.
ROE (return on equity) is Adjusted earnings (loss) divided by common shareholders’ equity. ROE is a measure that allows common shareholders to determine how effectively their invested capital is being employed. As Norbord operates in a cyclical commodity business, it looks at ROE over the cycle and targets top-quartile performance among North American forest products companies.
Cash provided by operating activities per share is calculated as cash provided by operating activities as determined under IFRS, divided by the weighted average number of common shares outstanding.
Net debt is the principal value of long-term debt, including the current portion, other long-term debt and bank advances, if any, less cash and cash equivalents. Net debt for financial covenant purposes is net debt excluding other long-term debt and including letters of credit outstanding. Net debt is a useful indicator of a company’s debt position. Net debt comprises:
(US $ millions) 2017 2016
Long-term debt, principal value $ 555 $ 755 Less: Cash and cash equivalents (241 ) (161 ) Net debt 314 594 Add: Letters of credit 19 25 Net debt for financial covenant purposes $ 333 $ 619
Tangible net worth consists of shareholders’ equity including certain adjustments. A minimum tangible net worth is one of two financial covenants contained in the Company’s committed bank lines. For financial covenant purposes, effective January 1, 2011, tangible net worth excludes all IFRS transitional adjustments and all movement in cumulative other comprehensive income subsequent to January 1, 2011 (includes those movements related to the translation of Ainsworth in prior periods).
(US $ millions) 2017 2016
Shareholders’ equity $ 1,019 $ 650 Add: Other comprehensive income movement(1) 53 79 Add: Impact of Ainsworth changing functional currencies 155 155 Add: IFRS transitional adjustments 21 21 Tangible net worth $ 1,248 $ 905
(1) Cumulative subsequent to January 1, 2011.
42 NORBORD 2017 ANNUAL REPORT
Net debt to capitalization, book basis, is net debt for financial covenant purposes divided by the sum of net debt for financial covenant purposes and tangible net worth. Net debt to capitalization on a book basis is a measure of a company’s relative debt position. Norbord interprets this measure as an indicator of the relative strength and flexibility of its balance sheet. In addition, a maximum net debt to capitalization, book basis, is one of two financial covenants contained in the Company’s committed bank lines.
Net debt to capitalization, market basis, is net debt for financial covenant purposes divided by the sum of net debt for financial covenant purposes and market capitalization. Market capitalization is the number of common shares outstanding at period-end multiplied by the trailing 12-month average per share market price. Net debt to capitalization, market basis, is a key measure of a company’s relative debt position and Norbord interprets this measure as an indicator of the relative strength and flexibility of its balance sheet. While the Company considers both book and market basis metrics, it believes the market basis to be superior to the book basis in measuring the true strength and flexibility of its balance sheet.
FORWARD-LOOKING STATEMENTS This document includes forward-looking statements, as defined by applicable securities legislation. Often, but not always, forward-looking statements can be identified by the use of words such as “believes,” “expects,” “targets,” “outlook,” “scheduled,” “estimates,” “represents,” “forecasts,” “aims,” “predicts,” “plans,” “projects,” “anticipates,” “intends,” “supports,” “continues,” “future” or variations of such words and phrases, or negative versions thereof, or statements that certain actions, events or results “may,” “could,” “would,” “should,” “might” or “will” be taken, occur or be achieved. Forward-looking statements involve known and unknown risks, uncertainties and other factors which may cause the actual results, performance or achievements of Norbord to be materially different from any future results, performance or achievements expressed or implied by the forward-looking statements.
Examples of such statements include, but are not limited to, comments with respect to: (1) outlook for the markets for products; (2) expectations regarding future product pricing; (3) outlook for operations; (4) expectations regarding mill capacity; (5) objectives; (6) strategies to achieve those objectives; (7) expected financial results including the expected results of the MIP; (8) sensitivity to changes in product prices, such as the price of OSB; (9) sensitivity to changes in foreign exchange rates; (10) sensitivity to key input prices, such as the price of fibre, resin, wax and energy; (11) expectations regarding compliance with environmental regulations; (12) expectations regarding income tax rates; (13) expectations regarding contingent liabilities and guarantees, including the outcome of pending litigation; (14) expectations regarding the amount, timing and benefits of capital investments; (15) expectations regarding the amount and timing of dividend payments; and (16) historical, forecasted and other forward-looking information published by third parties such as the US Census Bureau, FEA (Forest Economic Advisors, LLC), APA, Office for National Statistics and EUROCONSTRUCT which the Company may refer to but has not independently verified.
Although Norbord believes it has a reasonable basis for making these forward-looking statements, readers are cautioned not to place undue reliance on such forward-looking information. By its nature, forward-looking information involves numerous assumptions, inherent risks and uncertainties, both general and specific, which contribute to the possibility that the predictions, forecasts and other forward-looking statements will not occur. These factors include, but are not limited to: (1) assumptions in connection with the economic and financial conditions in the US, Europe, Canada and globally; (2) risks inherent to product concentration and cyclicality; (3) effects of competition and product pricing pressures; (4) risks inherent to customer dependence; (5) effects of variations in the price and availability of manufacturing inputs, including continued access to fibre resources at competitive prices; (6) availability of transportation services, including rail services and port facilities; (7) various events that could disrupt operations, including natural or catastrophic events and ongoing relations with employees; (8) impact of changes to, or non-compliance with, environmental or other regulations; (9) impact of any product liability claims in excess of insurance coverage; (10) risks inherent to a capital intensive industry; (11) impact of future outcomes of tax exposures; (12) potential future changes in tax laws; (13) effects of currency exposures and exchange rate fluctuations; (14) future operating costs; (15) availability of financing; (16) impact of future cross border trade rulings or agreements; (17) ability to implement new or upgraded information technology infrastructure; and (18) impact of information technology service disruptions or failures.
The above list of important factors affecting forward-looking information is not exhaustive. Additional factors are noted elsewhere, and reference should be made to the other risks discussed in filings with Canadian and United States securities regulatory authorities. Except as required by applicable law, Norbord does not undertake to update any forward-looking statements, whether written or oral, that may be made from time to time by, or on behalf of, the Company, whether as a result of new information, future events or otherwise, or to publicly update or revise the above list of factors affecting this information.

NORBORD 2017 ANNUAL REPORT 43
Management’s Responsibility for the Financial Statements
The accompanying consolidated financial statements have been prepared by the Company’s management which is responsible for their integrity, consistency, objectivity and reliability. To fulfill this responsibility, the Company maintains policies, procedures and systems of internal control to ensure that its reporting practices and accounting and administrative procedures are appropriate to provide a high degree of assurance that relevant and reliable financial information is produced and assets are safeguarded. These controls include the careful selection and training of employees, the establishment of well-defined areas of responsibility and accountability for performance, and the communication of policies and code of conduct throughout the Company. In addition, the Company maintains an internal audit function that conducts periodic audits of the Company’s operations.
These consolidated financial statements have been prepared in conformity with International Financial Reporting Standards as issued by the International Accounting Standards Board, and where appropriate, reflect estimates based on management’s judgement. The financial information presented throughout the Management’s Discussion and Analysis is generally consistent with the information contained in the accompanying consolidated financial statements.
The consolidated financial statements have been further reviewed and approved by the Board of Directors acting through its Audit Committee, which is comprised of directors who are neither officers nor employees of the Company, and who are independent of the Company’s controlling shareholder. The Audit Committee, which meets with the auditors and management to review the activities of each and reports to the Board of Directors, oversees management’s responsibilities for the financial reporting and internal control systems. The auditors have full and direct access to the Audit Committee and meet periodically with the committee both with and without management present to discuss their audit and related findings.
/s/ Peter Wijnbergen /s/ Robin Lampard PETER C. WIJNBERGEN ROBIN E. LAMPARD President and Chief Executive Officer Senior Vice President and Chief Financial Officer
Toronto, Canada February 1, 2018
44 NORBORD 2017 ANNUAL REPORT
REPORT OF INDEPENDENT REGISTERED PUBLIC ACCOUNTING FIRM
To the Shareholders and Directors of Norbord Inc.
Opinion on the Consolidated Financial Statements We have audited the accompanying consolidated financial statements of Norbord Inc. (the “Entity”), which comprise the consolidated balance sheets as at December 31, 2017 and December 31, 2016, the consolidated statements of earnings, comprehensive income, changes in shareholders’ equity and cash flows for the years then ended, and the related notes, comprising a summary of significant accounting policies and other explanatory information (collectively referred to as the “consolidated financial statements”).
In our opinion, the consolidated financial statements present fairly, in all material respects, the consolidated financial position of the Entity as at December 31, 2017 and December 31, 2016, and its consolidated financial performance and its consolidated cash flows for the years then ended in accordance with International Financial Reporting Standards as issued by the International Accounting Standards Board.
Report on Internal Control Over Financial Reporting We also have audited, in accordance with the standards of the Public Company Accounting Oversight Board (United States), the Entity’s internal control over financial reporting as of December 31, 2017, based on the criteria established in Internal Control – Integrated Framework (2013) issued by the Committee of Sponsoring Organizations of the Treadway Commission, and our report dated February 1, 2018 expressed an unqualified (unmodified) opinion on the effectiveness of the Entity’s internal control over financial reporting.
Basis for Opinion A - Management’s Responsibility for the Consolidated Financial Statements Management is responsible for the preparation and fair presentation of these consolidated financial statements in accordance with International Financial Reporting Standards as issued by the International Accounting Standards Board, and for such internal control as management determines is necessary to enable the preparation of consolidated financial statements that are free from material misstatement, whether due to fraud or error.
B - Auditors’ Responsibility Our responsibility is to express an opinion on these consolidated financial statements based on our audits. We conducted our audits in accordance with Canadian generally accepted auditing standards and the standards of the Public Company Accounting Oversight Board (United States) (“PCAOB”). Those standards require that we plan and perform the audit to obtain reasonable assurance about whether the consolidated financial statements are free from material misstatement, whether due to error or fraud. Those standards also require that we comply with ethical requirements, including independence. We are required to be independent with respect to the Entity in accordance with the ethical requirements that are relevant to our audit of the consolidated financial statements in Canada, the U.S. federal securities laws and the applicable rules and regulations of the Securities and Exchange Commission and the PCAOB. We are a public accounting firm registered with the PCAOB.
An audit includes performing procedures to assess the risks of material misstatements of the consolidated financial statements, whether due to error or fraud, and performing procedures to respond to those risks. Such procedures included obtaining and examining, on a test basis, audit evidence regarding the amounts and disclosures in the consolidated financial statements. The procedures selected depend on our judgment, including the assessment of the risks of material misstatement of the consolidated financial statements, whether due to fraud or error. In making those risk assessments, we consider internal control relevant to the entity’s preparation and fair presentation of the consolidated financial statements in order to design audit procedures that are appropriate in the circumstances.
An audit also includes evaluating the appropriateness of accounting policies and principles used and the reasonableness of accounting estimates made by management, as well as evaluating the overall presentation of the consolidated financial statements.
We believe that the audit evidence we have obtained in our audits is sufficient and appropriate to provide a reasonable basis for our audit opinion.
/s/ KPMG LLP
Chartered Professional Accountants, Licensed Public Accountants
We have served as the Entity’s auditor since 2007. Toronto, Canada February 1, 2018
KPMG LLP Bay Adelaide Centre Telephone (416) 777-8500 333 Bay Street Suite 4600 Fax (416) 777-8818 Toronto ON M5H 2S5 Internet www.kpmg.ca Canada

NORBORD 2017 ANNUAL REPORT 45
Management’s Report on Internal Control over Financial Statements
The Company’s management is responsible for establishing and maintaining adequate internal control over financial reporting. Internal control over financial reporting is a process designed by, or under the supervision of, the CEO and CFO, and it is effected by management and other personnel to provide reasonable assurance regarding the reliability of financial reporting and the preparation of financial statements for external purposes in accordance with International Financial Reporting Standards as issued by the International Accounting Standards Board.
Management assessed the effectiveness of the Company’s internal control over financial reporting as of December 31, 2017 and management believes that the Company’s internal control over financial reporting is operating effectively. Management’s assessment was based on the framework established in Internal Control–Integrated Framework (2013) issued by the Committee of Sponsoring Organizations of the Treadway Commission. Based on this evaluation, the CEO and CFO have concluded that Norbord’s internal control over financial reporting, as defined in NI 52-109, is designed and operating effectively.
Norbord’s internal control over financial reporting as of December 31, 2017, has been audited by KPMG LLP, the Independent Registered Public Accounting Firm, who also audited Norbord’s consolidated financial statements for the year ended December 31, 2017. As stated in the Report of Independent Registered Public Accounting Firm, KPMG LLP expressed an unqualitifed opinion on the effectiveness of Norbord’s internal control over financial reporting as of December 31, 2017.
/s/ Peter Wijnbergen /s/ Robin Lampard PETER C. WIJNBERGEN ROBIN E. LAMPARD President and Chief Executive Officer Senior Vice President and Chief Financial Officer
Toronto, Canada February 1, 2018
46 NORBORD 2017 ANNUAL REPORT
REPORT OF INDEPENDENT REGISTERED PUBLIC ACCOUNTING FIRM
The Shareholders and Board of Directors of Norbord Inc.
Opinion on Internal Control over Financial Reporting We have audited Norbord Inc.’s (the “Company”) internal control over financial reporting as of December 31, 2017, based on the criteria established in Internal Control – Integrated Framework (2013) issued by the Committee of Sponsoring Organizations of the Treadway Commission.
In our opinion, the Company maintained, in all material respects, effective internal control over financial reporting as of December 31, 2017, based on the criteria established in Internal Control – Integrated Framework (2013) issued by the Committee of Sponsoring Organizations of the Treadway Commission.
Report on the Consolidated Financial Statements We have also audited, in accordance with Canadian generally accepted auditing standards and the standards of the Public Company Accounting Oversight Board (United States) (“PCAOB”), the consolidated financial statements of the Company, which comprise the consolidated balance sheets as at December 31, 2017 and December 31, 2016, the consolidated statements of earnings, comprehensive income, changes in shareholders’ equity and cash flows for the years then ended, and the related notes, comprising a summary of significant accounting policies and other explanatory information (collectively referred to as the “consolidated financial statements”) and our report dated February 1, 2018 expressed an unmodified (unqualified) opinion on those consolidated financial statements.
Basis for Opinion The Company’s management is responsible for maintaining effective internal control over financial reporting and for its assessment of the effectiveness of internal control over financial reporting, included in the accompanying Form 40-F under the section entitled “Certifications and Disclosures Regarding Controls and Procedures”. Our responsibility is to express an opinion on the Company’s internal control over financial reporting based on our audit.
We are a public accounting firm registered with the PCAOB and are required to be independent with respect to the Company in accordance with the U.S. federal securities laws and the applicable rules and regulations of the Securities and Exchange Commission and the PCAOB and in accordance with the ethical requirements that are relevant to our audit of the financial statements in Canada.
We conducted our audit in accordance with the standards of the PCAOB. Those standards require that we plan and perform the audit to obtain reasonable assurance about whether effective internal control over financial reporting was maintained in all material respects. Our audit of internal control over financial reporting included obtaining an understanding of internal control over financial reporting, assessing the risk that a material weakness exists, and testing and evaluating the design and operating effectiveness of internal control based on the assessed risk. Our audit also included performing such other procedures as we considered necessary in the circumstances. We believe that our audit provides a reasonable basis for our opinion.
Definition and Limitations of Internal Control over Financial Reporting A company’s internal control over financial reporting is a process designed to provide reasonable assurance regarding the reliability of financial reporting and the preparation of financial statements for external purposes in accordance with generally accepted accounting principles. A company’s internal control over financial reporting includes those policies and procedures that (1) pertain to the maintenance of records that, in reasonable detail, accurately and fairly reflect the transactions and dispositions of the assets of the company; (2) provide reasonable assurance that transactions are recorded as necessary to permit preparation of financial statements in accordance with generally accepted accounting principles, and that receipts and expenditures of the company are being made only in accordance with authorizations of management and directors of the company; and (3) provide reasonable assurance regarding prevention or timely detection of unauthorized acquisition, use, or disposition of the company’s assets that could have a material effect on the financial statements.
Because of its inherent limitations, internal control over financial reporting may not prevent or detect misstatements. Also, projections of any evaluation of effectiveness to future periods are subject to the risk that controls may become inadequate because of changes in conditions, or that the degree of compliance with the policies or procedures may deteriorate.
/s/ KPMG LLP
Chartered Professional Accountants, Licensed Public Accountants Toronto, Canada February 1, 2018
KPMG LLP Bay Adelaide Centre Telephone (416) 777-8500 333 Bay Street Suite 4600 Fax (416) 777-8818 Toronto ON M5H 2S5 Internet www.kpmg.ca Canada
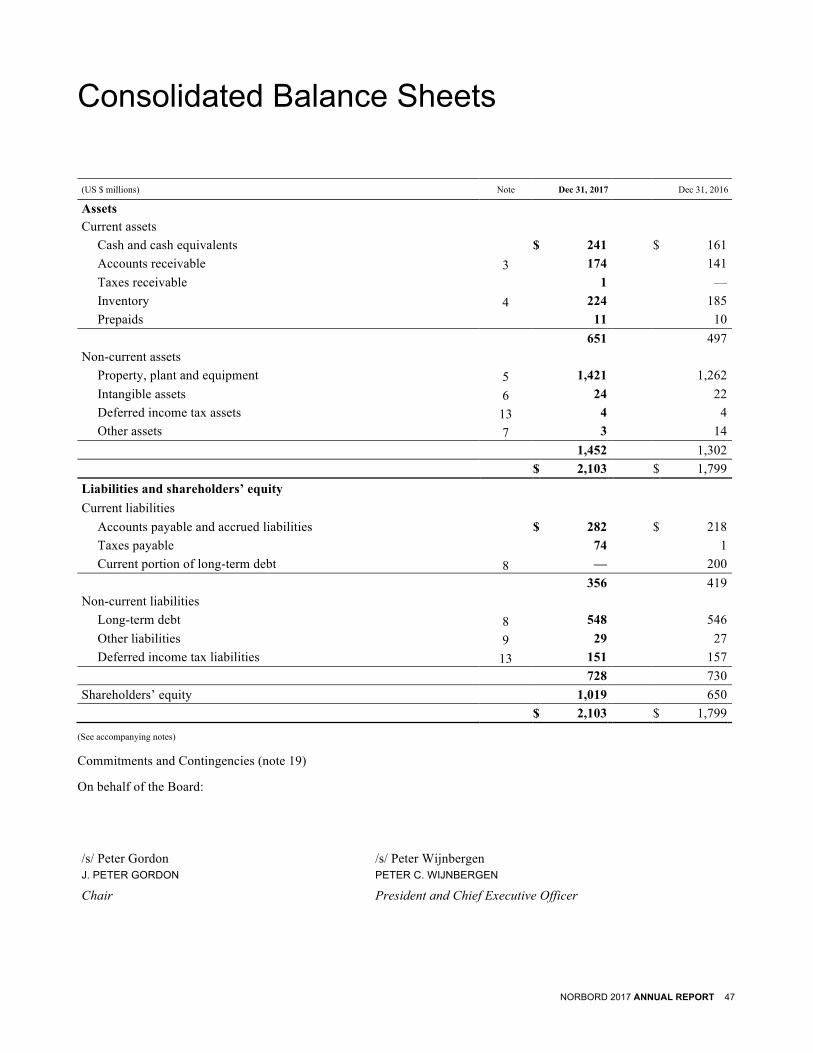
NORBORD 2017 ANNUAL REPORT 47
Consolidated Balance Sheets (US $ millions) Note Dec 31, 2017 Dec 31, 2016
Assets Current assets
Cash and cash equivalents $ 241 $ 161 Accounts receivable 3 174 141 Taxes receivable 1 — Inventory 4 224 185 Prepaids 11 10
651 497 Non-current assets
Property, plant and equipment 5 1,421 1,262 Intangible assets 6 24 22 Deferred income tax assets 13 4 4 Other assets 7 3 14
1,452 1,302 $ 2,103 $ 1,799 Liabilities and shareholders’ equity Current liabilities
Accounts payable and accrued liabilities $ 282 $ 218 Taxes payable 74 1 Current portion of long-term debt 8 — 200
356 419 Non-current liabilities
Long-term debt 8 548 546 Other liabilities 9 29 27 Deferred income tax liabilities 13 151 157
728 730 Shareholders’ equity 1,019 650
$ 2,103 $ 1,799
(See accompanying notes)
Commitments and Contingencies (note 19)
On behalf of the Board:
/s/ Peter Gordon /s/ Peter Wijnbergen J. PETER GORDON PETER C. WIJNBERGEN
Chair President and Chief Executive Officer

48 NORBORD 2017 ANNUAL REPORT
Consolidated Statements of Earnings Years ended December 31 (US $ millions, except per share information) Note 2017 2016
Sales 21 $ 2,177 $ 1,766 Cost of sales (1,499 ) (1,378 ) General and administrative expenses (10 ) (14 ) Depreciation and amortization 21 (107 ) (94 ) Loss on disposal of assets 4, 5 (12 ) — Operating income 549 280 Non-operating (expense) income:
Finance costs 12 (32 ) (52 ) Gain on Asset Exchange 22 — 16
Earnings before income tax 517 244 Income tax expense 13 (81 ) (61 ) Earnings $ 436 $ 183 Earnings per common share 15
Basic $ 5.06 $ 2.14 Diluted 5.03 2.13
(See accompanying notes)
Consolidated Statements of Comprehensive Income Years ended December 31 (US $ millions) Note 2017 2016
Earnings $ 436 $ 183 Other comprehensive income (loss), net of tax
Items that will not be reclassified to earnings: Actuarial (loss) gain on post-employment obligation 10, 13 (3 ) 5
Items that may be reclassified subsequently to earnings: Foreign currency translation gain (loss) on foreign operations 13 29 (37 )
Other comprehensive income (loss), net of tax 26 (32 ) Comprehensive income $ 462 $ 151
(See accompanying notes)

NORBORD 2017 ANNUAL REPORT 49
Consolidated Statements of Changes in Shareholders’ Equity Years ended December 31 (US $ millions) Note 2017 2016
Share capital Balance, beginning of year $ 1,341 $ 1,334 Issue of common shares upon exercise of options and Dividend Reinvestment Plan 14 9 7 Balance, end of year $ 1,350 $ 1,341 Merger reserve 14 $ (96 ) $ (96 ) Contributed surplus Balance, beginning of year $ 9 $ 10 Stock-based compensation 14 1 1 Stock options exercised 14 (2 ) (2 ) Balance, end of year $ 8 $ 9 Retained deficit Balance, beginning of year $ (402 ) $ (559 ) Earnings 436 183 Common share dividends (101 ) (26 ) Balance, end of year(i) $ (67 ) $ (402 ) Accumulated other comprehensive loss Balance, beginning of year $ (202 ) $ (170 ) Other comprehensive income (loss) 26 (32 ) Balance, end of year 14 $ (176 ) $ (202 ) Shareholders’ equity $ 1,019 $ 650
(See accompanying notes)
(i) Retained deficit comprised of: Deficit arising on cashless exercise of warrants in 2013 14 $ (263 ) $ (263 ) All other retained earnings (deficit) 196 (139 ) $ (67 ) $ (402 )
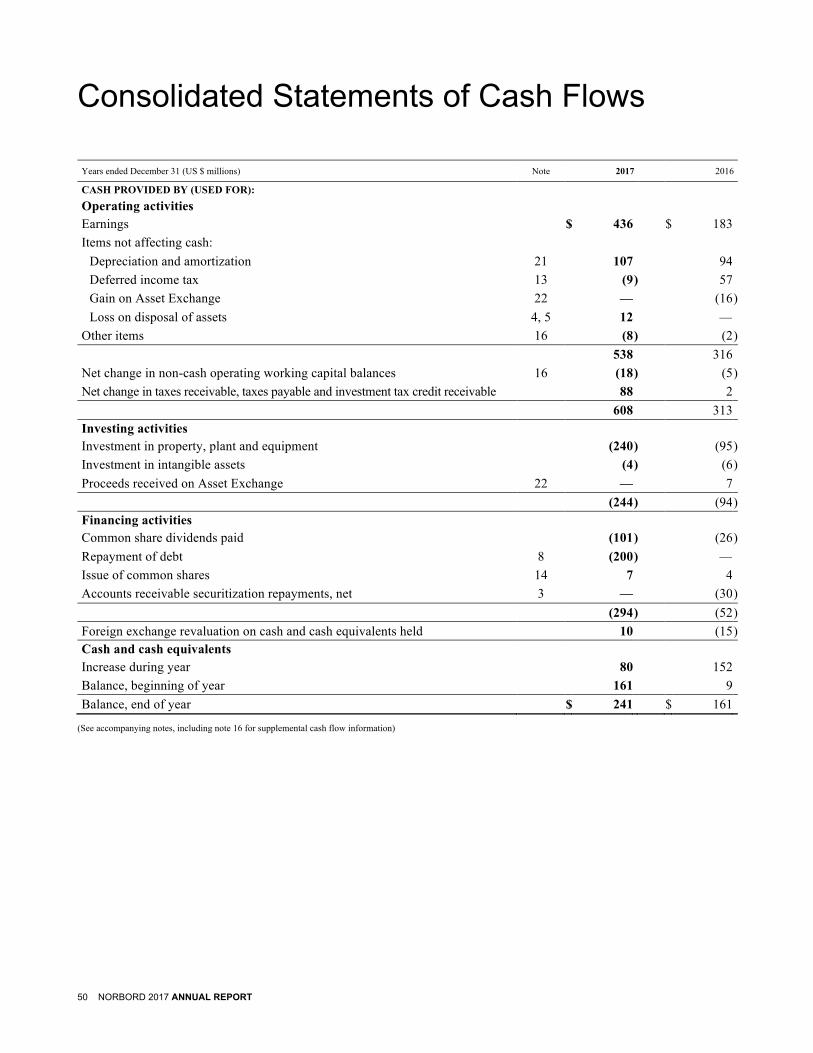
50 NORBORD 2017 ANNUAL REPORT
Consolidated Statements of Cash Flows Years ended December 31 (US $ millions) Note 2017 2016
CASH PROVIDED BY (USED FOR): Operating activities Earnings $ 436 $ 183 Items not affecting cash:
Depreciation and amortization 21 107 94 Deferred income tax 13 (9 ) 57 Gain on Asset Exchange 22 — (16 ) Loss on disposal of assets 4, 5 12 —
Other items 16 (8 ) (2 ) 538 316 Net change in non-cash operating working capital balances 16 (18 ) (5 ) Net change in taxes receivable, taxes payable and investment tax credit receivable 88 2 608 313 Investing activities Investment in property, plant and equipment (240 ) (95 ) Investment in intangible assets (4 ) (6 ) Proceeds received on Asset Exchange 22 — 7 (244 ) (94 ) Financing activities Common share dividends paid (101 ) (26 ) Repayment of debt 8 (200 ) — Issue of common shares 14 7 4 Accounts receivable securitization repayments, net 3 — (30 ) (294 ) (52 ) Foreign exchange revaluation on cash and cash equivalents held 10 (15 ) Cash and cash equivalents Increase during year 80 152 Balance, beginning of year 161 9 Balance, end of year $ 241 $ 161
(See accompanying notes, including note 16 for supplemental cash flow information)
NORBORD 2017 ANNUAL REPORT 51
Notes to the Consolidated Financial Statements (in US $, unless otherwise noted)
In these consolidated financial statement notes, “Norbord” means Norbord Inc. and all of its consolidated subsidiaries and affiliates, and “Company” means Norbord Inc. as a separate corporation, unless the context implies otherwise. “Brookfield” means Brookfield Asset Management Inc., or any of its consolidated subsidiaries and affiliates, which are related parties by virtue of holding a significant equity interest in the Company.
NOTE 1. NATURE AND DESCRIPTION OF THE COMPANY
Norbord is an international producer of wood-based panels with 17 mills in the United States, Europe and Canada. Norbord is a publicly traded company listed on the Toronto Stock Exchange (TSX) and the New York Stock Exchange (NYSE). The ticker symbol on both exchanges is “OSB”. The Company is incorporated under the Canada Business Corporations Act and is headquartered in Toronto, Ontario, Canada.
At year-end, Brookfield’s interest was approximately 40% of the outstanding common shares of the Company (see note 20).
NOTE 2. SIGNIFICANT ACCOUNTING POLICIES
(a) Statement of Compliance These consolidated financial statements have been prepared in accordance with International Financial Reporting Standards (IFRS) as issued by the International Accounting Standards Board (IASB) and with Interpretations of the International Financial Reporting Interpretations Committee. These financial statements were authorized for issuance by the Board of Directors of the Company on February 1, 2018.
(b) Basis of Presentation These consolidated financial statements include the accounts of the Company and all of its wholly-owned subsidiaries.
(c) Basis of Measurement These consolidated financial statements have been prepared on the historical cost basis except for certain financial instruments, which are measured at fair value (as described in note 18).
(d) Functional and Presentation Currency The US dollar is the presentation currency of the Company. Each of the Company’s subsidiaries determines its functional currency, and items included in the financial statements of each subsidiary are measured using that functional currency. The functional currency of North American operations is the US dollar and the functional currency of European operations is the Pound Sterling.
(e) Foreign Currency Translation Assets and liabilities of foreign operations having a functional currency other than the US dollar are translated at the rate of exchange prevailing at the reporting date, and revenues and expenses at average rates during the period. Gains or losses on translation are included as a component of shareholders’ equity in other comprehensive income (OCI). Gains or losses on foreign currency-denominated balances and transactions that are designated as hedges of net investments in these operations are reported in the same manner.
Foreign currency-denominated monetary assets and liabilities of the Company and its subsidiaries are translated using the rate of exchange prevailing at the reporting date. Gains or losses on translation of these items are included in earnings and reported as general and administrative expenses, with the exception of gains and losses on translation of foreign currency-denominated deferred tax assets and liabilities, taxes payable and receivable, and investment tax credit receivable. Gains and losses on these items are included in earnings and reported as income tax expense (previously reported as general and administrative expenses). Gains or losses on transactions that hedge these items are also included in earnings. Foreign currency-denominated revenue and expenses are translated at average rates during the period. Foreign currency-denominated non-monetary assets and liabilities, measured at historic cost, are translated at the rate of exchange at the transaction date. Foreign exchange gains or losses arising from intercompany loans to foreign operations, the settlement of which is neither planned nor likely to occur in the foreseeable future and which in substance are considered to form part of the net investment in the foreign operation, are recognized in OCI.
52 NORBORD 2017 ANNUAL REPORT
(f) Cash and Cash Equivalents Cash and cash equivalents consist of demand deposits, and investment-grade money market securities and bank term deposits with maturities of 90 days or less from the date of purchase. Cash and cash equivalents are recorded at fair value.
(g) Inventories Inventories of finished goods, raw materials and operating and maintenance supplies are valued at the lower of cost and net realizable value, with cost determined on an average cost basis. The cost of finished goods inventories includes direct material, direct labour and an allocation of overhead.
(h) Property, Plant and Equipment Property, plant and equipment is recorded at cost less accumulated depreciation. Borrowing costs are included as part of the cost of a qualifying asset. Property and plant includes land and buildings. Buildings are depreciated on a straight-line basis over 20 to 40 years. Production equipment is depreciated using the units-of-production method. This method amortizes the cost of equipment over the estimated units to be produced during its estimated useful life, which ranges from 10 to 25 years. When parts of an item of property, plant and equipment have different useful lives, they are accounted for as separate items (major components) of property, plant and equipment. The rates of depreciation are intended to fully depreciate manufacturing and non-manufacturing assets over their useful lives. These periods are assessed at least annually to ensure that they continue to approximate the useful lives of the related assets.
Property, plant and equipment is tested for impairment only when there is an indication of impairment. Impairment testing is a one-step approach for both testing and measurement, with the carrying value of the asset or group of assets compared directly to the higher of fair value less costs of disposal and value in use. Fair value is measured at the sale price of the asset or group of assets in an arm’s length transaction. Value in use is based on the cash flows of the asset or group of assets, discounted to their present value using a pre-tax discount rate that reflects current market assessments of the time value of money and the risks specific to the asset. The projection of future cash flows takes into account the relevant operating plans and management’s best estimate of the most probable set of conditions anticipated to prevail. Where an impairment loss exists, it is recorded against earnings. If an impairment loss subsequently reverses, the carrying amount of the asset is increased to the lesser of the revised estimate of recoverable amount and the carrying value that would have remained had no impairment loss been recognized previously. IFRS requires such reversals to be recognized in earnings if certain criteria are met.
(i) Intangible Assets Intangible assets consist of timber rights and software acquisition and development costs. Intangible assets are recorded at cost less accumulated amortization. Timber rights are amortized in accordance with the substance of the agreements (either on a straight-line basis or based on the volume of timber harvested). Software costs are amortized on a straight-line basis over their estimated useful lives and commence once the software is put into service. Amortization methods, useful lives and residual values are assessed at least annually. If the Company identifies events or changes in circumstances which may indicate that their carrying amount may not be recoverable, the intangible assets would be reviewed for impairment as described in note 2(h) above.
(j) Reforestation Obligations For certain operations, timber is harvested under various licences issued by the provinces of British Columbia and Alberta, which include future requirements for reforestation. The fair value of the future estimated reforestation obligation is accrued and recognized in cost of sales on the basis of the volume of timber harvested; fair value is determined by discounting the estimated future cash flows using a credit adjusted risk-free rate. Subsequent changes to fair value resulting from the passage of time and revisions to fair value calculations are recognized in earnings as they occur.
(k) Employee Future Benefits Norbord sponsors various defined benefit and defined contribution pension plans, which cover substantially all employees and are funded in accordance with applicable plan and regulatory requirements. The benefits under Norbord’s defined benefit pension plans are generally based on an employee’s length of service and final five years’ or career average salary. The plans do not provide for indexation of benefit payments.
The measurement date for all defined benefit pension plans is December 31. The obligations associated with Norbord’s defined benefit pension plans are actuarially valued using the projected unit credit method, management’s best estimate assumptions for salary escalation, inflation and life expectancy, and a current market discount rate. Assets are measured at fair value. The obligation in excess of plan assets is recorded as a liability and any plans with assets in excess of obligations are recorded as an asset. All actuarial gains or losses are recognized immediately through OCI.

NORBORD 2017 ANNUAL REPORT 53
(l) Financial Instruments The Company periodically utilizes derivative financial instruments solely to manage its foreign currency, interest rate and commodity price exposures in the ordinary course of business. Derivatives are not used for trading or speculative purposes. All hedging relationships, risk management objectives and hedging strategies are formally documented and periodically assessed to ensure that the changes in the value of these derivatives are highly effective in offsetting changes in the fair values, net investments or cash flows of the hedged exposures. Accordingly, all gains and losses (realized and unrealized, as applicable) on such derivatives are recognized in the same manner as gains and losses on the underlying exposure being hedged. Any resulting carrying amounts are included in other assets if there is an unrealized gain on the derivative, or in other liabilities if there is an unrealized loss on the derivative.
The fair values of the Company’s derivative financial instruments are determined by using observable market inputs for similar assets and liabilities. These fair values reflect the estimated amount that the Company would have paid or received if required to settle all outstanding contracts at period-end. The fair value measurements of the Company’s derivative financial instruments are classified as Level 2 of a three-level hierarchy, as fair value of these derivative instruments has been determined based on observable market inputs. This fair value represents a point-in-time estimate that may not be relevant in predicting the Company’s future earnings or cash flows.
The Company is exposed to credit risk in the event of non-performance by its derivative counterparties. However, the Company’s Board-approved financial policies require that derivative transactions be executed only with approved highly rated counterparties under master netting agreements; therefore, the Company does not anticipate any non-performance.
The carrying value of the Company’s non-derivative financial instruments approximates fair value, except where disclosed in these notes. Fair values disclosed are determined using actual quoted market prices or, if not available, indicative prices based on similar publicly traded instruments.
(m) Debt Issue Costs The Company accounts for transaction costs that are directly attributable to the issuance of long-term debt by deducting such costs from the carrying value of the long-term debt. The capitalized transaction costs are amortized to interest expense over the term of the related long-term debt using the effective interest rate method.
(n) Income Taxes The Company uses the asset and liability method of accounting for income taxes and provides for temporary differences between the tax basis and carrying amounts of assets and liabilities. Accordingly, deferred tax assets and liabilities are recognized for all deductible temporary differences, carryforward of unused tax credits and unused tax losses to the extent that it is probable that the deductions, tax credits and tax losses can be utilized. Deferred tax assets and liabilities are measured using enacted or substantively enacted tax rates expected to apply to the year when the asset is realized or the liability is settled, based on the tax rates and laws that have been enacted or substantively enacted at the balance sheet date. In addition, the effect of a change in tax rates on deferred tax assets and liabilities is recognized in earnings in the year of enactment or substantive enactment. Current and deferred income taxes relating to items recognized directly in other comprehensive income are also recognized directly in other comprehensive income. The Company assesses recoverability of deferred tax assets based on the Company’s estimates and assumptions. At the end of each reporting period, the Company reassesses unrecognized deferred tax assets. Previously unrecognized tax assets are recognized to the extent that it has become probable that future taxable profit will support their realization, or derecognized to the extent it is no longer probable that the tax assets will be recovered.
The Company has certain non-monetary assets and liabilities for which the tax reporting currency is different from the functional currency. Translation gains or losses arising on the remeasurement of these items at current exchange rates versus historic exchange rates give rise to a temporary difference for which a deferred tax asset or liability and deferred tax expense (recovery) is recorded.
(o) Share-based Payments The Company issues both equity-settled and cash-settled share-based awards to certain employees, officers and Directors. Both types of awards are accounted for using the fair value method.
54 NORBORD 2017 ANNUAL REPORT
Equity-settled share-based awards are issued in the form of stock options that vest evenly over a five-year period. The fair value of the awards on the grant date is determined using a fair value model (Black-Scholes option pricing model). Each tranche of the award is considered to be a separate grant based on its respective vesting period. The fair value of each tranche is determined separately on the date of grant and recognized as compensation expense, net of forfeiture estimate, over the term of its respective vesting period, with a corresponding increase to contributed surplus. Upon exercise of the award, the issued shares are recorded at the corresponding amount in contributed surplus, plus the cash proceeds received.
Cash-settled share-based awards are issued in the form of restricted stock units (RSUs) and deferred stock units (DSUs). The fair value of the liability for RSUs is determined using the Black-Scholes option pricing model. The liabilities for the DSUs are fair valued using the closing price of the Company’s common shares on the grant date. DSUs are initially measured at fair value at the grant date, and subsequently remeasured to fair value at each reporting date until settlement. The liability related to cash-settled awards is recorded in other liabilities.
(p) Revenue Recognition Sales are recognized when the risks and rewards of ownership pass to the purchaser. This is generally when goods are shipped. Sales are recorded net of discounts.
Sales are governed by contract or by standard industry terms. Revenue is not recognized prior to the completion of those terms. The majority of product is shipped via third-party transport on a freight-on-board shipping point basis. In all cases, product is subject to quality testing by the Company to ensure it meets applicable standards prior to shipment.
(q) Government Grants Government grants relating to the acquisition of property, plant and equipment are recorded as a reduction of the cost of the asset to which it relates, with any depreciation calculated on the net amount over the related asset’s useful life. Government grants relating to income or for the reimbursement of costs are recognized in earnings in the period they become receivable and deducted against the costs for which the grants were intended to compensate.
(r) Impairment of Non-Derivative Financial Assets Financial assets not classified at fair value through profit or loss are assessed at each reporting date to determine whether there is objective evidence of impairment.
(s) Measurements of Fair Value A number of the Company’s accounting policies and disclosures require the measurement of fair value, for both financial and non-financial assets and liabilities.
The Company has an established framework with respect to the measurement of fair values. If third-party information, such as broker quotes or pricing services, is used to measure fair values, then management assesses the evidence obtained from these sources to support the conclusion that such valuations meet the requirements of IFRS, including the level in the fair value hierarchy at which such valuations should be classified.
When measuring the fair value of an asset or a liability, the Company uses observable market data as far as possible. Fair values are categorized into different levels in a fair value hierarchy based on the inputs used in the valuation technique, as follows:
Level 1 – unadjusted quoted prices available in active markets for identical assets or liabilities; Level 2 – inputs other than quoted prices included in Level 1 that are observable for the asset or liability,
either directly (i.e., as prices) or indirectly (i.e., derived from prices); and
Level 3 – inputs for the asset or liability that are not based on observable market data (unobservable inputs).
(t) Critical Judgements and Estimates The preparation of the consolidated financial statements in conformity with IFRS requires management to make critical judgements, estimates and assumptions that affect: the reported amounts of assets, liabilities, revenues and expenses; disclosure of contingent assets and liabilities at the date of the financial statements; and the reported amounts of revenues and expenses during the period. Actual results could differ materially from those estimates. Such differences in estimates are recognized when realized on a prospective basis.
NORBORD 2017 ANNUAL REPORT 55
In making estimates and judgements, management relies on external information and observable conditions where possible, supplemented by internal analysis as required. These estimates and judgements have been applied in a manner consistent with prior periods and there are no known trends, commitments, events or uncertainties that we believe will materially affect the methodology or assumptions utilized in making these estimates and judgements in these financial statements. The significant estimates and judgements used in determining the recorded amount for assets and liabilities in the financial statements include the following:
A. Judgements Management’s judgements made in applying accounting policies that have the most significant effect on the amounts recognized in the consolidated financial statements are:
(i) Functional Currency The Company assesses the relevant factors related to the primary economic environment in which its entities operate to determine their functional currency.
(ii) Income Taxes In the normal course of operations, judgement is required in assessing tax interpretations, regulations and legislation and in determining the provision for income taxes, deferred tax assets and liabilities. These judgements are subject to various uncertainties concerning the interpretation and application of tax laws in the filing of its tax returns in operating jurisdictions, which could materially affect the Company’s earnings or cash flows. There can be no assurance that the tax authorities will not challenge the Company’s filing positions. To the extent that a recognition or derecognition of a deferred tax asset is required, current period earnings or OCI will be affected.
B. Estimates Assumptions and estimation uncertainties that have a significant risk of resulting in a material adjustment in the year ended December 31, 2017 are:
(i) Inventory The Company estimates the net realizable value of its finished goods and raw materials inventory using estimates regarding future selling prices. The net realizable value of operating and maintenance supplies inventory uses estimates regarding replacement costs.
(ii) Property, Plant and Equipment and Intangible Assets When indicators of impairment are present and the recoverable amount of property, plant and equipment and intangible assets need to be determined, the Company uses the following critical estimates: the timing of forecasted revenues; future selling prices and margins; future sales volumes; maintenance and other capital expenditures; discount rates; useful lives; and residual values.
(iii) Employee Benefit Plans The net obligations associated with the defined benefit pension plans are actuarially valued using: the projected unit credit method; management’s best estimates for salary escalation, inflation and life expectancy; and a current market discount rate to match the timing and amount of pension payments.
(iv) Income Taxes Current income tax assets and liabilities are measured at the amount expected to be paid to tax authorities, net of recoveries, based on the tax rates and laws enacted or substantively enacted at the balance sheet date.
Deferred income tax assets are recognized for all deductible temporary differences and carryforward of unused tax credits and unused tax losses, to the extent that it is probable that the deductions, tax credits and tax losses can be utilized. Deferred income tax assets and liabilities are measured at the tax rates that are expected to apply to the year when the asset is realized or the liability settled, based on the tax rates and laws that have been enacted or substantively enacted at the balance sheet date.
(v) Financial Instruments The critical assumptions and estimates used in determining the fair value of financial instruments are: equity and commodity prices; future interest rates; the relative creditworthiness of the Company to its counterparties; estimated future cash flows; discount rates; and volatility utilized in option valuations.
56 NORBORD 2017 ANNUAL REPORT
(u) Changes in Accounting Policies
(i) Income Taxes In January 2016, the IASB issued amendments to clarify the requirements for recognizing deferred tax assets on unrealized losses. The amendments clarify the accounting for deferred tax where an asset is measured at fair value and that fair value is below the asset’s tax base. They also clarify certain other aspects of accounting for deferred tax assets. The amendments became effective for the Company on January 1, 2017 and did not have any impact on its financial statements.
(ii) Cash Flow Statement Disclosure In January 2016, the IASB issued an amendment to IAS 7, Statement of Cash Flows, introducing additional disclosure requirements for liabilities arising from financing activities. The amendment became effective for the Company on January 1, 2017 and the additional disclosure has been included in the supplemental cash flow information (note 16) accordingly.
(iii) Foreign Currency Translation Effective April 2, 2017, the Company changed its policy on the classification of gains and losses on translation of foreign currency-denominated deferred tax assets and liabilities, taxes payable and receivable, and investment tax credit receivable. Gains and losses on these items are included in earnings and reported as income tax expense (previously reported as general and administrative expenses). The effect of this classification change on prior period comparative balances was $1 million and the balances were not required to be restated.
(v) Future Changes in Accounting Policies
(i) Financial Instruments In July 2014, the IASB issued the final publication of IFRS 9, Financial Instruments (IFRS 9), superseding IAS 39, Financial Instruments. IFRS 9 includes amended guidance for the classification and measurement of financial assets by introducing a fair value through other comprehensive income category for certain debt instruments. It also includes a new general hedge accounting standard which will align hedge accounting more closely with risk management and contains a new impairment model which could result in earlier recognition of losses. Norbord intends to adopt IFRS 9 in its financial statements for the annual period beginning on January 1, 2018. Norbord has assessed its financial instruments and does not expect the standard to have a material impact on its financial statements or accounting policy.
(ii) Revenue from Contracts with Customers In May 2014, the IASB issued IFRS 15, Revenue from Contracts with Customers (IFRS 15), which replaces the existing revenue recognition guidance with a new framework to determine the timing of revenue recognition and the measurement of revenue. In September 2015, the IASB formalized a one-year deferral of the effective date to the year beginning on or after January 1, 2018. In April 2016, the IASB issued an amendment clarifying the guidance on identifying performance obligations, licences of intellectual property, and principal versus agent, and to provide additional practical expedients upon transition. Norbord intends to adopt IFRS 15 and the clarifications in its financial statements for the annual period beginning on January 1, 2018. Norbord has undertaken a comprehensive review of its significant contracts in accordance with the five-step model in IFRS 15 to determine the impact on the timing and measurement of its revenue recognition. Based on this review, Norbord does not expect the standard to have a material impact on its financial statements or accounting policy.
(iii) Share-based Payment In June 2016, the IASB issued an amendment to IFRS 2, Share-based Payment, clarifying the accounting for certain types of share-based payment transactions. The amendment provides requirements on accounting for the effects of vesting and non-vesting conditions of cash-settled share-based payments, withholding tax obligations for share-based payments with a net settlement feature, and when a modification to the terms of a share-based payment changes the classification of the transaction from cash-settled to equity-settled. Norbord intends to adopt the amendment to IFRS 2 in its financial statements for the annual period beginning on January 1, 2018. Norbord has assessed its share-based payment transactions and does not expect the amendment to have a material impact on its financial statements or accounting policy.

NORBORD 2017 ANNUAL REPORT 57
(iv) Foreign Currency Transactions and Advance Consideration In December 2016, the IFRS Interpretations Committee of the IASB issued IFRIC 22, Foreign Currency Transactions and Advance Consideration (IFRIC 22). The interpretation addresses how to determine the date of the transaction when applying IAS 21, The Effects of Changes in Foreign Exchange Rates. The date of transaction determines the exchange rate to be used on initial recognition of the related asset, expense or income. Norbord intends to adopt IFRIC 22 in its financial statements for the annual period beginning on January 1, 2018. Norbord has assessed its foreign currency transactions and does not expect the interpretation to have a material impact on its financial statements or accounting policy.
(v) Leases In January 2016, the IASB issued IFRS 16, Leases (IFRS 16), which replaces the existing lease accounting guidance. IFRS 16 requires all leases to be reported on the balance sheet unless certain criteria for exclusion are met. Norbord intends to adopt IFRS 16 in its financial statements for the annual period beginning on January 1, 2019. The Company is currently assessing the impact of IFRS 16 on its financial statements.
(vi) Uncertainty over Income Tax Treatments In June 2017, the IFRS Interpretations Committee of the IASB issued IFRIC 23, Uncertainty over Income Tax Treatments (IFRIC 23). The interpretation provides guidance on the accounting for current and deferred tax liabilities and assets in circumstances in which there is uncertainty over income tax treatments. The interpretation is effective for the annual period beginning on January 1, 2019. The Company is currently assessing the impact of IFRIC 23 on its financial statements.
NOTE 3. ACCOUNTS RECEIVABLE
The Company has a $125 million multi-currency accounts receivable securitization program with a third-party trust sponsored by a highly rated Canadian financial institution. The program is revolving and has an evergreen commitment subject to termination on 12 months’ notice. Under the program, Norbord has transferred substantially all of its present and future trade accounts receivable to the trust, on a fully serviced basis, for proceeds consisting of cash and deferred purchase price. However, the asset derecognition criteria under IFRS have not been met and the transferred accounts receivable remain recorded as an asset.
At year-end, Norbord had transferred but continued to recognize $153 million (December 31, 2016 – $125 million) in trade accounts receivable, and Norbord recorded drawings of $nil as other long-term debt (December 31, 2016 – $nil) relating to this financing program. The level of accounts receivable transferred under the program fluctuates with the level of shipment volumes, product prices and foreign exchange rates. The amount Norbord chooses to draw under the program at any point in time depends on the level of accounts receivable transferred and timing of cash settlements and fluctuates with the Company’s cash requirements. Any drawings are presented as other long-term debt on the balance sheet and are excluded from the net debt to capitalization calculation for financial covenant purposes (note 17). The utilization charge, which is based on money market rates plus a margin, and other program fees are recorded as finance costs. For the year, the utilization charge on drawings ranged from 1.5% to 2.6%.
The securitization program contains no financial covenants; however, the program is subject to minimum credit-rating requirements. The Company must maintain a long-term issuer credit rating of at least single B (mid) or the equivalent. As at February 1, 2018, Norbord’s ratings were BB (DBRS), BB (Standard & Poor’s Ratings Services) and Ba1 (Moody’s Investors Service).
NOTE 4. INVENTORY
(US $ millions)
Dec 31, 2017 Dec 31, 2016
Raw materials $ 68 $ 55 Finished goods 74 61 Operating and maintenance supplies 82 69 $ 224 $ 185
At year-end, the provision to reflect inventories at the lower of cost and net realizable value was $14 million (December 31, 2016 – $10 million). The change in inventory provision of $4 million (2016 – $nil) has been recognized in loss on disposal of assets on the statement of earnings.
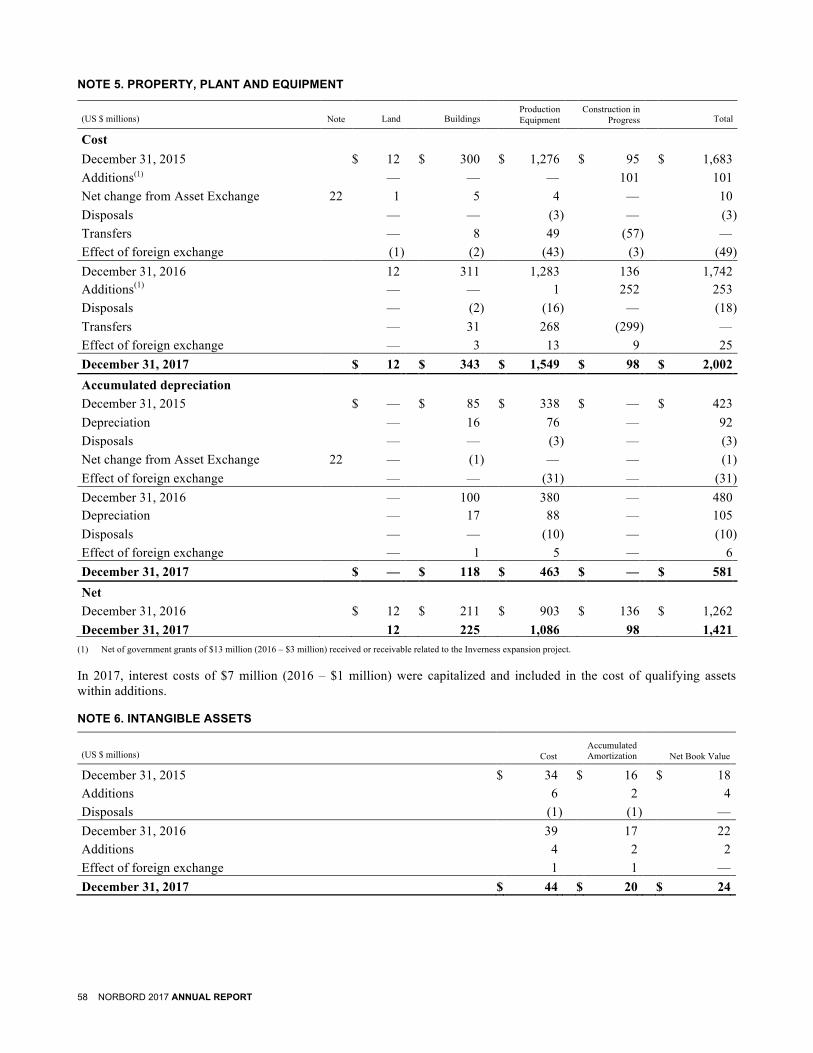
58 NORBORD 2017 ANNUAL REPORT
NOTE 5. PROPERTY, PLANT AND EQUIPMENT
(US $ millions)
Note Land
Buildings
Production Equipment
Construction in
Progress
Total
Cost December 31, 2015 $ 12 $ 300 $ 1,276 $ 95 $ 1,683 Additions(1) — — — 101 101 Net change from Asset Exchange 22 1 5 4 — 10
Disposals — — (3 ) — (3 ) Transfers — 8 49 (57 ) — Effect of foreign exchange (1 ) (2 ) (43 ) (3 ) (49 ) December 31, 2016 12 311 1,283 136 1,742 Additions(1) — — 1 252 253 Disposals — (2 ) (16 ) — (18 ) Transfers — 31 268 (299 ) — Effect of foreign exchange — 3 13 9 25
December 31, 2017 $ 12 $ 343 $ 1,549 $ 98 $ 2,002
Accumulated depreciation December 31, 2015 $ — $ 85 $ 338 $ — $ 423
Depreciation — 16 76 — 92 Disposals — — (3 ) — (3 ) Net change from Asset Exchange 22 — (1 ) — — (1 ) Effect of foreign exchange — — (31 ) — (31 ) December 31, 2016 — 100 380 — 480 Depreciation — 17 88 — 105
Disposals — — (10 ) — (10 ) Effect of foreign exchange — 1 5 — 6
December 31, 2017 $ — $ 118 $ 463 $ — $ 581
Net December 31, 2016 $ 12 $ 211 $ 903 $ 136 $ 1,262
December 31, 2017 12 225 1,086 98 1,421 (1) Net of government grants of $13 million (2016 – $3 million) received or receivable related to the Inverness expansion project.
In 2017, interest costs of $7 million (2016 – $1 million) were capitalized and included in the cost of qualifying assets within additions.
NOTE 6. INTANGIBLE ASSETS
(US $ millions)
Cost Accumulated Amortization Net Book Value
December 31, 2015 $ 34 $ 16 $ 18 Additions 6 2 4 Disposals (1 ) (1 ) —
December 31, 2016 39 17 22 Additions 4 2 2 Effect of foreign exchange 1 1 —
December 31, 2017 $ 44 $ 20 $ 24

NORBORD 2017 ANNUAL REPORT 59
NOTE 7. OTHER ASSETS
(US $ millions) Note Dec 31, 2017 Dec 31, 2016
Defined benefit pension asset 10 $ 2 $ — Foreign currency forward contracts 18 1 — Investment tax credit receivable — 13
Other — 1
$ 3 $ 14
NOTE 8. LONG-TERM DEBT
(US $ millions) Dec 31, 2017 Dec 31, 2016
Principal value 7.7% senior secured notes due February 2017 $ — $ 200 5.375% senior secured notes due December 2020 240 240 6.25% senior secured notes due April 2023 315 315 555 755 Less: Unamortized debt issue costs (7 ) (9 ) Less: Current portion — (200 ) $ 548 $ 546
Maturities of long-term debt are as follows:
(US $ millions) 2018 2019 2020 2021 2022 Thereafter Total
Maturities of long-term debt $ — $ — $ 240 $ — $ — $ 315 $ 555
As at December 31, 2017, the weighted average effective interest rate on the Company’s debt-related obligations was 5.9% (2016 – 6.4%).
Senior Secured Notes Due 2017 The Company’s senior secured notes due in February 2017 bore a fixed interest rate that varied with the changes in the Company’s credit ratings. In 2017 and 2016, the interest rate was 7.70%. In February 2017, the Company repaid these notes at maturity.
Senior Secured Notes Due 2020 The Company’s senior secured notes due in December 2020 bear a fixed interest rate of 5.375%. The notes rank pari passu with the Company’s existing senior secured notes due in 2023 and committed revolving bank lines.
Senior Secured Notes Due 2023 The Company’s senior secured notes due in April 2023 bear a fixed interest rate of 6.25%. The notes rank pari passu with the Company’s existing senior secured notes due in 2020 and committed revolving bank lines.
Revolving Bank Lines The Company has an aggregate commitment of $245 million under committed revolving bank lines which bear interest at money market rates plus a margin that varies with the Company’s credit rating. The maturity date of the total aggregate commitment is May 2019. The bank lines are secured by a first lien on the Company’s North American OSB inventory and property, plant and equipment. This lien is shared pari passu with holders of the 2020 and 2023 senior secured notes.
At year-end, none of the revolving bank lines were drawn as cash, $19 million (2016 – $25 million) was utilized for letters of credit and $226 million (2016 – $220 million) was available to support short-term liquidity requirements.
The revolving bank lines contain two quarterly financial covenants: minimum tangible net worth of $500 million and maximum net debt to total capitalization, book basis (note 17), of 65%. The Company was in compliance with the financial covenants at year-end.
Debt Issue Costs Finance expense related to amortization of debt issue costs for 2017 was $2 million (2016 – $2 million).
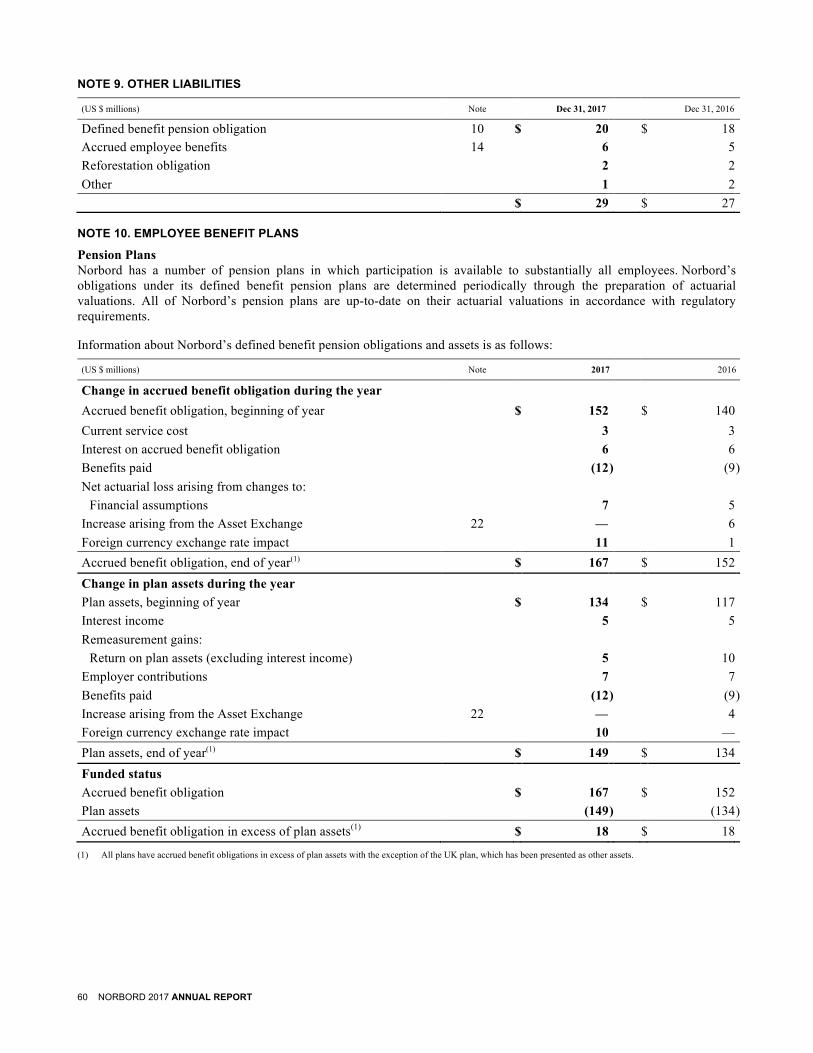
60 NORBORD 2017 ANNUAL REPORT
NOTE 9. OTHER LIABILITIES
(US $ millions) Note Dec 31, 2017 Dec 31, 2016
Defined benefit pension obligation 10 $ 20 $ 18 Accrued employee benefits 14 6 5 Reforestation obligation 2 2 Other 1 2 $ 29 $ 27
NOTE 10. EMPLOYEE BENEFIT PLANS
Pension Plans Norbord has a number of pension plans in which participation is available to substantially all employees. Norbord’s obligations under its defined benefit pension plans are determined periodically through the preparation of actuarial valuations. All of Norbord’s pension plans are up-to-date on their actuarial valuations in accordance with regulatory requirements.
Information about Norbord’s defined benefit pension obligations and assets is as follows:
(US $ millions) Note 2017 2016
Change in accrued benefit obligation during the year Accrued benefit obligation, beginning of year $ 152 $ 140 Current service cost 3 3 Interest on accrued benefit obligation 6 6 Benefits paid (12 ) (9 ) Net actuarial loss arising from changes to:
Financial assumptions 7 5 Increase arising from the Asset Exchange 22 — 6 Foreign currency exchange rate impact 11 1 Accrued benefit obligation, end of year(1) $ 167 $ 152 Change in plan assets during the year Plan assets, beginning of year $ 134 $ 117 Interest income 5 5 Remeasurement gains:
Return on plan assets (excluding interest income) 5 10 Employer contributions 7 7 Benefits paid (12 ) (9 ) Increase arising from the Asset Exchange 22 — 4 Foreign currency exchange rate impact 10 — Plan assets, end of year(1) $ 149 $ 134 Funded status Accrued benefit obligation $ 167 $ 152 Plan assets (149 ) (134 ) Accrued benefit obligation in excess of plan assets(1) $ 18 $ 18
(1) All plans have accrued benefit obligations in excess of plan assets with the exception of the UK plan, which has been presented as other assets.

NORBORD 2017 ANNUAL REPORT 61
The components of benefit expense recognized in the statement of earnings are as follows:
(US $ millions) 2017 2016
Current service cost $ 3 $ 3 Interest cost 1 1 Net periodic pension expense $ 4 $ 4
The significant weighted average actuarial assumptions are as follows:
2017 2016
Used in calculation of accrued benefit obligation, end of year Discount rate 3.4 % 3.7 % Rate of compensation increase 2.9 % 2.8 %
Used in calculation of net periodic pension expense for the year Discount rate 3.7 % 3.9 % Rate of compensation increase 2.9 % 2.8 %
The impact of a change to the significant actuarial assumptions on the accrued benefit obligation as at December 31, 2017 is as follows:
(US $ millions) Increase Decrease
Discount rate (0.5% change) $ (13 ) $ 14 Compensation rate (1.0% change) 3 (3 ) Future life expectancy (1 year movement) 4 (4 ) Retirement age (1 year movement) (2 ) —
The weighted average asset allocation of Norbord’s defined benefit pension plan assets is as follows:
Dec 31, 2017 Dec 31, 2016
Asset category Equity investments 55 % 57 % Fixed income investments 45 % 40 % Cash — 3 %
Total assets 100 % 100 %
Cost of sales and general and administrative expenses include $12 million (2016 – $11 million) related to contributions to Norbord’s defined contribution pension plans.
NOTE 11. EMPLOYEE COMPENSATION AND BENEFITS
Included in cost of sales and general and administrative expenses are the following:
(US $ millions) 2017 2016
Short-term employee compensation and benefits $ 203 $ 178 Long-term employee compensation and benefits 32 30 Share-based payments 2 2 $ 237 $ 210
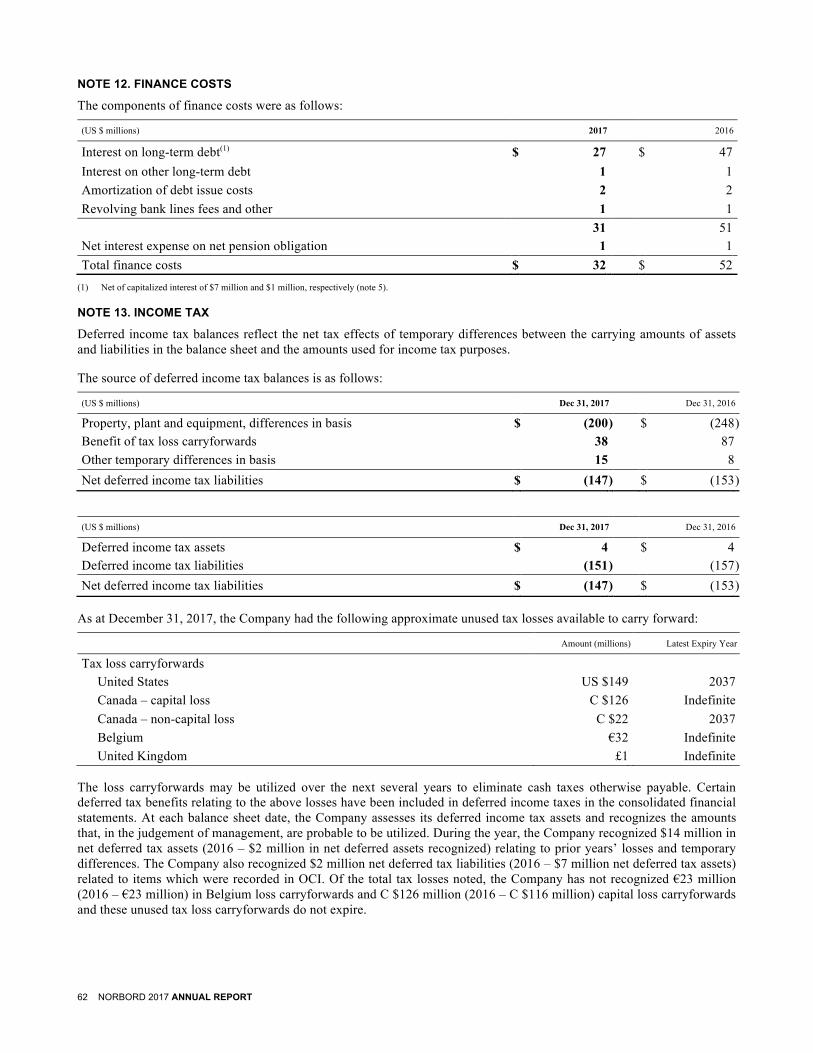
62 NORBORD 2017 ANNUAL REPORT
NOTE 12. FINANCE COSTS
The components of finance costs were as follows:
(US $ millions) 2017 2016
Interest on long-term debt(1) $ 27 $ 47 Interest on other long-term debt 1 1 Amortization of debt issue costs 2 2 Revolving bank lines fees and other 1 1 31 51 Net interest expense on net pension obligation 1 1 Total finance costs $ 32 $ 52
(1) Net of capitalized interest of $7 million and $1 million, respectively (note 5).
NOTE 13. INCOME TAX
Deferred income tax balances reflect the net tax effects of temporary differences between the carrying amounts of assets and liabilities in the balance sheet and the amounts used for income tax purposes.
The source of deferred income tax balances is as follows:
(US $ millions) Dec 31, 2017 Dec 31, 2016
Property, plant and equipment, differences in basis $ (200 ) $ (248 ) Benefit of tax loss carryforwards 38 87 Other temporary differences in basis 15 8 Net deferred income tax liabilities $ (147 ) $ (153 )
(US $ millions) Dec 31, 2017 Dec 31, 2016
Deferred income tax assets $ 4 $ 4 Deferred income tax liabilities (151 ) (157 ) Net deferred income tax liabilities $ (147 ) $ (153 )
As at December 31, 2017, the Company had the following approximate unused tax losses available to carry forward:
Amount (millions) Latest Expiry Year
Tax loss carryforwards United States US $149 2037 Canada – capital loss C $126 Indefinite Canada – non-capital loss C $22 2037 Belgium €32 Indefinite United Kingdom £1 Indefinite
The loss carryforwards may be utilized over the next several years to eliminate cash taxes otherwise payable. Certain deferred tax benefits relating to the above losses have been included in deferred income taxes in the consolidated financial statements. At each balance sheet date, the Company assesses its deferred income tax assets and recognizes the amounts that, in the judgement of management, are probable to be utilized. During the year, the Company recognized $14 million in net deferred tax assets (2016 – $2 million in net deferred assets recognized) relating to prior years’ losses and temporary differences. The Company also recognized $2 million net deferred tax liabilities (2016 – $7 million net deferred tax assets) related to items which were recorded in OCI. Of the total tax losses noted, the Company has not recognized €23 million (2016 – €23 million) in Belgium loss carryforwards and C $126 million (2016 – C $116 million) capital loss carryforwards and these unused tax loss carryforwards do not expire.
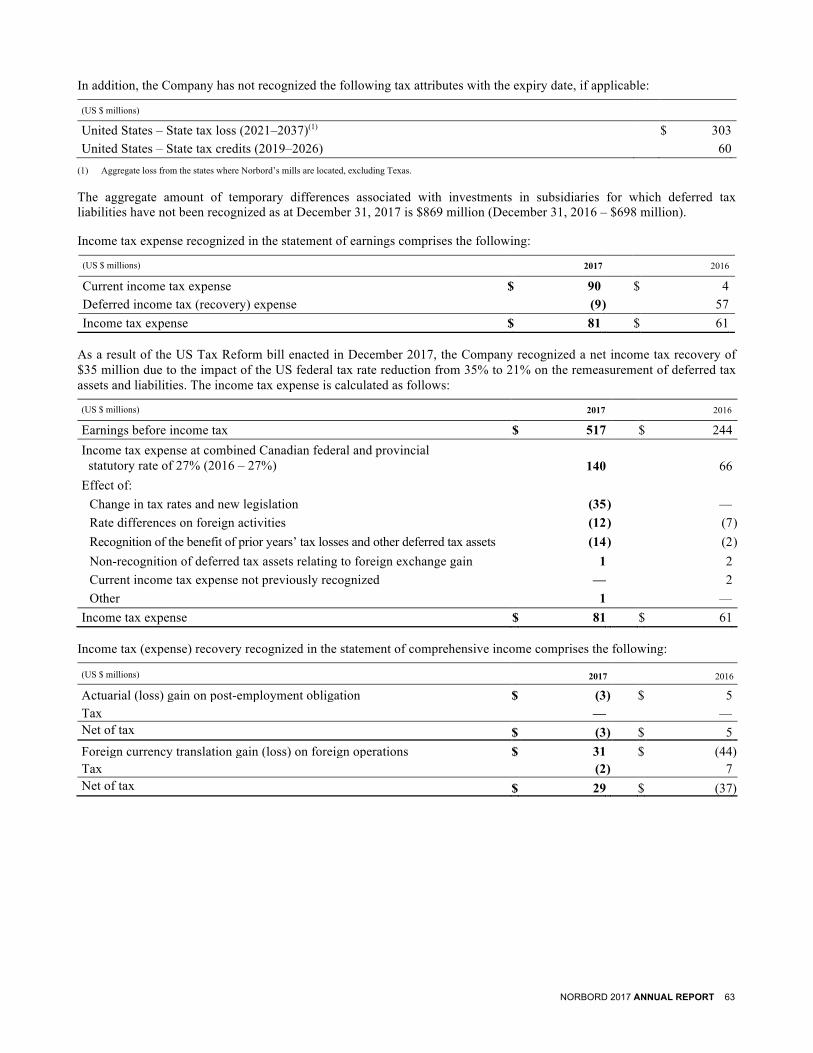
NORBORD 2017 ANNUAL REPORT 63
In addition, the Company has not recognized the following tax attributes with the expiry date, if applicable:
(US $ millions) United States – State tax loss (2021–2037)(1) $ 303 United States – State tax credits (2019–2026) 60
(1) Aggregate loss from the states where Norbord’s mills are located, excluding Texas.
The aggregate amount of temporary differences associated with investments in subsidiaries for which deferred tax liabilities have not been recognized as at December 31, 2017 is $869 million (December 31, 2016 – $698 million).
Income tax expense recognized in the statement of earnings comprises the following:
(US $ millions)
2017 2016
Current income tax expense $ 90 $ 4 Deferred income tax (recovery) expense (9 ) 57 Income tax expense $ 81 $ 61
As a result of the US Tax Reform bill enacted in December 2017, the Company recognized a net income tax recovery of $35 million due to the impact of the US federal tax rate reduction from 35% to 21% on the remeasurement of deferred tax assets and liabilities. The income tax expense is calculated as follows:
(US $ millions)
2017 2016
Earnings before income tax $ 517 $ 244 Income tax expense at combined Canadian federal and provincial
statutory rate of 27% (2016 – 27%) 140 66
Effect of: Change in tax rates and new legislation (35 ) — Rate differences on foreign activities (12 ) (7 ) Recognition of the benefit of prior years’ tax losses and other deferred tax assets (14 ) (2 ) Non-recognition of deferred tax assets relating to foreign exchange gain 1 2 Current income tax expense not previously recognized — 2 Other 1 —
Income tax expense $ 81 $ 61
Income tax (expense) recovery recognized in the statement of comprehensive income comprises the following:
(US $ millions)
2017 2016
Actuarial (loss) gain on post-employment obligation $ (3 ) $ 5 Tax — — Net of tax $ (3 ) $ 5
Foreign currency translation gain (loss) on foreign operations $ 31 $ (44 ) Tax (2 ) 7 Net of tax $ 29 $ (37 )

64 NORBORD 2017 ANNUAL REPORT
NOTE 14. SHAREHOLDERS’ EQUITY
Share Capital
2017
2016
Shares
(millions)
Amount (US $ millions)
Shares (millions)
Amount (US $ millions)
Common shares outstanding, beginning of year 85.8 $ 1,341 85.4 $ 1,334 Issuance of common shares upon exercise of options and Dividend Reinvestment Plan 0.6
9
0.4
7
Common shares outstanding, end of year 86.4 $ 1,350 85.8 $ 1,341
As at December 31, 2017, the authorized capital stock of the Company is as follows: an unlimited number of Class A and Class B preferred shares, an unlimited number of non-voting participating shares and an unlimited number of common shares.
Dividend Reinvestment Plan During the year, less than $1 million of dividends was reinvested in common shares (2016 – less than $1 million).
Merger Reserve On March 31, 2015, the Company and Ainsworth Lumber Co. Ltd. (Ainsworth) completed an arrangement under which the Company acquired all of the outstanding common shares of Ainsworth in an all-share transaction. The Company elected not to account for this transaction as a business combination under IFRS 3, Business Combinations, as the transaction represented a combination of entities under common control of Brookfield. Accordingly, the book values of the two entities were combined and no adjustments were made to reflect fair values or to recognize any new assets or liabilities of either entity. The merger reserve represents the difference between the fair value of the Norbord common shares on the date of issuance and the book value of Ainsworth’s net assets exchanged.
Contributed Surplus Contributed surplus at December 31, 2017 comprises amounts related to compensation expense on stock options issued under the Company’s stock option plan.
Share-based Payments Stock Options
2017
2016
Options
(millions)
Weighted Average
Exercise Price (C $)
Options (millions)
Weighted Average
Exercise Price (C $)
Balance, beginning of year 1.8 $ 25.28 2.3 $ 24.79 Options granted 0.2 34.96 — — Options exercised (0.6 ) 15.16 (0.4 ) 14.93 Options expired — — (0.1 ) 111.30 Balance, end of year 1.4 $ 27.23 1.8 $ 25.28 Exercisable at year-end 0.8 $ 25.03 1.2 $ 25.18
Under the Company’s stock option plan, the Board of Directors may issue stock options to certain employees of the Company. These options vest over a five-year period and expire 10 years from the date of issue. During the year, 0.2 million stock options were granted (2016 – no stock options) and stock option expense of $1 million was recorded with a corresponding increase in contributed surplus (2016 – $1 million).

NORBORD 2017 ANNUAL REPORT 65
The table below outlines the significant assumptions used during the period to estimate the fair value of options granted:
2017 2016
Risk-free interest rate 1.1 % — Expected volatility 30 % — Dividend yield 1.1 % — Expected option life (years) 5 — Share price (in Canadian dollars) $37.72 — Exercise price (in Canadian dollars) $34.96 — Weighted average fair value per option granted (in Canadian dollars) $ 7.47 —
In 2017, 0.6 million common shares (2016 – 0.4 million common shares) were issued as a result of options exercised under the stock option plan for total cash proceeds of $7 million (2016 – $4 million) plus $2 million (2016 – $3 million) representing the vested fair value of the stock options. The weighted average share price on the date of exercise for 2017 was $41.89 (2016 – $31.71).
The following table summarizes the weighted average exercise prices and the weighted average remaining contractual life of the stock options outstanding at December 31, 2017:
Options Outstanding Options Exercisable
Range of Exercise Prices (C $) Options
Weighted Average Remaining
Contractual Life (years)
Weighted Average
Exercise Price (C $) Options
Weighted Average
Exercise Price (C $)
$6.50–$10.00 157,000 4.08 $ 9.96 157,000 $ 9.96 $10.01–$15.00 129,862 2.98 14.58 129,862 14.58 $15.01–$20.00 108,210 2.22 18.04 108,210 18.04 $20.01–$25.00 11,409 6.45 21.44 11,409 21.44 $25.01–$30.00 457,420 7.42 27.25 172,420 27.32 $30.01–$35.00 458,696 7.16 32.35 158,702 30.53 $60.90 90,630 0.10 60.90 90,630 60.90
1,413,227 6.00 $ 27.23 828,233 $ 25.03
Restricted and Deferred Stock Units The Company has a Restricted Stock Unit (RSU) Plan for designated employees of the Company or its subsidiaries. An RSU is a unit equivalent in value to a common share. Units credited under this plan vest equally over three years. Vested amounts are paid in cash within 30 days of the vesting date. In addition, holders are credited with additional units as and when dividends are paid on the Company’s common shares.
The Company also has a Deferred Common Share Unit (DSU) Plan for senior management and Directors. A DSU is a unit equivalent in value to a common share. Following the participant’s termination of employment with the Company, the participant will be paid in cash the market value of the common shares represented by the DSUs. In addition, holders are credited with additional units as and when dividends are paid on the Company’s common shares.
As at December 31, 2017, the total liability outstanding related to these plans was $5 million (December 31, 2016 – $4 million), of which $3 million (December 31, 2016 – $3 million) is recorded in other liabilities and $2 million (December 31, 2016 – $1 million) is recorded in accounts payable and accrued liabilities.

66 NORBORD 2017 ANNUAL REPORT
Accumulated Other Comprehensive Loss
(US $ millions) Dec 31, 2017 Dec 31, 2016
Foreign currency translation loss on investment in foreign operations, net of tax of $(5) (December 31, 2016 – $(3)) $ (138 ) $ (167 )
Net loss on hedge of net investment in foreign operations, net of tax of $3 (December 31, 2016 – $3) (8 ) (8 )
Actuarial loss on defined benefit pension obligation, net of tax of $9 (December 31, 2016 – $9) (30 ) (27 )
Accumulated other comprehensive loss, net of tax $ (176 ) $ (202 )
Amendment to Warrant Indenture On March 25, 2013, the Company amended certain terms of its Warrant Indenture dated December 24, 2008 by executing a Supplemental Warrant Indenture to include a cashless exercise feature. This feature allowed warrant holders to elect to exercise their warrants on a cashless basis, and receive common shares based on the in-the-money value of their warrants. The warrants expired on December 24, 2013. In 2013, a total of 134.4 million warrants were exercised on a cashless basis resulting in the issuance of 8.4 million common shares. As required under IFRS, for the year ended December 31, 2013, the cashless exercise of the warrants resulted in:
• an increase in share capital of $298 million, representing the fair value on the date of exercise of the common shares issued in exchange for the in-the-money value of the warrants;
• a decrease in contributed surplus of $35 million, representing the book value of the warrants recorded at the time of their issuance; and
• a decrease in retained earnings of $263 million, reflecting the difference between these two amounts.
NOTE 15. EARNINGS PER COMMON SHARE
(US $ millions, except share and per share information, unless otherwise noted) 2017 2016
Earnings available to common shareholders $ 436 $ 183 Common shares (millions):
Weighted average number of common shares outstanding 86.2 85.6 Dilutive stock options(1) 0.4 0.5
Diluted number of common shares 86.6 86.1 Earnings per common share:
Basic $ 5.06 $ 2.14 Diluted 5.03 2.13
(1) Applicable if dilutive and when the weighted average daily closing share price for the year was greater than the exercise price for stock options. At year-end, there were 0.1 million stock options (December 31, 2016 – 0.5 million) that were not taken into account in the calculation of diluted earnings per share because their effect was anti-dilutive.
NOTE 16. SUPPLEMENTAL CASH FLOW INFORMATION
Other items comprise:
(US $ millions) Note 2017 2016
Stock-based compensation $ 4 $ 2 Pension funding greater than expense (3 ) (3 ) Cash interest paid greater than interest expense (6 ) — Amortization of debt issue costs 12 2 2 Unrealized (gain) loss on outstanding forwards 18 (1 ) 1
Unrealized foreign exchange gain on translation of monetary balances (4 ) (1 ) Unrealized foreign exchange gain on translation of tax balances (1 ) — Other 1 (3 )
$ (8 ) $ (2 )

NORBORD 2017 ANNUAL REPORT 67
The net change in non-cash operating working capital balance comprises:
(US $ millions) 2017 2016
Cash (used for) provided by: Accounts receivable $ (33 ) $ (20 ) Prepaids (1 ) — Inventory (37 ) (10 ) Accounts payable and accrued liabilities 53 25
$ (18 ) $ (5 )
Cash interest and income taxes comprise:
(US $ millions) 2017 2016
Cash income taxes paid, net $ 2 $ 2
The net change in financial liabilities comprises:
(US $ millions) 2017 2016
Long-term debt $ (198 ) $ — Other long-term debt — (30 ) Accrued interest on long-term debt (6 ) 2 Net decrease in financial liabilities $ (204 ) $ (28 )
Cash and non-cash movements in financial liabilities comprise:
(US $ millions) 2017 2016
Cash movements: Repayment of debt $ (200 ) $ — Interest paid (42 ) (50 ) A/R securitization repayments — (30 ) (242 ) (80 )
Non-cash movements:
Amortization of debt issue costs 2 2 Interest expense 36 50 38 52 Net decrease in financial liabilities $ (204 ) $ (28 )
NOTE 17. CAPITAL MANAGEMENT
The capital of the Company consists of the components of equity and debt obligations. Norbord monitors its capital structure using two key measures of its relative debt position. While the Company considers both book and market basis metrics, it believes the market basis to be superior to the book basis in measuring the true strength and flexibility of its balance sheet. The two key measures used are defined as follows:
Net debt to capitalization, book basis, is net debt divided by the sum of net debt and tangible net worth. Net debt consists of the principal value of long-term debt, including the current portion and bank advances (if any) less cash and cash equivalents. Consistent with the treatment under the Company’s financial covenants, letters of credit are included in net debt. Tangible net worth consists of shareholders’ equity, less certain adjustments.
Net debt to capitalization, market basis, is net debt divided by the sum of net debt and market capitalization. Net debt is calculated, as outlined above, under net debt to capitalization, book basis. Market capitalization is the number of common shares outstanding at year-end multiplied by the trailing 12-month average per share market price. Market basis capitalization is intended to correct for the low historical book value of Norbord’s asset base relative to its fair value.
68 NORBORD 2017 ANNUAL REPORT
NOTE 18. FINANCIAL INSTRUMENTS
Norbord has exposure to market, commodity price, interest rate, currency, counterparty credit and liquidity risks. Norbord’s primary risk management objective is to protect the Company’s balance sheet, earnings and cash flow.
Norbord’s financial risk management activities are governed by Board-approved financial policies that cover risk identification, tolerance, measurement, hedging limits, hedging products, authorization levels and reporting. Derivative contracts that are deemed to be highly effective in offsetting changes in the fair value, net investment or cash flows of hedged items are designated as hedges of specific exposures. Gains and losses on these instruments are recognized in the same manner as the item being hedged. Hedge ineffectiveness, if any, is measured and included in current period earnings.
Market Risk Norbord purchases commodity inputs, issues debt at fixed and floating interest rates, invests surplus cash, sells product, purchases inputs in foreign currencies and invests in foreign operations. These activities expose the Company to market risk from changes in commodity prices, interest rates and foreign exchange rates, which affects the Company’s balance sheet, earnings and cash flows. The Company periodically uses derivatives as part of its overall financial risk management policy to manage certain exposures to market risk that result from these activities.
Commodity Price Risk Norbord is exposed to commodity price risk on most of its manufacturing inputs, which principally comprise wood fibre, resin and energy. These manufacturing inputs are purchased primarily on the open market in competition with other users of such resources, and prices are influenced by factors beyond Norbord’s control.
Norbord monitors market developments in all commodity prices to which it is materially exposed. No liquid futures markets exist for the majority of Norbord’s commodity inputs, but, where possible, Norbord will hedge a portion of its commodity price exposure up to Board-approved limits in order to reduce the potential negative impact of rising commodity input prices. Should Norbord decide to hedge any of this exposure, it will lock in prices directly with its suppliers or, if unfeasible, purchase financial hedges where liquid markets exist.
At December 31, 2017, Norbord has economically hedged approximately 6% of its 2018 expected natural gas consumption by locking in the price directly with its suppliers. Approximately 62% of Norbord’s forecasted electricity consumption is purchased in regulated markets, and Norbord has hedged approximately 43% of its 2018 deregulated electricity consumption. While these contracts are derivatives, they are exempt from being accounted for as financial instruments as they are considered normal purchases for the purpose of consumption.
Interest Rate Risk Norbord’s financing strategy is to access public and private capital markets to raise long-term core financing, and to utilize the banking market to provide committed standby credit facilities supporting its short-term cash flow needs. The Company has fixed-rate debt, which subjects it to interest rate price risk, and has floating-rate debt, which subjects it to interest rate cash flow risk. In addition, the Company invests surplus cash in bank deposits and short-term money market securities.
Currency Risk Norbord’s primary foreign exchange exposure arises from the following sources:
• net investments in foreign operations, limited to Norbord’s investment in its European operations which transact in both Pounds Sterling and Euros;
• Canadian dollar-denominated monetary assets and liabilities; and
• committed or anticipated foreign currency-denominated transactions, primarily Canadian dollar costs in Norbord’s Canadian operations and Euro revenues in Norbord’s UK operations.
Under the Company’s risk management policy, the Company may hedge up to 100% of its significant balance sheet foreign exchange exposures by entering into cross-currency swaps and forward foreign exchange contracts. The Company may also hedge a portion of future foreign currency-denominated cash flows, using forward foreign exchange contracts or options for periods of up to three years, in order to reduce the potential negative effect of a strengthening Canadian dollar versus the US dollar, or a weakening Euro versus the Pound Sterling.
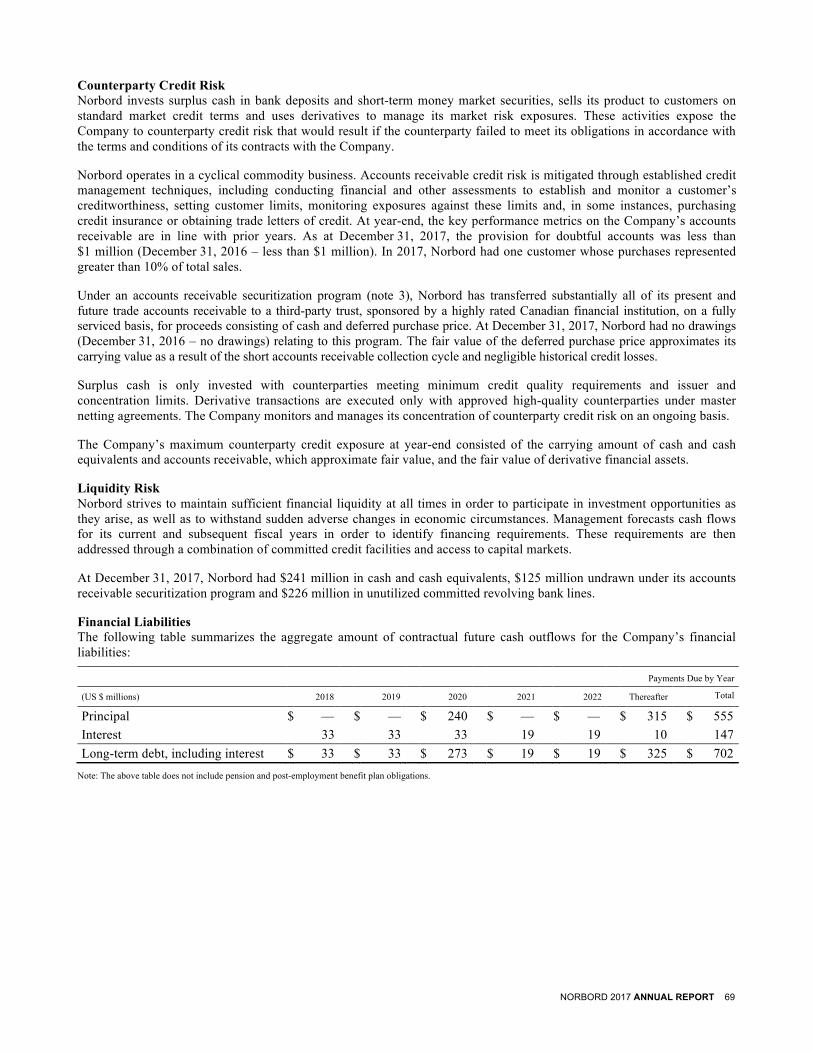
NORBORD 2017 ANNUAL REPORT 69
Counterparty Credit Risk Norbord invests surplus cash in bank deposits and short-term money market securities, sells its product to customers on standard market credit terms and uses derivatives to manage its market risk exposures. These activities expose the Company to counterparty credit risk that would result if the counterparty failed to meet its obligations in accordance with the terms and conditions of its contracts with the Company.
Norbord operates in a cyclical commodity business. Accounts receivable credit risk is mitigated through established credit management techniques, including conducting financial and other assessments to establish and monitor a customer’s creditworthiness, setting customer limits, monitoring exposures against these limits and, in some instances, purchasing credit insurance or obtaining trade letters of credit. At year-end, the key performance metrics on the Company’s accounts receivable are in line with prior years. As at December 31, 2017, the provision for doubtful accounts was less than $1 million (December 31, 2016 – less than $1 million). In 2017, Norbord had one customer whose purchases represented greater than 10% of total sales.
Under an accounts receivable securitization program (note 3), Norbord has transferred substantially all of its present and future trade accounts receivable to a third-party trust, sponsored by a highly rated Canadian financial institution, on a fully serviced basis, for proceeds consisting of cash and deferred purchase price. At December 31, 2017, Norbord had no drawings (December 31, 2016 – no drawings) relating to this program. The fair value of the deferred purchase price approximates its carrying value as a result of the short accounts receivable collection cycle and negligible historical credit losses.
Surplus cash is only invested with counterparties meeting minimum credit quality requirements and issuer and concentration limits. Derivative transactions are executed only with approved high-quality counterparties under master netting agreements. The Company monitors and manages its concentration of counterparty credit risk on an ongoing basis.
The Company’s maximum counterparty credit exposure at year-end consisted of the carrying amount of cash and cash equivalents and accounts receivable, which approximate fair value, and the fair value of derivative financial assets.
Liquidity Risk Norbord strives to maintain sufficient financial liquidity at all times in order to participate in investment opportunities as they arise, as well as to withstand sudden adverse changes in economic circumstances. Management forecasts cash flows for its current and subsequent fiscal years in order to identify financing requirements. These requirements are then addressed through a combination of committed credit facilities and access to capital markets.
At December 31, 2017, Norbord had $241 million in cash and cash equivalents, $125 million undrawn under its accounts receivable securitization program and $226 million in unutilized committed revolving bank lines.
Financial Liabilities The following table summarizes the aggregate amount of contractual future cash outflows for the Company’s financial liabilities:
Payments Due by Year
(US $ millions) 2018 2019 2020 2021 2022
Thereafter
Total
Principal $ — $ — $ 240 $ — $ — $ 315 $ 555 Interest 33 33 33 19 19 10 147 Long-term debt, including interest $ 33 $ 33 $ 273 $ 19 $ 19 $ 325 $ 702
Note: The above table does not include pension and post-employment benefit plan obligations.
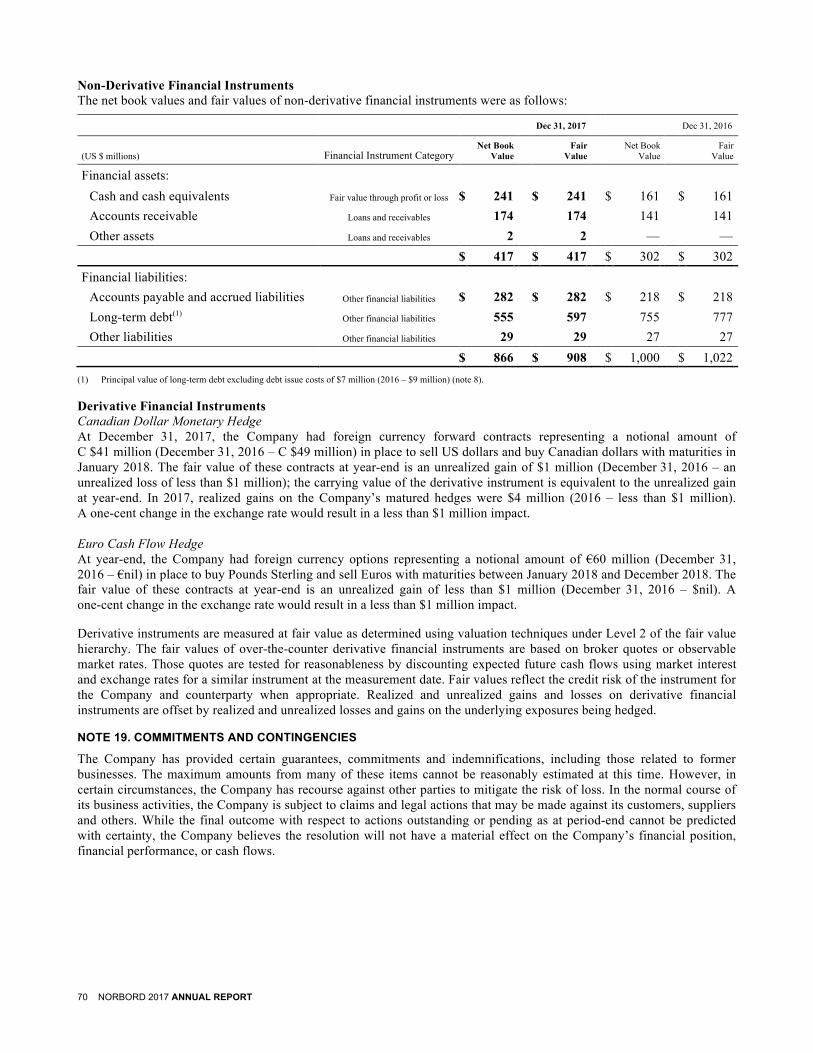
70 NORBORD 2017 ANNUAL REPORT
Non-Derivative Financial Instruments The net book values and fair values of non-derivative financial instruments were as follows:
Dec 31, 2017 Dec 31, 2016
(US $ millions) Financial Instrument Category
Net Book Value
Fair Value
Net Book Value
Fair Value
Financial assets: Cash and cash equivalents Fair value through profit or loss $ 241 $ 241 $ 161 $ 161
Accounts receivable Loans and receivables 174 174 141 141
Other assets Loans and receivables 2 2 — —
$ 417 $ 417 $ 302 $ 302
Financial liabilities: Accounts payable and accrued liabilities Other financial liabilities $ 282 $ 282 $ 218 $ 218
Long-term debt(1) Other financial liabilities 555 597 755 777
Other liabilities Other financial liabilities 29 29 27 27
$ 866 $ 908 $ 1,000 $ 1,022
(1) Principal value of long-term debt excluding debt issue costs of $7 million (2016 – $9 million) (note 8).
Derivative Financial Instruments Canadian Dollar Monetary Hedge At December 31, 2017, the Company had foreign currency forward contracts representing a notional amount of C $41 million (December 31, 2016 – C $49 million) in place to sell US dollars and buy Canadian dollars with maturities in January 2018. The fair value of these contracts at year-end is an unrealized gain of $1 million (December 31, 2016 – an unrealized loss of less than $1 million); the carrying value of the derivative instrument is equivalent to the unrealized gain at year-end. In 2017, realized gains on the Company’s matured hedges were $4 million (2016 – less than $1 million). A one-cent change in the exchange rate would result in a less than $1 million impact. Euro Cash Flow Hedge At year-end, the Company had foreign currency options representing a notional amount of €60 million (December 31, 2016 – €nil) in place to buy Pounds Sterling and sell Euros with maturities between January 2018 and December 2018. The fair value of these contracts at year-end is an unrealized gain of less than $1 million (December 31, 2016 – $nil). A one-cent change in the exchange rate would result in a less than $1 million impact.
Derivative instruments are measured at fair value as determined using valuation techniques under Level 2 of the fair value hierarchy. The fair values of over-the-counter derivative financial instruments are based on broker quotes or observable market rates. Those quotes are tested for reasonableness by discounting expected future cash flows using market interest and exchange rates for a similar instrument at the measurement date. Fair values reflect the credit risk of the instrument for the Company and counterparty when appropriate. Realized and unrealized gains and losses on derivative financial instruments are offset by realized and unrealized losses and gains on the underlying exposures being hedged.
NOTE 19. COMMITMENTS AND CONTINGENCIES
The Company has provided certain guarantees, commitments and indemnifications, including those related to former businesses. The maximum amounts from many of these items cannot be reasonably estimated at this time. However, in certain circumstances, the Company has recourse against other parties to mitigate the risk of loss. In the normal course of its business activities, the Company is subject to claims and legal actions that may be made against its customers, suppliers and others. While the final outcome with respect to actions outstanding or pending as at period-end cannot be predicted with certainty, the Company believes the resolution will not have a material effect on the Company’s financial position, financial performance, or cash flows.
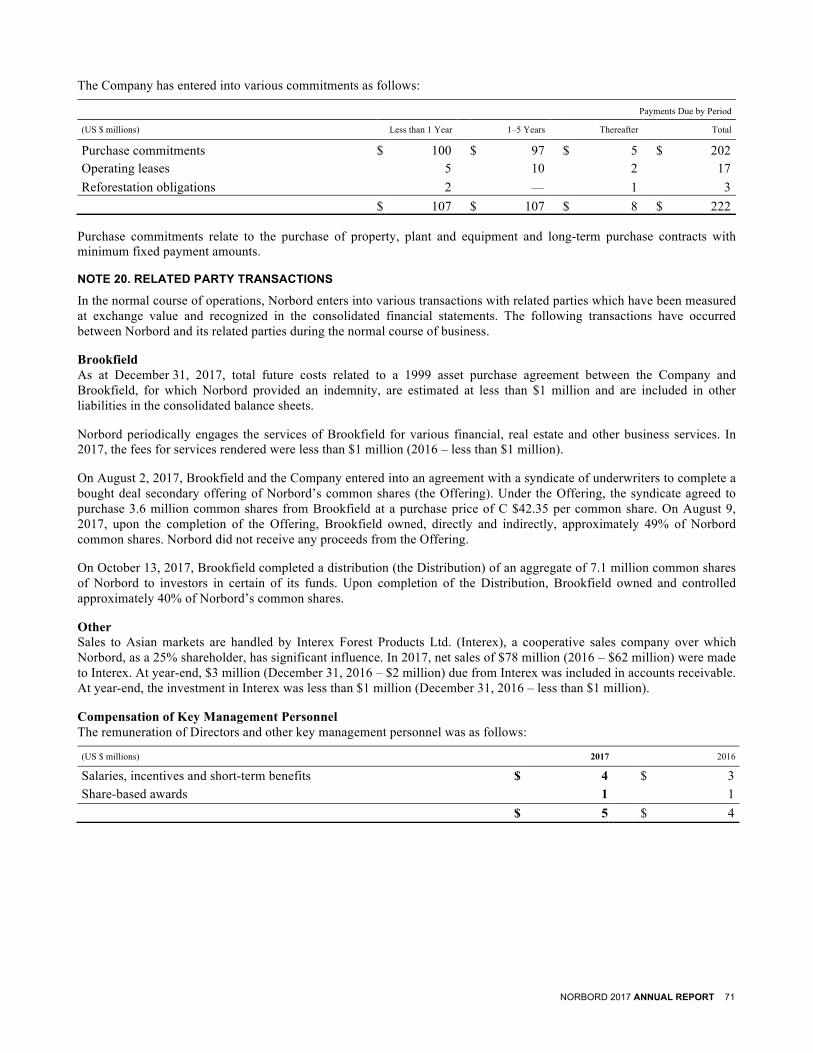
NORBORD 2017 ANNUAL REPORT 71
The Company has entered into various commitments as follows:
Payments Due by Period
(US $ millions) Less than 1 Year 1–5 Years Thereafter Total
Purchase commitments $ 100 $ 97 $ 5 $ 202 Operating leases 5 10 2 17
Reforestation obligations 2 — 1 3
$ 107 $ 107 $ 8 $ 222
Purchase commitments relate to the purchase of property, plant and equipment and long-term purchase contracts with minimum fixed payment amounts.
NOTE 20. RELATED PARTY TRANSACTIONS
In the normal course of operations, Norbord enters into various transactions with related parties which have been measured at exchange value and recognized in the consolidated financial statements. The following transactions have occurred between Norbord and its related parties during the normal course of business.
Brookfield As at December 31, 2017, total future costs related to a 1999 asset purchase agreement between the Company and Brookfield, for which Norbord provided an indemnity, are estimated at less than $1 million and are included in other liabilities in the consolidated balance sheets.
Norbord periodically engages the services of Brookfield for various financial, real estate and other business services. In 2017, the fees for services rendered were less than $1 million (2016 – less than $1 million).
On August 2, 2017, Brookfield and the Company entered into an agreement with a syndicate of underwriters to complete a bought deal secondary offering of Norbord’s common shares (the Offering). Under the Offering, the syndicate agreed to purchase 3.6 million common shares from Brookfield at a purchase price of C $42.35 per common share. On August 9, 2017, upon the completion of the Offering, Brookfield owned, directly and indirectly, approximately 49% of Norbord common shares. Norbord did not receive any proceeds from the Offering.
On October 13, 2017, Brookfield completed a distribution (the Distribution) of an aggregate of 7.1 million common shares of Norbord to investors in certain of its funds. Upon completion of the Distribution, Brookfield owned and controlled approximately 40% of Norbord’s common shares.
Other Sales to Asian markets are handled by Interex Forest Products Ltd. (Interex), a cooperative sales company over which Norbord, as a 25% shareholder, has significant influence. In 2017, net sales of $78 million (2016 – $62 million) were made to Interex. At year-end, $3 million (December 31, 2016 – $2 million) due from Interex was included in accounts receivable. At year-end, the investment in Interex was less than $1 million (December 31, 2016 – less than $1 million).
Compensation of Key Management Personnel The remuneration of Directors and other key management personnel was as follows:
(US $ millions) 2017 2016
Salaries, incentives and short-term benefits $ 4 $ 3 Share-based awards 1 1 $ 5 $ 4
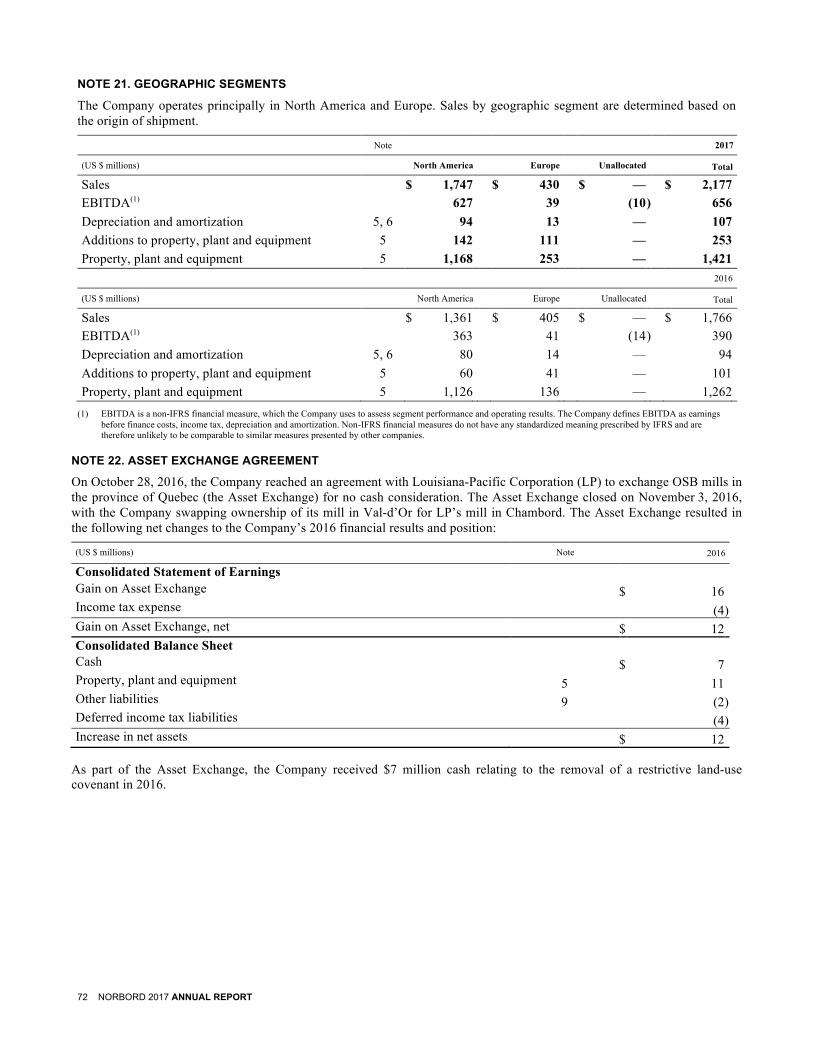
72 NORBORD 2017 ANNUAL REPORT
NOTE 21. GEOGRAPHIC SEGMENTS
The Company operates principally in North America and Europe. Sales by geographic segment are determined based on the origin of shipment.
Note
2017
(US $ millions) North America Europe Unallocated
Total
Sales $ 1,747 $ 430 $ — $ 2,177 EBITDA(1) 627 39 (10 ) 656 Depreciation and amortization 5, 6 94 13 — 107 Additions to property, plant and equipment 5 142 111 — 253 Property, plant and equipment 5 1,168 253 — 1,421
2016
(US $ millions) North America Europe Unallocated
Total
Sales $ 1,361 $ 405 $ — $ 1,766 EBITDA(1) 363 41 (14 ) 390 Depreciation and amortization 5, 6 80 14 — 94 Additions to property, plant and equipment 5 60 41 — 101 Property, plant and equipment 5 1,126 136 — 1,262
(1) EBITDA is a non-IFRS financial measure, which the Company uses to assess segment performance and operating results. The Company defines EBITDA as earnings before finance costs, income tax, depreciation and amortization. Non-IFRS financial measures do not have any standardized meaning prescribed by IFRS and are therefore unlikely to be comparable to similar measures presented by other companies.
NOTE 22. ASSET EXCHANGE AGREEMENT
On October 28, 2016, the Company reached an agreement with Louisiana-Pacific Corporation (LP) to exchange OSB mills in the province of Quebec (the Asset Exchange) for no cash consideration. The Asset Exchange closed on November 3, 2016, with the Company swapping ownership of its mill in Val-d’Or for LP’s mill in Chambord. The Asset Exchange resulted in the following net changes to the Company’s 2016 financial results and position:
(US $ millions)
Note
2016
Consolidated Statement of Earnings Gain on Asset Exchange $ 16 Income tax expense (4 ) Gain on Asset Exchange, net $ 12 Consolidated Balance Sheet Cash $ 7 Property, plant and equipment 5 11 Other liabilities 9 (2 ) Deferred income tax liabilities (4 ) Increase in net assets $ 12
As part of the Asset Exchange, the Company received $7 million cash relating to the removal of a restrictive land-use covenant in 2016.

NORBORD 2017 ANNUAL REPORT 73
Five-Year Historical Review
(unaudited)
(in US $ millions, except per share information) 2017 2016 2015 2014 2013(1)
EARNINGS
Sales $ 2,177 $ 1,766 $ 1,509 $ 1,601 $ 1,343 Adjusted EBITDA(2) 672 385 125 119 291 Depreciation and amortization (107) (94) (86) (85) (56) Finance costs (32) (52) (55) (53) (37) Loss on disposal of assets (12) — (1) (2) — Stock-based compensation and related costs (3) (2) (2) (2) (4) Pre-operating costs related to Inverness project (1) — — — — Gain on Asset Exchange — 16 — — — Merger transaction costs — — (8) (10) — Severance and other costs to achieve Merger synergies — (8) (7) — — Costs related to High Level fire — (1) — — — Costs on early debt extinguishment — — (25) — (20) Foreign exchange loss on Ainsworth Notes — — (28) (28) — Gain (loss) on derivative financial instrument on
Ainsworth Notes —
— 4
(11)
—
Costs related to terminated LP acquisition — — — (2) — Earnings (loss) before income tax 517 244 (83) (74) 174 Income tax (expense) recovery (81) (61) 27 35 (25) Earnings (loss) 436 183 (56) (39) 149
Adjusted earnings (loss)(2) $ 389 $ 174 $ (12) $ (15) $ 145 Per common share Earnings (loss), basic(3) $ 5.06 $ 2.14 $ (0.66) $ (0.46) $ 2.92 Adjusted earnings (loss), basic(2,4) 4.51 2.03 (0.14) (0.18) 2.84 FINANCIAL POSITION Cash and cash equivalents $ 241 $ 161 $ 9 $ 92 $ 193 Operating working capital 127 118 125 106 44 Property, plant and equipment 1,421 1,262 1,260 1,341 794 Net debt for financial covenant purposes(2,5) 333 619 751 418 251 Tangible net worth for financial covenant purposes(2,5) 1,248 905 724 404 492 Net debt to capitalization, book basis(2,5) 21% 41% 51% 51% 34% CASH FLOW Cash provided by operating activities $ 608 $ 313 $ 24 $ 16 $ 244 Cash used for investing activities (244) (94) (68) (113) (79) Cash used for financing activities (294) (52) (27) (125) (100) Foreign exchange revaluation on cash and cash
equivalents held 10
(15) (12)
(13)
—
Increase (decrease) in cash and cash equivalents $ 80 $ 152 $ (83) $ (235) $ 65 PER COMMON SHARE Dividends declared (C $) $ 1.50 $ 0.40 $ 0.70 $ 2.40 $ 1.80 Stock price (TSX) (C $) High 51.75 35.67 29.07 32.92 37.55 Low 31.38 19.90 19.14 20.82 25.41 Close 42.55 33.91 26.95 26.34 33.86 (1) Pre-2014 figures have not been restated for the Merger and reflect Norbord on a standalone basis. (2) Non-IFRS measure; see the Non-IFRS Financial Measures section on page 37. (3) Basic and diluted (loss) earnings per share are the same except diluted earnings per share for 2017, 2016 and 2013 are $5.03, $2.13 and $2.79, respectively. (4) Basic and diluted Adjusted (loss) earnings per share are the same except diluted Adjusted earnings per share for 2017, 2016 and 2013 are $4.49, $2.02 and
$2.72, respectively. (5) 2014 figures have not been restated for the Merger as financial covenants pre-Merger were based on Norbord on a standalone basis.

74 NORBORD 2017 ANNUAL REPORT
Selected Quarterly Information
(unaudited) 2017
(in US $ millions, except per share information) Q1 Q2 Q3 Q4 Total
Sales North America $ 367 $ 431 $ 464 $ 485 $ 1,747 Europe 100 105 114 111 430 Total 467 536 578 596 2,177 Adjusted EBITDA(1) North America 102 157 184 195 638 Europe 6 9 14 12 41 Unallocated (5) (1) 2 (3) (7) Total 103 165 200 204 672 Depreciation and amortization (24) (27) (27) (29) (107) Finance costs (11) (8) (7) (6) (32) Loss on disposal of assets (5) (2) (2) (3) (12) Stock-based compensation and related costs (1) (1) (1) — (3) Pre-operating costs related to Inverness project — — (1) — (1) Gain on Asset Exchange — — — — — Other costs incurred to achieve Merger synergies — — — — — Costs related to High Level fire — — — — — Earnings before income tax 62 127 162 166 517 Income tax expense (13) (30) (32) (6) (81) Earnings 49 97 130 160 436
Adjusted earnings(1) $ 50 $ 95 $ 121 $ 123 $ 389 Per common share Earnings, basic(2) $ 0.57 $ 1.13 $ 1.51 $ 1.85 $ 5.06 Adjusted earnings, basic(1,3) 0.58 1.10 1.40 1.42 4.51 Cash provided by operating activities(1) 0.45 1.67 2.36 2.57 7.05 Dividends declared(4) 0.10 0.30 0.50 0.60 1.50 Key performance metrics Return on capital employed(1) 29% 44% 52% 52% 45% Net debt for financial covenant purposes(1) $ 580 $ 567 $ 449 $ 333 Tangible net worth for financial covenant purposes(1) 951 1,028 1,128 1,248 Net debt to capitalization, market basis(1) 22% 20% 15% 11% Net debt to capitalization, book basis(1) 38% 36% 28% 21% (1) Non-IFRS measure; see the Non-IFRS Financial Measures section on page 37. (2) Basic and diluted earnings per share are the same except diluted earnings per share for Q2 2017, Q3 2017, Q4 2017 and 2017 are $1.12, $1.50, $1.84 and $5.03, respectively. (3) Basic and diluted Adjusted earnings per share are the same except diluted Adjusted earnings per share for Q3 2017, Q4 2017 and 2017 are $1.39, $1.41 and $4.49,
respectively. (4) Dividends declared per share stated in Canadian dollars.
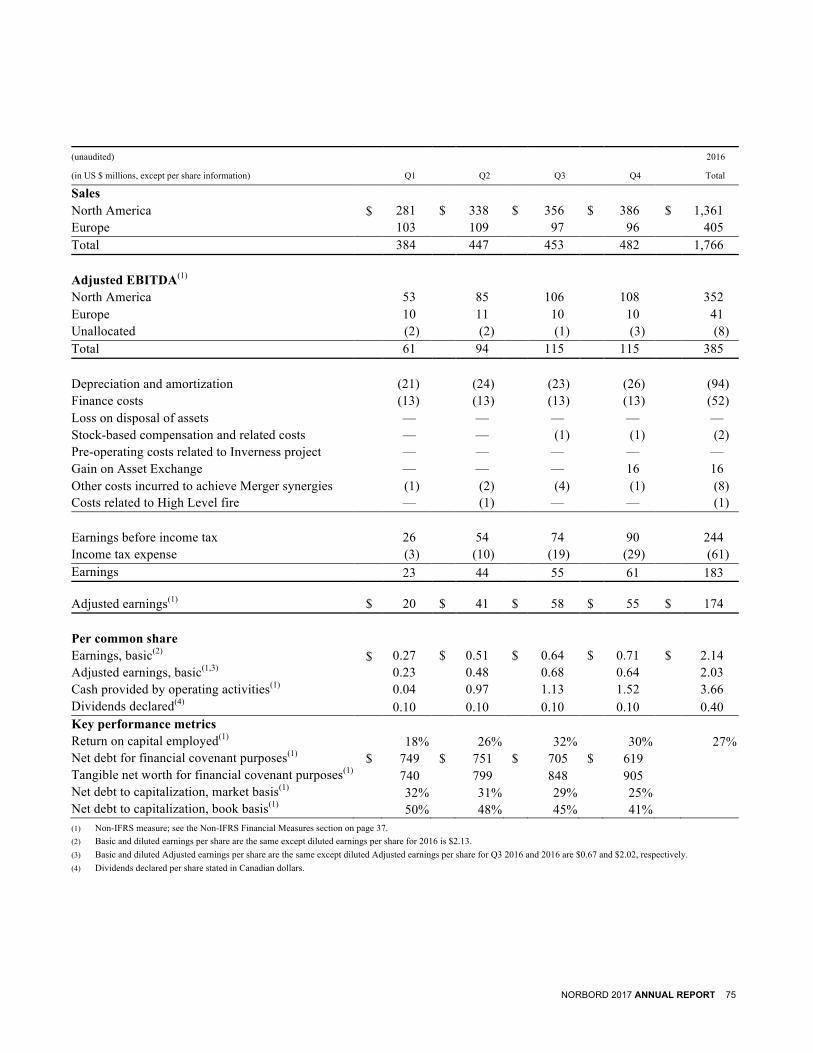
NORBORD 2017 ANNUAL REPORT 75
(unaudited) 2016
(in US $ millions, except per share information) Q1 Q2 Q3 Q4 Total
Sales North America $ 281 $ 338 $ 356 $ 386 $ 1,361 Europe 103 109 97 96 405 Total 384 447 453 482 1,766 Adjusted EBITDA(1) North America 53 85 106 108 352 Europe 10 11 10 10 41 Unallocated (2) (2) (1) (3) (8) Total 61 94 115 115 385 Depreciation and amortization (21) (24) (23) (26) (94) Finance costs (13) (13) (13) (13) (52) Loss on disposal of assets — — — — — Stock-based compensation and related costs — — (1) (1) (2) Pre-operating costs related to Inverness project — — — — — Gain on Asset Exchange — — — 16 16 Other costs incurred to achieve Merger synergies (1) (2) (4) (1) (8) Costs related to High Level fire — (1) — — (1) Earnings before income tax 26 54 74 90 244 Income tax expense (3) (10) (19) (29) (61) Earnings 23 44 55 61 183
Adjusted earnings(1) $ 20 $ 41 $ 58 $ 55 $ 174 Per common share Earnings, basic(2) $ 0.27 $ 0.51 $ 0.64 $ 0.71 $ 2.14 Adjusted earnings, basic(1,3) 0.23 0.48 0.68 0.64 2.03 Cash provided by operating activities(1) 0.04 0.97 1.13 1.52 3.66 Dividends declared(4) 0.10 0.10 0.10 0.10 0.40 Key performance metrics Return on capital employed(1) 18% 26% 32% 30% 27% Net debt for financial covenant purposes(1) $ 749 $ 751 $ 705 $ 619 Tangible net worth for financial covenant purposes(1) 740 799 848 905 Net debt to capitalization, market basis(1) 32% 31% 29% 25% Net debt to capitalization, book basis(1) 50% 48% 45% 41% (1) Non-IFRS measure; see the Non-IFRS Financial Measures section on page 37. (2) Basic and diluted earnings per share are the same except diluted earnings per share for 2016 is $2.13. (3) Basic and diluted Adjusted earnings per share are the same except diluted Adjusted earnings per share for Q3 2016 and 2016 are $0.67 and $2.02, respectively. (4) Dividends declared per share stated in Canadian dollars.
76 NORBORD 2017 ANNUAL REPORT
Glossary
Bsf: Measurement for panel products equal to a billion square feet. This measurement is calculated on either a 3/8-inch or 7/16-inch thick basis.
m3: Cubic metre. A measure of volume equal to approximately 1,130 square feet (3/8-inch basis).
MDF: Medium density fibreboard. A panelboard produced by chemically bonding highly refined wood fibres of uniform size under heat and pressure.
Merger: On March 31, 2015, Norbord completed its merger with Ainsworth. The Merger created the largest global OSB producer and brought together Norbord’s manufacturing cost leadership with Ainsworth’s track record of innovation in product development.
MIP: Norbord’s Margin Improvement Program is a company-wide continuous improvement effort to reduce manufacturing costs through improved productivity and lower raw material use, reduce overhead costs and improve product mix. MIP gains are measured relative to the previous year at constant prices and exchange rates.
Msf (MMsf): Measurement for panel products equal to a thousand (million) square feet. This measurement is calculated on either a 3/8-inch or 7/16-inch thick basis.
OSB: Oriented strand board. An engineered structural wood panel produced by chemically bonding wood strands in a uniform direction under heat and pressure.
Panelboard: Oriented strand board, particleboard, medium density fibreboard and plywood.
Particleboard: A panelboard produced by chemically bonding clean sawdust, small wood particles and recycled wood fibre under heat and pressure.
Plywood: A panelboard produced by chemically bonding thin layers of solid wood veneers.
NORBORD 2017 ANNUAL REPORT 77
Board of Directors
Jack Cockwell Director since 1987 Director, Brookfield Asset Management Inc.
Pierre Dupuis Director since 1995 Corporate Director
Paul Gagné Director since 2015 Corporate Director
Peter Gordon Chair Director since 2015 Managing Partner, Brookfield Asset Management Inc.
Paul Houston Lead Director Director since 2015 Corporate Director
Barrie Shineton Director since 2004 Corporate Director
Denis Turcotte Director since 2012 Managing Partner, Brookfield Capital Partners
Peter Wijnbergen Director since 2014 President and Chief Executive Officer, Norbord Inc.
Additional details on Norbord’s Directors are provided in the Management Proxy Circular dated March 5, 2018, which is available on Norbord’s website at www.norbord.com, on SEDAR at www.sedar.com and on EDGAR at www.sec.gov.
Senior Management
Peter Gordon Chair
Peter Wijnbergen President and Chief Executive Officer
Robin Lampard Senior Vice President and Chief Financial Officer
Nigel Banks Senior Vice President, Corporate Services
Bruce Alexander Senior Vice President, Sales, Marketing and Logistics
Kevin Burke Senior Vice President, North American Operations
Alan McMeekin Senior Vice President, Europe
78 NORBORD 2017 ANNUAL REPORT
Corporate Information
Norbord Inc. 1 Toronto Street, Suite 600 Toronto, Ontario M5C 2W4 416-365-0705 1-888-667-2673 www.norbord.com [email protected] TSX and NYSE stock symbol: OSB
Sales Toronto, Ontario 416-365-0705 1-800-387-1740
Cowie, Scotland 011-44-1786-819220
2018 Financial Calendar Norbord Year-End December 31
(dates on or about) Q1 Earnings Release May 3, 2018 Q2 Earnings Release August 2, 2018 Q3 Earnings Release November 1, 2018 Q4 and 2018 Full Year February 1, 2019
Annual Meeting of Shareholders Thursday, May 3, 2018 at 10:00 a.m. The National Club 303 Bay Street Toronto, Ontario M5H 2R1
Media and Investor Relations Heather Colpitts Senior Manager, Corporate Affairs 416-365-0705 [email protected]
Shareholder Inquiries Elaine Toomey Assistant Corporate Secretary 416-365-0705 [email protected]
Shareholder Information Main Transfer Agent & Registrar AST Trust Company (Canada) 1 Toronto Street, Suite 1200 Toronto, Ontario M5C 2V6 416-682-3860 1-800-387-0825 [email protected]
Co-Transfer Agent & Registrar American Stock Transfer & Trust Company, LLC 6201 15th Avenue Brooklyn, NY 11219 1-800-937-5449 718-236-2641 [email protected]
To receive additional copies of this report, please contact us at 1-888-667-2673, 416-365-0705 or [email protected].


www.norbord.com
NORTH AMERICAN PRODUCTS
EUROPEAN PRODUCTS
FLAT ROOF DECKING