2017 AFP Payments Fraud and Control Survey
41
2017 AFP Payments Fraud and Control Survey REPORT OF SURVEY RESULTS Underwritten by
Transcript of 2017 AFP Payments Fraud and Control Survey

2017 AFPPayments Fraud and Control SurveyREPORT OF SURVEY RESULTS
Underwritten by
Association for Financial Professionals
4520 East-West Highway, Suite 750
Bethesda, MD 20814
Phone 301.907.2862
Fax 301.907.2864
www.AFPonline.org
2017 AFPPayments Fraud and Control SurveyREPORT OF SURVEY RESULTS
March 2017
Underwritten by

For the ninth consecutive year, J.P. Morgan is proud to once again sponsor the AFP Payments Fraud and Control Survey, and we’re pleased to provide you with this copy of AFP’s 2017 report.
This year’s survey results demonstrate that cybersecurity models and strict control governance are crucial for all businesses, given that 75 percent of companies were targets of payments fraud last year. Additionally, the survey reveals that:
• 75 percent of organizations experienced check fraud in 2016. This is an increase from 71 percent in 2015 and a reversal of the declining trend in check fraud since 2010.
• 74 percent reported that their organizations were exposed to business email compromise (BEC), a 10 percent increase from the prior year. • Over70percentofcorporatetreasuryandfinanceprofessionalsarehesitantaboutadopting mobile payments at their organizations, as they question the security of this payment method. • Nearly half of survey respondents reported that the incidents of fraud attempts increased in 2016.
With these statistics in mind, it’s important for all businesses to take preventive measures to pro-tect their payments, including educating their employees on current payments fraud practices, and implementing the products and processes they need to protect their corporate assets and data from cyber fraud.
J.P. Morgan is one of the world’s largest providers of treasury management services and is a leader in electronic payments technology and solutions. We’re committed to fraud mitigation and information protection across our entire infrastructure, and we’ll continue to invest in the technology, educational toolsandriskmanagementexpertiseintheongoingfightagainstpaymentsfraud.
We hope this survey serves as such an important tool in understanding the potential cyber risks withinthepaymentsindustry—theyshouldnotbeunderestimated.We’dliketothanktheAFPforprovidinguswiththisyear’svaluableinsights—theyareacautiousreminderthatthebestdefenseisto remain vigilant in fraud detection and cybersecurity protection protocols.
With best regards,
Nancy K. McDonnellManaging Director J.P. Morgan
J.P. Morgan is a marketing name for certain businesses segments of JPMorgan Chase & Co. and its subsidiaries worldwide. The material con-tained herein or in any related presentation or oral briefing do not constitute in any way J.P. Morgan research or a J.P. Morgan report, and should not be treated as such (and may differ from that contained in J.P. Morgan research) and are not intended as an offer or solicitation for the purchase or sale of any financial product or a commitment by J.P. Morgan as to the availability to any person of any such product at any time. All J.P. Morgan products, services, or arrangements are subject to applicable laws and regulations, its policies and procedures and its service terms, and not all such products and services are available in all geographic areas.

©2017 Association for Financial Professionals, Inc. All Rights Reserved www.AFPonline.org 1
2017 AFP Payments Fraud and Control Survey
IntroductionPayments fraud has been a concern for organizations for many years, but has become
an even more troublesome issue recently. While enterprising criminals keep developing
new and innovative ways of scamming their victims, they are also reverting back to
old-fashioned methods, such as check fraud. In the United States, checks are the
payment method most often subject to fraud, likely due to the extensive use of checks
for business-to-business (B2B) transactions.
In addition, new technology is providing fraudsters with an expanding set of tools
tocommitfraud—particularlywithchecks—andisalsoenablingthemtodevelopnew
forms of fraud, such as business email compromise (BEC) scams. Since all organizations,
tosomeextent,makefinancialtransactions,theyconsequentlyarealsopotentialtargets
for these criminals. One of the toughest challenges for corporations is that these
technologically savvy individuals seem to be at least one step ahead of organizations’
methods to guard against fraud. It usually takes some time before information on how
to protect against new fraud approaches reaches potential targets, and so the scams can
continue for a while. It is impossible for organizations to be completely protected from
payments fraud, but there is much they can do to limit their exposure to it.
Each year since 2005, the Association for Financial Professionals® (AFP) has
conducted its Payments Fraud and Control Survey to examine the trends in payments
fraud in business-to-business (B2B) activities, the level of fraud activity, payment methods
impacted by fraud and the extent of the impact from fraud. The survey also captures
information on the strategies and controls being implemented by organizations, and
highlights the emergence of any new tactics fraudsters are adopting.
Continuingtheseefforts,inJanuary2017AFPconductedits13thAnnual Payments
Fraud and Control Survey. The survey generated 547 responses from corporate
practitioners from organizations of varying sizes, representing numerous industries.
Theirresponsesformthebasisofthisreportandreflectdatafor2016.
AFP thanks J.P. Morgan for its underwriting support of the 2017 AFP Payments Fraud
and Control Survey.Boththequestionnairedesignandthefinalreportarethesole
responsibility of AFP’s Research Department. Information on the demographics of the
respondents can be found at the end of the report.
2017 AFP Payments Fraud and Control Survey
2 www.AFPonline.org ©2017 Association for Financial Professionals, Inc. All Rights Reserved
74% of organizations were victims of payments fraud in 2016
Exposed to more earnings uncertainty
Exposed to same level of earnings uncertainty
Exposed to less earnings uncertainty
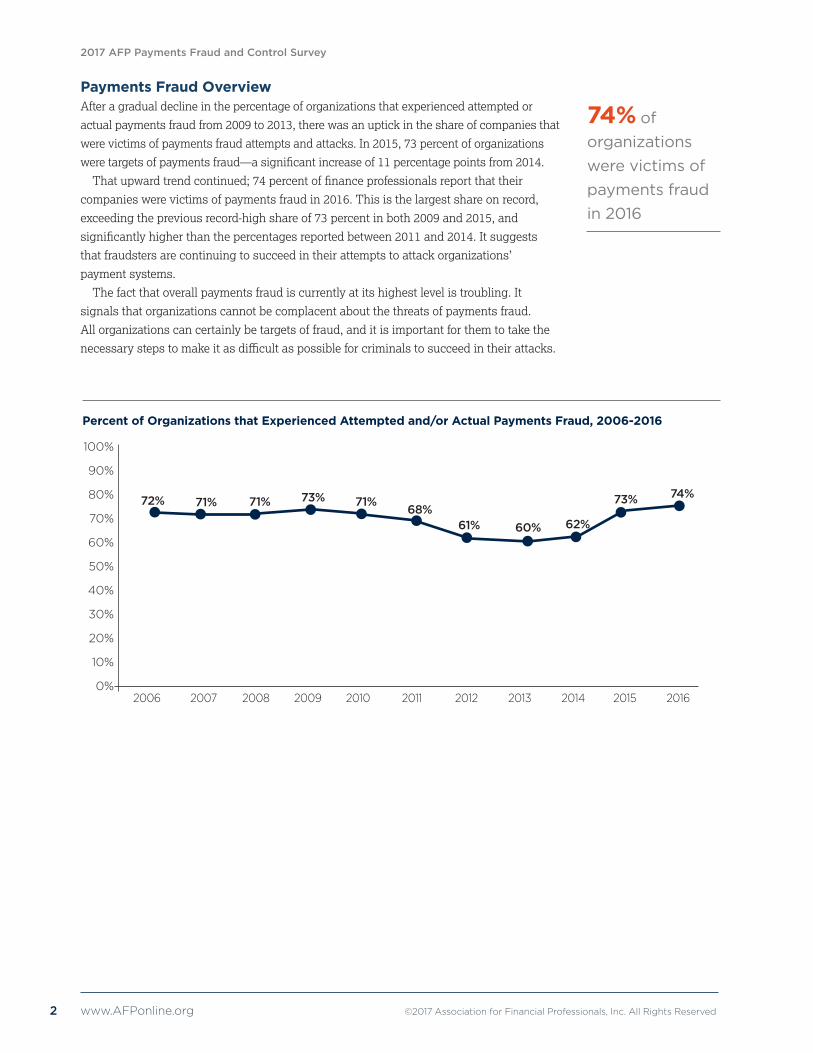
Payments Fraud Overview After a gradual decline in the percentage of organizations that experienced attempted or
actualpaymentsfraudfrom2009to2013,therewasanuptickintheshareofcompaniesthat
werevictimsofpaymentsfraudattemptsandattacks.In2015,73percentoforganizations
weretargetsofpaymentsfraud—asignificantincreaseof11percentagepointsfrom2014.
Thatupwardtrendcontinued;74percentoffinanceprofessionalsreportthattheir
companies were victims of payments fraud in 2016. This is the largest share on record,
exceedingthepreviousrecord-highshareof73percentinboth2009and2015,and
significantlyhigherthanthepercentagesreportedbetween2011and2014.Itsuggests
that fraudsters are continuing to succeed in their attempts to attack organizations’
payment systems.
The fact that overall payments fraud is currently at its highest level is troubling. It
signals that organizations cannot be complacent about the threats of payments fraud.
All organizations can certainly be targets of fraud, and it is important for them to take the
necessarystepstomakeitasdifficultaspossibleforcriminalstosucceedintheirattacks.
Percent of Organizations that Experienced Attempted and/or Actual Payments Fraud, 2006-2016
100%
90%
80%
70%
60%
50%
40%
30%
20%
10%
0%2006 2007 2008 2009 2010 2011 2012 2013 2014 2015 2016
72% 71% 71% 73% 71%68%
61% 60% 62%
73% 74%

©2017 Association for Financial Professionals, Inc. All Rights Reserved www.AFPonline.org 3
2017 AFP Payments Fraud and Control Survey
Checks continue to be the payment method most frequently targeted by those
committingorattemptingtocommitfraud.Seventy-fivepercentoforganizationsthatwere
victims of fraud attempts/attacks in 2016 experienced check fraud. This is an increase from
the 71 percent that experienced check fraud in 2015.
The fact that check fraud remains the most prevalent form of payments fraud is not
surprising. Checks continue to be the payment method most often used by organizations.
According to the 2016 AFP Electronic Payments Survey, 51 percent of companies’ B2B
payments are made by check. Since checks are more prevalent as a payment method,
they subsequently are most often targets of fraud. Another possible reason for the increase
in payments fraud via check could be business email compromise (BEC) scams that
target checks to some extent.
Organization size appears to have had an impact on the incidence of payments fraud in 2016.
Those organizations with at least $1 billion in annual revenue were more likely to have been
subject to fraud than were smaller organizations with annual revenue of less than $1 billion.
Percent of Organizations that Experienced Attempted and/or Actual Payments Fraud in 2016
All Annual Annual Annual Annual Revenue Revenue Revenue Revenue Less Than at Least at Least at Least $1 Billion $1 Billion $1 Billion and $1 Billion and Fewer Than 26 More Than 100 Payment Accounts Payment Accounts
74% 71%
81% 82% 84%90%
80%
70%
60%
50%
40%
30%
20%
10%
0%
Checks continue to be the payment method most often exposed to fraud activity

2017 AFP Payments Fraud and Control Survey
4 www.AFPonline.org ©2017 Association for Financial Professionals, Inc. All Rights Reserved
In 2016, wire transfers were the second most-often targeted payment method attacked by
fraudsters. Forty-six percent of corporate practitioners whose organizations had experienced
attempted or actual payments fraud report that such attacks were via wire transfers. This is
similartothe48percentoffinanceprofessionalswhoreportedwiretransferfraudin2015,
butasignificantincreasefromthe27percentand14percentwhoreportedwiretransferfraud
in2014and2013,respectively.
Payment Methods that Were Targets of Attempted and/or Actual Payments Fraud in 2016*(Percent of Organizations)
80%
70%
60%
50%
40%
30%
Checks Wire Corporate/commercial ACH debits ACH credits Organization transfers credit cards not a victim (e.g., purchasing, T&E, fleet)
66%
44%
55%
All
Annual Revenue Less Than $1 Billion
Annual Revenue At Least $1 Billion
40%35%34%
24%27%
23% 25%
20%22%
10%
4%8%
19%
29%26%
Finance professionals are increasingly dealing with business email compromise (BEC)
scams. (More information about BEC is covered later in this report.) While checks are often
targetsofBECscams,themaintarget—orpreferredpaymentmethod—forBECscams
remains wire transfers. Looking at the long-term trends in wire fraud, it is evident that the
share of organizations subject to payments fraud via wire transfers has increased dramatically.
Onlyfivepercentoffinanceprofessionalsreportedwirefraudin2009,butthesharerose
continually—anddramatically—peakingat48percentin2015.Thedramaticincreaseinwire
fraud coincided directly with the rise in BEC scams. The fact that wire fraud is still being
reportedaroundasimilarlyelevatedlevel(46percent)indicatesthatBECscams—
unfortunately—continuetobeprevalentandeffective.
Fraud via corporate/commercial credit cards accounted for the third largest share of fraud
(citedby32percentofsurveyrespondents),followedcloselybyACHdebits(30percent)and
ACHcredits(11percent).Theincidenceofpaymentfraudviacardshasexperiencedsignificant
upwardanddownwardmovements.Cardfraudpeakedin2013at43percent,likelydueto
large data breaches at major retailers in which card credentials were stolen.
Wire transfers were the 2ndmost-often targeted payment method in 2016
*This chart also includes data for organizations that had not experienced attempted/actual fraud

©2017 Association for Financial Professionals, Inc. All Rights Reserved www.AFPonline.org 5
2017 AFP Payments Fraud and Control Survey
AlsonoteworthyistherecentriseinACHdebitfraud—from25percentinboth2014and
2015to30percentin2016.The2016figureishigherthaninanyofthepreviousyears’
surveys, and could be an indication of some new type of fraud. As always, it is vital that
financeprofessionalsstayalertandreportinstancesoffraudtoauthorities.
Trends in Payments Fraud Activity(Percent of Organizations that Experienced Attempted and/or Actual Payments Fraud)
100%
90%
80%
70%
60%
50%
40%
30%
—— Checks —— Wire transfers —— Corporate/commercial credit cards —— ACH debits —— ACH credits
2011 2012 2013 2014 2015 2016
85% 87%82%
77%71%
75%
5%8% 9% 10% 11% 11%
11%14%
27%
48%46%
20%27%
22%25% 25%
30%
32%
39%34%
43%
29%
23%
Amajorityoffinanceprofessionals(55percent)reportsthattheincidenceofpayments
fraud at their companies in 2016 was unchanged from 2015. Thirty-six percent of respondents
whose organizations experienced payments fraud report that the number of incidents of fraud
attempts increased in 2016 compared to 2015 and nine percent indicate it had decreased.
Theseresultsreflectaslightimprovementfromthepreviousyearwhen42percentofsurvey
respondents indicated the incidence of payments fraud increased in 2015 compared to 2014.
Larger organizations with annual revenue of at least $1 billion were more likely than smaller
companies to have experienced an increase in fraud activity over the past year (42 percent in
2016versus35percentin2015).

2017 AFP Payments Fraud and Control Survey
6 www.AFPonline.org ©2017 Association for Financial Professionals, Inc. All Rights Reserved
Protectingthemselvesfrompaymentsfraudcanbeverydifficultfororganizations.
Certainlythereareanumberofproductsinthemarketthatcanhelpfightfraudonsome
level.However,criminalsarerelentlessandareconstantlydiscoveringnewwaysto
infiltrateorganizations;mostcompaniessimplydonothavetheresourcestoadequately
protect themselves. Their banking partners can provide a number of protective measures
such as positive pay, etc. But those measures come with a cost, and those costs can directly
affectanorganization’sbottomline.
AnotherchallengeishowdifferentbusinesseshandleEMVtechnology.Forbig-ticket-item
retailers,EMVmakesmoresensethanforretailersinahigh-volume,low-valuebusiness
suchasfastfoodrestaurants.ThecostofinvestinginnewEMV-enabledterminals(which
authenticatechipcardtransactions)forfast-foodrestaurantsissignificant,andthose
businesses may not be experiencing considerable fraud. There are cases where certain
businesseswillriskpaymentsfraudmerelybecauseafinanciallossincurredfromafraud
attack may be lower than the cost of investing in new terminals.
Change in Incidence of Payments Fraud in 2016 Compared to 2015 (Percentage Distribution of Organizations that Experienced Attempted and/or Actual Payments Fraud)
36%
55%
9%
Increased
About the same
Decreased

©2017 Association for Financial Professionals, Inc. All Rights Reserved www.AFPonline.org 7
2017 AFP Payments Fraud and Control Survey
Financial Loss from Fraud Attempts Amajorityofcompaniesthatweretargetsofpaymentfraudin2016sufferedarelativelysmall
financiallossasaresult.Fourteenpercentoforganizationsthatexperiencedpaymentsfraud
in2016didnothaveafinanciallossfromthefraud.For25percentofthosethatdid,the
potentiallossfromfraudin2016wasestimatedatlessthan$25,000;for32percentofthem
the loss was between $25,000 and $249,999. The potential loss was estimated at $250,000 or
more at 29 percent of organizations.
Larger organizations with annual revenue greater than $1 billion were more likely than
othercompaniestohaveexperiencedpotentialfinanciallossinthehigherdollarranges.
Thirty-nine percent of corporate practitioners from these companies report the potential loss
fromfraudin2016wasgreaterthan$250,000.Notably,32percentoffinanceprofessionals
from larger organizations with more than 100 payment accounts report the potential fraud
loss in 2016 was more than $500,000.
Potential Financial Loss from Attempted or Actual Payments Fraud in 2016(Percentage Distribution of Organizations that Experienced Attempted and/or Actual Payments Fraud)
Annual Annual Annual Revenue Annual Revenue Revenue Revenue At Least $1 Billion At Least $1 Billion Less Than At Least and Fewer Than and More Than All $1 Billion $1 Billion 26 Payment Accounts 100 Payment Accounts
No Loss 14% 20% 9% 11% 8%
Up to $24,999 25 28 20 27 16
$25,000-$49,999 9 9 10 11 8
$50,000-$99,999 11 13 9 8 8
$100,000-$249,999 12 14 12 13 16
$250,000-$499,999 10 6 13 13 12
$500,000-$999,999 4 2 5 4 12
$1,000,000-$1,999,999 7 5 8 6 4
Over $2,000,000 8 4 13 8 16

2017 AFP Payments Fraud and Control Survey
8 www.AFPonline.org ©2017 Association for Financial Professionals, Inc. All Rights Reserved
Seventy-fivepercentoforganizationsthatwereexposedtoatleastonepaymentsfraud
attempt in 2016 did not incur an actual financiallossfromthatattempt.Thirteenpercentof
surveyrespondentsreportafinanciallosstotheirorganizationsoflessthan$25,000dueto
payments fraud, and only four percent report a loss greater than $250,000. Over one-third of
larger organizations maintaining more than 100 payment accounts were likely to experience
adirectfinanciallossduetopaymentsfraud.
Actual Direct Financial Loss from Attempted and/or Actual Payments Fraud in 2016(Percentage Distribution of Organizations that Experienced Attempted and/or Actual Payments Fraud)
Annual Annual Annual Revenue Annual Revenue Revenue Revenue At Least $1 Billion At Least $1 Billion Less Than At Least and Fewer Than and More Than All $1 Billion $1 Billion 26 Payment Accounts 100 Payment Accounts
No Loss 75% 82% 71% 75% 65%
Up to $24,999 13 13 11 16 4
$25,000-$49,999 3 – 4 1 4
$50,000-$99,999 4 3 5 2 12
$100,000-$249,999 3 1 5 3 12
$250,000-$499,999 1 – 1 1 –
$500,000-$999,999 1 1 – – –
$1,000,000-$1,999,999 1 – 2 1 4
Over $2,000,000 1 – 1 – –

©2017 Association for Financial Professionals, Inc. All Rights Reserved www.AFPonline.org 9
2017 AFP Payments Fraud and Control Survey
Costs to manage/defend and/or clean up from fraud attacks were relatively low for most
organizations. Forty-eight percent did not incur any expenses due to a fraud attempt, and
41 percent spent less than $25,000 to defend against or clean up the fraud. A greater share
oflargerorganizations—specificallythosewithmorepaymentaccounts—weremorelikelyto
have spent more on cleaning up and defending against fraud than were other companies.
Cost to Manage/Defend/Cleanup from Attempted and/or Actual Payments Fraud in 2016(Percentage Distribution of Organizations that Experienced Attempted and/or Actual Payments Fraud)
Annual Annual Annual Revenue Annual Revenue Revenue Revenue At Least $1 Billion At Least $1 Billion Less Than At Least and Fewer Than and More Than All $1 Billion $1 Billion 26 Payment Accounts 100 Payment Accounts
No Cost 48% 59% 38% 43% 26%
Up to $24,999 41 37 46 49 39
$25,000-$49,999 4 3 4 1 9
$50,000-$99,999 2 1 3 2 4
$100,000-$249,999 4 – 6 3 22
$250,000-$499,999 1 – 2 1 –
$500,000-$999,999 – – – – –
$1,000,000-$1,999,999 – – – – –
Over $2,000,000 – – – – –
2017 AFP Payments Fraud and Control Survey
10 www.AFPonline.org ©2017 Association for Financial Professionals, Inc. All Rights Reserved
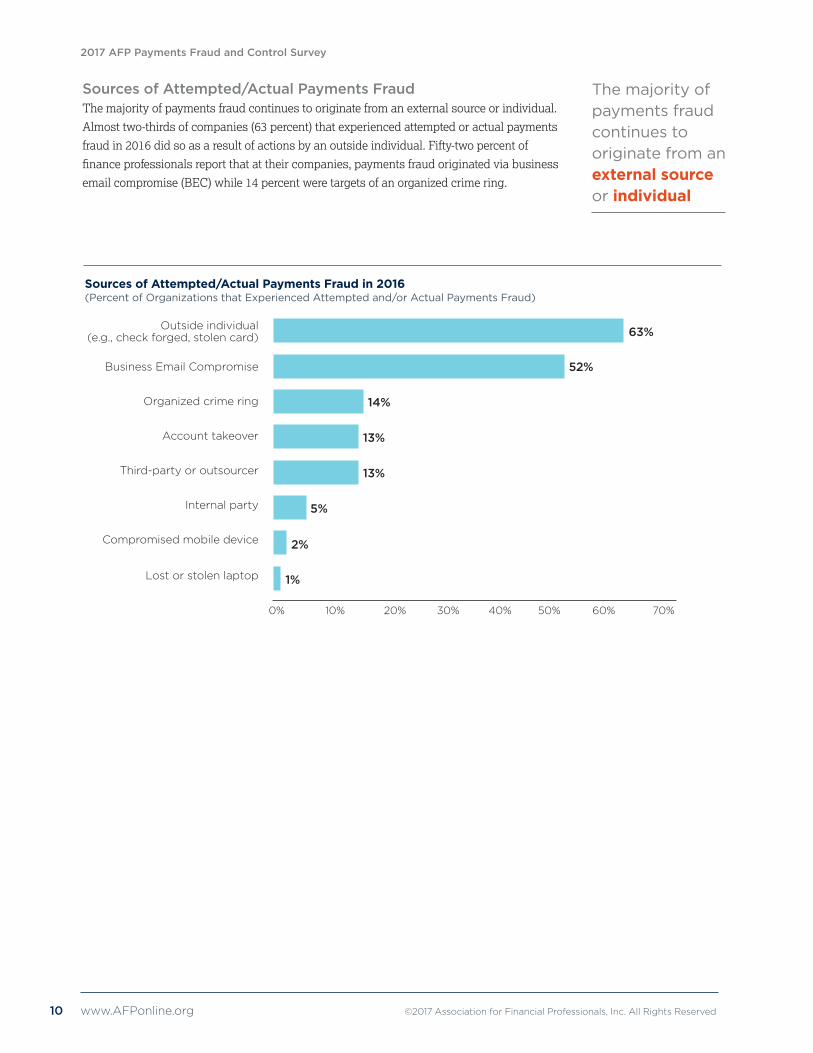
Sources of Attempted/Actual Payments Fraud The majority of payments fraud continues to originate from an external source or individual.
Almosttwo-thirdsofcompanies(63percent)thatexperiencedattemptedoractualpayments
fraud in 2016 did so as a result of actions by an outside individual. Fifty-two percent of
financeprofessionalsreportthatattheircompanies,paymentsfraudoriginatedviabusiness
email compromise (BEC) while 14 percent were targets of an organized crime ring.
Sources of Attempted/Actual Payments Fraud in 2016 (Percent of Organizations that Experienced Attempted and/or Actual Payments Fraud)
Outside individual (e.g., check forged, stolen card)
Business Email Compromise
Organized crime ring
Account takeover
Third-party or outsourcer
Internal party
Compromised mobile device
Lost or stolen laptop
0% 10% 20% 30% 40% 50% 60% 70%
2%
1%
5%
13%
13%
14%
52%
63%
The majority of payments fraud continues to originate from an external source or individual

©2017 Association for Financial Professionals, Inc. All Rights Reserved www.AFPonline.org 11
2017 AFP Payments Fraud and Control Survey
Business Email Compromise (BEC) The past few years have seen a sharp uptick in business email compromise (BEC) scams. A
2016 FBI alertdefinesBECas“asophisticatedscamtargetingbusinessesworkingwith
foreign suppliers and/or businesses that regularly perform wire transfer payments. The scam
is carried out by compromising legitimate business email accounts through social engineering
or computer intrusion techniques to conduct unauthorized transfers of funds.” While these
scamstargetwirepaymentsforthemostpart,theyalsotargetcheckstoasignificantextent.
With overall payments fraud at similarly elevated levels in both 2015 and 2016, it certainly
appearsthatthesescamsareeffective.
The FBI alert also indicates that BEC scams are increasing, evolving and targeting
businesses regardless of size or geographic location. The FBI has received reports of BEC
scams from organizations in all 50 states and 100 countries, and losses from such scams
have increased exponentially since January 2015. Reports indicate that fraudulent transfers
havebeensentto79countrieswiththemajoritygoingtobanksinChinaandHongKong.
Fully74percentoffinanceprofessionalsreportthattheirorganizationswerevictimsof
BEC in 2016. This is a 10-percentage point increase from 2015. BEC was more prevalent
among larger organizations with annual revenue of at least $1 billion and more than 100
payment accounts than similarly sized organizations with fewer than 26 payment accounts.
Percent of Organizations that Experienced Attempted and/or Actual Business Email Compromise in 2016
74% 76% 77%73%
88%90%
80%
70%
60%
50%
40%
30%
All Annual Annual Annual Annual Revenue Revenue Revenue Revenue Less Than at Least at Least at Least $1 Billion $1 Billion $1 Billion and $1 Billion and Fewer Than 26 More Than 100 Payment Accounts Payment Accounts
Nearly three-fourths of companies were victims of business email compromise in 2016

2017 AFP Payments Fraud and Control Survey
12 www.AFPonline.org ©2017 Association for Financial Professionals, Inc. All Rights Reserved
WhenBECscamsfirststartedoccurring,ittookmanyfinanceprofessionalsbysurprise.
What looked like a regular email from a CEO or CFO requesting the accounts payable
department to make a quick transfer for a merger or other important transaction appeared
authentic, and so the payment was made. Fraudsters were successfully using email, a
vehicle extensively used in business communications, to steal from unsuspecting targets.
It should be fairly simple to guard against BEC scams, and solid internal controls
are key to doing so. Every organization needs to have policies in place to prevent funds
transactionsbeinginitiatedbyanemail.Thefinanceteamandseniormanagementneed
to communicate with employees regarding BEC, explain what to look out for, and always
encouragestafftocheckbeforetakinganyactionregardingapayment,suchas
implementingdualauthentication—thatis,transactionsshouldnotbeauthorizedwithout
a second signature. Given the broad spectrum of BEC scams, it is also important to plan
for scenarios such as changes in payment information with external providers, etc. In
manycasesasimplecalltoatrustedphonenumberonfilewillensurethat
information is authentic.
Sixty percent of organizations that experienced actual payments fraud via BEC did so
via wire transfers. That result is a slight increase from the 56 percent in 2015. Although
nearly three quarters of organizations were subject to BEC, fortunately less than half
(47percent)incurredafinanciallossasaresult.
Payment Methods Impacted by Actual Loss as a Result of Business Email Compromise (BEC)(Percent of Organizations that Experienced Financial Loss Due to BEC)
Wire transfers Checks ACH credits Corporate/Commercial ACH debits credit and debit cards
60%
32%
16% 16%
6%
70%
60%
50%
40%
30%
20%
60% of companies that experienced payments fraud via business email compromise did so via wire transfers

©2017 Association for Financial Professionals, Inc. All Rights Reserved www.AFPonline.org 13
2017 AFP Payments Fraud and Control Survey
A vast majority of corporate practitioners reports that their organizations are being
proactive in preventing BEC, and have either implemented controls to guard against
being impacted from BEC (71 percent) or are in the process of determining the
controls that need to be in place to protect their organizations from BEC (10 percent).
Another 12 percent are considering implementing controls. Eight percent do not
believe there is a need. Over 90 percent of larger organizations with more than 100
payment accounts have controls in place to prevent being impacted by BEC.
Estimated Total Dollar Amount of the Potential and Actual Financial Loss Resulting from Business Email Compromise (BEC) in 2016(Percentage Distribution of Organizations that Experienced Payments Fraud via BEC)
Implemented New Controls to Prevent Business Email Compromise(Percentage Distribution of Organizations)
Annual Annual Annual Revenue Annual Revenue Revenue Revenue At Least $1 Billion At Least $1 Billion Less Than At Least and Fewer Than and More Than All $1 Billion $1 Billion 26 Payment Accounts 100 Payment Accounts
Yes, have implemented several new internal controls to prevent being impacted by BEC 71% 61% 79% 74% 92%
Yes, are in the process of determining the controls that should be in place to prevent BEC 10 14 6 8 4
Not yet, but are considering it 12 15 9 12 –
No, do not see the need 8 11 6 6 4
Annual Annual Annual Revenue Annual Revenue Revenue Revenue At Least $1 Billion At Least $1 Billion Less Than At Least and Fewer Than and More Than All $1 Billion $1 Billion 26 Payment Accounts 100 Payment Accounts
No Loss 53% 58% 47% 49% 30%
Up to $24,999 11 15 10 13 9
$25,000-$49,999 4 5 4 6 –
$50,000-$99,999 6 7 5 3 13
$100,000-$249,999 9 9 10 9 22
$250,000-$499,999 6 3 7 9 9
$500,000-$999,999 3 – 3 1 4
$1,000,000-$1,999,999 4 3 6 4 9
Over $2,000,000 5 1 8 6 4
81% of organizations have either implemented or are in the process of implementing controls to guard against business email compromise

2017 AFP Payments Fraud and Control Survey
14 www.AFPonline.org ©2017 Association for Financial Professionals, Inc. All Rights Reserved
Check Fraud Checks have been and continue to be the payment method most often exposed to fraud
activity.Fifty-ninepercentoforganizationsthatexperiencedcheckfraudin2016suffered
betweenoneandfiveincidents;15percentweresubjecttobetweensixand10incidentsand
16 percent were exposed to 21 or more instances. Larger organizations with annual revenue
of at least $1 billion were far more likely than other companies to have been victims
of check fraud. Thirty-one percent of survey respondents from this group report their
organizations experienced check fraud more than 15 times in 2016.
Number of Times Organization Experienced Attempted and/or Actual Check Fraud in 2016(Percentage Distribution of Organizations that Experienced At Least One Attempt of Check Fraud)
Annual Annual Annual Revenue Annual Revenue Revenue Revenue At Least $1 Billion At Least $1 Billion Less Than At Least and Fewer Than and More Than All $1 Billion $1 Billion 26 Payment Accounts 100 Payment Accounts
1-5 59% 72% 45% 49% 45%
6-10 15 12 18 17 10
11-15 5 3 7 5 14
16-20 5 5 6 8 7
21-more 16 8 25 21 24
Overtwo-thirds(68percent)offinanceprofessionalsreportthatthenumberofcheck
fraud attempts at their organizations was unchanged from that in 2015, while 20 percent
report an increase.
Change in Incidence of Check Fraud in 2016 Compared to 2015 (Percentage Distribution of Organizations that Experienced Attempted and/or Actual Payments Fraud via Checks)
Increased
About the same
Decreased
12%20%
68%

©2017 Association for Financial Professionals, Inc. All Rights Reserved www.AFPonline.org 15
2017 AFP Payments Fraud and Control Survey
Positive pay continues to be the method most often used by organizations to guard against
check fraud, used by 74 percent of organizations. Other methods include:
• Segregation of accounts (cited by 69 percent of respondents)
• Daily reconciliations and other internal processes (64 percent)
• Payee positive pay (41 percent).
Fraud Control Procedures Used to Guard against Check Fraud(Percent of Organizations that Experienced At Least One Attempt of Check Fraud)
Annual Annual Annual Revenue Annual Revenue Revenue Revenue At Least $1 Billion At Least $1 Billion Less Than At Least and Fewer Than and More Than All $1 Billion $1 Billion 26 Payment Accounts 100 Payment Accounts
Positive pay 74% 71% 82% 85% 100%
Segregation of accounts 69 57 86 84 50
Daily reconciliation and other internal processes 64 57 64 77 –
Payee positive pay 41 29 55 54 50
“Post no checks” restriction on depository accounts 38 21 55 77 –
Reverse positive pay 13 14 14 15 50
Non-bank fraud control services 10 – 14 15 –
Although 55 percent of organizations experienced check fraud in 2016, only 10 percent of
companiessufferedafinanciallossasaresult.Indeed,thevastmajoritydidnotexperiencea
financiallossasaconsequence.Lackofpositivepay(citedby23percentofrespondents)and
clericalerrors(18percent)weretwoprimaryreasonsforfinanciallossduetocheckfraud.
Organization Suffered Financial Loss as a Result of Check Fraud (Percentage Distribution of Organizations that Experienced At Least One Attempt of Check Fraud)
Yes10%
No90%
No, did not suffer financial loss
Yes, suffered financial loss
2017 AFP Payments Fraud and Control Survey
16 www.AFPonline.org ©2017 Association for Financial Professionals, Inc. All Rights Reserved
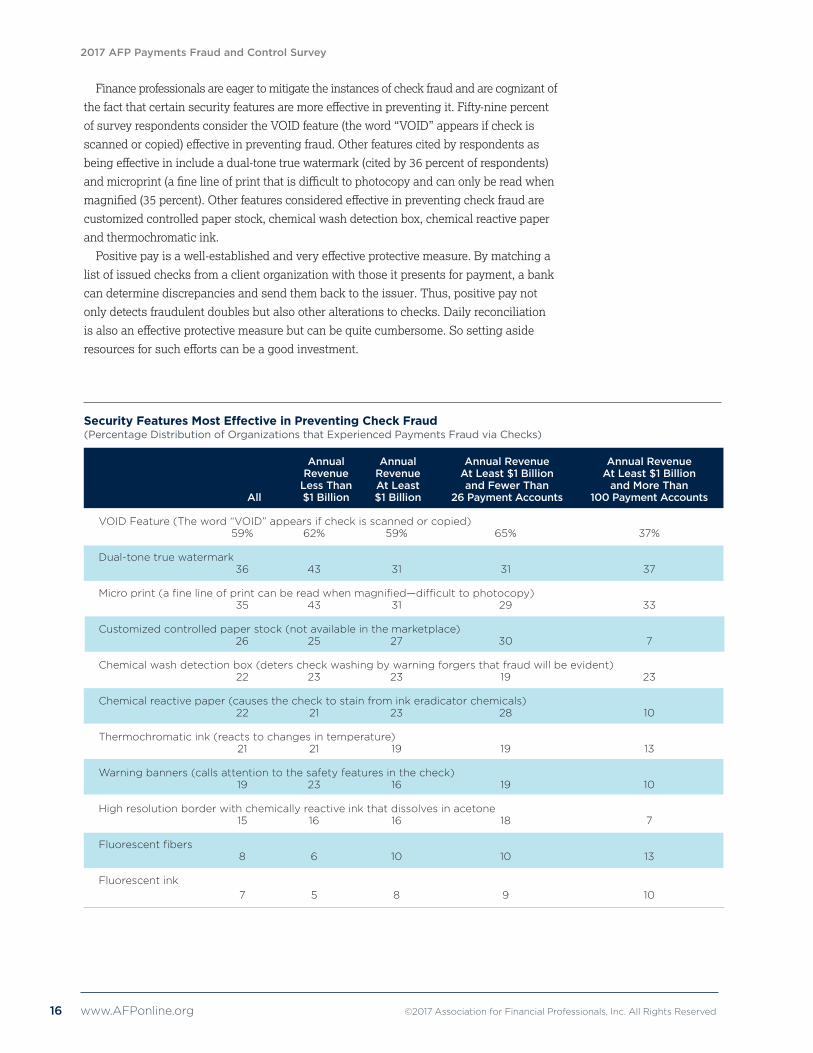
Finance professionals are eager to mitigate the instances of check fraud and are cognizant of
thefactthatcertainsecurityfeaturesaremoreeffectiveinpreventingit.Fifty-ninepercent
ofsurveyrespondentsconsidertheVOIDfeature(theword“VOID”appearsifcheckis
scannedorcopied)effectiveinpreventingfraud.Otherfeaturescitedbyrespondentsas
beingeffectiveinincludeadual-tonetruewatermark(citedby36percentofrespondents)
andmicroprint(afinelineofprintthatisdifficulttophotocopyandcanonlybereadwhen
magnified(35percent).Otherfeaturesconsideredeffectiveinpreventingcheckfraudare
customized controlled paper stock, chemical wash detection box, chemical reactive paper
and thermochromatic ink.
Positivepayisawell-establishedandveryeffectiveprotectivemeasure.Bymatchinga
list of issued checks from a client organization with those it presents for payment, a bank
can determine discrepancies and send them back to the issuer. Thus, positive pay not
only detects fraudulent doubles but also other alterations to checks. Daily reconciliation
isalsoaneffectiveprotectivemeasurebutcanbequitecumbersome.Sosettingaside
resourcesforsucheffortscanbeagoodinvestment.
Security Features Most Effective in Preventing Check Fraud(Percentage Distribution of Organizations that Experienced Payments Fraud via Checks)
Annual Annual Annual Revenue Annual Revenue Revenue Revenue At Least $1 Billion At Least $1 Billion Less Than At Least and Fewer Than and More Than All $1 Billion $1 Billion 26 Payment Accounts 100 Payment Accounts
VOID Feature (The word “VOID” appears if check is scanned or copied) 59% 62% 59% 65% 37%
Dual-tone true watermark 36 43 31 31 37
Micro print (a fine line of print can be read when magnified—difficult to photocopy) 35 43 31 29 33
Customized controlled paper stock (not available in the marketplace) 26 25 27 30 7
Chemical wash detection box (deters check washing by warning forgers that fraud will be evident) 22 23 23 19 23
Chemical reactive paper (causes the check to stain from ink eradicator chemicals) 22 21 23 28 10
Thermochromatic ink (reacts to changes in temperature) 21 21 19 19 13
Warning banners (calls attention to the safety features in the check) 19 23 16 19 10
High resolution border with chemically reactive ink that dissolves in acetone 15 16 16 18 7
Fluorescent fibers 8 6 10 10 13
Fluorescent ink 7 5 8 9 10

©2017 Association for Financial Professionals, Inc. All Rights Reserved www.AFPonline.org 17
2017 AFP Payments Fraud and Control Survey
ACH FraudACHtransactionshavesomeadvantagesovercheckpayments.Oneadvantageisthat
theyareconsideredmoresecurethanchecksandthereforerequiremoreofaneffortfor
criminalstobesuccessfulincommittingfraudviaACH.ACHtransactionsareoften
generatedthroughlargefilessentfromorganizationstotheirbanks.Thosearemuchmore
difficulttocompromisethanmerelyalteringcredentialsorfeaturesonpaperchecks.In
ordertocommitsuccessfulACHfraud,criminalsmayevenhavetopartnerwithindividuals
inside the targeted organization in order to bypass any security features in place.
Despitethis,theincidenceofACHdebitfraudincreasedinthepastyear.Atthesame
time,fraudviaACHcredithasremainedatafairlylowlevel.Anyincreaseinfraudmeans
that something is not working the way it should, or criminals have come up with new
scams that bypass current security.
In2016,30percentoforganizationsweresubjecttoACHdebitfraudand11percentto
ACHcreditfraud.Largerorganizationswithmorethan100paymentaccountsweresix
timesmorelikelytohaveexperiencedmorethan20attemptsofpaymentsfraudviaACH
than were similarly sized organizations with fewer payment accounts. Eighty-four percent
oforganizationswereexposedtobetweenoneandfiveACHfraudincidents.Onlyfiveper-
centoffinanceprofessionalsreporttheirorganizationsweresubjecttomorethan
20incidentsofACHfraud.
Number of Organizations that Experienced Attempted and/or Actual ACH Fraud in 2016(Percentage Distribution of Organizations that Experienced At Least One Attempt of ACH Fraud)
Annual Annual Annual Revenue Annual Revenue Revenue Revenue At Least $1 Billion At Least $1 Billion Less Than At Least and Fewer Than and More Than All $1 Billion $1 Billion 26 Payment Accounts 100 Payment Accounts
1-5 84% 90% 77% 85% 59%
6-10 6 4 7 3 15
11-15 3 1 6 5 4
16-20 2 1 3 3 4
21-more 5 4 7 3 19

2017 AFP Payments Fraud and Control Survey
18 www.AFPonline.org ©2017 Association for Financial Professionals, Inc. All Rights Reserved
EightypercentofcorporatepractitionersreportthatthenumberofinstancesofACHfraud
attempts at their organizations in 2016 was unchanged from that in 2015. Thirteen percent
reportariseinincidentsofACHfraudduringthesametimeframeandonlysevenpercent
report a decrease.
Onlyfivepercentoffinanceprofessionalsindicatetheirorganizationssufferedafinancial
lossasaresultofACHfraud.Thisshareincreasedto16percentforlargerorganizations
with more than 100 payment accounts.
TheprimaryreasonsforACHfraudinclude:
• ACH return not timely(citedby33percentofrespondents)
• Gaps in online security controls/criminal account takeover (29 percent)
• DidnotuseACHdebitblocksorACHcreditfilters (24 percent)
OrganizationsimplementvarioustacticstoreducetheimpactofACHfraud.Sixtypercent
ofcompaniesreconcileaccountsdailytoidentifyandreturnunauthorizedACHdebits,while
50percentblockallACHdebitsexceptonasingleaccountset-upwithACHdebitfilters/
ACHpositivepay.Thirty-fivepercentcreateseparateaccountsforelectronicdebitsinitiated
byathirdpartyand30percentblockACHdebitsonallaccounts.
Fraud Control Procedures Used to Prevent ACH Fraud(Percent of Organizations that Experienced At Least One Attempt of ACH Fraud)
80%
70%
60%
50%
40%
30%
20%
10%
0%
40%
30%25%
33%
10%
25%
7%
Reconcile accounts Block all ACH debits Create separate Block ACH Debit block on all daily to identify and except on a single account for debits on consumer items with return unauthorized set up with ACH electronic debits all accounts debit filter ACH debits debit filter/ACH initiated by the on commercial positive pay third party ACH debits (e.g., taxing authority)
25%
35%
60%
25%
50%53%
75%
60%
All
Annual Revenue Less Than $1 Billion
Annual Revenue At Least $1 Billion

©2017 Association for Financial Professionals, Inc. All Rights Reserved www.AFPonline.org 19
2017 AFP Payments Fraud and Control Survey
Corporate/Commercial Card Payments The use of commercial cards has undergone some turbulence in the last couple of years. In
2013,beforethehighlypublicizeddatabreachesatmajorretailers,carduseforcorporate
transactionshadincreasedsignificantly.Thereareanumberofreasonswhy.Cardscan
be a very convenient payment method to use; an organization can simply issue commercial
cards to employees, and the use of cards can be restricted to pay only for certain things
orhavelimitedspendingamounts.However,aftertheretailbreaches,commercialcard
use declined abruptly, as has been reported in previous AFP Payments Fraud and Control
Surveys. Since then, the use of certain cards, such as purchasing cards, has again started
to increase, but not to the extent seen prior to the breaches. Despite the convenience of
using cards, there is still some concern regarding loss of card credentials but to a much
lesserextentin2016thanin2013.Astimepasses,thememoryoftheimpactfromlarge
computer data breaches fades away.
The most widely used corporate/commercial cards for B2B transactions in 2016 continued
tobepurchasingcards,usedby73percentoforganizations(slightlylessthanthe75percent
reported in 2015), followed by Travel & Entertainment (T&E) cards (46 percent, similar to 45
percent in 2015). Thirty-one percent of companies used ghost and virtual cards (29 percent in
2015). Larger organizations with more than 100 payment accounts were more likely to have
used ghost or virtual cards and T&E cards than were other organizations.
Percentage of Corporate/Commercial Cards that Organizations Use for B2B Payments(Percent of Organizations that Experienced Attempted and/or Actual Fraud via Corporate/Commercial Cards)
Annual Annual Annual Revenue Annual Revenue Revenue Revenue At Least $1 Billion At Least $1 Billion Less Than At Least and Fewer Than and More Than All $1 Billion $1 Billion 26 Payment Accounts 100 Payment Accounts
Purchasing cards 73% 65% 82% 82% 82%
T&E cards 46 44 51 48 61
Ghost or virtual cards (valid card account without a physical card issued) 31 26 39 37 43
Fleet cards 22 15 29 32 32
“One card” combining several uses above 19 23 16 15 11
Airline travel cards (UATP) 7 5 8 6 11
Purchasing cards are the most widely
used corporate/
commercial cards
for B2B transactions

2017 AFP Payments Fraud and Control Survey
20 www.AFPonline.org ©2017 Association for Financial Professionals, Inc. All Rights Reserved
Twenty-seven percent of organizations that experienced payments fraud in 2016 were
impactedbyfraudassociatedwiththeirowncorporatecommercialcards,asignificant
decline from the 42 percent reported for 2015. Corporate/commercial cards were the third
most targeted payment method by fraudsters in 2016.
Corporate/commercialcardfraudcanresultinfinanciallossnotonlytoorganizationsbut
also to third parties such as an organization’s bank or merchant partners. In 2016, over half
oforganizationsdidnotsufferafinanciallossfromcorporate/commercialcardfraud—an
increasefromthe38percentin2015.Asmallershareoforganizations’merchantsalso
experiencedanincreaseincorporate/commercialcardfraud—from21percentin2015to15
percentin2016.Elevenpercentoffinanceprofessionalsreporttheirorganizationssuffered
financiallossfromsuchfraud.
Cards are the payment method that has experienced the most volatile trend in fraud. As
mentioned above, the incidence of fraud via corporate/commercial card appears to correlate
with data breaches in which large numbers of card credentials are stolen. In the aftermath
ofsuchdatabreaches,cardfraudseemstoincrease.However,therecanalsobeatimelag
between when card credentials are stolen and when fraudulent cards/credentials are actually
used.Onereasonfortherecentdeclineincardfraud—from39percentin2015to32percent
in2016—maybethatcardissuersandbankshavebecomemoreproficientinprotectingthe
data. Another reason may be quicker action of canceling cards when data breaches occur.
Parties That Suffered Financial Loss from Fraud on Corporate/Commercial Cards(Percent of Organizations that Suffered At Least One Attempt of Corporate/Commercial Card Fraud)
No organization Card Merchant My organization Card processor Other suffered issuing bank financial loss
51%
25%
15%11%
9%6%
60%
50%
40%
30%
20%
10%
0%
©2017 Association for Financial Professionals, Inc. All Rights Reserved www.AFPonline.org 21
2017 AFP Payments Fraud and Control Survey
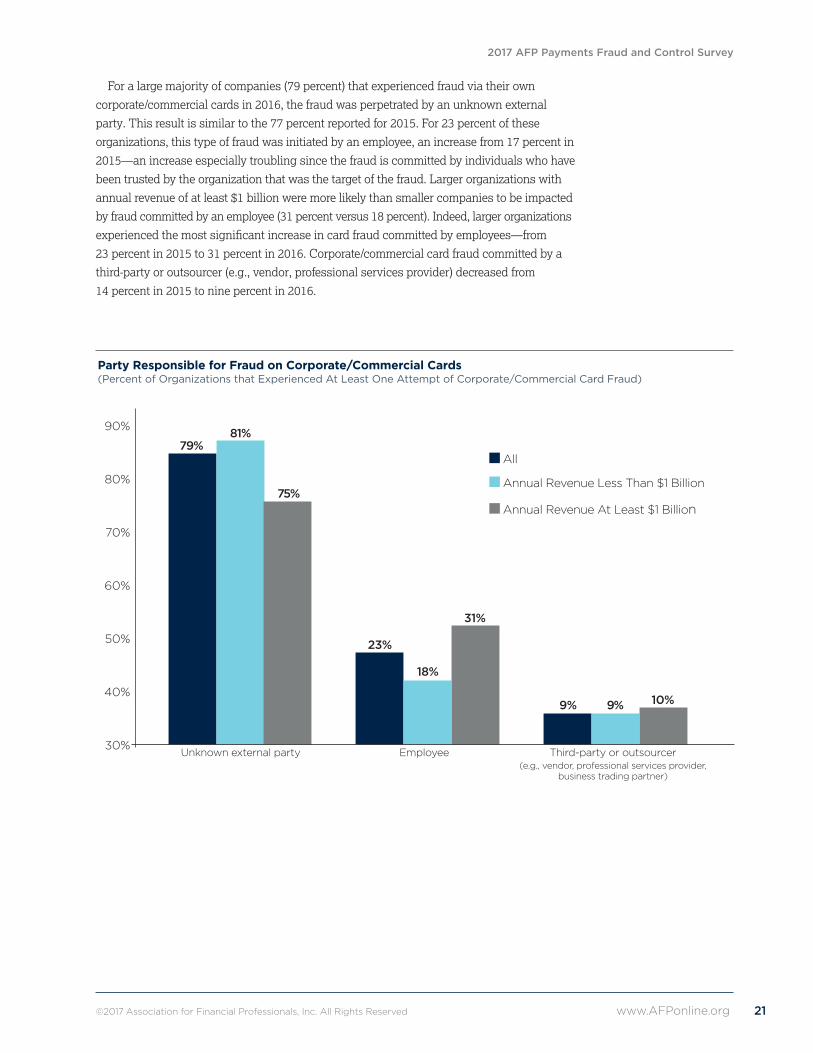
For a large majority of companies (79 percent) that experienced fraud via their own
corporate/commercial cards in 2016, the fraud was perpetrated by an unknown external
party.Thisresultissimilartothe77percentreportedfor2015.For23percentofthese
organizations, this type of fraud was initiated by an employee, an increase from 17 percent in
2015—anincreaseespeciallytroublingsincethefraudiscommittedbyindividualswhohave
been trusted by the organization that was the target of the fraud. Larger organizations with
annual revenue of at least $1 billion were more likely than smaller companies to be impacted
byfraudcommittedbyanemployee(31percentversus18percent).Indeed,largerorganizations
experiencedthemostsignificantincreaseincardfraudcommittedbyemployees—from
23percentin2015to31percentin2016.Corporate/commercialcardfraudcommittedbya
third-party or outsourcer (e.g., vendor, professional services provider) decreased from
14 percent in 2015 to nine percent in 2016.
Party Responsible for Fraud on Corporate/Commercial Cards(Percent of Organizations that Experienced At Least One Attempt of Corporate/Commercial Card Fraud)
90%
80%
70%
60%
50%
40%
30%
31%
9% 9% 10%
18%
23%
75%
81%79%
All
Annual Revenue Less Than $1 Billion
Annual Revenue At Least $1 Billion
Unknown external party Employee Third-party or outsourcer (e.g., vendor, professional services provider, business trading partner)

2017 AFP Payments Fraud and Control Survey
22 www.AFPonline.org ©2017 Association for Financial Professionals, Inc. All Rights Reserved
Halfofthesurveyrespondentswhosecompanieswereexposedtocorporate/creditcard
fraudreportthatthefinanciallossexperiencedbytheirorganizationsasaconsequenceof
the fraud was due to fraudulent credit card charges made by a third party. Other plausible
causesforlossareemployeetheft(39percent)andlackofinternalcontrols(25percent).A
greatershareoffinanceprofessionalsfromlargeorganizationswithmorethan100payment
accounts than those from similar-sized companies with fewer payment accounts indicate that
fraudulentcreditcardchargesbyathird-partycompanyisareasonforthefinanciallossthose
companies experienced (67 percent versus 50 percent).
Reasons for Financial Loss Associated with Corporate/Commercial Cards(Percent of Organizations that Experienced At Least One Attempt of Corporate/Commercial Card Fraud)
Annual Annual Annual Revenue Annual Revenue Revenue Revenue At Least $1 Billion At Least $1 Billion Less Than At Least and Fewer Than and More Than All $1 Billion $1 Billion 26 Payment Accounts 100 Payment Accounts
Fraudulent credit card charges made by a third party 50% 44% 52% 50% 67%
Employee theft 39 44 39 50 17
Lack of internal controls 25 33 17 17 17
No segregation of duties 5 6 4 – –
©2017 Association for Financial Professionals, Inc. All Rights Reserved www.AFPonline.org 23
2017 AFP Payments Fraud and Control Survey
Mobile Payments Mobile devices have been available for B2B transactions for a number of years. It is, however,
importanttodefinewhatmobilitymeansforcorporatetransactions.Ratherthanusing
mobile wallets to conduct payments, mobility for corporations is more about using online
banking functionality and authorization of payments, etc., from a mobile device. If key
personnelareoutoftheoffice,mobiledevicescanbeveryeffectiveinensuringminimal
interruption to payment schedules and processes.
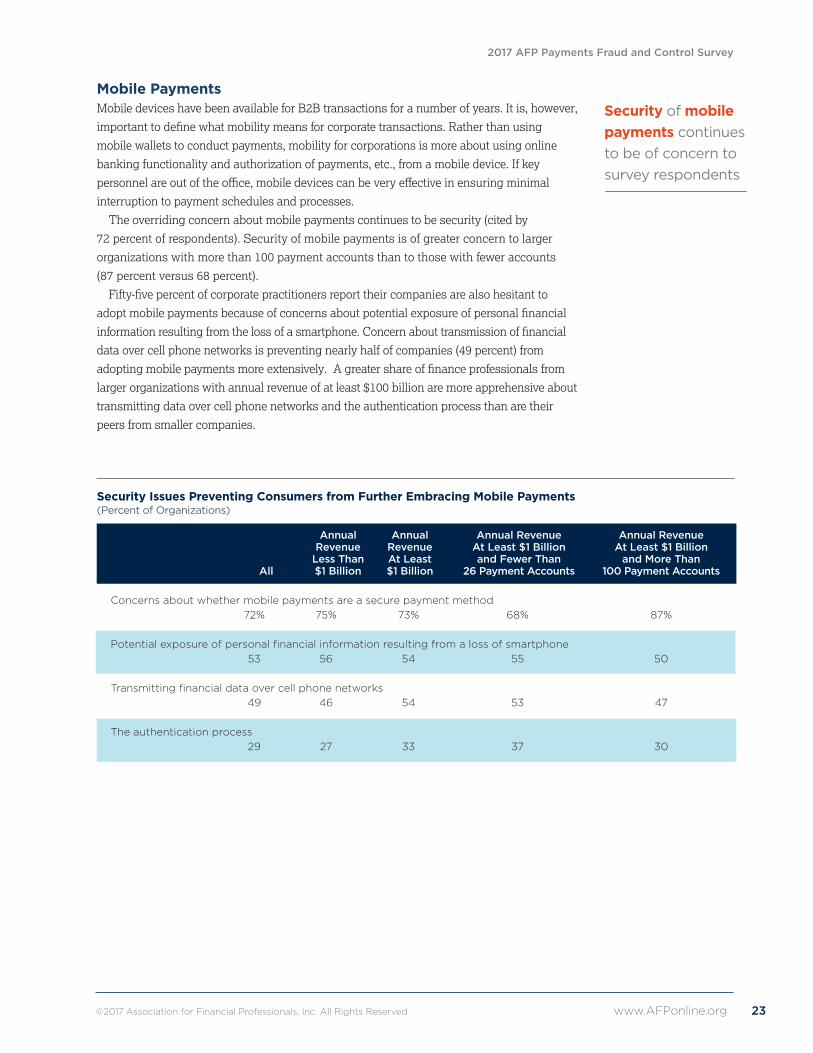
The overriding concern about mobile payments continues to be security (cited by
72 percent of respondents). Security of mobile payments is of greater concern to larger
organizations with more than 100 payment accounts than to those with fewer accounts
(87 percent versus 68 percent).
Fifty-fivepercentofcorporatepractitionersreporttheircompaniesarealsohesitantto
adoptmobilepaymentsbecauseofconcernsaboutpotentialexposureofpersonalfinancial
informationresultingfromthelossofasmartphone.Concernabouttransmissionoffinancial
data over cell phone networks is preventing nearly half of companies (49 percent) from
adoptingmobilepaymentsmoreextensively.Agreatershareoffinanceprofessionalsfrom
larger organizations with annual revenue of at least $100 billion are more apprehensive about
transmitting data over cell phone networks and the authentication process than are their
peers from smaller companies.
Security Issues Preventing Consumers from Further Embracing Mobile Payments(Percent of Organizations)
Annual Annual Annual Revenue Annual Revenue Revenue Revenue At Least $1 Billion At Least $1 Billion Less Than At Least and Fewer Than and More Than All $1 Billion $1 Billion 26 Payment Accounts 100 Payment Accounts
Concerns about whether mobile payments are a secure payment method 72% 75% 73% 68% 87%
Potential exposure of personal financial information resulting from a loss of smartphone 53 56 54 55 50
Transmitting financial data over cell phone networks 49 46 54 53 47
The authentication process 29 27 33 37 30
Security of mobile payments continues to be of concern to survey respondents

2017 AFP Payments Fraud and Control Survey
24 www.AFPonline.org ©2017 Association for Financial Professionals, Inc. All Rights Reserved
Credit/Debit Card PaymentsSeventy percent of corporate practitioners report that their companies accept debit/credit card
payments from their vendors and customers. A greater share of larger organizations accepts
debit/credit card payments than do smaller organizations (75 percent versus 68 percent).
AdoptionofEMVtechnology,whichauthenticateschipcardtransactions,hasbeen
slowintheU.S.TheEMVliabilityshiftinOctober2015wasnotamandatethatrequired
businessestoacceptEMVcards,butratherashiftofliabilityfromthecardissuersto
merchantswithoutthecapabilitytoacceptthenewEMV-enabledcards.Businessescould
opt out of investing in new terminals, as has been the cases for many businesses in high-
volume, low-value businesses, such as fast-food restaurants. The low level of fraud among
thesebusinessessimplydidnotjustifyinvestinginnewEMV-enabledterminals.
Also,adoptionofEMVhasnotbeenpainless.Therehasbeenashortageofterminals
capableofaccommodatingthenewtechnologyandthishascauseddelays.Certificationof
these terminals has also seen delays. The result has been slow implementation.
AstheuseofEMVchipcardsbecomesmoreprevalent,fraudstersarelikelytoshifttheir
focus to less secure payment methods. Ninety-three percent of survey respondents believe
this will be the case if perpetrators are less successful in hacking credit/debit cards. This is
slightlyhigherthanthe90percentoffinanceprofessionalswhoheldthisviewin2015but
23percentagepointshigherthanin2014.Sixty-twopercentoffinanceprofessionals
anticipate that the instances of fraud will increase for those transactions where cards are
not present, e.g., online transactions. This is an increase from 55 percent reported for 2015.
Asmallershareoffinanceprofessionalsanticipatefraudactivityinchecksandwire
transferswillincreaseasaresultofEMVcardsbeingusedmoreextensively(15percent
and eight percent, respectively).
Forms of Payments Subject to Greater Fraud Activity if EMV Cards are Successful in Reducing Fraud(Percentage Distribution of Respondents)
Annual Annual Annual Revenue Annual Revenue Revenue Revenue At Least $1 Billion At Least $1 Billion Less Than At Least and Fewer Than and More Than All $1 Billion $1 Billion 26 Payment Accounts 100 Payment Accounts
Card-not-present transactions 62% 62% 65% 56% 60%
Checks 15 16 13 9 16
Wire transfers 8 8 9 9 12
ACH debit 5 5 5 7 4
ACH credit 1 1 2 2 –
Fraud won’t migrate to other payment forms 7 9 6 4 8

©2017 Association for Financial Professionals, Inc. All Rights Reserved www.AFPonline.org 25
2017 AFP Payments Fraud and Control Survey
Avastmajority(91percent)offinanceprofessionalsbelievesthatEMVchipcardswill
be successful in mitigating point-of-sale (POS) fraud. Sixty-nine percent consider
Chip-and-PINaneffectivemethodinreducingPOSfraud,asafour-digitPINwouldadd
anadditionallayerofsecurityforcards.Othermethodsconsideredeffectiveare
Chip-and-Choice, in which a merchant can choose the option of signature or PIN (cited
by 10 percent of respondents), and chip and signature (four percent). Finance professionals
from larger organizations with more than 100 payment accounts are less likely than those
withfewerpaymentaccountstoconsiderChip-and-PINtobeeffectiveinpreventing
POS fraud.
TheEMVtechnologydoeshelppreventcounterfeitingofcards.Butitcomesasno
surprisethatastheEMVcardtechnologyisbeingimplemented,fraudhasmigrated
elsewhere, especially to card-not-present (CNP) transactions.
Authentication Method for EMV Cards Most Effective in Preventing Fraud and Providing a Better Customer Experience(Percentage Distribution of Respondents)
Annual Annual Annual Revenue Annual Revenue Revenue Revenue At Least $1 Billion At Least $1 Billion Less Than At Least and Fewer Than and More Than All $1 Billion $1 Billion 26 Payment Accounts 100 Payment Accounts
Chip-and-PIN 69% 68% 70% 76% 52%
Chip-and-Choice (merchant can chose PIN or Signature) 10 11 7 2 20
EMV is effective in reducing POS card fraud regardless of authentication method used 9 8 10 9 8
Don’t believe EMV is effective in reducing POS card fraud (i.e., no authentication method will be effective in reducing POS card fraud) 9 9 9 9 12
Chip-and-Signature 4 4 4 3 8
91% of financeprofessionals believe that EMV chip cards will be successful in mitigating point-of-sale (POS) fraud

2017 AFP Payments Fraud and Control Survey
26 www.AFPonline.org ©2017 Association for Financial Professionals, Inc. All Rights Reserved
Securing CredentialsCyberattacks, data phishing and data breaches have become an almost daily occurrence. Malicious
emails with virus-infested links are rampant. Even though these emails are often easy to detect, the
sheer volume of such emails suggests that if a fraction of them are opened they could provide a door
for criminals to gather valuable information and potentially compromise vital systems.
Organizations are well aware that a fraud attack and data breach can have far-reaching conse-
quences for both their bottom line and reputation. They are taking serious steps to alleviate any
fraud attacks and minimize the impact if they are targeted. Nearly three-fourths are performing
daily reconciliations to protect themselves against attacks that would compromise security.
Other strategies being implemented by organizations are:
• Adopt a stronger form of authentication or added layers of security for access
to bank services (cited by 46 percent of survey respondents)
• Upgrade the authentication procedure/devices to access their company network
(37percent)
• Ensure disaster recovery plans include the ability to continue with strong controls
(37percent)
• Restricting network access for payments to only company-issued laptops (27 percent)
As mentioned earlier, it is important to realize that it is almost impossible to protect against
allfraud.Givensufficienttimeandresources,criminalscanhackintoalmostanysystem.What
organizations candoistomakeitmoredifficultforcriminalstogainaccess.Ifcriminalsaremet
with resistance they will most likely move on to an easier target. Using several layers of security
isgenerallyagoodwaytosafeguardanorganization’sinternalsystems.Particulareffortshould
beplacedonpaymentsystems.Onewayisrestrictingnetworkaccessforpaymentstospecific
company-issued computers that only are used for payment transactions.
Actions Taken to Defend Against Attacks that Would Compromise Security (Percent of Organizations that Experienced Attempted and/or Actual Payments Fraud)
Perform daily reconciliations
Adopt a stronger form of authentication or added layers of security for access
to bank services
Ensure disaster recovery plans include the ability to continue with strong controls
Upgrade the authentication procedure/devices used to access company network
Restrict network access for payments to only company-issued laptop
Restrict company network access for payments via mobile devices (laptop,
tablets, phones) to emergency situations only
Dedicate a PC for payment origination (with no links to email/web browsing/social networks)
Replace proprietary bank connections with secure access through the SWIFT network
Other
0% 10% 20% 30% 40% 50% 60% 70% 80%
12%
8%
15%
27%
37%
37%
46%
74%
5%

©2017 Association for Financial Professionals, Inc. All Rights Reserved www.AFPonline.org 27
2017 AFP Payments Fraud and Control Survey
Conclusion Results from the 2017 AFP Payments Fraud and Control Survey suggest that the spike in payments
fraudobservedin2015wasnotananomaly.In2016,AFPreported73percentoforganizationsin
2015hadbeenexposedtoattempted/actualpaymentsfraud—asignificant11-percentage-point
increase from 2014. This year’s survey results are very comparable, as 74 percent of survey
participants indicate their organizations were exposed to either attempted or actual fraud in 2016.
Althoughthehighincidenceoffrauddoesnotnecessarilytranslateintosignificantimpacts
on companies’ bottom lines, it can negatively impact an organization’s reputation and expose
confidentialbusinessandpersonnelinformation,puttingcompanies,theiremployeesandtheir
customersatsignificantrisk.
Businessleadersareawarethatfraudstersareactivelylookingtoinfiltrateorganizations’
paymentsystems,andconsequentlytheyaremakingseriouseffortstosafeguardagainstsuch
attacks in order to prevent and minimize any possible damage any breaches may cause. Our
research shows business leaders are cognizant of what might be making their companies more
vulnerable,andthoseleadersareseekingwaystoinstituteeffectivecontrols.Unfortunately,
perpetrators of payments fraud are usually a step ahead and are increasingly successful in
circumventing any checks and controls organizations have in place.
Fraudsters are relentless. Even if they do face challenges when attempting to hack into payment
systems, they are becoming more resourceful and shifting their focus to more vulnerable methods.
Businessemailcompromise(BEC)isanexampleofa“newer”typeoffraudbeingconducted
more extensively. Unsuspecting employees receive emails from fraudsters who pose as an
organization’sseniorexecutives,requestingstafftowirefundsandsharepersonalandconfidential
information. Many have fallen for the hoax and exposed themselves and their companies to fraud.
Our survey results indicate a continued uptick in BEC with nearly three quarters of survey
participants reporting their organizations had experienced fraud via this avenue in 2016.
Executive teams at organizations will need to increasingly focus on protecting their businesses
from fraud. Often these attacks originate in other countries, making it even more challenging to
capture those committing fraud. Safeguarding payment systems, investing in secure controls,
andconstantlystrivingtostay“onestepahead”offraudsterswillbeevenmoreessentialfor
businesses going forward.
Key highlights revealed in the 2017 AFP Payments Fraud and Control Survey: • Seventy-four percentoffinanceprofessionalsreportthattheircompanieswere victims of
payments fraud in 2016. This is the highest percentage on record.
• Checks continue to be the payment method most frequently targeted by those committing or
attempting to commit fraud. Seventy-five percent of organizations that were victims of fraud
attempts/attacks in 2016 experienced check fraud.
• Almost two-thirds of companies (63 percent) that experienced attempted or actual
payments fraud in 2016 did so as a result of actions by an outside individual.
• Seventy-four percentoffinanceprofessionalsreportthattheirorganizationswere victims
of business email compromise (BEC) in 2016. This is a 10-percentage-point increase
from 2015.
• Over 70 percent of corporate practitioners report that their organizations are being proactive
and have implemented controls to prevent any impact from BEC.
• Seventy-two percent of respondents have concerns about the extent of security of
mobile payments.

2017 AFP Payments Fraud and Control Survey
28 www.AFPonline.org ©2017 Association for Financial Professionals, Inc. All Rights Reserved
About the SurveyIn January 2017, the Research Department of the Association for Financial Professionals®
(AFP) surveyed corporate practitioner members and prospects with the following job titles:
cashmanager,analystanddirector.Thesurveyyielded311responsesfrommembersandan
additional236responsesfromprospectsforatotalof547responses.
AFP thanks J.P. Morgan for underwriting the 2017 AFP Payments Fraud and Control Survey.
Boththequestionnairedesignandthefinalreport,alongwithitscontentandconclusions,
are the sole responsibilities of the AFP Research Department. The following tables provide a
profileofthesurveyrespondents,includingpaymenttypesusedandaccepted.
Types of Organization’s Payment Transactions(Percentage Distribution of Organization’s Payment Transactions)
When Making When Receiving Payments Payments
Primarily businesses 72% 49%
Split between consumers and businesses 25 30
Primarily consumers 3 21
Number of Payment Accounts Maintained(Percentage Distribution of Organizations that Experienced Payments Fraud)
Annual Annual Annual Revenue Annual Revenue Revenue Revenue At Least $1 Billion At Least $1 Billion Less Than At Least and Fewer Than and More Than All $1 Billion $1 Billion 26 Payment Accounts 100 Payment Accounts
Fewer than 5 27% 37% 19% 33% —
5-9 18 25 13 23 —
10-25 20 15 25 44 —
26-50 11 7 14 — —
51-100 9 7 13 — —
More than 100 15 10 15 — 100%
Industry Classification(Percentage Distribution of Organizations)
Banking/Financial services 5%
Business services/Consulting 6
Construction 2
Energy (including utilities) 9
Government 7
Health services 9
Hospitality/Travel 2
Insurance 6
Manufacturing 20
Non-profit (including education) 8
Real estate 6
Retail (including wholesale/distribution) 9
Software/Technology 5
Telecommunications/Media 2
Transportation 3

©2017 Association for Financial Professionals, Inc. All Rights Reserved www.AFPonline.org 29
2017 AFP Payments Fraud and Control Survey
Annual Revenues (USD)(Percentage Distribution of Organizations)
Ownership Type(Percentage Distribution of Organizations)
Annual Annual Annual Revenue Annual Revenue Revenue Revenue At Least $1 Billion At Least $1 Billion Less Than At Least and Fewer Than and More Than All $1 Billion $1 Billion 26 Payment Accounts 100 Payment Accounts
Privately held 41% 53% 28% 30% 19%
Publicly owned 36 21 51 43 74
Non-profit (not-for-profit) 13 14 11 15 3
Government (or government-owned entity) 11 12 10 13 3
Annual Annual Annual Revenue Annual Revenue Revenue Revenue At Least $1 Billion At Least $1 Billion Less Than At Least and Fewer Than and More Than All $1 Billion $1 Billion 26 Payment Accounts 100 Payment Accounts
Under $50 million 8% 16% — — —
$50-99.9 million 3 5 — — —
$100-249.9 million 10 21 — — —
$250-499.9 million 9 18 — — —
$500-999.9 million 20 40 — — —
$1-4.9 billion 30 — 58% 69% 29%
$5-9.9 billion 10 — 19 17 13
$10-20 billion 7 — 13 9 26
Over $20 billion 6 — 11 6 32

2017 AFP Payments Fraud and Control Survey
30 www.AFPonline.org ©2017 Association for Financial Professionals, Inc. All Rights Reserved
Payment Method Subject to Attempted and/or Actual Payments Fraud in 2016(Percent of Organizations)
Appendix
Annual Annual Annual Revenue Annual Revenue Revenue Revenue At Least $1 Billion At Least $1 Billion Less Than At Least and Fewer Than and More Than All $1 Billion $1 Billion 26 Payment Accounts 100 Payment Accounts All (2015)
Checks 55% 44% 66% 65% 65% 52%
Wire transfers 34 35 40 35 48 27
Corporate/commercial credit cards (e.g., purchasing, T&E, fleet) 23 27 24 24 29 29
ACH debits 22 20 25 20 35 18
ACH credits 8 4 10 8 16 8
Organization was not a victim 26 29 19 18 16 27
Payment Method Subject to Attempted and/or Actual Payments Fraud in 2016(Percent of Organizations that Experienced Attempted and/or Actual Payments Fraud)
Annual Annual Revenue Revenue Less Than At Least All $1 Billion $1 Billion
Checks 75% 61% 81%
Wire transfers 46 49 49
Corporate/commercial credit cards (e.g., purchasing, T&E, fleet) 32 38 29
ACH debits 30 52 31
ACH credits 11 20 12

©2017 Association for Financial Professionals, Inc. All Rights Reserved www.AFPonline.org 31
2017 AFP Payments Fraud and Control Survey
Change in Incidence of Payments Fraud in 2016 Compared to 2015(Percentage Distribution of Organizations that Experienced Attempted and/or Actual Payments Fraud)
Annual Annual Annual Revenue Annual Revenue Revenue Revenue At Least $1 Billion At Least $1 Billion Less Than At Least and Fewer Than and More Than All $1 Billion $1 Billion 26 Payment Accounts 100 Payment Accounts
More 36% 35% 42% 43% 42%
About the same 55 57 49 49 42
Less 9 9 9 9 15
Sources of Attempted/Actual Payments Fraud in 2016(Percent of Organizations that Experienced Attempted and/or Actual Payments Fraud)
Annual Annual Annual Revenue Annual Revenue Revenue Revenue At Least $1 Billion At Least $1 Billion Less Than At Least and Fewer Than and More Than All $1 Billion $1 Billion 26 Payment Accounts 100 Payment Accounts
Outside individual (e.g., check forged, stolen card) 63% 60% 66% 69% 58%
Business Email Compromise 52 55 51 51 42
Organized crime ring 14 12 18 19 15
Third-party or outsourcer 13 8 18 13 27
Account takeover (e.g., hacked system, malicious code—spyware or malware from social network) 13 13 13 12 15
Internal party 5 1 8 7 15
Compromised mobile device 2 1 1 – 4
Lost or stolen laptop 1 1 1 – 4
Other 6 7 5 3 4

2017 AFP Payments Fraud and Control Survey
32 www.AFPonline.org ©2017 Association for Financial Professionals, Inc. All Rights Reserved
Payment Methods Impacted by Actual Loss as a Result of Business Email Compromise (Percent of Organizations that Experienced a Financial Loss Due to Business Email Compromise)
Annual Annual Annual Revenue Annual Revenue Revenue Revenue At Least $1 Billion At Least $1 Billion Less Than At Least and Fewer Than and More Than All $1 Billion $1 Billion 26 Payment Accounts 100 Payment Accounts
Wire transfers 60% 61% 64% 59% 60%
Checks 32 22 33 35 30
ACH Credits 16 11 14 12 20
Corporate/Commercial credit and debit cards 16 22 14 12 20
ACH Debits 6 6 8 6 20
Percent of Organizations that Experienced Attempted and/or Actual Business Email Compromise (BEC) Fraud in 2016(Percentage Distribution of Organizations that Experienced Attempted and/or Actual Payments Fraud)
Annual Annual Annual Revenue Annual Revenue Revenue Revenue At Least $1 Billion At Least $1 Billion Less Than At Least and Fewer Than and More Than All $1 Billion $1 Billion 26 Payment Accounts 100 Payment Accounts
Yes 74% 76% 77% 73% 88%
No 26 24 23 27 12
Change in incidence of Check Fraud in 2016 Compared to 2015(Percentage Distribution of Organizations Subject to Attempted and/or Actual Payments Fraud via Checks)
Annual Annual Annual Revenue Annual Revenue Revenue Revenue At Least $1 Billion At Least $1 Billion Less Than At Least and Fewer Than and More Than All $1 Billion $1 Billion 26 Payment Accounts 100 Payment Accounts
Increased 20% 19% 23% 19% 27%
About the same 68 67 67 74 63
Decreased 12 14 11 7 10
Organization Suffered Financial Loss as a Result of Check Fraud(Percentage Distribution of Organizations that Experienced At Least One Attempt of Check Fraud)
Annual Annual Annual Revenue Annual Revenue Revenue Revenue At Least $1 Billion At Least $1 Billion Less Than At Least and Fewer Than and More Than All $1 Billion $1 Billion 26 Payment Accounts 100 Payment Accounts
Yes 10% 8% 12% 12% 6%
No 90 92 88 88 94

©2017 Association for Financial Professionals, Inc. All Rights Reserved www.AFPonline.org 33
2017 AFP Payments Fraud and Control Survey
Reasons for Financial Loss Due to Check Fraud(Percent of Organizations that Experienced At Least One Attempt of Check Fraud)
Annual Annual Annual Revenue Annual Revenue Revenue Revenue At Least $1 Billion At Least $1 Billion Less Than At Least and Fewer Than and More Than All $1 Billion $1 Billion 26 Payment Accounts 100 Payment Accounts
No positive pay 23% 31% 13% 14% –
Clerical errors 18 8 26 21 100%
Internal fraud (e.g., employee responsible) 15 15 13 7 –
Account reconciliation not timely 15 23 9 7 –
Stolen check stock 15 23 13 14 –
Gaps in online security controls/criminal account takeover 13 8 17 14 50
Other 33 23 39 43 –
Change in Incidence of ACH Fraud in 2016 Compared to 2015(Percentage Distribution of Organizations that Experienced At Least One Attempt of ACH Fraud)
Annual Annual Annual Revenue Annual Revenue Revenue Revenue At Least $1 Billion At Least $1 Billion Less Than At Least and Fewer Than and More Than All $1 Billion $1 Billion 26 Payment Accounts 100 Payment Accounts
Increase 13% 7% 21% 20% 14%
About the same 80 85 72 73 79
Decreased 7 7 7 7 7
Suffered Financial Loss as a Result of ACH Fraud(Percentage Distribution of Organizations that Experienced At Least One Attempt of ACH Fraud)
Annual Annual Annual Revenue Annual Revenue Revenue Revenue At Least $1 Billion At Least $1 Billion Less Than At Least and Fewer Than and More Than All $1 Billion $1 Billion 26 Payment Accounts 100 Payment Accounts
Yes 5% 2% 9% 7% 16%
No 95 98 91 93 84

2017 AFP Payments Fraud and Control Survey
34 www.AFPonline.org ©2017 Association for Financial Professionals, Inc. All Rights Reserved
Reasons for Financial Loss from ACH Fraud(Percent of Organizations that Experienced At Least One Attempt of ACH Fraud)
Fraud Control Procedures Used to Prevent ACH Fraud(Percent of Organizations that Experienced At Least One Attempt of ACH Fraud)
Annual Annual Annual Revenue Annual Revenue Revenue Revenue At Least $1 Billion At Least $1 Billion Less Than At Least and Fewer Than and More Than All $1 Billion $1 Billion 26 Payment Accounts 100 Payment Accounts
Reconcile accounts daily to identify and return unauthorized ACH debits 60% 75% 53% 57% 25%
Block all ACH debits except on a single account set up with ACH debit filter/ACH positive pay 50 25 60 71 50
Create separate account for electronic debits initiated by the third party (e.g., taxing authority) 35 25 40 43 50
Block ACH debits on all accounts 30 25 33 29 50
Debit block on all consumer items with debit filter on commercial ACH debits 10 25 7 – 25
Annual Annual Annual Revenue Annual Revenue Revenue Revenue At Least $1 Billion At Least $1 Billion Less Than At Least and Fewer Than and More Than All $1 Billion $1 Billion 26 Payment Accounts 100 Payment Accounts
ACH return not timely 33% 25% 31% 29% 20%
Gaps in online security controls/criminal account takeover 29 – 38 29 80
Did not use ACH debit blocks or ACH debit filters 24 75 13 14 –
Did not use ACH positive pay 14 25 13 29 –
Internal fraud (e.g., employee responsible) 14 – 19 14 20
Account reconciliation not timely 10 25 6 – –

©2017 Association for Financial Professionals, Inc. All Rights Reserved www.AFPonline.org 35
2017 AFP Payments Fraud and Control Survey
Organization’s Own Corporate/Commercial Cards Used in Attempt to Commit Fraud(Percentage Distribution of Organizations that Experienced At Least One Attempt of Corporate/Commercial Card Fraud)
Annual Annual Annual Revenue Annual Revenue Revenue Revenue At Least $1 Billion At Least $1 Billion Less Than At Least and Fewer Than and More Than All $1 Billion $1 Billion 26 Payment Accounts 100 Payment Accounts
Yes 27% 30% 25% 22% 32%
No 73 70 75 78 68
Party Responsible for Fraud on Corporate/Commercial Cards(Percent of Organizations that Experienced At Least One Attempt of Corporate/Commercial Card Fraud)
Annual Annual Annual Revenue Annual Revenue Revenue Revenue At Least $1 Billion At Least $1 Billion Less Than At Least and Fewer Than and More Than All $1 Billion $1 Billion 26 Payment Accounts 100 Payment Accounts
Unknown external party 79% 81% 75% 63% 90%
Employee 23 18 31 38 30
Third-party or outsourcer 9 9 10 8 30
Parties that Suffered Financial Loss from Fraud on Corporate/Commercial Cards(Percent of Organizations that Experienced At Least One Attempt of Corporate/Commercial Card Fraud)
Annual Annual Annual Revenue Annual Revenue Revenue Revenue At Least $1 Billion At Least $1 Billion Less Than At Least and Fewer Than and More Than All $1 Billion $1 Billion 26 Payment Accounts 100 Payment Accounts
No organization suffered financial loss 51% 54% 8% 8% 14%
Card-issuing bank 25 23 13 11 21
Merchant 15 18 27 27 28
My organization 11 10 49 49 41
Card processor 9 10 11 11 10

2017 AFP Payments Fraud and Control Survey
36 www.AFPonline.org ©2017 Association for Financial Professionals, Inc. All Rights Reserved
Actions Taken to Defend Against Attacks that Would Compromise Security(Percent of Organizations that Experienced Attempted and/or Actual Payments Fraud)
Annual Annual Annual Revenue Annual Revenue Revenue Revenue At Least $1 Billion At Least $1 Billion Less Than At Least and Fewer Than and More Than All $1 Billion $1 Billion 26 Payment Accounts 100 Payment Accounts
Perform daily reconciliations 74% 71% 76% 84% 50%
Adopt a stronger form of authentication or added layers of security for access to bank services 46 43 48 42 50
Upgrade the authentication procedure/devices used to access company network 37 34 38 36 54
Ensure disaster recovery plans include the ability to continue with strong controls 37 33 41 41 38
Restrict company network access for payments to only company-issued laptop 27 25 27 26 23
Restrict network access for payments via mobile devices (laptop, tablets, phones) to emergency situations only 15 16 14 12 8
Dedicate a PC for payment origination (with no links to email/web browsing/social networks) 12 9 12 12 4
Replace proprietary bank connections with secure access through the SWIFT network 8 5 10 6 23
Acceptance of Credit and/or Debit Card Payments from Customers(Percentage Distribution of Organizations)
Annual Annual Annual Revenue Annual Revenue Revenue Revenue At Least $1 Billion At Least $1 Billion Less Than At Least and Fewer Than and More Than All $1 Billion $1 Billion 26 Payment Accounts 100 Payment Accounts
Yes 70% 68% 75% 77% 84%
No 30 32 25 23 16

AFP Research
AFPResearchprovidesfinancialprofessionalswithproprietaryandtimelyresearchthat
drives business performance. AFP Research draws on the knowledge of the Association’s
members and its subject matter experts in areas that include bank relationship management,
riskmanagement,payments,andfinancialaccountingandreporting.Studiesreporton
a variety of topics, including AFP’s annual compensation survey, are available online at
www.AFPonline.org/research.
About the Association for Financial Professionals
HeadquarteredoutsideWashington,D.C.,theAssociationforFinancialProfessionals(AFP)
istheprofessionalsocietythatrepresentsfinanceexecutivesglobally.AFPestablishedand
administerstheCertifiedTreasuryProfessionalTM andCertifiedCorporateFP&AProfessionalTM
credentials,whichsetstandardsofexcellenceinfinance.ThequarterlyAFPCorporate
Cash IndicatorsTM serve as a bellwether of economic growth. The AFP Annual Conference
isthelargestnetworkingeventforcorporatefinanceprofessionalsintheworld.
AFP,AssociationforFinancialProfessionals,CertifiedTreasuryProfessional,and
CertifiedCorporateFinancialPlanning&AnalysisProfessionalareregisteredtrademarks
of the Association for Financial Professionals. © 2017 Association for Financial
Professionals, Inc. All Rights Reserved.
General Inquiries [email protected]
Web Site www.AFPonline.org
Phone 301.907.2862

© 2017 JPMorgan Chase Bank, N.A. Member FDIC. “Chase” is a marketing name for certain businesses of JPMorgan Chase & Co. and its subsidiaries (collectively, “JPMC”). 304323
Commercial Banking Treasury Services
In 2016, 74% percent of companies were impacted by payment fraud including credit card and business email compromise schemes. Get proactive about cybersecurity—visit our Fraud Protection Center to learn ways to identify fraud and protect your business.
Learn more at jpmorgan.com/cb/fraudprotection
Payments FraudPROTECT for if, PREPARE for when