2017-10-19 SI Clean10.1038...RI SODVPD LQVXOLQ OHYHO GXULQJ D PHDO WHVW $8&&SHS DUHD XQGHU FXUYH...
40
1 2 Supplementary Figure 1. Flow chart of the clinical trial 3 4
-
Upload
phungnguyet -
Category
Documents
-
view
217 -
download
0
Transcript of 2017-10-19 SI Clean10.1038...RI SODVPD LQVXOLQ OHYHO GXULQJ D PHDO WHVW $8&&SHS DUHD XQGHU FXUYH...

1
2 Supplementary Figure 1. Flow chart of the clinical trial 3
4

5
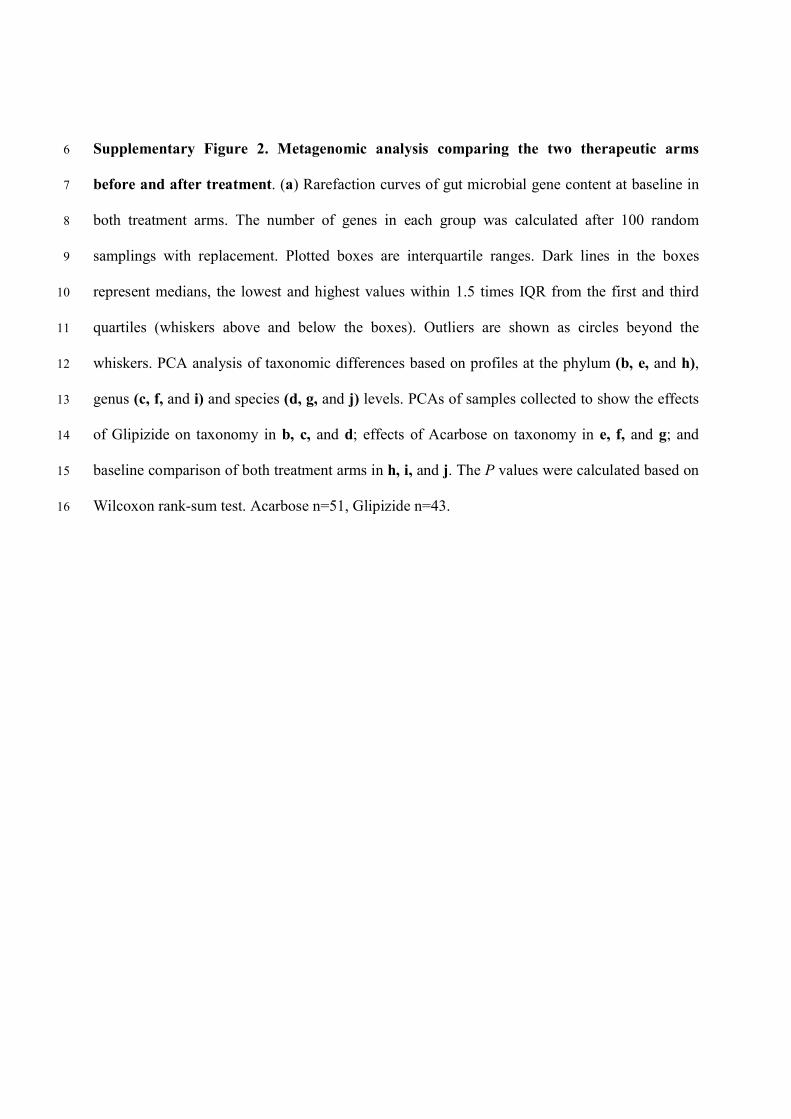
Supplementary Figure 2. Metagenomic analysis comparing the two therapeutic arms 6
before and after treatment. (a) Rarefaction curves of gut microbial gene content at baseline in 7
both treatment arms. The number of genes in each group was calculated after 100 random 8
samplings with replacement. Plotted boxes are interquartile ranges. Dark lines in the boxes 9
represent medians, the lowest and highest values within 1.5 times IQR from the first and third 10
quartiles (whiskers above and below the boxes). Outliers are shown as circles beyond the 11
whiskers. PCA analysis of taxonomic differences based on profiles at the phylum (b, e, and h), 12
genus (c, f, and i) and species (d, g, and j) levels. PCAs of samples collected to show the effects 13
of Glipizide on taxonomy in b, c, and d; effects of Acarbose on taxonomy in e, f, and g; and 14
baseline comparison of both treatment arms in h, i, and j. The P values were calculated based on 15
Wilcoxon rank-sum test. Acarbose n=51, Glipizide n=43. 16

17
Supplementary Figure 3. Correlation between clinical outcomes and mOTUs that exhibit 18
changes in relative abundance in response to Acarbose treatment. Multivariate longitudinal 19
analysis of the contribution of changes of mOTUs to alterations in clinical outcomes. The colour 20
key indicates the β coefficient value of independent variables. mOTUs in green indicate those 21
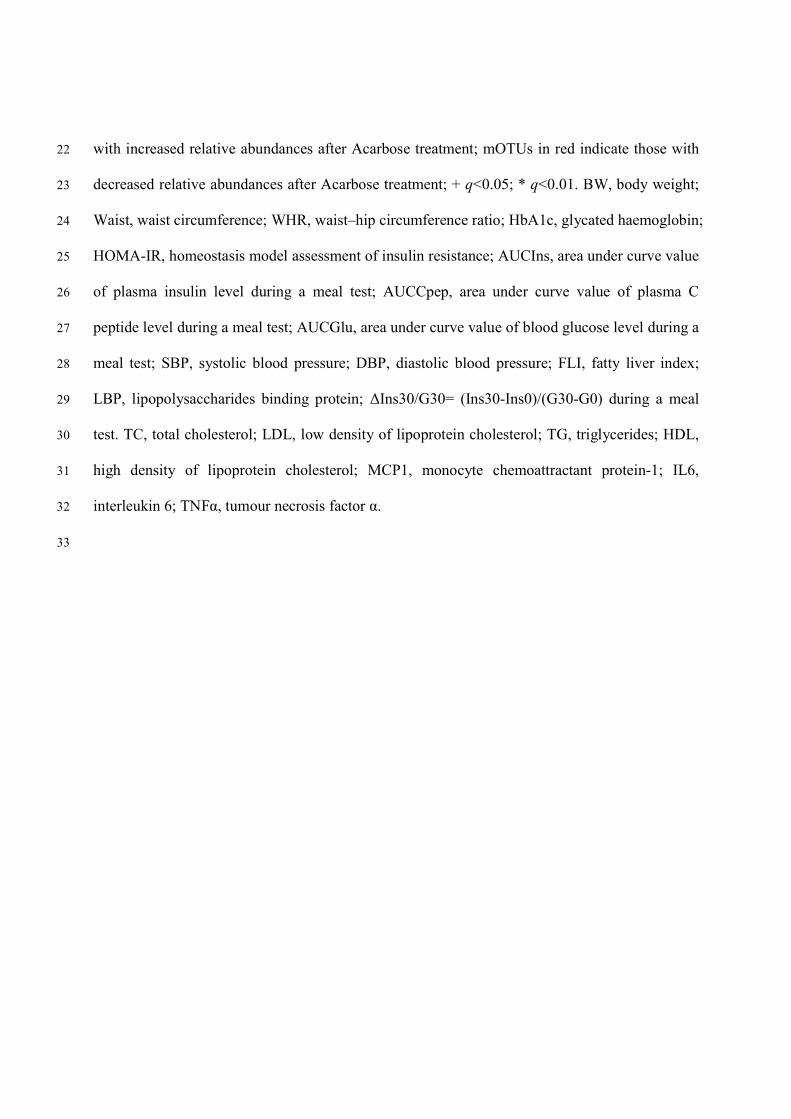
with increased relative abundances after Acarbose treatment; mOTUs in red indicate those with 22
decreased relative abundances after Acarbose treatment; + q<0.05; * q<0.01. BW, body weight; 23
Waist, waist circumference; WHR, waist–hip circumference ratio; HbA1c, glycated haemoglobin; 24
HOMA-IR, homeostasis model assessment of insulin resistance; AUCIns, area under curve value 25
of plasma insulin level during a meal test; AUCCpep, area under curve value of plasma C 26
peptide level during a meal test; AUCGlu, area under curve value of blood glucose level during a 27
meal test; SBP, systolic blood pressure; DBP, diastolic blood pressure; FLI, fatty liver index; 28
LBP, lipopolysaccharides binding protein; ΔIns30/G30= (Ins30-Ins0)/(G30-G0) during a meal 29
test. TC, total cholesterol; LDL, low density of lipoprotein cholesterol; TG, triglycerides; HDL, 30
high density of lipoprotein cholesterol; MCP1, monocyte chemoattractant protein-1; IL6, 31
interleukin 6; TNFα, tumour necrosis factor α. 32
33
34
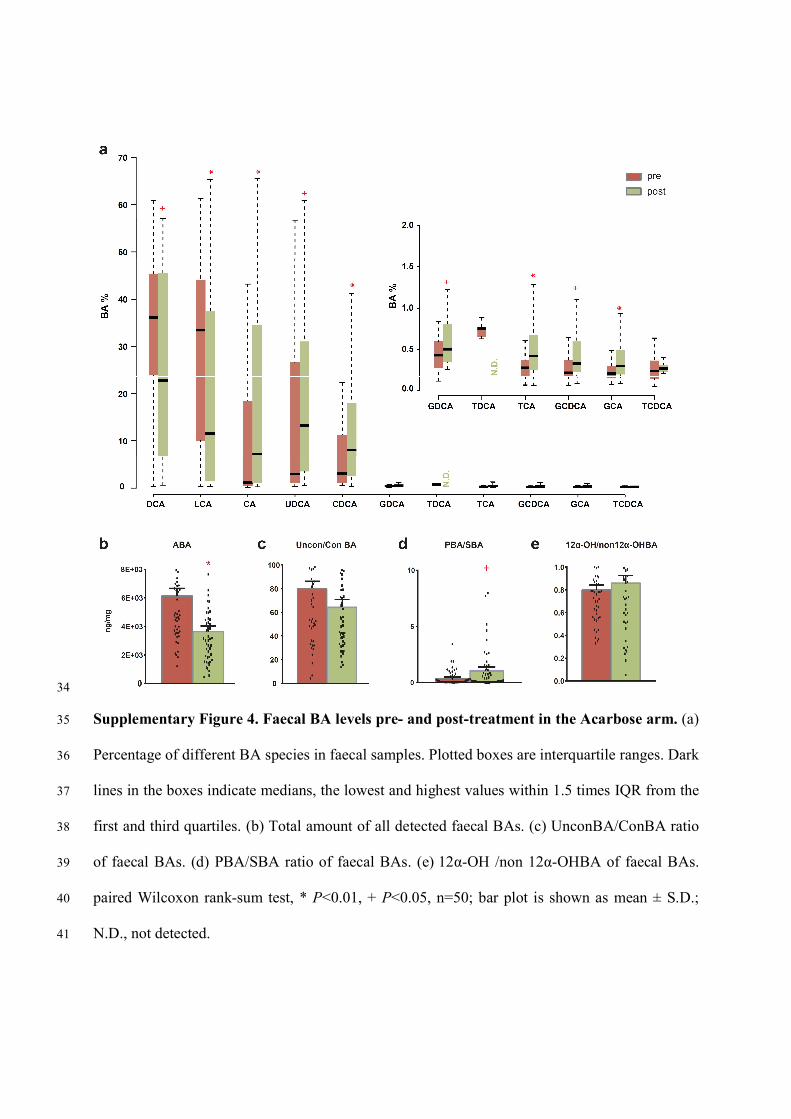
Supplementary Figure 4. Faecal BA levels pre- and post-treatment in the Acarbose arm. (a) 35
Percentage of different BA species in faecal samples. Plotted boxes are interquartile ranges. Dark 36
lines in the boxes indicate medians, the lowest and highest values within 1.5 times IQR from the 37
first and third quartiles. (b) Total amount of all detected faecal BAs. (c) UnconBA/ConBA ratio 38
of faecal BAs. (d) PBA/SBA ratio of faecal BAs. (e) 12α-OH /non 12α-OHBA of faecal BAs. 39
paired Wilcoxon rank-sum test, * P<0.01, + P<0.05, n=50; bar plot is shown as mean ± S.D.; 40
N.D., not detected. 41
42
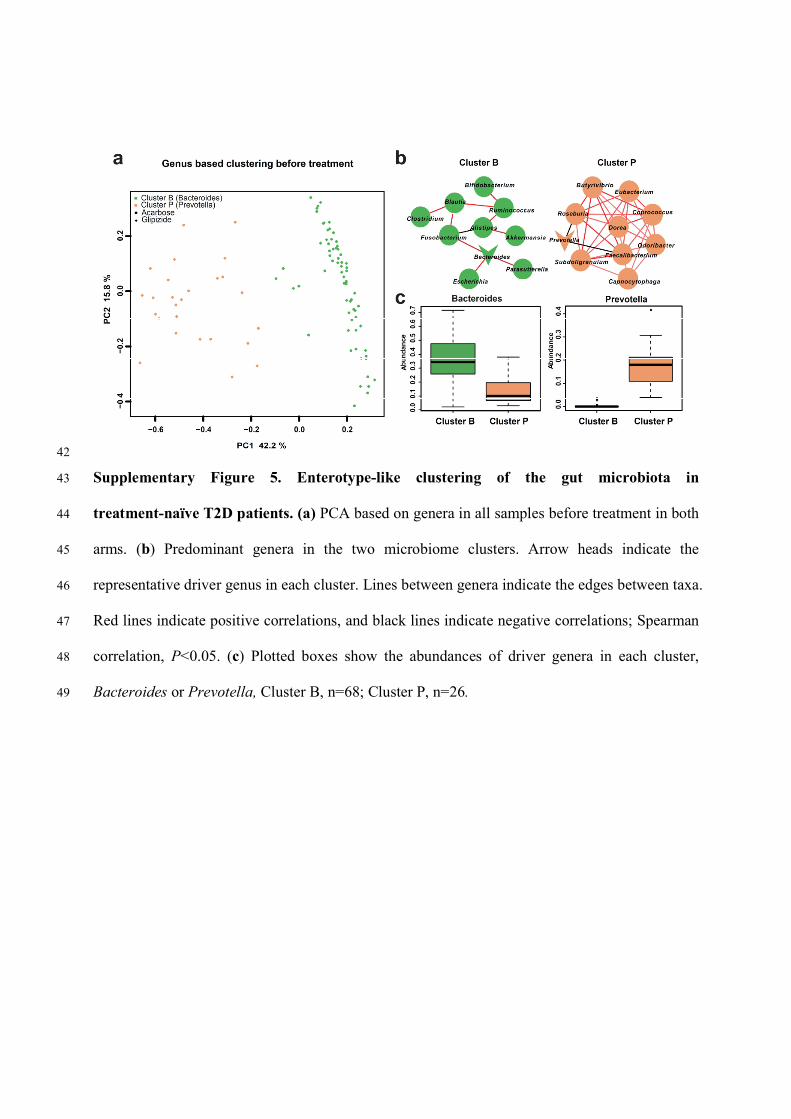
Supplementary Figure 5. Enterotype-like clustering of the gut microbiota in 43
treatment-naïve T2D patients. (a) PCA based on genera in all samples before treatment in both 44
arms. (b) Predominant genera in the two microbiome clusters. Arrow heads indicate the 45
representative driver genus in each cluster. Lines between genera indicate the edges between taxa. 46
Red lines indicate positive correlations, and black lines indicate negative correlations; Spearman 47
correlation, P<0.05. (c) Plotted boxes show the abundances of driver genera in each cluster, 48
Bacteroides or Prevotella, Cluster B, n=68; Cluster P, n=26. 49

50

Supplementary Figure 6. Plasma BA composition and therapeutic responses to Acarbose 51
treatment differ in patients with different baseline microbiome compositions. 52
(a) Differential effects of Glipizide and Acarbose on metabolic parameters and plasma BA 53
compositions in patients stratified according to their baseline intestinal microbiome. Glycaemia, 54
glycaemia related clinical parameters; IR, insulin secretion/resistance related indices; AF, 55
adipose tissue secreted factors; OB, anthropometry parameters to measure body obesity; NAFLD, 56
parameters to evaluate non-alcohol fatty liver disease; BP, blood pressures; BAs, bile acids; P, 57
Cluster P; B, Cluster B (b) Comparison of the genus composition of the gut microbiota in 58
patients belonging to the Bacteroides or Prevotella driven enterotype-like clusters, pre- and 59
post-treatment with Acarbose. The 15 most abundant genera were plotted, *, genus significantly 60
changed in relative abundances after treatment, q<0.01. (c) Relative abundances of genes 61
involved in BA metabolism in samples pre- and post- treatment with Acarbose from patients 62
with gut microbiomes belonging to the Bacteroides (Cluster B) or Prevotella (Cluster P) driven 63
enterotype-like clusters. Plotted boxes are interquartile ranges. Dark lines in the boxes indicate 64
medians, the lowest and highest values within 1.5 times IQR from the first and third quartiles. 65
Cluster B, n=36; Cluster P, n=15, * P<0.01, + P<0.05. 66
67
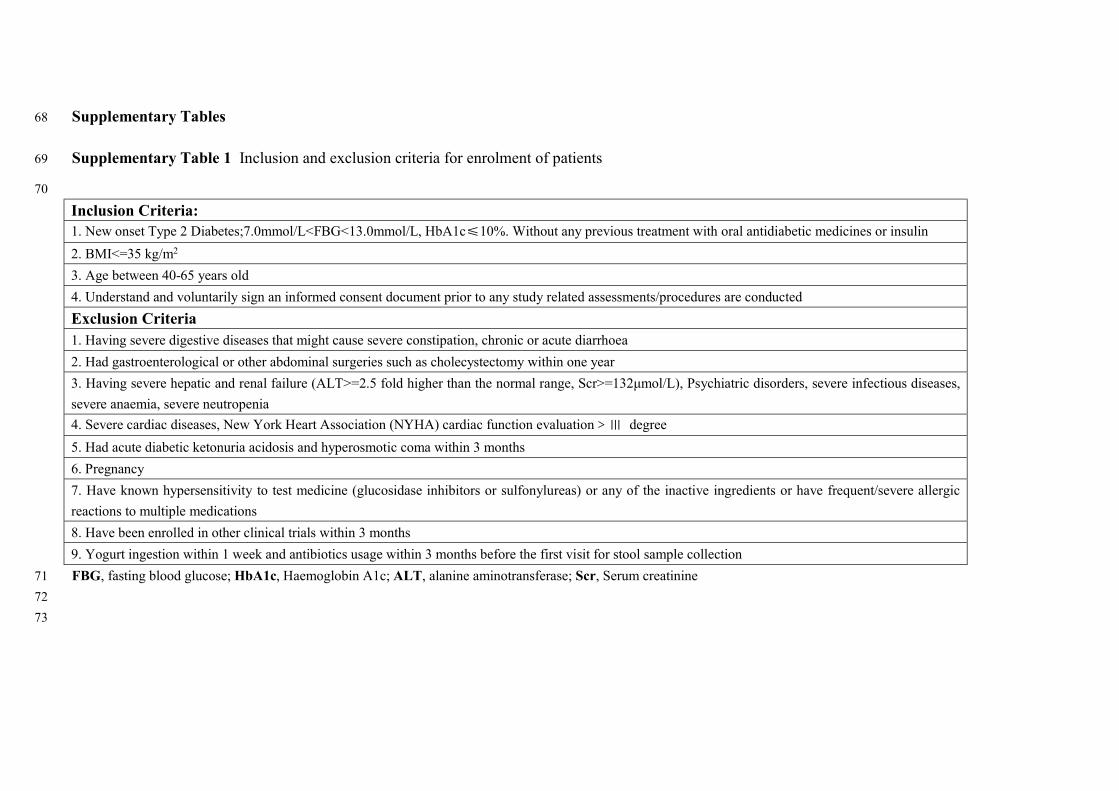
Supplementary Tables 68
Supplementary Table 1 Inclusion and exclusion criteria for enrolment of patients 69
70
Inclusion Criteria: 1. New onset Type 2 Diabetes;7.0mmol/L<FBG<13.0mmol/L, HbA1c≤10%. Without any previous treatment with oral antidiabetic medicines or insulin
2. BMI<=35 kg/m2
3. Age between 40-65 years old
4. Understand and voluntarily sign an informed consent document prior to any study related assessments/procedures are conducted
Exclusion Criteria 1. Having severe digestive diseases that might cause severe constipation, chronic or acute diarrhoea
2. Had gastroenterological or other abdominal surgeries such as cholecystectomy within one year
3. Having severe hepatic and renal failure (ALT>=2.5 fold higher than the normal range, Scr>=132μmol/L), Psychiatric disorders, severe infectious diseases,
severe anaemia, severe neutropenia
4. Severe cardiac diseases, New York Heart Association (NYHA) cardiac function evaluation>Ⅲ degree
5. Had acute diabetic ketonuria acidosis and hyperosmotic coma within 3 months
6. Pregnancy
7. Have known hypersensitivity to test medicine (glucosidase inhibitors or sulfonylureas) or any of the inactive ingredients or have frequent/severe allergic
reactions to multiple medications
8. Have been enrolled in other clinical trials within 3 months
9. Yogurt ingestion within 1 week and antibiotics usage within 3 months before the first visit for stool sample collection
FBG, fasting blood glucose; HbA1c, Haemoglobin A1c; ALT, alanine aminotransferase; Scr, Serum creatinine 71
72
73

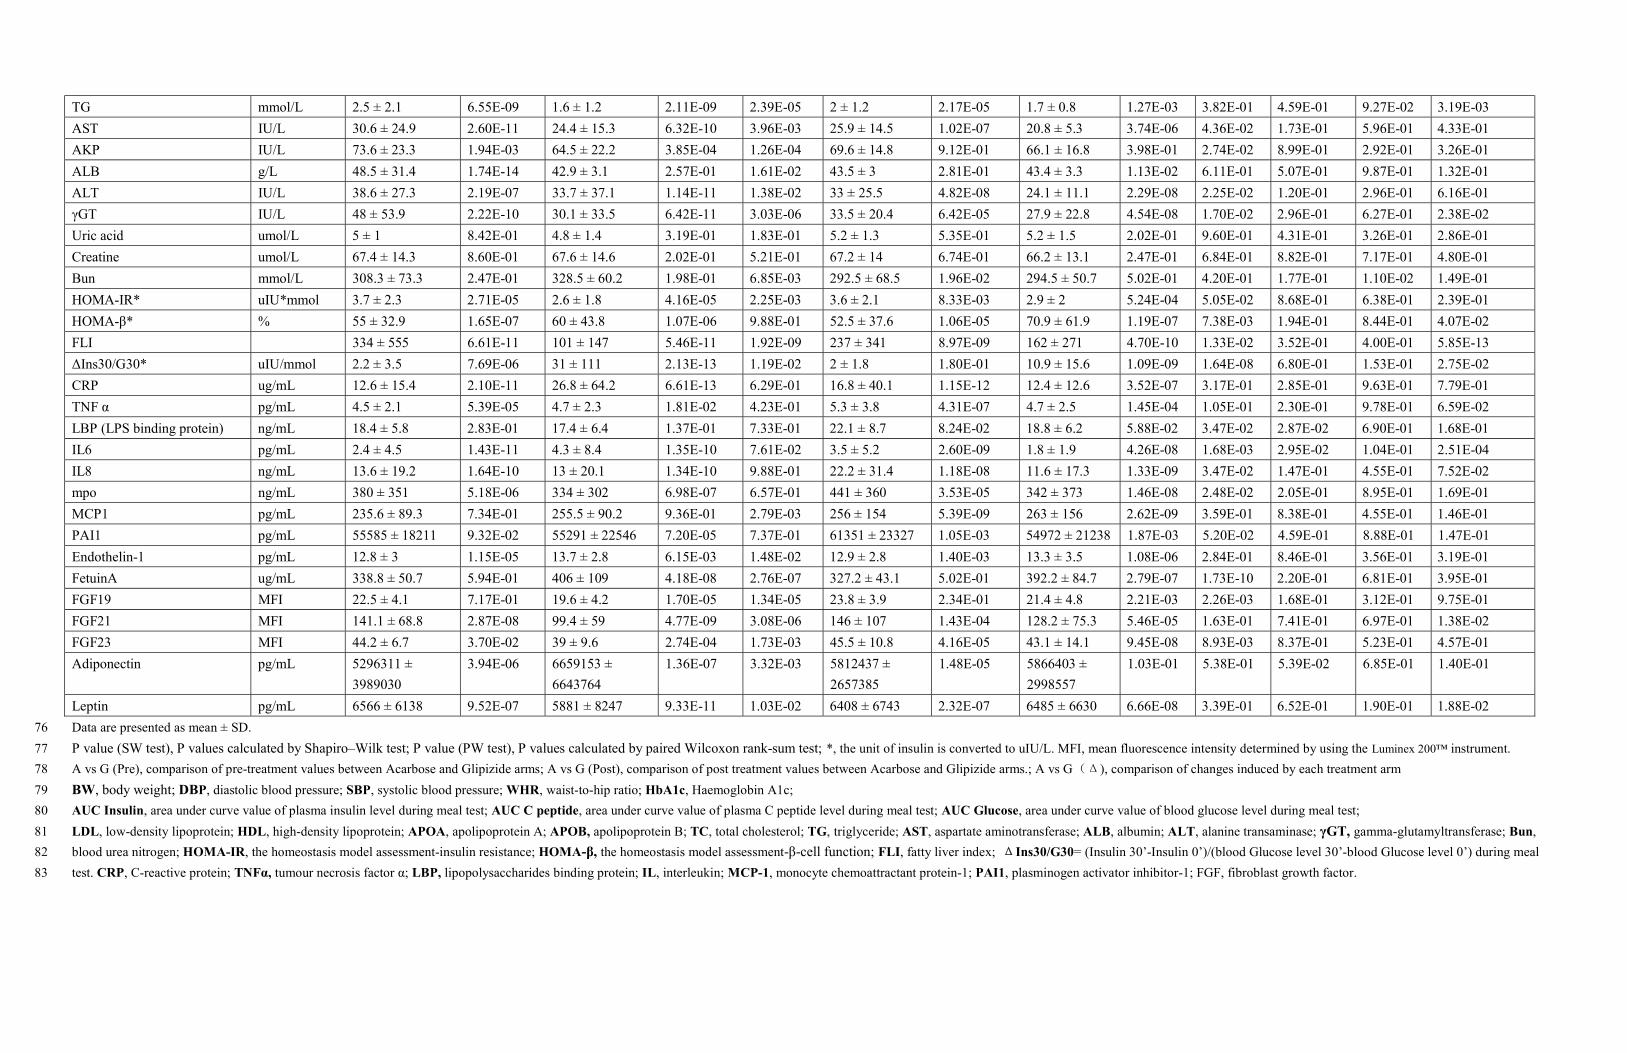
Supplementary Table 2 Clinical indices pre- and post-treatment in both treatment arms 74
75
Clinical Index Unit Acarbose Glipizide Acarbose vs. Glipizide (Wilcoxon test)
Pre-treatment Post-Treatment
P value
(PW test)
Pre-treatment Post-Treatment
P value
(PW test)
A vs. G
(Pre)
A vs. G
(Post)
A vs G
(Δ)
Value
(Mean ± SD)
P value
(SW test)
Value
(Mean ± SD)
P value
(SW test)
Value
(Mean ± SD)
P value
(SW test)
Value
(Mean ± SD)
P value
(SW test)
P value
P value
P value
Age years 53±7 NA 54±7 NA 0.40 NA
Sex (male/Total) 34/51 NA 24/43 NA 0.39 NA
BMI kg/m2 26.3 ± 3.2 1.26E-01 25.4 ± 3.2 4.08E-03 3.48E-07 26 ± 3.4 7.73E-05 25.7 ± 3.3 2.09E-05 1.13E-01 2.65E-01 9.46E-01 4.21E-03
BW kg 74.7 ± 10.3 4.23E-01 72.1 ± 10.1 3.64E-01 2.36E-07 71.5 ± 10.7 2.00E-01 70.6 ± 10.2 1.77E-01 1.38E-01 6.72E-02 1.90E-01 2.50E-03
DBP mmHg 81.6 ± 8.4 1.79E-02 75.2 ± 8.1 3.28E-01 2.99E-05 81 ± 10.2 2.39E-01 76.1 ± 9.1 6.14E-01 1.28E-02 6.75E-01 7.03E-01 4.33E-01
SBP mmHg 127.2 ± 15.8 1.40E-02 120.5 ± 13 1.18E-01 2.16E-02 131 ± 18.7 2.29E-02 125.4 ± 14.5 2.39E-01 4.36E-02 4.31E-01 1.28E-01 9.97E-01
Waist circumference cm 91.5 ± 8.5 5.93E-01 88.6 ± 7.3 8.61E-01 3.85E-04 90.7 ± 8.4 8.21E-02 89.5 ± 8.4 1.89E-02 1.44E-01 5.27E-01 8.70E-01 1.51E-01
WHR 0.9 ± 0.1 2.19E-02 0.9 ± 0 5.43E-01 5.31E-03 0.9 ± 0.1 2.37E-01 0.9 ± 0.1 3.60E-01 1.89E-02 4.85E-01 7.80E-01 7.45E-01
HbA1c % 7.5 ± 0.8 9.48E-03 6.4 ± 0.5 1.79E-01 1.45E-09 7.7 ± 0.9 4.57E-03 6.3 ± 0.6 9.23E-01 1.82E-08 5.41E-01 5.08E-01 4.68E-01
Blood Glucose level 0' mmol/L 7.6 ± 1.4 1.45E-03 6.6 ± 0.9 1.84E-02 3.58E-07 7.8 ± 1.4 3.99E-02 6.7 ± 1.2 2.44E-03 2.48E-06 2.91E-01 6.65E-01 3.51E-01
Blood Glucose level 30' mmol/L 10.4 ± 2 5.96E-03 7.6 ± 1.4 2.80E-02 1.43E-09 11.1 ± 1.8 4.95E-04 8.9 ± 2.2 1.31E-01 2.88E-06 5.25E-02 1.62E-03 1.73E-01
Blood Glucose level 60' mmol/L 13.7 ± 2.2 2.69E-03 9.1 ± 1.8 1.98E-02 8.28E-10 14.6 ± 2.3 5.96E-04 11.5 ± 2.4 5.61E-02 2.60E-07 9.35E-02 1.38E-06 2.90E-03
Blood Glucose level 120' mmol/L 14.2 ± 2.7 3.35E-04 9.2 ± 1.8 3.19E-04 5.30E-10 14.9 ± 2.8 2.53E-03 10.8 ± 2.8 4.06E-03 6.29E-10 1.64E-01 2.01E-03 1.54E-01
Blood Glucose level 180' mmol/L 11.4 ± 3 9.05E-06 7.9 ± 2.1 9.56E-04 7.37E-09 12.6 ± 3.2 5.49E-03 8.9 ± 3 5.16E-03 9.80E-10 8.84E-02 2.56E-01 4.74E-01
AUC blood Glucose mmol/L*min 2241 ± 363 8.16E-03 1507 ± 263 1.47E-02 5.30E-10 2381 ± 351 5.42E-03 1804 ± 359 7.35E-02 6.98E-11 7.70E-02 6.55E-05 4.89E-02
C Peptide 0' ng/mL 1.2 ± 0.5 5.84E-02 1.1 ± 0.5 1.39E-04 1.12E-02 1.1 ± 0.4 3.24E-02 1.1 ± 0.4 7.22E-01 3.47E-01 4.34E-01 7.36E-01 2.08E-01
C Peptide 30' ng/mL 1.7 ± 0.8 1.81E-03 1.4 ± 0.6 2.22E-01 1.02E-06 1.6 ± 0.5 8.62E-02 2.1 ± 0.7 1.21E-01 1.38E-06 5.92E-01 1.47E-07 4.91E-12
C Peptide 60' ng/mL 2.7 ± 1.4 1.52E-02 1.9 ± 0.9 2.55E-02 2.30E-06 2.4 ± 0.9 1.95E-02 2.9 ± 1 1.19E-02 3.42E-04 3.63E-01 1.28E-08 4.99E-09
C Peptide 120' ng/mL 3.9 ± 1.7 4.57E-03 2.8 ± 1.1 4.83E-01 8.13E-08 3.8 ± 1.3 7.39E-01 4.2 ± 1.4 5.72E-01 2.14E-02 9.44E-01 3.54E-08 9.39E-08
C Peptide 180' ng/mL 3.6 ± 1.6 7.96E-05 2.5 ± 1.2 4.81E-03 7.49E-08 3.5 ± 1.2 8.69E-01 3.8 ± 1.2 4.36E-01 1.04E-01 4.81E-01 7.73E-08 1.03E-06
AUC C Peptide ng/mL*min 528 ± 210 1.96E-02 384 ± 143 8.05E-01 1.94E-08 501 ± 154 2.57E-01 575 ± 161 1.54E-01 1.95E-03 9.78E-01 1.94E-07 4.78E-10
Insulin 0' pmol/L 83.8 ± 45.1 7.16E-05 68.6 ± 44.2 6.44E-05 2.12E-02 80.7 ± 47 3.62E-03 76.3 ± 48.6 2.20E-03 6.03E-01 5.92E-01 7.76E-01 1.57E-01
Insulin30' pmol/L 138.9 ± 79.8 1.67E-05 100.5 ± 58 1.69E-04 9.12E-04 135.2 ± 65.7 1.15E-02 194.1 ± 112.6 1.26E-05 2.61E-05 8.93E-01 2.26E-06 1.29E-07
Insulin 60' pmol/L 258.5 ± 163.2 2.63E-07 157.4 ± 97.5 1.26E-03 2.73E-05 226.6 ± 121.2 2.35E-01 283.3 ± 172.5 1.48E-03 6.03E-03 3.93E-01 1.26E-06 1.03E-06
Insulin120' pmol/L 361.8 ± 224.1 3.39E-07 210.6 ± 119.1 2.11E-07 3.85E-06 318.8 ± 156.3 2.19E-03 378.9 ± 223.6 3.84E-02 5.72E-02 6.39E-01 2.53E-06 7.78E-06
Insulin180' pmol/L 286.7 ± 180.6 2.22E-04 169.2 ± 127 5.77E-03 1.63E-06 277.8 ± 151.6 5.86E-02 309.6 ± 170.3 1.72E-04 1.31E-01 7.66E-01 6.78E-06 1.30E-05
AUC Insulin* pmol/L*min 1029.9 ± 575.2 1.50E-06 637.1 ± 342.6 6.61E-04 2.41E-06 940.2 ± 431.7 1.62E-01 1139.6 ± 608.9 3.83E-04 1.90E-02 6.97E-01 1.62E-06 9.54E-08
LDL mmol/L 1.2 ± 0.4 3.78E-08 1.2 ± 0.3 5.71E-05 2.76E-01 1.2 ± 0.4 1.15E-08 1.3 ± 0.6 9.43E-09 5.35E-01 5.00E-01 8.64E-01 7.68E-01
HDL mmol/L 3.1 ± 1 6.54E-03 3 ± 1 5.66E-01 4.84E-01 3.1 ± 0.8 8.73E-01 2.9 ± 0.8 1.93E-01 3.58E-02 4.92E-01 5.14E-01 2.07E-01
APOA g/L 1.3 ± 0.2 7.22E-01 1.2 ± 0.2 6.96E-01 2.46E-03 1.4 ± 0.1 5.74E-01 1.3 ± 0.2 9.22E-01 2.25E-01 7.97E-01 2.35E-01 1.01E-01
APOB g/L 1.1 ± 0.3 3.02E-01 1 ± 0.3 8.29E-01 2.98E-01 1 ± 0.2 4.69E-01 1 ± 0.2 8.76E-01 2.36E-01 7.87E-01 9.15E-01 8.76E-01
TC mmol/L 5.1 ± 1.2 3.79E-02 4.8 ± 1.2 6.43E-02 7.47E-03 4.9 ± 1 3.73E-02 4.8 ± 0.8 7.28E-01 2.28E-01 6.96E-01 7.12E-01 3.18E-01
TG mmol/L 2.5 ± 2.1 6.55E-09 1.6 ± 1.2 2.11E-09 2.39E-05 2 ± 1.2 2.17E-05 1.7 ± 0.8 1.27E-03 3.82E-01 4.59E-01 9.27E-02 3.19E-03
AST IU/L 30.6 ± 24.9 2.60E-11 24.4 ± 15.3 6.32E-10 3.96E-03 25.9 ± 14.5 1.02E-07 20.8 ± 5.3 3.74E-06 4.36E-02 1.73E-01 5.96E-01 4.33E-01
AKP IU/L 73.6 ± 23.3 1.94E-03 64.5 ± 22.2 3.85E-04 1.26E-04 69.6 ± 14.8 9.12E-01 66.1 ± 16.8 3.98E-01 2.74E-02 8.99E-01 2.92E-01 3.26E-01
ALB g/L 48.5 ± 31.4 1.74E-14 42.9 ± 3.1 2.57E-01 1.61E-02 43.5 ± 3 2.81E-01 43.4 ± 3.3 1.13E-02 6.11E-01 5.07E-01 9.87E-01 1.32E-01
ALT IU/L 38.6 ± 27.3 2.19E-07 33.7 ± 37.1 1.14E-11 1.38E-02 33 ± 25.5 4.82E-08 24.1 ± 11.1 2.29E-08 2.25E-02 1.20E-01 2.96E-01 6.16E-01
γGT IU/L 48 ± 53.9 2.22E-10 30.1 ± 33.5 6.42E-11 3.03E-06 33.5 ± 20.4 6.42E-05 27.9 ± 22.8 4.54E-08 1.70E-02 2.96E-01 6.27E-01 2.38E-02
Uric acid umol/L 5 ± 1 8.42E-01 4.8 ± 1.4 3.19E-01 1.83E-01 5.2 ± 1.3 5.35E-01 5.2 ± 1.5 2.02E-01 9.60E-01 4.31E-01 3.26E-01 2.86E-01
Creatine umol/L 67.4 ± 14.3 8.60E-01 67.6 ± 14.6 2.02E-01 5.21E-01 67.2 ± 14 6.74E-01 66.2 ± 13.1 2.47E-01 6.84E-01 8.82E-01 7.17E-01 4.80E-01
Bun mmol/L 308.3 ± 73.3 2.47E-01 328.5 ± 60.2 1.98E-01 6.85E-03 292.5 ± 68.5 1.96E-02 294.5 ± 50.7 5.02E-01 4.20E-01 1.77E-01 1.10E-02 1.49E-01
HOMA-IR* uIU*mmol 3.7 ± 2.3 2.71E-05 2.6 ± 1.8 4.16E-05 2.25E-03 3.6 ± 2.1 8.33E-03 2.9 ± 2 5.24E-04 5.05E-02 8.68E-01 6.38E-01 2.39E-01
HOMA-β* % 55 ± 32.9 1.65E-07 60 ± 43.8 1.07E-06 9.88E-01 52.5 ± 37.6 1.06E-05 70.9 ± 61.9 1.19E-07 7.38E-03 1.94E-01 8.44E-01 4.07E-02
FLI 334 ± 555 6.61E-11 101 ± 147 5.46E-11 1.92E-09 237 ± 341 8.97E-09 162 ± 271 4.70E-10 1.33E-02 3.52E-01 4.00E-01 5.85E-13
ΔIns30/G30* uIU/mmol 2.2 ± 3.5 7.69E-06 31 ± 111 2.13E-13 1.19E-02 2 ± 1.8 1.80E-01 10.9 ± 15.6 1.09E-09 1.64E-08 6.80E-01 1.53E-01 2.75E-02
CRP ug/mL 12.6 ± 15.4 2.10E-11 26.8 ± 64.2 6.61E-13 6.29E-01 16.8 ± 40.1 1.15E-12 12.4 ± 12.6 3.52E-07 3.17E-01 2.85E-01 9.63E-01 7.79E-01
TNF α pg/mL 4.5 ± 2.1 5.39E-05 4.7 ± 2.3 1.81E-02 4.23E-01 5.3 ± 3.8 4.31E-07 4.7 ± 2.5 1.45E-04 1.05E-01 2.30E-01 9.78E-01 6.59E-02
LBP (LPS binding protein) ng/mL 18.4 ± 5.8 2.83E-01 17.4 ± 6.4 1.37E-01 7.33E-01 22.1 ± 8.7 8.24E-02 18.8 ± 6.2 5.88E-02 3.47E-02 2.87E-02 6.90E-01 1.68E-01
IL6 pg/mL 2.4 ± 4.5 1.43E-11 4.3 ± 8.4 1.35E-10 7.61E-02 3.5 ± 5.2 2.60E-09 1.8 ± 1.9 4.26E-08 1.68E-03 2.95E-02 1.04E-01 2.51E-04
IL8 ng/mL 13.6 ± 19.2 1.64E-10 13 ± 20.1 1.34E-10 9.88E-01 22.2 ± 31.4 1.18E-08 11.6 ± 17.3 1.33E-09 3.47E-02 1.47E-01 4.55E-01 7.52E-02
mpo ng/mL 380 ± 351 5.18E-06 334 ± 302 6.98E-07 6.57E-01 441 ± 360 3.53E-05 342 ± 373 1.46E-08 2.48E-02 2.05E-01 8.95E-01 1.69E-01
MCP1 pg/mL 235.6 ± 89.3 7.34E-01 255.5 ± 90.2 9.36E-01 2.79E-03 256 ± 154 5.39E-09 263 ± 156 2.62E-09 3.59E-01 8.38E-01 4.55E-01 1.46E-01
PAI1 pg/mL 55585 ± 18211 9.32E-02 55291 ± 22546 7.20E-05 7.37E-01 61351 ± 23327 1.05E-03 54972 ± 21238 1.87E-03 5.20E-02 4.59E-01 8.88E-01 1.47E-01
Endothelin-1 pg/mL 12.8 ± 3 1.15E-05 13.7 ± 2.8 6.15E-03 1.48E-02 12.9 ± 2.8 1.40E-03 13.3 ± 3.5 1.08E-06 2.84E-01 8.46E-01 3.56E-01 3.19E-01
FetuinA ug/mL 338.8 ± 50.7 5.94E-01 406 ± 109 4.18E-08 2.76E-07 327.2 ± 43.1 5.02E-01 392.2 ± 84.7 2.79E-07 1.73E-10 2.20E-01 6.81E-01 3.95E-01
FGF19 MFI 22.5 ± 4.1 7.17E-01 19.6 ± 4.2 1.70E-05 1.34E-05 23.8 ± 3.9 2.34E-01 21.4 ± 4.8 2.21E-03 2.26E-03 1.68E-01 3.12E-01 9.75E-01
FGF21 MFI 141.1 ± 68.8 2.87E-08 99.4 ± 59 4.77E-09 3.08E-06 146 ± 107 1.43E-04 128.2 ± 75.3 5.46E-05 1.63E-01 7.41E-01 6.97E-01 1.38E-02
FGF23 MFI 44.2 ± 6.7 3.70E-02 39 ± 9.6 2.74E-04 1.73E-03 45.5 ± 10.8 4.16E-05 43.1 ± 14.1 9.45E-08 8.93E-03 8.37E-01 5.23E-01 4.57E-01
Adiponectin pg/mL 5296311 ±
3989030
3.94E-06 6659153 ±
6643764
1.36E-07 3.32E-03 5812437 ±
2657385
1.48E-05 5866403 ±
2998557
1.03E-01 5.38E-01 5.39E-02 6.85E-01 1.40E-01
Leptin pg/mL 6566 ± 6138 9.52E-07 5881 ± 8247 9.33E-11 1.03E-02 6408 ± 6743 2.32E-07 6485 ± 6630 6.66E-08 3.39E-01 6.52E-01 1.90E-01 1.88E-02
Data are presented as mean ± SD. 76
P value (SW test), P values calculated by Shapiro–Wilk test; P value (PW test), P values calculated by paired Wilcoxon rank-sum test; *, the unit of insulin is converted to uIU/L. MFI, mean fluorescence intensity determined by using the Luminex 200™ instrument. 77
A vs G (Pre), comparison of pre-treatment values between Acarbose and Glipizide arms; A vs G (Post), comparison of post treatment values between Acarbose and Glipizide arms.; A vs G(Δ), comparison of changes induced by each treatment arm 78
BW, body weight; DBP, diastolic blood pressure; SBP, systolic blood pressure; WHR, waist-to-hip ratio; HbA1c, Haemoglobin A1c; 79
AUC Insulin, area under curve value of plasma insulin level during meal test; AUC C peptide, area under curve value of plasma C peptide level during meal test; AUC Glucose, area under curve value of blood glucose level during meal test; 80
LDL, low-density lipoprotein; HDL, high-density lipoprotein; APOA, apolipoprotein A; APOB, apolipoprotein B; TC, total cholesterol; TG, triglyceride; AST, aspartate aminotransferase; ALB, albumin; ALT, alanine transaminase; γGT, gamma-glutamyltransferase; Bun, 81
blood urea nitrogen; HOMA-IR, the homeostasis model assessment-insulin resistance; HOMA-β, the homeostasis model assessment-β-cell function; FLI, fatty liver index; ΔIns30/G30= (Insulin 30’-Insulin 0’)/(blood Glucose level 30’-blood Glucose level 0’) during meal 82
test. CRP, C-reactive protein; TNFα, tumour necrosis factor α; LBP, lipopolysaccharides binding protein; IL, interleukin; MCP-1, monocyte chemoattractant protein-1; PAI1, plasminogen activator inhibitor-1; FGF, fibroblast growth factor.83

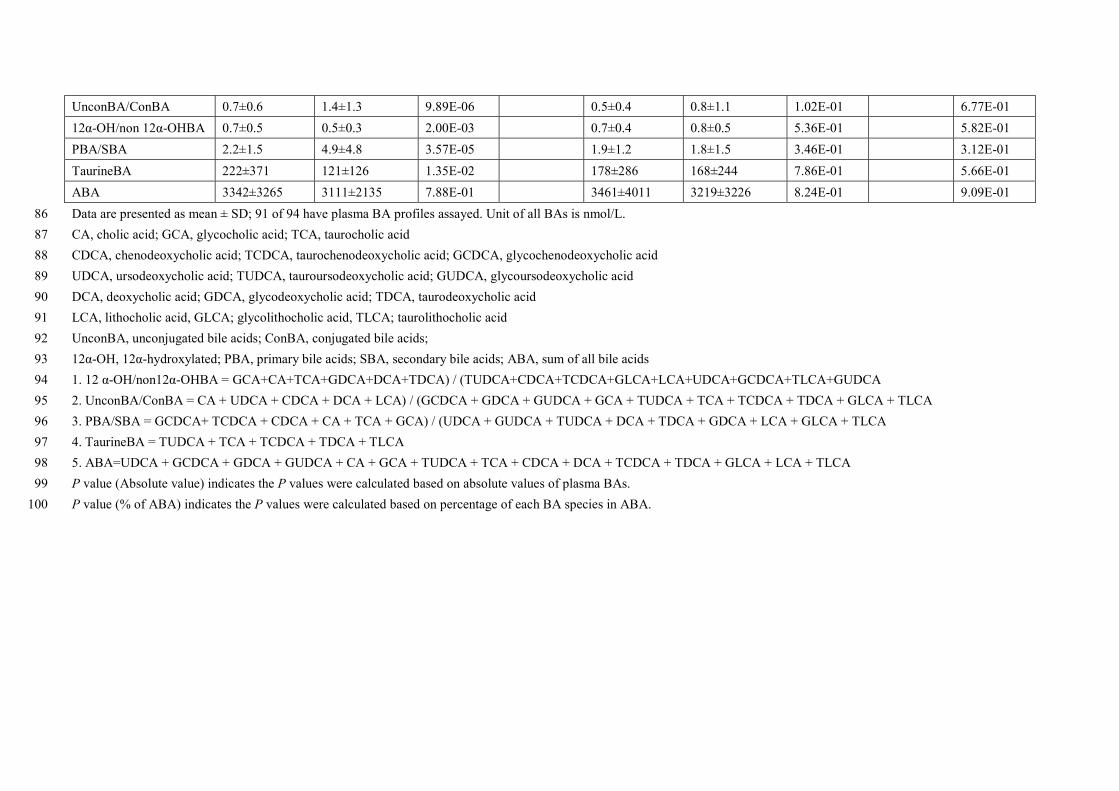
Supplementary Table 3 Plasma bile acid pre-and post-treatment in both treatment arms 84
85
Plasma bile
acid (nmol/L)
Acarbose Glipizide Acarbose
pre vs.
Glipizide
pre
Pre-Treatment Post-Treatment P value
(Absolute
value)
P value (%
of ABA)
Pre-Treatment Post-Treatment P value
(Absolute
value)
P value
(% of ABA)
P value
(Absolute
value)
Primary BAs
CA 100±133 211±258 2.00E-03 0.002 134±268 119±200 5.69E-01 7.29E-01 5.50E-01
CDCA 297±328 680±550 3.20E-05 4.20E-08 290±396 396±870 8.24E-01 2.23E-01 5.93E-01
GCA 366±629 249±432 4.00E-03 9.01E-05 401±781 329±617 1.87E-01 2.18E-01 6.24E-01
TCA 40±86 22±45 1.00E-03 2.56E-04 34±76 32±71 9.80E-01 2.48E-01 2.48E-01
TCDCA 119±187 76±77 1.59E-01 8.59E-04 92±145 89±140 6.75E-01 8.24E-01 5.06E-01
GCDCA 1124±1263 959±992 2.87E-01 4.20E-03 1156±1568 1001±1341 3.33E-01 2.18E-02 9.02E-01
Secondary BAs
UDCA 179±282 256±346 1.29E-01 0.407 234±336 245±395 2.38E-01 8.14E-01 9.53E-01
TUDCA 16±27 8±8 3.30E-02 2.94E-04 14±25 9±13 2.96E-01 5.60E-01 4.57E-01
GUDCA 112±135 87±93 2.87E-01 0.061 126±175 96±110 2.63E-01 3.78E-01 8.71E-01
DCA 184±191 142±166 2.30E-01 0.039 198±219 183±160 7.22E-01 9.61E-01 9.46E-01
LCA 18±20 13±13 5.50E-02 0.234 15±12 16±11 7.10E-01 4.13E-01 9.84E-01
TDCA 38±75 13±15 7.91E-04 3.07E-04 29±52 31±39 6.82E-01 1.28E-01 8.21E-01
GDCA 468±806 175±292 2.00E-03 5.17E-05 470±907 421±575 9.95E-01 4.08E-01 7.65E-01
GLCA 8±13 5±5 3.01E-01 0.448 12±27 10±15 9.02E-01 5.44E-01 2.36E-01
TLCA 8±17 4±4 7.80E-02 0.080 7±11 7±7 6.56E-01 8.24E-01 5.99E-01
BA index
UnconBA/ConBA 0.7±0.6 1.4±1.3 9.89E-06 0.5±0.4 0.8±1.1 1.02E-01 6.77E-01
12α-OH/non 12α-OHBA 0.7±0.5 0.5±0.3 2.00E-03 0.7±0.4 0.8±0.5 5.36E-01 5.82E-01
PBA/SBA 2.2±1.5 4.9±4.8 3.57E-05 1.9±1.2 1.8±1.5 3.46E-01 3.12E-01
TaurineBA 222±371 121±126 1.35E-02 178±286 168±244 7.86E-01 5.66E-01
ABA 3342±3265 3111±2135 7.88E-01 3461±4011 3219±3226 8.24E-01 9.09E-01
Data are presented as mean ± SD; 91 of 94 have plasma BA profiles assayed. Unit of all BAs is nmol/L. 86
CA, cholic acid; GCA, glycocholic acid; TCA, taurocholic acid 87
CDCA, chenodeoxycholic acid; TCDCA, taurochenodeoxycholic acid; GCDCA, glycochenodeoxycholic acid 88
UDCA, ursodeoxycholic acid; TUDCA, tauroursodeoxycholic acid; GUDCA, glycoursodeoxycholic acid 89
DCA, deoxycholic acid; GDCA, glycodeoxycholic acid; TDCA, taurodeoxycholic acid 90
LCA, lithocholic acid, GLCA; glycolithocholic acid, TLCA; taurolithocholic acid 91
UnconBA, unconjugated bile acids; ConBA, conjugated bile acids; 92
12α-OH, 12α-hydroxylated; PBA, primary bile acids; SBA, secondary bile acids; ABA, sum of all bile acids 93
1. 12 α-OH/non12α-OHBA = GCA+CA+TCA+GDCA+DCA+TDCA) / (TUDCA+CDCA+TCDCA+GLCA+LCA+UDCA+GCDCA+TLCA+GUDCA 94
2. UnconBA/ConBA = CA + UDCA + CDCA + DCA + LCA) / (GCDCA + GDCA + GUDCA + GCA + TUDCA + TCA + TCDCA + TDCA + GLCA + TLCA 95
3. PBA/SBA = GCDCA+ TCDCA + CDCA + CA + TCA + GCA) / (UDCA + GUDCA + TUDCA + DCA + TDCA + GDCA + LCA + GLCA + TLCA 96
4. TaurineBA = TUDCA + TCA + TCDCA + TDCA + TLCA 97
5. ABA=UDCA + GCDCA + GDCA + GUDCA + CA + GCA + TUDCA + TCA + CDCA + DCA + TCDCA + TDCA + GLCA + LCA + TLCA 98
P value (Absolute value) indicates the P values were calculated based on absolute values of plasma BAs. 99
P value (% of ABA) indicates the P values were calculated based on percentage of each BA species in ABA. 100
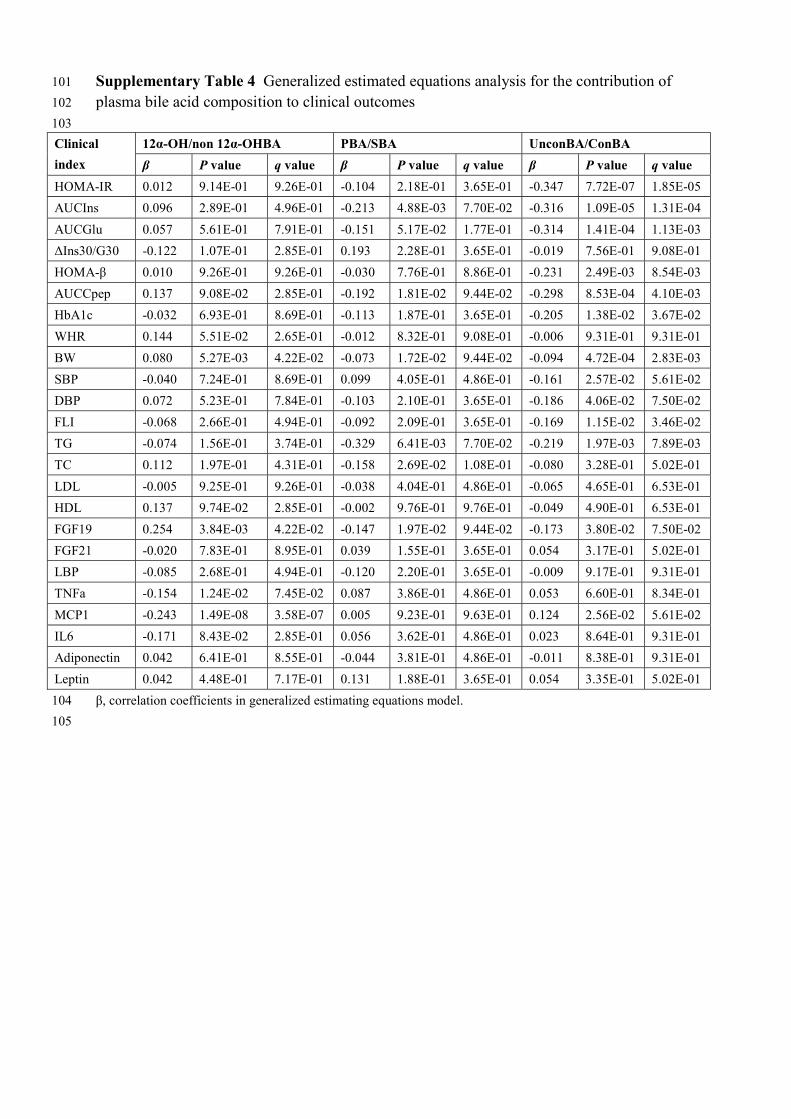
Supplementary Table 4 Generalized estimated equations analysis for the contribution of 101
plasma bile acid composition to clinical outcomes 102
103
Clinical
index
12α-OH/non 12α-OHBA PBA/SBA UnconBA/ConBA
β P value q value β P value q value β P value q value
HOMA-IR 0.012 9.14E-01 9.26E-01 -0.104 2.18E-01 3.65E-01 -0.347 7.72E-07 1.85E-05
AUCIns 0.096 2.89E-01 4.96E-01 -0.213 4.88E-03 7.70E-02 -0.316 1.09E-05 1.31E-04
AUCGlu 0.057 5.61E-01 7.91E-01 -0.151 5.17E-02 1.77E-01 -0.314 1.41E-04 1.13E-03
ΔIns30/G30 -0.122 1.07E-01 2.85E-01 0.193 2.28E-01 3.65E-01 -0.019 7.56E-01 9.08E-01
HOMA-β 0.010 9.26E-01 9.26E-01 -0.030 7.76E-01 8.86E-01 -0.231 2.49E-03 8.54E-03
AUCCpep 0.137 9.08E-02 2.85E-01 -0.192 1.81E-02 9.44E-02 -0.298 8.53E-04 4.10E-03
HbA1c -0.032 6.93E-01 8.69E-01 -0.113 1.87E-01 3.65E-01 -0.205 1.38E-02 3.67E-02
WHR 0.144 5.51E-02 2.65E-01 -0.012 8.32E-01 9.08E-01 -0.006 9.31E-01 9.31E-01
BW 0.080 5.27E-03 4.22E-02 -0.073 1.72E-02 9.44E-02 -0.094 4.72E-04 2.83E-03
SBP -0.040 7.24E-01 8.69E-01 0.099 4.05E-01 4.86E-01 -0.161 2.57E-02 5.61E-02
DBP 0.072 5.23E-01 7.84E-01 -0.103 2.10E-01 3.65E-01 -0.186 4.06E-02 7.50E-02
FLI -0.068 2.66E-01 4.94E-01 -0.092 2.09E-01 3.65E-01 -0.169 1.15E-02 3.46E-02
TG -0.074 1.56E-01 3.74E-01 -0.329 6.41E-03 7.70E-02 -0.219 1.97E-03 7.89E-03
TC 0.112 1.97E-01 4.31E-01 -0.158 2.69E-02 1.08E-01 -0.080 3.28E-01 5.02E-01
LDL -0.005 9.25E-01 9.26E-01 -0.038 4.04E-01 4.86E-01 -0.065 4.65E-01 6.53E-01
HDL 0.137 9.74E-02 2.85E-01 -0.002 9.76E-01 9.76E-01 -0.049 4.90E-01 6.53E-01
FGF19 0.254 3.84E-03 4.22E-02 -0.147 1.97E-02 9.44E-02 -0.173 3.80E-02 7.50E-02
FGF21 -0.020 7.83E-01 8.95E-01 0.039 1.55E-01 3.65E-01 0.054 3.17E-01 5.02E-01
LBP -0.085 2.68E-01 4.94E-01 -0.120 2.20E-01 3.65E-01 -0.009 9.17E-01 9.31E-01
TNFa -0.154 1.24E-02 7.45E-02 0.087 3.86E-01 4.86E-01 0.053 6.60E-01 8.34E-01
MCP1 -0.243 1.49E-08 3.58E-07 0.005 9.23E-01 9.63E-01 0.124 2.56E-02 5.61E-02
IL6 -0.171 8.43E-02 2.85E-01 0.056 3.62E-01 4.86E-01 0.023 8.64E-01 9.31E-01
Adiponectin 0.042 6.41E-01 8.55E-01 -0.044 3.81E-01 4.86E-01 -0.011 8.38E-01 9.31E-01
Leptin 0.042 4.48E-01 7.17E-01 0.131 1.88E-01 3.65E-01 0.054 3.35E-01 5.02E-01
β, correlation coefficients in generalized estimating equations model. 104
105
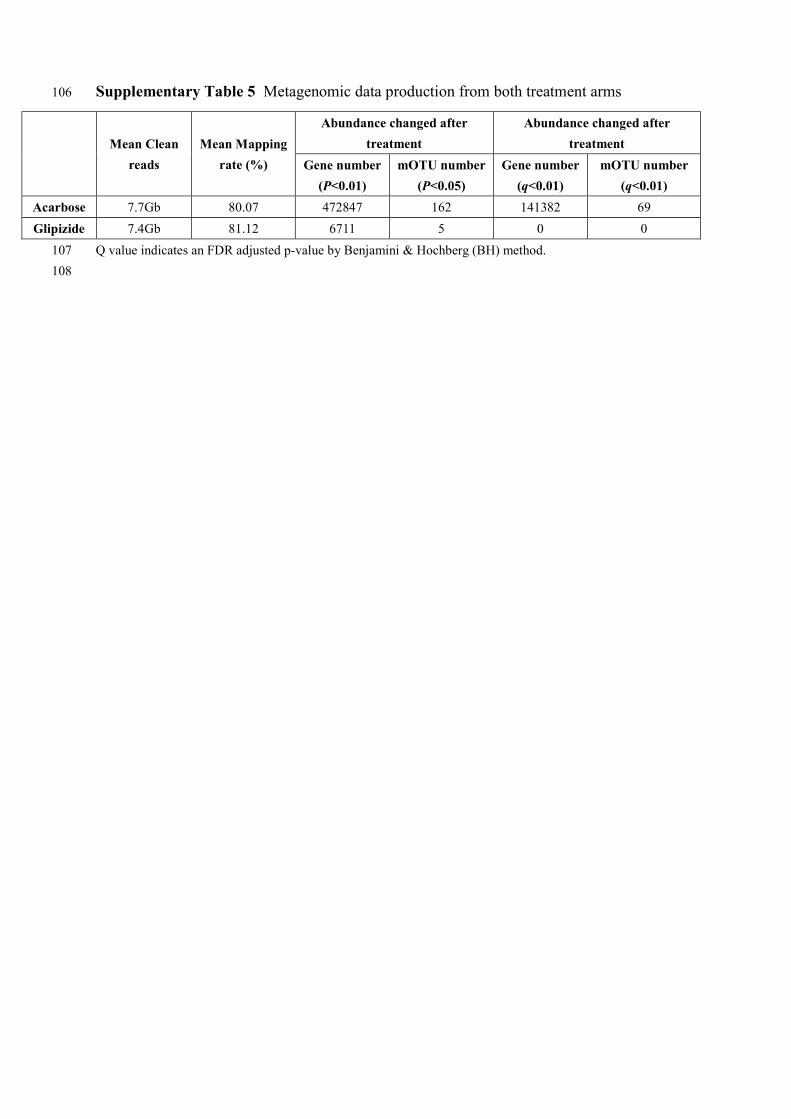
Supplementary Table 5 Metagenomic data production from both treatment arms 106
Mean Clean
reads
Mean Mapping
rate (%)
Abundance changed after
treatment
Abundance changed after
treatment
Gene number
(P<0.01)
mOTU number
(P<0.05)
Gene number
(q<0.01)
mOTU number
(q<0.01)
Acarbose 7.7Gb 80.07 472847 162 141382 69
Glipizide 7.4Gb 81.12 6711 5 0 0
Q value indicates an FDR adjusted p-value by Benjamini & Hochberg (BH) method. 107
108

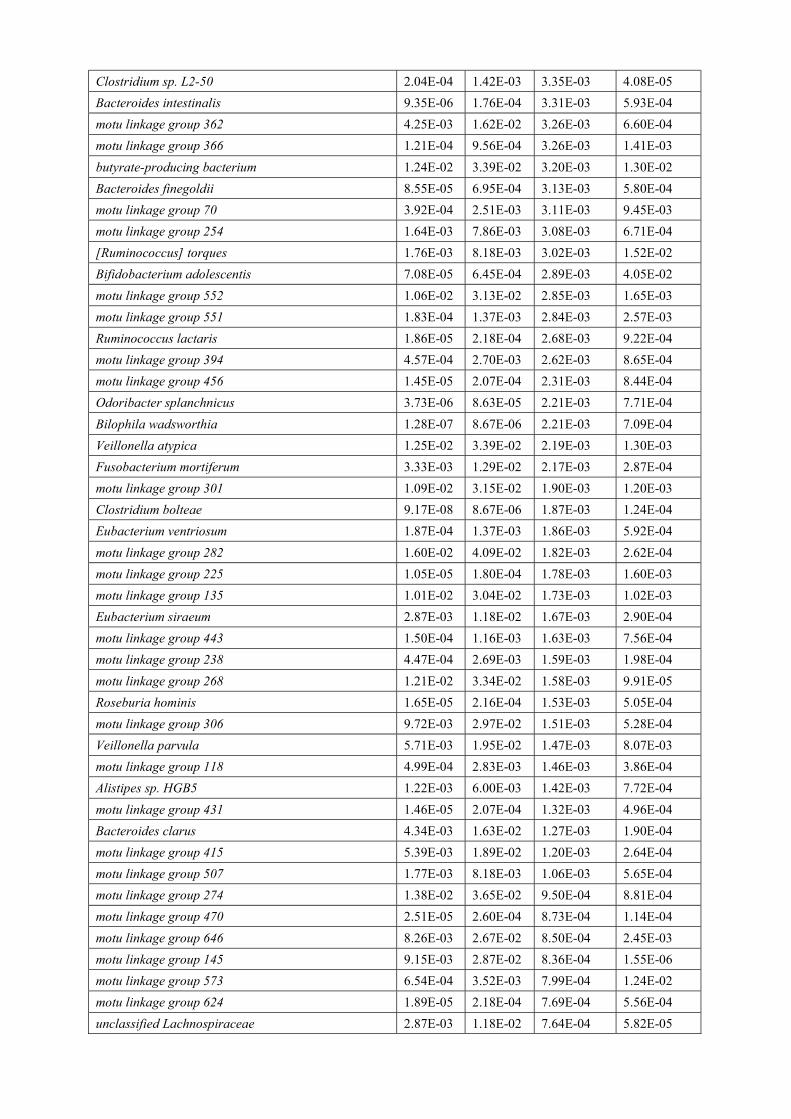
Supplementary Table 6 List of mOTUs that changed in relative abundance in response to 109
treatment in the Acarbose and the Glipizide arms (P<0.05) 110
111
Acarbose
mOTU ID P value q value Relative Abundance
Pre Post
Prevotella copri 8.17E-03 2.67E-02 1.03E-01 1.34E-01
Bacteroides dorei/vulgatus 2.35E-07 1.01E-05 8.30E-02 3.50E-02
Bacteroides plebeius 2.21E-03 9.79E-03 5.45E-02 2.97E-02
Bacteroides uniformis 2.02E-04 1.42E-03 3.34E-02 1.65E-02
Alistipes putredinis 2.35E-07 1.01E-05 2.25E-02 7.08E-03
Bacteroides stercoris 8.48E-05 6.95E-04 2.25E-02 8.74E-03
motu linkage group 158 3.20E-06 8.03E-05 2.10E-02 3.01E-03
Eubacterium eligens 4.34E-04 2.67E-03 1.92E-02 7.48E-03
motu linkage group 284 7.96E-09 2.40E-06 1.42E-02 1.92E-03
motu linkage group 115 1.18E-02 3.30E-02 1.26E-02 9.85E-03
Parabacteroides distasonis 1.08E-02 3.15E-02 1.22E-02 1.73E-02
Bacteroides thetaiotaomicron 1.73E-05 2.16E-04 1.16E-02 3.19E-03
motu linkage group 104 2.02E-02 4.94E-02 1.13E-02 2.40E-02
motu linkage group 325 1.23E-06 3.69E-05 1.10E-02 5.27E-04
Bacteroides xylanisolvens 1.95E-02 4.81E-02 1.02E-02 6.07E-03
motu linkage group 536 1.27E-02 3.42E-02 9.70E-03 4.09E-03
motu linkage group 260 6.92E-03 2.30E-02 9.40E-03 2.14E-03
Roseburia inulinivorans 1.52E-05 2.07E-04 9.25E-03 3.09E-03
motu linkage group 134 2.33E-03 1.00E-02 9.05E-03 2.19E-03
motu linkage group 290 1.14E-02 3.24E-02 7.95E-03 3.31E-03
motu linkage group 258 8.54E-06 1.71E-04 7.94E-03 2.09E-03
motu linkage group 206 1.44E-07 8.67E-06 6.90E-03 7.53E-04
Streptococcus salivarius 6.38E-06 1.37E-04 6.43E-03 1.32E-02
motu linkage group 490 2.75E-04 1.88E-03 6.39E-03 3.66E-03
motu linkage group 131 9.58E-04 5.06E-03 6.34E-03 3.49E-03
Bifidobacterium catenulatum-Bifidobacterium
pseudocatenulatum complex
1.46E-05 2.07E-04 6.24E-03 3.11E-02
motu linkage group 316 4.79E-04 2.77E-03 6.05E-03 1.92E-02
Ruminococcus sp. 5 1 39BFAA 5.29E-04 2.95E-03 5.62E-03 3.18E-03
Roseburia intestinalis 2.24E-05 2.41E-04 5.24E-03 3.45E-04
Alistipes shahii 5.13E-03 1.82E-02 4.78E-03 3.42E-03
Collinsella aerofaciens 7.29E-05 6.45E-04 4.72E-03 1.43E-02
Bifidobacterium longum 5.38E-07 2.02E-05 4.49E-03 5.35E-02
Bacteroides caccae 3.09E-03 1.26E-02 4.06E-03 1.96E-03
motu linkage group 349 2.05E-08 3.09E-06 3.89E-03 9.57E-04
motu linkage group 265 5.52E-03 1.91E-02 3.79E-03 1.31E-03
motu linkage group 471 3.33E-03 1.29E-02 3.62E-03 1.17E-03
motu linkage group 520 2.04E-03 9.29E-03 3.43E-03 1.70E-03
Capnocytophaga sp. oral taxon 329 6.97E-03 2.30E-02 3.41E-03 1.25E-03
Clostridium sp. L2-50 2.04E-04 1.42E-03 3.35E-03 4.08E-05
Bacteroides intestinalis 9.35E-06 1.76E-04 3.31E-03 5.93E-04
motu linkage group 362 4.25E-03 1.62E-02 3.26E-03 6.60E-04
motu linkage group 366 1.21E-04 9.56E-04 3.26E-03 1.41E-03
butyrate-producing bacterium 1.24E-02 3.39E-02 3.20E-03 1.30E-02
Bacteroides finegoldii 8.55E-05 6.95E-04 3.13E-03 5.80E-04
motu linkage group 70 3.92E-04 2.51E-03 3.11E-03 9.45E-03
motu linkage group 254 1.64E-03 7.86E-03 3.08E-03 6.71E-04
[Ruminococcus] torques 1.76E-03 8.18E-03 3.02E-03 1.52E-02
Bifidobacterium adolescentis 7.08E-05 6.45E-04 2.89E-03 4.05E-02
motu linkage group 552 1.06E-02 3.13E-02 2.85E-03 1.65E-03
motu linkage group 551 1.83E-04 1.37E-03 2.84E-03 2.57E-03
Ruminococcus lactaris 1.86E-05 2.18E-04 2.68E-03 9.22E-04
motu linkage group 394 4.57E-04 2.70E-03 2.62E-03 8.65E-04
motu linkage group 456 1.45E-05 2.07E-04 2.31E-03 8.44E-04
Odoribacter splanchnicus 3.73E-06 8.63E-05 2.21E-03 7.71E-04
Bilophila wadsworthia 1.28E-07 8.67E-06 2.21E-03 7.09E-04
Veillonella atypica 1.25E-02 3.39E-02 2.19E-03 1.30E-03
Fusobacterium mortiferum 3.33E-03 1.29E-02 2.17E-03 2.87E-04
motu linkage group 301 1.09E-02 3.15E-02 1.90E-03 1.20E-03
Clostridium bolteae 9.17E-08 8.67E-06 1.87E-03 1.24E-04
Eubacterium ventriosum 1.87E-04 1.37E-03 1.86E-03 5.92E-04
motu linkage group 282 1.60E-02 4.09E-02 1.82E-03 2.62E-04
motu linkage group 225 1.05E-05 1.80E-04 1.78E-03 1.60E-03
motu linkage group 135 1.01E-02 3.04E-02 1.73E-03 1.02E-03
Eubacterium siraeum 2.87E-03 1.18E-02 1.67E-03 2.90E-04
motu linkage group 443 1.50E-04 1.16E-03 1.63E-03 7.56E-04
motu linkage group 238 4.47E-04 2.69E-03 1.59E-03 1.98E-04
motu linkage group 268 1.21E-02 3.34E-02 1.58E-03 9.91E-05
Roseburia hominis 1.65E-05 2.16E-04 1.53E-03 5.05E-04
motu linkage group 306 9.72E-03 2.97E-02 1.51E-03 5.28E-04
Veillonella parvula 5.71E-03 1.95E-02 1.47E-03 8.07E-03
motu linkage group 118 4.99E-04 2.83E-03 1.46E-03 3.86E-04
Alistipes sp. HGB5 1.22E-03 6.00E-03 1.42E-03 7.72E-04
motu linkage group 431 1.46E-05 2.07E-04 1.32E-03 4.96E-04
Bacteroides clarus 4.34E-03 1.63E-02 1.27E-03 1.90E-04
motu linkage group 415 5.39E-03 1.89E-02 1.20E-03 2.64E-04
motu linkage group 507 1.77E-03 8.18E-03 1.06E-03 5.65E-04
motu linkage group 274 1.38E-02 3.65E-02 9.50E-04 8.81E-04
motu linkage group 470 2.51E-05 2.60E-04 8.73E-04 1.14E-04
motu linkage group 646 8.26E-03 2.67E-02 8.50E-04 2.45E-03
motu linkage group 145 9.15E-03 2.87E-02 8.36E-04 1.55E-06
motu linkage group 573 6.54E-04 3.52E-03 7.99E-04 1.24E-02
motu linkage group 624 1.89E-05 2.18E-04 7.69E-04 5.56E-04
unclassified Lachnospiraceae 2.87E-03 1.18E-02 7.64E-04 5.82E-05

motu linkage group 651 1.40E-02 3.68E-02 6.62E-04 3.25E-04
Blautia hansenii 3.17E-03 1.27E-02 6.02E-04 9.63E-05
Megasphaera elsdenii 3.21E-04 2.10E-03 5.49E-04 2.61E-03
motu linkage group 600 3.22E-03 1.27E-02 5.09E-04 5.72E-05
motu linkage group 495 1.09E-03 5.50E-03 4.64E-04 1.47E-04
motu linkage group 497 6.25E-03 2.11E-02 4.61E-04 3.16E-04
motu linkage group 586 2.89E-05 2.90E-04 4.55E-04 4.09E-05
motu linkage group 491 9.09E-03 2.87E-02 4.48E-04 3.13E-04
Streptococcus vestibularis 1.08E-05 1.80E-04 4.15E-04 8.84E-04
motu linkage group 517 3.16E-04 2.10E-03 4.13E-04 1.77E-05
Enterobacter hormaechei/cloacae 1.62E-02 4.10E-02 3.95E-04 1.09E-05
motu linkage group 672 9.76E-03 2.97E-02 3.71E-04 2.02E-05
Streptococcus thermophilus 2.09E-05 2.33E-04 3.43E-04 9.39E-04
Eggerthella lenta 1.45E-06 3.97E-05 3.28E-04 8.81E-05
Streptococcus sp. C150 4.32E-04 2.67E-03 2.79E-04 2.98E-04
Lachnospiraceae bacterium 1 4 56FAA 6.83E-05 6.42E-04 2.67E-04 3.14E-05
Clostridium leptum 2.25E-03 9.83E-03 2.48E-04 1.03E-04
Holdemania filiformis 7.30E-07 2.44E-05 2.38E-04 5.38E-05
Anaerotruncus colihominis 4.08E-05 3.96E-04 2.20E-04 3.67E-05
Pseudoflavonifractor capillosus 7.99E-05 6.87E-04 1.79E-04 5.14E-05
Oxalobacter formigenes 4.82E-03 1.77E-02 1.75E-04 3.61E-05
motu linkage group 771 9.15E-03 2.87E-02 1.62E-04 1.44E-06
motu linkage group 696 1.13E-02 3.23E-02 1.53E-04 8.83E-05
Bifidobacterium breve 1.45E-02 3.73E-02 1.40E-04 2.60E-03
Eubacterium dolichum 2.53E-03 1.07E-02 1.35E-04 2.18E-06
Lactobacillus gasseri 5.80E-04 3.17E-03 1.07E-04 3.23E-03
Streptococcus infantis 4.82E-03 1.77E-02 9.30E-05 1.54E-04
Clostridium spiroforme 1.05E-02 3.13E-02 9.29E-05 4.59E-05
motu linkage group 691 1.15E-02 3.25E-02 9.06E-05 1.92E-05
Ruminococcaceae bacterium D16 1.32E-02 3.51E-02 8.77E-05 4.59E-05
Clostridium scindens 1.41E-03 6.86E-03 8.51E-05 2.71E-05
Streptococcus pneumoniae 1.83E-02 4.55E-02 7.51E-05 1.45E-04
Lactobacillus amylovorus 9.72E-03 2.97E-02 7.35E-05 1.26E-02
Acidaminococcus fermentans 1.78E-02 4.47E-02 6.23E-05 5.00E-04
Bifidobacterium dentium 5.14E-03 1.82E-02 5.83E-05 4.51E-04
Lactobacillus oris 2.11E-03 9.46E-03 4.40E-06 1.36E-03
Lactobacillus salivarius 1.10E-03 5.50E-03 4.36E-06 2.39E-03
Streptococcus sp. M143 1.45E-02 3.73E-02 1.65E-06 1.82E-05
Lactobacillus crispatus 5.10E-03 1.82E-02 9.42E-07 6.58E-04
Lactobacillus rhamnosus 1.10E-03 5.50E-03 0 2.36E-03
Glipizide
mOTU ID P value q value Relative Abundance
Pre Post
Bacteroides eggerthii 3.82E-02 9.70E-01 1.56E-02 9.04E-03
Megasphaera elsdenii 1.43E-02 9.70E-01 6.43E-04 2.93E-04
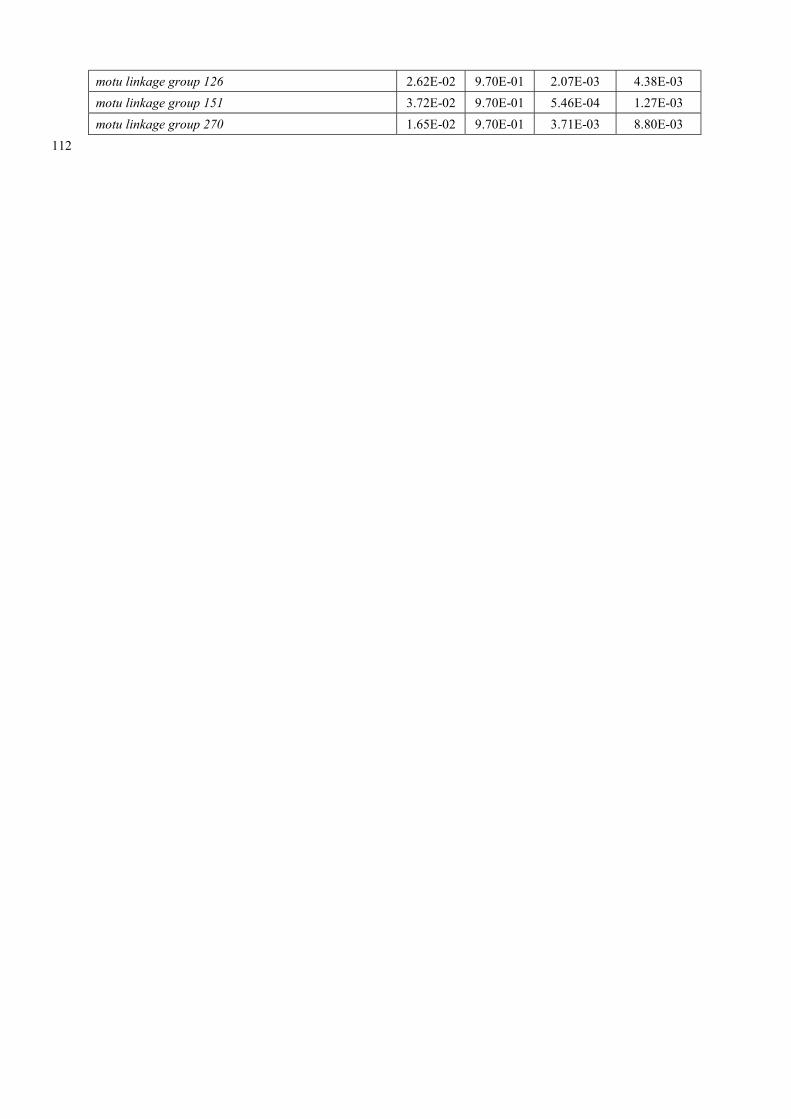
motu linkage group 126 2.62E-02 9.70E-01 2.07E-03 4.38E-03
motu linkage group 151 3.72E-02 9.70E-01 5.46E-04 1.27E-03
motu linkage group 270 1.65E-02 9.70E-01 3.71E-03 8.80E-03
112

Supplementary Table 7 PERMANOVA analysis of microbial genes and plasma BA species 113
114
Bile Acid Sample
Number
df SumsOfSqs MeanSqs F.Model R2 Pr(>F) q value
UDCA 91 1 1.076 1.076 3.460 0.037 1.00E-04 5.00E-04
GUDCA 91 1 0.887 0.887 2.833 0.031 1.00E-04 5.00E-04
LCA 91 1 0.843 0.843 2.688 0.029 1.00E-04 5.00E-04
DCA 91 1 0.923 0.923 2.952 0.032 2.00E-04 7.50E-04
GLCA 91 1 0.544 0.544 1.715 0.019 6.90E-03 2.07E-02
TUDCA 91 1 0.497 0.497 1.565 0.017 2.14E-02 4.71E-02
CDCA 91 1 0.500 0.500 1.574 0.017 2.20E-02 4.71E-02
GCA 91 1 0.248 0.248 0.774 0.009 8.99E-01 9.76E-01
TCDCA 91 1 0.236 0.236 0.736 0.008 9.44E-01 9.76E-01
GDCA 91 1 0.431 0.431 1.355 0.015 6.96E-02 1.31E-01
TCA 91 1 0.224 0.224 0.700 0.008 9.76E-01 9.76E-01
TLCA 91 1 0.386 0.386 1.210 0.013 1.47E-01 2.45E-01
TDCA 91 1 0.310 0.310 0.970 0.011 4.86E-01 7.28E-01
GCDCA 91 1 0.281 0.281 0.877 0.010 6.91E-01 9.42E-01
CA 91 1 0.269 0.269 0.839 0.009 7.69E-01 9.62E-01
CA, cholic acid; GCA, glycocholic acid; TCA, taurocholic acid 115
CDCA, chenodeoxycholic acid; TCDCA, taurochenodeoxycholic acid; GCDCA, glycochenodeoxycholic acid 116
UDCA, ursodeoxycholic acid; TUDCA, tauroursodeoxycholic acid; GUDCA, glycoursodeoxycholic acid 117
DCA, deoxycholic acid; GDCA, glycodeoxycholic acid; TDCA, taurodeoxycholic acid 118
LCA, lithocholic acid; GLCA, glycolithocholic acid; TLCA; taurolithocholic acid 119
120
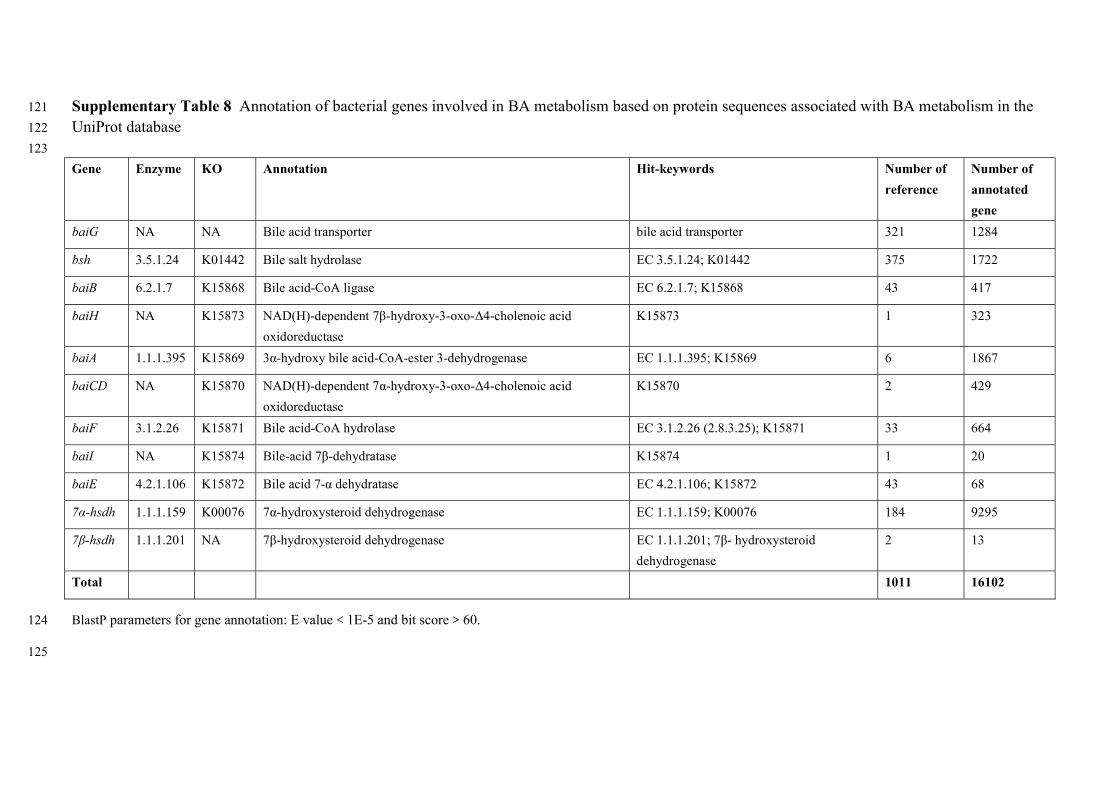
Supplementary Table 8 Annotation of bacterial genes involved in BA metabolism based on protein sequences associated with BA metabolism in the 121
UniProt database 122
123
Gene Enzyme KO Annotation Hit-keywords Number of
reference
Number of
annotated
gene
baiG NA NA Bile acid transporter bile acid transporter 321 1284
bsh 3.5.1.24 K01442 Bile salt hydrolase EC 3.5.1.24; K01442 375 1722
baiB 6.2.1.7 K15868 Bile acid-CoA ligase EC 6.2.1.7; K15868 43 417
baiH NA K15873 NAD(H)-dependent 7β-hydroxy-3-oxo-Δ4-cholenoic acid
oxidoreductase
K15873 1 323
baiA 1.1.1.395 K15869 3α-hydroxy bile acid-CoA-ester 3-dehydrogenase EC 1.1.1.395; K15869 6 1867
baiCD NA K15870 NAD(H)-dependent 7α-hydroxy-3-oxo-Δ4-cholenoic acid
oxidoreductase
K15870 2 429
baiF 3.1.2.26 K15871 Bile acid-CoA hydrolase EC 3.1.2.26 (2.8.3.25); K15871 33 664
baiI NA K15874 Bile-acid 7β-dehydratase K15874 1 20
baiE 4.2.1.106 K15872 Bile acid 7-α dehydratase EC 4.2.1.106; K15872 43 68
7α-hsdh 1.1.1.159 K00076 7α-hydroxysteroid dehydrogenase EC 1.1.1.159; K00076 184 9295
7β-hsdh 1.1.1.201 NA 7β-hydroxysteroid dehydrogenase EC 1.1.1.201; 7β- hydroxysteroid
dehydrogenase
2 13
Total 1011 16102
BlastP parameters for gene annotation: E value<1E-5 and bit score>60. 124
125
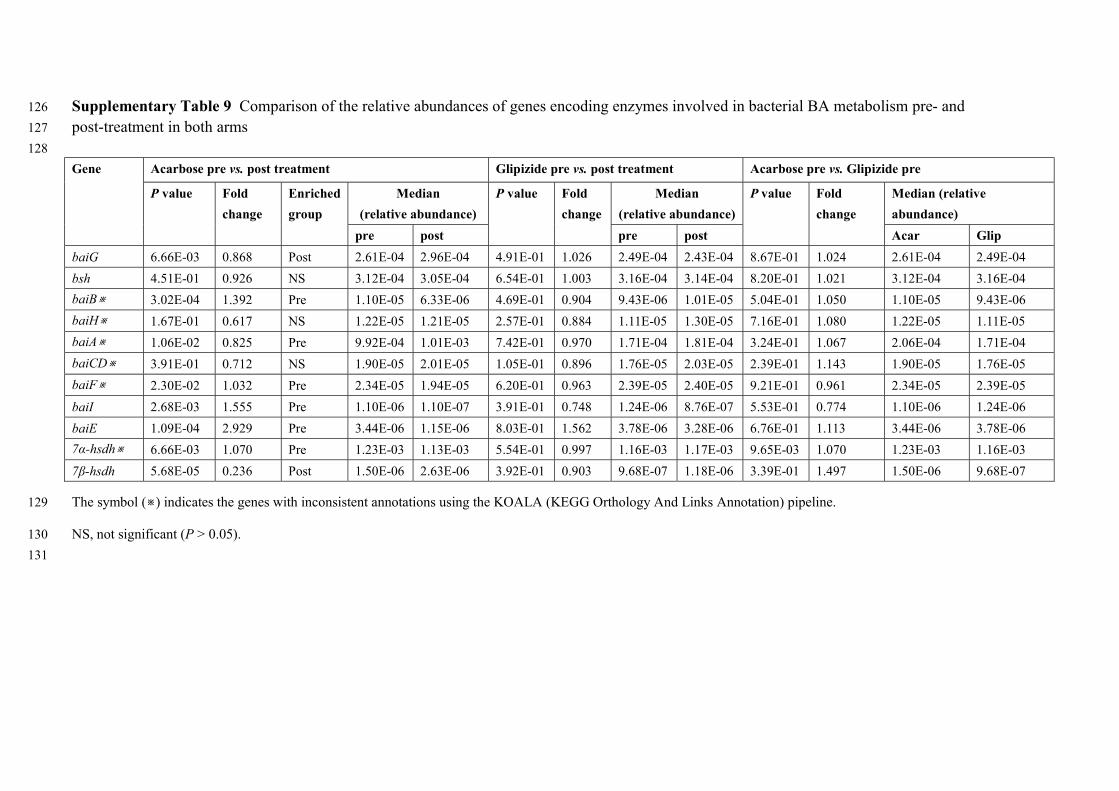
Supplementary Table 9 Comparison of the relative abundances of genes encoding enzymes involved in bacterial BA metabolism pre- and 126
post-treatment in both arms 127
128
Gene Acarbose pre vs. post treatment Glipizide pre vs. post treatment Acarbose pre vs. Glipizide pre
P value Fold
change
Enriched
group
Median
(relative abundance)
P value Fold
change
Median
(relative abundance)
P value Fold
change
Median (relative
abundance)
pre post pre post Acar Glip
baiG 6.66E-03 0.868 Post 2.61E-04 2.96E-04 4.91E-01 1.026 2.49E-04 2.43E-04 8.67E-01 1.024 2.61E-04 2.49E-04
bsh 4.51E-01 0.926 NS 3.12E-04 3.05E-04 6.54E-01 1.003 3.16E-04 3.14E-04 8.20E-01 1.021 3.12E-04 3.16E-04
baiB※ 3.02E-04 1.392 Pre 1.10E-05 6.33E-06 4.69E-01 0.904 9.43E-06 1.01E-05 5.04E-01 1.050 1.10E-05 9.43E-06
baiH※ 1.67E-01 0.617 NS 1.22E-05 1.21E-05 2.57E-01 0.884 1.11E-05 1.30E-05 7.16E-01 1.080 1.22E-05 1.11E-05
baiA※ 1.06E-02 0.825 Pre 9.92E-04 1.01E-03 7.42E-01 0.970 1.71E-04 1.81E-04 3.24E-01 1.067 2.06E-04 1.71E-04
baiCD※ 3.91E-01 0.712 NS 1.90E-05 2.01E-05 1.05E-01 0.896 1.76E-05 2.03E-05 2.39E-01 1.143 1.90E-05 1.76E-05
baiF※ 2.30E-02 1.032 Pre 2.34E-05 1.94E-05 6.20E-01 0.963 2.39E-05 2.40E-05 9.21E-01 0.961 2.34E-05 2.39E-05
baiI 2.68E-03 1.555 Pre 1.10E-06 1.10E-07 3.91E-01 0.748 1.24E-06 8.76E-07 5.53E-01 0.774 1.10E-06 1.24E-06
baiE 1.09E-04 2.929 Pre 3.44E-06 1.15E-06 8.03E-01 1.562 3.78E-06 3.28E-06 6.76E-01 1.113 3.44E-06 3.78E-06
7α-hsdh※ 6.66E-03 1.070 Pre 1.23E-03 1.13E-03 5.54E-01 0.997 1.16E-03 1.17E-03 9.65E-03 1.070 1.23E-03 1.16E-03
7β-hsdh 5.68E-05 0.236 Post 1.50E-06 2.63E-06 3.92E-01 0.903 9.68E-07 1.18E-06 3.39E-01 1.497 1.50E-06 9.68E-07
The symbol (※) indicates the genes with inconsistent annotations using the KOALA (KEGG Orthology And Links Annotation) pipeline. 129
NS, not significant (P > 0.05). 130
131

Supplementary Table 10 Faecal bile acids pre-and post-treatment in the Acarbose arm 132
133
Faecal bile acid (ng/g) Pre-Treatment Post-Treatment P value
(Absolute value)
Pre-Treatment
(% of ABA)
Post-Treatment
(% of ABA)
P value
(% of ABA)
Primary BAs
CA 781.42±1110.84 752.1±881.29 7.96E-01 9.79±13.34 18.64±20.13 1.33E-03
CDCA 638.36±933.5 603.98±868.9 4.22E-01 8.12±9.79 13.07±12.89 2.97E-04
GCA 18.34±40.24 11.09±6.07 7.98E-02 0.34±0.61 0.42±0.33 4.75E-03
TCA 22.84±43.4 17.24±24.42 5.72E-01 0.37±0.5 0.56±0.46 4.19E-04
TCDCA 21.46±23.62 15.77±6.4 3.75E-01 0.33±0.32 0.3±0.1 4.32E-01
GCDCA 22.73±53.09 13.34±13.77 7.50E-02 0.4±0.79 0.45±0.33 1.48E-02
Secondary BAs
UDCA 1270.29±2079.42 954.03±1644.08 9.64E-01 14.14±18.06 19.26±18.33 3.39E-02
DCA 1553.16±934.29 724.44±787.64 1.47E-05 32.62±16.98 26.04±19.77 1.04E-02
LCA 1333.92±1010.54 539.54±637.42 1.98E-06 28.64±18.58 19.85±20.08 4.05E-03
GDCA 24.38±26.61 15.87±3.59 3.88E-04 0.51±0.45 0.65±0.46 3.31E-02
7KLCA 111.49±156.93 51.33±55.78 2.66E-02 1.33±1.27 1.22±0.95 3.79E-01
12KLCA 259.35±232.37 131.77±149.32 2.14E-04 5.26±3.7 4.53±3.31 1.18E-01
BA index
UnconBA/ConBA 74.18±38.18 62.65±40.97 5.53E-02
12α-OH/non 12α-OHBA 0.80±0.28 0.87±0.45 5.32E-01
PBA/SBA 0.40±0.66 1.46±2.9 5.20E-04
ABA 5962.77±3413.34 3740.42±2527.12 4.19E-05
Data are presented as mean ± SD; 100 samples had faecal BA profile determined. Unit of all BAs is ng/g dry faces 134
7KLCA, 7-ketolithocholic acid; 12KLCA, 12-ketolithocholic acid 135
UnconBA/ConBA = (CA + UDCA + CDCA + DCA + LCA+7KLCA+12KLCA) / (GCDCA + GDCA + GCA + TCA + TCDCA) 136
12 α-OH/non12α-OHBA =(GCA+CA+TCA+GDCA+DCA) / (CDCA+TCDCA+LCA+UDCA+GCDCA+7KLCA+12KLCA) 137
PBA/SBA = (GCDCA+ TCDCA + CDCA + CA + TCA + GCA) / (UDCA + DCA + GDCA + LCA +7KLCA+12KLCA) 138

ABA=GCDCA+ TCDCA + CDCA + CA + TCA + GCA + UDCA + DCA + GDCA + LCA +7KLCA+12KLCA 139
P value (Absolute value) indicates that the P values were calculated based on absolute values of faecal BAs. 140
P value (% of ABA) indicates that the P values were calculated based on percentage of each BA species in ABA. 141
142
143
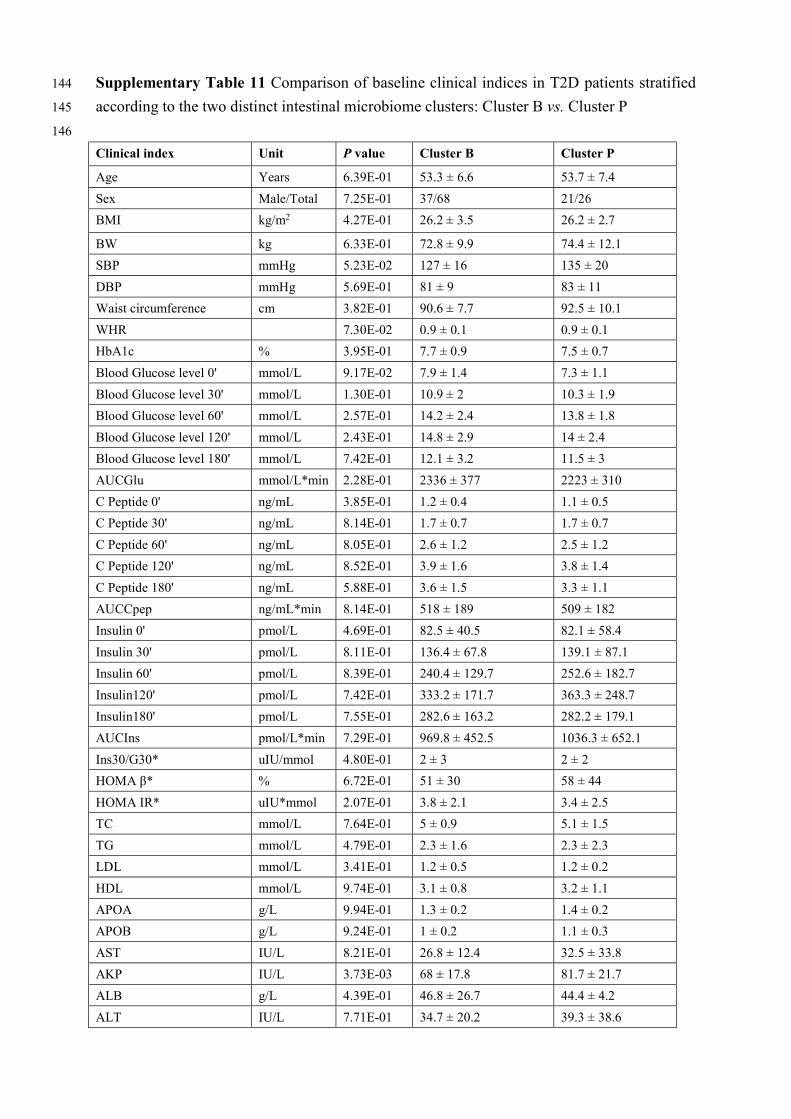
Supplementary Table 11 Comparison of baseline clinical indices in T2D patients stratified 144
according to the two distinct intestinal microbiome clusters: Cluster B vs. Cluster P 145
146
Clinical index Unit P value Cluster B Cluster P
Age Years 6.39E-01 53.3 ± 6.6 53.7 ± 7.4
Sex Male/Total 7.25E-01 37/68 21/26
BMI kg/m2 4.27E-01 26.2 ± 3.5 26.2 ± 2.7
BW kg 6.33E-01 72.8 ± 9.9 74.4 ± 12.1
SBP mmHg 5.23E-02 127 ± 16 135 ± 20
DBP mmHg 5.69E-01 81 ± 9 83 ± 11
Waist circumference cm 3.82E-01 90.6 ± 7.7 92.5 ± 10.1
WHR 7.30E-02 0.9 ± 0.1 0.9 ± 0.1
HbA1c % 3.95E-01 7.7 ± 0.9 7.5 ± 0.7
Blood Glucose level 0' mmol/L 9.17E-02 7.9 ± 1.4 7.3 ± 1.1
Blood Glucose level 30' mmol/L 1.30E-01 10.9 ± 2 10.3 ± 1.9
Blood Glucose level 60' mmol/L 2.57E-01 14.2 ± 2.4 13.8 ± 1.8
Blood Glucose level 120' mmol/L 2.43E-01 14.8 ± 2.9 14 ± 2.4
Blood Glucose level 180' mmol/L 7.42E-01 12.1 ± 3.2 11.5 ± 3
AUCGlu mmol/L*min 2.28E-01 2336 ± 377 2223 ± 310
C Peptide 0' ng/mL 3.85E-01 1.2 ± 0.4 1.1 ± 0.5
C Peptide 30' ng/mL 8.14E-01 1.7 ± 0.7 1.7 ± 0.7
C Peptide 60' ng/mL 8.05E-01 2.6 ± 1.2 2.5 ± 1.2
C Peptide 120' ng/mL 8.52E-01 3.9 ± 1.6 3.8 ± 1.4
C Peptide 180' ng/mL 5.88E-01 3.6 ± 1.5 3.3 ± 1.1
AUCCpep ng/mL*min 8.14E-01 518 ± 189 509 ± 182
Insulin 0' pmol/L 4.69E-01 82.5 ± 40.5 82.1 ± 58.4
Insulin 30' pmol/L 8.11E-01 136.4 ± 67.8 139.1 ± 87.1
Insulin 60' pmol/L 8.39E-01 240.4 ± 129.7 252.6 ± 182.7
Insulin120' pmol/L 7.42E-01 333.2 ± 171.7 363.3 ± 248.7
Insulin180' pmol/L 7.55E-01 282.6 ± 163.2 282.2 ± 179.1
AUCIns pmol/L*min 7.29E-01 969.8 ± 452.5 1036.3 ± 652.1
Ins30/G30* uIU/mmol 4.80E-01 2 ± 3 2 ± 2
HOMA β* % 6.72E-01 51 ± 30 58 ± 44
HOMA IR* uIU*mmol 2.07E-01 3.8 ± 2.1 3.4 ± 2.5
TC mmol/L 7.64E-01 5 ± 0.9 5.1 ± 1.5
TG mmol/L 4.79E-01 2.3 ± 1.6 2.3 ± 2.3
LDL mmol/L 3.41E-01 1.2 ± 0.5 1.2 ± 0.2
HDL mmol/L 9.74E-01 3.1 ± 0.8 3.2 ± 1.1
APOA g/L 9.94E-01 1.3 ± 0.2 1.4 ± 0.2
APOB g/L 9.24E-01 1 ± 0.2 1.1 ± 0.3
AST IU/L 8.21E-01 26.8 ± 12.4 32.5 ± 33.8
AKP IU/L 3.73E-03 68 ± 17.8 81.7 ± 21.7
ALB g/L 4.39E-01 46.8 ± 26.7 44.4 ± 4.2
ALT IU/L 7.71E-01 34.7 ± 20.2 39.3 ± 38.6

γGT IU/L 2.20E-01 38.9 ± 37.5 48.1 ± 54.4
FLI 4.50E-01 284 ± 487 309 ± 435
Uric acid umol/L 3.89E-01 5 ± 1.2 5.2 ± 1
Bun mmol/L 9.38E-01 301.2 ± 73.9 301.3 ± 65.5
creatine umol/L 4.24E-01 66.6 ± 14.8 69.2 ± 12.4
IFNr1 pg/mL 1.82E-01 45.6 ± 42.6 34.8 ± 17.1
IL6 pg/mL 4.44E-02 3 ± 5 3 ± 4
IL8 ng/mL 8.13E-01 17 ± 26 19 ± 25
LPS binding protein ng/mL 1.85E-01 20.6 ± 7.3 18.7 ± 8
MCP1 pg/mL 4.54E-01 244 ± 136 246 ± 78
mpo ng/mL 2.74E-01 386 ± 352 465 ± 363
PAI1 pg/mL 6.36E-01 57833 ± 21243 59240 ± 19940
TNF α pg/mL 2.93E-01 4.6 ± 2.2 5.7 ± 4.5
CRP ug/mL 3.10E-01 12 ± 16 21 ± 49
Endothelin-1 MFI 5.61E-01 12.8 ± 2.7 12.9 ± 3.4
FetuinA ug/mL 7.90E-01 333.8 ± 50.2 332.6 ± 40.5
FGF19 MFI 8.03E-01 23 ± 4.1 23.3 ± 3.8
FGF21 MFI 5.37E-01 138.6 ± 60.8 156 ± 136
FGF23 MFI 1.32E-01 45.9 ± 9.3 42 ± 6.8
Adiponectin pg/mL 6.33E-01 5307140 ± 3052570 6121582 ± 4297114
Leptin pg/mL 7.32E-01 6491 ± 6637 6502 ± 5786
Data are presented as mean ± SD; * the Unit of insulin is converted to uIU/L 147
MFI, mean fluorescence intensity determined by using the Luminex 200™ instrument 148
149
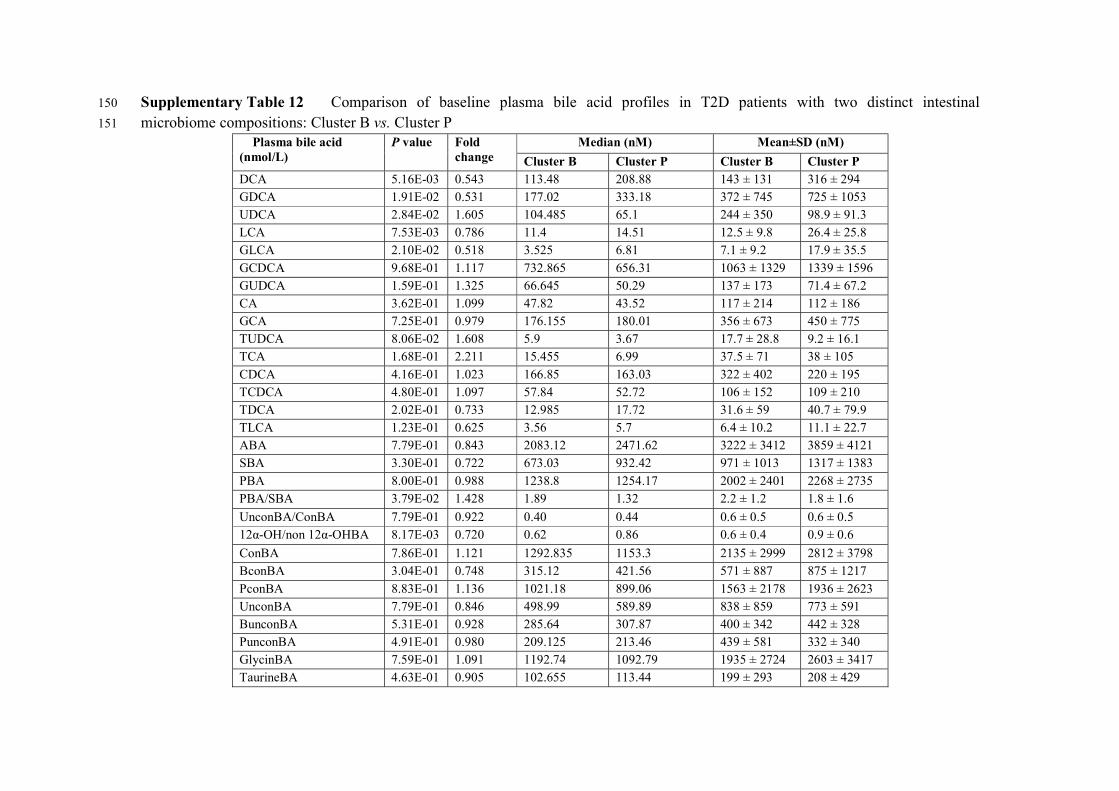
Supplementary Table 12 Comparison of baseline plasma bile acid profiles in T2D patients with two distinct intestinal 150
microbiome compositions: Cluster B vs. Cluster P 151
Plasma bile acid (nmol/L)
P value Fold change
Median (nM) Mean±SD (nM)
Cluster B Cluster P Cluster B Cluster P DCA 5.16E-03 0.543 113.48 208.88 143 ± 131 316 ± 294 GDCA 1.91E-02 0.531 177.02 333.18 372 ± 745 725 ± 1053 UDCA 2.84E-02 1.605 104.485 65.1 244 ± 350 98.9 ± 91.3 LCA 7.53E-03 0.786 11.4 14.51 12.5 ± 9.8 26.4 ± 25.8 GLCA 2.10E-02 0.518 3.525 6.81 7.1 ± 9.2 17.9 ± 35.5
GCDCA 9.68E-01 1.117 732.865 656.31 1063 ± 1329 1339 ± 1596 GUDCA 1.59E-01 1.325 66.645 50.29 137 ± 173 71.4 ± 67.2 CA 3.62E-01 1.099 47.82 43.52 117 ± 214 112 ± 186 GCA 7.25E-01 0.979 176.155 180.01 356 ± 673 450 ± 775 TUDCA 8.06E-02 1.608 5.9 3.67 17.7 ± 28.8 9.2 ± 16.1 TCA 1.68E-01 2.211 15.455 6.99 37.5 ± 71 38 ± 105
CDCA 4.16E-01 1.023 166.85 163.03 322 ± 402 220 ± 195 TCDCA 4.80E-01 1.097 57.84 52.72 106 ± 152 109 ± 210 TDCA 2.02E-01 0.733 12.985 17.72 31.6 ± 59 40.7 ± 79.9 TLCA 1.23E-01 0.625 3.56 5.7 6.4 ± 10.2 11.1 ± 22.7 ABA 7.79E-01 0.843 2083.12 2471.62 3222 ± 3412 3859 ± 4121 SBA 3.30E-01 0.722 673.03 932.42 971 ± 1013 1317 ± 1383
PBA 8.00E-01 0.988 1238.8 1254.17 2002 ± 2401 2268 ± 2735 PBA/SBA 3.79E-02 1.428 1.89 1.32 2.2 ± 1.2 1.8 ± 1.6
UnconBA/ConBA 7.79E-01 0.922 0.40 0.44 0.6 ± 0.5 0.6 ± 0.5 12α-OH/non 12α-OHBA 8.17E-03 0.720 0.62 0.86 0.6 ± 0.4 0.9 ± 0.6
ConBA 7.86E-01 1.121 1292.835 1153.3 2135 ± 2999 2812 ± 3798 BconBA 3.04E-01 0.748 315.12 421.56 571 ± 887 875 ± 1217
PconBA 8.83E-01 1.136 1021.18 899.06 1563 ± 2178 1936 ± 2623 UnconBA 7.79E-01 0.846 498.99 589.89 838 ± 859 773 ± 591 BunconBA 5.31E-01 0.928 285.64 307.87 400 ± 342 442 ± 328 PunconBA 4.91E-01 0.980 209.125 213.46 439 ± 581 332 ± 340 GlycinBA 7.59E-01 1.091 1192.74 1092.79 1935 ± 2724 2603 ± 3417 TaurineBA 4.63E-01 0.905 102.655 113.44 199 ± 293 208 ± 429
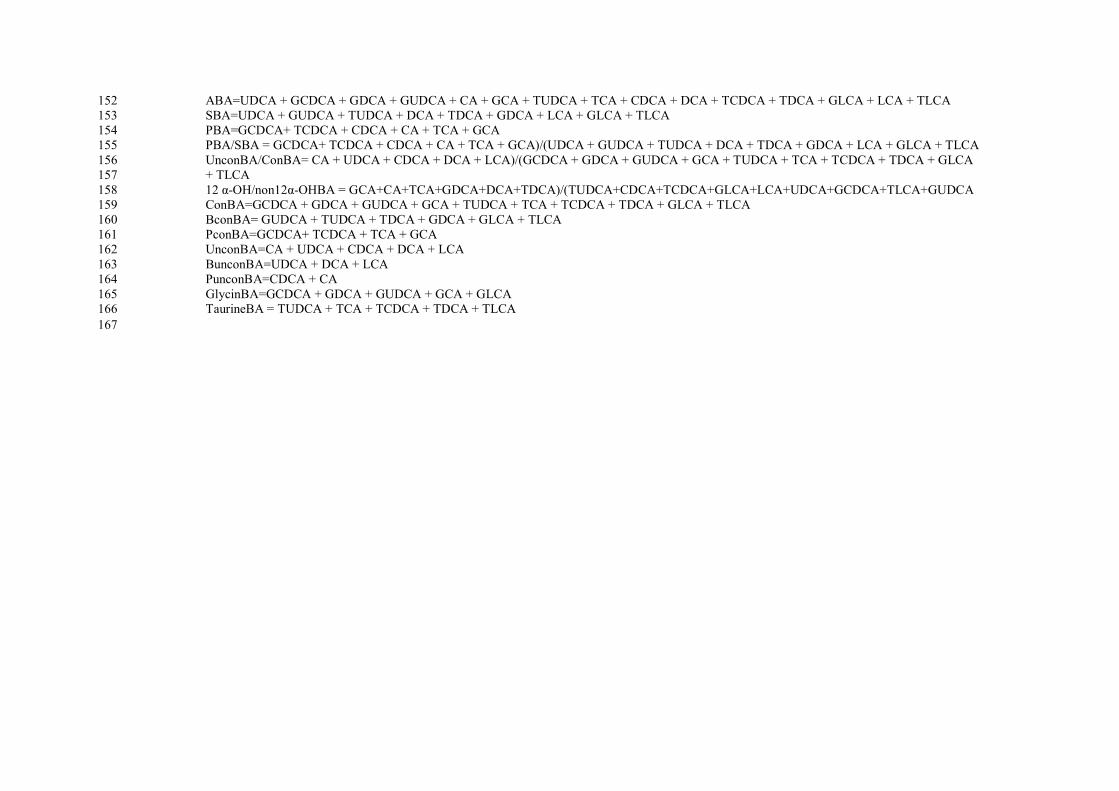
ABA=UDCA + GCDCA + GDCA + GUDCA + CA + GCA + TUDCA + TCA + CDCA + DCA + TCDCA + TDCA + GLCA + LCA + TLCA 152 SBA=UDCA + GUDCA + TUDCA + DCA + TDCA + GDCA + LCA + GLCA + TLCA 153 PBA=GCDCA+ TCDCA + CDCA + CA + TCA + GCA 154 PBA/SBA = GCDCA+ TCDCA + CDCA + CA + TCA + GCA)/(UDCA + GUDCA + TUDCA + DCA + TDCA + GDCA + LCA + GLCA + TLCA 155 UnconBA/ConBA= CA + UDCA + CDCA + DCA + LCA)/(GCDCA + GDCA + GUDCA + GCA + TUDCA + TCA + TCDCA + TDCA + GLCA 156 + TLCA 157 12 α-OH/non12α-OHBA = GCA+CA+TCA+GDCA+DCA+TDCA)/(TUDCA+CDCA+TCDCA+GLCA+LCA+UDCA+GCDCA+TLCA+GUDCA 158 ConBA=GCDCA + GDCA + GUDCA + GCA + TUDCA + TCA + TCDCA + TDCA + GLCA + TLCA 159 BconBA= GUDCA + TUDCA + TDCA + GDCA + GLCA + TLCA 160 PconBA=GCDCA+ TCDCA + TCA + GCA 161 UnconBA=CA + UDCA + CDCA + DCA + LCA 162 BunconBA=UDCA + DCA + LCA 163 PunconBA=CDCA + CA 164 GlycinBA=GCDCA + GDCA + GUDCA + GCA + GLCA 165 TaurineBA = TUDCA + TCA + TCDCA + TDCA + TLCA 166
167

Supplementary Table 13 Comparison of baseline faecal bile acid profiles in T2D patients in the Acarbose arm with two distinct 168 intestinal microbiome compositions: Cluster B vs. Cluster P 169
170
Fecal bile acid (ng/g)
Acarbose arm
Median (Absolute value) Median (% of ABA)
Cluster B Cluster P P value Cluster B Cluster P P value
Primary BAs
CA 208.00 21.87 3.69E-02 4.66 0.45 2.42E-02 CDCA 351.99 56.78 8.92E-02 6.52 1.07 5.18E-02 GCA 9.67 8.20 1.74E-01 0.21 0.21 9.53E-01 TCA 11.29 11.87 9.37E-01 0.28 0.26 9.55E-01 TCDCA 12.86 11.76 2.61E-01 0.19 0.29 6.93E-01 GCDCA 10.95 9.39 4.25E-01 0.22 0.23 7.79E-01
Secondary BAs UDCA 326.21 43.34 9.66E-02 7.37 1.00 2.37E-02 DCA 1552.04 1757.16 1.95E-01 33.48 42.88 7.11E-02 LCA 991.54 1698.36 2.00E-02 26.91 43.84 1.35E-02 GDCA 17.97 18.42 6.36E-01 0.42 0.48 3.89E-01 7KLCA 86.82 14.43 5.42E-02 1.01 0.40 2.72E-02 12KLCA 177.06 248.26 3.88E-01 4.51 5.75 3.88E-01 BA index UnconBA/ConBA 68.77 82.04 5.08E-01 12α-OH/non 12α-OHBA 0.74 0.85 9.58E-02 PBA/SBA 0.17 0.02 2.42E-02 ABA 6157.32 4542.35 1.10E-01 171
172
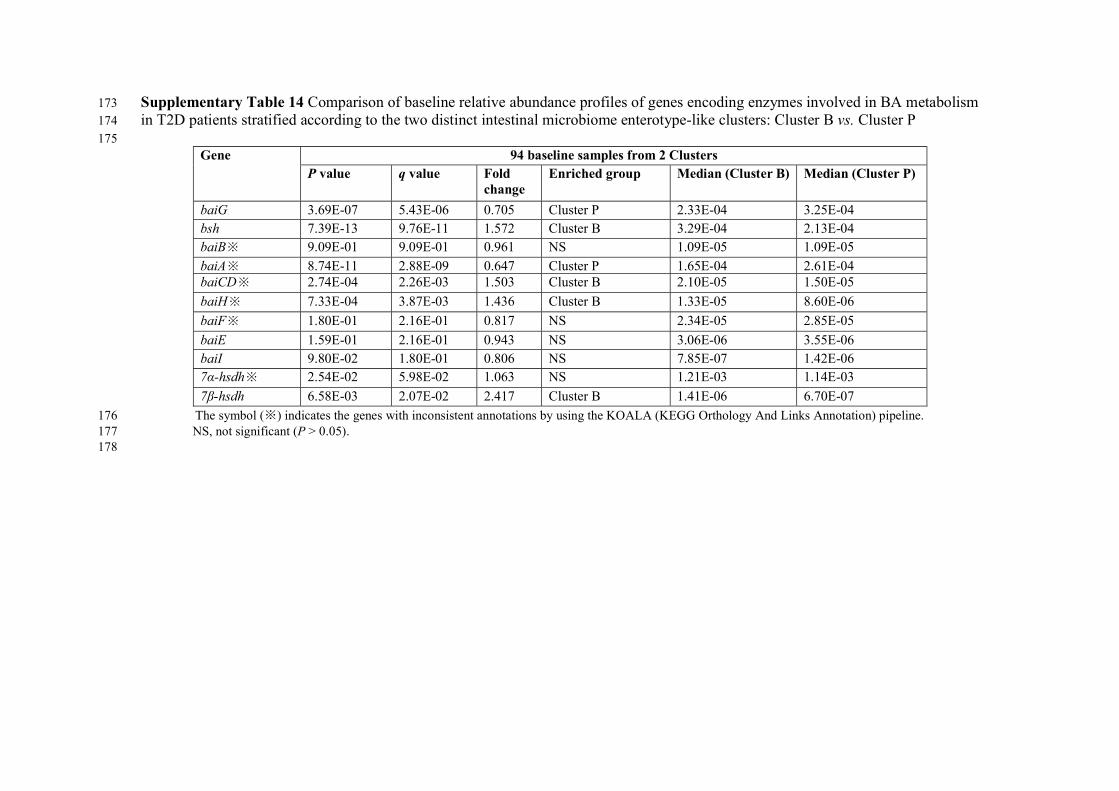
Supplementary Table 14 Comparison of baseline relative abundance profiles of genes encoding enzymes involved in BA metabolism 173 in T2D patients stratified according to the two distinct intestinal microbiome enterotype-like clusters: Cluster B vs. Cluster P 174
175 Gene 94 baseline samples from 2 Clusters
P value q value Fold change
Enriched group Median (Cluster B) Median (Cluster P)
baiG 3.69E-07 5.43E-06 0.705 Cluster P 2.33E-04 3.25E-04 bsh 7.39E-13 9.76E-11 1.572 Cluster B 3.29E-04 2.13E-04 baiB※ 9.09E-01 9.09E-01 0.961 NS 1.09E-05 1.09E-05
baiA※ 8.74E-11 2.88E-09 0.647 Cluster P 1.65E-04 2.61E-04 baiCD※ 2.74E-04 2.26E-03 1.503 Cluster B 2.10E-05 1.50E-05
baiH※ 7.33E-04 3.87E-03 1.436 Cluster B 1.33E-05 8.60E-06
baiF※ 1.80E-01 2.16E-01 0.817 NS 2.34E-05 2.85E-05
baiE 1.59E-01 2.16E-01 0.943 NS 3.06E-06 3.55E-06 baiI 9.80E-02 1.80E-01 0.806 NS 7.85E-07 1.42E-06 7α-hsdh※ 2.54E-02 5.98E-02 1.063 NS 1.21E-03 1.14E-03
7β-hsdh 6.58E-03 2.07E-02 2.417 Cluster B 1.41E-06 6.70E-07
The symbol (※) indicates the genes with inconsistent annotations by using the KOALA (KEGG Orthology And Links Annotation) pipeline. 176 NS, not significant (P > 0.05). 177 178
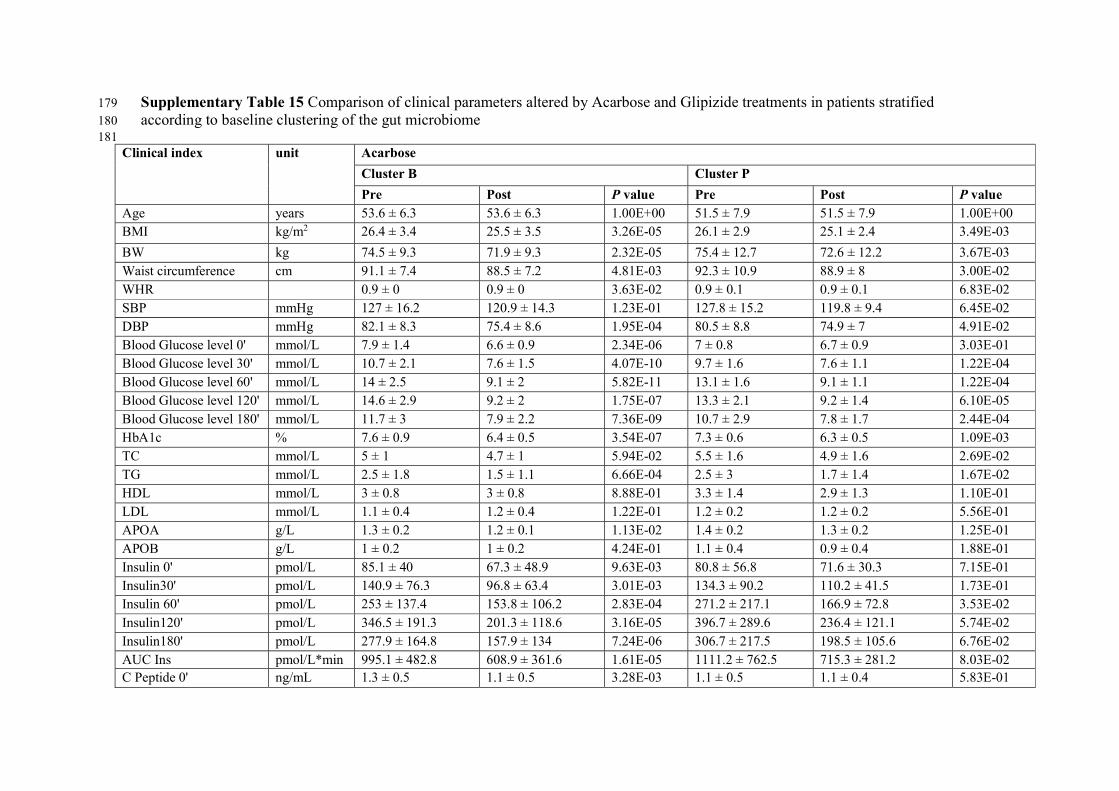
Supplementary Table 15 Comparison of clinical parameters altered by Acarbose and Glipizide treatments in patients stratified 179 according to baseline clustering of the gut microbiome 180 181
Clinical index unit Acarbose
Cluster B Cluster P
Pre Post P value Pre Post P value Age years 53.6 ± 6.3 53.6 ± 6.3 1.00E+00 51.5 ± 7.9 51.5 ± 7.9 1.00E+00 BMI kg/m2 26.4 ± 3.4 25.5 ± 3.5 3.26E-05 26.1 ± 2.9 25.1 ± 2.4 3.49E-03
BW kg 74.5 ± 9.3 71.9 ± 9.3 2.32E-05 75.4 ± 12.7 72.6 ± 12.2 3.67E-03 Waist circumference cm 91.1 ± 7.4 88.5 ± 7.2 4.81E-03 92.3 ± 10.9 88.9 ± 8 3.00E-02 WHR 0.9 ± 0 0.9 ± 0 3.63E-02 0.9 ± 0.1 0.9 ± 0.1 6.83E-02 SBP mmHg 127 ± 16.2 120.9 ± 14.3 1.23E-01 127.8 ± 15.2 119.8 ± 9.4 6.45E-02 DBP mmHg 82.1 ± 8.3 75.4 ± 8.6 1.95E-04 80.5 ± 8.8 74.9 ± 7 4.91E-02 Blood Glucose level 0' mmol/L 7.9 ± 1.4 6.6 ± 0.9 2.34E-06 7 ± 0.8 6.7 ± 0.9 3.03E-01 Blood Glucose level 30' mmol/L 10.7 ± 2.1 7.6 ± 1.5 4.07E-10 9.7 ± 1.6 7.6 ± 1.1 1.22E-04 Blood Glucose level 60' mmol/L 14 ± 2.5 9.1 ± 2 5.82E-11 13.1 ± 1.6 9.1 ± 1.1 1.22E-04 Blood Glucose level 120' mmol/L 14.6 ± 2.9 9.2 ± 2 1.75E-07 13.3 ± 2.1 9.2 ± 1.4 6.10E-05 Blood Glucose level 180' mmol/L 11.7 ± 3 7.9 ± 2.2 7.36E-09 10.7 ± 2.9 7.8 ± 1.7 2.44E-04 HbA1c % 7.6 ± 0.9 6.4 ± 0.5 3.54E-07 7.3 ± 0.6 6.3 ± 0.5 1.09E-03 TC mmol/L 5 ± 1 4.7 ± 1 5.94E-02 5.5 ± 1.6 4.9 ± 1.6 2.69E-02 TG mmol/L 2.5 ± 1.8 1.5 ± 1.1 6.66E-04 2.5 ± 3 1.7 ± 1.4 1.67E-02 HDL mmol/L 3 ± 0.8 3 ± 0.8 8.88E-01 3.3 ± 1.4 2.9 ± 1.3 1.10E-01 LDL mmol/L 1.1 ± 0.4 1.2 ± 0.4 1.22E-01 1.2 ± 0.2 1.2 ± 0.2 5.56E-01 APOA g/L 1.3 ± 0.2 1.2 ± 0.1 1.13E-02 1.4 ± 0.2 1.3 ± 0.2 1.25E-01 APOB g/L 1 ± 0.2 1 ± 0.2 4.24E-01 1.1 ± 0.4 0.9 ± 0.4 1.88E-01 Insulin 0' pmol/L 85.1 ± 40 67.3 ± 48.9 9.63E-03 80.8 ± 56.8 71.6 ± 30.3 7.15E-01 Insulin30' pmol/L 140.9 ± 76.3 96.8 ± 63.4 3.01E-03 134.3 ± 90.2 110.2 ± 41.5 1.73E-01 Insulin 60' pmol/L 253 ± 137.4 153.8 ± 106.2 2.83E-04 271.2 ± 217.1 166.9 ± 72.8 3.53E-02 Insulin120' pmol/L 346.5 ± 191.3 201.3 ± 118.6 3.16E-05 396.7 ± 289.6 236.4 ± 121.1 5.74E-02 Insulin180' pmol/L 277.9 ± 164.8 157.9 ± 134 7.24E-06 306.7 ± 217.5 198.5 ± 105.6 6.76E-02 AUC Ins pmol/L*min 995.1 ± 482.8 608.9 ± 361.6 1.61E-05 1111.2 ± 762.5 715.3 ± 281.2 8.03E-02 C Peptide 0' ng/mL 1.3 ± 0.5 1.1 ± 0.5 3.28E-03 1.1 ± 0.5 1.1 ± 0.4 5.83E-01

C Peptide 30' ng/mL 1.8 ± 0.9 1.4 ± 0.6 4.56E-05 1.6 ± 0.8 1.4 ± 0.5 1.34E-02 C Peptide 60' ng/mL 2.8 ± 1.3 1.9 ± 0.9 1.23E-04 2.5 ± 1.4 1.9 ± 0.9 6.10E-04 C Peptide 120' ng/mL 4 ± 1.7 2.8 ± 1.2 3.16E-05 3.8 ± 1.5 2.7 ± 1 1.22E-04 C Peptide 180' ng/mL 3.7 ± 1.7 2.5 ± 1.2 1.50E-06 3.3 ± 1.3 2.5 ± 1.3 2.45E-02 AUCGlu mM*min 2299 ± 388 1525 ± 263 2.91E-11 2102 ± 254 1464 ± 270 6.10E-05 AUCCpep ng/mL*min 537 ± 215 384 ± 146 9.67E-06 507 ± 205 383 ± 139 3.66E-04 HOMA IR* uIU*mmol 4 ± 2.3 2.6 ± 2 1.03E-03 3.2 ± 2.2 2.7 ± 1.2 7.15E-01 HOMA β* % 51.4 ± 23.5 58 ± 43.6 7.65E-01 60 ± 46.1 65 ± 45.6 5.42E-01 ΔIns30/G30* uIU/mmol 2.1 ± 3.7 33 ± 115 1.24E-02 2.6 ± 2.9 27 ± 102 6.35E-01 Bun mmol/L 309.3 ± 76.8 329.2 ± 58.9 1.71E-02 306.2 ± 67.2 326.5 ± 65.9 2.21E-01 creatine umol/L 67.1 ± 15.8 67.6 ± 16 5.31E-01 68 ± 10.6 67.4 ± 10.4 1.00E+00 Uric acid umol/L 4.9 ± 1 4.7 ± 1.4 2.06E-01 5.1 ± 1.1 5 ± 1.2 7.01E-01 FLI 315 ± 570 103 ± 167 1.76E-06 387 ± 529 94.9 ± 82.8 9.77E-04 AKP IU/L 68.4 ± 20.9 59.2 ± 18.9 2.98E-04 85.4 ± 24.7 77.5 ± 24.9 1.49E-01 ALB g/L 49.8 ± 37.5 42.3 ± 2.6 5.29E-02 45.6 ± 4.8 44.4 ± 3.7 1.26E-01 ALT IU/L 37.7 ± 21.9 29.4 ± 21.1 2.39E-02 40.7 ± 37.8 44.4 ± 61.1 3.15E-01 γGT IU/L 42.8 ± 47 24.8 ± 16.9 5.29E-05 60.1 ± 67.7 43.1 ± 56.1 2.03E-02 AST IU/L 28.2 ± 12.3 22.5 ± 9.8 9.26E-03 35.9 ± 41.6 29.4 ± 24 1.84E-01 LPS binding protein ng/mL 19.6 ± 5.8 17.4 ± 6.6 3.17E-01 15.4 ± 5 17.6 ± 5.9 3.91E-01 Adiponectin pg/ml 4659142 ± 3197330 5157340 ± 2775458 9.07E-03 6825516 ± 5265272 10063264 ± 10737091 7.30E-02 Leptin pg/mL 6319 ± 6148 6481 ± 9720 1.58E-01 7201 ± 6297 4522 ± 2763 6.71E-03
CRP ug/mL 13.6 ± 17.5 30 ± 75.1 8.53E-01 10.2 ± 8.4 19.6 ± 27.3 2.29E-01 Endothelin-1 pg/mL 12.4 ± 2.4 13.4 ± 2.8 3.01E-02 13.7 ± 4.1 14.3 ± 2.8 2.08E-01 MCP1 pg/mL 245.5 ± 93.8 256.6 ± 91.8 6.96E-02 212 ± 75.3 252.8 ± 89.7 6.71E-03 mpo ng/mL 366 ± 358 276 ± 223 5.43E-01 411 ± 344 467 ± 409 1.00E+00 PAI1 pg/mL 56210 ± 19392 52770 ± 20498 7.10E-01 54085 ± 15520 61007 ± 26493 2.52E-01 TNF α pg/mL 4.7 ± 2.1 4.8 ± 2.4 8.78E-01 4 ± 2 4.6 ± 1.9 7.82E-02 IFNr1 pg/mL 38.8 ± 23.1 42.1 ± 24 2.59E-01 37.6 ± 20.2 38.8 ± 12.9 6.09E-01 IL6 pg/mL 2.6 ± 5.2 4.8 ± 9.8 3.46E-01 1.6 ± 0.8 2.7 ± 2.4 1.29E-01 IL8 ng/mL 15.1 ± 21.8 11.9 ± 17.8 6.48E-01 9.6 ± 9.6 15.4 ± 24.9 4.63E-01 FGF19 MFI 22.4 ± 4.3 19.7 ± 4.7 7.21E-04 22.6 ± 3.7 19.3 ± 3 6.27E-03 FGF21 MFI 143 ± 64.9 100.1 ± 65.8 2.00E-04 136.4 ± 79.7 97.9 ± 41.5 2.62E-03
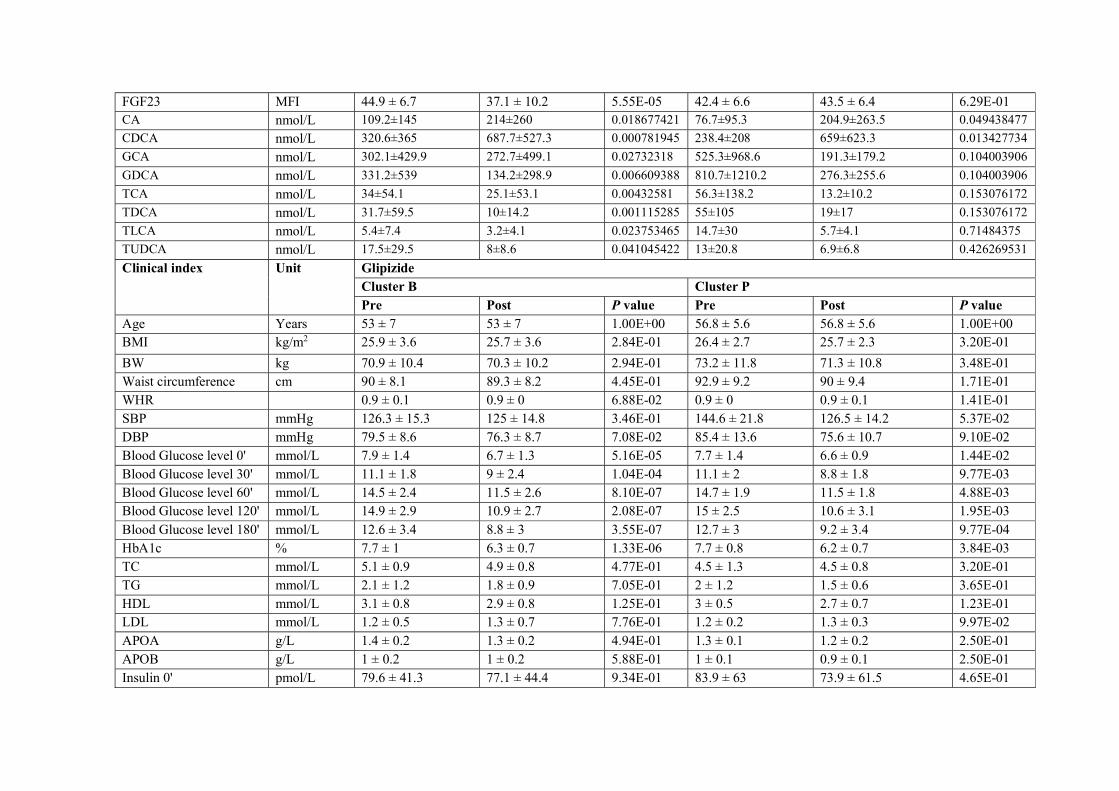
FGF23 MFI 44.9 ± 6.7 37.1 ± 10.2 5.55E-05 42.4 ± 6.6 43.5 ± 6.4 6.29E-01 CA nmol/L 109.2±145 214±260 0.018677421 76.7±95.3 204.9±263.5 0.049438477 CDCA nmol/L 320.6±365 687.7±527.3 0.000781945 238.4±208 659±623.3 0.013427734 GCA nmol/L 302.1±429.9 272.7±499.1 0.02732318 525.3±968.6 191.3±179.2 0.104003906 GDCA nmol/L 331.2±539 134.2±298.9 0.006609388 810.7±1210.2 276.3±255.6 0.104003906 TCA nmol/L 34±54.1 25.1±53.1 0.00432581 56.3±138.2 13.2±10.2 0.153076172 TDCA nmol/L 31.7±59.5 10±14.2 0.001115285 55±105 19±17 0.153076172 TLCA nmol/L 5.4±7.4 3.2±4.1 0.023753465 14.7±30 5.7±4.1 0.71484375 TUDCA nmol/L 17.5±29.5 8±8.6 0.041045422 13±20.8 6.9±6.8 0.426269531
Clinical index Unit Glipizide Cluster B Cluster P Pre Post P value Pre Post P value
Age Years 53 ± 7 53 ± 7 1.00E+00 56.8 ± 5.6 56.8 ± 5.6 1.00E+00 BMI kg/m2 25.9 ± 3.6 25.7 ± 3.6 2.84E-01 26.4 ± 2.7 25.7 ± 2.3 3.20E-01
BW kg 70.9 ± 10.4 70.3 ± 10.2 2.94E-01 73.2 ± 11.8 71.3 ± 10.8 3.48E-01 Waist circumference cm 90 ± 8.1 89.3 ± 8.2 4.45E-01 92.9 ± 9.2 90 ± 9.4 1.71E-01 WHR 0.9 ± 0.1 0.9 ± 0 6.88E-02 0.9 ± 0 0.9 ± 0.1 1.41E-01 SBP mmHg 126.3 ± 15.3 125 ± 14.8 3.46E-01 144.6 ± 21.8 126.5 ± 14.2 5.37E-02 DBP mmHg 79.5 ± 8.6 76.3 ± 8.7 7.08E-02 85.4 ± 13.6 75.6 ± 10.7 9.10E-02 Blood Glucose level 0' mmol/L 7.9 ± 1.4 6.7 ± 1.3 5.16E-05 7.7 ± 1.4 6.6 ± 0.9 1.44E-02 Blood Glucose level 30' mmol/L 11.1 ± 1.8 9 ± 2.4 1.04E-04 11.1 ± 2 8.8 ± 1.8 9.77E-03 Blood Glucose level 60' mmol/L 14.5 ± 2.4 11.5 ± 2.6 8.10E-07 14.7 ± 1.9 11.5 ± 1.8 4.88E-03 Blood Glucose level 120' mmol/L 14.9 ± 2.9 10.9 ± 2.7 2.08E-07 15 ± 2.5 10.6 ± 3.1 1.95E-03 Blood Glucose level 180' mmol/L 12.6 ± 3.4 8.8 ± 3 3.55E-07 12.7 ± 3 9.2 ± 3.4 9.77E-04 HbA1c % 7.7 ± 1 6.3 ± 0.7 1.33E-06 7.7 ± 0.8 6.2 ± 0.7 3.84E-03 TC mmol/L 5.1 ± 0.9 4.9 ± 0.8 4.77E-01 4.5 ± 1.3 4.5 ± 0.8 3.20E-01 TG mmol/L 2.1 ± 1.2 1.8 ± 0.9 7.05E-01 2 ± 1.2 1.5 ± 0.6 3.65E-01 HDL mmol/L 3.1 ± 0.8 2.9 ± 0.8 1.25E-01 3 ± 0.5 2.7 ± 0.7 1.23E-01 LDL mmol/L 1.2 ± 0.5 1.3 ± 0.7 7.76E-01 1.2 ± 0.2 1.3 ± 0.3 9.97E-02 APOA g/L 1.4 ± 0.2 1.3 ± 0.2 4.94E-01 1.3 ± 0.1 1.2 ± 0.2 2.50E-01 APOB g/L 1 ± 0.2 1 ± 0.2 5.88E-01 1 ± 0.1 0.9 ± 0.1 2.50E-01 Insulin 0' pmol/L 79.6 ± 41.3 77.1 ± 44.4 9.34E-01 83.9 ± 63 73.9 ± 61.5 4.65E-01
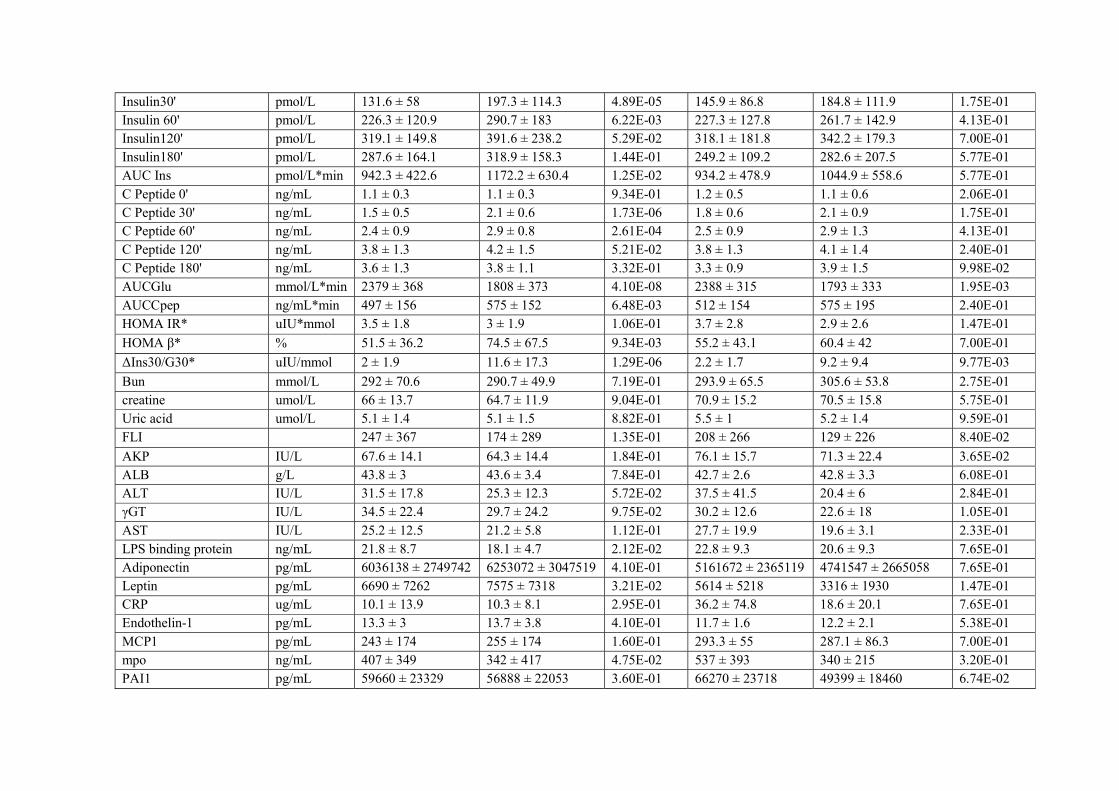
Insulin30' pmol/L 131.6 ± 58 197.3 ± 114.3 4.89E-05 145.9 ± 86.8 184.8 ± 111.9 1.75E-01 Insulin 60' pmol/L 226.3 ± 120.9 290.7 ± 183 6.22E-03 227.3 ± 127.8 261.7 ± 142.9 4.13E-01 Insulin120' pmol/L 319.1 ± 149.8 391.6 ± 238.2 5.29E-02 318.1 ± 181.8 342.2 ± 179.3 7.00E-01 Insulin180' pmol/L 287.6 ± 164.1 318.9 ± 158.3 1.44E-01 249.2 ± 109.2 282.6 ± 207.5 5.77E-01 AUC Ins pmol/L*min 942.3 ± 422.6 1172.2 ± 630.4 1.25E-02 934.2 ± 478.9 1044.9 ± 558.6 5.77E-01 C Peptide 0' ng/mL 1.1 ± 0.3 1.1 ± 0.3 9.34E-01 1.2 ± 0.5 1.1 ± 0.6 2.06E-01 C Peptide 30' ng/mL 1.5 ± 0.5 2.1 ± 0.6 1.73E-06 1.8 ± 0.6 2.1 ± 0.9 1.75E-01 C Peptide 60' ng/mL 2.4 ± 0.9 2.9 ± 0.8 2.61E-04 2.5 ± 0.9 2.9 ± 1.3 4.13E-01 C Peptide 120' ng/mL 3.8 ± 1.3 4.2 ± 1.5 5.21E-02 3.8 ± 1.3 4.1 ± 1.4 2.40E-01 C Peptide 180' ng/mL 3.6 ± 1.3 3.8 ± 1.1 3.32E-01 3.3 ± 0.9 3.9 ± 1.5 9.98E-02 AUCGlu mmol/L*min 2379 ± 368 1808 ± 373 4.10E-08 2388 ± 315 1793 ± 333 1.95E-03 AUCCpep ng/mL*min 497 ± 156 575 ± 152 6.48E-03 512 ± 154 575 ± 195 2.40E-01 HOMA IR* uIU*mmol 3.5 ± 1.8 3 ± 1.9 1.06E-01 3.7 ± 2.8 2.9 ± 2.6 1.47E-01
HOMA β* % 51.5 ± 36.2 74.5 ± 67.5 9.34E-03 55.2 ± 43.1 60.4 ± 42 7.00E-01
ΔIns30/G30* uIU/mmol 2 ± 1.9 11.6 ± 17.3 1.29E-06 2.2 ± 1.7 9.2 ± 9.4 9.77E-03
Bun mmol/L 292 ± 70.6 290.7 ± 49.9 7.19E-01 293.9 ± 65.5 305.6 ± 53.8 2.75E-01 creatine umol/L 66 ± 13.7 64.7 ± 11.9 9.04E-01 70.9 ± 15.2 70.5 ± 15.8 5.75E-01 Uric acid umol/L 5.1 ± 1.4 5.1 ± 1.5 8.82E-01 5.5 ± 1 5.2 ± 1.4 9.59E-01 FLI 247 ± 367 174 ± 289 1.35E-01 208 ± 266 129 ± 226 8.40E-02
AKP IU/L 67.6 ± 14.1 64.3 ± 14.4 1.84E-01 76.1 ± 15.7 71.3 ± 22.4 3.65E-02 ALB g/L 43.8 ± 3 43.6 ± 3.4 7.84E-01 42.7 ± 2.6 42.8 ± 3.3 6.08E-01 ALT IU/L 31.5 ± 17.8 25.3 ± 12.3 5.72E-02 37.5 ± 41.5 20.4 ± 6 2.84E-01 γGT IU/L 34.5 ± 22.4 29.7 ± 24.2 9.75E-02 30.2 ± 12.6 22.6 ± 18 1.05E-01 AST IU/L 25.2 ± 12.5 21.2 ± 5.8 1.12E-01 27.7 ± 19.9 19.6 ± 3.1 2.33E-01 LPS binding protein ng/mL 21.8 ± 8.7 18.1 ± 4.7 2.12E-02 22.8 ± 9.3 20.6 ± 9.3 7.65E-01 Adiponectin pg/mL 6036138 ± 2749742 6253072 ± 3047519 4.10E-01 5161672 ± 2365119 4741547 ± 2665058 7.65E-01 Leptin pg/mL 6690 ± 7262 7575 ± 7318 3.21E-02 5614 ± 5218 3316 ± 1930 1.47E-01 CRP ug/mL 10.1 ± 13.9 10.3 ± 8.1 2.95E-01 36.2 ± 74.8 18.6 ± 20.1 7.65E-01 Endothelin-1 pg/mL 13.3 ± 3 13.7 ± 3.8 4.10E-01 11.7 ± 1.6 12.2 ± 2.1 5.38E-01 MCP1 pg/mL 243 ± 174 255 ± 174 1.60E-01 293.3 ± 55 287.1 ± 86.3 7.00E-01 mpo ng/mL 407 ± 349 342 ± 417 4.75E-02 537 ± 393 340 ± 215 3.20E-01 PAI1 pg/mL 59660 ± 23329 56888 ± 22053 3.60E-01 66270 ± 23718 49399 ± 18460 6.74E-02
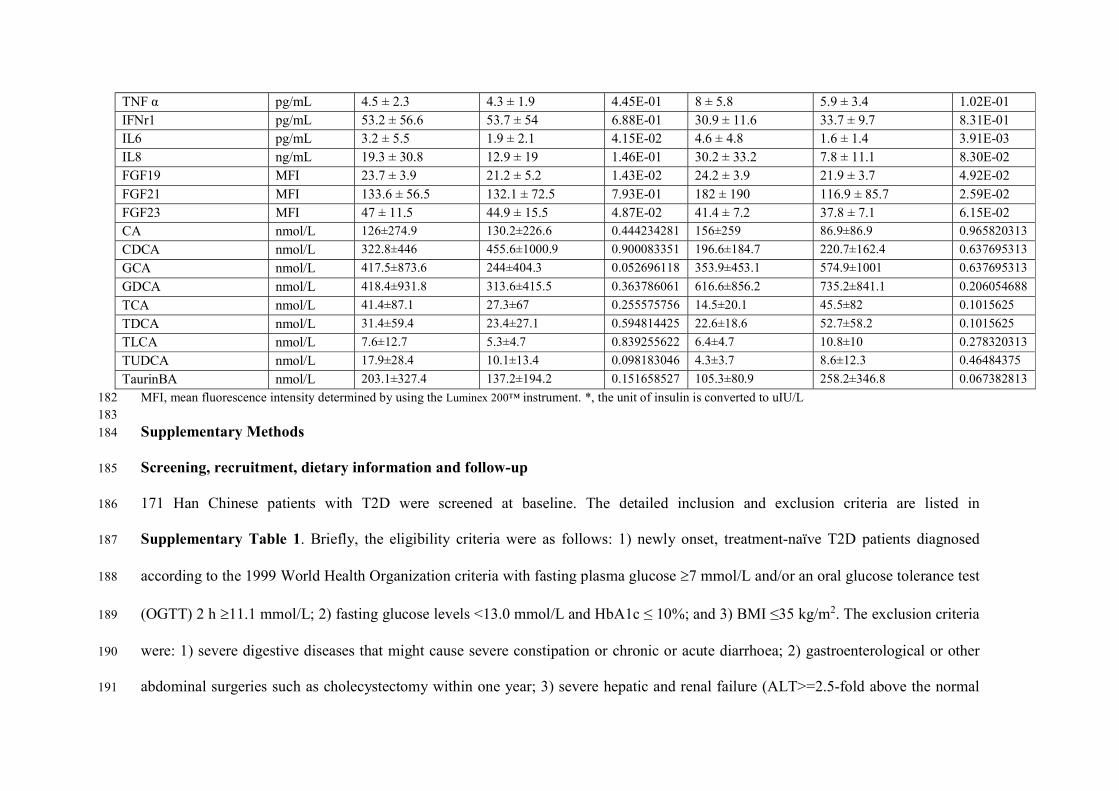
TNF α pg/mL 4.5 ± 2.3 4.3 ± 1.9 4.45E-01 8 ± 5.8 5.9 ± 3.4 1.02E-01 IFNr1 pg/mL 53.2 ± 56.6 53.7 ± 54 6.88E-01 30.9 ± 11.6 33.7 ± 9.7 8.31E-01 IL6 pg/mL 3.2 ± 5.5 1.9 ± 2.1 4.15E-02 4.6 ± 4.8 1.6 ± 1.4 3.91E-03 IL8 ng/mL 19.3 ± 30.8 12.9 ± 19 1.46E-01 30.2 ± 33.2 7.8 ± 11.1 8.30E-02 FGF19 MFI 23.7 ± 3.9 21.2 ± 5.2 1.43E-02 24.2 ± 3.9 21.9 ± 3.7 4.92E-02 FGF21 MFI 133.6 ± 56.5 132.1 ± 72.5 7.93E-01 182 ± 190 116.9 ± 85.7 2.59E-02 FGF23 MFI 47 ± 11.5 44.9 ± 15.5 4.87E-02 41.4 ± 7.2 37.8 ± 7.1 6.15E-02 CA nmol/L 126±274.9 130.2±226.6 0.444234281 156±259 86.9±86.9 0.965820313
CDCA nmol/L 322.8±446 455.6±1000.9 0.900083351 196.6±184.7 220.7±162.4 0.637695313
GCA nmol/L 417.5±873.6 244±404.3 0.052696118 353.9±453.1 574.9±1001 0.637695313
GDCA nmol/L 418.4±931.8 313.6±415.5 0.363786061 616.6±856.2 735.2±841.1 0.206054688
TCA nmol/L 41.4±87.1 27.3±67 0.255575756 14.5±20.1 45.5±82 0.1015625
TDCA nmol/L 31.4±59.4 23.4±27.1 0.594814425 22.6±18.6 52.7±58.2 0.1015625
TLCA nmol/L 7.6±12.7 5.3±4.7 0.839255622 6.4±4.7 10.8±10 0.278320313
TUDCA nmol/L 17.9±28.4 10.1±13.4 0.098183046 4.3±3.7 8.6±12.3 0.46484375
TaurinBA nmol/L 203.1±327.4 137.2±194.2 0.151658527 105.3±80.9 258.2±346.8 0.067382813 MFI, mean fluorescence intensity determined by using the Luminex 200™ instrument. *, the unit of insulin is converted to uIU/L 182 183
Supplementary Methods 184
Screening, recruitment, dietary information and follow-up 185
171 Han Chinese patients with T2D were screened at baseline. The detailed inclusion and exclusion criteria are listed in 186
Supplementary Table 1. Briefly, the eligibility criteria were as follows: 1) newly onset, treatment-naïve T2D patients diagnosed 187
according to the 1999 World Health Organization criteria with fasting plasma glucose 7 mmol/L and/or an oral glucose tolerance test 188
(OGTT) 2 h 11.1 mmol/L; 2) fasting glucose levels <13.0 mmol/L and HbA1c ≤ 10%; and 3) BMI ≤35 kg/m2. The exclusion criteria 189
were: 1) severe digestive diseases that might cause severe constipation or chronic or acute diarrhoea; 2) gastroenterological or other 190
abdominal surgeries such as cholecystectomy within one year; 3) severe hepatic and renal failure (ALT>=2.5-fold above the normal 191
range and Scr>=132 μmol/L); 4) psychiatric disorders, severe infectious diseases, severe anaemia, or severe neutropenia; 5) severe 192
cardiac diseases or cardiac function evaluation >=NYHA Class III; 6) acute diabetic ketonuria acidosis and hyperosmotic coma within 193
3 months; 7) past history of antidiabetic drug administration; and 8) treatment with antibiotics during the past 3 months. 194
Acarbose (Bayer HealthCare, Wuppertal, Germany) or Glipizide (Sine Pharm. Corp, Shanghai, China) was administered after a 195
one-day run-in preparation. All the enrolled patients completed a physical examination and questionnaires for diet, lifestyle and 196
history of disease and medication use. For Acarbose, the initial dose was 75 mg/day, 25 mg per meal, 3 times a day and, and the dose 197
was increased to 300-450 mg/day, 100-150 mg per meal, 3 times a day within one month. For Glipizide, the initial dose was 5 mg/day, 198
2.5 mg pre-meal, twice a day, and the dose was increased to 15 mg/day, 5 mg pre-meal, 3 times per day. Patients were instructed to 199
avoid ingesting yogurt and antibiotics or to keep record of prescriptions if necessary during the follow-up. 200
Dietary intake was recorded by a food frequency query (FFQ) based on the SLAN study1, using a Chinese translated version. 201
Primarily, the distribution of vegetarian or non-vegetarian and diary-food consumer or non-dairy-food consumer did not differ 202
between the two arms at baseline (Pearson's Chi-squared test, P>0.05). The frequencies of vegetable, meat, fish, sweets intakes, and 203
the frequencies of eating out were similar in patients belonging to the two treatment arms pre- and post-treatment (Kruskal-Wallis 204
rank sum test, P>0.05). These dietary features of patients in both arms showed no significant changes after treatment (Kruskal-Wallis 205
rank sum test, P>0.05). 206
207
208

Functional annotation of genes involved in BA synthesis based on BLASTP and BlastKOALA 209
To identify genes involved in bile acid metabolism, we performed a BlastP search against 1,011 amino acid sequences annotated as 210
enzymes involved in BA metabolism in the UniProt database using an E value<1E-5 2 and bit score>60 3, 4. This resulted in 16,102 211
genes potentially involved in bile acid metabolism. We next assessed the 16,102 potential hits against KEGG using the KEGG online 212
BlastKOALA algorithm5. As shown in Supplementary Data 4, the genes annotated to bsh, baiE and baiI by our pipeline showed 213
high consistency with the KEGG online results, with 69%-85% genes annotated to the same KO. For genes annotated to baiG (bile 214
acid transporter), 72.2% were assigned to K03453 (bile acid:Na+ symporter, BASS family), although no KO was reported and 215
assigned to baiG. For genes annotated to 7β-hsdh by our pipeline, 92.3% were assigned to K07124. By contrast, the remaining 216
UniProt annotated genes exhibited rather low consistency with the KEGG online results. For example, genes annotated to baiF 217
(K15871, EC 3.1.2.26, bile acid-CoA hydrolase) by UniProt were largely assigned to K18702 (uctC; CoA:oxalate CoA-transferase 218
[EC:2.8.3.19], 43.4%), K07749 (frc; formyl-CoA transferase [EC:2.8.3.16], 31.0%) and K08298 (caiB; L-carnitine CoA-transferase 219
[EC:2.8.3.21], 13.3%) by KEGG. For genes annotated to baiA (K15869, EC 1.1.1.395, 3α-hydroxy bile acid-CoA-ester 220
3-dehydrogenase) by UniProt, more than 80% of the genes were assigned to K00059 (abG; 3-oxoacyl-[acyl-carrier protein] reductase 221
[EC:1.1.1.100]) by KEGG. There are several possibilities explaining the inconsistency between the two methods. First, the high 222
sequence identity between target KOs (enzymes) and other KOs (enzymes). For example, the KEGG annotated CoA-transferases 223
exhibit very high identity with bile acid-CoA hydrolase. The protein sequence A0A0S2W5Y8 (EC2.8.3.16, K07749) exhibits 99.7% 224
identity with sequence A0A1C6GV35 (EC 3.1.2.26, bile acid-CoA hydrolase); the sequence F7UY98 (K08298) exhibits 92.3% 225
identity with sequence T4BVW9 (EC 3.1.2.26, bile acid-CoA hydrolase). Second, there are differences between the two annotation 226
algorithms. For example, the gene encoding protein sequence 1 (ID: V1.CD3-0-PN_GL0121220) is annotated to baiA ((K15869) by 227
UniProt but assigned to K00059 by KEGG, although protein sequence 1 exhibits higher identity (87%) with ag:ACF20977 (K15869) 228
than with sequences from K00059 (Supplementary Data 5). Finally, the inconsistency could be also caused by unique protein 229
sequences in the two databases. For instance, 12 of 13 genes annotated to 7β-hsdh (7-beta-hydroxysteroid dehydrogenase, EC 230
1.1.1.201) are assigned to K07124 by KEGG. The protein sequences encoded by these genes exhibit more than 70% identity with 231
R9UAM1 (7-beta-hydroxysteroid dehydrogenase, EC 1.1.1.201), and less than 40% identity with sequences from K07124 232
(Supplementary Data 6). 233
To further validate the annotation of genes involved in bile acid metabolism, we searched the 16,102 genes against the entire UniProt 234
database (Release 2017_07 of 05-Jul-2017) and calculated the percentage of genes with the best-scoring hits assigned to the same BA 235
metabolism functions/enzymes identified in the initial search against the 1,011 amino acid sequences annotated as enzymes involved in 236
BA metabolism in the UniProt database (Supplementary Data 7). Due to the multiple submitted names of the same gene or protein and 237
the existence of a massive number of uncharacterized proteins in UniProt, we combined the different synonymous protein names for 238
each BA metabolism function and removed the best scoring uncharacterized proteins. 239
For bsh, baiE, baiG, baiI and 7β-hsdh genes, the annotation of the highest scoring UniProt hits representing more than 85% of the genes 240
was consistent with the annotations by searching against only the 1,011 amino acid sequences from UniProt database. These results 241

demonstrated the robustness of the annotation of these genes. However, for baiF, baiCD, baiB, baiH, baiA and 7α-hsdh, their highest 242
scoring UniProt hits were still largely assigned to non-BA metabolism functions. 243
Thus, although E value cutoff (E value>1E -5) 2 and bit score cutoff (Score>60) 3, 4 have been widely used for metagenomic functional 244
annotation in previously published studies, our analyses clearly reveal the limitations to distinguish different enzymes/functions with 245
high sequence identity. Accordingly, in the present study only genes exhibiting highly consistent annotation (bsh, baiE, baiG, baiI and 246
7β-hsdh) have been included in the analyses. 247
248
Supplementary References 249
250 1. Harrington J, Fitzgerald AP, Layte R, Lutomski J, Molcho M, Perry IJ. Sociodemographic, health and lifestyle predictors of poor diets. Public Health 251
Nutr 14, 2166-2175 (2011). 252 253 2. Tremaroli V, et al. Roux-en-Y Gastric Bypass and Vertical Banded Gastroplasty Induce Long-Term Changes on the Human Gut Microbiome 254
Contributing to Fat Mass Regulation. Cell metabolism 22, 228-238 (2015). 255 256 3. Harrington ED, et al. Quantitative assessment of protein function prediction from metagenomics shotgun sequences. Proceedings of the National 257
Academy of Sciences of the United States of America 104, 13913-13918 (2007). 258 259 4. Tringe SG, et al. Comparative metagenomics of microbial communities. Science 308, 554-557 (2005). 260 261 5. Kanehisa M, Sato Y, Morishima K. BlastKOALA and GhostKOALA: KEGG Tools for Functional Characterization of Genome and Metagenome 262
Sequences. J Mol Biol 428, 726-731 (2016). 263 264 265