CONTENTS€¦ · · 2017-09-06Guar seed Other data ... The government has pegged India’s...
11
Date: 27-06-2017 NCML Commodity Market Monitor CONTENTS Outlook Wheat Maize Moong Paddy Chana Guar seed Other data Sowing progress: Kharif 2017-18 Monsoon Probabilities State wise procurement of wheat and pulses
Transcript of CONTENTS€¦ · · 2017-09-06Guar seed Other data ... The government has pegged India’s...

Date: 27-06-2017
NCML Commodity Market Monitor
Home
CONTENTS
Outlook
Wheat
Maize
Moong
Paddy
Chana
Guar seed
Other data
Sowing progress: Kharif 2017-18
Monsoon Probabilities
State wise procurement of wheat and
pulses
Date: 27-06-2017
NCML Commodity Market Monitor
Price Trend & Technicals
1500
1700
1900
2100
2300
2500
Jan
-16
Feb
-16
Ap
r-16
May
-16
Jul-1
6
Se
p-1
6
Oct
-16
De
c-16
Jan
-17
Mar
-17
Ap
r-17
Jun
-17
Wheat: Standard mill quality : Delhi
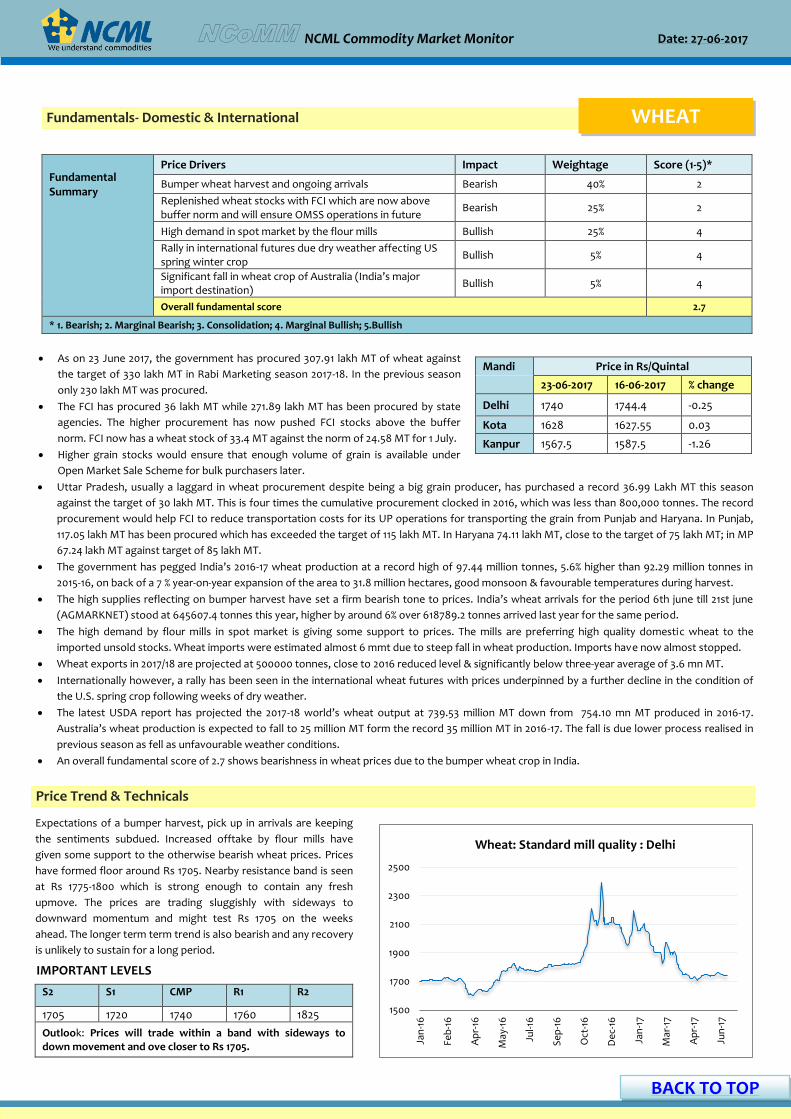
Expectations of a bumper harvest, pick up in arrivals are keeping
the sentiments subdued. Increased offtake by flour mills have
given some support to the otherwise bearish wheat prices. Prices
have formed floor around Rs 1705. Nearby resistance band is seen
at Rs 1775-1800 which is strong enough to contain any fresh
upmove. The prices are trading sluggishly with sideways to
downward momentum and might test Rs 1705 on the weeks
ahead. The longer term term trend is also bearish and any recovery
is unlikely to sustain for a long period.
IMPORTANT LEVELS
S2 S1 CMP R1 R2
1705 1720 1740 1760 1825
Outlook: Prices will trade within a band with sideways to down movement and ove closer to Rs 1705.
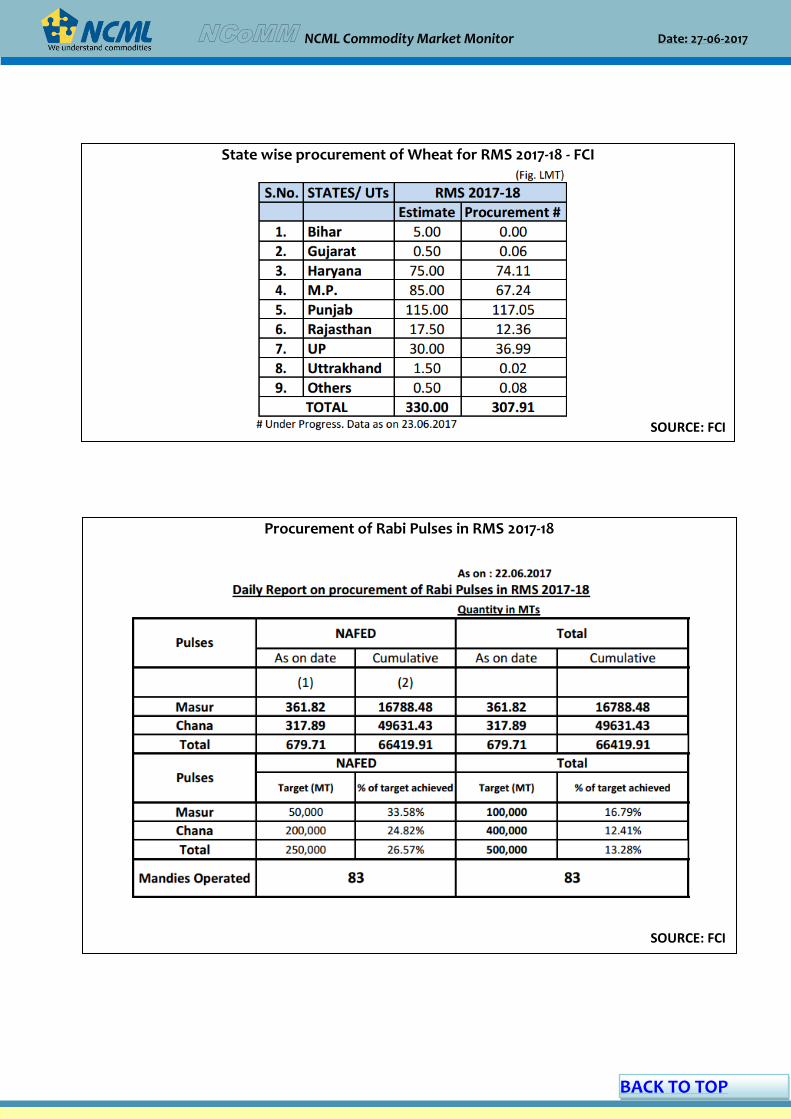
As on 23 June 2017, the government has procured 307.91 lakh MT of wheat against
the target of 330 lakh MT in Rabi Marketing season 2017-18. In the previous season
only 230 lakh MT was procured.
The FCI has procured 36 lakh MT while 271.89 lakh MT has been procured by state
agencies. The higher procurement has now pushed FCI stocks above the buffer
norm. FCI now has a wheat stock of 33.4 MT against the norm of 24.58 MT for 1 July.
Higher grain stocks would ensure that enough volume of grain is available under
Open Market Sale Scheme for bulk purchasers later.
Mandi Price in Rs/Quintal
23-06-2017 16-06-2017 % change
Delhi 1740 1744.4 -0.25
Kota 1628 1627.55 0.03
Kanpur 1567.5 1587.5 -1.26
Uttar Pradesh, usually a laggard in wheat procurement despite being a big grain producer, has purchased a record 36.99 Lakh MT this season
against the target of 30 lakh MT. This is four times the cumulative procurement clocked in 2016, which was less than 800,000 tonnes. The record
procurement would help FCI to reduce transportation costs for its UP operations for transporting the grain from Punjab and Haryana. In Punjab,
117.05 lakh MT has been procured which has exceeded the target of 115 lakh MT. In Haryana 74.11 lakh MT, close to the target of 75 lakh MT; in MP
67.24 lakh MT against target of 85 lakh MT.
The government has pegged India’s 2016-17 wheat production at a record high of 97.44 million tonnes, 5.6% higher than 92.29 million tonnes in
2015-16, on back of a 7 % year-on-year expansion of the area to 31.8 million hectares, good monsoon & favourable temperatures during harvest.
The high supplies reflecting on bumper harvest have set a firm bearish tone to prices. India’s wheat arrivals for the period 6th june till 21st june
(AGMARKNET) stood at 645607.4 tonnes this year, higher by around 6% over 618789.2 tonnes arrived last year for the same period.
The high demand by flour mills in spot market is giving some support to prices. The mills are preferring high quality domestic wheat to the
imported unsold stocks. Wheat imports were estimated almost 6 mmt due to steep fall in wheat production. Imports have now almost stopped.
Wheat exports in 2017/18 are projected at 500000 tonnes, close to 2016 reduced level & significantly below three-year average of 3.6 mn MT.
Internationally however, a rally has been seen in the international wheat futures with prices underpinned by a further decline in the condition of
the U.S. spring crop following weeks of dry weather.
The latest USDA report has projected the 2017-18 world’s wheat output at 739.53 million MT down from 754.10 mn MT produced in 2016-17.
Australia’s wheat production is expected to fall to 25 million MT form the record 35 million MT in 2016-17. The fall is due lower process realised in
previous season as fell as unfavourable weather conditions.
An overall fundamental score of 2.7 shows bearishness in wheat prices due to the bumper wheat crop in India.
Fundamental Summary
Price Drivers Impact Weightage Score (1-5)*
Bumper wheat harvest and ongoing arrivals Bearish 40% 2
Replenished wheat stocks with FCI which are now above buffer norm and will ensure OMSS operations in future
Bearish 25% 2
High demand in spot market by the flour mills Bullish 25% 4
Rally in international futures due dry weather affecting US spring winter crop
Bullish 5% 4
Significant fall in wheat crop of Australia (India’s major import destination)
Bullish 5% 4
Overall fundamental score 2.7
* 1. Bearish; 2. Marginal Bearish; 3. Consolidation; 4. Marginal Bullish; 5.Bullish
Fundamentals- Domestic & International WHEAT
BACK TO TOP

Date: 27-06-2017
NCML Commodity Market Monitor
Fundamentals- Domestic & International PADDY
Fundamental Summary
Price Drivers Impact Weightage Score (1-5)*
Rising export demand, especially from Bangladesh & Srilanka Bullish 25% 4
High prices of Thai and Vietnam making India exports competitive Bullish 15% 4
Record high rice production in 2016-17 Bearish 25% 2
Higher sowing for 2017-18 Bearish 10% 2
Demand from millers Bullish 25% 4
Overall fundamental score 3.3
*Bearish; 2. Marginal Bearish; 3. Consolidation; 4. Marginal Bullish; 5.Bullish
The government has announced only a modest increase of Rs 80 for the
2017-18 MSP of paddy. MSP for paddy common for 2017-18 was hiked to Rs.
1,550 per quintal from Rs. 1,470 per quintal last season while MSP of paddy
grade A to Rs. 1,590 from Rs. 1,510 per quintal in 2016-17. This has left the
peasantry across states unhappy as according them the rise is not enough
to adjust for cost of production inflation.
Meanwhile the latest sowing update pegs the area under rice till 23rd June
at 16.7 lakh ha., 4.6% above 15.97 lakh ha in previous year till same date. The
farmers realised good prices last year, and so with a normal monsson on
cards, acreage is expected to be good.
Mandi Paddy 1121: Price in Rs/ Quintal
23-06-2017
16-06-2017 % change
Hanumangarh(1121 Pusa)
3050 3000 1.67
Baran 1425 1430 -0.35
Vellore 1700 1750 -2.86
Meanwhile, buying by stockists and uptick in demand in spot markets is keeping rice basmati prices firm in the domestic market.
Vietnamese and Indian rice prices rose this week following strong demand from Bangladesh even as Thailand's high prices is putting off
buyers. Thai traders said demand from abroad has started to dwindle as high prices have forced buyers to turn to rivals.
Bangladesh has cut import duty on rice from 28 per cent to 10 per cent in a bid to stabilise the domestic market. Its paddy production is likely
to fall this year due to flash floods and disease, and it has strengthened its efforts to build a buffer stock of rice through quick imports. Export
demand from Bangladesh, and Srilanka too will help Indian exporters due to comparatively lower freight charges
Export demand is from Phillipines and African buyers are further expected to support Indian prices. Despite stronger rupee, Indian exports are
now competitive due to rise in prices of Thailand and Vietnam. Prices of Thai rice hit their highest in nearly four years while those of the
Vietnamese grain rose to their strongest in more than two years on strong demand from key importing countries.
India’s paddy 2016-17 production is estimated at a record high of 109.15 mn tonnes, up 4.5% from last year’s 104.41 mn tonnes. The kharif
production this year was 96.09 mn tonnes against 91.41 mn tonnes last year. Rabi production however stands flat at 13.06 mn tonnes.
As on 22 June 2017, 385.16 lakh MT of rice has been procured exceeding the total procurement of 342.18 lakh MT in 2015-16.
June USDA report pegs world rice output 2017-18 at 481.04 million MT, lowert than last year’s 483.10 million MT.
Overall fundamental score of 3.3 shows bullish undertone to rice prices.
reflects bullish undertone in rice prices.
Resurging export demand from Bangladesh and positive price parity
for indian rice as compared to Thailand and Vietnam is lending some
support to the prices. However record high production in 2016-17
has limited the upside. Nearest resistanse is seen at Rs 3170 and for
prices to take any noticeable upside leap they will have to breach
this level convincingly. Overall the Paddy prices are expected to
move in the range of Rs 2880 to Rs 3200 in the coming few weeks
and any push beyond these boundries will require some spark from
the fundamental front.
Price Trend & Technicals
1500.00
1750.00
2000.00
2250.00
2500.00
2750.00
3000.00
3250.00
3500.00
3750.00
May
-16
Jun
-16
Jul-1
6
Au
g-1
6
Se
p-1
6
Oct
-16
No
v-16
De
c-16
Jan
-17
Mar
-17
Ap
r-17
May
-17
Jun
-17
Jul-1
7
Paddy : 1121 : Narela
IMPORTANT LEVELS
S2 S1 CMP R1 R2
2800 2880 3050 3200 3280
Outlook: Prices may move in the range of Rs 2900 to Rs 3200.
BACK TO TOP

Date: 27-06-2017
NCML Commodity Market Monitor
The MSP of maize has been increased to Rs 1425, Rs 60 more than 1365
last year by the government.
Due to drought in Peninsular India resulting in modest Rabi maize crop,
the maize prices ruling at Rs 1,550-1,600 per quintal, are above the
Centre’s MSP of Rs 1,425. This means that maize will preferred by
farmers for sowing this kharif season.
In line with expectations, the acreage of maize as on 23 June 2017, was
9.44 lakh ha, slightly above the normal of 9.04 lakh ha for the same
period .
Mandi Price in Rs/ Quintal
23-06-2017 16-06-2017 % change
Gulabbagh 1261.25 1243.15 1.46
Nizamabad 1532.8 1508.5 1.61
Delhi 1315 1315 0.00
The rabi maize production in the state of Bihar is higher by about 16% as compared to the previous year. However, the recent rains in Bihar have
led to a mild setback in arrivals and have been delayed due to this.
According to the third advance estimates released by the government, India’s maize production 2016-17 stands at 26.14 mn MT, up almost 19%
from the previous year’s 22.57 mn MT. The kharif maize harvest was 19.17 mn MT as against only 16.05 mn MT in the previous year. Rabi harvest
was 6.97 mn MT, slightly higher than last year’s 6.51 mn MT affected by bad rains in the southern India.
India’s maize exports in 2016-17 have been estimated 6 lakh MT, against 5.12 lakh MT in the previous year. In 2014-15, exports were 11.62 lakh MT.
The exports have fallen due to export disparity with other global exporters. Global prices of maize have weakened due to higher carryover stocks.
Even as maize prices stabilised in India, they are still ruling higher than the rates in the international market, according to the US Grains Council
(USGC). Indian maize continued to be be the highest priced in the world market and despite higher production, there has been less export,
Recent festive spur in demand for poultry feed supported the domestic prices.
The June USDA report forecasts world corn production for 2017-18 at 1,033.66 million MT. Corn output rose in 2016-17 to 1,067.21 million MT
compared to 968.29 million MT in 2015-16. The report increased estimate of Brazil's 2016-17 corn production from 96.0 million metric tons to 97.0
mmt while keeping Argentina's 40.0 mmt estimate unchanged. Both have significant increases from the previous year.
China has slased its 2017/18 corn output forecast to 211.65 million tonnes, 3.6% below last year, and the lowest level in four years after drought and
hail hit planting in the northeastern region of one of the world's top producers, spurring a rally in futures prices.
Overall fundamental score of 3.1 indicates consolidation in maize prices.
Price Trend & Technicals
1250
1330
1410
1490
1570
1650
Ap
r-16
May
-16
Jun
-16
Jul-1
6
Au
g-1
6
Oct
-16
No
v-16
De
c-16
Jan
-17
Feb
-17
Ap
r-17
May
-17
Jun
-17
Maize-Feed/Industrial Grade : Delhi
As forecasted in last Ncomm prices remained bearish and moved
closer to the first support level of Rs 1300. Higher domestic and
global production this year continued to pressurize maize prices.
Export disparity due to higher global production aslo exerted
pressure on the prices. In the coming weeks sustainable trading
below the first support level, prices may pull down prices further to
Rs 1260. Before that the prices trade for sometinme within the
range of Rs 1300-1320. At current juncture the downside is looking
limited from here on in Maize.
IMPORTANT LEVELS
S2 S1 CMP R1 R2
1260 1300 1315 1350 1415
Outlook: Prices may show bearish movement till the support level of Rs 1300 and towards 1260 on a crack of 1300.
Fundamentals- Domestic & International MAIZE
Fundamental Summary
Price Drivers Impact Weightage Score (1-5) *
High maize production in 2016-17 and including higher rabi output in Bihar
Bearish 30% 2
Rains in Bihar affecting arrivals Bullish 25% 4
Lack of recovery in exports over the year due to export disparity Bearish 15% 2
Demand rise from poultry feed Bullish 25% 4
High world carryover stocks Bearish 5% 4
Overall fundamental score 3.1
*Bearish; 2. Marginal Bearish; 3. Consolidation; 4. Marginal Bullish; 5.Bullish
BACK TO TOP

Date: 27-06-2017
NCML Commodity Market Monitor
As expected in our last volume the prices moved initially
towards the resistance of Rs 5240 and made a high of Rs 5225
but could not test or breach the level. This resulted in some
technical supply pressure and the prices around the resistance
levels pulling down the prices once again. Looking ahead the
support is seen at Rs 4850 and the current pressure can pull
down prices till that level. The chances of prices slipping below
that level looks bleak and some consolidation can take place
around 4850.
Fundamentals- Domestic & International
Price Trend & Technicals
2000
4000
6000
8000
10000
12000
Feb
-16
Mar
-16
May
-16
Jun
-16
Au
g-1
6
Se
p-1
6
No
v-16
De
c-16
Feb
-17
Mar
-17
May
-17
Jul-1
7
Chana - Rajasthani desi : Bikaner
CHANA
IMPORTANT LEVELS
S2 S1 CMP R1 R2
4800 4850 4912 5050 5240
Outlook: Prices will slip towards Rs 4850 and will consolidate around those levels.
Farmers and stockists are holding chana in expectation of getting
higher prices in the coming days. Stock holding of chana may have
slightly bullish impact on the prices.
Till 17th June, Nafed had procured around 48.20 thousand tonnes of
chana. Procurement of chana by Nafed is being made at prevailing
market prices in states of Rajasthan, Madhya Pradesh and Uttar
Pradesh. Procurement activity may give support to the prevailing
market price.
Mandi Price in Rs/ Quintal
23-06-2017 16-06-2017 % change
Delhi 5100 5400 -5.56
Jaipur 5050 5375 -6.05
Bikaner 4912.5 5150 -4.61
As of 21st June, Australian chana is being traded at Rs 5200-5250 per quintal in Mumbai market. Australian chickpea of October- November
delivery is being offered at Rs 4900 at Mumbai port. Australian new crop arrivals are expected to come in November – December month
putting downward pressure on the prices.
According to DGFT, India chana imports are recorded at 10.80 Lakh metric tonnes from in 2016-17 which is around 4 per cent higher than last
year imports of 10.31 lakh metric tonnes in 2015-16. Despite higher production estimate this year imports were higher due to lower prices of
imported chana. Regular imports of chana may have a slightly bearish impact on the prices.
According to the Abares, Australia chickpea production estimate has been reduced by 24 percent to 1.416 million tonnes from 1.854 million
tonnes last year. Lower production estimate is due to ungavourable weather conition which might effect the yield. Lower Australian chana
production estimate may have a slightly bullish impact on the prices.
India chana production estimate has been decreased by 0.43 percent to 9.08 MMT in third advance estimates as against second advance
estimate of 9.12 MMT for 2016-17. However, trade sources are estimating 8.3-8.5 MMT of chana this year. Last year chana production estimate
was 7.06 MMT. Higher production estimate compared to last year will continue to put chana prices under pressure..
Overall score of 3.2 shows range bound with slightly firm movement in the coming days.
Fundamental Summary
Price Drivers Impact Weightage Score (1-5)*
Stock holding by farmers Bullish 25% 4
Procurement activity by Nafed Bullish 15% 4
Regular imports Bearish 20% 2
Lower Australian chickpea production estimate Bullish 20% 4
Higher domestic production estimate Bearish 20% 2
Overall fundamental score 3.2
*Bearish; 2. Marginal Bearish; 3. Consolidation; 4. Marginal Bullish; 5.Bullish
BACK TO TOP
Date: 27-06-2017
NCML Commodity Market Monitor
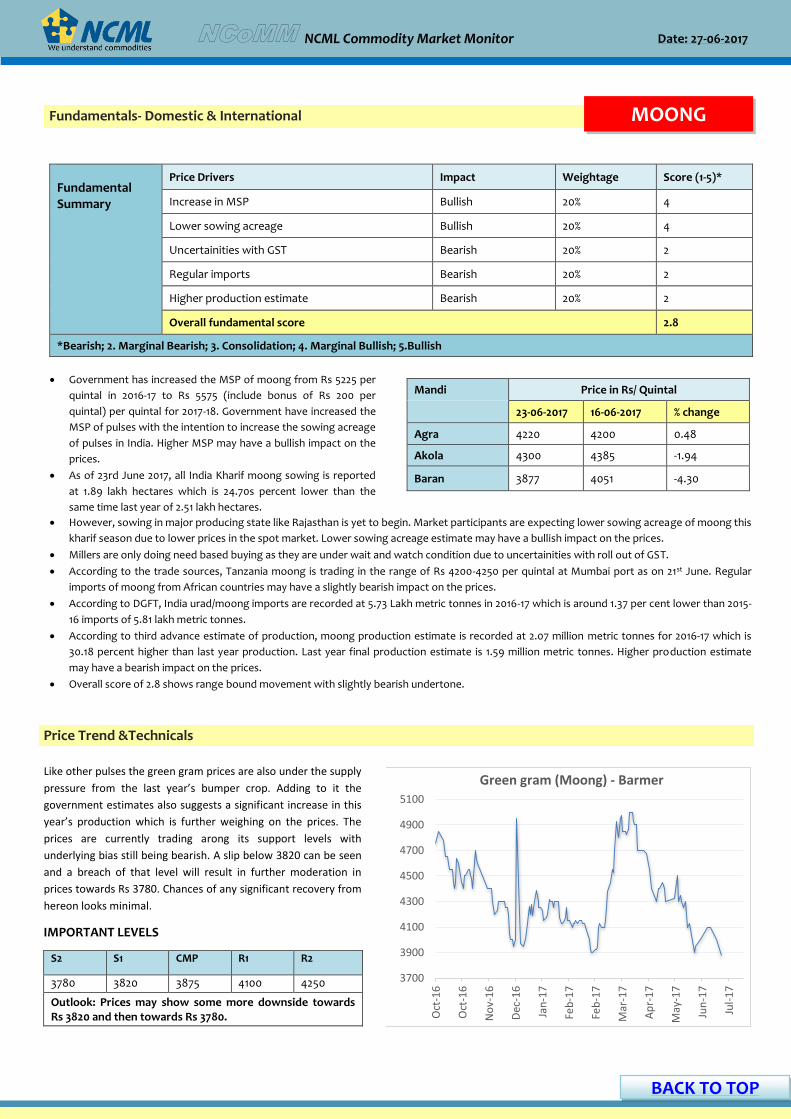
Price Trend &Technicals
Like other pulses the green gram prices are also under the supply
pressure from the last year’s bumper crop. Adding to it the
government estimates also suggests a significant increase in this
year’s production which is further weighing on the prices. The
prices are currently trading arong its support levels with
underlying bias still being bearish. A slip below 3820 can be seen
and a breach of that level will result in further moderation in
prices towards Rs 3780. Chances of any significant recovery from
hereon looks minimal.
IMPORTANT LEVELS
S2 S1 CMP R1 R2
3780 3820 3875 4100 4250
Outlook: Prices may show some more downside towards Rs 3820 and then towards Rs 3780.
Government has increased the MSP of moong from Rs 5225 per
quintal in 2016-17 to Rs 5575 (include bonus of Rs 200 per
quintal) per quintal for 2017-18. Government have increased the
MSP of pulses with the intention to increase the sowing acreage
of pulses in India. Higher MSP may have a bullish impact on the
prices.
As of 23rd June 2017, all India Kharif moong sowing is reported
at 1.89 lakh hectares which is 24.70s percent lower than the
same time last year of 2.51 lakh hectares.
Mandi Price in Rs/ Quintal
23-06-2017 16-06-2017 % change
Agra 4220 4200 0.48
Akola 4300 4385 -1.94
Baran 3877 4051 -4.30
However, sowing in major producing state like Rajasthan is yet to begin. Market participants are expecting lower sowing acreage of moong this
kharif season due to lower prices in the spot market. Lower sowing acreage estimate may have a bullish impact on the prices.
Millers are only doing need based buying as they are under wait and watch condition due to uncertainities with roll out of GST.
According to the trade sources, Tanzania moong is trading in the range of Rs 4200-4250 per quintal at Mumbai port as on 21st June. Regular
imports of moong from African countries may have a slightly bearish impact on the prices.
According to DGFT, India urad/moong imports are recorded at 5.73 Lakh metric tonnes in 2016-17 which is around 1.37 per cent lower than 2015-
16 imports of 5.81 lakh metric tonnes.
According to third advance estimate of production, moong production estimate is recorded at 2.07 million metric tonnes for 2016-17 which is
30.18 percent higher than last year production. Last year final production estimate is 1.59 million metric tonnes. Higher production estimate
may have a bearish impact on the prices.
Overall score of 2.8 shows range bound movement with slightly bearish undertone.
Fundamental Summary
Price Drivers Impact Weightage Score (1-5)*
Increase in MSP Bullish 20% 4
Lower sowing acreage Bullish 20% 4
Uncertainities with GST Bearish 20% 2
Regular imports Bearish 20% 2
Higher production estimate Bearish 20% 2
Overall fundamental score 2.8
*Bearish; 2. Marginal Bearish; 3. Consolidation; 4. Marginal Bullish; 5.Bullish
Fundamentals- Domestic & International MOONG
3700
3900
4100
4300
4500
4700
4900
5100
Oct
-16
Oct
-16
No
v-1
6
Dec
-16
Jan
-17
Feb
-17
Feb
-17
Mar
-17
Ap
r-1
7
May
-17
Jun
-17
Jul-
17
Green gram (Moong) - Barmer
BACK TO TOP

Date: 27-06-2017
NCML Commodity Market Monitor
Lacklustre domestic and overseas demand coupled with high
carryover stocks and expectation of better production on
account of expected good rainfall will keep the sentiments in
guarseed dampened in the near furture. We hold our previous
week’s view that sustained trading below Rs 3300 will further
extend the ongoing declining streak making way for prices to
enter the support range of Rs 3200-3160. This band will arrest
the further declines. Chances of any sharp recovery in prices is
unlikely. Resistance is seen at Rs 3375.
2,800
3,000
3,200
3,400
3,600
3,800
4,000
Feb
-16
Mar
-16
May
-16
Jun
-16
Au
g-1
6
Se
p-1
6
No
v-16
De
c-16
Feb
-17
Ap
r-17
May
-17
Jul-1
7
Guarseed-Average : Bikaner
IMPORTANT LEVELS
S2 S1 CMP R1 R2
3160 3200 3318 3375 3480
Outlook: Price will slip further towards the support range of Rs 3200-3160 and a crack of Rs 3300.
Guar seed and Guar gum continue to declined at the major markets of
Rajasthan due to bearish tone on futures and slow domestic demand.
Activity in the market is lackluster in the absence of buyers. However
crushers are active but since they have ample stocks they are buying in
limited quantity.
Weakness in crude oil prices have also weighed on Guar. With forecast
of more fall, market players are concern about Guar gum demand.
Guarseed prices will closely watch monsoon progress as further
direction is heavily depend on it. Good monsoon may push down prices
near and monsoon failure may turn the trend on bullish side.
Mandi Price in Rs/ Quintal
23-06-2017 16-06-2017 %change
Bikaner 3300 3520 -6.25
Jodhpur 3379 3600 -6.13
Sri Ganga Nagar 3300 3325 -0.75
Fundamental Summary
Price Drivers Impact Weightage Score (1-5)*
Limited demand from crushers Bearish 25% 2
Weakness in crude oil Bearish 20% 2
Favorable monsoon rainfall Bearish 15% 2
Buying at lower levels Bullish 20% 4
Higher stock position Bearish 20% 3
Overall fundamental score 2.6
*1. Bearish; 2. Marginal Bearish; 3. Consolidation; 4. Marginal Bullish; 5. Bullish
Fundamentals- Domestic & International
Price Trend &Technicals
GUAR SEED
Though Guar gum export in the recent times has remained positive, but higher Guar seed stock in the country put pressure on prices. Further
the recent sell off in crude, which pushed its prices to 2017 lows has also weighed on sentiments.
According to Industry sources, the country have nearly 1.75 to 1.85 crore bags (100kg each) of Guar seed stocks at present, which is more than
sufficient to cater domestic and overseas demand. Indias Guar gum export during April 2017 rose to 54,392 metric tonnes against 23,158 metric
tonnes same period a year ago, more than two fold rise, according to APEDA. India shipped 4,23,285.66 metric tonnes of Guar gum in FY 2016-
17, much higher than 3,25,250.71 metric tonnes in FY 2015-16.
As per the Department of Agriculture Rajasthan 2nd advanced estimates for 2016-17 Guar seed production is estimated to decline at 14.25 lakh
tonnes as against 22.23 lakh tonnes in 2015-16.
Stock position of Guar seed as on 22nd June stood at 17,640 tonnes and Guar gum at 22,941 tonnes.
Overall fundamental score of 2.6 indicates that Guar seed will be on the downside.
BACK TO TOP

Date: 27-06-2017
NCML Commodity Market Monitor
Rice exports seen picking up on Bangladesh, Sri Lanka demand News Link
Kharif sowing acreage up 10% News Link
Kharif MSPs 2017-18: Government hikes pulses MSP by up to Rs 400 per quintal News Link
As wheat procurement from farmers rises 3 pct, FCI grain stocks more than buffer norms now News Link
SEA demands placement of oilseeds in zero per cent slab by GST Council News Link
Soyabean sowing in Madhya Pradesh, Maharashtra may be delayed News Link
Oilseed prices fall below MSP; farmers may shift to other crops News Link
Pepper exports fall sharply in 2016-17; imports increase News Link
Oil mills face heat as farmers refuse to sell below MSP News Link
Rajasthan may penalise traders buying below MSP News Link
Gram prices set to rise on lower output, stocks News Link
Centre’s pulse procurement strategy has gone awry News Link
Cardamom exports drop in 2016-17 on rise in price News Link
Spring wheat futures hit 2-year top. How much higher can they go? News Link
Palm oil futures hit 10-month low, despite fall in Malaysian stocks News Link
5.9-0.5
0.0
-1.6
-1.4
0.0
-0.5
1.0
0.9
0.6
3.7
1.2
-6.3
0.08
-9.0 -4.0 1.0 6.0 11.0
Chana
Moong
Wheat
Paddy
Maize
Guar
Soya
Mustard
Cotton
Sugar
Castor
Coriander
Turmeric
Jeera
% age change since 16th June 2017
News corner
OFFICIAL PRODUCTION ESTIMATES
Third advance estimates 2016-17 & previous years’ estimates :
Third Advance Estimates
Link for commodity-wise and
market-wise prices and arrivals:
http://agmarknet.gov.in/PriceAndArrival
s/CommodityWiseDailyReport2.aspx
MSP in Rs /Qtl
Commodity 2015-16 2016-17 2017-18
Paddy Common 1410 1470 1550
paddy grade A 1450 1510 1590
Jowar Hybrid 1570 1625 1700
Jowar Maldandi 1590 1650 1725
Bajra 1275 1330 1425
Ragi 1650 1725 1900
Maize 1325 1365 1425
Tur 4625 5050 5450*
Moong 4850 5225 5575*
Urad 4625 5000 5400*
Groundnut 4030 4220 4450*
Sunflower seed 3800 3950 4100 #
Soyabean black
2775 3050
Sesamum 4700 5000 5300 #
Nigerseed 3650 3825 4050 #
Cotton(Medium Staple) 3800 3680 4020
Cotton(Long Staple) 4100 4160 4320
*includes bonus of Rs 200 per quintal
# includes bonus of Rs 100 per quintal
BACK TO TOP
MONSOON PROBABILITIES- IMD
Date: 27-06-2017
NCML Commodity Market Monitor
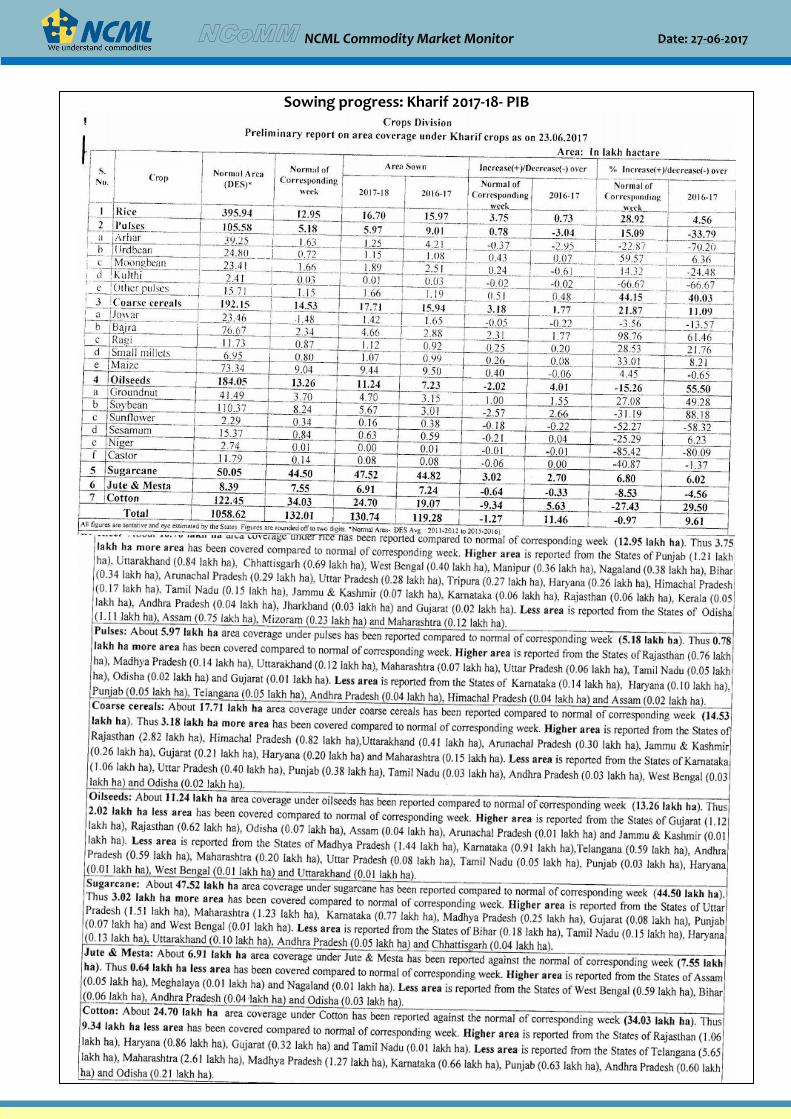
Sowing progress: Kharif 2017-18- PIB
Date: 27-06-2017
NCML Commodity Market Monitor
Procurement of Rabi Pulses in RMS 2017-18
SOURCE: FCI
State wise procurement of Wheat for RMS 2017-18 - FCI
BACK TO TOP
SOURCE: FCI
Date: 27-06-2017
NCML Commodity Market Monitor
Advisory Team
Basant Vaid Head: TCIG [email protected]
Sreedhar Nandam Vice President: SCM [email protected]
Research Team
Suresh Solanki Assistant Manager: TCIG [email protected]
Kamna Malhotra Economist: TCIG [email protected]
Akash Jaiswal Research Analyst: TCIG [email protected]
Ansh Aggarwal Senior Officer: Trade Support [email protected]
For any research queries, contact us at [email protected]
Fundamentals- Domestic & International RM SEED
Disclaimer:
This consultancy report has been prepared by National Collateral Management Services Limited (NCML) for the sole benefit of the addressee.
Neither the report nor any part of the report shall be provided to third parties without the written consent of NCML. Any third party in
possession of the report may not rely on its conclusions without the written consent of NCML. NCML has exercised reasonable care and skill in
preparation of this consultancy report but has not independently verified information provided by others. No other warranty, express or
implied, is made in relation to this report. Therefore, NCML assumes no liability for any loss resulting from errors, omissions or
misrepresentations made by others. Any recommendations, opinions and findings stated in this report are based on circumstances and facts as
they existed at the time of preparation of this report. Any change in circumstances and facts on which this report is based may adversely affect
any recommendations, opinions or findings contained in this report.
© National Collateral Management Services Limited (NCML) 2017
STOCK
Stock limits of States/UTs
BACK TO TOP


![TOPIC: 291006 KNOWLEDGE: K1.01 [2.7/2.7] QID: B104](https://static.fdocuments.in/doc/165x107/61bd329661276e740b104f0e/topic-291006-knowledge-k101-2727-qid-b104.jpg)