2016_IT SalaryReport_Global Knowledge
62
© 2016 Global Knowledge Training LLC. All rights reserved. SPECIAL REPORT 2016 IT Skills and Salary Report A Comprehensive Study from Global Knowledge
-
Upload
michelle-pichardo -
Category
Documents
-
view
38 -
download
2
Transcript of 2016_IT SalaryReport_Global Knowledge

© 2016 Global Knowledge Training LLC. All rights reserved.
S P E C I A L R E P O R T
2016IT Skills and Salary Report
A Comprehensive Study from Global Knowledge

2© 2016 Global Knowledge Training LLC. All rights reserved.
TABLE OF CONTENTS 3 Introduction
4 Participant Profile
5 Overriding Trends
6 Compensation
8 Salary Range of IT Respondents in Percent
9 Functional Areas and Job Roles
10 Raises and Bonuses
11 Reasons for Raises by Size of Raise
12 When Change Happens
12 Company Size
13 Industry
14 Geography
15 Job Security Stands Strong
16 Professional Development
18 How Professionals Stay Up to Date
19 Methods for Keeping Skills Current
21 Using Internal Versus External Training Resources
21 Annual Professional Development Plans
22 Certifications: Has the Gold Standard Been Debased?
25 Showing Off Your Badge
26 Higher Bar, More Value for Microsoft Certifications
27 IT Decision-Makers
28 Department Size and Budget Allocations
29 Skills Assessment
30 Reasons Behind Skills Gaps
30 Impact of Skills Gaps on the Organization
31 Is Training Necessary?
32 Application Developers
33 What Tools Are in Their Toolkits?
35 Non-IT Professionals
37 Looking Forward
38 Technology Areas of Interest for 2016
39 Conclusions
40 Acknowledgements
41 Appendix: Complete Lists of Salaries
by Certification and State/Province
Survey Methodology and Report Details
The 2016 IT Skills and Salary Survey was
conducted online from September 21 to
October 23, 2015. Global Knowledge and
partner companies and organizations
emailed more than half a million
survey invitations to recipients in their
databases. Links were also provided in
online newsletters. The survey yielded
more than 14,000 completed responses
from around the globe, with over 70
percent coming from the United States
and Canada. The online survey was
tabulated using IBM SPSS and
Q Research software. The 2016 IT Skills
and Salary Report focuses on North
America, where 8,923 IT professionals
and 1,263 business professionals shared
their input.
2© 2015 Global Knowledge Training LLC. All rights reserved.

3© 2016 Global Knowledge Training LLC. All rights reserved.
INTRODUCTIONConfidence is contagious and so is lack of confidence, and a customer will recognize both.— VINCE LOMBARDI
Confidence, be it in an individual, a team or a company, can be the distin-
guishing factor between success and failure in the market. After all, both
internal and external customers will recognize a professional’s and an orga-
nization’s confidence level and make their choices accordingly. Having the
knowledge, skills and expertise to perform the tasks that your role requires
is a sure-fire way to instill and convey confidence in yourself and in your
organization.
In our 2016 IT Skills and Salary Survey, the ninth for Global Knowledge, we
continued to explore IT professionals’ skills and salaries and the factors that
influence both.
New this year is insight directly from application developers, including the
tools and languages they use most.
For the second year, we asked IT decision-makers (ITDMs) to share their
opinions, calling on them to elaborate on:
• Skills gaps and how they affect an IT organization’s ability to deliver.
• Where and why skills gaps exist.
• The value of certification to their team members.
We again pulled in non-IT professionals to get their take on training, certifi-
cation and workplace challenges.

INTRODUCTION
4© 2016 Global Knowledge Training LLC. All rights reserved.
PARTICIPANT PROFILE
Base Salary
Received a Raise Received a Bonus
Raise Percentage Average Bonus
Average Age Male-to-Female Ratio
Average Tenure College Degree
$84,5522012
$78,6492013
$88,9522014
$89,8912015
$87,6062016
2012
63% 65%
2013
70%
2014
75%
2015
75%
2016 2012
48% 48%
2013
53%
2014
63%
2015
66%
2016
2012 2013 2014 2015 2016
5% 5% 5% 5% 5%$3,507
$6,414$5,600$4,522
$5,920
2012 2013 2014 2015 2016
2012 2013 2014 2015 2016
44 42 41 43 41
2012 2013 2014 2015 2016
16 14 14 15 14 2012
70% 67%
2013
72%
2014
69%
2015
72%
2016
3.7:1 4.2:1 3.5:1 4.9:1 3.8:1
2012 2013 2014 2015 2016

INTRODUCTION
5© 2016 Global Knowledge Training LLC. All rights reserved.
OVERRIDING TRENDS
AVERAGE SALARIES FOR IT PROFESSIONALS ARE ON THE RISE, WHILE NON-IT PROFESSIONALS’ SALARIES ARE LOWER.Though combined average salaries for IT professionals and decision-makers
fell by two percentage points—from $88,835 to $86,545—average salaries in-
creased for each group, from $75,889 to $76,865 for IT staff and from $109,165
to $111,167 for ITDMs.
The lower total average is due to a change in the distribution of these two
groups within the response pool. Staff-level IT respondents increased from 63
percent in 2015 to 72 percent in 2016. Conversely, ITDM respondents dropped
from 37 percent in 2015 to 28 percent in 2016.
Non-IT salaries took a plunge this year, averaging $95,019 after last year’s
$109,165 and bringing figures back in line with those from 2014. A nine percent
increase in the number of entry-level—and therefore lower-paid—respondents
is at least partly to blame for that decline.
For IT personnel, other measures showed some improvement. The percentage
of respondents reporting a raise reached 75 for the second year in a row, and
66 percent reported receiving a bonus—the highest percentage we’ve ever re-
ported. The percentage of decision-makers who saw a bonus increased to 70,
up from last year’s 64 percent. Non-IT professionals, however, saw a decline in
the percentage reporting a bonus—59 percent versus 74 percent in the previ-
ous year, a substantial drop.
EXISTING SKILLS GAPS INCREASE STRESS ON EMPLOYEES.When asked to candidly assess their organizational fitness, 31 percent of ITDMs
reported measurable gaps in their group’s technical skill sets. An equal per-
centage reported that, while they are OK today, they have looming concerns
for the next two years. The biggest impact of those skills gaps? Seventy per-
cent of ITDMs said the gaps mean increased stress on existing employees. On
a positive note, 38 percent reported that their IT groups have the skills needed
for today and for the next 12 to 24 months, up from 32 percent in 2015.
CYBERSECURITY, CLOUD COMPUTING AND NETWORKING SKILLS ARE IN DEMAND.IT security tops the list of ITDMs’ in-demand skills for their teams. ITDMs also
identified skills in cloud computing, IT architecture, and network and systems
engineering and operations as high-priority needs. Furthermore, one of three
ITDMs reported having difficulty finding skilled talent to fill cybersecurity po-
sitions, while one of five reported difficulty filling cloud-related ones. Demon-
strating the principles of supply and demand, respondents with job roles in
cloud computing, IT architecture and security reported higher average salaries
than those with job roles in other areas.
BUILDING NEW SKILLS IS THE TOP DRIVER FOR PROFESSIONAL DEVELOPMENT, WHILE LACK OF BUDGET IS THE TOP OBSTACLE.Three-fourths of this year’s IT respondents said they participate in some form
of professional development to build new skills, and half said preparing for a
career certification or specialist exam is a top motivator. More than 45 percent
of those who did not train in the previous year said that their organizations did
not allocate funds for professional development. According to ITDM respon-
dents, lack of training funds is also one of the driving reasons behind skills
gaps in IT departments.

6© 2016 Global Knowledge Training LLC. All rights reserved.
COMPENSATIONMaking money is art and working is art and good business is the best art.— ANDY WARHOL
When it comes to earning potential, several factors are usually at play at any
given time. These include personal factors, such as education, certification,
years on the job and personality, as well as other factors, including geogra-
phy, company size, industry trends, technological changes, and the overall
ebb and flow in global and regional economies.
One-fourth of this year’s IT respondents reported a salary under $60,000.
The median salary for these respondents is $81,300, down four percent from
the prior year’s $85,000. Changes in salary figures emerged from numerous
factors, including the composition of the respondent base, overall econom-
ic influences and changes in overall workforce structure. Compared to last
year’s study, this year’s respondents are slightly less educated and have
fewer certifications on average, all of which contribute to a lower overall
level of pay by whatever metrics might apply to that population.

7© 2016 Global Knowledge Training LLC. All rights reserved.
COMPENSATION
We collected compensation data, including base salaries plus bonuses if appli-
cable, for respondents and compared it to respondents’ levels of responsibility
on the job, ranging from entry-level to executive levels.
Entry-level IT staff (specialists, analysts, associates, level 1, etc.) account for 22
percent of this year’s technical respondents. Average salary for this group is
$61,249 (with a median of $58,195), where typical job roles include senior help
desk specialist, network technician and business systems analyst.
Mid-level professionals (managers and team leads) form the core of this year’s
respondent base, accounting for 50 percent of IT respondents and 61 percent
of non-IT respondents. The average salary for mid-level IT pros who have job
roles such as manager of information security, manager of network operations
and manager of applications systems architecture is $83,655, with a median of
$80,000. The average salary for non-IT mid-level managers and solo contribu-
tors is $90,669 with a median of $89,160.
Respondents in senior-level roles account for more than one-fourth of this
year’s IT participants, with titles such as director of systems engineering, vice
president or director of corporate applications and vice president or director of
enterprise infrastructure. Average salary for these technical positions exceeds
$109,000, with a median of $105,000. Twenty-one percent of non-IT respon-
dents are in senior-level roles, earning an average salary of $120,000 with a
median of $115,000.
Executives with roles such as president, partner and CxO account for two per-
cent of technical respondents and reported an average salary of $130,858, with
a median of $125,000.
SALARY BY LEVEL OF RESPONSIBILITY (TOTAL IT)
Entry-level respondents earn an average of 47 cents to every dollar an execu-
tive-level respondent earns, and the average salary for mid-level respondents
is 37 percent higher than that of entry-level IT professionals. This is up from
31 percent in 2015. Respondents in senior positions realized a bump of 33
percent over their mid-level counterparts, and executives typically saw a bump
of 20 percent over their direct reports. All of this data strongly confirms the
correlation of job seniority with job tenure and responsibilities as reflected in
job titles and levels associated with such job roles. Overall, compensation is up
three percent from last year’s study but still reflects some drag from continu-
ing slow economic growth and organizations’ ongoing conservatism regarding
employee compensation.
$61,249
$83,655
$109,738
$130,858
Average Salary Percent of Respondents
22%
50%26%
2%
Entry-Level Mid-Level Senior-Level Executive

8© 2016 Global Knowledge Training LLC. All rights reserved.
COMPENSATION
SALARY RANGE OF IT RESPONDENTS IN PERCENT
Less than $40,000
$40,000 to $49,999
$50,000 to $59,999
$60,000 to $69,999
$70,000 to $79,999
$80,000 to $89,999
$90,000 to $99,999
$100,000 to $109,999
$110,000 to $119,999
$120,000 to $129,999
2012
More than $130,000
2013
2014
2015
2016
11.0
9.2
12.7
7.2
9.5
5.5
5.1
4.13.8
4.9
5.7
6.66.2
4.7
5.3
7.7
10.7
13.0
8.7
7.8
9.2
12.7
17.3
10.210.1
12.0
14.5
14.0
12.913.3
11.8
13.2
8.9
13.213.0
12.1
10.3
8.1
13.4
12.211.8
9.0
6.3
11.2
10.1
7.8
5.4
4.7
7.88.1
5.3
3.5
4.7
6.9
5.7

9© 2016 Global Knowledge Training LLC. All rights reserved.
COMPENSATION
FUNCTIONAL AREAS AND JOB ROLES
Nearly half of this year’s technical respondents
represent five functional areas: IT security, help
desk, system operations, systems engineering and
network engineering. From an average salary per-
spective, five areas top the list: cloud computing
($115,826), IT architecture ($113,499), IT security
($104,949), business technology ($101,663) and
enterprise infrastructure management ($101,390).
These levels of pay also indicate relatively high
seniority for those who occupy such positions,
by virtue of either extended tenure on the job or
possessing in-demand knowledge and skills.
Within functional areas there is significant variation
in average salaries across specific job roles. For
some job roles, such as enterprise architect, infor-
mation security analyst, and IT risk and compliance
manager, pay is up, as the market seeks to satisfy
the demand for capable and available candidates.
With additional responsibility comes increased
compensation and an opportunity to diversify skills
through the pursuit of advanced training and certi-
fications. This is illustrated clearly in the IT security
area where the range of salary difference between
security specialists and the vice presidents or direc-
tors who lead such organizational units is as high as
over $63,000.
SALARY BY FUNCTIONAL AREA SALARY WITHIN FUNCTIONAL AREA
IT Functional Area Mean Median Count
Cloud computing $115,826 $118,000 11 8
IT architecture $113,499 $110,000 356
IT security $104,949 $102,000 1,184
Business technology $101,663 $95,000 187
Enterprise infrastructure management $101,390 $96,000 345
Java developers $99,763 $97,000 69
Project/Program management $98,607 $94,750 580
Data warehousing / Business intelligence $93,522 $86,105 86
Business application development $92,037 $90,000 198
Voice engineering $91,489 $85,600 318
Systems engineering $89,554 $87,500 795
Business analysis $86,809 $85,000 301
Network engineering $86,158 $81,000 1,185
Database management/development $83,752 $82,000 151
.NET developer $83,484 $80,000 88
Storage/SAN $78,799 $77,000 34
Web/intranet/extranet $76,781 $70,000 94
System operations $71,002 $65,000 1,069
Network operations $69,993 $65,000 933
Help desk $57,286 $51,500 763
All others $90,761 $87,490 69
IT Functional Area Mean Median
IT architectureDirector, Architecture $157,057 $155,000 Director, Applications Systems Architecture $122,509 $115,000 Manager, Applications Systems Architecture $109,725 $116,000 Sr. Applications Systems Architect $112,170 $110,500 Applications Systems Architect $96,253 $91,000 Information Architect $99,095 $98,800 Sr. Data Architect $90,132 $82,500 Data Architect $90,481 $98,010 Enterprise Architect $115,978 $110,000 IT securityVP/Director, Information Security $141,124 $135,000 Manager, Information Security $113,970 $113,214 Security Architect $122,237 $116,500 Information Security Analyst (Jr. or Sr.) $87,942 $87,000 Sr. Security Administrator $102,190 $99,840 Security Administrator $76,709 $73,000 IT Risk and Compliance Manager $110,660 $110,011 Data Security Specialist (Jr. or Sr.) $77,645 $72,000 Network operationsDirector (Senior Manager) $91,339 $85,000 Manager $84,072 $80,000 Sr. Network Technician $77,895 $80,000 Network Technician $60,306 $56,000 Sr. Network Administrator (LAN, WAN) $83,193 $80,000 Network Administrator (LAN, WAN) $63,328 $60,500 Project/Program managementVP/Director Project/Program Management $136,770 $133,100 Manager/Sr. Manager Project/Program Management $101,255 $99,000 Project/Program Coordinator $86,226 $86,000 Project/Program Analyst $75,410 $75,950 Systems engineeringDirector $93,359 $77,000 Manager $110,073 $100,000 Sr. Systems Engineer $96,306 $95,000 Systems Engineer $74,466 $73,219

10© 2016 Global Knowledge Training LLC. All rights reserved.
COMPENSATION
RAISES AND BONUSES
In addition to salary and benefits like insurance and paid time off, raises and
bonuses can add substantially to overall compensation.
Three out of four respondents reported receiving a raise in the prior year. This
is consistent with 2015 results and up five points from 2014. The percentage re-
ceiving a raise has risen each year since reaching an all-time low of 43 in 2010.
Those who saw a raise attributed it primarily to their performance on the job
and standard company increases. This is consistent with last year’s data. Other
popular reasons include internal promotions, taking on new responsibilities and
developing new skills.
Respondents reporting that they received a bonus reached a new level of 66
percent. Just as with raises, the percentage indicating they received a bonus
has increased steadily since reaching its lowest point in 2010.
Not all respondents were bonus eligible—in fact, 24 percent of technical staff
respondents said they were not, consistent with 2015 data. That rate drops to
18 percent for ITDMs and 22 percent for non-technical respondents.
Of those who were bonus eligible, 34 percent did not receive a bonus in the
prior year (37 percent for IT staff, 29 percent for ITDMs and 22 percent for non-
IT). For those who were eligible and did receive a bonus, the typical amount
was one to five percent of annual pay, with 59 percent of staff, 43 percent of
ITDMs and 46 percent of non-IT respondents receiving a bonus in this range.
ITDMs were significantly more likely than staff to receive a bonus greater than
five percent. In fact, 30 percent of ITDMs received a bonus of 11 percent or
greater, compared to 16 percent of IT staff.
HOW SKILLS AND RESPONSIBILITIES AFFECT RAISESFor those receiving a raise up to five percent, typical reasons cited include a
cost of living increase, performance in their current jobs or standard company
raises across the board. Those receiving a moderate raise (six to 10 percent)
were more likely to attribute it to taking on new responsibilities in their cur-
rent position, internal promotion, new assignment at their current company or
developing new skills. Those reporting a significant raise (11 percent or great-
er) were more likely to attribute it to promotion (both external and internal),
bringing valuable new skills to the table or external lateral moves.
PERCENT RECEIVING RAISES AND BONUSES
Received a Raise
Received a Bonus
2012 2013 2014 2015 2016
75%75%70%
65%63%
48% 48%53%
63% 66%

11© 2016 Global Knowledge Training LLC. All rights reserved.
COMPENSATION
REASONS FOR RAISES BY SIZE OF RAISE
1 - 5% 6 - 10% 11% and higher
70%
13%
17%
87% 86%
39%
52%
30%
18%
50%
40%
30%
55%49%
22%
28%
24%
21%
24%
46%
27%
33%
28%
22%22%
33%
27%
11%
3%4%
10%
Performance on current job
Standard company increase
Cost of living increase
Cost of living increase
Promotion within company
Additional responsibilities in current position
New assignment in current company
New assignment in current company
Change at same level to another company
Promotion to another company
Developed new skills that were of added value Others
Size of Raise

12© 2016 Global Knowledge Training LLC. All rights reserved.
COMPENSATION
WHEN CHANGE HAPPENS
One-third of respondents indicated they considered leaving their present field
for another career. This skews lower for ITDMs (29 percent) but up for non-IT
professionals (44 percent). Fourteen percent relocated to take a new position.
One in four (24 percent) moved to a new employer. Thirty-five percent stated
they changed job roles in the previous year, ranging from 30 percent for ITDMs
up to 37 percent for non-IT professionals.
Looking more closely at high-demand specialties, it’s likely that increasing
innovation and new technology adoptions will force change into IT organiza-
tions. Thus, continuing advancement toward cloud-based operations and the
Internet of Things could accelerate these trends as ITDMs seek to reconfigure
their teams to maximize opportunities in the market.
Total EmployeesIT Staff IT Decision-Makers Non-IT
Mean Median Count Mean Median Count Mean Median Count
1 - 99 $60,619 $55,000 760 $106,501 $100,000 457 $75,721 $65,000 135
100 - 499 $66,201 $62,000 1,160 $105,117 $100,000 489 $83,586 $77,150 176
500 - 999 $70,367 $66,000 725 $110,903 $105,000 249 $96,386 $97,499 109
1,000 - 4,999 $75,049 $71,000 1,523 $105,293 $100,000 500 $87,981 $82,000 338
5,000+ $84,342 $81,000 2,234 $113,830 $110,000 826 $100,159 $95,000 505
Total $74,445 $70,000 6,402 $108,829 $103,000 2,521 $91,653 $85,000 1,263
COMPANY SIZE
Employee headcount, both at a specific location and for the company or orga-
nization as a whole, remains a key factor when determining compensation and
job function. It also plays a substantial role in the type of person attracted to
an organization. Some professionals need the challenge and responsibility that
comes with wearing multiple hats in a small company, whereas others prefer
the specialization and defined job ladders found in larger organizations.
From a salary perspective, larger companies pay their technical staff an aver-
age of $23,723 more than firms with fewer than 100 employees. For ITDMs the
bump is $7,329, or 12 percent, over the average for the smallest firms. The trend
is more significant for non-IT respondents who see an average salary difference
of $24,438, or 40 percent, between the largest and smallest firms.
SALARIES BY NUMBER OF EMPLOYEES

13© 2016 Global Knowledge Training LLC. All rights reserved.
COMPENSATION
INDUSTRY
For technical staff across all industries, the average
salary ranges from $62,027 in the educational ser-
vices sector to $91,428 for those who support sys-
tems integration. Technical employees at systems
integrators such as Bechtel Group and General
Dynamics earn the highest average salaries at just
over $108,300, ranging from $91,428 for technical
staff to $119,559 for ITDMs.
Decision-makers tasked with leading IT opera-
tions earn an average of 45 percent more than
their staff counterparts ($111,146 versus $76,858).
Salaries for ITDMs range from $89,728 in educa-
tional services to $134,242 in mining and natural
resources. Non-IT respondents earn an average of
$95,019, ranging from $83,713 for those in edu-
cational services to over $105,000 for those in
banking and finance.
IndustryIT Staff IT Decision-Makers Total IT
Mean Median Mean Median Mean Median
VAR and IS integration $91,428 $77,000 $119,559 $115,000 $108,348 $97,000
IT communication manufacturing $89,555 $84,500 $128,339 $130,000 $100,738 $100,000
Natural resources: Mining, oil, gas $90,925 $90,000 $134,242 $117,450 $100,551 $96,000
Media, film, music $82,782 $81,650 $132,819 $120,000 $95,854 $89,000
IT consulting $79,368 $75,000 $115,700 $110,000 $95,156 $88,000
Banking and finance $84,872 $83,000 $115,974 $111,450 $94,861 $90,000
Insurance, real estate, legal $82,422 $80,000 $121,510 $120,000 $94,651 $91,825
Pharmaceutical, medical, biotech $82,283 $82,000 $120,273 $115,000 $93,373 $91,500
Professional business services $79,216 $76,000 $119,664 $112,500 $92,638 $89,500
Aerospace/Defense $81,808 $80,000 $119,720 $115,000 $91,836 $90,000
Transportation or public utilities $81,745 $80,000 $102,906 $95,000 $87,894 $85,000
Hospitality, travel and recreation $73,419 $75,000 $108,225 $100,000 $87,705 $80,000
Government: Military and homeland security $78,221 $72,000 $112,434 $105,500 $86,971 $82,000
Healthcare $77,933 $75,000 $105,489 $100,410 $85,335 $83,000
Government: Nondefense, state, local $78,000 $76,950 $108,652 $104,250 $84,461 $81,000
Retail $74,499 $74,000 $123,774 $130,000 $83,511 $82,000
Telecommunications $74,806 $73,000 $107,741 $102,425 $82,631 $80,000
IT-related services $71,670 $65,845 $105,528 $100,000 $81,885 $75,000
Manufacturing: Industrial $74,413 $65,500 $102,734 $103,000 $81,653 $73,481
Construction, architecture, engineering $72,592 $67,685 $101,321 $100,000 $80,946 $79,875
Manufacturing: Consumer $74,831 $70,000 $102,995 $98,700 $79,247 $72,000
Nonprofit $66,389 $62,000 $100,091 $87,000 $72,623 $70,000
Education services $62,027 $59,640 $89,728 $85,000 $68,254 $64,000
IT SALARIES BY INDUSTRY

14© 2016 Global Knowledge Training LLC. All rights reserved.
COMPENSATION
GEOGRAPHY
UNITED STATESA region’s cost of living is one of the strongest drivers behind salary. For IT
staff in the continental U.S., the average salary ranges 18 percent from a high
of $80,720 in the Mid-Atlantic region, with markets such as New York and
Philadelphia, to a low of $68,185 in the East South Central region that includes
markets such as Louisville, Memphis or Birmingham. Clearly, variation exists
within any given region as well. Major metro areas that have higher costs of
living than rural areas usually command higher base salaries to match.
For example, the average salary for ITIL®-certified professionals (both staff and
decision-makers) ranges from $92,000 in Mountain markets such as Albuquer-
que, Colorado Springs or Casper to $105,842 in Pacific markets such as San
Diego, Orange County or Portland, Oregon. Cisco-certified professionals see a
similar geographic variation, with salaries in Mountain markets such as Phoenix,
Denver and Boise averaging $75,396, while those in South Atlantic markets
such as Atlanta and Washington average $86,670.
1. PACIFICMEAN: $92,881MEDIAN: $87,801
4. WEST SOUTHCENTRALMEAN: $84,345MEDIAN: $80,000
7. WEST NORTHCENTRALMEAN: $81,537MEDIAN: $77,350
2. MID-ATLANTICMEAN: $91,703MEDIAN: $85,000
5. NEW ENGLANDMEAN: $83,506MEDIAN: $76,000
8. MOUNTAINMEAN: $80,910MEDIAN: $75,000
3. SOUTH ATLANTICMEAN: $90,056MEDIAN: $85,000
6. EAST NORTHCENTRALMEAN: $82,960MEDIAN: $80,000
9. EAST SOUTHCENTRALMEAN: $78,052MEDIAN: $72,841
Top 5 Total IT Salary
Washington, D.C. $104,265
Virginia $103,395
Maryland $99,678
California $96,066
New York $95,219
Bottom 5 Total IT Salary
New Mexico $67,217
Wyoming $65,602
Vermont $62,361
North Dakota $62,125
West Virginia $61,348
For a complete list of salaries by state, see page 60.

15© 2016 Global Knowledge Training LLC. All rights reserved.
COMPENSATION
CANADAWhile salaries in Canada are somewhat lower than those in the U.S., both in
absolute terms and in terms of buying power in their home locations, Canadian
salaries show the same kinds of regional and geographic variability that we see
in the U.S.
Overall, IT professionals working in Canada earn an average of CA$85,045, with
averages for IT technical staff exceeding CA$78,000 and exceeding CA$111,000
for ITDMs. Provincial variations range from CA$68,657 in New Brunswick to
CA$90,537 in Alberta, which is down from the 2015 study and is consistent with
a down market for oil and gas.
From a certification viewpoint, Project Management Professional® (PMP®)-certi-
fied respondents show a peak salary of CA$100,820 in Ontario and CA$103,000
in Alberta. Microsoft-certified professionals’ salaries range from CA$73,411 in
British Columbia to CA$86,758 Alberta.
JOB SECURITY STANDS STRONG
Sixty percent of respondents agreed that they feel more secure than last
year, while 18 percent disagreed and 22 percent were unsure. Further analysis
revealed that professionals who think management values their contributions
also feel more secure and satisfied at work.
Such a sense of job security does not mean, however, that employees are less
likely to consider new opportunities. Consistent with the previous two years,
more than 40 percent of respondents plan to seek new positions in 2016. Fur-
ther, 14 percent of respondents said they relocated in the prior year to take a
new position. One-fourth of respondents changed employers during 2015, and
one-third changed job roles without changing employers.
1. ALBERTAMEAN: $90,537MEDIAN: $85,200
4. SASKATCHEWANMEAN: $83,037MEDIAN: $81,040
7. NOVA SCOTIAMEAN: $79,421MEDIAN: $75,000
2. ONTARIOMEAN: $86,798MEDIAN: $82,500
5. MANITOBAMEAN: $79,749MEDIAN: $72,600
8. BRITISH COLUMBIAMEAN: $79,230MEDIAN: $69,225
3. QUEBECMEAN: $85,558MEDIAN: $85,577
6. OTHERS*MEAN: $79,671MEDIAN: $75,015
9. NEW BRUNSWICKMEAN: $68,657MEDIAN: $66,466
* Twenty respondents were from Prince Edward Island, Newfoundland, Labrador and the three territoriesYukon, Nunavut and Northwest Territories.
For a complete list of salaries by province see page 62.

16© 2016 Global Knowledge Training LLC. All rights reserved.
PROFESSIONAL DEVELOPMENTThere are no secrets to success. It is the result of preparation, hard work and learning from failure.— COLIN POWELL
Advancing one’s career requires regular attention, daily discipline and con-
centrated effort. Professional development takes on many guises, embracing
everything from reading a blog post on virtualization or downloading a white
paper on Agile deployment, to attending a multiday certification prep course
or participating in a cybersecurity conference. We asked respondents for
their views on professional development, including the methods they use to
keep current, its importance to their present career stage, and the kinds of
activities they plan to pursue this year.
When determining the best ways to keep skills up to date, professionals must
weigh benefits with cost, including direct expenses such as course price,
travel and lodging, as well as indirect costs like time away from work. Our
respondents demonstrated that benefits of professional development appear
to justify the investment.

17© 2016 Global Knowledge Training LLC. All rights reserved.
PROFESSIONAL DEVELOPMENT
When asked to select benefits of professional de-
velopment, 89 percent of respondents chose stay-
ing current on technological changes. It ranked
higher for ITDMs (91 percent) and lower for non-IT
professionals (83 percent), with technology staff
falling between those two values.
Among respondents’ perceived benefits, signif-
icant variation exists depending on their levels
of responsibility and career tenure. However, all
respondents shared the viewpoint that training,
either skills-based or certification-focused, allows
them to gain insight critical to their current roles.
Respondents early in their careers or in entry-level
positions view training as a means to develop skills
that will be useful in future positions (71 percent
for entry-level vs. 52 percent for executives).
Similar trends are present for developing a sense
of personal accomplishment, advancing career ob-
jectives and developing professional confidence.
Many respondents see professional development
as a path toward greater personal economic po-
tential, but it is not the primary reason they seek to
benefit from training. In fact, overall, earnings rank
number eight—over 30 percentage points behind
staying up to date on technological changes. Those
early in their careers are more apt to list a boost in
earnings as a perceived benefit when compared to
senior and executive-level respondents.
PERCEIVED BENEFITS OF PROFESSIONAL DEVELOPMENT
Possible BenefitResponsibility Level
Entry-level Mid-level Senior-level Executive Total
Stay up to date on technological changes. 87% 89% 91% 92% 89%
Gain insight that enables me to be more effective in my current role. 77% 77% 77% 78% 77%
Develop skills that will be useful for future positions. 71% 66% 62% 52% 66%
Develop a sense of personal accomplishment. 70% 64% 61% 53% 65%
Advance my career objectives. 70% 62% 61% 46% 63%
Develop professional confidence. 66% 62% 57% 52% 61%
Obtain knowledge that I can share with my colleagues. 57% 59% 59% 61% 59%
Obtain greater earning potential. 65% 58% 55% 44% 58%
Gain from the knowledge of others. 60% 59% 56% 59% 58%
Achieve a higher level of professional status. 62% 56% 54% 37% 56%
Increase my sense of job security. 57% 47% 43% 28% 48%
Interact with others in my profession. 44% 48% 47% 53% 47%
Prepare for the unknown. 47% 43% 43% 43% 44%
Better my standing with management. 40% 38% 36% 32% 37%
Develop an advantage over my peers. 36% 32% 31% 31% 33%
Get closer to strategy, business or customers. 26% 31% 36% 53% 32%
Increasing one’s skills can be seen as a means
of building a cushion in the area of job security.
In theory, lower-skilled employees will be let go
before those with more in-demand skills. This trend
shows up clearly when looking through the lens
of responsibility level. Over half (57 percent) of
entry-level respondents stated training leads to an
increased personal sense of job security. This de-
clined nearly 30 points for executives (28 percent).
Those farther along in their careers see profession-
al development as a means of gaining knowledge
necessary for creating more effective business
strategies. Senior managers and executives also
see interacting with peers and developing deeper
customer relationships as key benefits that may be
obtained from professional development.

18© 2016 Global Knowledge Training LLC. All rights reserved.
HOW PROFESSIONALS STAY UP TO DATE
On average, respondents provided a total of seven
different methods of keeping their knowledge and
skills up to date. Nearly all of them (85 percent)
reported researching topics online. After that, there
is significant variation according to job role, tenure
and level of responsibility. For example, ITDMs are
most likely to report downloading a white paper
(72 percent vs. 59 percent overall). Conversely,
non-technology professionals are more apt to par-
ticipate in classroom training and formal training
sessions at their worksites compared to those in IT
positions.
As a way to pick up new information in a quick
shot, two-thirds of respondents use webinars. This
skews up for those in senior and executive posi-
tions as compared to those in staff- and entry-lev-
el roles. Fifty-one percent of entry-level profes-
sionals reported attending webinars, as compared
to 75 percent of those in executive roles. Atten-
dance at conferences and seminars also increases
with tenure and level of responsibility, with 47 per-
cent of entry-level respondents versus 82 percent
of executives reporting attending such events.
When it comes to identifying a preferred learning
method, answers vary. Overall, respondents prefer
classroom training sessions delivered out of office
and self-paced e-learning methods almost equal-
ly, with those two choices combined accounting
for over 60 percent of responses. Non-technical
professionals show greater preference for off-site
classroom training, whereas those in development
positions skew toward self-paced online methods.
Because time available for training competes with
work tasks, respondents reported turning to meth-
ods that afford them greater control over their
learning and its timing, both inside and outside of
normal working hours. These self-directed meth-
ods include online videos, online communities,
hands-on labs for technical training, printed materi-
als and seeking mentoring from seasoned profes-
sionals. What’s appealing about all of these things,
aside from their content and coverage, is profes-
sionals’ ability to fit learning activities around their
busy work schedules.
Eighty-five percent of respondents reported using
online video for educational purposes. Technology
professionals at both staff and management levels
are more apt than non-technology respondents to
report using video as a means of gaining insight
(86 percent vs. 80 percent). From a satisfaction
standpoint, 81 percent reported being satisfied (59
percent moderately and 22 percent completely
satisfied) with online video’s ability to impart useful
information. Somewhat surprisingly, online video
appeals across all age groups, despite the common
notion that videos are more interesting and entic-
ing to younger members of the workforce.
Given the prevalence and popularity of digital
resources, it is interesting that 75 percent of
respondents reported turning to printed materials
in their search for information. Other methods are
used less frequently: hands-on labs (58 percent),
online communities (55 percent, though higher
with developers and lower with non-IT profession-
als), and mentoring (31 percent). Apparently, there
is still something satisfying about reading text on
paper, even though a screen of some kind is never
far from professionals these days.
PROFESSIONAL DEVELOPMENT

19© 2016 Global Knowledge Training LLC. All rights reserved.
86% 85%82%
85%
72%
61%
75%
65%69%
62%64% 64%
Researching a topic online
Attending web seminars
A self-paced e-learning session
Attending a professional seminar or conference
Downloading a white paper
Reading and/or contributing to a blog
A classroom training session
An informal learning session at work
A live instructor-led online training session
Joining an online community
A formal training session at work
Using a mobile device to download apps or content
Posting to or following someone on
Twitter or LinkedIn
A DVD-based training tool
72%
56%
75%
63%
72%
55% 57% 59%56%
49%
40%
50%46% 44%
54%
46%
47% 44% 46% 46%41%
49%43% 44%
37%32%
38% 38% 36%
54%
38% 38% 36%30%
36%
22%
17% 18% 19%
10% 10% 8% 10%
55%
IT Decision-Makers IT Sta Non-IT Total
METHODS FOR KEEPING SKILLS CURRENT
PROFESSIONAL DEVELOPMENT

20© 2016 Global Knowledge Training LLC. All rights reserved.
PROFESSIONAL DEVELOPMENT
WHY PROFESSIONALS TRAINProfessionals train for many reasons. Perceived benefits aside, across the spec-
trum of roles, 75 percent of technology professionals said they train to deepen
their existing skills and to gain exposure to new topics, tools and technologies.
Preparing for a certification or specialist exam is the second most frequent-
ly mentioned reason for training, at 49 percent overall. This skews up to 57
percent for those who function as IT staff but work outside a formal IT depart-
ment, and it dips down to 32 percent for developers. The importance of certifi-
cation is of lesser concern to developers than it is to other tech professionals in
roles such as security, systems and networking.
Of the respondents who pursued certification in the preceding year, 73 percent
noted an increase in their job effectiveness because of related training. Fifty
percent noted a slight increase and 23 percent reported a significant increase.
Interestingly, ITDMs held a more favorable view of certification and related
training. Eighty-six percent of those who sent their staff for such training noted
at least a slight improvement in job effectiveness.
REASONS FOR TRAINING (IT)
WHY PROFESSIONALS DON’T TRAINNot all of this year’s respondents reported participating in professional develop-
ment. Lack of an available training budget is the primary reason. In fact, over 45
percent of those who did not train said their organizations did not allocate funds
for it. According to the ITDMs who responded, lack of training budget is also one
of the driving reasons behind skills gaps in IT departments. We might expect this
to be an issue solely for smaller organizations, but that percentage remains con-
sistent across all employee groups, regardless of size or industry. Other reasons
include work demands preventing time away from the office, lack of perceived
benefit by management and an inability to travel for training purposes.
One-third of IT respondents indicated they can train only on an ad hoc basis
or if a project requires specific skills. Twenty percent are limited to one course
per year, while 31 percent reported being able to take four or more courses per
year. Access to and support for training varies considerably across the respon-
dent population and remains a major factor in determining whether employees
participate in any sort of professional development activities.
Build new skills Prepare for a career certification or specialist exam
Prepare organization for a new product
deployment or software upgrade
Meet employer’s requirement
Work with cutting-edge technology
Prepare me to qualify for a di�erent job
Solve a particular problem
Evaluate new products for possible
purchase
Other
75% 74% 76% 75%
49%
57%
32%
49%
32% 30%33% 32%
27%32%
26% 28%23%
30% 30%24% 23%
31%
23% 24% 22% 24% 26% 23%17% 15%
20% 17%
3% 3% 3%3%
Formal IT Dept Informal IT Dept Developer Total

21© 2016 Global Knowledge Training LLC. All rights reserved.
PROFESSIONAL DEVELOPMENT
USING INTERNAL VERSUS EXTERNAL TRAINING RESOURCES
Organizations cover employee training needs both internally and externally.
Internal resources include using company employees, such as human resourc-
es or learning and development staff, to train other employees; using inter-
nally developed and managed training materials; and purchasing third-party
dedicated software or printed materials. External resources include online
third-party training software; external trainers brought on-site; and outside
training sessions, conferences and events that employees go to.
More than 85 percent of respon-
dents reported using some form of
external training, compared to 59
percent using internal resources.
Given that organizations can use ex-
ternal, internal or a mix to meet their
learning and development needs, it
is not surprising to see a near ma-
jority (46 percent) of respondents
using both. Just over 41 percent rely
solely on external sources, while
one out of eight IT respondents said
their firms only use internal sources.
External third-party online training software, including virtual classes and online
videos, and sending employees to outside training providers are the most fre-
quently mentioned external resources used for training IT employees. Using com-
pany employees is the most popular internal method that organizations employ.
ANNUAL PROFESSIONAL DEVELOPMENT PLANS
Overall, 53 percent of respondents reported their organizations use annual
planning that includes employee development. This skews upward for Canadi-
an firms (58 percent) and slightly downward for U.S. firms (52 percent). There
is a sizable difference between smaller and larger firms in their use of such
plans. Forty-three percent of organizations with fewer than 100 employees use
annual development plans, as compared to 60 percent of firms with 5,000 or
more employees. Non-technical respondents are more likely to report using
annual training plans in their organizations, compared to IT respondents (60
percent versus 52 percent).
What impact, if any, do these plans have on employee morale or satisfaction?
Employees in organizations with training plans in place reported being less
likely to leave their companies (78 percent versus 73 percent for those without
a plan and 69 percent for those who were unsure if such plans exist). These
employees are also less likely to report that employee turnover is an issue at
their respective companies. The existence of an employee training and devel-
opment plan was positively associated with the belief that an IT professional’s
contribution is valued by their managers and that certifications matter to the
organization as a whole.
It may seem that formalized employee development is the domain of larger
organizations, even though not all larger firms use an annual training plan for
their staff. Yet, overall training plans appear to have merit because of their
association with decreased turnover and creating a greater sense of employee
commitment.
41%External Only
12%InternalOnly
46%Internal & External
IT TRAINING RESOURCES

22© 2016 Global Knowledge Training LLC. All rights reserved.
PROFESSIONAL DEVELOPMENT
CERTIFICATIONS: HAS THE GOLD STANDARD BEEN DEBASED?
IT certifications are considered a gold standard
for exhibiting knowledge learned, and by proxy,
one’s ability to perform on the job. However, are
such certifications worth the time and the expense
they require? Is it better to simply pursue skills as
needed? After all, there are numerous low-cost,
readily available ways to acquire usable informa-
tion. In other words, what’s the value proposition
for certification?
Two trends support a contention that certification
is more popular than ever and more appreciated
and valued by the people who pursue them and
by the people who hire them.
Among technical respondents, nearly nine out
of 10 report having earned at least one profes-
sional certification during their careers. This is
up 10 points from last year (87 percent versus 77
percent in 2015). This ranges from 77 percent for
entry-level respondents up to 92 percent for IT
professionals in executive roles.
Twenty-nine percent reported earning their most
recent certification within the last six months.
What about current certification interest? Forty
percent report they are currently working on a
certification, up from 36 percent in the 2015 study.
That said, only nineteen percent indicated having
plans to start a new certification in 2016, down
substantially from 26 percent last year. Also, over
40 percent reported that they have no plans to
pursue certification in 2016, up slightly from 38
percent in 2015. Current enrollment or expressed
plans to pursue a certification is highest for those
early in their careers (67 percent) and declines
to 44 percent for those in executive positions.
Considering all of these various metrics, interest in
certification appears to remain strong and grow-
ing slightly stronger, though immediate plans to
pursue certification in the short term are down
somewhat from previous years.
In addition, current or expected involvement with
certification-related training varies by technical
discipline. Overall, 59 percent of IT professionals
are currently working on, or plan to pursue, some
form of certification within the current year. This
skews up for networking operations and engineer-
ing, cloud computing, and help desk, and it skews
down for those in development positions, business
analysis and project management.
CompTIA is the certification provider mentioned
most frequently by respondents, with 35 percent
of the certified IT professionals reporting they
hold one or more CompTIA certifications. Comp-
TIA certifications span numerous functional areas,
including networking, security and project man-
agement. One in four certified respondents to this
year’s survey hold an A+ certification, one in five
hold a Network+ certification and 17 percent hold
a Security+ certification. CompTIA certifications
are frequently foundational, so their average salary
tends to be lower than other providers. However,
two CompTIA certifications, Cloud Essentials and
CompTIA Advanced Security Practitioner (CASP)
trend above the average at $102,568 and $90,579,
respectively.
Rounding out the top five certification catego-
ries are Cisco (2,595), security (2,332), Microsoft
(2,327), and ITIL and IT service management
(1,440). The average salary for Cisco certification
holders is $82,746, compared to an average of
$88,447 for all certified IT respondents.

23© 2016 Global Knowledge Training LLC. All rights reserved.
PROFESSIONAL DEVELOPMENT
IT professionals with experience and certifications in the IT security field are
in strong demand. The ITDMs who responded said these candidates are at
the top of their 2016 lists for talent recruitment. Average salaries within this
category range from $81,316 for CompTIA Security+ to over $120,000 for
(ISC)2’s Certified Information Security Manager (CISM) and ISACA’s Certified
in Risk and Information Systems Control (CRISC) and Certified Information
Systems Security Professional (CISSP) variants. Security certifications also
garner three of the top five salaries reported.
Nearly 2,600 IT respondents reported holding at least one Cisco certifica-
tion and average holding two of them. Salaries range from $70,819 for Cisco
Certified Entry Networking Technician (CCENT) to $121,578 for CCNP Data
Center. Average salaries for CCNA-level certifications are in the mid-$80,000s.
Presumably, higher-level Cisco certifications such as CCAr would trend even
higher salary-wise, but we didn’t receive enough responses from professionals
holding those certifications to back up this assertion.
Over 2,300 respondents reported having at least one Microsoft certification,
where over 50 percent indicated that they possessed one certification in
that category. The Microsoft Certified Professional (MCP) received the most
mentions with 41 percent of those holding a current Microsoft certification
reporting that they have an MCP. As with other large vendors, there is a range
of expertise levels and related salaries. Entry-level certifications such as the
Microsoft Technology Associate (MTA) earn $66,608 on average. Salaries for
certifications such as the MCP and the Microsoft Certified Solutions Associate
(MCSA) are typically in the $80,000 range. IT professionals with more ad-
vanced certifications, including the MCSE and its variants, could easily earn in
excess of $100,000.
Certification Category Mean Median Count Percent
Application Development $91,248 $88,166 250 3%
Avaya $89,667 $85,000 118 2%
Big data $101,812 $90,000 53 1%
IT architecture $111,404 $108,690 115 1%
Business process $100,129 $95,000 277 4%
Business analysis $103,051 $96,000 244 3%
Cisco $82,746 $77,000 2,595 33%
Citrix $90,846 $85,000 626 8%
Cloud $119,238 $120,000 299 4%
CompTIA $76,575 $70,910 2,688 35%
EMC $96,568 $86,000 110 1%
Help desk $71,104 $64,950 196 3%
Governance $123,350 $119,000 214 3%
HP $86,735 $83,250 156 2%
IBM $95,944 $95,000 147 2%
Internet/Web development $74,046 $69,000 283 4%
ITIL and IT service management $98,212 $95,000 1,440 19%
Juniper $94,975 $87,000 176 2%
Knowledge management $87,530 $76,300 37 0%
Microsoft $84,229 $80,000 2,327 30%
Networking $85,509 $80,000 519 7%
Novell $95,893 $87,500 229 3%
Oracle/Database $95,911 $90,000 123 2%
Project management $97,655 $94,100 892 11%
Red Hat / Linux $90,538 $85,000 255 3%
SAP $124,904 $118,000 34 0%
Security $95,603 $91,306 2,332 30%
Sun $106,009 $101,000 85 1%
VMware $95,056 $90,000 681 9%
Virtualization $102,696 $95,000 99 1%
Wireless $90,510 $82,500 178 2%
Other certifications $92,249 $89,000 836 11%
MOST POPULAR CERTIFICATION CATEGORIES

24© 2016 Global Knowledge Training LLC. All rights reserved.
PROFESSIONAL DEVELOPMENT
Professionals who have ITIL and IT service management certifications aver-
age $98,212, or 11 percent above the norm for certified respondents overall
($88,456). More than 90 percent of respondents in this category hold an ITIL
Foundation, which has an average salary exceeding $98,000. The range for the
category is not as high as others, but salaries for several of the more advanced
certifications such as ITIL Service Lifecycle: Service Operation and ITIL Service
Lifecycle: Service Transition exceed $117,000 on average.
Respondents said certifications have a positive impact on their earning po-
tential—some more positive than others, as evidenced by this year’s Top 20
Highest-Paying Certifications list. To be included in the list, a certification must
have had at least 100 respondents.
In 2014 and 2015, security certifications held the top spot for salary. This year,
the highest average salary ($131,443) goes to respondents holding ISACA’s
Certification in the Governance of Enterprise IT (CGEIT). Security certifications
remain close behind with three of the top five slots occupied by CRISC, CISM
and CISSP.
As computing technology’s transition toward the cloud continues, so does the
importance of skilled IT professionals who are needed to design, guide and
implement this process. Training that leads to certification across the Amazon
Web Services (AWS) portfolio helps build the skills needed to design, deploy
and operate applications and infrastructure in the AWS environment. The AWS
Certified Solutions Architect – Associate boasts an average salary of $123,801.
Other cloud certifications show significant value too, including cloud comput-
ing credentials from VMware, Cisco, Citrix and Microsoft.
The Project Management Institute’s PMP certification is never far from the top
five. As IT and other projects continue to expand in scope and complexity, it is
Certification Mean Median Count
CGEIT: Certification in the Governance of Enterprise IT $131,443 $125,000 123
AWS Certified Solutions Architect - Associate $123,801 $120,000 203
CRISC: Certified in Risk and Information Systems Control $121,424 $120,000 274
CISM: Certified Information Security Manager $121,177 $118,000 377
CISSP: Certified Information Systems Security Professional $120,933 $117,000 589
CISA: Certified Information Systems Auditor $112,931 $110,000 574
PMP: Project Management Professional $112,153 $108,690 437
CCIE Routing and Switching $109,656 $103,000 128
Citrix Certified Advanced Administrator – XenApp 6 $108,113 $100,000 133
Certified ScrumMaster $107,080 $100,882 102
Citrix Certified Expert – Virtualization (CCE-V) $106,496 $102,000 108
CCAdmin – XenApp 5 $105,242 $100,000 140
CCNA Data Center $105,136 $96,000 155
Certified Business Analysis Professional $105,045 $98,000 114
MCSE: Microsoft Certified Systems Engineer 2003 $105,013 $98,000 205
CCAdmin – XenDesktop 5 $103,534 $100,000 155
CCDP Cisco Certified Design Professional $103,360 $97,700 175
CCNP Security $102,832 $98,000 163
CEH: Certified Ethical Hacker $102,482 $101,250 178
Six Sigma Green Belt $101,550 $96,000 151
TOP 20 HIGHEST-PAYING CERTIFICATIONS
Certifications listed here had at least 100 responses. For a complete list of certifications by salary, see page 41.

25© 2016 Global Knowledge Training LLC. All rights reserved.
PROFESSIONAL DEVELOPMENT
critical to mission success for trained professionals to oversee their implemen-
tation. According to PMI Today, there are over 694,000 PMP-certified individ-
uals worldwide. Salaries for PMP-certified professionals range from a median
of $108,690 up to an average of $112,153. Obtaining this certification is often a
pathway for technical professionals to move out of the trenches into roles offer-
ing expanded responsibilities with commensurate (and greater) compensation.
The remainder of the top 20 is from a diverse mix of disciplines. Citrix has four
certifications on the list, including the Citrix Certified Expert in Virtualization
(CCE-V). All earn between $101,000 and $108,000 on average. Between them,
Cisco and Microsoft have five certifications on the list, including CCIE Rout-
ing and Switching and the MCSE on Windows Server 2003, a platform that
reached end-of-life status in July 2015. Other categories represented include
security (Certified Ethical Hacker), business analysis (Certified Business Analy-
sis Professional), business process (Six Sigma Green Belt) and project manage-
ment (Certified Scrum Master).
From the salary perspective there are a few additional certifications worth
keeping an eye on. The COBIT certification, from ISACA, provides IT execu-
tives the essential guidance needed to govern their organization’s IT activities.
Average salary for COBIT holders typically falls in the range of $115,000 up to
$123,000. The Cisco Design Associate (CCDA) provides a fundamental knowl-
edge of network design to those who are expanding into networking roles.
Average salary for holders of this certification is around $100,000. Those who
require a working knowledge of Juniper networking systems and protocols can
strive for the JNCIA-Junos and its average salary of $94,000. Finally, if Linux
is important to your career path, then consider the Red Hat Certified Engineer
(RHCE) whose average salary also pushes $100,000. For interested IT profes-
sionals, Red Hat offers an enterprise- and Linux-focused certification program
that is both broad and deep.
SHOWING OFF YOUR BADGE
Digital badges are considered a validated indicator of one’s skills and accom-
plishments. For example, AWS gives their certification holders the ability to ex-
hibit the AWS Certified logo on LinkedIn, outbound emails and websites. Some
of the functions of digital badges include a signal of achievement to potential
employers, a means for motivating engagement and collaboration, and build-
ing a sense of identity within learning communities.
Only three out of 10 (31 percent) of IT respondents indicated some level of
familiarity with the digital badge construct. Overall, 70 percent reported having
no familiarity with the concept. Of those familiar, 59 percent have at least one
badge.
Attitudes toward badging are moderate, with up to half of respondents ex-
pressing agreement with statements such as “Badges highlight and recognize
the skills and knowledge that come from personal initiative,” “Badges encour-
age peer-based assessment,” and “Badges enhance my personal identity and
reputation.” The takeaway from these responses: If you plan to display a badge
as part of your professional persona, you must also be prepared to answer
questions about that badge and to explain its meaning and value.

INTRODUCTION
26© 2016 Global Knowledge Training LLC. All rights reserved.
HIGHER BAR, MORE VALUE FOR MICROSOFT CERTIFICATIONSWhen Microsoft reinvented its MCSA and MCSE certifi-cations in 2012, moving from Microsoft Certified Systems Administrators and Engineers to Microsoft Certified Solutions Associates and Experts, the company also raised the bar for achieving them. Becoming certified now requires passing more exams, and those exams are more rigorous—much more rigorous, according to the Microsoft instructors at Global Knowledge.
Previously, IT professionals would take one exam to be-come a Microsoft Certified Technology Specialist (MCTS) and then take two or three exams to achieve Microsoft Certified IT Professional (MCITP) status. Now, profession-als on the path to an MCSE—the current road map’s equiv-alent to MCITP—must first earn an MCSA that requires two to three exams and then pass two MCSE exams.
At the same time that the exams have become more challenging, the certification paths have grown longer, and more specialized paths have become available, we’ve noticed a decline in the number of survey respon-dents who are Microsoft-certified. We’ve also noticed a steady decline in the number of Microsoft certifications that make our Top 20 Highest-Paying Certifications list.
For a certification to be included on that list, at least 100 respondents must have provided salary data about it. So, just because a Microsoft certification isn’t on our top-paying list doesn’t mean we haven’t heard from Microsoft-certified professionals who are bringing in list-worthy salaries. It simply means we haven’t heard from enough of them.
Even without the required 100 responses, the data we’ve collected suggests that while it may take longer to earn an MCSE certification, the pursuit pays off. In fact, some MCSE specializations are bringing in salaries that rival those of even the highest-paying certifications on our list. So, raising the bar for Microsoft certifications may have made them a little less common among the respondents to this survey, but it also appears to have increased their value.
Construction on the Microsoft certification road map is far from over. Further refinements are sure to follow the upcoming releases of Windows Server 2016, Exchange 2016 and SQL Server 2016. In fact, those pending releases could be another factor in the declining certification rate, as professionals wait to certify on the latest and greatest.
As Microsoft Azure expands access to other operating systems and platforms, and as Azure expertise becomes required for partner’s cloud certifications, the frequen-cy and value of Azure certifications will certainly grow. Also, perhaps the recent additions to the developer path will result in more professionals attaining MCSD certifi-cation, the developer equivalent of MCSE.
Year IT Respondents Total Certified Microsoft-Certified Microsoft Certs in Top-Paying 20
2013 10,068 8,356 (83%) 4,447 (54% of all certified) 8
2014 10,299 7,518 (73%) 2,462 (33% of all certified) 4
2015 9,611 7,400 (77%) 2,173 (35% of all certified) 3
2016 8,923 7,763 (87%) 2,327 (30% of all certified) 1
Certification Year Count Median Salary
MCSE: Data Platform 2013 0 —
2014 11 $118,191
2015 12 $92,364
2016 12 $131,172
MCSE: Messaging 2013 0 —
2014 93 $99,824
2015 49 $95,559
2016 48 $119,016
MCSE: Private Cloud 2013 24 $89,149
2014 29 $92,599
2015 30 $94,919
2016 30 $108,779
MCSE: Server Infrastructure 2013 88 $86,600
2014 85 $94,747
2015 64 $93,267
2016 85 $104,851
PROFESSIONAL DEVELOPMENT

27© 2016 Global Knowledge Training LLC. All rights reserved.
PERSPECTIVE:
IT DECISION-MAKERSWhenever you see a successful business, someone once made a courageous decision.— PETER F. DRUCKER
There is no lack of courageous decisions to be made by those tasked
with running an organization. This applies equally to those who manage
a four-person help desk team up to those charged with stewarding entire
organizations. In this year’s survey, we asked ITDMs a select set of questions
aimed at assessing their staff training needs and the impact, if any, skills
gaps are having on their ability to accomplish their business missions.
One out of four IT respondents (28 percent or N = 2,521) hold a position of
responsibility. This skews up to 30 percent for U.S. respondents and down
to 21 percent for Canadian respondents. Nearly nine out of 10 are male, with
over 60 percent having invested 16 or more years in their careers. Over half
(56 percent) manage teams and operations in IT security, network engi-
neering, systems engineering or IT architecture. Half manage teams of up to
10. At the other end of the spectrum, 18 percent are responsible for teams
exceeding 100 full-time employees.

28© 2016 Global Knowledge Training LLC. All rights reserved.
IT DECISION-MAKERS
46%10%
11%
13%
22%
4%
25%
49%
11%
6%
15%
67%
45%
15%
20%
20%
$499,999 or Less $500,000 - 999,999 $1 Million - $2.9 Million $3 Million or More
10 Employees or Less 11–99 Employees
100–499 Employees 500 or More Employees
DEPARTMENT SIZE AND BUDGET ALLOCATIONS
The budget ranges, which exclude salaries, are consistent with the reported
staff sizes. In one corner, two-thirds of the smallest teams have budgets under
$500,000, with the majority of this group having a budget under $250,000. In
the other corner, two-thirds of the largest teams have budgets exceeding $3
million. Half of those responding expect to see their staff and technology bud-
gets increase this year (ranging from 44 percent for the smallest organizations
up to 60 percent for those with 500+ staff). Typical increases will be one to
five percent. Overall, one-third expect their budgets to be flat, with the remain-
ing 17 percent expecting a decrease in available funding.
IT BUDGET BY STAFF SIZE
29© 2016 Global Knowledge Training LLC. All rights reserved.
IT DECISION-MAKERS
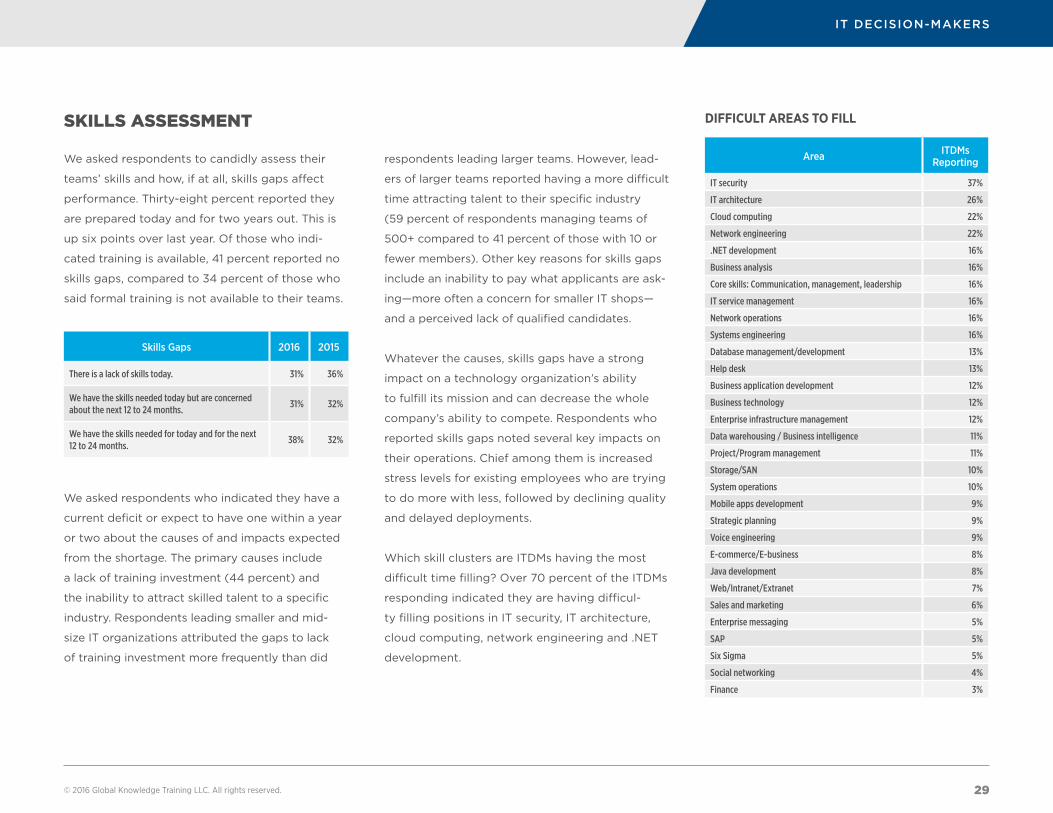
SKILLS ASSESSMENT
We asked respondents to candidly assess their
teams’ skills and how, if at all, skills gaps affect
performance. Thirty-eight percent reported they
are prepared today and for two years out. This is
up six points over last year. Of those who indi-
cated training is available, 41 percent reported no
skills gaps, compared to 34 percent of those who
said formal training is not available to their teams.
We asked respondents who indicated they have a
current deficit or expect to have one within a year
or two about the causes of and impacts expected
from the shortage. The primary causes include
a lack of training investment (44 percent) and
the inability to attract skilled talent to a specific
industry. Respondents leading smaller and mid-
size IT organizations attributed the gaps to lack
of training investment more frequently than did
respondents leading larger teams. However, lead-
ers of larger teams reported having a more difficult
time attracting talent to their specific industry
(59 percent of respondents managing teams of
500+ compared to 41 percent of those with 10 or
fewer members). Other key reasons for skills gaps
include an inability to pay what applicants are ask-
ing—more often a concern for smaller IT shops—
and a perceived lack of qualified candidates.
Whatever the causes, skills gaps have a strong
impact on a technology organization’s ability
to fulfill its mission and can decrease the whole
company’s ability to compete. Respondents who
reported skills gaps noted several key impacts on
their operations. Chief among them is increased
stress levels for existing employees who are trying
to do more with less, followed by declining quality
and delayed deployments.
Which skill clusters are ITDMs having the most
difficult time filling? Over 70 percent of the ITDMs
responding indicated they are having difficul-
ty filling positions in IT security, IT architecture,
cloud computing, network engineering and .NET
development.
Area ITDMs Reporting
IT security 37%
IT architecture 26%
Cloud computing 22%
Network engineering 22%
.NET development 16%
Business analysis 16%
Core skills: Communication, management, leadership 16%
IT service management 16%
Network operations 16%
Systems engineering 16%
Database management/development 13%
Help desk 13%
Business application development 12%
Business technology 12%
Enterprise infrastructure management 12%
Data warehousing / Business intelligence 11%
Project/Program management 11%
Storage/SAN 10%
System operations 10%
Mobile apps development 9%
Strategic planning 9%
Voice engineering 9%
E-commerce/E-business 8%
Java development 8%
Web/Intranet/Extranet 7%
Sales and marketing 6%
Enterprise messaging 5%
SAP 5%
Six Sigma 5%
Social networking 4%
Finance 3%
DIFFICULT AREAS TO FILL
Skills Gaps 2016 2015
There is a lack of skills today. 31% 36%
We have the skills needed today but are concerned about the next 12 to 24 months.
31% 32%
We have the skills needed for today and for the next 12 to 24 months.
38% 32%

30© 2016 Global Knowledge Training LLC. All rights reserved.
IT DECISION-MAKERS
REASONS BEHIND SKILLS GAPS
IMPACT OF SKILLS GAPS ON THE ORGANIZATION
We have not invested enough in training to
develop the skills we need.
It’s dicult to attract candidates with the skills we
need to our industry.
We cannot pay what candidates demand.
We would hire more people if there were more
qualified candidates.
Our current training programs are not e�ective in developing the skills we need
our employees to have.
We have not e�ectively anticipated
the skills we need.
We do not have the ability to track and measure
the skills that exist in our employee base.
The skills we need tend to be mostly located
outside of our country.
45%
38%41% 42% 43%
59%
40% 40%
29%33%
29%
37%
27%
41%
27%23%
14%
30%
24% 23%
32% 32%
18% 18% 18%15%
3% 5% 4% 4%
46% 44%
10 Employees or Less 11 - 99 Employees 100 - 499 Employees 500 Employees or More
Sta� Size
Increased stress on existing employees
Di�culty meeting quality objectives
Delayed deployments of new hardware and/or
software
Delays in developing new products or services
Increased operating costs
Declining customer satisfaction
Loss of revenues Loss of business to competitors
Di�culty reaching revenue growth
objectives
72%67% 66%
73%
49%43%
48%
61%
45% 43% 44%50%
41%
47%42%
50%
36% 38%
20%
53%
35%32%
44%40%
26% 24%20%
28%24% 22%
25%28%
24%23% 21%17%

31© 2016 Global Knowledge Training LLC. All rights reserved.
IT DECISION-MAKERS
IS TRAINING NECESSARY?
Six out of 10 ITDM respondents reported that their team members receive com-
pany-provided training. At 52 percent, the ratio is lowest for organizations with
10 or fewer staff and up to 71 percent for IT organizations with 500 or more
staff. For respondents whose organizations offer training, 70 percent have sent
their team members to outside training providers of one kind or another.
Certification-focused training was on the docket for over two-thirds of the
ITDMs who had staff trained. Over two-thirds authorized training for certifica-
tion or recertification (65 to 74 percent, depending on staff size). The general
perception of these managers is that staff who are certified bring added value
to the organization. When it comes to job effectiveness, one out of four
(25 percent) noted a significant increase in performance post-certification.
Over 60 percent reported seeing at least a moderate increase in the effective-
ness of their staff after gaining certifications.
Looking forward, ITDMs definitely see training as important to mitigating the skills
gaps they now face. Skills development is at the top of the list, with over 57 per-
cent reporting a high likelihood of pursuit. Larger organizations are apt to have a
diversified workforce and are more likely to embrace training in the areas of proj-
ect management, business process improvement and leadership development.
LIKELIHOOD FOR TRAINING IN 2016
IT skills training Certification-focused training Project management Business process improvement Leadership
54%
62%
52%57%
10 Employees or Less 11 - 99 Employees 100 - 499 Employees 500 Employees or More
47%
54%51% 53%
21%25%
32% 30%
16%
26% 26%31%
24%
35%32%
36%

32© 2016 Global Knowledge Training LLC. All rights reserved.
PERSPECTIVE:
APPLICATION DEVELOPERSIt’s kind of fun to do the impossible.— WALT DISNEY
There is no denying we live in an application-centric world. According to
the online statistics portal Statista, as of June 2015 more than 100 billion
mobile apps have been downloaded from the Apple App Store alone, not to
mention downloads from Google Play, the Microsoft Store and other similar
outlets. The app market has expanded from primarily productivity and in-
formative tools, such as calendars, email and weather apps, to products that
support leisure activities, including games, entertainment and education.
Once only the domain of mobile browsers, the world of mobile software is
being overtaken by mobile apps. Consider for example, the category of mo-
bile social networking properties. It includes Facebook with its monthly 700
million plus active mobile-only users and represents one of the largest online
communities worldwide. There is also a strong growth trend in mobile retail
thanks to shopping apps. All in all, application development has become a
gargantuan business—not just for mobile devices, but also for laptops and
other electronic gadgetry.
To get a sense of what’s going on in this booming field, in this year’s survey,
we included a separate question set specifically for developers, including
business application developers, Java developers, .NET developers, mobile
app developers and web/intranet/extranet developers. Developers account
for six percent of the North American respondents (N = 620). Eighty percent
of those respondents are male, entirely in line with the larger overall set of
IT respondents. The largest group (45 percent) are in mid-level roles, with an
average of 11 to 15 years of tenure in their careers.

33© 2016 Global Knowledge Training LLC. All rights reserved.
APPLICATION DEVELOPERS
WHAT TOOLS ARE IN THEIR TOOLKITS?
On average, developers employ five tools to get
their work done. Languages and database tools
are the leaders in the app development space.
Integrated development environments, version
control procedures and bug-tracking tools round
out the top five. All of these items are essential
to developing, testing, releasing and maintaining
quality software.
Seventy percent of those in development roles
use one or more programming languages. On
average, developers use six different languages
to accomplish their tasks. More than 60 percent
of the developers who responded said they use
JavaScript, SQL and some version of HTML. XML,
Java, .NET and CSS round out the top of the list.
Thirteen languages are used by at least 10 percent
of the developers responding. The tools with fewer
mentions include Ruby, Objective-C, COBOL, RPG,
Python and Visual Basic.
On average, the developers who responded are
involved in two areas of software development.
Nearly two-thirds (65 percent) are involved in
business application development, and more than
60 percent include web development in their list
of tasks. Half are involved in system development.
APPLICATION DEVELOPERS’ TOOLS OF THE TRADE CRITICAL LANGUAGES SOFTWARE DEVELOPMENT
Tool
Languages 70%
Database tools 70%
Integrated development environments 57%
Version control 56%
Bug tracking 51%
Framework 50%
Storage 44%
Project management tools 40%
Web hosting 37%
Website analytics 25%
Other 3%
Language
JavaScript 67%
SQL 66%
HTML 62%
XML 48%
Java 46%
.NET 43%
CSS 42%
C# 33%
Python 27%
ASP 21%
C/C++ 21%
PHP 18%
Perl 10%
Areas
Business applications 65%
Web development 61%
Systems development 51%
Test automation 31%
Mobile applications 28%
Embedded systems development 14%
Scientific development 5%
Other 3%

34© 2016 Global Knowledge Training LLC. All rights reserved.
APPLICATION DEVELOPERS
We asked the developers who responded to share their thoughts on the
trends shaping their work. Security concerns are top of mind. According to
one respondent, “Security, Security, Security. With all the hacking of company
systems, every level of an IT department needs to be aware of how they can
do their jobs better and make their code or the systems they administer more
secure.”
Other developers focused on the continued shift toward development for mo-
bile applications. This is a natural outgrowth of burgeoning Internet of Things
activity, with more networking things to interact with and manage. Many de-
velopers mentioned cloud computing in all of its many manifestations. As one
respondent reported, “Cloud services will eventually take most of the repetitive
effort out of building software.”
From a skills perspective it is apparent that to be successful in the develop-
ment world, one needs to be able to bridge multiple platforms. Respondents
reported seeing increasing use of HTML5, Python and Angular JS. According
to one developer from New York, “To be successful you need to stay aware of
technological changes, maintain a base-level knowledge of secondary skills
and [understand] how different technologies integrate.”
Several respondents emphasized the need for fluency in multiple languages,
or at the very least an ability to pick up new programming languages quickly.
Flexibility and adaptability are key attributes for anyone who wishes to be suc-
cessful in a software development role of some kind.

35© 2016 Global Knowledge Training LLC. All rights reserved.
PERSPECTIVE:
NON-IT PROFESSIONALSYesterday’s home runs don’t win today’s games.— BABE RUTH
Although most non-IT professionals do not see training and certification in
the same light as those in technology do, there is no doubt that both are
important to career development and advancement. As the foregoing quote
from the Babe reminds us, what we learned yesterday may have worked
then, but we must keep our eyes on what is ahead if we are to succeed in the
days and years to come. Non-IT professionals, especially those outside ac-
credited professions, such as law, engineering, and accounting, need to keep
their skills fresh to stay competitive and help their organizations compete.
More than 1,200 professionals from fields as diverse as accounting to strate-
gic planning responded to a slate of questions on professional development,
certification and workplace challenges. The non-IT respondent is markedly
different from his or her technology counterpart. Non-IT respondents are
more apt to hold a graduate degree (33 percent versus 19 percent), to be
female (44 percent versus 18 percent), to be more tenured in their careers,
and to manage both staff and budget.

36© 2016 Global Knowledge Training LLC. All rights reserved.
NON-IT PROFESSIONALS
A certification equating to expertise is less common outside the tech world,
though there are some notable exceptions, such as project management,
accounting, law and financial planning. Yet, non-tech professionals still place
value on professional development. Overall, 78 percent rated professional
development as important or very important in the context of their current
career stages. As with tech professionals, training for new skills and/or certifi-
cation varies by tenure. It’s important or very important for 87 percent of those
with five or fewer years under their belt versus 72 percent of those with over 20
years of experience.
Over 80 percent reported they would likely undertake training of some form in
2016. Over half of those responding said they have plans to work toward some
level of professional certification.
Respondents reported needing training in several areas. Topping the list are
skills that foster effective communication and the ability to interact with superi-
ors, peers and subordinates, followed by leadership and risk management skills.
Perceptions of which skills to improve upon is a function of both internal re-
flection and an awareness of what is happening in the organization. From the
perspective of workplace challenges, respondents said internal communication
is the most relevant, followed by needing to lead without authority and unclear
job roles and responsibilities. The latter point is no doubt driven by the change
that comes from the process of flattening an organization or growth through
mergers and acquisitions. Above all, this points to the need for individual con-
tributors to be able to collaborate well with others and to persuade, encourage
and cajole their co-workers into helping them meet organizational objectives,
with or without the mantle of a formal leadership or management position.
IMPORTANCE OF PROFESSIONAL DEVELOPMENT
Area Percent
Communication skills 48%
Interpersonal skills 42%
Leadership 42%
Risk management 41%
Presentation skills 39%
Process improvement 39%
Team building 38%
Training and development 38%
Change management 37%
Thinking and innovation 37%
Time management 37%
Management and supervisory skills 36%
Project/Program management 36%
Strategic planning 35%
Business analysis 34%
Business intelligence 30%
Customer service 28%
Predictive analytics and data mining 28%
Business enhancement skills 27%
Business writing 25%
KEY TRAINING AREAS WORKPLACE CHALLENGES
Area Percent
Communication within organization 52%
Leading without authority 39%
Unclear job roles and responsibilities 39%
Working with remote teams 37%
Collaborating with teams 36%
Working across borders and cultural differences
24%
Managing budget resources 24%
Working with supervisors 20%
Other 5%
None 8%
2%Unimportant
20%Somewhat important
34%Important
44%Very important

37© 2016 Global Knowledge Training LLC. All rights reserved.
LOOKING FORWARDSuccess is where preparation and opportunity meet.— BOBBY UNSER
IT security is the technology area most likely to expand in 2016, followed by
cloud initiatives and IT architecture. In fact, more than 40 percent of the IT
respondents, both staff and decision-makers, reported that their organiza-
tions expect to increase security efforts this year. This is consistent across
company size, industry and geography and shows how important security is
to organizations of all sizes and stripes, no matter how they earn their keep
or what kind of objectives they’re seeking to meet.
The percentage of respondents who reported that IT and business projects
are resuming or being initiated has held steady over the last four years (in
the mid-70 percent range). In this year’s survey, one-third reported a slight
increase in projects, with 30 percent indicating a moderate increase and 14
percent reporting a significant increase.
The percentage of respondents who indicated that their organizations are
facing challenging conditions or reported that conditions are “the worst
ever” increased to 49, up from 44 percent in the 2015 study. Over 28 percent
of respondents reported that their organizations are in environments where
business conditions are either significantly improving or where “business
is good.” This has remained stable over the last four years as well. One in
four reported they are in slow-growth mode. Firms that see their business
conditions as good or significantly improving are more apt to pursue new
technical and business projects. They are also more likely to invest in training
for their technical employees.

38© 2016 Global Knowledge Training LLC. All rights reserved.
LOOKING FORWARD
TECHNOLOGY AREAS OF INTEREST FOR 2016
43%
38%35%
31%
26%23% 22%
20% 20%
20% 19% 17% 17% 16% 16% 15% 15% 14%
13% 13% 12%10% 9%
7% 7% 7% 6%
Cybersecurity Cloud Computing IT Architecture Network Engineering Network Operations Storage/SAN System Operations Systems Engineering Enterprise Infrastructure Management
Help Desk Voice Engineering Database Management/Development
Project/Program Management
Business Intelligence/Predictive Analytics
Web/Intranet/Extranet
Business Technology Business Analysis Data Warehousing
Business Application Development
Business Process Improvement
Mobile Apps Development
.NET Development E-commerce/E-business
Enterprise Messaging Java Development Social Networking SAP

39© 2016 Global Knowledge Training LLC. All rights reserved.
CONCLUSIONSSuccess is nothing more than a few simple disciplines, practiced every day. — JIM ROHN
What factors have the greatest impact on project success? We asked respon-
dents to rank five: team skill, team effort, project leadership, vendor support
and other factors. Forty-three percent of respondents, ranging from 37 per-
cent for decision-makers to 54 percent for non-technical professionals, ranked
project leadership most important. Team skill and team effort tied for second.
What is clear is that organizations are willing to invest in personnel and
the technology they need to better themselves in the market. Agility is the
watchword for today. Trends such as costly security threats and the promise
of a better, or at least more connected, world arising from the Internet of
Things require companies to maintain an agile stance if they seek to remain
competitive. The power that IT and business professionals have to influence
this process is the value they bring to the table through ongoing knowledge
and skills development. It is this artful combination of resources and employ-
ee ingenuity that enables organizations to stay relevant and competitive.
New skills not only add to one’s acumen, but also open doors for advance-
ment and enable professionals to better their economic potential. Certifica-
tions are still seen as valuable within professional communities served by IT
and non-IT professionals. This trend is unlikely to change as the pace of tech-
nological innovation and market forces continue to demand that we develop
new ways of thinking and executing.

40© 2016 Global Knowledge Training LLC. All rights reserved.
ACKNOWLEDGEMENTS
ABOUT GLOBAL KNOWLEDGE
Global Knowledge is the world’s leading learning
services and professional development solutions
provider. We deliver learning solutions to support
customers as they adapt to key business trans-
formations and technological advancements that
drive the way that organizations around the world
differentiate themselves and thrive. Our learning
programs, whether designed for a global organi-
zation or an individual professional, help business-
es close skills gaps and foster an environment of
continuous talent development.
Offering the most relevant and timely content
delivered by the best instructors, we provide
customers around the world with their choice
of customized private programs, convenient
public training scheduling options, flexible de-
livery formats and continuous learning support
to accelerate their success. Our business skills
solutions teach essential communications skills,
leadership development, business analysis, project
management, IT service management and process
improvement. With thousands of courses spanning
from foundational training to specialized certifica-
tions, our core IT training is focused on technolo-
gy partners such as Amazon Web Services, Cisco,
IBM, Microsoft, Red Hat, SAP and VMware. We
offer comprehensive professional development
for advancements in application development, big
data analytics, change management, cloud com-
puting, cybersecurity and networking.
Founded in 1995, Global Knowledge employs
more than 1,700 people worldwide and is head-
quartered in Cary, North Carolina. Learn more at
www.globalknowledge.com.
THANKS TO OUR PARTNERS
Global Knowledge extends a special
thank you to our partners for helping
make this year’s survey possible:
Amazon Web Services
Cisco
Citrix
CIW
Certification Partners
CompTIA
EMC
HDI
IBM
Information Systems Audit and Control
Association (ISACA)
International Avaya Users Group (IAUG)
(ISC)2
Juniper
Microsoft
PEOPLECERT
Red Hat
SAP
Skillsoft
Trainingindustry.com
UBM
VMware
ABOUT THE PRIMARY RESEARCHER
Greg Timpany is the senior manager for market
research and competitive intelligence at Global
Knowledge. He has more than 25 years of experience
in market research, competitive intelligence and
database marketing. His experience includes research
design and implementation for both consumer and
B2B segments. He is also a published author and
lecturer focusing on the effective use of marketing
data. Greg has held positions with Guitar Center, Los
Angeles Times and Wilkin Guge Marketing. He holds
an MBA in information systems and marketing from
California State University, San Bernardino.

© 2016 Global Knowledge Training LLC. All rights reserved.
APPENDIX
41
AREA CERTIFICATIONU.S. CANADA
MEAN MEDIAN COUNT MEAN MEDIAN COUNT
Application Development Certified Scrum Developer (CSD) $98,931 $98,500 16 $99,500 $105,000 4
Certified Software Development Associate (CSDA) $38,000 $38,000 1 — — 0
Certified Software Development Professional (CSDP) $131,200 $131,200 1 $67,274 $81,000 5
Development Certifications through Colleges and Universities $75,821 $81,180 35 $84,935 $81,000 10
Java ME Mobile Application Developer $78,490 $65,500 12 $84,908 $88,332 5
JBoss Certified Application Administrator (JBCAA) $98,650 $104,800 4 — — 0
MCSD: Web Applications $94,300 $88,000 37 $64,130 $64,130 1
MCSD: Windows Metro Style Apps Using C# $99,367 $94,000 15 $81,400 $81,400 2
MCSD: Windows Metro Style Apps Using HTML 5 $84,875 $92,250 4 — — 0
MCSD: Windows Store Apps $90,630 $94,000 9 $61,600 $61,600 1
Microsoft Certified Professional Developer (MCPD) $93,891 $89,600 39 $76,734 $86,265 6
Mobile App Security+ $94,114 $105,000 14 $86,070 $86,070 2
MTA: Mobile Development Fundamentals $76,632 $69,000 10 — — 0
Oracle Application Express (APEX) Developer Certified Expert $90,794 $93,087 4 $41,535 $41,535 2
Oracle Certified Associate (OCA), Java $94,316 $82,500 36 $88,300 $95,000 4
Oracle Certified Expert (OCE), Java $107,945 $95,000 11 — — 0
Oracle Certified Master (OCM), Java $98,750 $90,000 8 $106,200 $100,000 5
COMPLETE LISTS OF SALARIES BY CERTIFICATION AND STATE/PROVINCE
To ensure the integrity of the information we provide, for a certification to appear in our “highest-paying” and “most popular” lists, we require that it has data from
at least 100 respondents. The lists below do not have that requirement and are for information purposes only. The fewer responses a certification receives, the less
reliable the data, so use your judgment when drawing conclusions.
SALARIES BY CERTIFICATION

© 2016 Global Knowledge Training LLC. All rights reserved.
APPENDIX
42
AREA CERTIFICATIONU.S. CANADA
MEAN MEDIAN COUNT MEAN MEDIAN COUNT
Oracle Certified Professional (OCP), Java $107,885 $102,500 35 $96,889 $95,000 9
Professional Scrum Developer I (PSD 1) $96,925 $96,925 1 — — 0
Professional Software Developer (PSD) $84,000 $84,000 1 $71,530 $81,000 5
Salesforce Certified App Builder $124,210 $100,000 8 $93,900 $93,900 2
Salesforce Certified Platform Developer I $73,000 $73,000 4 $94,760 $96,000 5
SAP Certified Development Associate $76,000 $82,000 6 $95,933 $96,000 3
Other Application Development $91,608 $90,000 36 $85,350 $76,800 8
Avaya Avaya Certified Implementation Specialist (ACIS) $88,211 $82,400 47 $88,333 $84,000 6
Avaya Certified Support Specialist (ACSS) $88,765 $86,000 43 $92,117 $72,000 12
Avaya Implementation Professional Specialist (AIPS) $96,647 $97,000 17 $81,194 $90,000 9
Avaya Support Professional Specialist (ASPS) $98,755 $81,000 11 — — 0
Big Data Cloudera Certified Administrator for Apache Hadoop (CCAH) $87,332 $89,820 13 $85,600 $80,000 3
Cloudera Certified Developer for Apache Hadoop (CCDH) $130,786 $130,000 14 $84,200 $80,000 4
Cloudera Certified Specialist in Apache Hbase (CCSHB) $126,833 $90,000 3 $68,560 $80,000 5
Other Big Data $107,240 $105,000 15 $70,706 $71,513 4
IT Architecture Cisco Business Value and IT Roadmap Specialist $83,118 $85,000 11 $86,024 $90,525 3
Cisco Business Value Practitioner $110,644 $103,100 16 $96,175 $87,263 6
Cisco Business Value Specialist $105,429 $105,600 26 $85,212 $87,263 10
Cisco Transformative Architecture Specialist $123,907 $110,000 15 $104,431 $95,263 8
TOGAF 9.1 $121,390 $120,000 47 $111,890 $108,690 25
Other Business Architecture $132,794 $135,368 11 — — 0
Business Process Six Sigma Black Belt $105,600 $93,000 25 $95,231 $90,525 15

© 2016 Global Knowledge Training LLC. All rights reserved.
APPENDIX
43
AREA CERTIFICATIONU.S. CANADA
MEAN MEDIAN COUNT MEAN MEDIAN COUNT
Six Sigma Green Belt $102,594 $96,000 112 $98,551 $96,000 39
Six Sigma Master Black Belt $97,709 $96,000 17 $90,982 $96,000 13
Other Business Process $97,602 $94,000 49 $99,235 $96,000 17
Business Analysis Certification of Competency in Business Analysis $96,608 $95,500 30 $86,930 $75,000 7
Certified Business Analysis Professional (CBAP) $105,228 $98,000 83 $104,557 $96,800 31
PMI Professional in Business Analysis $112,072 $114,000 44 $101,161 $81,600 10
Other Business Analysis $104,482 $94,600 36 $89,161 $85,200 25
Cisco CCIE Collaboration $122,161 $141,000 14 $73,621 $74,742 4
CCIE Data Center $119,912 $110,000 38 $92,109 $90,000 7
CCIE Routing and Switching $112,858 $111,000 103 $96,463 $82,500 25
CCIE Security $95,176 $99,200 74 $97,633 $93,263 10
CCIE Service Provider $182,000 $190,000 5 $89,800 $76,000 4
CCIE Voice $109,104 $105,000 41 $70,137 $85,200 7
CCIE Wireless $96,406 $83,500 30 $97,200 $96,000 5
CCNA Cloud $112,865 $120,000 13 $64,284 $64,284 1
CCNA Collaboration $87,241 $80,000 37 $52,332 $52,332 2
CCNA Data Center $107,045 $100,000 134 $92,954 $86,261 21
CCNA Industrial $86,850 $80,000 6 $66,449 $63,313 6
CCNA Routing and Switching $79,942 $75,000 1,547 $78,831 $75,000 187
CCNA Security $85,598 $82,000 413 $96,328 $92,600 36
CCNA Service Provider $112,972 $120,000 9 $50,162 $50,162 1
CCNA Video $86,425 $80,000 38 $61,588 $61,825 4

© 2016 Global Knowledge Training LLC. All rights reserved.
APPENDIX
44
AREA CERTIFICATIONU.S. CANADA
MEAN MEDIAN COUNT MEAN MEDIAN COUNT
CCNA Voice $89,889 $85,000 267 $77,491 $69,225 53
CCNA Wireless $90,901 $85,000 159 $88,073 $82,140 24
CCNP Cloud $88,143 $65,000 7 — — 0
CCNP Collaboration $109,389 $113,500 18 $112,500 $124,250 4
CCNP Data Center $123,444 $115,000 57 $108,283 $88,130 8
CCNP Routing and Switching $95,881 $92,000 501 $89,195 $82,520 78
CCNP Security $101,414 $98,000 145 $114,255 $105,600 18
CCNP Service Provider $102,872 $76,500 18 $134,400 $145,200 3
CCNP Voice $95,060 $90,800 128 $93,439 $90,000 29
CCNP Wireless $115,375 $103,500 48 $96,000 $93,000 6
Cisco Certified Design Associate (CCDA) $99,946 $93,250 242 $102,675 $90,000 33
Cisco Certified Design Expert (CCDE) $94,743 $83,000 44 $71,956 $65,845 7
Cisco Certified Design Professional (CCDP) $105,008 $99,000 146 $95,061 $90,000 29
Cisco Certified Entry Networking Technician (CCENT) $70,698 $65,000 753 $72,217 $65,000 65
Other Cisco $87,772 $79,000 75 $84,765 $80,000 12
Cloud AWS Certified Developer – Associate $126,210 $130,000 51 $93,192 $99,400 6
AWS Certified DevOps Engineer – Professional $130,284 $135,000 19 — — 0
AWS Certified Solutions Architect – Associate $125,871 $120,000 187 $99,609 $97,124 16
AWS Certified Solutions Architect – Professional $126,546 $120,000 35 $110,000 $110,000 2
AWS Certified SysOps Administrator – Associate $122,735 $120,000 67 $79,033 $73,275 6
Cloud Business Associate $87,240 $110,000 5 $63,999 $49,750 5
Cloud Technology Associate $79,601 $70,000 15 $66,416 $64,125 6

© 2016 Global Knowledge Training LLC. All rights reserved.
APPENDIX
45
AREA CERTIFICATIONU.S. CANADA
MEAN MEDIAN COUNT MEAN MEDIAN COUNT
CompTIA Cloud Essentials $104,974 $107,500 24 $109,200 $109,200 2
Professional Cloud Administrator $95,111 $82,000 9 $96,800 $96,800 2
Professional Cloud Developer $154,000 $154,000 2 $96,800 $96,800 2
Professional Cloud Security Manager $158,333 $90,000 3 — — 0
Professional Cloud Service Manager $150,000 $150,000 2 $108,900 $108,900 4
Professional Cloud Solutions Architect $179,117 $200,000 3 — — 0
Other Cloud $136,000 $136,000 2 — — 0
CompTIA A+ $72,546 $65,000 1611 $75,243 $70,455 238
CASP $90,579 $81,000 42 — — 0
Cloud Essentials $102,568 $100,000 33 $71,467 $85,200 3
Healthcare IT Technician $77,934 $69,000 33 $87,000 $87,000 2
IT Fundamentals $74,371 $65,000 98 $72,395 $70,910 15
Mobile App Security+ $93,622 $84,800 9 $96,300 $96,300 2
Mobility+ $79,579 $80,000 19 $75,817 $77,836 5
Network+ $74,828 $68,000 1293 $73,477 $69,225 115
Project+ $76,279 $70,000 247 $83,601 $80,918 16
Security+ $81,467 $75,000 1216 $79,246 $74,400 89
Server+ $82,918 $72,000 117 $76,522 $71,000 35
Storage+ $92,823 $73,000 22 $100,500 $96,300 6
Other CompTIA $80,970 $70,000 85 $73,040 $66,000 4
Citrix Citrix Certified Administrator (CCA) for XenApp 5 $107,561 $103,000 119 $92,100 $88,000 21
Citrix Certified Administrator (CCA) for XenApp 6 $95,192 $88,500 270 $81,689 $72,000 45

© 2016 Global Knowledge Training LLC. All rights reserved.
APPENDIX
46
AREA CERTIFICATIONU.S. CANADA
MEAN MEDIAN COUNT MEAN MEDIAN COUNT
Citrix Certified Administrator (CCA) for XenDesktop 5 $104,174 $100,000 136 $98,951 $94,600 19
Citrix Certified Administrator (CCA) for XenServer 6 $103,696 $100,000 131 $84,159 $79,750 18
Citrix Certified Advanced Administrator (CCAA) for Citrix XenApp 6 $110,002 $100,000 118 $93,247 $94,600 15
Citrix Certified Associate – Networking (CCA-N) $101,991 $100,000 73 $104,853 $94,600 13
Citrix Certified Associate – Virtualization (CCA-V) $92,527 $87,000 162 $98,917 $90,600 29
Citrix Certified Enterprise Engineer (CCEE) $108,362 $103,000 81 $106,608 $108,000 8
Citrix Certified Expert – Virtualization (CCE-V) $107,710 $102,000 97 $95,788 $85,092 11
Citrix Certified Integration Architect (CCIA) $110,225 $103,000 67 $123,052 $121,000 5
Citrix Certified Professional – Mobility (CCP-M) $94,992 $86,500 48 $83,000 $83,000 1
Citrix Certified Professional – Networking (CCP-N) $99,050 $100,000 80 $125,600 $121,000 6
Citrix Certified Professional – Virtualization (CCP-V) $102,138 $100,000 117 $94,082 $91,960 17
Other Citrix $92,977 $100,000 22 $103,632 $95,000 3
EMC EMC Cloud Architect (EMCCA) Specialist – Virtualized Infrastructure $162,313 $161,000 8 $71,000 $71,000 1
EMC Cloud Infrastructure and Services Associate (EMCCIS) $112,000 $112,000 2 — — 0
EMC Information Storage Associate (EMCISA) $95,037 $92,000 41 $102,085 $87,500 9
EMC Storage Administrator (EMCSA) Expert – CLARiiON Solutions $109,914 $95,000 7 — — 0
EMC Storage Administrator (EMCSA) Specialist – Backup and Recovery – Avamar $96,813 $90,500 12 — — 0
EMC Storage Administrator (EMCSA) Specialist – Backup and Recovery – NetWorker $99,205 $84,910 4 — — 0
EMC Storage Administrator (EMCSA) Specialist – CLARiiON Solutions $106,929 $105,000 7 $140,000 $140,000 2
EMC Storage Administrator (EMCSA) Specialist – Network Attached Storage (NAS) $89,250 $80,000 4 $65,845 $65,845 2
EMC Storage Administrator (EMCSA) Specialist – Storage Area Network (SAN) $90,957 $81,700 14 — — 0
EMC Storage Administrator (EMCSA) Specialist – Storage Management – ControlCenter $107,500 $107,500 2 $109,200 $109,200 2

© 2016 Global Knowledge Training LLC. All rights reserved.
APPENDIX
47
AREA CERTIFICATIONU.S. CANADA
MEAN MEDIAN COUNT MEAN MEDIAN COUNT
EMC Storage Administrator (EMCSA) Specialist – Symmetrix Solutions $93,750 $80,000 4 — — 0
EMC Storage Administrator (EMCSA) Specialist – VNX Solutions $101,369 $96,000 24 $86,910 $87,500 5
Other EMC $109,367 $100,000 15 $95,000 $95,000 1
Governance Certified in the Governance of Enterprise IT (CGEIT) $130,199 $125,000 97 $136,085 $125,550 26
COBIT $124,759 $120,000 70 $119,312 $100,000 24
Other Governance $82,039 $83,000 14 $96,566 $108,000 3
Help Desk HDI Desktop Support Manager (HDI-DSM) $82,283 $72,000 34 $85,103 $83,811 16
HDI Desktop Support Technician (HDI-DST) $69,337 $60,500 74 $73,838 $67,698 22
HDI Problem Management Professional (HDI-PM) $111,791 $105,975 8 $60,054 $62,804 4
HDI Support Center Analyst (HDI-SCA) $64,141 $57,475 44 $65,637 $60,000 8
HDI Support Center Director (HDI-SCD) $124,797 $120,000 5 — — 0
HDI Support Center Manager (HDI-SCM) $76,379 $71,700 24 $68,110 $68,110 1
HDI Support Center Team Lead (HDI-SCTL) $72,510 $71,700 22 $76,821 $70,607 6
HP AIS: HP ProLiant ML/DL/SL Servers $83,682 $79,500 36 $84,923 $84,000 15
AIS: HP Storage Works $92,223 $65,000 17 $112,685 $113,060 4
AIS: Network Infrastructure $96,457 $96,000 19 $113,250 $124,000 4
AIS: ProCurve Networking $102,625 $93,000 8 $89,016 $72,000 5
APC: HP Imaging and Printing Solutions $76,099 $63,000 12 $114,096 $109,200 5
APP: Enterprise Solutions $112,962 $125,000 7 — — 0
APS: HP BladeSystem Solutions $103,059 $95,000 17 $123,810 $123,810 4
APS: HP LaserJet Solutions $76,214 $63,000 16 $79,064 $90,600 9
APS: HP ProLiant ML/DL/SL Servers $98,286 $80,000 7 $57,520 $55,000 5

© 2016 Global Knowledge Training LLC. All rights reserved.
APPENDIX
48
AREA CERTIFICATIONU.S. CANADA
MEAN MEDIAN COUNT MEAN MEDIAN COUNT
ASC: HP BladeSystem $88,274 $65,000 17 $77,000 $77,000 1
ASC: HP ProCurve Networking $95,873 $83,500 8 $72,000 $72,000 1
ASE: HP ProLiant ML/DL Servers $86,287 $81,000 15 $62,650 $56,900 4
ASE: HP StorageWorks $113,523 $100,000 8 $100,000 $100,000 2
ASE: Network Infrastructure $93,474 $90,000 16 $79,100 $73,800 6
Other HP $92,005 $92,000 33 $52,000 $52,000 1
IBM IBM Administrator $99,938 $102,500 14 $94,500 $94,500 2
IBM Administrator for SOA Solutions $92,993 $118,000 7 $77,022 $77,022 1
IBM Advanced Application Developer $83,987 $80,200 4 $77,022 $77,022 1
IBM Advanced Database Administrator $91,571 $120,000 7 — — 0
IBM Advanced Deployment Professional $103,667 $118,000 3 $77,000 $77,000 1
IBM Advanced Security Professional $130,100 $132,500 6 — — 0
IBM Advanced System Administrator $101,733 $110,000 13 $96,800 $96,800 1
IBM Advanced Technical Expert $77,873 $71,500 8 — — 0
IBM Analyst — — 0 $77,000 $77,000 1
IBM Application Developer $125,000 $125,000 4 — — 0
IBM Associate BPM Analyst $75,000 $75,000 2 $106,509 $106,509 1
IBM Associate BPM Developer $103,667 $118,000 3 — — 0
IBM Associate Business Process Analyst $88,333 $90,000 3 $50,650 $50,650 1
IBM Associate System Administrator $35,000 $35,000 1 — — 0
IBM BPM Developer $81,000 $81,000 2 — — 0
IBM Business Process Analyst $35,000 $35,000 1 $106,509 $106,509 1

© 2016 Global Knowledge Training LLC. All rights reserved.
APPENDIX
49
AREA CERTIFICATIONU.S. CANADA
MEAN MEDIAN COUNT MEAN MEDIAN COUNT
IBM Database Administrator $96,089 $120,000 9 $100,000 $100,000 1
IBM Database Associate $94,933 $123,200 3 $90,000 $90,000 1
IBM Deployment Professional $75,000 $75,000 1 $90,000 $90,000 1
IBM Implementation Professional $143,117 $137,350 3 $93,833 $90,750 3
IBM Implementation Specialist $132,000 $110,000 5 $92,875 $90,750 4
IBM Operator $66,667 $75,000 3 $66,461 $66,461 2
IBM Sales Specialist $99,850 $101,250 5 $90,750 $90,750 2
IBM SOA Solution Designer — — 0 $83,070 $83,070 1
IBM Solution Advisor $115,500 $111,000 4 — — 0
IBM Solution Developer $111,400 $114,500 8 — — 0
IBM Solution Expert $110,125 $112,000 8 — — 0
IBM Solution Implementer $115,667 $110,000 3 — — 0
IBM Solutions Specialist $115,372 $111,000 5 $81,000 $81,000 2
IBM Specialist $92,533 $88,000 27 $97,441 $96,800 8
IBM Storage Administrator $75,167 $65,000 6 $91,667 $87,500 3
IBM Support Professional $72,276 $65,000 5 $99,000 $99,000 1
IBM System Administrator $97,098 $104,133 22 $79,600 $90,000 3
IBM Systems Expert $98,416 $113,600 5 $96,800 $96,800 1
Other IBM $103,631 $90,000 21 $109,485 $109,485 2
Internet Database Design Specialist $71,382 $65,599 74 $61,000 $61,000 1
E-Commerce Specialist $66,665 $62,500 20 $46,000 $46,000 1
Internet Business Associate $74,856 $69,000 23 — — 0
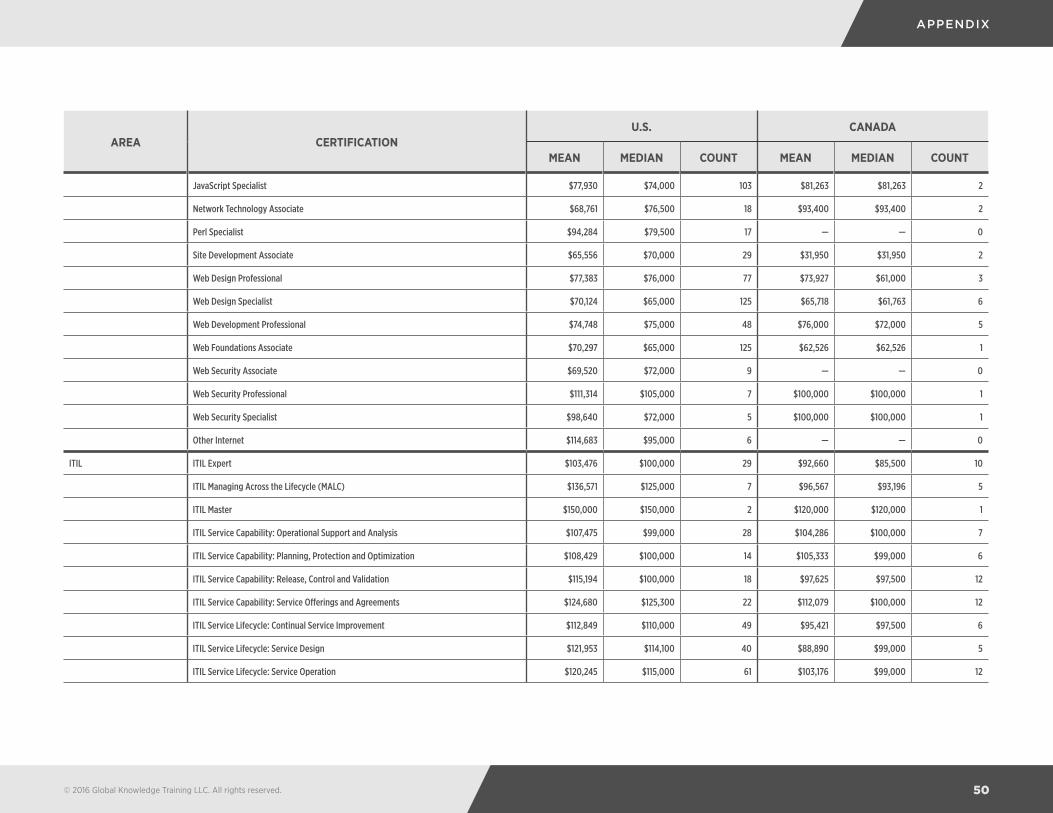
© 2016 Global Knowledge Training LLC. All rights reserved.
APPENDIX
50
AREA CERTIFICATIONU.S. CANADA
MEAN MEDIAN COUNT MEAN MEDIAN COUNT
JavaScript Specialist $77,930 $74,000 103 $81,263 $81,263 2
Network Technology Associate $68,761 $76,500 18 $93,400 $93,400 2
Perl Specialist $94,284 $79,500 17 — — 0
Site Development Associate $65,556 $70,000 29 $31,950 $31,950 2
Web Design Professional $77,383 $76,000 77 $73,927 $61,000 3
Web Design Specialist $70,124 $65,000 125 $65,718 $61,763 6
Web Development Professional $74,748 $75,000 48 $76,000 $72,000 5
Web Foundations Associate $70,297 $65,000 125 $62,526 $62,526 1
Web Security Associate $69,520 $72,000 9 — — 0
Web Security Professional $111,314 $105,000 7 $100,000 $100,000 1
Web Security Specialist $98,640 $72,000 5 $100,000 $100,000 1
Other Internet $114,683 $95,000 6 — — 0
ITIL ITIL Expert $103,476 $100,000 29 $92,660 $85,500 10
ITIL Managing Across the Lifecycle (MALC) $136,571 $125,000 7 $96,567 $93,196 5
ITIL Master $150,000 $150,000 2 $120,000 $120,000 1
ITIL Service Capability: Operational Support and Analysis $107,475 $99,000 28 $104,286 $100,000 7
ITIL Service Capability: Planning, Protection and Optimization $108,429 $100,000 14 $105,333 $99,000 6
ITIL Service Capability: Release, Control and Validation $115,194 $100,000 18 $97,625 $97,500 12
ITIL Service Capability: Service Offerings and Agreements $124,680 $125,300 22 $112,079 $100,000 12
ITIL Service Lifecycle: Continual Service Improvement $112,849 $110,000 49 $95,421 $97,500 6
ITIL Service Lifecycle: Service Design $121,953 $114,100 40 $88,890 $99,000 5
ITIL Service Lifecycle: Service Operation $120,245 $115,000 61 $103,176 $99,000 12

© 2016 Global Knowledge Training LLC. All rights reserved.
APPENDIX
51
AREA CERTIFICATIONU.S. CANADA
MEAN MEDIAN COUNT MEAN MEDIAN COUNT
ITIL Service Lifecycle: Service Strategy $112,664 $110,000 45 $89,176 $99,000 3
ITIL Service Lifecycle: Service Transition $133,962 $119,500 50 $98,353 $96,000 11
ITIL v3 Foundation $99,869 $96,000 1063 $94,247 $88,000 289
Kepner-Tregoe Foundation $88,412 $100,000 13 $113,167 $109,500 6
Other ITIL $108,087 $110,000 23 $80,311 $84,000 15
Juniper Juniper Networks Certified Associate – Firewall/VPN (JNCIA-FWV) $104,650 $105,000 10 — — 0
Juniper Networks Certified Associate – Junos (JNCIA-Junos) $93,563 $85,000 113 $95,537 $86,000 21
Juniper Networks Certified Professional – Enterprise Routing and Switching (JNCIP-ENT) $94,006 $95,250 18 $84,500 $84,000 4
Juniper Networks Certified Professional – Security (JNCIP-SEC) $88,140 $80,000 10 $96,000 $96,000 2
Juniper Networks Certified Specialist – Enterprise Routing and Switching (JNCIS-ENT) $95,148 $85,000 27 $113,091 $121,000 11
Juniper Networks Certified Specialist – Firewall/VPN (JNCIS-FW) $114,700 $112,000 5 — — 0
Juniper Networks Certified Specialist – Security (JNCIS-SEC) $89,383 $85,000 15 $99,975 $90,525 6
Other Juniper $81,366 $70,000 9 — — 0
Knowledge Management Knowledge Center Support Fundamentals $85,873 $76,150 20 $119,466 $144,000 3
Knowledge Center Support Principles $88,660 $82,000 21 $62,570 $64,900 5
Microsoft MCITP: Database Administrator $102,284 $100,000 38 $72,279 $80,000 12
MCITP: Enterprise Administrator $100,361 $90,000 176 $79,760 $72,804 26
MCITP: Enterprise Desktop Administrator 7 $87,782 $85,000 122 $89,142 $87,000 21
MCITP: Enterprise Desktop Support Technician 7 $83,942 $84,000 90 $82,658 $75,600 25
MCITP: Enterprise Support Technician $88,257 $84,000 116 $80,198 $75,600 15
MCITP: Microsoft Certified IT Professional $94,450 $88,000 190 $78,444 $80,000 34
MCITP: Server Administrator $97,293 $90,000 142 $73,615 $75,975 25

© 2016 Global Knowledge Training LLC. All rights reserved.
APPENDIX
52
AREA CERTIFICATIONU.S. CANADA
MEAN MEDIAN COUNT MEAN MEDIAN COUNT
MCSA: SQL Server 2012 $101,480 $90,000 19 $50,954 $40,000 7
MCSA: Windows 7 $76,120 $72,000 152 $70,604 $70,607 27
MCSA: Windows 8 $91,647 $87,750 27 $54,333 $58,000 3
MCSA: Windows Server 2008 $89,288 $84,000 139 $89,047 $84,546 24
MCSA: Windows Server 2012 $76,988 $70,000 171 $73,226 $70,000 47
MCSD: Web Applications $94,300 $88,000 37 $64,130 $64,130 1
MCSD: Windows Metro Style Apps Using C# $99,367 $94,000 15 $81,400 $81,400 2
MCSD: Windows Metro Style Apps Using HTML 5 $84,875 $92,250 4 — — 0
MCSD: Windows Store Apps $90,630 $94,000 9 $61,600 $61,600 1
MCSE: Business Intelligence $131,111 $90,000 9 $89,788 $89,788 2
MCSE: Communication $135,218 $120,000 9 $83,725 $90,600 3
MCSE: Data Platform $144,140 $134,000 10 $66,330 $66,330 2
MCSE: Desktop Infrastructure $101,538 $83,000 35 $71,782 $78,000 7
MCSE: Messaging $130,917 $121,000 35 $86,973 $91,960 13
MCSE: Private Cloud $118,082 $98,500 22 $83,197 $81,323 8
MCSE: Server Infrastructure $111,154 $102,000 68 $79,641 $81,040 17
MCSE: SharePoint $83,557 $83,500 14 $75,455 $66,000 5
MCTS: Microsoft Exchange Server 2007, Configuration $107,815 $104,646 29 $86,077 $84,000 11
MCTS: Microsoft Office SharePoint Server 2007 – Configuration $106,418 $92,000 22 $78,667 $72,000 3
MCTS: SQL Server 2005 $103,173 $98,300 15 $84,000 $84,000 3
MCTS: Windows 7, Configuration $75,211 $73,000 139 $79,547 $75,000 21
MCTS: Windows Server 2008 Active Directory Configuration $88,112 $84,000 91 $77,924 $72,804 24

© 2016 Global Knowledge Training LLC. All rights reserved.
APPENDIX
53
AREA CERTIFICATIONU.S. CANADA
MEAN MEDIAN COUNT MEAN MEDIAN COUNT
MCTS: Windows Server 2008 Applications Infrastructure Configuration $94,485 $85,000 75 $97,849 $95,850 10
MCTS: Windows Server 2008 Network Infrastructure Configuration $87,025 $84,000 73 $82,727 $80,000 23
MCTS: Windows Vista, Configuration $102,267 $90,000 47 $79,027 $77,304 8
Microsoft Certified Application Developer (MCAD) $86,090 $85,000 10 $41,535 $41,535 2
Microsoft Certified Architect (MCA) $90,562 $80,000 35 $75,421 $83,070 8
Microsoft Certified Database Administrator (MCDBA) $100,034 $95,000 36 $81,124 $66,000 7
Microsoft Certified Desktop Support Technician (MCDST) $81,917 $80,000 167 $77,237 $72,000 31
Microsoft Certified Professional (MCP) $82,618 $78,000 804 $78,015 $72,609 150
Microsoft Certified Professional Developer (MCPD) $93,891 $89,600 39 $76,734 $86,265 6
Microsoft Certified Solutions Associate (MCSA) $91,273 $84,000 201 $79,969 $78,020 40
Microsoft Certified Solutions Developer (MCSD) $108,247 $88,000 12 $60,000 $60,000 2
Microsoft Certified Solutions Expert (MCSE 2012) $86,893 $81,500 46 $84,830 $75,000 15
Microsoft Certified Solutions Expert (MCSE) $102,868 $88,000 41 $77,541 $70,000 13
Microsoft Certified Systems Administrator (MCSA) $88,043 $84,900 178 $87,502 $93,400 22
Microsoft Certified Systems Engineer (MCSE 2003) $106,925 $100,000 179 $91,849 $88,200 26
Microsoft Certified Systems Engineer (MCSE) $101,918 $93,000 253 $85,727 $84,000 63
Microsoft Certified Technology Specialist (MCTS) $82,492 $80,000 198 $78,991 $80,000 24
Microsoft Certified Trainer (MCT) $117,043 $120,000 23 $122,667 $109,000 3
Microsoft Technology Associate (MTA) $65,821 $60,000 141 $88,825 $90,525 5
MOS: Microsoft Office Specialist $79,097 $80,000 49 $92,620 $90,600 7
Other Microsoft $86,357 $87,500 68 $76,613 $75,038 17
Networking Wireshark Certified Network Analyst (WCNA) $87,170 $80,000 237 $79,455 $79,250 44
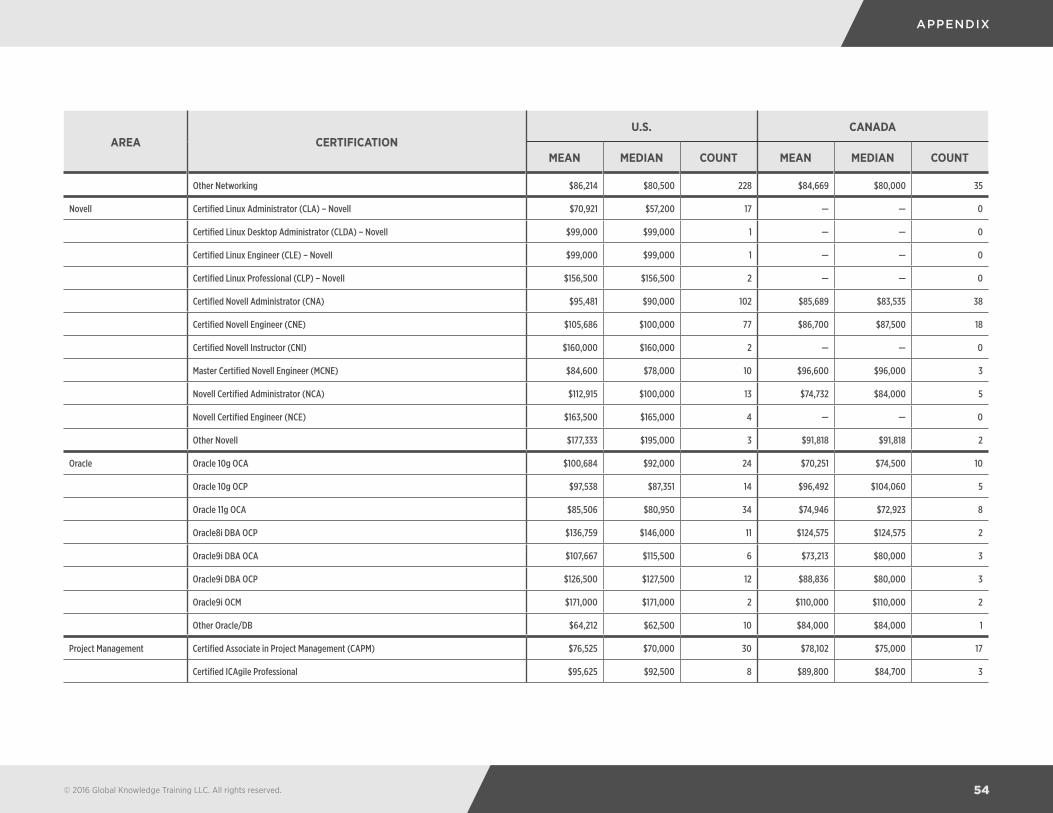
© 2016 Global Knowledge Training LLC. All rights reserved.
APPENDIX
54
AREA CERTIFICATIONU.S. CANADA
MEAN MEDIAN COUNT MEAN MEDIAN COUNT
Other Networking $86,214 $80,500 228 $84,669 $80,000 35
Novell Certified Linux Administrator (CLA) – Novell $70,921 $57,200 17 — — 0
Certified Linux Desktop Administrator (CLDA) – Novell $99,000 $99,000 1 — — 0
Certified Linux Engineer (CLE) – Novell $99,000 $99,000 1 — — 0
Certified Linux Professional (CLP) – Novell $156,500 $156,500 2 — — 0
Certified Novell Administrator (CNA) $95,481 $90,000 102 $85,689 $83,535 38
Certified Novell Engineer (CNE) $105,686 $100,000 77 $86,700 $87,500 18
Certified Novell Instructor (CNI) $160,000 $160,000 2 — — 0
Master Certified Novell Engineer (MCNE) $84,600 $78,000 10 $96,600 $96,000 3
Novell Certified Administrator (NCA) $112,915 $100,000 13 $74,732 $84,000 5
Novell Certified Engineer (NCE) $163,500 $165,000 4 — — 0
Other Novell $177,333 $195,000 3 $91,818 $91,818 2
Oracle Oracle 10g OCA $100,684 $92,000 24 $70,251 $74,500 10
Oracle 10g OCP $97,538 $87,351 14 $96,492 $104,060 5
Oracle 11g OCA $85,506 $80,950 34 $74,946 $72,923 8
Oracle8i DBA OCP $136,759 $146,000 11 $124,575 $124,575 2
Oracle9i DBA OCA $107,667 $115,500 6 $73,213 $80,000 3
Oracle9i DBA OCP $126,500 $127,500 12 $88,836 $80,000 3
Oracle9i OCM $171,000 $171,000 2 $110,000 $110,000 2
Other Oracle/DB $64,212 $62,500 10 $84,000 $84,000 1
Project Management Certified Associate in Project Management (CAPM) $76,525 $70,000 30 $78,102 $75,000 17
Certified ICAgile Professional $95,625 $92,500 8 $89,800 $84,700 3

© 2016 Global Knowledge Training LLC. All rights reserved.
APPENDIX
55
AREA CERTIFICATIONU.S. CANADA
MEAN MEDIAN COUNT MEAN MEDIAN COUNT
Certified ScrumMaster $108,689 $102,000 84 $99,570 $92,690 18
CompTIA Project+ $76,279 $70,000 247 $83,601 $80,918 16
PMI Agile Certified Practitioner (PMI-ACP) $119,349 $116,000 14 $114,750 $119,000 4
PMI Risk Management Professional (PMI-RMP) $126,569 $102,000 10 — — 0
PMI Scheduling Professional (PMI-SP) $52,333 $50,000 3 — — 0
Portfolio Management Professional (PfMP) $106,280 $90,000 5 — — 0
Prince2 $99,657 $91,750 19 $93,726 $90,000 13
Program Management Professional (PgMP) $126,515 $124,000 19 $90,334 $86,585 12
Project Management Professional (PMP) $116,094 $115,000 314 $102,091 $96,800 123
Other Project Management $90,544 $85,000 73 $98,505 $96,000 28
Red Hat Red Hat Certified Architect (RHCA) $116,778 $100,000 17 $48,581 $48,581 2
Red Hat Certified Engineer (RHCE) $101,824 $103,000 69 $78,333 $78,250 8
Red Hat Certified JBoss Administrator (RHCJA) $95,286 $73,000 7 — — 0
Red Hat Certified JBoss Developer (RHCJD) $150,400 $131,200 3 — — 0
Red Hat Certified Virtualization Administrator (RHCVA) $115,000 $50,000 5 $69,300 $85,200 3
Red Hat System Administrator (RHCSA) $92,748 $84,142 106 $87,673 $85,200 20
Other Red Hat $80,046 $63,000 46 $44,667 $42,000 3
SAP SAP Certified Application Associate – Financial Accounting with ERP 6.0 $108,833 $120,000 3 $90,525 $90,525 1
SAP Certified Application Associate – Financial Accounting with SAP ERP 6.0 $158,000 $158,000 2 $106,509 $106,509 1
SAP Certified Application Associate – Human Capital Management with SAP ERP 6.0 $149,000 $141,000 3 — — 0
SAP Certified Application Associate – Order Fulfillment with SAP ERP 6.0 $122,000 $122,000 1 — — 0
SAP Certified Application Associate – Procurement with SAP ERP 6.0 — — 0 $96,800 $96,800 2

© 2016 Global Knowledge Training LLC. All rights reserved.
APPENDIX
56
AREA CERTIFICATIONU.S. CANADA
MEAN MEDIAN COUNT MEAN MEDIAN COUNT
SAP Certified Application Associate – Sales and Distribution, ERP 6.0 $168,000 $121,000 4 — — 0
SAP Certified Application Associate – SAP BusinessObjects Web Intelligence $100,000 $100,000 2 — — 0
SAP Certified Application Associate – SAP HANA — — 0 $100,000 $100,000 1
SAP Certified Associate – Business Foundation & Integration with SAP ERP 6.0 $107,467 $130,000 3 $132,600 $96,000 3
SAP Certified Development Associate – ABAP with SAP NetWeaver $104,250 $104,250 2 $139,150 $139,150 1
SAP Certified Support Associate – SAP HANA $170,000 $100,000 3 — — 0
SAP Certified Technology Associate – OS/DB Migration $100,000 $100,000 2 — — 0
SAP Certified Technology Associate – SAP HANA $99,000 $99,000 4 $100,000 $100,000 1
Other SAP $101,125 $101,125 2 $168,500 $168,500 2
Security Blue Coat Certified Proxy Administrator (BCCPA) $108,208 $105,000 6 — — 0
Blue Coat Certified Proxy Professional (BCCPP) $118,875 $118,875 2 — — 0
Certified Authorization Professional (CAP) $102,292 $103,000 49 $122,950 $125,400 4
Certified Cyber Forensics Professional (CCFP) $137,000 $137,000 1 — — 0
Certified Ethical Hacker (CEH) $103,297 $104,000 168 $88,794 $88,500 10
Certified in Risk and Information Systems Control (CRISC) $122,954 $120,000 241 $110,251 $108,000 33
Certified Information Security Manager (CISM) $122,291 $119,000 328 $113,722 $109,000 49
Certified Information Systems Auditor (CISA) $113,320 $110,000 504 $110,128 $102,500 70
Certified Information Systems Security Professional (CISSP) $121,923 $119,000 522 $113,221 $110,000 67
Certified Secure Software Lifecycle Professional (CSSLP) $129,859 $130,500 16 — — 0
Certified SonicWALL Security Professional (CSSP) $91,081 $68,500 6 — — 0
Certified SonicWALL System Administrator (CCSA) for Network Security $81,414 $60,000 6 $62,526 $62,526 1
Check Point Certified Security Administrator (CCSA) $99,783 $100,000 23 $130,333 $130,000 6

© 2016 Global Knowledge Training LLC. All rights reserved.
APPENDIX
57
AREA CERTIFICATIONU.S. CANADA
MEAN MEDIAN COUNT MEAN MEDIAN COUNT
Check Point Certified Security Expert (CCSE) $108,677 $95,000 13 $110,845 $130,000 7
CISSP: Information Systems Security Architecture Professional (CISSP-ISSAP) $132,960 $135,368 26 $90,350 $90,525 3
CISSP: Information Systems Security Engineering Professional (CISSP-ISSEP) $126,761 $132,000 11 $77,000 $77,000 1
CompTIA Security+ $81,467 $75,000 1216 $79,246 $74,400 89
Computer Hacking Forensic Investigator (CHFI) v8 $103,783 $100,000 15 — — 0
CSFI Defensive Cyber Operations Engineer (DCOE) $90,000 $90,000 1 — — 0
CSX Practitioner $129,261 $125,000 9 — — 0
EC-Council Certified Security Analyst (ECSA) v8 $113,167 $114,000 6 $50,650 $50,650 1
F5 Certified Application Delivery Engineer $121,950 $118,000 5 $50,650 $50,650 1
F5 Certified BIG-IP Administrator $112,811 $111,300 9 — — 0
F5 Certified Master Application Delivery Engineer $108,667 $118,000 3 — — 0
F5 Certified Technology Specialist $104,556 $109,000 18 $104,639 $99,000 3
HealthCare Information Security and Privacy Practitioner (HCISPP) $142,077 $120,000 13 — — 0
Other Security $111,122 $106,500 156 $94,430 $99,000 22
Symantec Certified Professional (SCP) $102,478 $87,702 7 $129,750 $129,750 4
Symantec Certified Specialist (SCS) $103,000 $103,000 1 $181,500 $181,500 2
System Security Certified Practitioner (SSCP) $107,909 $120,000 11 $78,650 $78,650 1
Systems Security Certified Practitioner (SSCP) $104,025 $110,000 15 — — 0
Sun Sun Certified Business Component Developer (SCBCD) $130,000 $130,000 2 — — 0
Sun Certified Developer for Java Web Services (SCDJWS) $140,000 $140,000 1 — — 0
Sun Certified Enterprise Architect (SCEA) $140,000 $140,000 1 — — 0
Sun Certified Java Associate (SCJA) $93,846 $100,000 13 — — 0

© 2016 Global Knowledge Training LLC. All rights reserved.
APPENDIX
58
AREA CERTIFICATIONU.S. CANADA
MEAN MEDIAN COUNT MEAN MEDIAN COUNT
Sun Certified Java Developer (SCJD) $135,000 $130,000 5 — — 0
Sun Certified Java Programmer (SCJP) $112,708 $108,000 19 $56,757 $56,757 2
Sun Certified Network Administrator (SCNA) $126,578 $131,200 9 $69,663 $75,000 4
Sun Certified Security Administrator (SCSECA) $250,000 $250,000 1 $78,000 $78,000 2
Sun Certified Solaris Associate (SCSAS) $127,833 $101,000 6 $93,333 $95,000 3
Sun Certified System Administrator (SCSA) $111,988 $109,500 32 $94,700 $83,250 10
Sun Certified Web Component Developer (SCWCD) $126,333 $130,000 3 $69,225 $69,225 1
Other Sun $150,000 $150,000 2 — — 0
VMware VMware Certified Advanced Professional 5 – Data Center Administration (VCAP5-DCA) $103,242 $103,300 44 $79,845 $75,000 11
VMware Certified Advanced Professional 5 – Data Center Design (VCAP5-DCD) $98,737 $100,000 11 — — 0
VMware Certified Associate – Cloud (VCA-Cloud) $93,805 $93,500 37 $78,040 $85,730 12
VMware Certified Associate – Data Center Virtualization (VCA-DCV) $79,212 $72,632 60 $88,749 $90,200 19
VMware Certified Associate - Network Virtualization (VCA-NV) $108,111 $92,500 23 $74,028 $85,263 6
VMware Certified Associate – Workforce Mobility (VCA-WM) $90,688 $89,820 15 $84,458 $95,850 8
VMware Certified Associate 6 – Cloud Management and Automation (VCA6-CMA) $70,457 $71,642 10 — — 0
VMware Certified Associate 6 – Data Center Virtualization (VCA6-DCV) $95,519 $85,000 98 $88,773 $91,960 16
VMware Certified Associate 6 – Desktop and Mobility (VCA6-DTM) $90,606 $83,283 18 $89,800 $85,200 3
VMware Certified Associate 6 – Hybrid Cloud (VCA6-HC) $104,009 $88,000 11 $99,000 $99,000 1
VMware Certified Associate 6 – Network Virtualization (VCA6-NV) $95,404 $86,601 12 — — 0
VMware Certified Professional – Cloud (VCP-Cloud) $104,744 $91,750 22 $72,091 $60,500 7
VMware Certified Professional – Network Virtualization (VCP-NV) $102,716 $87,851 34 $106,736 $102,000 5
VMware Certified Professional 5 – Data Center Virtualization (VCP5-DCV) $99,334 $98,000 237 $93,341 $87,500 57

© 2016 Global Knowledge Training LLC. All rights reserved.
APPENDIX
59
AREA CERTIFICATIONU.S. CANADA
MEAN MEDIAN COUNT MEAN MEDIAN COUNT
VMware Certified Professional 5 – Desktop (VCP5-DT) $103,253 $100,000 32 $99,750 $99,000 4
VMware Certified Professional 6 – Cloud (VCP6-Cloud) $135,250 $110,500 8 — — 0
VMware Certified Professional 6 – Cloud Management and Automation (VCP6-CMA) $105,010 $97,050 10 $85,500 $85,500 2
VMware Certified Professional 6 – Data Center Virtualization (VCP6-DCV) $96,009 $87,000 65 $59,500 $53,250 3
VMware Certified Professional 6 – Desktop (VCP6-DT) $98,085 $101,600 13 $73,500 $73,500 2
VMware Certified Professional 6 – Desktop and Mobility (VCP6-DTM) $110,063 $96,200 15 $67,334 $68,110 5
VMware Certified Professional 6 – Network Virtualization (VCP6-NV) $101,174 $93,500 21 $58,203 $53,250 3
VMware Design Expert – Cloud (VCDX-Cloud) $116,000 $116,000 2 — — 0
VMware Design Expert – Desktop (VCDX-DT) $93,820 $101,600 5 — — 0
VMware Design Expert – Network Virtualization (VCDX-NV) $70,500 $70,500 1 — — 0
VMware Design Expert 5 – Data Center Virtualization (VCDX5-DCV) $102,546 $95,000 13 $180,000 $180,000 2
VMware Implementation Expert – Network Virtualization (VCIX-NV) $166,250 $181,500 4 $180,000 $180,000 2
Virtualization Certified Virtualization Desktop Administrator (CVDA) $103,204 $95,000 30 $78,420 $73,800 5
Certified Virtualization Desktop Expert (CVDE) $107,802 $109,500 10 $99,000 $99,000 1
Certified Virtualization Expert (CVE) $111,619 $100,000 21 $89,576 $89,413 8
Certified Virtualization Security Expert (CVSE) $100,000 $100,000 2 — — 0
Virtualization Council Master Infrastructure Architect (VC-MIA) $135,000 $135,000 1 — — 0
Virtualization Council Virtualization Infrastructure Professional (VC-VIP) $106,083 $118,250 6 $85,244 $87,500 4
Other Virtualization $106,771 $115,000 17 $76,200 $76,200 2
Wireless Certified Wireless Network Administrator (CWNA) $92,889 $83,500 106 $108,733 $111,000 12
Certified Wireless Security Professional (CWSP) $104,411 $100,300 22 $110,923 $114,345 4
Certified Wireless Technology Specialist (CWTS) $83,077 $77,000 41 $103,007 $82,000 3
Other Wireless $85,929 $80,500 38 $150,000 $150,000 2

© 2016 Global Knowledge Training LLC. All rights reserved.
APPENDIX
60
SALARIES BY STATE
StateIT Staff IT Decision-Makers IT Total
Mean Median Count Mean Median Count IT Mean Median IT Count
Alabama $77,045 $60,000 53 $95,982 $95,000 32 $84,174 $75,000 85
Alaska $78,494 $72,000 19 $90,670 $100,000 5 $81,031 $77,552 24
Arizona $76,233 $70,000 124 $112,302 $112,650 66 $88,762 $85,000 190
Arkansas $68,485 $65,000 35 $76,111 $85,000 9 $70,045 $69,600 44
California $84,859 $80,000 439 $117,364 $116,000 231 $96,066 $90,500 670
Colorado $76,658 $75,000 151 $103,938 $96,750 48 $83,238 $80,000 199
Connecticut $87,728 $81,000 46 $103,843 $92,000 23 $93,100 $85,000 69
Delaware $83,041 $84,000 8 $70,800 $60,000 7 $77,328 $84,000 15
District of Columbia $89,184 $88,000 58 $136,662 $125,000 27 $104,265 $102,000 85
Florida $74,377 $70,000 257 $111,901 $103,000 135 $87,300 $80,840 392
Georgia $72,602 $70,000 202 $100,428 $100,000 64 $79,297 $76,000 266
Hawaii $84,289 $82,600 11 $116,863 $98,000 8 $98,004 $92,000 19
Idaho $63,196 $61,250 22 $110,740 $125,610 3 $68,901 $68,000 25
Illinois $78,860 $75,000 253 $109,051 $109,000 91 $86,846 $82,750 344
Indiana $63,247 $60,000 76 $85,117 $87,000 36 $70,277 $69,000 112
Iowa $70,067 $71,000 48 $93,550 $87,500 24 $77,895 $74,000 72
Kansas $66,538 $63,000 39 $94,240 $92,000 25 $77,359 $70,200 64
Kentucky $63,901 $56,392 34 $86,667 $88,000 18 $71,781 $71,000 52
Louisiana $63,889 $60,000 39 $106,909 $85,000 11 $73,353 $67,050 50
Maine $70,965 $70,000 27 $67,500 $67,500 1 $70,841 $70,000 28
Maryland $85,480 $81,500 148 $128,074 $127,000 74 $99,678 $100,000 222
Massachusetts $76,250 $70,000 118 $120,808 $119,000 53 $90,060 $85,000 171

© 2016 Global Knowledge Training LLC. All rights reserved.
APPENDIX
61
StateIT Staff IT Decision-Makers IT Total
Mean Median Count Mean Median Count IT Mean Median IT Count
Michigan $73,437 $70,000 120 $109,367 $105,000 43 $82,915 $79,000 163
Minnesota $80,841 $80,500 110 $110,916 $105,000 56 $90,987 $89,961 166
Mississippi $54,907 $51,129 14 $88,129 $75,000 14 $71,518 $65,360 28
Missouri $68,733 $63,000 122 $109,570 $105,000 45 $79,737 $73,000 167
Montana $54,056 $51,064 14 $76,494 $90,000 3 $58,016 $51,064 17
North Dakota $62,125 $56,650 23 — — 0 $62,125 $56,650 23
Nebraska $69,217 $77,000 35 $92,250 $91,000 10 $74,335 $77,500 45
Nevada $70,369 $67,500 27 $95,931 $100,000 13 $78,676 $72,000 40
New Hampshire $59,182 $53,250 22 $121,675 $122,600 4 $68,796 $57,250 26
New Jersey $87,878 $87,000 148 $108,542 $100,000 62 $93,979 $90,500 210
New Mexico $62,151 $59,000 40 $117,875 $123,750 4 $67,217 $64,680 44
New York $80,699 $77,000 293 $122,667 $115,000 155 $95,219 $86,250 448
North Carolina $73,619 $68,000 269 $108,285 $101,000 68 $80,614 $77,000 337
Ohio $73,980 $71,000 189 $104,584 $104,030 92 $84,000 $80,000 281
Oklahoma $66,369 $59,000 48 $91,000 $100,000 23 $74,348 $68,000 71
Oregon $77,993 $71,500 83 $109,625 $105,000 26 $85,539 $80,000 109
Pennsylvania $72,569 $68,000 171 $108,222 $108,850 81 $84,029 $80,325 252
Rhode Island $68,307 $57,500 16 $115,500 $115,500 2 $73,551 $70,000 18
South Carolina $73,567 $68,500 60 $121,653 $120,000 14 $82,664 $75,000 74
South Dakota $69,325 $60,205 13 $113,333 $110,000 6 $83,223 $81,000 19
Tennessee $66,481 $63,000 81 $113,662 $116,200 26 $77,945 $71,000 107
Texas $77,865 $75,000 542 $110,559 $104,500 206 $86,869 $82,000 748
Utah $67,994 $63,000 71 $104,772 $92,000 24 $77,285 $70,000 95

© 2016 Global Knowledge Training LLC. All rights reserved.
APPENDIX
62
StateIT Staff IT Decision-Makers IT Total
Mean Median Count Mean Median Count IT Mean Median IT Count
Vermont $35,750 $33,750 3 $75,667 $75,000 6 $62,361 $72,000 9
Virginia $88,486 $81,000 257 $129,460 $128,000 147 $103,395 $100,000 404
Washington $77,439 $74,000 126 $109,538 $107,000 48 $86,294 $81,500 174
West Virginia $52,660 $47,800 28 $88,378 $83,000 9 $61,348 $54,000 37
Wisconsin $74,564 $71,850 102 $100,664 $105,000 37 $81,511 $82,000 139
Wyoming $64,772 $48,000 13 $71,000 $71,000 2 $65,602 $70,000 15
Province/TerritoryIT Staff IT Decision-Makers IT Total
Mean Median Count Mean Median Count Mean Median Count
Alberta $70,512 $70,000 172 $97,885 $84,000 31 $74,692 $70,550 203
British Columbia $57,630 $55,000 143 $101,977 $96,000 34 $66,149 $60,000 177
Manitoba $64,847 $65,000 46 $68,552 $65,000 16 $65,803 $65,000 62
New Brunswick $56,129 $55,000 19 $58,814 $67,728 5 $56,688 $55,000 24
Newfoundland and Labrador $57,853 $55,000 23 $84,976 $100,000 5 $62,696 $56,440 28
Northwest Territories — — 0 $92,500 $92,500 2 $92,500 $92,500 2
Nova Scotia $62,157 $60,000 41 $76,270 $67,729 8 $64,461 $64,000 49
Nunavut — — 0 — — 0 — — 0
Ontario $65,516 $65,000 502 $96,433 $97,000 121 $71,520 $69,845 623
Prince Edward Island $65,500 $66,500 8 — — 0 $65,500 $66,500 8
Quebec $63,033 $60,000 140 $83,377 $80,000 70 $69,814 $69,110 210
Saskatchewan $66,444 $65,000 37 $92,200 $92,000 5 $69,510 $66,251 42
Yukon — — 0 — — 0 — — 0
SALARIES BY PROVINCE