201610 Convex LP monthly - Constant...
15
CONVEX ASIA FUND LP | OCTOBER 2016 1 FOR PROFESSIONAL INVESTORS ONLY CONVEX ASIA FUND LP Monthly Update – October 2016 Monthly Review The Convex Asia Fund LP, Class ‘A’ was down -0.85%* net for the month of October 2016. Performance attribution CAF Net AF Net AF Net AF Net Outright Net Outright Net Outright Net Outright Net RV Net RV Net RV Net RV Net Outright Outright Outright Outright -0.86 0.86 0.86 0.86% REHEDGE REHEDGE REHEDGE REHEDGE 0.00% 0.00% 0.00% 0.00% Carry Carry Carry Carry 0.0 0.0 0.0 0.02% Relative Value Relative Value Relative Value Relative Value -0. 0. 0. 0.07% VAR VAR VAR VAR -0. 0. 0. 0.28 28 28 28% Skew Skew Skew Skew -0.01 0.01 0.01 0.01% Other Other Other Other 0.08 0.08 0.08 0.08% Vol Vol Vol Vol -0. 0. 0. 0.01 01 01 01% Delta Delta Delta Delta 0.00% 0.00% 0.00% 0.00% -0.85 0.85 0.85 0.85% Tail Tail Tail Tail -0.57 0.57 0.57 0.57% Curve Curve Curve Curve 0.0 0.0 0.0 0.00% CVX CVX CVX CVX 0.00% 0.00% 0.00% 0.00% Spread Spread Spread Spread 0.00% 0.00% 0.00% 0.00% Tact Tact Tact Tact 0.00% 0.00% 0.00% 0.00% VARSPREAD VARSPREAD VARSPREAD VARSPREAD 0.00% 0.00% 0.00% 0.00% -0.86 0.86 0.86 0.86% Term Term Term Term 0.00% 0.00% 0.00% 0.00% Corr Corr Corr Corr 0.00% 0.00% 0.00% 0.00% Tact Tact Tact Tact -0. 0. 0. 0.08 08 08 08% Vol Vol Vol Vol 0.00% 0.00% 0.00% 0.00% -0.0 0.0 0.0 0.07% *Reflects Convex Asia Fund LP – Class ‘A’ net investor returns. Past performance is not a guarantee of future returns, and an investment in the Fund could lose value. Performance attribution is based on the Trading Level of the Fund. Trading Level is defined as the product of the fund’s NAV multiplied by the Funding Factor. The Funding Factor is 1x for Convex Asia Fund LP, while the Funding Factor is 2x for Convex Asia Fund PF LP. Fees and expenses are allocated pro rata with the absolute gross return of each strategy in order to arrive at the net performance figures. Source: City Financial, internal data Market Review Interest Rates With an apparent flick of a switch, bond markets shifted from pricing “deflation” risk to pricing “inflation” risk in October. Despite the general outlook for global growth remaining skewed towards weakness and below trend growth, rates have moved higher. It is yet to be determined if this ‘inflation’ enthusiasm will expand to anything more meaningful. Moves in October were modest, but, to be precise, US 10y bond yields rose 20.3bps, Korean 10y bond yields rose 22.2bps, Euro 10y bonds rose 21.7bps and 10y JGBs rose 2bps under “YCC” (Yield Curve Control) governance. Modest moves in the context of the heavy compression of yields in recent years, but significant given the overall low levels of yields. Given such moves, has the opportunity to hedge higher rates become significantly more restricted? Quite the reverse, we would argue, as the asymmetry that we track in the portfolio has accelerated over the last three months, so much so that we have almost doubled our potential sensitivity to moves higher in rates over that period.
Transcript of 201610 Convex LP monthly - Constant...

CONVEX ASIA FUND LP | OCTOBER 2016 1
FOR PROFESSIONAL INVESTORS ONLY
CONVEX ASIA FUND LP
Monthly Update – October 2016
Monthly Review
The Convex Asia Fund LP, Class ‘A’ was down -0.85%* net for the month of October 2016.
Performance attribution
CCCCAF NetAF NetAF NetAF Net Outright NetOutright NetOutright NetOutright Net RV NetRV NetRV NetRV Net
OutrightOutrightOutrightOutright ----0.860.860.860.86%%%% REHEDGEREHEDGEREHEDGEREHEDGE 0.00%0.00%0.00%0.00% CarryCarryCarryCarry 0.00.00.00.02222%%%%
Relative ValueRelative ValueRelative ValueRelative Value ----0.0.0.0.00007777%%%% VARVARVARVAR ----0.0.0.0.28282828%%%% SkewSkewSkewSkew ----0.010.010.010.01%%%%
OtherOtherOtherOther 0.080.080.080.08%%%% VolVolVolVol ----0.0.0.0.01010101%%%% DeltaDeltaDeltaDelta 0.00%0.00%0.00%0.00%
----0.850.850.850.85%%%% TailTailTailTail ----0.570.570.570.57%%%% CurveCurveCurveCurve 0.00.00.00.00000%%%%
CVXCVXCVXCVX 0.00%0.00%0.00%0.00% SpreadSpreadSpreadSpread 0.00%0.00%0.00%0.00%
TactTactTactTact 0.00%0.00%0.00%0.00% VARSPREADVARSPREADVARSPREADVARSPREAD 0.00%0.00%0.00%0.00%
----0.860.860.860.86%%%% TermTermTermTerm 0.00%0.00%0.00%0.00%
CorrCorrCorrCorr 0.00%0.00%0.00%0.00%
TactTactTactTact ----0.0.0.0.08080808%%%%
VolVolVolVol 0.00%0.00%0.00%0.00%
----0.00.00.00.07777%%%%
*Reflects Convex Asia Fund LP – Class ‘A’ net investor returns.
Past performance is not a guarantee of future returns, and an investment in the Fund could lose value. Performance attribution is based
on the Trading Level of the Fund. Trading Level is defined as the product of the fund’s NAV multiplied by the Funding Factor. The
Funding Factor is 1x for Convex Asia Fund LP, while the Funding Factor is 2x for Convex Asia Fund PF LP. Fees and expenses are
allocated pro rata with the absolute gross return of each strategy in order to arrive at the net performance figures.
Source: City Financial, internal data
Market Review
Interest Rates
With an apparent flick of a switch, bond markets shifted from pricing “deflation” risk to pricing “inflation” risk
in October. Despite the general outlook for global growth remaining skewed towards weakness and below
trend growth, rates have moved higher. It is yet to be determined if this ‘inflation’ enthusiasm will expand to
anything more meaningful. Moves in October were modest, but, to be precise, US 10y bond yields rose
20.3bps, Korean 10y bond yields rose 22.2bps, Euro 10y bonds rose 21.7bps and 10y JGBs rose 2bps under
“YCC” (Yield Curve Control) governance. Modest moves in the context of the heavy compression of yields in
recent years, but significant given the overall low levels of yields. Given such moves, has the opportunity to
hedge higher rates become significantly more restricted? Quite the reverse, we would argue, as the
asymmetry that we track in the portfolio has accelerated over the last three months, so much so that we
have almost doubled our potential sensitivity to moves higher in rates over that period.

CONVEX ASIA FUND LP | OCTOBER 2016 2
The following two charts are of the same underlying securities, indexed at 1, for US 10y bond, JGB 10y bond,
EUR 10y bond, KTB 10y bond, USD 3M Libor and Korean 90-day CD rate. The first chart shows a medium
term view, from March 2008 through to 31 October 2016, the other shows changes year to date. What is
striking is the expansion of USD 3M Libor on the second chart, which is tightening financial conditions
globally and pre-emptive with respect to Federal Reserve action.
US, JGB, EUR, KTB 10y Bond yields, USD 3m Libor, and KRW 90-day CD
Source: Bloomberg
US, JGB, EUR, KTB 10y Bond yields, USD 3m Libor, and KRW 90-day CD
Source: Bloomberg
Reflation and an end to Quantitative Easing (QE) in Europe and Japan are the biggest concerns currently for
interest rate markets. However, the cost of convexity does not reflect this; skew is still cheap in many
markets. QQEYCC in Japan has made interest rate volatility extremely attractive in some areas of the
volatility surface there. South Korea may be the next developed economy in line for QE and most bank
-0.5
0
0.5
1
1.5
2
Mar-2008 Jan-2009 Nov-2009 Sep-2010 Jul-2011 May-2012 Mar-2013 Jan-2014 Nov-2014 Sep-2015 Jul-2016
USGG10Y GJGB10Y GTEUR10Y US0003M GTKRW10Y KWCDC
-1.5
-1
-0.5
0
0.5
1
1.5
2
Jan-16 Feb-16 Mar-16 Apr-16 May-16 Jun-16 Jul-16 Aug-16 Sep-16 Oct-16
USGG10Y GJGB10Y GTEUR10Y US0003M GTKRW10Y KWCDC

CONVEX ASIA FUND LP | OCTOBER 2016 3
analysts expect the Bank of Korea (BoK) to cut rates by 25 - 75bps from the current rate of 1.25% over the
coming months.
The following grid shows on the X-axis the cost in (bps) premium for a 2y10y ATMF + 150bps payer and on
the Y-axis we show the skewness of the ATMF payer over the ATMF payer as a percentage. Despite moves
in the US, it appears with the lowest level of absolute skewness. However, the comparison also shows the US
to be the most costly market to hedge. Despite South Korean won (KRW) and Japanese yen (JPY) having a
higher cost of skewness in absolute terms, the cost of convexity is much less than in either Europe or the
USA. We are not saying that the US dollar or euro cost of convexity is expensive, as if you do an empirical
regression and study of skewness and at-the-money implied volatility they are both attractive in their own
right at these levels. However, the opportunity set that is afforded us in Asia makes ownership of rate
convexity more attractive for a scenario where inflation fears feed into higher rates.
2y10y ATMF + 150 Payer Premium vs Relative Skewness
Source: Bloomberg
FX
A quick trip around global markets last month and we note that Brazil cut rates by 25bps to 14%. In Europe,
the Riksbank further lowered its repo-rate forecast and announced a likelihood of an extension to QE by
December, and Norges Bank held rates. In our view, both macro dynamics and flow dynamics are quite
supportive of the US dollar at a higher level, especially vs the Chinese yuan (CNY) as latest data from the
People's Bank of China (PBoC) suggests that capital outflow pressure remains. Whilst foreign holdings of
Chinese equities and bonds increased in the third quarter by US$7bn and US$5bn respectively, foreign
holdings of onshore CNY deposits fell by US$21bn in the same period. Monthly foreign direct investment and
outward direct investment data (from the Ministry of Commerce) shows net outflows of US$6.9bn in
September, the highest net outflows since US$10.1bn in April 2016. Global uncertainty, Fed hike
expectations, RMB overvaluation, Bank of Japan (BoJ) tapering, European concerns around the banking
sector, the Italian December referendum and slower Chinese economic momentum seemingly all point
towards a stronger US dollar and weaker CNY.
EUR, 35, 126%USD, 54, 111%
KRW, 9.25, 138%
TWD, 15, 188%
JPY, 9, 248%
0%
50%
100%
150%
200%
250%
300%
0 10 20 30 40 50 60
CONVEX ASIA FUND LP | OCTOBER 2016 4
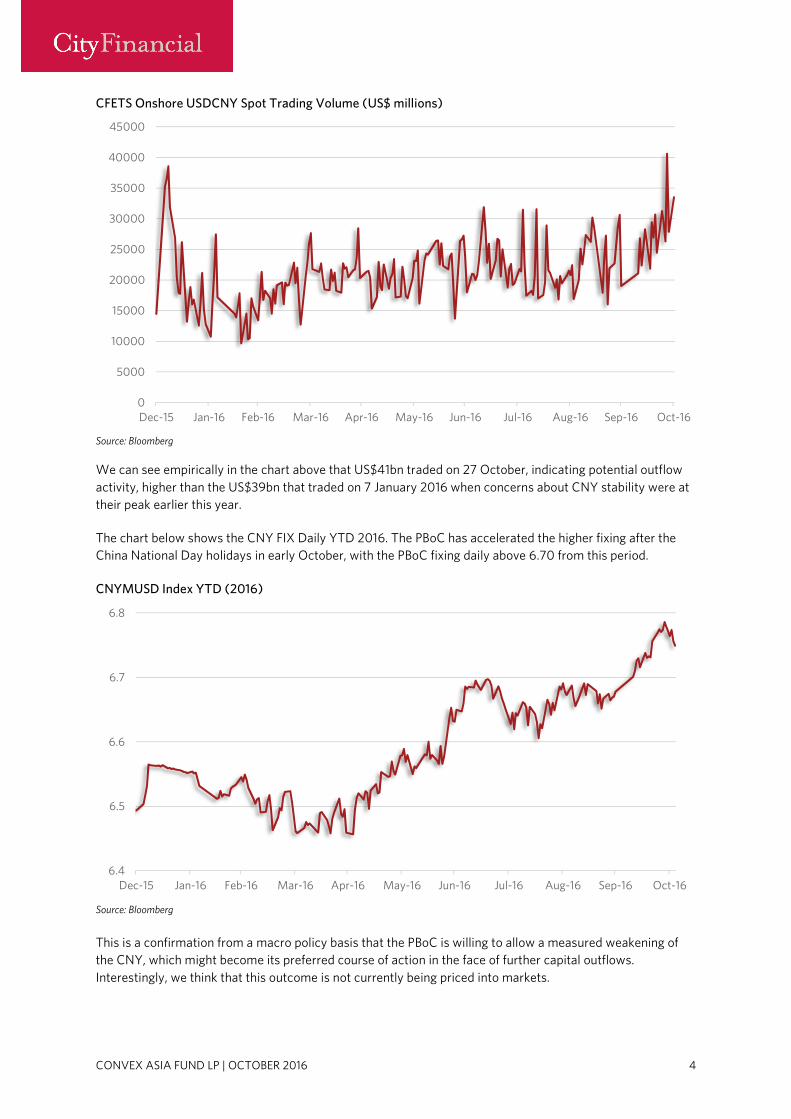
CFETS Onshore USDCNY Spot Trading Volume (US$ millions)
Source: Bloomberg
We can see empirically in the chart above that US$41bn traded on 27 October, indicating potential outflow
activity, higher than the US$39bn that traded on 7 January 2016 when concerns about CNY stability were at
their peak earlier this year.
The chart below shows the CNY FIX Daily YTD 2016. The PBoC has accelerated the higher fixing after the
China National Day holidays in early October, with the PBoC fixing daily above 6.70 from this period.
CNYMUSD Index YTD (2016)
Source: Bloomberg
This is a confirmation from a macro policy basis that the PBoC is willing to allow a measured weakening of
the CNY, which might become its preferred course of action in the face of further capital outflows.
Interestingly, we think that this outcome is not currently being priced into markets.
0
5000
10000
15000
20000
25000
30000
35000
40000
45000
Dec-15 Jan-16 Feb-16 Mar-16 Apr-16 May-16 Jun-16 Jul-16 Aug-16 Sep-16 Oct-16
6.4
6.5
6.6
6.7
6.8
Dec-15 Jan-16 Feb-16 Mar-16 Apr-16 May-16 Jun-16 Jul-16 Aug-16 Sep-16 Oct-16

CONVEX ASIA FUND LP | OCTOBER 2016 5
Nearby, in Hong Kong, we look at the CNH HIBOR fixing (chart below) where it seems that, despite the
weakness of spot CNY and FIX, we are not seeing the authorities jack up the cost of funding in order to
remove any speculative short positions, as we have seen them to do in the past. CNY Fix is currently around
five-year highs, spot CNY or CNH (China Offshore Spot) rates are at circa five-year highs and yet CNH
implied volatility, CNH forward points, and CNH HIBOR are very stable. CNH HIBOR becomes much more
relevant when the Chinese authorities want to clean things up, so what we conclude from this is that, at
present, the PBoC is not concerned at current levels and a test of 6.80 looks imminent in November or
December. Overall, we believe the RMB depreciation trend will continue over the medium-term and the
recent lack of PBoC action and market positioning suggests we could continue to see bigger moves than the
forward market is pricing in in the near-term.
Regression below shows HIBOR rate is stable as USDCNH moves to its highest level.
Regression of CNH HIBOR vs USDCNH
Source: Bloomberg
Onshore corporates in China have been active in structured product markets via covered forwards, selling
$CNH topside calls versus buying CNH 12m Forward points. As a result, the supply of volatility has been
mainly at the front end of the volatility curve (1m, 3m expiry). Even with the covered forward issuance, and
forward point buying, plus the move in CNY Fix and spot CNY/CNH rates, it is interesting to see these points
not widening on speculative flows, even as we trade at the highest levels in five years. There appears to be a
breakdown between spot moves, risk reversals, butterflies, forward levels and implied volatility, while even
high strike skew volatility has been compressed. Under such a scenario there is still interesting convexity and
asymmetry in China that we would not expect to see given the risks that are evident to markets.
The second chart on the following page is a longer-dated history (minus CNH12m) of USDCNH 10 delta
butterfly, USDCNH 1y implied volatility, USDCNH 1y 10 delta Risk Reversal, CNH 12M Forward points,
indexed to 1. The risk reversal has compressed from US$ call to CNH call as CNY/CNH spot has weakened.
In January 2016, the risk reversal traded as high as 10.625 (to $ calls) but by end October closed at 3.2175.
Historically, these cost components of owning upside protection against USD/CNH have been highly
correlated to a rising spot exchange rate. That has not been the case with the most recent trend higher in
spot.

CONVEX ASIA FUND LP | OCTOBER 2016 6
Indexed CNH Implied Volatility, Risk Reversal, Butterfly and Forward Points.
Source: Bloomberg
Indexed CNH Implied Volatility, Risk Reversal, Butterfly.
Source: Bloomberg
Equities
The month of October saw equity risk premia cheapen across the board, although it was hard not to notice
the clouds gathering on the horizon:
• Rising populist sentiment (US Presidential elections/ Italian referendum)
• Involuntary reversal of easy monetary policy and rising interest rates
• Increasing FX volatility
• Credit events
0.5
1
1.5
2
2.5
3
3.5
Oct-14 Jan-15 Apr-15 Jul-15 Oct-15 Jan-16 Apr-16 Jul-16 Oct-16
USDCNH10B1Y USDCNHV1Y USDCNH10R1Y CNH12M
0
0.5
1
1.5
2
2.5
3
Nov-11 May-12 Nov-12 May-13 Nov-13 May-14 Nov-14 May-15 Nov-15 May-16
USDCNH10B1Y USDCNHV1Y USDCNH10R1Y

CONVEX ASIA FUND LP | OCTOBER 2016 7
With financial market leverage higher in many markets than just before the 2008 financial crisis , there
appears to be no shortage of crowded trades which will likely prove to have tiny exit doors, we think, when
the decision to trade out is taken. And yet, equity risk premia are back to the lows of the year and, more
ominously, back to levels seen in the second half of 2007. The Nikkei saw the fourth consecutive month of
declines in the cost of protection, and led the fall in volatility across virtually all markets.
Fresh from inflating an equity bubble and subsequently bursting it last year, the Chinese government appears
to have a pump in hand once more, this time turning attention to the property market. Down-payments for
mortgages were cut and a record amount of credit (financed by the PBoC) has been pumped into the
financial system this year, rivalling the quantum for all of 2009. Property funding in the second quarter 2016
was reported to account for almost 70% (up from 24% last year) of the growth in Total Social Financing
(TSF). Loans related to the property sector now account for 24% of the outstanding TSF. The lack of
alternative investments and the common belief that ‘the government will never allow housing prices to fall in
China’ continued to drive demand for property investments.
Across China, different forms of leverage, both on and off balance sheet, continue to build up in banks,
developers and peer-to-peer (P2P) platforms. P2P platforms use leverage to help small investors, who
cannot afford to participate in the property market alone, to invest in schemes with the prospect of high
returns (approximately 20% p.a). Property agents have been reported to use these platforms to supply
bridge loans to help buyers with their down-payments, which they would not ordinarily be able to afford.
Developers also lend out such bridging loans to home buyers, circumventing the requirements for down-
payments. We must also not forget the now less sensationalised wealth management products (WMP)
which continue to grow at a frightening pace, +56% year-on-year (YoY) in 2015, and worth approximately
RMB 23.5tr as of 2015. Extending leverage into housing and households could be construed badly; utilising
‘under-leveraged’ household balance sheets to continue financing growth after the corporate sector and local
provincial governments have tapped out. China’s household leverage (household debt to disposable income)
was understood to be under 50% in 2015, which is low in comparison to 100% in the US, 160% in South
Korea or almost 200% in Australia.
Chinese house price indices are up over 20% YoY, from an already high level. Tier 1 and 2 housing prices
climbed 29% and 13% YoY in September. The average selling price of the Tier 1 cities took five years to climb
41% (or 7% CAGR from 2010 to 2015) but took only one year (2015 to 2016) to climb another whopping
44%. This parabolic climb in property prices has also exacerbated capital outflows due to relative cheapness
of asset prices in other countries. The Chinese government has finally announced some macro-prudential
measures across 11 major cities, for example by raising down-payments for first and second mortgages, but
market activity would suggest the moves are having little impact.
The crux here is that most asset price bubbles historically are pricked by self-inflicted macro prudential
measures like the US equity market in the late 1920s, Japan housing bubble in late 1980s, Hong Kong
housing bubble in late 1990s and the China equity bubble in late 2015, for example. The Chinese property
market is a much larger beast compared to equity markets and might prove to be more robust. However, as
we look at hedging opportunities across equities, we can see very attractively priced protection in a
particular group of Asian countries that are highly susceptible to a burst in the Chinese credit bubble with
fixed or dirty-floating currency pegs. Interestingly, the cost of protection in these markets has become
cheaper in the past quarter and is now as cheap as it was in the second half of 2007.

CONVEX ASIA FUND LP | OCTOBER 2016 8
HSI Index Implied and Realised Volatility
Source: Bloomberg
Monthly Performance Asian Indices
Source: Bloomberg
Credit
In early 1994, bond yields were at a 20-year low while inflation had been subdued. The United States had just
escaped from a short recession between 1990-1991, an oil price shock in 1990, an asset bubble crash in
Japan (one of the US’ biggest trading partners), and a nine-year long savings and loan crisis (1980-1989).1
The Fed had begun raising short-term interest rates from 3% to 4.75% by September 1994. The 30-year
Treasury rate started the year at 6.2% but was 160 basis points higher at 7.8% by September. That year
ended in an estimated loss of over US$1tr worldwide from the decline of bond prices from a correlated spike
in long-dated yields across major countries including the US, Germany, the UK and Japan, as well as in the
emerging markets.
Back then, the outstanding bond market in the US was US$10.2 trillion, an all-time high at that time,
constituting around 57% of the global bond market. With short-term yields at 20-year lows (in 1994), the
spread between long- and short-dated yields was at a high. By way of illustration, the spread between the 2-
year and 30-year US Treasury yields peaked at 3.6% in 1992. This encouraged a huge amount of bond
issuance and carry trades which resulted in lower yields and reflexively higher bond prices, thus spiralling
into a leveraged bond bubble.
1 http://fortune.com/2013/02/03/the-great-bond-massacre-fortune-1994/

CONVEX ASIA FUND LP | OCTOBER 2016 9
The US bond market has grown to almost US$37tr in 2015 (still around 42% of the global bond market) with
issuance at new all-time highs, coupled with near all-time lows in rates globally. The explosion of the global
monetary base led by the US, Japan and the Eurozone (5x, 4.5x and 2.5x December 2007 levels) added a
massive dose of impetus to an already insatiable hunt for yield. The US bond market is around 1.5 times the
size of the US stock market and nearly twice the total size of the five largest foreign stock markets combined
(London, Japan, China, Europe and Hong Kong).
To find out how far the carry trade has caused risk premia to diverge from fundamentals, you need look no
further than the sovereign credit spread of South Korea, one of the largest emerging market countries. The
sovereign credit spread at 42bps is at nine year lows and at a level last seen in 2007. Currently, the country
is seeing the lowest five-year average GDP growth rate since 1975, the weakest PMI among all the major
Asian countries, weak export growth, surging NPL ratios and record high household leverage. Likewise,
ITRAXX Japan and Asia credit indices are also trading at lows for the year, as well as historical lows.
Fed Fund rate, US PCE Core Index, US GDP and the US 30Y vs 2Y spread between 1970 - 1994
Source: Bloomberg
Fed Fund rate, US PCE Core Index, US GDP and the US 30Y vs 2Y spread between 1970 - 2016
Source: Bloomberg

CONVEX ASIA FUND LP | OCTOBER 2016 10
Korea 5Y CDS Spread
Source: Bloomberg
Credit Benchmarks
Source: Bloomberg
Risk Update
No doubt, November 2016 is a big month. The United States is going to make history, one way or another.
Whether the outcome is a potential spark in the accumulated plains of dry trees and grass, we will only know
in hindsight.
What we do have a pretty good idea of is the proliferation of dry grass (a.k.a. risk) in the mass pursuit of
yield. We always aim to differentiate between what is a view (what one thinks will happen) and what is risk
(what really hurts if it happens). As many of you are aware, we think one of, if not the, key risks in the system
is rising interest rates. We see it in the volatility supply of yield enhancing structured products on the
dangerous belief that yields will never go higher. That “lower for longer” is the only alternative for global
Central Banks. As you have heard us say before, the only thing necessary for rates to go up, is for them to

CONVEX ASIA FUND LP | OCTOBER 2016 11
stop going down, and from one rate cutting/ZIRP/QE/NIRP country to the next, rates have stopped going
down. At least for the time being.
USD 10yr Swap
Source: Bloomberg
KRW 10yr ND IRS
Source: Bloomberg

CONVEX ASIA FUND LP | OCTOBER 2016 12
JPY 10yr Swap
Source: Bloomberg
GBP 10yr Swap
Source: Bloomberg
CONVEX ASIA FUND LP | OCTOBER 2016 13
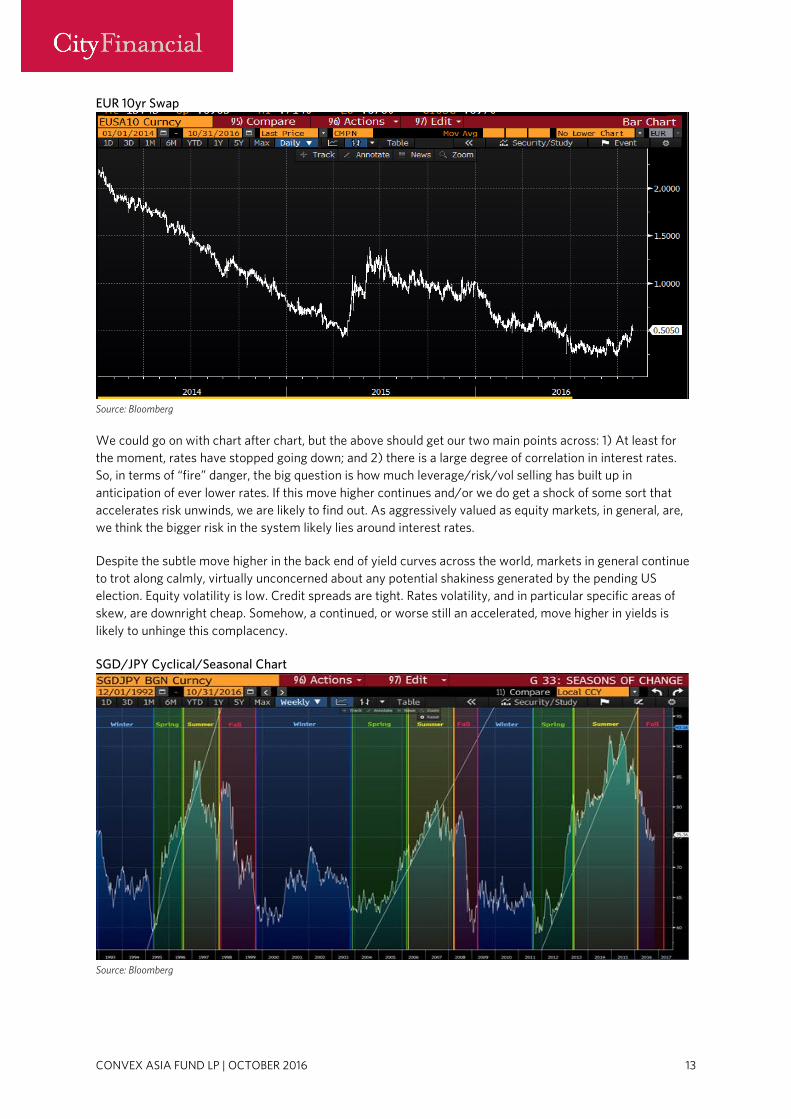
EUR 10yr Swap
Source: Bloomberg
We could go on with chart after chart, but the above should get our two main points across: 1) At least for
the moment, rates have stopped going down; and 2) there is a large degree of correlation in interest rates.
So, in terms of “fire” danger, the big question is how much leverage/risk/vol selling has built up in
anticipation of ever lower rates. If this move higher continues and/or we do get a shock of some sort that
accelerates risk unwinds, we are likely to find out. As aggressively valued as equity markets, in general, are,
we think the bigger risk in the system likely lies around interest rates.
Despite the subtle move higher in the back end of yield curves across the world, markets in general continue
to trot along calmly, virtually unconcerned about any potential shakiness generated by the pending US
election. Equity volatility is low. Credit spreads are tight. Rates volatility, and in particular specific areas of
skew, are downright cheap. Somehow, a continued, or worse still an accelerated, move higher in yields is
likely to unhinge this complacency.
SGD/JPY Cyclical/Seasonal Chart
Source: Bloomberg

CONVEX ASIA FUND LP | OCTOBER 2016 14
CONVEX ASIA FUND RETURNS(1)
Year Jan Feb Mar Apr May Jun Jul Aug Sep Oct Nov Dec YTD 2012 0.41% -1.11% -0.80% -0.63% -1.09% -0.90% -0.68% -0.39% ----5.08%5.08%5.08%5.08%
2013 -0.36% -0.26% -0.37% -0.33% 0.73% 1.16% -0.61% -0.06% -1.54% -0.94% -0.44% -0.59% ----3.58%3.58%3.58%3.58%
2014 -0.05% -0.40% -0.72% -0.57% -1.01% -1.14% -0.16% -0.78% 0.25% -0.55% 0.01% -0.15% ----5.15%5.15%5.15%5.15%
2015 0.77% -0.93% -0.51% -0.45% -0.42% 0.04% -0.24% 3.20% 0.31% -3.33% -0.75% -0.74% ----3.13%3.13%3.13%3.13%
2016 2.87% 1.81% -3.19% -0.14% -1.29% 0.31% -1.77% -1.67% -1.46% -0.85% ----5.39%5.39%5.39%5.39%
Past performance is no guarantee of future results, and an investment in the Fund could lose value. __________________________ (1) The investment services being offered in connection with this track record are neither offered by, nor associated with, Fortress Investment Group LLC, its affiliates or the directors, officers, employees, members, partners, shareholders or controlling persons of any of the foregoing (collectively, “Fortress”). This track record reflects investment returns resulting from the investment activities of the Fortress Convex Asia Master Fund of which Mr David Dredge as CIO and Mr Julian Ings-Chambers as Managing Director from 11 October 2011 through the termination date, 30 June 2016, on behalf of Fortress clients during the period specified above, during which the track record was maintained by Fortress in the normal course of business solely for Fortress’s use. For the avoidance of doubt, this document is not associated with Fortress’s business in any way, and Fortress will not have any future association with the investment funds or advisory services discussed herein. Further, you should not view the inclusion of the track record herein as an indication that Fortress endorses any such investment fund or services because Fortress expressly disclaims any such endorsement. Fortress disclaims all liability associated with these materials. To the extent you choose to make an investment or otherwise engage in a relationship with any person based on this track record, you do so at your own risk and there can be no assurance that results similar to those in the track record will be achieved.
All performance figures through 2014 and 2015 are based on audited financial information and, with respect to 2016, are based on estimated and unaudited financial information and are, in each case, confidential. The performance data set forth above reflect returns, net of all fees and expenses, for both Class A and Class B day one “new issue” eligible investors. Allocation of “new issues” to “new issue” eligible investors may result in returns that are higher than returns earned by other investors.
Investors in Class A are subject to 1.5% management fee, 20% incentive allocation, and other expenses. The descriptions of the management fees, incentive allocations, and other expenses to which investors are subject are set forth in detail in the Fund's offering documents. The summaries in this paragraph are not binding and do not alter the terms of such documents, which govern in all respects.
The Class A returns are hypothetical and projected from the Class B returns (a share class traded pari passu with Class A), with the Class A fee structure imposed upon them. The Class A returns do not represent profit and loss that any investor has actually received.
The Class B returns have not been provided as this class is now closed to new investment.
CONVEX ASIA FUND LP - CLASS A NET INVESTOR RETURNS

CONVEX ASIA FUND LP | OCTOBER 2016 15
DISCLOSURE
This document is intended for professional use only; it should not be relied upon by private clients. It is provided for information
purposes only and should not be interpreted as investment advice. It does not purport to be an inducement, recommendation or offer to
invest in any fund. Any offering is made only pursuant to the relevant offering document, together with the current audited financial
statements of the relevant fund, if available, and the relevant subscription/application, all of which must be read in their entirety. No
offer to purchase securities will be made or accepted prior to receipt by the offeree of these documents and the completion of all
appropriate documentation. Whilst the information contained in this document has been prepared in good faith, no representation or
warranty, express or implied, is given by City Financial Investment Company Limited or any of its Directors, partners, officers, affiliates
or employees. Past performance is not a guide to future performance. City Financial Investment Company Limited (Registration No.
020473901) is incorporated in England and Wales and the registered office is at 62 Queen Street, London EC4R 1EB. The company is
authorised and regulated by the Financial Conduct Authority. The representative of the Fund in Switzerland is Hugo Fund Services SA, 6
Cours de Rive, 1204 Geneva. The distribution of Shares in Switzerland must exclusively be made to qualified investors. The place of
performance for Shares in the Fund distributed in Switzerland is at the registered office of the Representative.