2016 WISCONSIN CANADA GOOSE HARVEST …dnr.wi.gov/topic/WildlifeHabitat/documents/report.pdf2016...
40
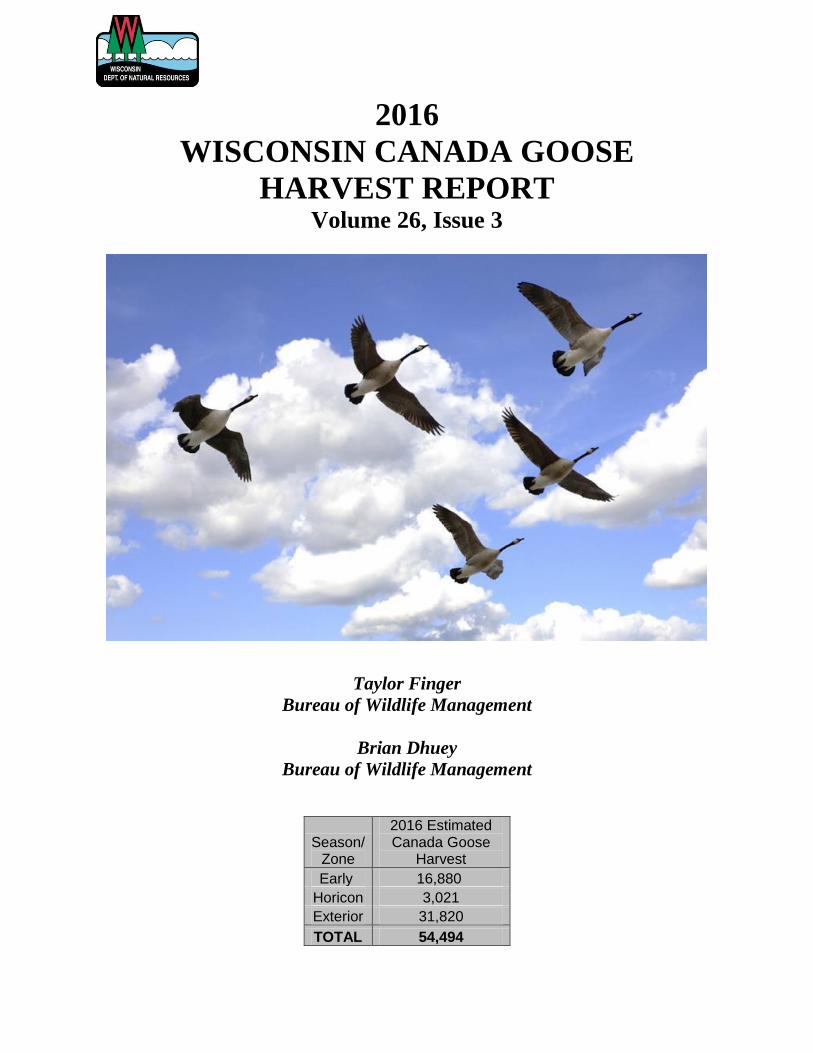
2016 WISCONSIN CANADA GOOSE HARVEST REPORT Volume 26, Issue 3 Taylor Finger Bureau of Wildlife Management Brian Dhuey Bureau of Wildlife Management Season/ Zone 2016 Estimated Canada Goose Harvest Early 16,880 Horicon 3,021 Exterior 31,820 TOTAL 54,494
Transcript of 2016 WISCONSIN CANADA GOOSE HARVEST …dnr.wi.gov/topic/WildlifeHabitat/documents/report.pdf2016...
2016
WISCONSIN CANADA GOOSE
HARVEST REPORT Volume 26, Issue 3
Taylor Finger
Bureau of Wildlife Management
Brian Dhuey
Bureau of Wildlife Management
Season/ Zone
2016 Estimated Canada Goose
Harvest
Early 16,880
Horicon 3,021
Exterior 31,820
TOTAL 54,494

3
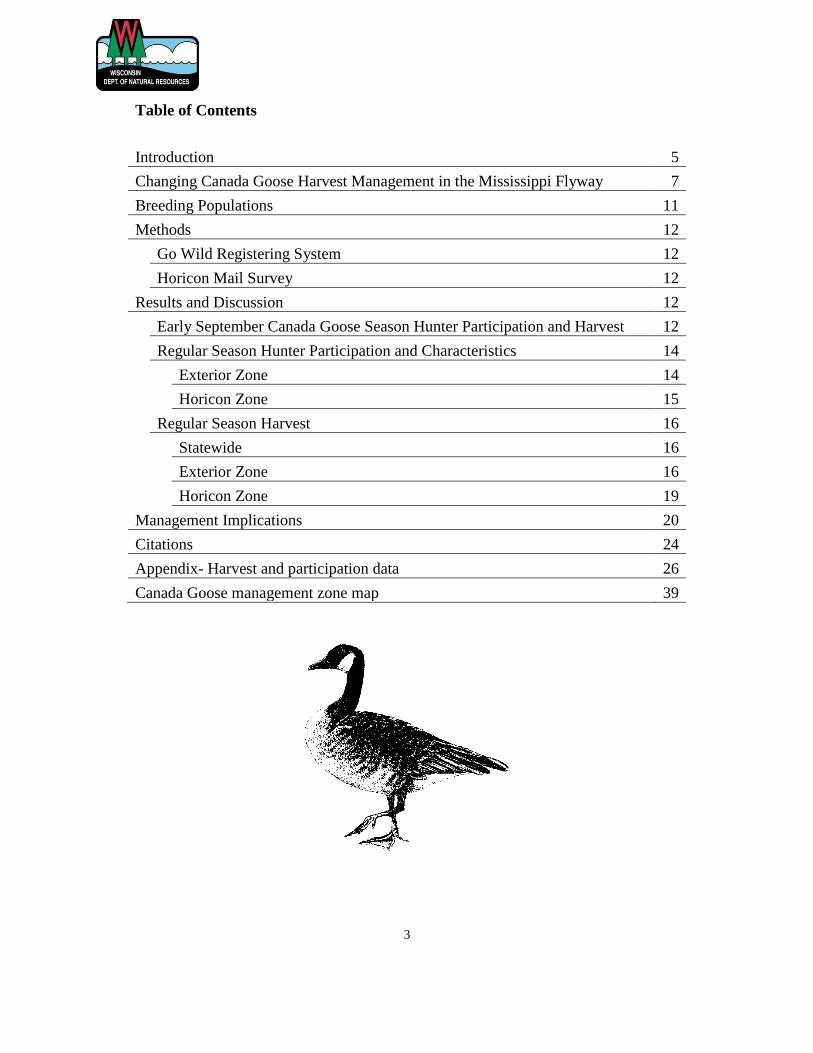
Table of Contents
Introduction 5
Changing Canada Goose Harvest Management in the Mississippi Flyway 7
Breeding Populations 11
Methods 12
Go Wild Registering System 12
Horicon Mail Survey 12
Results and Discussion 12
Early September Canada Goose Season Hunter Participation and Harvest 12
Regular Season Hunter Participation and Characteristics 14
Exterior Zone 14
Horicon Zone 15
Regular Season Harvest 16
Statewide 16
Exterior Zone 16
Horicon Zone 19
Management Implications 20
Citations 24
Appendix- Harvest and participation data 26
Canada Goose management zone map 39

4
5
WISCONSIN 2016 CANADA GOOSE HARVEST REPORT
INTRODUCTION
The management of Canada goose populations and hunting recreation has been a social
and biological challenge for the state of Wisconsin since the 1950’s (Miller 1998).
Continental Canada goose management is based on several different breeding
populations. The fall harvest of Canada geese in Wisconsin consists primarily of two
populations. One population once referred to as the Mississippi Valley Population
(MVP), but hereafter will be referred to as Ontario nesting Canada geese, breeds along
the southern Hudson Bay Coast in Ontario and migrates south primarily through
Wisconsin and Michigan, and then Illinois, Indiana and western Ohio. Traditionally,
many Ontario nesting Canada geese wintered in Kentucky and Tennessee, and sometimes
as far south as Mississippi (Brook and Luukkonen 2010, Leafloor et al. 2003). However,
in recent years many are wintering as far north as northern Illinois and southern
Wisconsin. A second major population of geese contributing to Wisconsin’s harvest is
the resident or giant race which breeds in WI, hereafter referred to as Temperate
Breeding Population of Canada geese (TBP). Based on banding data, a small percentage
of Wisconsin’s goose harvest (~2%) also comes from the Eastern Prairie, Tall Grass
Prairie and Southern James Bay Populations. The Mississippi Flyway Council (MFC)
was established in 1952 to work cooperatively among the states, provinces and federal
governments in the management of migratory birds and in 1956 the MFC established a
Canada Goose Committee to manage the harvest and distribution of several Canada
goose populations in the Flyway.
In the 1950’s the Ontario nesting Canada geese were the primary population of Canada
geese in Wisconsin while the TBP geese were considered nearly extinct in the Flyway.
During this period, the Horicon National Wildlife Refuge (NWR) in WI began managing
specifically to support migrating Ontario nesting Canada geese during the fall.
Landscape changes, Horicon refuge management and an expanded refuge system in
Illinois all contributed to an increase in fall/winter Canada goose populations and harvest
levels in both states. In 1960 Wisconsin and Illinois agreed to establish a harvest quota
system to cooperatively manage goose harvest and despite a number of changes, a quota
system remained through 2006. During the early 1960’ Ontario nesting geese steadily
increased in numbers at Horicon with fall numbers exceeding 100,000 geese and harvest
near 1,000 geese per day for only a 9 to 11 day season. This growing fall goose
population began to cause significant agricultural crop depredation in WI and complaints
by hunters in states to the south that WI was short stopping geese (Miller 1998). In 1965
agricultural damage payments began as a result of goose depredation in east central WI.
Over a period of several years in the 1960’s; social, political and biological forces
surrounded goose management and resulted in actions such as hazing and a harvest of
30,000 geese in 3 days of shooting in 1966. In 1965 the MFC agreed to a winter Flyway
population objective of 200,000 and in 1969 this was increased to 300,000. Several
states in the Flyway wished to see an increase in the Ontario nesting Canada goose
6
population and a greater distribution of these birds to the south of WI while WI managers
continued to express concern over increased goose concentrations in east central WI.
In the 1970’s up to 80% (250,000-300,000 birds) of the winter population of those
Ontario nesting Canada geese stopped at Horicon and surrounding areas (Miller 1998).
Agricultural and biological concerns over this concentration of birds led to the 1976
management strategy to reduce the peak fall population and encourage birds to move
south. Altering land management in the Horicon NWR, and increased harvest and
disturbance helped to move geese out of the refuge but not necessarily to locations
outside of WI. However, many hunters and goose watchers in Wisconsin opposed these
efforts to redistribute goose concentrations. A number of biological and political
concerns complicated management efforts. In 1979 the MFC prepared the first Flyway-
wide management plan for Ontario nesting Canada geese specifically for the MVP in an
attempt to create a more scientifically based management strategy. Revisions of this plan
continue to guide the management of the MVP population with the most recent revision
in 2010 (Brook and Luukkonen 2010). Work is currently underway to create a combined
Canada goose management plan for all populations in the Flyway.
Meanwhile, a few small remnants of the TBP geese were discovered in southern WI and
elsewhere in the Flyway during the 1950s and 1960s. Restoration efforts to increase this
population began in the 1960’s and involved the releasing of birds from captive reared
populations, translocation of birds within and among states and provinces and closure of
Canada goose hunting in some areas (MF Giant Canada goose management plan 1996).
Now TBP geese are the most abundant subspecies in the Flyway (Leafloor et al. 2003).
The increase in the TBP of Canada geese began in urban and rural areas of southeast WI
and this remains an area of high resident goose densities. Temperate breeding Canada
geese have adapted well to the urban, suburban and agricultural landscapes in Wisconsin
and an increasing population was documented from 1986 when WI goose surveys began
until about 2011 along with an expanding distribution across the state. With this
increasing population and distribution came both problems with agricultural damage and
urban nuisance geese as well as increased hunting and viewing opportunities. Most
recent harvest derivations indicate that the TBP geese are approximately 40% of the WI
regular season Canada goose harvest and nearly all of the early September season
harvest. The Wisconsin breeding population of temperate breeders steadily increased
during the 1980s and 1990s but stabilized from 2005-2008 and has shown a decreasing
trend since 2011.
The MVP Canada goose Management Plan provides the basis for evaluation and
management of the Ontario nesting Canada goose population and harvest. The annual
harvest quota was being determined using the breeding population estimate (breeding
adults) produced by the Ontario Ministry of Natural Resources as a trigger to determine
different harvest levels. Based on the total Ontario nesting Canada goose harvest level,
the harvest quota in 2006 was distributed among the major and minor harvest states as
follows; WI 35%, IL 33%, MI 20%, KY 12% and the minor harvest states a collective
harvest of 80,500 geese. Annual harvest derivations for each state indicated the
7
percentage of the annual Canada goose harvest for each state that comes from the Ontario
nesting Canada geese, TBP geese or other populations. While quotas and derivations
have varied, it is clear that Wisconsin and Illinois have been most dependent on the
Ontario nesting geese to support Canada goose harvest among states in the Flyway. The
total harvest quota for the state of Wisconsin was determined by applying derivations to
the Ontario nesting Canada goose harvest limit. During this period, we were challenged
with conflicting trends with and the TBP goose population was increasing while the
Ontario nesting Canada geese and overall state goose harvest was declining. This was the
system that guided the Canada goose season framework for Wisconsin up until 2006.
Changing Canada Goose Harvest Management in the Mississippi Flyway
Historically, there was an emphasis on maintaining a high abundance of Ontario nesting
Canada geese via population objectives and harvest restraint. The simultaneous growth
of the TBP goose population provided more harvest opportunities, but has also expanded
management challenges (e.g., human-goose conflict). There was some concern that the
annual regular hunting season changes intended to reduce harvest on the Ontario nesting
Canada geese in low population years also reduced harvest on TBP geese, allowing
greater growth of that population. In addition, in the Mississippi Flyway (14 states)
nearly 70% of the total Canada goose harvest now consists of the TBP geese. Therefore,
one theory was that the TBP geese can “buffer” the Ontario nesting Canada geese and
other interior Canada goose populations from harvest impacts in most locations. In order
to test this theory, in 2007 the states that harvest the Ontario nesting geese in the Flyway
set stable seasons for five years. By creating a stable hunting season framework and
monitoring outcomes, the ability of the TBP geese to “buffer” the harvest of migrants
was tested. On a Flyway-wide level, the effects of this new strategy were predicted to
increase overall harvest and harvest rate of the TBP geese and thus slow or stabilize their
population growth. Predicted effects on migrant goose populations included either an
insignificant increase in harvest rate or an initial larger increase in harvest rate followed
by declining abundance and declining harvest rate.
This 5 year trial of a stable hunting season was agreed to among the states that harvest
Ontario nesting Canada geese in 2007, to determine if we could simplify hunting
regulation changes, increase hunting opportunity and increase harvest on TBP Canada
geese without negatively impacting the Ontario nesting population. In Wisconsin, we
agreed to a 15 day – 5 bird daily bag limit early September Canada goose season, an 85
day – 2 bird daily bag Exterior Canada goose season and a 92 day Horicon season with a
6 bird season limit and a 2 bird daily limit.
Wisconsin’s Canada goose harvest system provided excellent tools to monitor harvest as
part of the evaluation of this strategy because of the 1-800 mandatory harvest reporting
system. During the 5-year trial from 2007-2011 Exterior Zone harvest figures ranged
from 31,570-43,958 while under the previous variable season structures of 2003-2006,
the harvest ranged from 26,902 – 46,699 (Figure 5). It did not appear that the regulations
had a significant impact on total harvest. Changes in annual goose production and fall
8
weather are likely driving much of the total harvest variation observed over these years.
With harsh, early winters, Wisconsin’s goose hunting season may effectively end, but
this actually has a greater impact on the Ontario nesting birds as they are driven south to
Illinois where they continue to be hunted. Based on the heavy hunting pressure in
Wisconsin early in the season (Figure 6, Figure 7) and low pressure later in the season,
adding additional hunting days late in the season has had little impact on total harvest.
However, it seems clear that the greatest harvest impact to the Ontario nesting Canada
goose population occurs in late September to mid-October.
At the February 2012, Mississippi Flyway Council technical meeting, waterfowl
biologists from across the Flyway reviewed population status, harvest data and
hunter/harvest surveys with the objective of charting the next step in Canada goose
hunting regulations based on the prior 5 year stable regulations. Wisconsin’s detailed
harvest data as reported in this document was important in the evaluation process.
Across the Mississippi Flyway, TBP of Canada geese were harvested at a rate of 16%
while in Wisconsin we harvested at a rate of 21%. At the same time, the Wisconsin and
the Mississippi Flyway breeding populations of TBP of Canada geese had shown an
increasing population trend. The steady increase observed from 1993-2000 was at a rate
of 7.2% annual growth. However, this rate of increase began to slow and the average
increase from 2001-2014 was only 1.2%. This reduction in population growth of the
TBP reduced any offset to the Ontario nesting Canada goose harvest. Nonbreeding TBP
(1-2 year olds and failed breeders) often migrate north to Ontario for the summer molt in
what is called a molt migration. These geese return to Wisconsin and Michigan in
September just prior to or with the Ontario nesting birds. Early opening (prior to
September 24) regular seasons help to target harvest of these birds and Wisconsin was
recognized by the other states as having an effective season structure to provide
additional harvest on these migrating TBP geese. With regard to TBP geese it was
believed that early opening dates (mid-September), additional hunting days and higher
bag limits were all options to increase regular season harvest on TBP geese across the
states. The use of these options would vary by state depending on the goals for the other
populations of Canada geese harvested in that state.
In contrast to the data related to TBP Canada geese which suggested opportunities for
liberalizing hunting season parameters, the Ontario nesting Canada goose data required a
cautious approach. Several years of low to moderate production, high adult harvest in
2009 and a steadily declining breeding population trend for the Ontario nesting geese all
contributed to a decision to avoid changes that might result in increased harvest.
Wisconsin is most dependent upon the Ontario nesting geese (about 60% of regular
season harvest) to support our Canada goose hunting opportunities with Illinois also
heavily dependent and Michigan somewhat dependent upon them as well. While
breeding ground conditions are likely the primary force driving population change,
significant harvest during low population cycles could drive the Ontario nesting geese
lower, slow population recovery and reduce hunting opportunity in Wisconsin. It appears
that this has been our experience the last several years as the Ontario nesting Canada
goose population continues to decline. In Wisconsin, most regular season Canada goose
9
hunting pressure and harvest occurs in late September and October (Figure 6). In the
Exterior Zone, 80% of the season harvest occurs in the first half of the season prior to
November 1. If we decide there is a need to reduce harvest on the Ontario nesting geese
then reducing bag limits or hunting days during the late September to mid-October period
would have the most benefit.
With the background of mixed results toward TBP and Ontario nesting Canada geese
goals, the MFC agreed to a small step toward greater liberalization of Canada goose
hunting regulations. The states that share the Ontario nesting geese could increase their
regular season Canada goose hunting season length from 85 to 92 days with a 2 bird bag
limit or shorten the season to 78 days with a 3 bird daily bag limit. The northern states
with high Ontario nesting Canada goose harvest (Wisconsin, Michigan and Illinois)
agreed to increase the hunting season length and maintain a 2 bird daily bag limit while
the southern states that harvest Ontario nesting geese increased the daily bag limit with a
shorter season, recognizing that a greater proportion of their harvest is TBP geese. While
this change provided an extra week of harvest opportunity for Wisconsin in 2013-2016, it
had a relatively small impact on overall harvest since few hunters hunt geese in
December. Less than 1-2% of total harvest occurred during these additional 7 days
during 2013-16 (Appendix Table 5).
Since 2012, there has been a growing interest among some states to simplify the Canada
goose regulatory frameworks at the Flyway level, reduce Ontario goose monitoring costs
and further liberalize regulations. States (Wisconsin, Illinois) more dependent upon
Canada goose nesting in northern Ontario expressed concern over this approach. The
management of Canada and cackling geese in the Mississippi Flyway is complicated by
the need to balance potentially conflicting objectives for arctic, subarctic and temperate-
breeding populations. These include maintaining breeding distributions, sustainable
populations, ecosystem functions, and multiple benefits and costs within social and
economic tolerances. As a result, three flyway committees that managed 3 different
subarctic populations were merged into one committee and a new merged monitoring
strategy was approved for 2016 which should reduce costs. The Mississippi Flyway
Canada goose committee recommended hunting season frameworks that provide
flexibility for state and provincial agencies to select regulations to meet local objectives
recognizing that dependence on different populations may require different regulations.
For 2016, this resulted in a simpler and broader Canada goose regulation framework that
allowed state regulations to vary based on the status of the Canada geese that support
each state’s harvest.
A disproportionate number of Horicon Zone harvested geese are from the Ontario nesting
Canada goose population, so there has been a need for special harvest management in this
zone. In addition, the Horicon Zone provides a unique hunting opportunity with reduced
hunter pressure which has been maintained to control harvest. However, the county level
harvest data over the last decade also indicated that parts of the Horicon Zone were being
underutilized. As a result, in 2012 we began to evaluate the possibility of reducing the
size of the zone to better represent the core around Horicon Marsh. Following analysis of
10
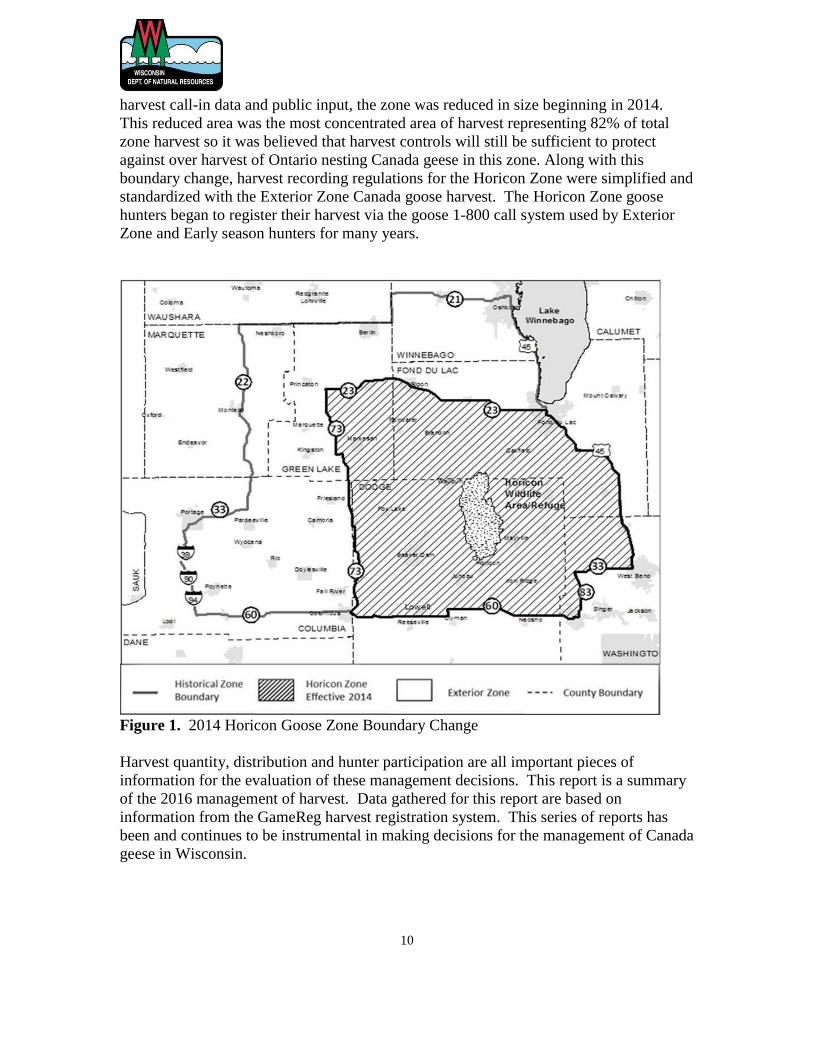
harvest call-in data and public input, the zone was reduced in size beginning in 2014.
This reduced area was the most concentrated area of harvest representing 82% of total
zone harvest so it was believed that harvest controls will still be sufficient to protect
against over harvest of Ontario nesting Canada geese in this zone. Along with this
boundary change, harvest recording regulations for the Horicon Zone were simplified and
standardized with the Exterior Zone Canada goose harvest. The Horicon Zone goose
hunters began to register their harvest via the goose 1-800 call system used by Exterior
Zone and Early season hunters for many years.
Figure 1. 2014 Horicon Goose Zone Boundary Change
Harvest quantity, distribution and hunter participation are all important pieces of
information for the evaluation of these management decisions. This report is a summary
of the 2016 management of harvest. Data gathered for this report are based on
information from the GameReg harvest registration system. This series of reports has
been and continues to be instrumental in making decisions for the management of Canada
geese in Wisconsin.
11
BREEDING POPULATIONS
With the shift in Canada goose management at a Flyway level, we also transitioned away
from the traditional breeding Canada goose survey, which surveys for the geese that nest
in northern Ontario to a design that provides indices of goose populations. The new
survey design monitors areas of high Canada goose density on the breeding grounds and
is used to detect changes in populations rather than provide a specific estimate. This
means that the index we obtain from the survey from 2016 and into the future will not be
comparable to the breeding goose estimates prior to 2015. It will take several years
before we have enough data using the new survey technique to begin to identify
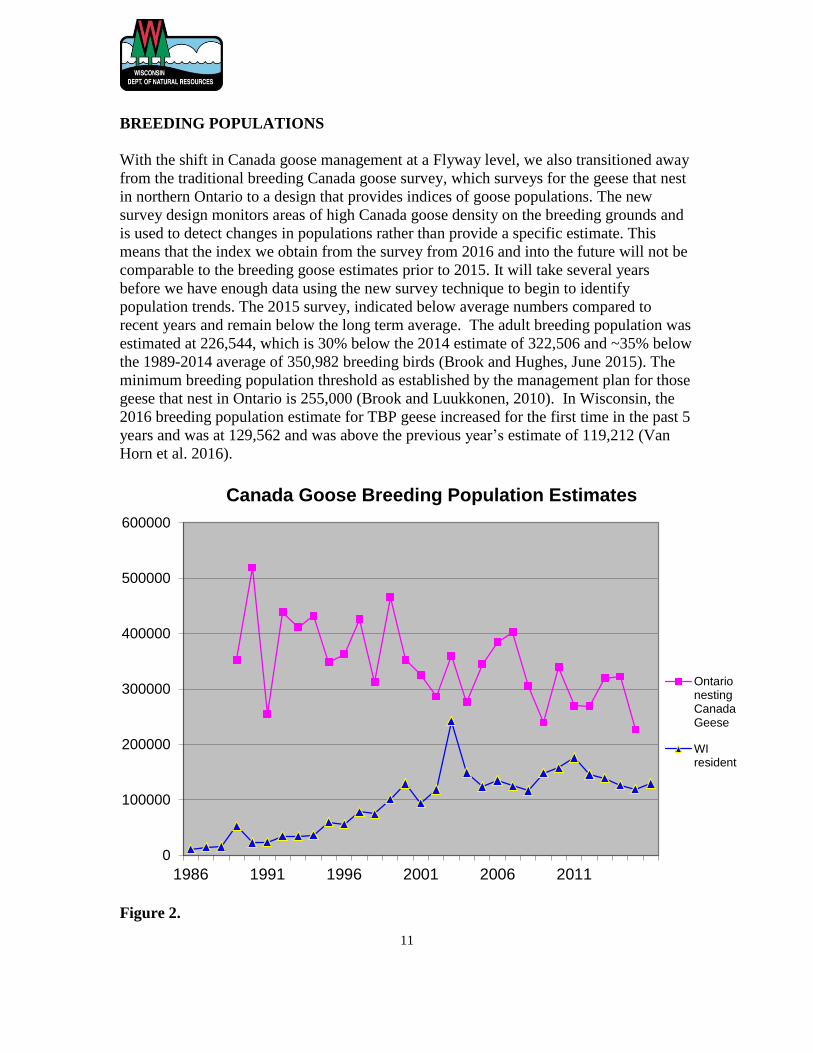
population trends. The 2015 survey, indicated below average numbers compared to
recent years and remain below the long term average. The adult breeding population was
estimated at 226,544, which is 30% below the 2014 estimate of 322,506 and ~35% below
the 1989-2014 average of 350,982 breeding birds (Brook and Hughes, June 2015). The
minimum breeding population threshold as established by the management plan for those
geese that nest in Ontario is 255,000 (Brook and Luukkonen, 2010). In Wisconsin, the
2016 breeding population estimate for TBP geese increased for the first time in the past 5
years and was at 129,562 and was above the previous year’s estimate of 119,212 (Van
Horn et al. 2016).
Figure 2.
0
100000
200000
300000
400000
500000
600000
1986 1991 1996 2001 2006 2011
Canada Goose Breeding Population Estimates
OntarionestingCanadaGeese
WIresident
12
METHODS
The Wisconsin Department of Natural Resources collects Canada goose harvest data for
all zones using call-in reporting. In 2014 the Horicon Zone reporting requirements were
changed to make reporting consistent statewide but the Horicon hunter survey was
maintained for 2014 and 2015 to provide comparable overlapping data between the 2
systems. In 2016, the Department merged telephone and internet registration for Canada
geese with turkeys, deer and other game species into one consistent system; Go Wild.
Harvest registration for Canada geese and other game species can be done by telephone
1-844-426-3734 (844 GAME-REG) or internet at gamereg.wi.gov.
Go Wild Registering System
During the 2016 statewide Early September season, Exterior Zone and Horicon Zone in
the regular season, all Canada goose hunters were required to report their harvest using
either 1-844-GAME-REG or online via gamereg.wi.gov within 48 hours. With this
system, hunters report the following information: Canada goose tag number, date of
harvest, county of harvest and number of geese harvested. This information is
electronically recorded and summarized in a harvest database that is reviewed weekly
during the season to track harvest levels. Department law enforcement personnel around
the state conduct field checks of Canada goose hunters to assure compliance with the
reporting requirement. Results of these field checks provide a compliance rate that is
used to adjust the reported harvest to estimate total Canada goose harvest. The level of
harvest detail available through this system is not available through any other state or
federal database.
Horicon Mail Survey
Canada goose hunters in the Horicon Zone were mailed a hunter questionnaire in 2014
and 2015 to obtain harvest information as they have in past years to provide transition
data to new collection methods. Continuation of the Horicon mail survey in 2014 and
2015 provided overlapping data with the 1-800 harvest registration so we could compare
the 2 methods of estimating harvest during the transition from one system to another.
RESULTS AND DISCUSSION
Early September Canada Goose Season Hunter Participation and Harvest
The Early September season is an important part of Wisconsin’s Canada goose
management program. This season offers hunters an additional recreational experience
outside of the regular season and directs harvest pressure onto our TBP Canada geese
formerly known as resident giants. In 2016, the season was open from September 1-15
with a 5 bird daily bag limit, which was unchanged from previous years.
13
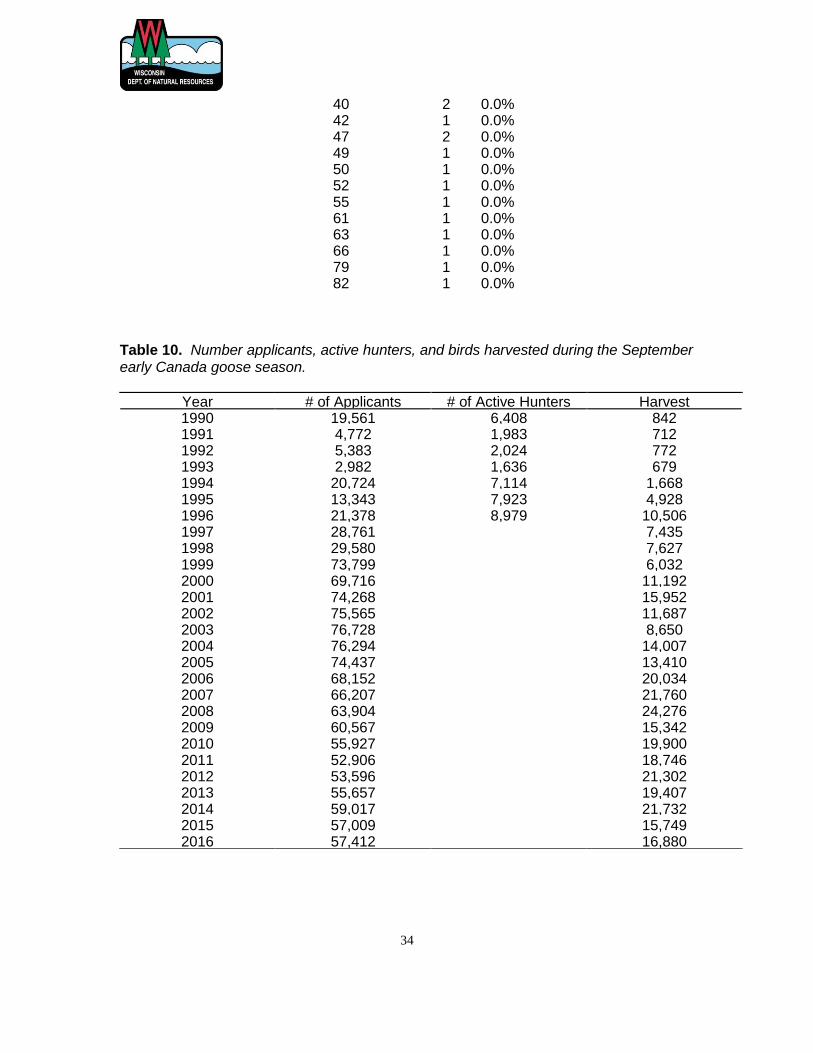
The number of applicants for the early season Canada goose permit was 57,412 which
was a slight increase from 2015 (Appendix Table 10). Prior to 2003, the number of early
permit holders had been steadily increasing. However, in 2004 the Conservation Patron
license increased from $110 to $140 and then to $165 in 2005 and the number of patron
licenses began declining. We believe this also triggered a several year decline in Canada
goose permit holders from 2004-2011 since all conservation patron license holders were
provided an early goose permit. We have no data to assess the percent of the total
applicants that actively hunt during this period although the federal HIP data suggests
relatively stable overall (early and regular season) active Canada goose hunter numbers in
Wisconsin the last several years. Conservation patron license customers are offered an
early goose permit as part of the combined license package so some of these permit
holders may have had little intent to hunt during this season even though they had a
permit. The harvest figures for 2016 show that 3,378 hunters were successful in
harvesting one or more geese during the early season, which was up from 3,363 in 2015.
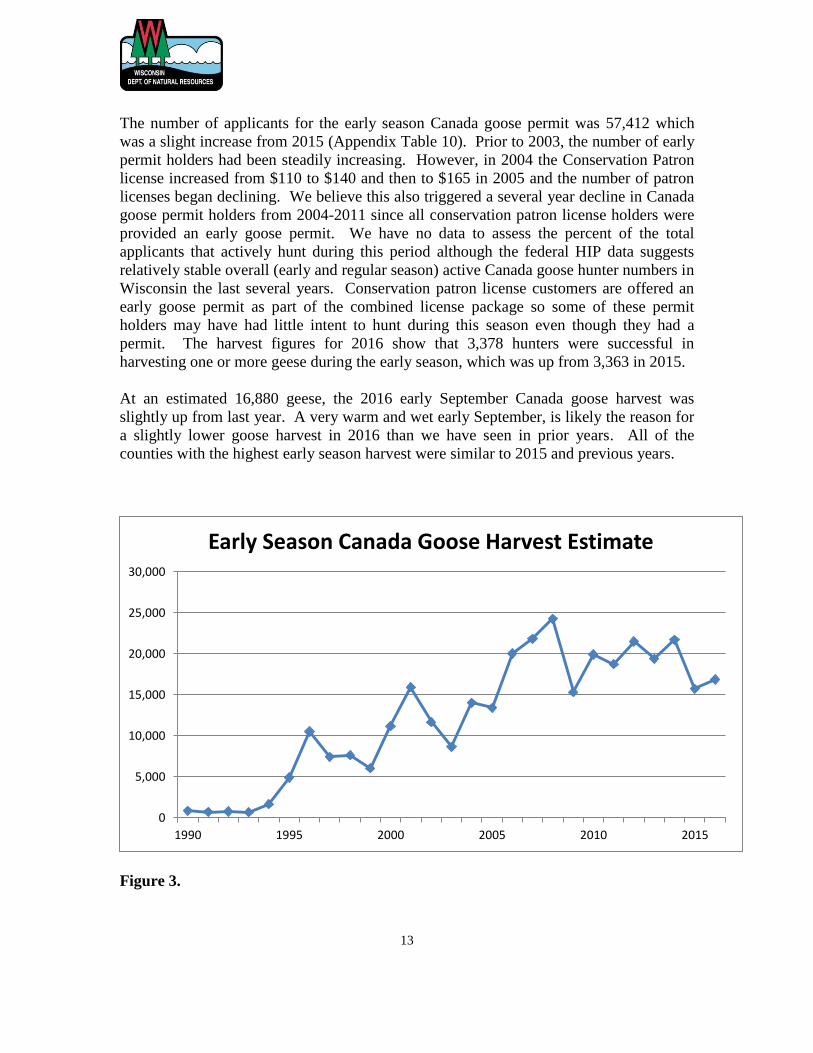
At an estimated 16,880 geese, the 2016 early September Canada goose harvest was
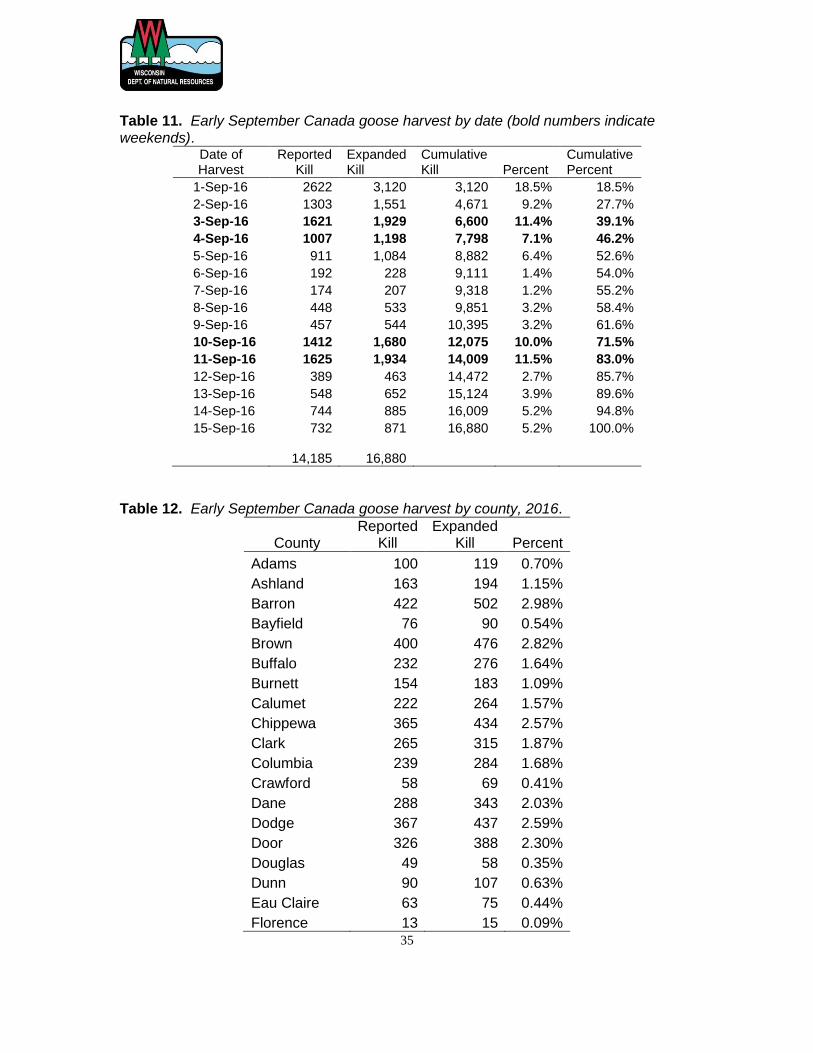
slightly up from last year. A very warm and wet early September, is likely the reason for
a slightly lower goose harvest in 2016 than we have seen in prior years. All of the
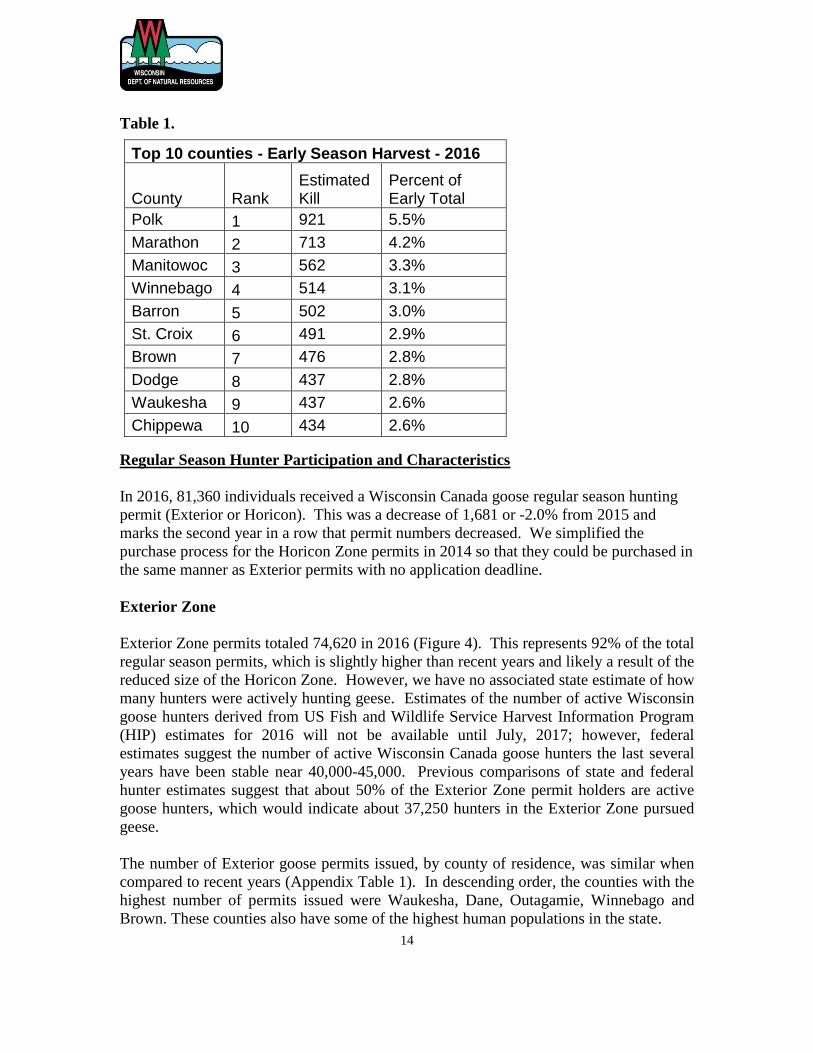
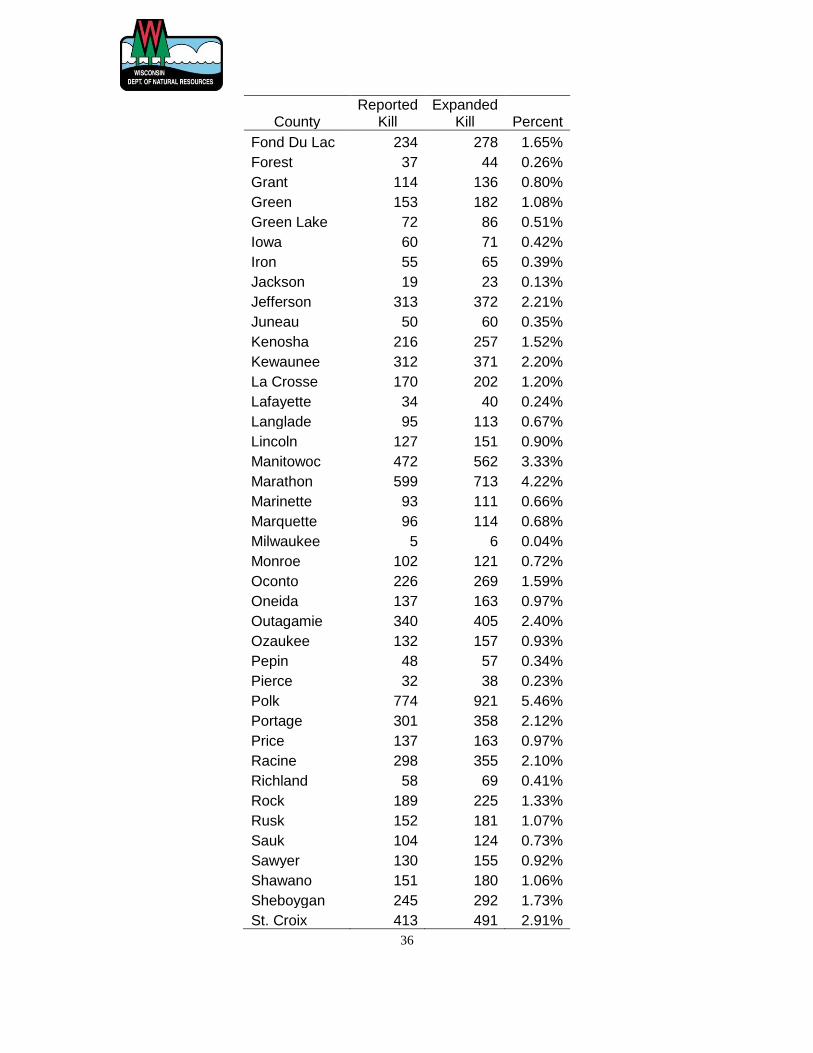
counties with the highest early season harvest were similar to 2015 and previous years.
Figure 3.
0
5,000
10,000
15,000
20,000
25,000
30,000
1990 1995 2000 2005 2010 2015
Early Season Canada Goose Harvest Estimate
14
Table 1.
Regular Season Hunter Participation and Characteristics
In 2016, 81,360 individuals received a Wisconsin Canada goose regular season hunting
permit (Exterior or Horicon). This was a decrease of 1,681 or -2.0% from 2015 and
marks the second year in a row that permit numbers decreased. We simplified the
purchase process for the Horicon Zone permits in 2014 so that they could be purchased in
the same manner as Exterior permits with no application deadline.
Exterior Zone
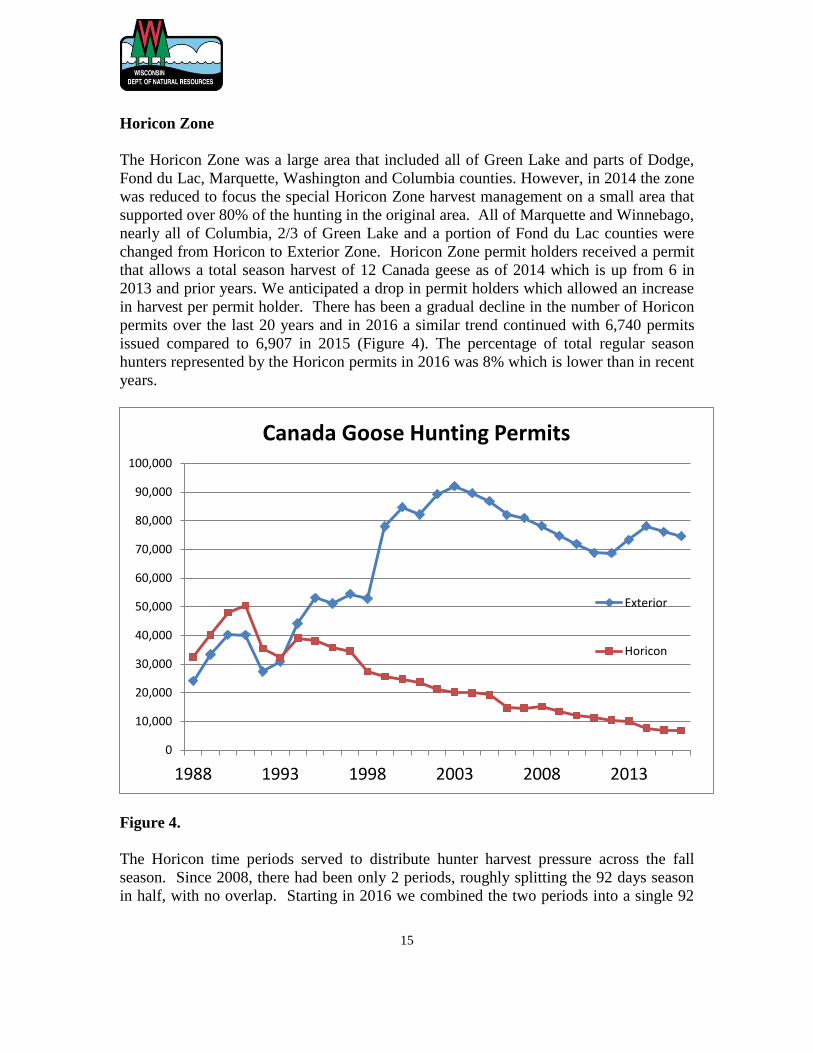
Exterior Zone permits totaled 74,620 in 2016 (Figure 4). This represents 92% of the total
regular season permits, which is slightly higher than recent years and likely a result of the
reduced size of the Horicon Zone. However, we have no associated state estimate of how
many hunters were actively hunting geese. Estimates of the number of active Wisconsin
goose hunters derived from US Fish and Wildlife Service Harvest Information Program
(HIP) estimates for 2016 will not be available until July, 2017; however, federal
estimates suggest the number of active Wisconsin Canada goose hunters the last several
years have been stable near 40,000-45,000. Previous comparisons of state and federal
hunter estimates suggest that about 50% of the Exterior Zone permit holders are active
goose hunters, which would indicate about 37,250 hunters in the Exterior Zone pursued
geese.
The number of Exterior goose permits issued, by county of residence, was similar when
compared to recent years (Appendix Table 1). In descending order, the counties with the
highest number of permits issued were Waukesha, Dane, Outagamie, Winnebago and
Brown. These counties also have some of the highest human populations in the state.
Top 10 counties - Early Season Harvest - 2016
County Rank Estimated Kill
Percent of Early Total
Polk 1 921 5.5%
Marathon 2 713 4.2%
Manitowoc 3 562 3.3%
Winnebago 4 514 3.1%
Barron 5 502 3.0%
St. Croix 6 491 2.9%
Brown 7 476 2.8%
Dodge 8 437 2.8%
Waukesha 9 437 2.6%
Chippewa 10 434 2.6%
15
Horicon Zone
The Horicon Zone was a large area that included all of Green Lake and parts of Dodge,
Fond du Lac, Marquette, Washington and Columbia counties. However, in 2014 the zone
was reduced to focus the special Horicon Zone harvest management on a small area that
supported over 80% of the hunting in the original area. All of Marquette and Winnebago,
nearly all of Columbia, 2/3 of Green Lake and a portion of Fond du Lac counties were
changed from Horicon to Exterior Zone. Horicon Zone permit holders received a permit
that allows a total season harvest of 12 Canada geese as of 2014 which is up from 6 in
2013 and prior years. We anticipated a drop in permit holders which allowed an increase
in harvest per permit holder. There has been a gradual decline in the number of Horicon
permits over the last 20 years and in 2016 a similar trend continued with 6,740 permits
issued compared to 6,907 in 2015 (Figure 4). The percentage of total regular season
hunters represented by the Horicon permits in 2016 was 8% which is lower than in recent
years.
Figure 4.
The Horicon time periods served to distribute hunter harvest pressure across the fall
season. Since 2008, there had been only 2 periods, roughly splitting the 92 days season
in half, with no overlap. Starting in 2016 we combined the two periods into a single 92
0
10,000
20,000
30,000
40,000
50,000
60,000
70,000
80,000
90,000
100,000
1988 1993 1998 2003 2008 2013
Canada Goose Hunting Permits
Exterior
Horicon
16
day season, it was felt that due to the continued decrease of permits issued in the Horicon
Zone, that there was no longer any need to distribute hunters throughout the season.
Regular Season Harvest
Statewide
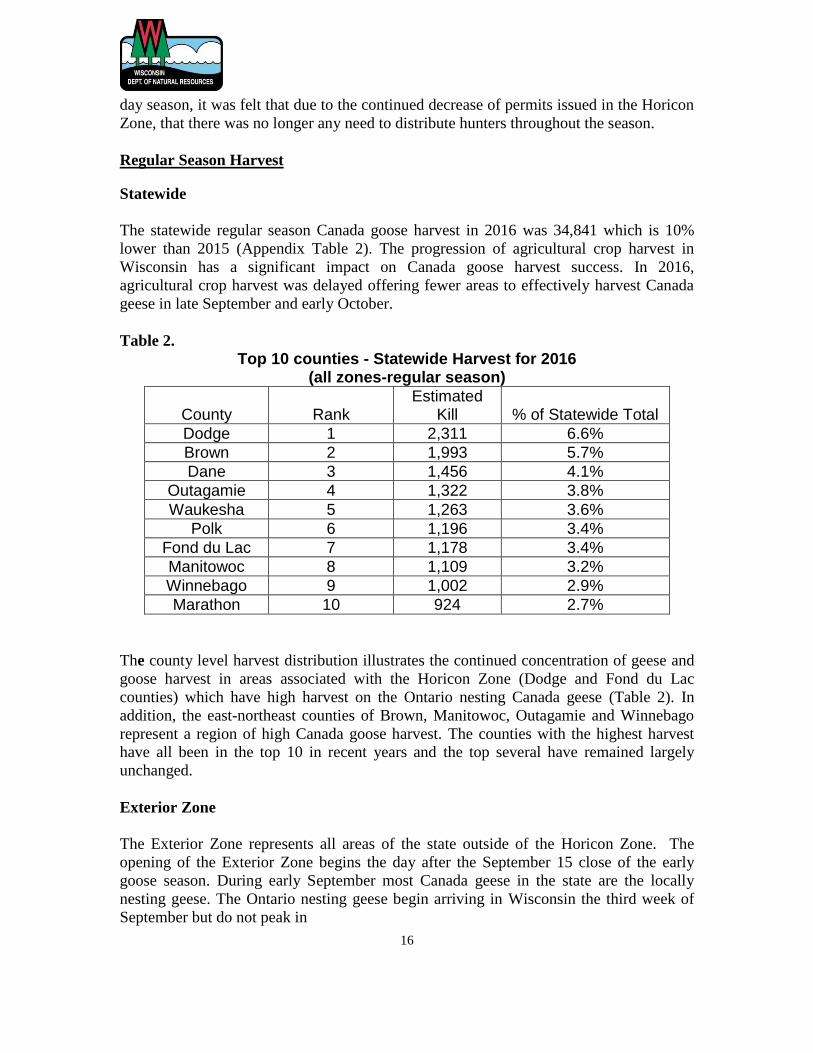
The statewide regular season Canada goose harvest in 2016 was 34,841 which is 10%
lower than 2015 (Appendix Table 2). The progression of agricultural crop harvest in
Wisconsin has a significant impact on Canada goose harvest success. In 2016,
agricultural crop harvest was delayed offering fewer areas to effectively harvest Canada
geese in late September and early October.
Table 2.
Top 10 counties - Statewide Harvest for 2016 (all zones-regular season)
County Rank Estimated
Kill % of Statewide Total
Dodge 1 2,311 6.6%
Brown 2 1,993 5.7%
Dane 3 1,456 4.1%
Outagamie 4 1,322 3.8%
Waukesha 5 1,263 3.6%
Polk 6 1,196 3.4%
Fond du Lac 7 1,178 3.4%
Manitowoc 8 1,109 3.2%
Winnebago 9 1,002 2.9%
Marathon 10 924 2.7%
The county level harvest distribution illustrates the continued concentration of geese and
goose harvest in areas associated with the Horicon Zone (Dodge and Fond du Lac
counties) which have high harvest on the Ontario nesting Canada geese (Table 2). In
addition, the east-northeast counties of Brown, Manitowoc, Outagamie and Winnebago
represent a region of high Canada goose harvest. The counties with the highest harvest
have all been in the top 10 in recent years and the top several have remained largely
unchanged.
Exterior Zone
The Exterior Zone represents all areas of the state outside of the Horicon Zone. The
opening of the Exterior Zone begins the day after the September 15 close of the early
goose season. During early September most Canada geese in the state are the locally
nesting geese. The Ontario nesting geese begin arriving in Wisconsin the third week of
September but do not peak in
17
number until mid-October so starting the Exterior Zone season the day after the early
season allows higher harvest on locally nesting geese in this season. In addition, hunter
participation and harvest are highest in late September and early October.
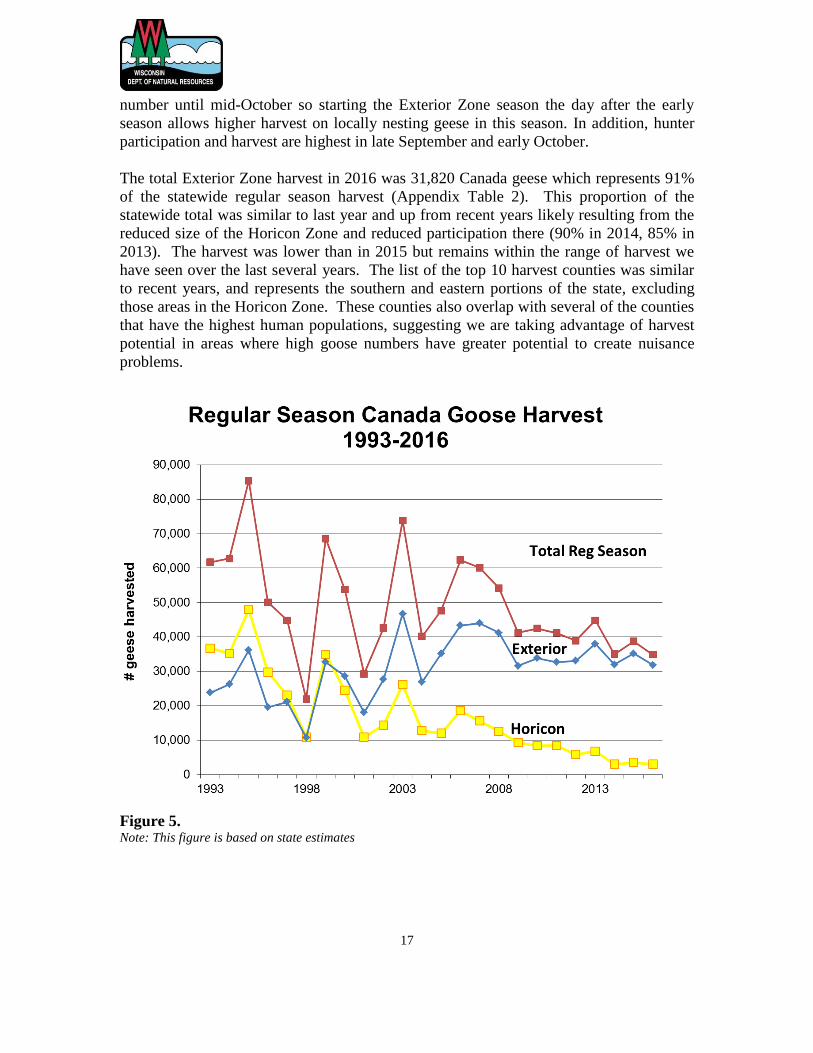
The total Exterior Zone harvest in 2016 was 31,820 Canada geese which represents 91%
of the statewide regular season harvest (Appendix Table 2). This proportion of the
statewide total was similar to last year and up from recent years likely resulting from the
reduced size of the Horicon Zone and reduced participation there (90% in 2014, 85% in
2013). The harvest was lower than in 2015 but remains within the range of harvest we
have seen over the last several years. The list of the top 10 harvest counties was similar
to recent years, and represents the southern and eastern portions of the state, excluding
those areas in the Horicon Zone. These counties also overlap with several of the counties
that have the highest human populations, suggesting we are taking advantage of harvest
potential in areas where high goose numbers have greater potential to create nuisance
problems.
Figure 5. Note: This figure is based on state estimates
Exterior
Horicon
Total
0
20,000
40,000
60,000
80,000
100,000
120,000
1990 1992 1994 1996 1998 2000 2002 2004 2006 2008 2010
# g
ee
se
ha
rve
ste
d
Canada Goose Harvest in All Regular Season Zones, 1990-2011
Exterior
Horicon
Total
0
20,000
40,000
60,000
80,000
100,000
120,000
1990 1992 1994 1996 1998 2000 2002 2004 2006 2008 2010
# g
ee
se
harv
este
d
Canada Goose Harvest in All Regular Season Zones, 1990-2011
18
Table 3.
Top 10 counties - Exterior Harvest - 2016
County Rank Estimated Kill % of Exterior Total
Brown 1 1,993 6.3%
Dane 2 1,456 4.6%
Outagamie 3 1,322 4.2%
Waukesha 4 1,263 4.0%
Polk 5 1,196 3.8%
Manitowoc 6 1,109 3.5%
Winnebago 7 1,002 3.2%
Marathon 8 924 2.9%
Calumet 9 834 2.6%
Waupaca 10 820 2.6%
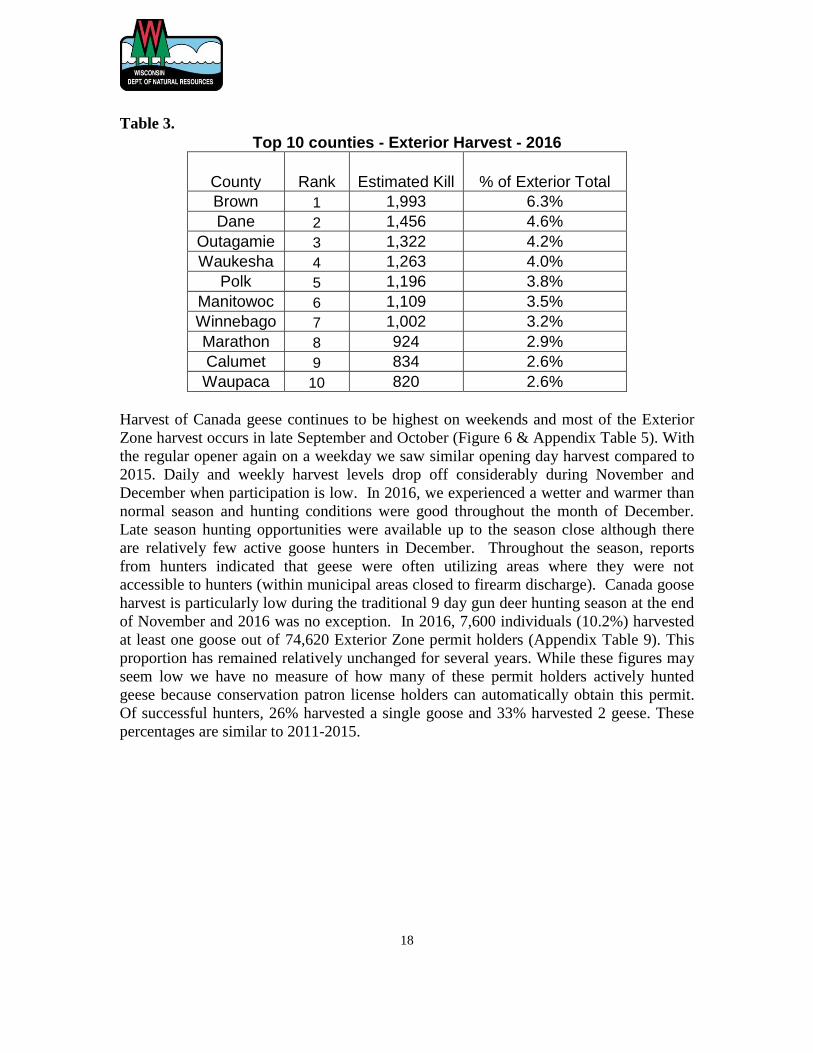
Harvest of Canada geese continues to be highest on weekends and most of the Exterior
Zone harvest occurs in late September and October (Figure 6 & Appendix Table 5). With
the regular opener again on a weekday we saw similar opening day harvest compared to
2015. Daily and weekly harvest levels drop off considerably during November and
December when participation is low. In 2016, we experienced a wetter and warmer than
normal season and hunting conditions were good throughout the month of December.
Late season hunting opportunities were available up to the season close although there
are relatively few active goose hunters in December. Throughout the season, reports
from hunters indicated that geese were often utilizing areas where they were not
accessible to hunters (within municipal areas closed to firearm discharge). Canada goose
harvest is particularly low during the traditional 9 day gun deer hunting season at the end
of November and 2016 was no exception. In 2016, 7,600 individuals (10.2%) harvested
at least one goose out of 74,620 Exterior Zone permit holders (Appendix Table 9). This
proportion has remained relatively unchanged for several years. While these figures may
seem low we have no measure of how many of these permit holders actively hunted
geese because conservation patron license holders can automatically obtain this permit.
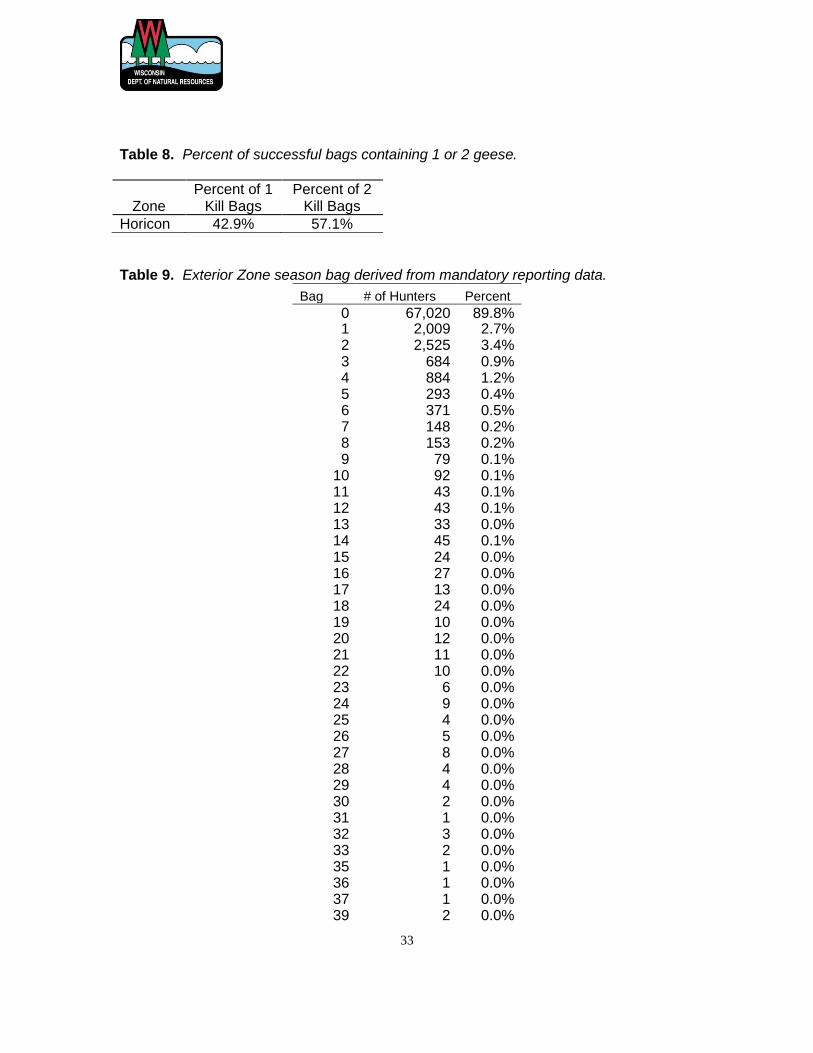
Of successful hunters, 26% harvested a single goose and 33% harvested 2 geese. These
percentages are similar to 2011-2015.
19
Figure 6.
Horicon Zone
The total Canada goose harvest for the Horicon Zone in 2016 was 3,021. This made up
9% of the statewide regular season harvest (Appendix Table 8). Harvest was down from
2015 (3,542) and was the lowest it has been in many years, likely reflecting the reduced
size of the zone and fewer hunters. The overall number of Horicon Zone permit holders
was down from 2015.
With the addition of the Horicon Zone to the telephone harvest reporting system (1-800-
GOOSE and GameReg), better and more consistent data is available on daily harvest.
Harvest of Canada geese in the Horicon Zone, similar to the Exterior, continues to be
highest on weekends and most of the Horicon Zone harvest occurs in early and mid-
October (Figure 7 & Appendix Table 6). In 2016, we experienced a wetter season which
likely contributed to the decrease in harvest compared to 2015. Late season hunting
opportunities were available up to the season close although there are relatively few
active goose hunters in December.
0
500
1,000
1,500
2,000
2,500
3,000
3,500
28-Aug 17-Sep 7-Oct 27-Oct 16-Nov 6-Dec 26-Dec
EarlyHarvest
ExteriorHarvest
20
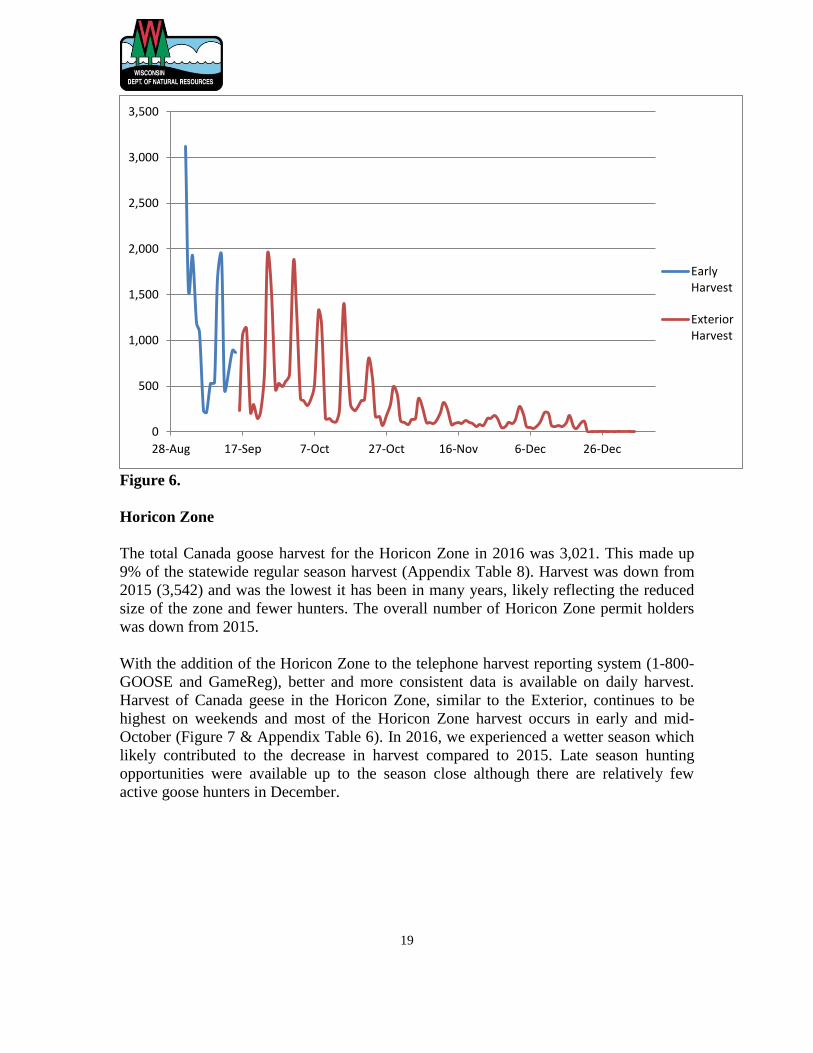
Figure 7
The areas directly adjacent to the Horicon Marsh National Wildlife Refuge and state
Wildlife Management area (portions of Dodge and Fond du Lac Counties) continue to
represent a high percentage of the Horicon Zone harvest, with 94% occurring in these
two counties alone. In the past Winnebago and Columbia counties represented a
significant portion of the zone’s area but contributed relatively little to the harvest. For
this reason we removed the area north of Hwy. 23 and west of Hwy 73 from the Horicon
Zone and designated it as part of the Exterior Zone effective in 2014.
In the third year of the size reduction of the Horicon Zone, it appears that harvest levels
in that area differ little from what was experienced across the state. The harvest success
of Wisconsin Canada goose hunters varies from year to year based on weather, crop
harvest timing, migration and goose populations.
MANAGEMENT IMPLICATIONS
Two primary populations of Canada geese are found in Wisconsin during the fall and
winter; the Temperate Breeding Population of Canada geese which nest in Wisconsin and
adjacent states and the northern Ontario nesting Canada geese formerly referred to as the
Mississippi Valley Population (MVP). The management of the Ontario nesting Canada
geese is guided by a cooperative management plan among several states and Ontario and
is acknowledged by the US Fish and Wildlife Service for management of this population
(Brook and Luukkonen 2010). Similarly, the management of the giant Canada goose
population (Temperate Breeding Population) in the Mississippi Flyway is also guided by
0
20
40
60
80
100
120
140
160
180
200
16-Sep 23-Sep 30-Sep 7-Oct 14-Oct 21-Oct 28-Oct 4-Nov 11-Nov 18-Nov 25-Nov 2-Dec 9-Dec 16-Dec
Horicon Harvest
21
a cooperative management plan (Zenner et al. 1996). Wisconsin’s Canada goose
management is guided by these 2 plans as well as the Wisconsin Waterfowl Strategic
Plan 2008-2018 (Van Horn and Benton 2007). The goal of Canada goose management in
Wisconsin is to manage the two populations in a way that balances the different and
sometimes conflicting societal perspectives of Canada geese. This goal is reached
through the following:
Provide for both abundant and quality Canada goose hunting opportunities and
monitor statewide and local harvest levels. Part of quality hunting opportunities
is to simplify hunting regulations at the state and flyway level where possible.
Work with flyway partners in cooperative monitoring of Ontario and locally
nesting Canada goose populations, survival and harvest with the objective of
maintaining a higher rate of harvest on locally nesting Canada geese than Ontario
nesting Canada geese.
Address conflicts between abundant Canada goose populations and people
through integrated management techniques including hunting where appropriate.
Seek to manage the statewide Wisconsin breeding population of Canada geese
near 125,000.
The monitoring of harvest as described in this report is an important part of implementing
these strategies along with annual population surveys, banding efforts and public input.
Ontario nesting Canada geese:
While TBP Canada geese provide about 40% of Wisconsin’s regular Canada goose
harvest and nearly all of the early season harvest, Wisconsin is still dependent upon the
Ontario nesting Canada geese for about 60% of our annual regular season goose harvest.
This is in contrast to most other Mississippi Flyway states where over 70% of their
Canada goose harvest consists of TBP Canada geese. For example, Minnesota harvests
over 90% resident geese and has a much larger population of these birds, which is why
regulations may vary even among neighboring states. The Ontario nesting breeding
population has been declining slowly over the last 20 years. While there are annual
increases and decreases in the population estimate, the population trend is now clearly
downward. The rate of adult harvest on the Ontario nesting Canada geese (not including
crippling loss) was within or below the targeted range of 8-10% from 2003-2014.
However, in years with a late winter and poor nesting conditions, the harvest rate on adult
birds increased above this range because fewer young of the year were in the fall flight.
Overall, it appears that annual production has not been able to support the harvest
demand.
In the long-term interest of maintaining the Ontario nesting goose population as a
sustainable resource, Wisconsin harvest management decisions need to continue to take
steps to maintain a relatively low harvest rate on the Ontario nesting Canada geese in the
state. The earlier opening of the Exterior Zone Canada goose season provides for the
high harvest in the early part of the season but with a lower proportion of Ontario nesting
geese. In addition, maintenance of a 2 bird or lower daily bag limit when Ontario nesting
22
geese are present in Wisconsin controls the rate of harvest on this population. Daily
harvest records allow us to document this high early harvest and schedule season dates
which reduce pressure on the geese that nest in Ontario while maintaining an abundant
harvest opportunity. The mid-September opening of the Exterior Zone season has
allowed Wisconsin to increase harvest but shift it away from the mid-October peak of
Ontario nesting goose presence in the state. On the other hand the high harvest during a
period when new Ontario nesting birds are just arriving in the state makes them more
vulnerable to harvest. Based on the variability of breeding ground conditions and the
relatively low and stable harvest rates, it appears that the Ontario nesting Canada goose
population change is driven primarily by breeding conditions and not by harvest;
however, because of periods of low recruitment there is still a need to remain cautious
about Ontario nesting goose harvest management. If the downward trend continues,
Wisconsin may need to reduce days or bag limits during the heavy harvest period of
September 16- mid-October.
The area around the Horicon Marsh contained within the Horicon Zone remains a focal
area of Ontario nesting goose migration through Wisconsin, so a shift in harvest pressure
from this area to other parts of the state is helpful in reducing the harvest rate on this
population. Over the last several years, these harvest reports have shown a decline in
Horicon Zone hunter permits and harvest while maintaining a quality hunting experience.
Further, these reports have shown that few hunters (~5%) fill the maximum harvest tags
during the entire season demonstrating that this regulation is not the limiting factor
affecting harvest opportunity (Appendix Table 13). Despite the restrictions, about 10%
of the statewide regular season Canada goose harvest in 2016 came from the 2 counties
(out of 72) containing the Horicon Marsh (Dodge and Fond du Lac) so the potential for a
high Canada goose harvest in this area remains (Appendix Table 4). This proportion was
lower than the nearly 20% level observed in the past.
Temperate Nesting Goose Population
From the early 1980’s through about 2011, the Wisconsin nesting population of
temperate nesting Canada geese grew and provided an additional hunting resource that is
more widely distributed around the state than the Ontario nesting Canada geese.
However, this increase also generated considerable conflict between abundant geese
present year round and human outdoor activities. Many of the same management
strategies designed to reduce harvest on Ontario nesters were also intended to provide
hunters with an opportunity to harvest the increasing local Canada goose resource and
help address human-goose conflicts. We have liberalized and simplified Canada goose
harvest regulations over the last several years, eliminated subzone restrictions and now
have the maximum number days (107) of Canada goose hunting allowed by international
treaty. The last five year average harvest rate on TBP Canada geese in Wisconsin was
over 21%, indicating that our current season structure has helped us reach our goal of
increased harvest pressure on locally nesting Canada geese. The 15 days of September
hunting in the early season now accounts for roughly 1/3 of the total statewide fall goose
23
harvest. The county level data shown in this report indicate that our early and Exterior
Zone Canada goose hunting are highest in many of the same counties where our human
population is highest and where many Canada goose control operations are requested.
However, since 2004 the Wisconsin breeding Canada goose population trend has
appeared to level off.
Agricultural crop damage from Canada geese, particularly during the spring continues to
be a concern for farmers in Wisconsin in areas where Canada geese concentrate.
Consideration of agricultural damage issues remains important in our overall approach to
managing Wisconsin’s Canada goose populations. The department can issue a spring
agricultural damage permit for those with eligible claims, which authorizes the removal
of Canada geese by shooting from May 15-August 31. Applicants must have (or expect
to have) crop damage in excess of $1,000 and be enrolled in the wildlife damage
abatement and claims program. In 2016, 78 spring Canada goose shooting permits were
issued and 217 geese were killed.
Similarly, consideration of Canada goose problems in urban areas is another important
aspect of management of goose management in Wisconsin. Initially, many of the
Wisconsin breeding Canada geese were found in more suburban and urban counties,
however, resident breeders continue to increase in distribution across the state. As we
monitor breeding populations and harvest we can evaluate our effectiveness at using
recreational harvest to assist in managing problems that result from concentrations of
Canada geese in urban areas. To target these birds in the fall, the early Canada goose
season remains an important part of our management strategy and contributes a
significant proportion of the overall harvest. In addition, site specific Canada goose
control measures (nest and egg control, adult take) will continue to be implemented in
some areas to mitigate nuisance goose problems. The nuisance goose control efforts of
US Department of Agriculture - Wildlife Services staff resulted in the removal of 2,584
adult and juvenile Canada geese at 34 sites in 2016; with the majority of these removals
occurring in urban centers where hunting does not sufficiently address these urban goose
conflicts (Lovell, 2016). Beginning in 2010, in addition to the federal requirement,
Wisconsin added its own mandatory reporting for nest and egg depredation permits to
better monitor control efforts around the state. In 2016, 138 nest and egg depredation
permits were issued.
24
CITATIONS
Brook, R. and J. Hughes. June 2016. 2016 Preliminary Spring Survey Results for
Interior Canada Geese. Ontario Ministry of Natural Resources and Canadian
Wildlife Service.
Brook, R.W. and D.R. Luukkonen. 2010. A Management Plan for the Mississippi Valley
Population of Canada geese. Mississippi Flyway Council Technical Section.
43pp.
Leafloor, J.O., K. F. Abraham, F. D. Caswell, K. E. Gamble, R. N. Helm, D. D.
Humburg, J. S. Lawerence, D. R. Luukkonen, R. D. Pritchert, E. L. Warr, G. G.
Zenner. 2003. Canada goose management in the Mississippi Flyway. Pages 22-36
in T. J. Moser, R. D. Lien, K. C. VerCauteren, K. F. Abraham, D. E. Andersen, J.
G. Bruggink, J. M. Coluccy, D. A.Graber, J. O. Leafloor, D. R. Luukkonen, R. E.
Trost, editors. Proceedings of the 2003 International Canada Goose Symposium,
Madison, WI. USA.
Lovell, C. 2016. Canada Goose Summary Report for Wisconsin Department of Natural
Resources 2016. USDA Wildlife Services. 9pp.
Miller, S.W. 1998. The biopolitics of Mississippi Valley Population Canada geese
management: the Wisconsin perspective. Pages 467-474 in D. H. Rusch, M. D.
Samuel, D. D. Humburg, and B. D. Sullivan, editors. Biology and management
of Canada geese. Proceedings of the international Canada Goose Symposium,
Milwaukee, Wisconsin, USA.
Van Horn, K., T. Finger, and R. Gatti. 2016. Waterfowl Breeding Population Survey for
Wisconsin, 1973-2016. Wisconsin Department of Natural Resources. 31pp.
Van Horn, K. and K. Benton. 2007. Wisconsin Waterfowl Strategic Plan 2008-2018.
Wisconsin Department of Natural Resources publication. Madison, WI. 56pp.
Wisconsin Department of Natural Resources. 1980. Canada Goose Management Plan for
East Central Wisconsin 1980-1990.
Zenner, G., J. Levengood, B. Williamson, R. Marshalla, R. Bielefeld, M. Hartman, M.
Morton, M. Gillespie, J. Johnson, T. Landwehr, D. Graber, G. Tori, K. Abraham,
E. Warr, B. Wheeler, B. Montgomery, and D. Rusch. 1996. Mississippi Flyway
Giant Canada Goose Management Plan. Mississippi Flyway Council Technical
Section. 65pp.
25
26
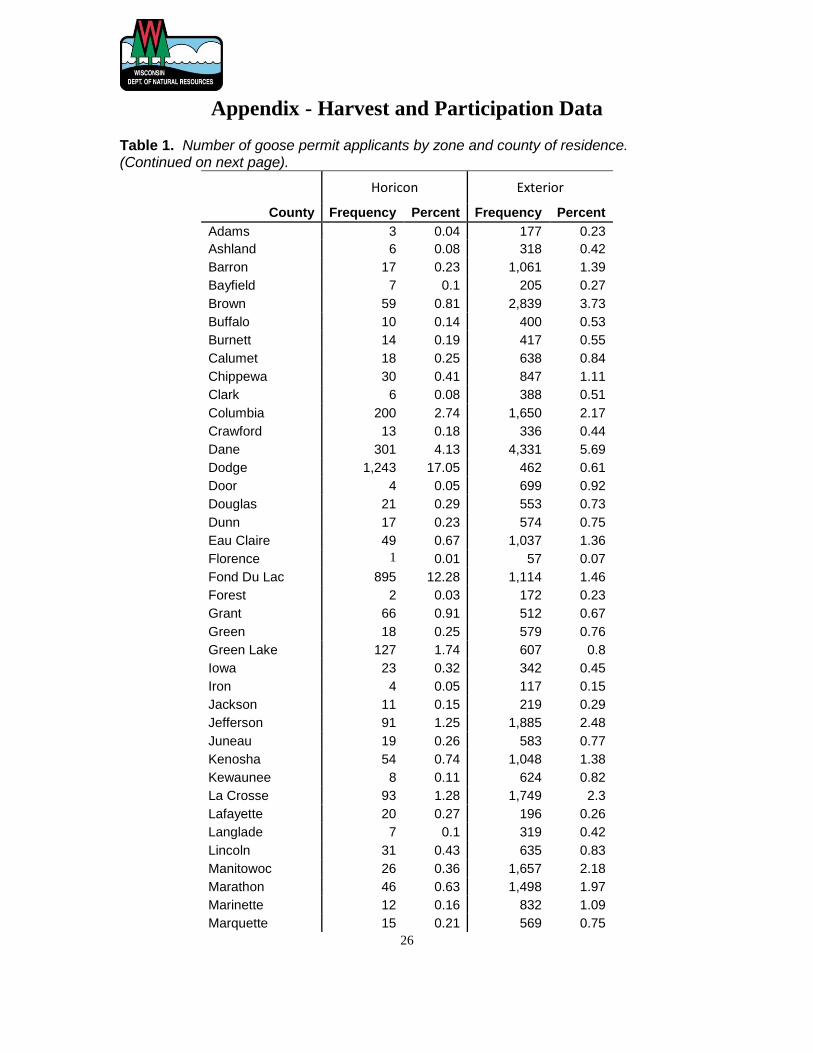
Appendix - Harvest and Participation Data Table 1. Number of goose permit applicants by zone and county of residence. (Continued on next page).
Horicon Exterior
County Frequency Percent Frequency Percent
Adams 3 0.04 177 0.23
Ashland 6 0.08 318 0.42
Barron 17 0.23 1,061 1.39
Bayfield 7 0.1 205 0.27
Brown 59 0.81 2,839 3.73
Buffalo 10 0.14 400 0.53
Burnett 14 0.19 417 0.55
Calumet 18 0.25 638 0.84
Chippewa 30 0.41 847 1.11
Clark 6 0.08 388 0.51
Columbia 200 2.74 1,650 2.17
Crawford 13 0.18 336 0.44
Dane 301 4.13 4,331 5.69
Dodge 1,243 17.05 462 0.61
Door 4 0.05 699 0.92
Douglas 21 0.29 553 0.73
Dunn 17 0.23 574 0.75
Eau Claire 49 0.67 1,037 1.36
Florence 1 0.01 57 0.07
Fond Du Lac 895 12.28 1,114 1.46
Forest 2 0.03 172 0.23
Grant 66 0.91 512 0.67
Green 18 0.25 579 0.76
Green Lake 127 1.74 607 0.8
Iowa 23 0.32 342 0.45
Iron 4 0.05 117 0.15
Jackson 11 0.15 219 0.29
Jefferson 91 1.25 1,885 2.48
Juneau 19 0.26 583 0.77
Kenosha 54 0.74 1,048 1.38
Kewaunee 8 0.11 624 0.82
La Crosse 93 1.28 1,749 2.3
Lafayette 20 0.27 196 0.26
Langlade 7 0.1 319 0.42
Lincoln 31 0.43 635 0.83
Manitowoc 26 0.36 1,657 2.18
Marathon 46 0.63 1,498 1.97
Marinette 12 0.16 832 1.09
Marquette 15 0.21 569 0.75
27
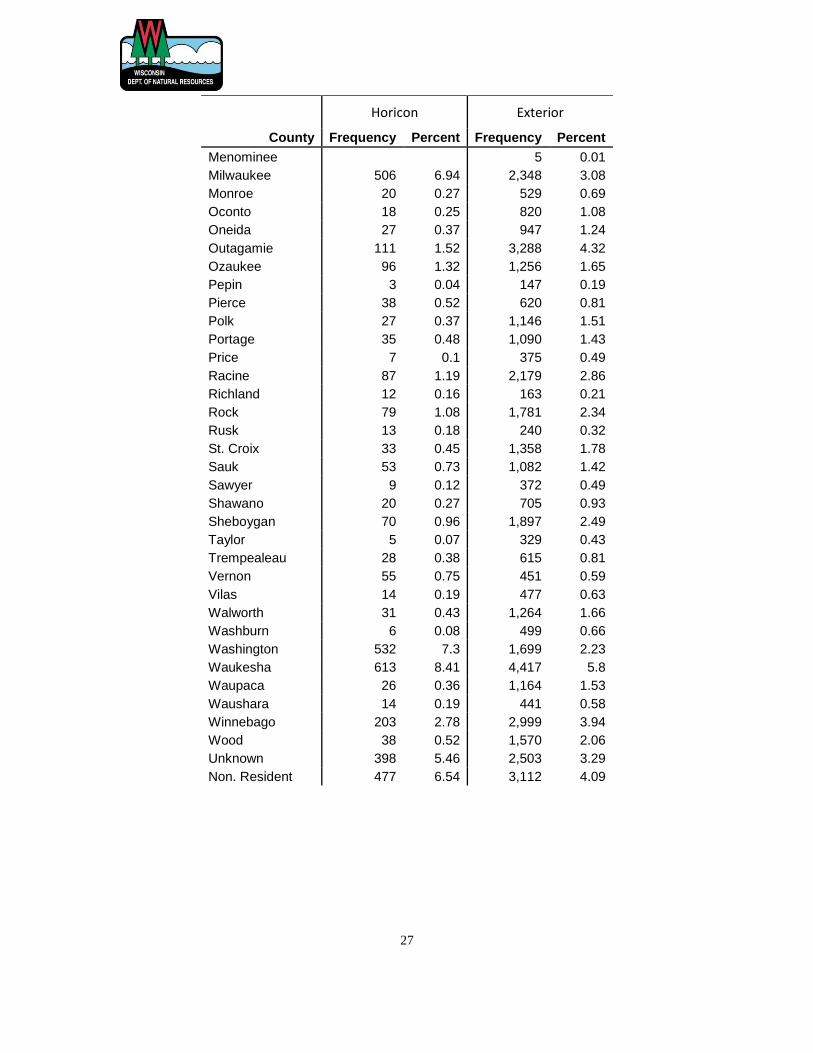
Horicon Exterior
County Frequency Percent Frequency Percent
Menominee 5 0.01
Milwaukee 506 6.94 2,348 3.08
Monroe 20 0.27 529 0.69
Oconto 18 0.25 820 1.08
Oneida 27 0.37 947 1.24
Outagamie 111 1.52 3,288 4.32
Ozaukee 96 1.32 1,256 1.65
Pepin 3 0.04 147 0.19
Pierce 38 0.52 620 0.81
Polk 27 0.37 1,146 1.51
Portage 35 0.48 1,090 1.43
Price 7 0.1 375 0.49
Racine 87 1.19 2,179 2.86
Richland 12 0.16 163 0.21
Rock 79 1.08 1,781 2.34
Rusk 13 0.18 240 0.32
St. Croix 33 0.45 1,358 1.78
Sauk 53 0.73 1,082 1.42
Sawyer 9 0.12 372 0.49
Shawano 20 0.27 705 0.93
Sheboygan 70 0.96 1,897 2.49
Taylor 5 0.07 329 0.43
Trempealeau 28 0.38 615 0.81
Vernon 55 0.75 451 0.59
Vilas 14 0.19 477 0.63
Walworth 31 0.43 1,264 1.66
Washburn 6 0.08 499 0.66
Washington 532 7.3 1,699 2.23
Waukesha 613 8.41 4,417 5.8
Waupaca 26 0.36 1,164 1.53
Waushara 14 0.19 441 0.58
Winnebago 203 2.78 2,999 3.94
Wood 38 0.52 1,570 2.06
Unknown 398 5.46 2,503 3.29
Non. Resident 477 6.54 3,112 4.09
28
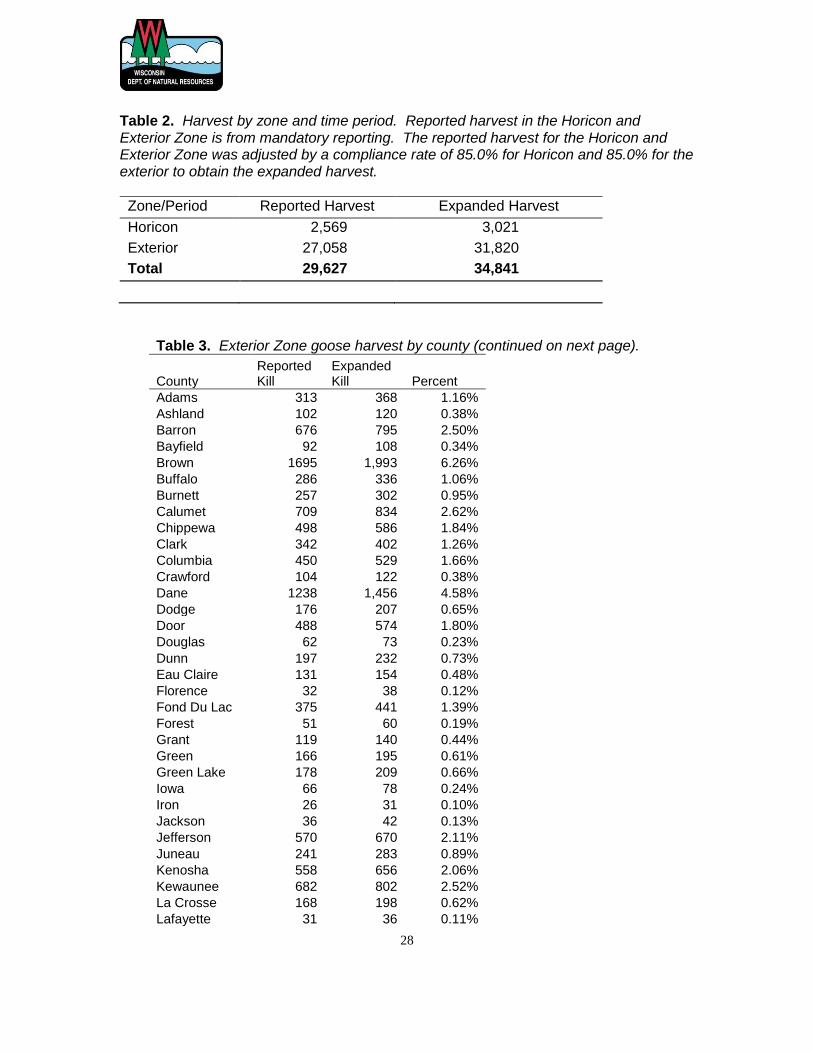
Table 2. Harvest by zone and time period. Reported harvest in the Horicon and Exterior Zone is from mandatory reporting. The reported harvest for the Horicon and Exterior Zone was adjusted by a compliance rate of 85.0% for Horicon and 85.0% for the exterior to obtain the expanded harvest.
Zone/Period Reported Harvest Expanded Harvest
Horicon 2,569 3,021
Exterior 27,058 31,820
Total 29,627 34,841
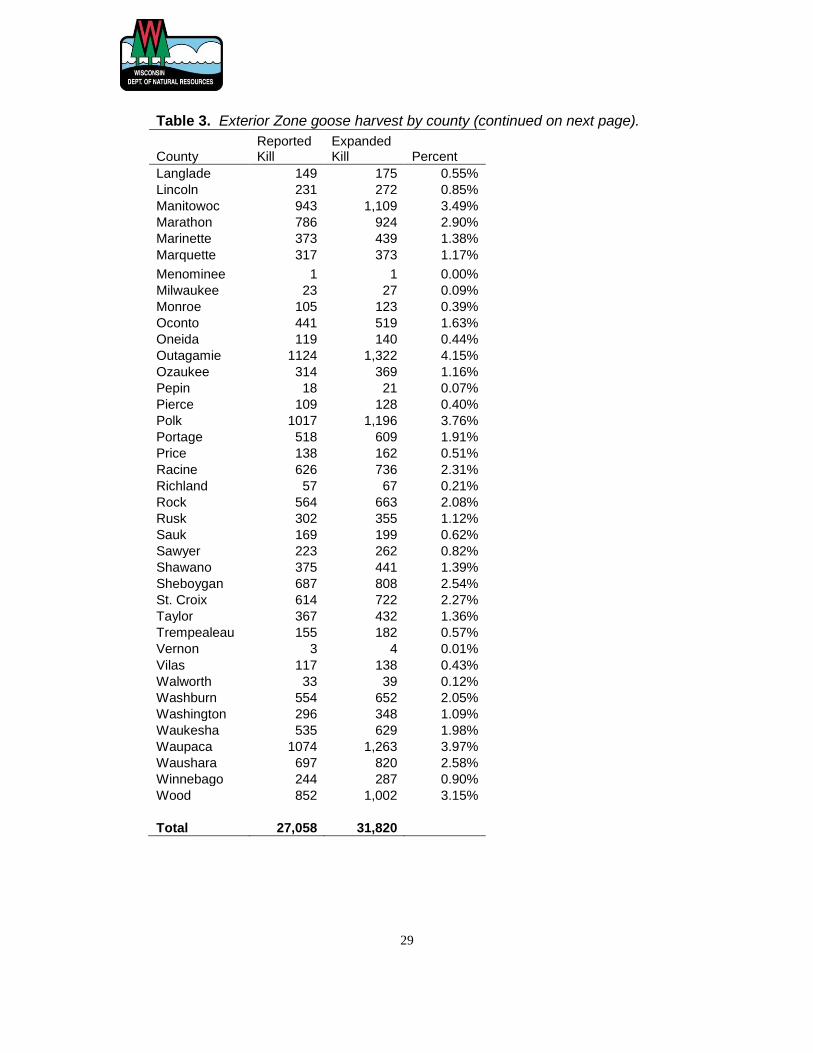
Table 3. Exterior Zone goose harvest by county (continued on next page).
County Reported Kill
Expanded Kill Percent
Adams 313 368 1.16%
Ashland 102 120 0.38%
Barron 676 795 2.50%
Bayfield 92 108 0.34%
Brown 1695 1,993 6.26%
Buffalo 286 336 1.06%
Burnett 257 302 0.95%
Calumet 709 834 2.62%
Chippewa 498 586 1.84%
Clark 342 402 1.26%
Columbia 450 529 1.66%
Crawford 104 122 0.38%
Dane 1238 1,456 4.58%
Dodge 176 207 0.65%
Door 488 574 1.80%
Douglas 62 73 0.23%
Dunn 197 232 0.73%
Eau Claire 131 154 0.48%
Florence 32 38 0.12%
Fond Du Lac 375 441 1.39%
Forest 51 60 0.19%
Grant 119 140 0.44%
Green 166 195 0.61%
Green Lake 178 209 0.66%
Iowa 66 78 0.24%
Iron 26 31 0.10%
Jackson 36 42 0.13%
Jefferson 570 670 2.11%
Juneau 241 283 0.89%
Kenosha 558 656 2.06%
Kewaunee 682 802 2.52%
La Crosse 168 198 0.62%
Lafayette 31 36 0.11%
29
Table 3. Exterior Zone goose harvest by county (continued on next page).
County Reported Kill
Expanded Kill Percent
Langlade 149 175 0.55%
Lincoln 231 272 0.85%
Manitowoc 943 1,109 3.49%
Marathon 786 924 2.90%
Marinette 373 439 1.38%
Marquette 317 373 1.17%
Menominee 1 1 0.00%
Milwaukee 23 27 0.09%
Monroe 105 123 0.39%
Oconto 441 519 1.63%
Oneida 119 140 0.44%
Outagamie 1124 1,322 4.15%
Ozaukee 314 369 1.16%
Pepin 18 21 0.07%
Pierce 109 128 0.40%
Polk 1017 1,196 3.76%
Portage 518 609 1.91%
Price 138 162 0.51%
Racine 626 736 2.31%
Richland 57 67 0.21%
Rock 564 663 2.08%
Rusk 302 355 1.12%
Sauk 169 199 0.62%
Sawyer 223 262 0.82%
Shawano 375 441 1.39%
Sheboygan 687 808 2.54%
St. Croix 614 722 2.27%
Taylor 367 432 1.36%
Trempealeau 155 182 0.57%
Vernon 3 4 0.01%
Vilas 117 138 0.43%
Walworth 33 39 0.12%
Washburn 554 652 2.05%
Washington 296 348 1.09%
Waukesha 535 629 1.98%
Waupaca 1074 1,263 3.97%
Waushara 697 820 2.58%
Winnebago 244 287 0.90%
Wood 852 1,002 3.15%
Total 27,058 31,820
30
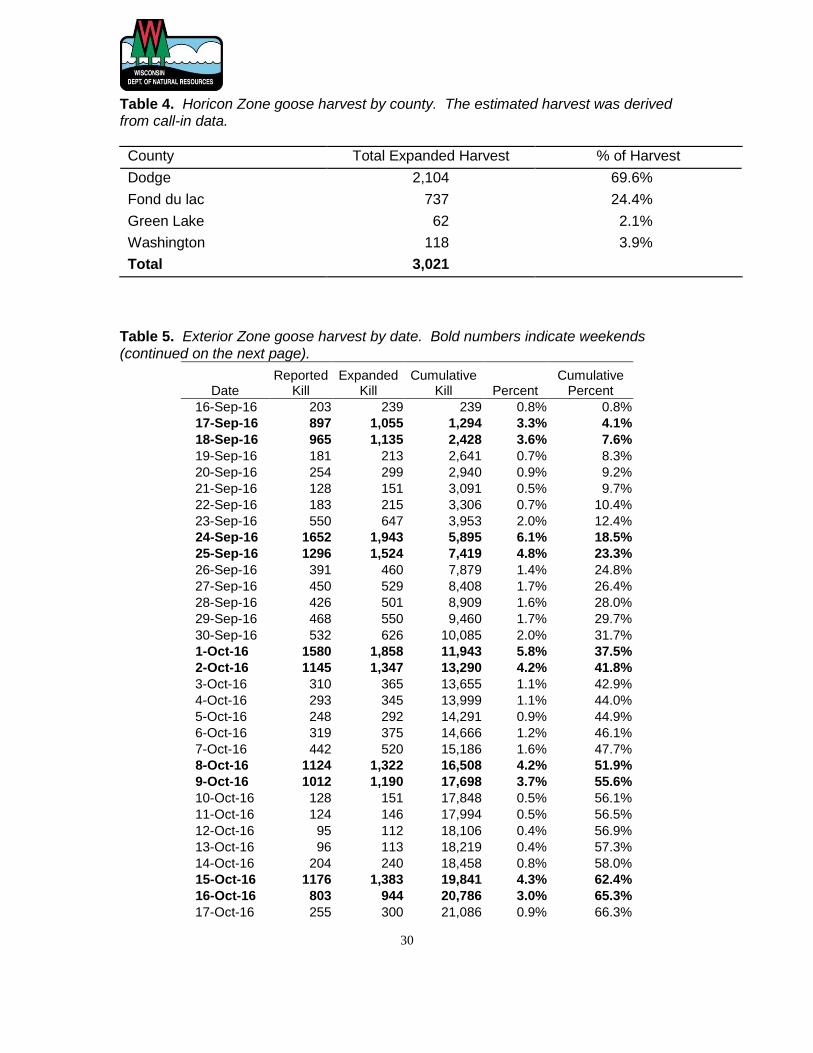
Table 4. Horicon Zone goose harvest by county. The estimated harvest was derived from call-in data.
County Total Expanded Harvest % of Harvest
Dodge 2,104 69.6%
Fond du lac 737 24.4%
Green Lake 62 2.1%
Washington 118 3.9%
Total 3,021
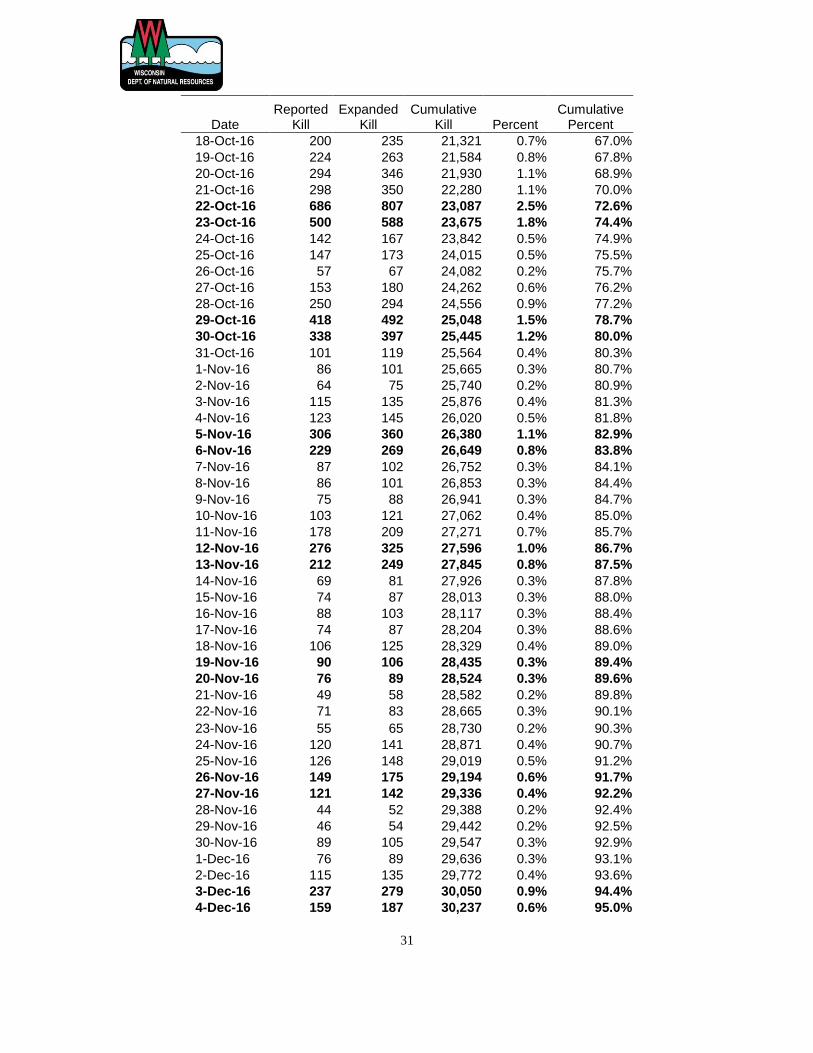
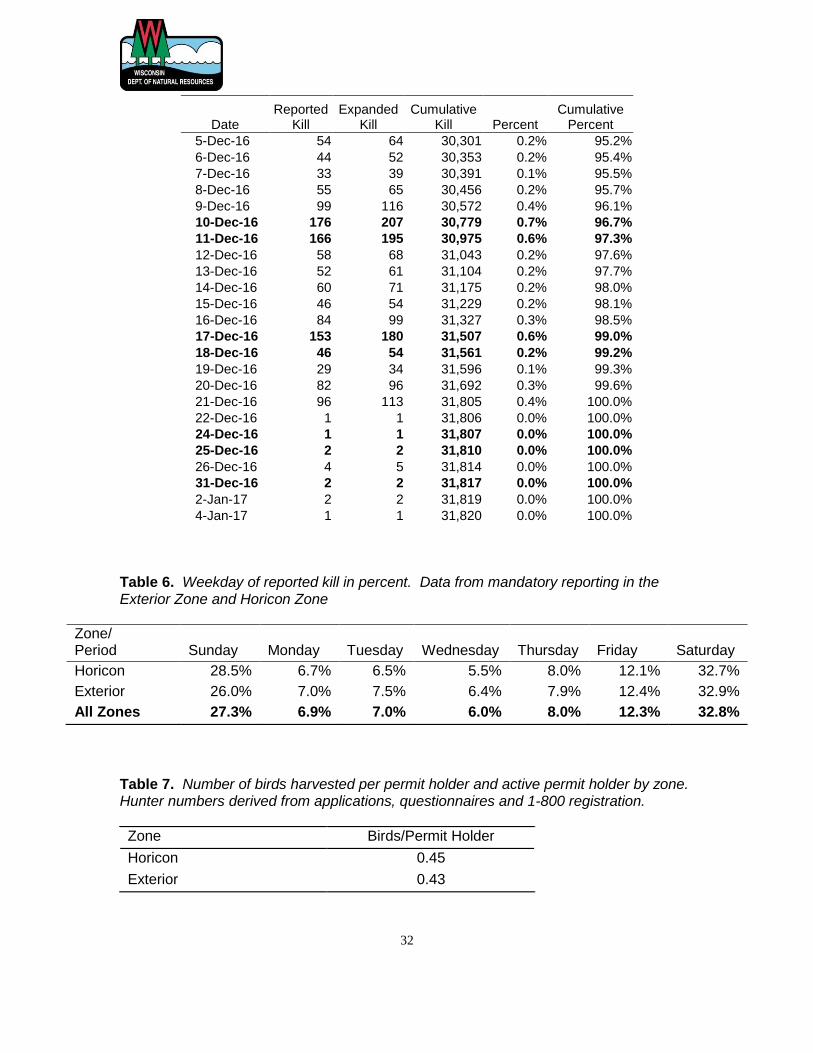
Table 5. Exterior Zone goose harvest by date. Bold numbers indicate weekends (continued on the next page).
Date Reported
Kill Expanded
Kill Cumulative
Kill Percent Cumulative
Percent
16-Sep-16 203 239 239 0.8% 0.8%
17-Sep-16 897 1,055 1,294 3.3% 4.1%
18-Sep-16 965 1,135 2,428 3.6% 7.6%
19-Sep-16 181 213 2,641 0.7% 8.3%
20-Sep-16 254 299 2,940 0.9% 9.2%
21-Sep-16 128 151 3,091 0.5% 9.7%
22-Sep-16 183 215 3,306 0.7% 10.4%
23-Sep-16 550 647 3,953 2.0% 12.4%
24-Sep-16 1652 1,943 5,895 6.1% 18.5%
25-Sep-16 1296 1,524 7,419 4.8% 23.3%
26-Sep-16 391 460 7,879 1.4% 24.8%
27-Sep-16 450 529 8,408 1.7% 26.4%
28-Sep-16 426 501 8,909 1.6% 28.0%
29-Sep-16 468 550 9,460 1.7% 29.7%
30-Sep-16 532 626 10,085 2.0% 31.7%
1-Oct-16 1580 1,858 11,943 5.8% 37.5%
2-Oct-16 1145 1,347 13,290 4.2% 41.8%
3-Oct-16 310 365 13,655 1.1% 42.9%
4-Oct-16 293 345 13,999 1.1% 44.0%
5-Oct-16 248 292 14,291 0.9% 44.9%
6-Oct-16 319 375 14,666 1.2% 46.1%
7-Oct-16 442 520 15,186 1.6% 47.7%
8-Oct-16 1124 1,322 16,508 4.2% 51.9%
9-Oct-16 1012 1,190 17,698 3.7% 55.6%
10-Oct-16 128 151 17,848 0.5% 56.1%
11-Oct-16 124 146 17,994 0.5% 56.5%
12-Oct-16 95 112 18,106 0.4% 56.9%
13-Oct-16 96 113 18,219 0.4% 57.3%
14-Oct-16 204 240 18,458 0.8% 58.0%
15-Oct-16 1176 1,383 19,841 4.3% 62.4%
16-Oct-16 803 944 20,786 3.0% 65.3%
17-Oct-16 255 300 21,086 0.9% 66.3%
31
Date Reported
Kill Expanded
Kill Cumulative
Kill Percent Cumulative
Percent
18-Oct-16 200 235 21,321 0.7% 67.0%
19-Oct-16 224 263 21,584 0.8% 67.8%
20-Oct-16 294 346 21,930 1.1% 68.9%
21-Oct-16 298 350 22,280 1.1% 70.0%
22-Oct-16 686 807 23,087 2.5% 72.6%
23-Oct-16 500 588 23,675 1.8% 74.4%
24-Oct-16 142 167 23,842 0.5% 74.9%
25-Oct-16 147 173 24,015 0.5% 75.5%
26-Oct-16 57 67 24,082 0.2% 75.7%
27-Oct-16 153 180 24,262 0.6% 76.2%
28-Oct-16 250 294 24,556 0.9% 77.2%
29-Oct-16 418 492 25,048 1.5% 78.7%
30-Oct-16 338 397 25,445 1.2% 80.0%
31-Oct-16 101 119 25,564 0.4% 80.3%
1-Nov-16 86 101 25,665 0.3% 80.7%
2-Nov-16 64 75 25,740 0.2% 80.9%
3-Nov-16 115 135 25,876 0.4% 81.3%
4-Nov-16 123 145 26,020 0.5% 81.8%
5-Nov-16 306 360 26,380 1.1% 82.9%
6-Nov-16 229 269 26,649 0.8% 83.8%
7-Nov-16 87 102 26,752 0.3% 84.1%
8-Nov-16 86 101 26,853 0.3% 84.4%
9-Nov-16 75 88 26,941 0.3% 84.7%
10-Nov-16 103 121 27,062 0.4% 85.0%
11-Nov-16 178 209 27,271 0.7% 85.7%
12-Nov-16 276 325 27,596 1.0% 86.7%
13-Nov-16 212 249 27,845 0.8% 87.5%
14-Nov-16 69 81 27,926 0.3% 87.8%
15-Nov-16 74 87 28,013 0.3% 88.0%
16-Nov-16 88 103 28,117 0.3% 88.4%
17-Nov-16 74 87 28,204 0.3% 88.6%
18-Nov-16 106 125 28,329 0.4% 89.0%
19-Nov-16 90 106 28,435 0.3% 89.4%
20-Nov-16 76 89 28,524 0.3% 89.6%
21-Nov-16 49 58 28,582 0.2% 89.8%
22-Nov-16 71 83 28,665 0.3% 90.1%
23-Nov-16 55 65 28,730 0.2% 90.3%
24-Nov-16 120 141 28,871 0.4% 90.7%
25-Nov-16 126 148 29,019 0.5% 91.2%
26-Nov-16 149 175 29,194 0.6% 91.7%
27-Nov-16 121 142 29,336 0.4% 92.2%
28-Nov-16 44 52 29,388 0.2% 92.4%
29-Nov-16 46 54 29,442 0.2% 92.5%
30-Nov-16 89 105 29,547 0.3% 92.9%
1-Dec-16 76 89 29,636 0.3% 93.1%
2-Dec-16 115 135 29,772 0.4% 93.6%
3-Dec-16 237 279 30,050 0.9% 94.4%
4-Dec-16 159 187 30,237 0.6% 95.0%
32
Date Reported
Kill Expanded
Kill Cumulative
Kill Percent Cumulative
Percent
5-Dec-16 54 64 30,301 0.2% 95.2%
6-Dec-16 44 52 30,353 0.2% 95.4%
7-Dec-16 33 39 30,391 0.1% 95.5%
8-Dec-16 55 65 30,456 0.2% 95.7%
9-Dec-16 99 116 30,572 0.4% 96.1%
10-Dec-16 176 207 30,779 0.7% 96.7%
11-Dec-16 166 195 30,975 0.6% 97.3%
12-Dec-16 58 68 31,043 0.2% 97.6%
13-Dec-16 52 61 31,104 0.2% 97.7%
14-Dec-16 60 71 31,175 0.2% 98.0%
15-Dec-16 46 54 31,229 0.2% 98.1%
16-Dec-16 84 99 31,327 0.3% 98.5%
17-Dec-16 153 180 31,507 0.6% 99.0%
18-Dec-16 46 54 31,561 0.2% 99.2%
19-Dec-16 29 34 31,596 0.1% 99.3%
20-Dec-16 82 96 31,692 0.3% 99.6%
21-Dec-16 96 113 31,805 0.4% 100.0%
22-Dec-16 1 1 31,806 0.0% 100.0%
24-Dec-16 1 1 31,807 0.0% 100.0%
25-Dec-16 2 2 31,810 0.0% 100.0%
26-Dec-16 4 5 31,814 0.0% 100.0%
31-Dec-16 2 2 31,817 0.0% 100.0%
2-Jan-17 2 2 31,819 0.0% 100.0%
4-Jan-17 1 1 31,820 0.0% 100.0%
Table 6. Weekday of reported kill in percent. Data from mandatory reporting in the Exterior Zone and Horicon Zone
Zone/ Period Sunday Monday Tuesday Wednesday Thursday Friday Saturday
Horicon 28.5% 6.7% 6.5% 5.5% 8.0% 12.1% 32.7%
Exterior 26.0% 7.0% 7.5% 6.4% 7.9% 12.4% 32.9%
All Zones 27.3% 6.9% 7.0% 6.0% 8.0% 12.3% 32.8%
Table 7. Number of birds harvested per permit holder and active permit holder by zone. Hunter numbers derived from applications, questionnaires and 1-800 registration.
Zone Birds/Permit Holder
Horicon 0.45
Exterior 0.43
33
Table 8. Percent of successful bags containing 1 or 2 geese.
Zone Percent of 1
Kill Bags Percent of 2
Kill Bags
Horicon 42.9% 57.1%
Table 9. Exterior Zone season bag derived from mandatory reporting data.
Bag # of Hunters Percent
0 67,020 89.8% 1 2,009 2.7% 2 2,525 3.4% 3 684 0.9% 4 884 1.2% 5 293 0.4% 6 371 0.5% 7 148 0.2% 8 153 0.2% 9 79 0.1%
10 92 0.1% 11 43 0.1% 12 43 0.1% 13 33 0.0% 14 45 0.1% 15 24 0.0% 16 27 0.0% 17 13 0.0% 18 24 0.0% 19 10 0.0% 20 12 0.0% 21 11 0.0% 22 10 0.0% 23 6 0.0% 24 9 0.0% 25 4 0.0% 26 5 0.0% 27 8 0.0% 28 4 0.0% 29 4 0.0% 30 2 0.0% 31 1 0.0% 32 3 0.0% 33 2 0.0% 35 1 0.0% 36 1 0.0% 37 1 0.0% 39 2 0.0%
34
40 2 0.0% 42 1 0.0% 47 2 0.0% 49 1 0.0% 50 1 0.0% 52 1 0.0% 55 1 0.0% 61 1 0.0% 63 1 0.0% 66 1 0.0% 79 1 0.0% 82 1 0.0%
Table 10. Number applicants, active hunters, and birds harvested during the September early Canada goose season.
Year # of Applicants # of Active Hunters Harvest 1990 19,561 6,408 842 1991 4,772 1,983 712 1992 5,383 2,024 772 1993 2,982 1,636 679 1994 20,724 7,114 1,668 1995 13,343 7,923 4,928 1996 21,378 8,979 10,506 1997 28,761 7,435 1998 29,580 7,627 1999 73,799 6,032 2000 69,716 11,192 2001 74,268 15,952 2002 75,565 11,687 2003 76,728 8,650 2004 76,294 14,007 2005 74,437 13,410 2006 68,152 20,034 2007 66,207 21,760 2008 63,904 24,276 2009 60,567 15,342 2010 55,927 19,900 2011 52,906 18,746 2012 53,596 21,302 2013 55,657 19,407 2014 59,017 21,732
732 2015 57,009 15,749 2016 57,412 16,880
35
Table 11. Early September Canada goose harvest by date (bold numbers indicate weekends).
Date of Harvest
Reported Kill
Expanded Kill
Cumulative Kill Percent
Cumulative Percent
1-Sep-16 2622 3,120 3,120 18.5% 18.5%
2-Sep-16 1303 1,551 4,671 9.2% 27.7%
3-Sep-16 1621 1,929 6,600 11.4% 39.1%
4-Sep-16 1007 1,198 7,798 7.1% 46.2%
5-Sep-16 911 1,084 8,882 6.4% 52.6%
6-Sep-16 192 228 9,111 1.4% 54.0%
7-Sep-16 174 207 9,318 1.2% 55.2%
8-Sep-16 448 533 9,851 3.2% 58.4%
9-Sep-16 457 544 10,395 3.2% 61.6%
10-Sep-16 1412 1,680 12,075 10.0% 71.5%
11-Sep-16 1625 1,934 14,009 11.5% 83.0%
12-Sep-16 389 463 14,472 2.7% 85.7%
13-Sep-16 548 652 15,124 3.9% 89.6%
14-Sep-16 744 885 16,009 5.2% 94.8%
15-Sep-16 732 871 16,880 5.2% 100.0%
14,185 16,880
Table 12. Early September Canada goose harvest by county, 2016.
County Reported
Kill Expanded
Kill Percent
Adams 100 119 0.70%
Ashland 163 194 1.15%
Barron 422 502 2.98%
Bayfield 76 90 0.54%
Brown 400 476 2.82%
Buffalo 232 276 1.64%
Burnett 154 183 1.09%
Calumet 222 264 1.57%
Chippewa 365 434 2.57%
Clark 265 315 1.87%
Columbia 239 284 1.68%
Crawford 58 69 0.41%
Dane 288 343 2.03%
Dodge 367 437 2.59%
Door 326 388 2.30%
Douglas 49 58 0.35%
Dunn 90 107 0.63%
Eau Claire 63 75 0.44%
Florence 13 15 0.09%
36
County Reported
Kill Expanded
Kill Percent
Fond Du Lac 234 278 1.65%
Forest 37 44 0.26%
Grant 114 136 0.80%
Green 153 182 1.08%
Green Lake 72 86 0.51%
Iowa 60 71 0.42%
Iron 55 65 0.39%
Jackson 19 23 0.13%
Jefferson 313 372 2.21%
Juneau 50 60 0.35%
Kenosha 216 257 1.52%
Kewaunee 312 371 2.20%
La Crosse 170 202 1.20%
Lafayette 34 40 0.24%
Langlade 95 113 0.67%
Lincoln 127 151 0.90%
Manitowoc 472 562 3.33%
Marathon 599 713 4.22%
Marinette 93 111 0.66%
Marquette 96 114 0.68%
Milwaukee 5 6 0.04%
Monroe 102 121 0.72%
Oconto 226 269 1.59%
Oneida 137 163 0.97%
Outagamie 340 405 2.40%
Ozaukee 132 157 0.93%
Pepin 48 57 0.34%
Pierce 32 38 0.23%
Polk 774 921 5.46%
Portage 301 358 2.12%
Price 137 163 0.97%
Racine 298 355 2.10%
Richland 58 69 0.41%
Rock 189 225 1.33%
Rusk 152 181 1.07%
Sauk 104 124 0.73%
Sawyer 130 155 0.92%
Shawano 151 180 1.06%
Sheboygan 245 292 1.73%
St. Croix 413 491 2.91%
37
County Reported
Kill Expanded
Kill Percent
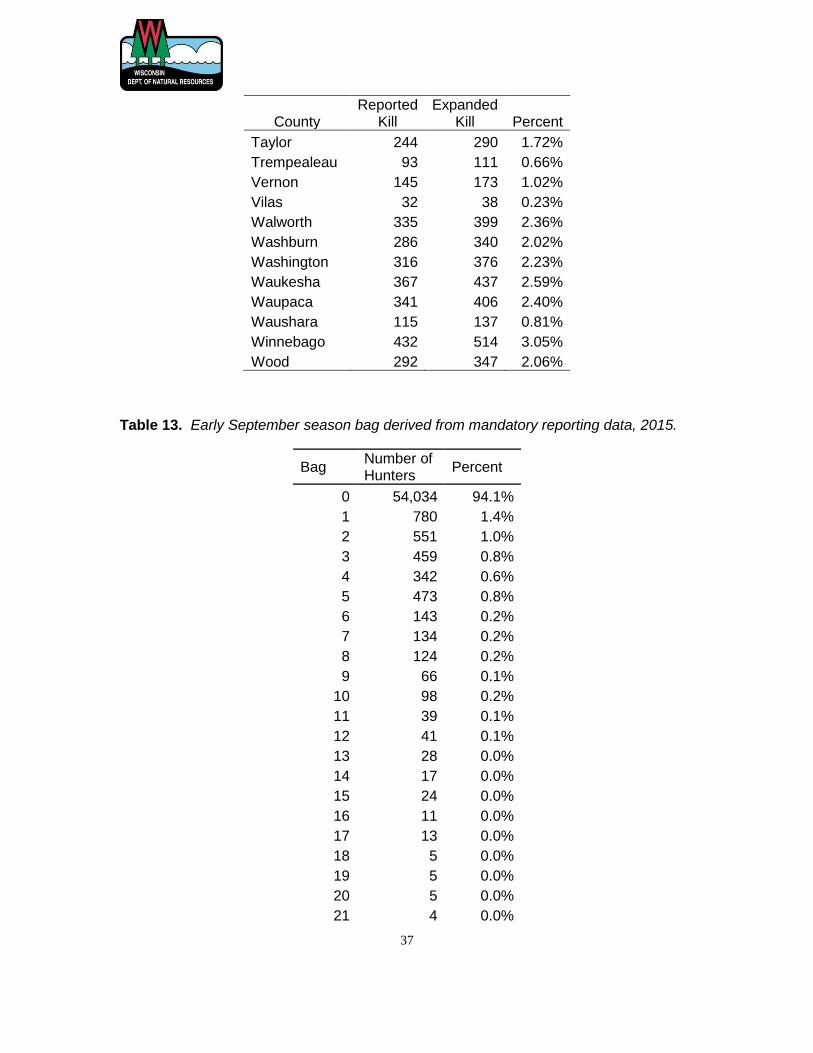
Taylor 244 290 1.72%
Trempealeau 93 111 0.66%
Vernon 145 173 1.02%
Vilas 32 38 0.23%
Walworth 335 399 2.36%
Washburn 286 340 2.02%
Washington 316 376 2.23%
Waukesha 367 437 2.59%
Waupaca 341 406 2.40%
Waushara 115 137 0.81%
Winnebago 432 514 3.05%
Wood 292 347 2.06%
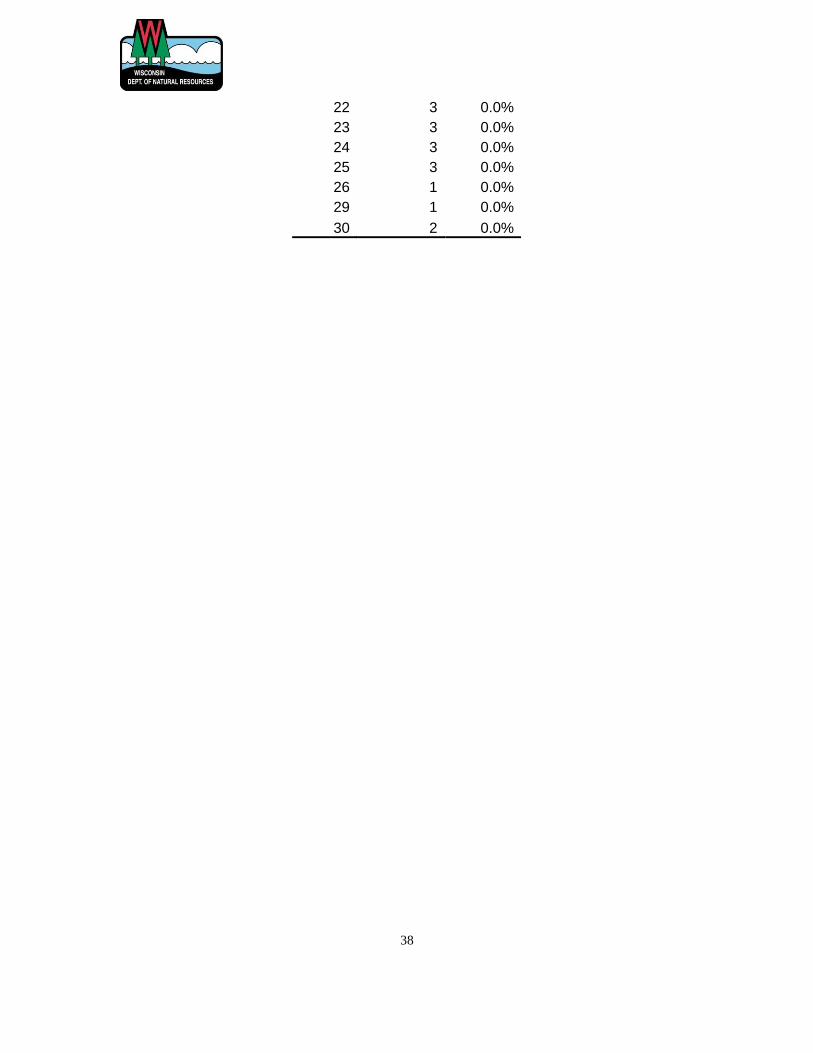
Table 13. Early September season bag derived from mandatory reporting data, 2015.
Bag Number of Hunters
Percent
0 54,034 94.1%
1 780 1.4%
2 551 1.0%
3 459 0.8%
4 342 0.6%
5 473 0.8%
6 143 0.2%
7 134 0.2%
8 124 0.2%
9 66 0.1%
10 98 0.2%
11 39 0.1%
12 41 0.1%
13 28 0.0%
14 17 0.0%
15 24 0.0%
16 11 0.0%
17 13 0.0%
18 5 0.0%
19 5 0.0%
20 5 0.0%
21 4 0.0%
38
22 3 0.0%
23 3 0.0%
24 3 0.0%
25 3 0.0%
26 1 0.0%
29 1 0.0%
30 2 0.0%
39
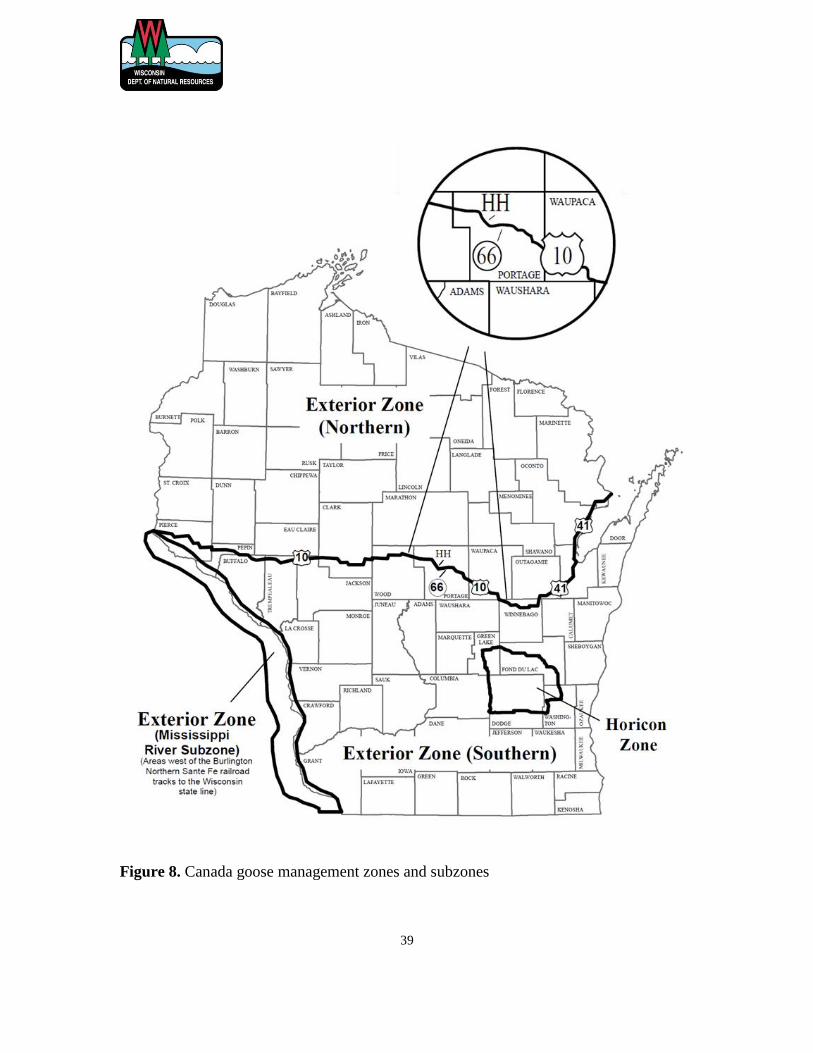
Figure 8. Canada goose management zones and subzones
40
The Wisconsin Department of Natural Resources provides equal opportunity in its employment, programs,
services, and functions under an Affirmative Action Plan. If you have any questions, please write to Equal
Opportunity Office, Department of Interior, Washington, D.C. 20240.
This publication can be made available in alternative formats (large print, Braille, audio tape, etc.) upon
request. Please call (608)266-8204 for more information.
WM-432