2016 Top Markets Report Renewable Energy · PDF file2016 Top Markets Report ... clean,...
67
2016 Top Markets Report Renewable Energy A Market Assessment Tool for U.S. Exporters U.S. Department of Commerce | International Trade Administration | Industry & Analysis (I&A) April 2016
Transcript of 2016 Top Markets Report Renewable Energy · PDF file2016 Top Markets Report ... clean,...
2016 Top Markets ReportRenewable Energy
A Market Assessment Tool for U.S. Exporters
U.S. Department of Commerce | International Trade Administration | Industry & Analysis (I&A)
April 2016

Industry & Analysis’ (I&A) staff of industry, trade and economic analysts devise and implement international trade, investment, and export promotion strategies that strengthen the global competitiveness of U.S. industries. These initiatives unlock export, and investment opportunities for U.S. businesses by combining in-depth quantitative and qualitative analysis with ITA’s industry relationships. For more information, visit www.trade.gov/industry
I&A is part of the International Trade Administration, whose mission is to create prosperity by strengthening the competitiveness of U.S. industry, promoting trade and investment, and ensuring fair trade and compliance with trade laws and agreements.
Cora Dickson served as the lead author of this report. A special note of thanks goes to Lilian Lee, Kyle Deming, Evan Fowler, and Drew Bennett, whose thoughtful gathering of market intelligence and trade data facilitated the completion of the study. In addition, critical insights on all the markets mentioned in the report were provided by in-country Commercial Service energy sector specialists. This report serves as an update to the 2015 report.

2016 ITA Renewable Energy Top Markets Report | 1
Table of Contents
Executive Summary ............................................................................................................................... 3
Overview and Key Findings ................................................................................................................ 5
Sector Snapshots
Geothermal Energy ............................................................................................................................. 13 Hydropower ........................................................................................................................................... 15 Solar Energy ........................................................................................................................................... 17 Wind Energy ......................................................................................................................................... 19
Country Case Studies
Brazil ......................................................................................................................................................... 23 Canada ...................................................................................................................................................... 27 Chile .......................................................................................................................................................... 31 China ......................................................................................................................................................... 35 India .......................................................................................................................................................... 39 Japan ......................................................................................................................................................... 43 Mexico ...................................................................................................................................................... 47 South Africa ............................................................................................................................................ 51
Addendum: Resources for U.S. Exporters ................................................................................... 55
Appendices
Appendix 1: Full Rankings................................................................................................................ 57 Appendix 2: Subsector Rankings ................................................................................................... 58 Appendix 3: Citations ......................................................................................................................... 62

2016 ITA Renewable Energy Top Markets Report | 2
This Page Intentionally Left Blank

2016 ITA Renewable Energy Top Markets Report | 3
Executive Summary The renewable energy industry remains one of the most vibrant, fast-changing, and transformative sectors of the global economy. Technology improvements, cost declines, and the catalytic influence of new financing structures, have turned the sector into a driver of economic growth – both in the United States and around the world. Global clean energy investment, including renewable energy, totaled more than $329 billion in 2015. Because the cost of most renewable energy technologies continued its downward trend, the world’s investment supported an unprecedented deployment of new renewable energy projects despite the availability of extremely cheap fossil fuels. There is a growing global consensus that the world must deal with the threat of climate change in part through the deployment of clean energy technologies. The conclusion of the international climate agreement in Paris in December 2015 has provided new momentum for countries to promote policy incentives for clean energy development, which should drive investment in almost all markets. However, despite the widespread desire to deploy clean energy, most countries’ tendency to cheaply import fossil fuels pulls them in the opposite direction. Governments around the world must decide whether to incentivize a clean, sustainable growth path or whether to allow investments in traditional energy sources to continue or even increase. The choices they make will govern the industry through both the short and medium-term. This Top Markets Report provides analysis on key trends, areas of opportunity, and important challenges that exporters need to know in order to compete effectively in foreign markets. It offers projections for potential exports in the 2016-2017 time frame, as well as eight country case studies from a variety of geographic regions (Brazil, Canada, Chile, China, India, Mexico, Japan, and South Africa) with more in-depth information. The report, which builds on earlier versions published in 2014 and 2015, includes rankings of 74 different markets, as well as subsector-specific projections. This report provides useful context in which to view export opportunities in a changing world, offering commentary on how exporters can best leverage the trade policy and export promotion tools offered by the U.S. Government. The report is meant to provide context to global markets over the near-term, helping exporters compare international opportunities. According to ITA’s projections, the 74 markets included in this report will install over 250 GW of new renewable energy capacity through 2017. To help meet this demand, the global import market in this sector is expected to reach $195 billion cumulatively in the 2016-2017 timeframe. Based on the estimates in this report, China is expected to account for more than 40 percent of all capacity installations outside the United States over the next two years. Its renewable energy investment is expected to be split relatively evenly between solar, wind, and hydropower through 2017. Other key developers of new capacity will be Japan, India, Brazil, Turkey, and the European Union (particularly, Germany and the United Kingdom). Export markets with the strongest potential, in the top level of the rankings, tended to have substantial opportunities across multiple subsectors (e.g., Canada, India, Mexico, Brazil, China, Chile, and Turkey). However a few markets had overwhelmingly strong prospects in particular subsectors, due to unique driving factors such as the popularity of solar in Japan and France, the coordinated exploitation of geothermal resources in Kenya, and abundance of wind farm projects in Uruguay. Of the markets that exhibited a jump in their overall rankings compared to last year, the most notable were India, France, and Vietnam. One of the biggest disappointments in last year’s projection was Saudi Arabia, where ambitious plans for solar development are in limbo for the near term while the focus turns to natural gas for its clean energy needs. Within the sector rankings, in addition to the aforementioned special cases, other noteworthy changes included:
2016 ITA Renewable Energy Top Markets Report | 4
• the emergence of India as an attractive market for solar as its new deployment goals far exceed its own
manufacturing capacity; • the downgrading of potential wind exports to China and hydro exports to Chile, reflecting the shrinking
U.S. market shares; and • the strengthening of Mexico as a serious contender in the geothermal sector, creating new project
opportunities for U.S. suppliers. The renewable energy sector is so reliant on policy that any policy changes – either positive or negative—will have an almost immediate impact on a market’s attractiveness. As a result, the rankings provided in this report could change substantially as new policies are announced. Political upheaval could also have an unforeseen negative impact in an otherwise promising export market. However, despite the significant changes in policy environments in the past year, only six countries dropped out of the top 30 rankings compared to last year, which indicates a stable yet growing industry. Since 2014, the Renewable Energy Top Markets Report framework has emphasized market size (a country’s imports) and market share (percentage of imports from the United States) in considering renewable energy export opportunities. ITA continues to encourage exporters to develop market entry and market expansion strategies based on these two variables. Unfortunately, U.S. exporters are relatively ill-positioned to benefit from rising demand globally. According to ITA’s projections, exporters will capture just 5.6 percent of the global import market through 2017. Although this is an improvement over last year’s projection of 3.2 percent, there are missed opportunities in certain key markets where renewable energy is growing rapidly enough to support substantial imports. In Japan, for example, where imports could account for two-thirds of all solar products deployed in the market, U.S. exporters are expected to capture just 2.6 percent. The United States does – and should continue to – capture a significant piece of the import market in the Western Hemisphere. U.S. exports benefit from geographic proximity as well as a longstanding reputation for reliable, innovative products. In fact, the share of the import market captured by U.S. exporters in the region (North America, Central America, and South America) during this period will reach nearly 13 percent. Exports of renewable energy products to the Caribbean were not measurable in this report. While opportunities can be found in most markets, the destination of U.S. renewable energy exports will continue to be highly concentrated. The top 4 export markets are expected to account for 50 percent of all exports in the sector through 2016, while the top 10 markets should support over three-quarters of all exports. In addition to understanding the competitiveness landscape facing exporters in different markets, exporters should also appreciate the other market dynamics facing the sector. For example, the impact of low fossil fuel prices will cascade across the renewable energy sector – both in the United States and around the world. Put simply, reaching “grid parity” – long the dream of the clean energy industry – will be harder to achieve given lower coal and natural gas prices. And in markets that use imported oil to power diesel generators, distributed renewables may seem less attractive. However, unlike the period around 2009, when low energy prices undermined global renewable energy investment, the fall in clean energy costs over the past few years should help the industry remain competitive. In fact, renewable energy is already cost competitive in some markets where policy-makers have implemented effective policies. One example is reverse power auctions, which are increasingly being used by governments allocating power purchasing agreements for a certain capacity of renewable energy. The auction process tends to encourage developers to propose the lowest price per unit of electricity. For technology suppliers, the reverse auction system provides a long pipeline of planned and approved projects.

2016 ITA Renewable Energy Top Markets Report | 5
Overview and Key Findings Introduction The renewable energy industry remains one of the most vibrant, fast-changing, and transformative sectors of the global economy. Technology improvements, cost declines, and the catalytic influence of new financing structures, have turned the sector into a driver of economic growth – both in the United States and around the world. The renewable energy sector faces many competing dynamics at once – the outcome of which will alter the policy landscape, and thus the investment landscape, for years to come. First and foremost, there is a growing global consensus that the world must deal with the threat of climate change in part through the deployment of clean energy technologies. The conclusion of the international climate agreement in Paris in December 2015 has provided new momentum for countries to promote policy incentives for clean energy development, which should drive investment in almost all markets. As the most tangible evidence of commitment under the agreement, countries have agreed to publicly outline their post-2020 climate actions, known as their Intended Nationally Determined Contributions (INDCs). Although not all the INDCs reflected new policy commitments since the publication of the last Top Markets Report, the International Energy Agency predicts that the full implementation of these pledges will require $13.5 trillion in clean energy and energy efficiency technology deployment investments over the next 15 years.1 The agreement also included a collective goal of keeping temperature rise to well below 2 degrees Celsius – something that cannot be met by only delivering on the initial INDCs pledges. Nevertheless,
the INDCs point the way to future opportunities for the sector. Furthermore, countries will also submit new INDCs on a regular, five-year cycle to take stock of progress and set new, stronger goals to reduce climate pollution. However, despite the widespread desire to deploy clean energy, most countries’ tendency to cheaply import fossil fuels pulls them in the opposite direction. Governments around the world must decide whether to incentivize a clean, sustainable growth path or whether to allow investments in traditional energy sources to continue or even increase. The choices they make will govern the industry through both the short and medium-term. For example, in the United States renewable energy manufacturing and deployment are getting a timely boost from the multiple-year extensions of the Business Energy Investment Tax Credit (ITC) and the Renewable Electricity Production Tax Credit (PTC), another development that came late in 2015. Building a stronger domestic market through the ITC and PTC will contribute to the international competitiveness of U.S. renewable energy solutions. This Top Markets Report provides analysis on key trends, areas of opportunity, and important challenges that exporters need to know in order to compete effectively in foreign markets. It offers projections for potential exports in the 2016-2017 time frame, as well as eight country case studies with more in-depth information. The report, which builds on earlier versions published in 2014 and 2015, includes rankings of 74 different markets (see Appendix 1), as well as subsector-specific projections (see Appendix 2). Our analysis of biofuels
Figure 1: Projected Top Markets for Renewable Energy Exports (2016-2017) 1 Canada 7 Chile 13 South Africa 19 Germany 25 Peru 2 Japan 8 China 14 Venezuela 20 South Korea 26 Honduras 3 India 9 France 15 Nicaragua 21 Ecuador 27 Argentina 4 Kenya 10 Turkey 16 El Salvador 22 Guatemala 28 Vietnam 5 Mexico 11 Indonesia 17 Philippines 23 Egypt 29 Panama 6 Brazil 12 Uruguay 18 United Kingdom 24 Russia 30 Thailand

2016 ITA Renewable Energy Top Markets Report | 6
and biomass wood pellet exports is covered separately in the Renewable Fuels Top Markets Report, and the growing industry related to energy efficient electricity transmission is covered in the Smart Grid Top Markets Report. This report provides useful context in which to view export opportunities in a changing world, offering commentary on how exporters can best leverage the trade policy and export promotion tools offered by the U.S. Government. The report is meant to provide context to global markets over the near-term, helping exporters compare international opportunities. Companies should note that ITA’s rankings are based on our current understanding of the market, which – given the pace of change in the sector globally – can be subject to unexpected twists and turns. Key Findings: Top Markets and Methodology Top Markets, 2016-2017 Export markets with the strongest potential, in the top level of the rankings, tended to have substantial opportunities across multiple subsectors (e.g., Canada, India, Mexico, Brazil, China, Chile, and Turkey). However a few markets had overwhelmingly strong prospects in particular subsectors, due to unique driving factors such as the popularity of solar in Japan and France, the coordinated exploitation of geothermal resources in Kenya, and abundance of wind farm projects in Uruguay. Of the markets that exhibited a jump in their overall rankings compared to last year, the most notable were India, France, and Vietnam. One of the biggest disappointments in last year’s projection was Saudi Arabia, where ambitious plans for solar development are in limbo for the near term while the focus turns to natural gas for its clean energy needs. Developing countries in Africa, particularly in the Sub-Saharan, remain challenging export markets. This is partly due to the lack of strong nationwide infrastructure, which limits the integration of renewable energy technologies
to the grid; but also exporters face the reality of stiff competition from Chinese and European suppliers. Within the sector rankings, in addition to the aforementioned special cases, other noteworthy changes included:
• the emergence of India as an attractive market for solar as its new deployment goals far exceed its own manufacturing capacity;
• the downgrading of potential wind exports to China and hydro exports to Chile, reflecting the shrinking U.S. market shares; and
• the strengthening of Mexico as a serious contender in the geothermal sector, creating new project opportunities for U.S. suppliers.
The renewable energy sector is so reliant on policy that any policy changes – either positive or negative—will have an almost immediate impact on a market’s attractiveness. As a result, the rankings provided in this report could change substantially as new policies are announced. Political upheaval could also have an unforeseen negative impact in an otherwise promising export market. However, despite the significant changes in policy environments in the past year, only six countries dropped out of the top 30 rankings compared to last year, which indicates a stable yet growing industry. Methodology ITA rankings are based on the projected value of U.S. exports in the 2016-2017 timeframe. The basic formula is summarized in Figure 2. For each market, we estimated the projected capacity installations for each technology through 2017 using projections from Bloomberg New Energy Finance and Business Monitor International, as well as several sector-specific sources. In the case of geothermal power, longer project time tables were taken into consideration. We then estimated the value associated with each market’s expected capacity growth by multiplying its
Figure 2: Methodology for Ranking Markets
(MW) ($) (percent) (percent) ($)
Capacity Growth
Technology Cost
Market to be met by Imports
Projected U.S. Market Share
Projected U.S. Exports

2016 ITA Renewable Energy Top Markets Report | 7
capacity growth projected by the cost of each technology. Where possible, ITA used country-specific and regional CAPEX estimates for the cost of technology, relying upon the Bloomberg New Energy Finance analysis of levelized cost of energy. The proportion and value of each market likely to be met by imports, as well as the percentage of imports expected to come from the United States, were derived from historical trade data while taking into consideration the existing domestic manufacturing capacity. In doing so, we were able to calculate a projected export market for each country and each subsector within countries, allowing markets to be compared against each other. It is important to note that the Renewable Energy Top Markets Report only includes an analysis of product exports. Service exports, which may provide an even greater opportunity than the export of products, are not included in the rankings. Global trade in products is easier to track using harmonized tariff system codes. However, based on work undertaken by the U.S. International Trade Commission,2 ITA believes that service exports are highly correlated with the export of renewable energy equipment. As such, the rankings featured in this analysis should provide policy-makers an adequate assessment of service export opportunities despite their exclusion from the methodology. Moreover, this analysis does not include an assessment of regional opportunities, although regional estimates are possible based on the methodology. In some markets, like Central America or the European Union, exporters can consider opportunities based on regional energy policies or transmission infrastructure. Thus while individual markets may rank low, opportunities when paired with other regional projects may be considerably larger. Market Size vs. Market Share Since 2014, the Renewable Energy Top Markets Report framework has emphasized market size and market share in considering renewable energy export opportunities. ITA continues to encourage exporters to develop market entry and market expansion strategies based on these two variables. Therefore, the case studies and industry snapshots in the report reference each market in terms of their import market size and the share of their import market expected to be captured by U.S. exporters.
If a market is large and U.S. exporters are likely to capture a significant market share, efforts should focus on making as many connections as possible. Exporters can feel good about their prospects, but may find other American competitors also having success in the market. Participation in trade missions, reverse trade missions, trade shows, and other “traditional” export promotion activities is encouraged in these markets. Canada is a prime example. Though it is expected to import about one-third as much as China over the next two years from the world, it ranks number one on ITA’s list of projected export markets through 2017, because of the significant market share enjoyed by U.S. suppliers (25.8 percent). In markets that are large, but in which the United States captures only a tiny fraction of the import market, exporters should consider the reasons for the lack of U.S. competitiveness before pursuing export opportunities – particularly opportunities that include long lead times or require considerable resources. Perhaps importers are demanding products that are not often sold competitively by U.S. exporters, in which case a niche product might play well in the market. However, in certain markets, where U.S. market share is low because of a specific trade barrier, then exporters may want to prioritize other markets and alert U.S. Government entities, so that appropriate action can be taken to remove that barrier. In markets that are small, but where U.S. exporters capture a large market share, exporters may find significant demand for their products and services – but accompanied by a small market or restrictive investment climate that stifles growth. Would-be exporters are encouraged to work with the U.S. Government to pursue market development activities in these locations, including through trade policy missions, technical capacity building, feasibility studies, and tendering assistance. Many Latin American markets fall into this category. In these countries, the share of the import market captured by U.S. technology is greater than the share captured globally – often substantially. Regrettably, Western Hemisphere markets outside the United States are expected to account for just $40 billion of total imports, about 20 percent of the entire import market covered by this report (when Canada is removed, this number falls to just 16 percent).

2016 ITA Renewable Energy Top Markets Report | 8
Finally, some markets are neither large nor support significant U.S. market share. While some companies may find niche opportunities, most exporters would be wise to consider opportunities elsewhere. Industry Overview and Competitiveness The renewable energy industry continues to grow steadily and show no sign of slowing down. Between 2005 and 2015, the world added over 1,000 GW of capacity total in the four subsectors covered by this report (geothermal, hydro, solar, and wind).3 Of these, the United States – which ranks second in the world for renewable energy capacity – has a mature hydro industry that is soon to be overtaken by wind power generation. (Figure 3). While the capacity of U.S. geothermal power is small compared to the other three subsectors, the industry is actually far ahead of other countries in its deployment.4 In terms of renewable energy investment, the United States also ranked second for most additional capacity in 2015.5 Rapid growth in the solar subsector is almost entirely driven by utility-scale and commercial projects, although the residential solar segment will also see installations continue to increase at a steady pace. While The United States is unquestionably a leader with regards to innovation and deployment in the renewable energy sector, the export base varies for each of the subsectors in this report. For the wind and solar industries, numerous new manufacturing facilities are under construction across the country.6 By comparison, the U.S. hydro subsector, which is dominated by European-owned manufacturing that targets Western Hemisphere markets, is not expanding actively except in the niche small-hydro subsector. Meanwhile U.S. companies in the geothermal sector face an industry dominated of a small number of companies, of which 40 percent are Japanese manufacturers. However, U.S. geothermal expertise in still highly regarded in project development, engineering, and resource exploration/drilling. Global Industry Landscape Global clean energy investment, including renewable energy, totaled more than $329 billion in 2015.7 Because the cost of most renewable energy technologies continued its downward trend, the world’s investment supported an unprecedented deployment of
new renewable energy projects despite the availability of extremely cheap fossil fuels. But growth is just beginning. According to ITA’s projections, the 74 markets included in this study will install over 250 GW of new renewable energy capacity through 2017. To help meet this demand, the global import market in this sector is expected to reach $195 billion cumulatively in the 2016-2017 timeframe. Based on the estimates in this study, China is expected to account for more than 40 percent of all capacity installations outside the United States over the next two years. Its renewable energy investment is expected to be split relatively evenly between solar, wind, and hydropower through 2017 [for more information on China, see country case study]. Other key developers of new capacity will be Japan, India, Brazil, Turkey, and the European Union (particularly, Germany and the United Kingdom). What is more, the sector’s growth is now global in nature, escaping the traditional markets of Western
73,751
79,221
27,811
2,640
0
10,000
20,000
30,000
40,000
50,000
60,000
70,000
80,000
90,000
Figure 3: Comparison of U.S. Generating Capacity (MW), 2015
source: BNEF
Wind Hydro Solar Geothermal
2016 ITA Renewable Energy Top Markets Report | 9
Europe and strongly taking root in Asia, Latin America, and Africa. Over the remainder of the decade, this trend should continue with important consequences for U.S. export competitiveness. Unfortunately, U.S. exporters are relatively ill-positioned to benefit from rising demand globally. According to ITA’s projections, exporters will capture just 5.6 percent of the global import market through 2017. Although this is an improvement over last year’s projection of 3.2 percent, there are missed opportunities in certain key markets where renewable energy is growing rapidly enough to support substantial imports. In Japan, for example, where imports are expected to account for two-thirds of all solar products deployed in the market, U.S. exporters are expected to capture just 2.6 percent. In China, projected U.S. market share is less than half a percent for hydro imports; other subsectors fare slightly better, with 3 percent for solar, around 2 percent for wind, and an estimated 40 percent for the nascent geothermal market (where China lacks domestic manufacturing). Further analysis of the challenges in these markets is provided in the country case studies. The United States does – and should continue to – capture a significant piece of the import market in the Western Hemisphere. U.S. exports benefit from geographic proximity as well as a longstanding reputation for reliable, innovative products. In fact, the share of the import market captured by U.S. exporters in the region (North America, Central America, and South America) during this period will reach nearly 13 percent. Exports of renewable energy products to the Caribbean were not measurable in this study. While opportunities can be found in most markets, the destination of U.S. renewable energy exports will continue to be highly concentrated. The top 4 export markets are expected to account for 50 percent of all exports in the sector through 2016, while the top 10 markets should support over three-quarters of all exports. Challenges and Barriers In addition to understanding the competitiveness landscape facing exporters in different markets, exporters should also appreciate the other market dynamics facing the sector. For example, the impact of low fossil fuel prices will cascade across the renewable energy sector – both in the United States and around the world. Put simply, reaching “grid parity” – long the
dream of the clean energy industry – will be harder to achieve given lower coal and natural gas prices. And in markets that use imported oil to power diesel generators, distributed renewables may seem less attractive. However, unlike the period around 2009, when low energy prices undermined global renewable energy investment, the fall in clean energy costs over the past few years should help the industry remain competitive. In fact, renewable energy is already cost competitive in some markets where policy-makers have implemented effective policies. For various reasons, the mechanisms by which renewable energy is incentivized are starting to shift away from straightforward feed-in tariffs to power auctions. In this system, increasingly used in developing countries,8 governments allocate power purchasing agreements for a certain capacity of renewable energy after evaluating the developer’s proposed price per unit of electricity. On the one hand, the price competition of auction schemes has worked well in an industry that is continually lowering its costs through innovation. From the government’s perspective, auctions help to avoid both windfall profits and underpayments that can potentially result from the feed-in tariff. On the other hand, critics assert that only large developers have the know-how and financial resources to participate in auctions. U.S. suppliers must choose their partners wisely if the proposed project depends on the auction system. These auctions are sometimes designed to pit different renewable energy subsectors against each other but are sometimes limited to a specific subsector. U.S.-based suppliers can also expect to encounter markets that are more inclined towards protectionism. For example, the financing terms or the auction requirements sometimes build in an obligation for a certain percentage of local content. Opportunities Close monitoring of renewable energy policies in foreign markets is the first and foremost key to identifying opportunities. A variety of resources exist to help exporters in this area, including analysis from U.S. government agencies that have “boots on the ground” in the embassies and consulates (Departments of State, Commerce, and Energy; U.S. Agency for International Development, etc.). Bilateral dialogues regarding clean

2016 ITA Renewable Energy Top Markets Report | 10
energy policies are also increasingly incorporating private sector participation to ensure that stakeholders can keep governments informed of technological, market, or policy changes, which are fast-paced in this industry. Despite a natural tendency for countries to rely on domestic or regional sources, market forces can still play a role in fostering export opportunities. Even when U.S. suppliers are not as cost-competitive as rivals from other countries, they are often well-positioned to offer technology solutions that are more innovative or reliable. For example, thin film PV enjoys an advantage for solar projects in India due to its cost efficiency; small hydro projects such as run-of-river are in increased demand in the Western Hemisphere as a less costly and less disruptive alternative to large hydro; geothermal plants utilizing binary turbines are becoming more prevalent as the technology matures.
Whether offering a traditional technology or a newer one, U.S. exporter can use U.S. Government financing tools to support their exports. In some markets, for example, exporters can be disadvantaged by distance from their customers or by low-cost competitors. The U.S. Export-Import Bank can provide a comparative advantage by delivering financing rates attractive to developers, financing which requires the developers to use U.S. technology. In addition, exporters should consider working with the U.S. Trade and Development Agency (USTDA), which can provide funding for feasibility studies for projects in emerging markets, or the U.S. Agency for International USAID, which can provide a key first-mover advantage through pilot projects or technical aid in many developing countries.

2016 ITA Renewable Energy Top Markets Report | 11
Sector Snapshots
This section summarizes the U.S. renewable energy export opportunities in the geothermal, hydro, solar, and wind subsectors and the relative competitive position of U.S. suppliers in different types of markets.

2016 ITA Renewable Energy Top Markets Report | 12
This Page Intentionally Left Blank
2016 ITA Renewable Energy Top Markets Report | 13
Geothermal Export Markets (2016-2017) 1. Kenya
large market; large share
2. Mexico large market; large share
3. Indonesia large market; small share
4. Chile large market; small share
5. Turkey large market; small share
6. Nicaragua small market; large share
7. Guatemala small market; large share
8. Philippines large market; small share
9. Canada small market; large share
10. Argentina large market; small share
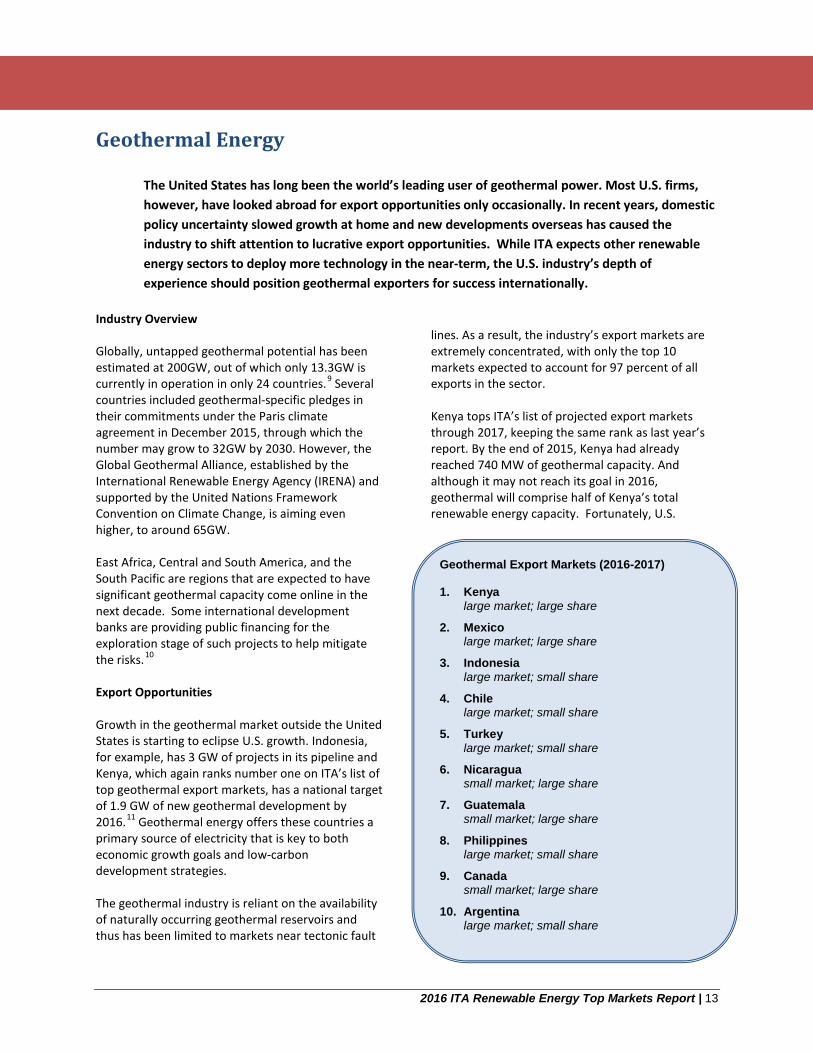
Geothermal Energy The United States has long been the world’s leading user of geothermal power. Most U.S. firms, however, have looked abroad for export opportunities only occasionally. In recent years, domestic policy uncertainty slowed growth at home and new developments overseas has caused the industry to shift attention to lucrative export opportunities. While ITA expects other renewable energy sectors to deploy more technology in the near-term, the U.S. industry’s depth of experience should position geothermal exporters for success internationally.
Industry Overview Globally, untapped geothermal potential has been estimated at 200GW, out of which only 13.3GW is currently in operation in only 24 countries.9 Several countries included geothermal-specific pledges in their commitments under the Paris climate agreement in December 2015, through which the number may grow to 32GW by 2030. However, the Global Geothermal Alliance, established by the International Renewable Energy Agency (IRENA) and supported by the United Nations Framework Convention on Climate Change, is aiming even higher, to around 65GW. East Africa, Central and South America, and the South Pacific are regions that are expected to have significant geothermal capacity come online in the next decade. Some international development banks are providing public financing for the exploration stage of such projects to help mitigate the risks.10 Export Opportunities Growth in the geothermal market outside the United States is starting to eclipse U.S. growth. Indonesia, for example, has 3 GW of projects in its pipeline and Kenya, which again ranks number one on ITA’s list of top geothermal export markets, has a national target of 1.9 GW of new geothermal development by 2016.11 Geothermal energy offers these countries a primary source of electricity that is key to both economic growth goals and low-carbon development strategies. The geothermal industry is reliant on the availability of naturally occurring geothermal reservoirs and thus has been limited to markets near tectonic fault
lines. As a result, the industry’s export markets are extremely concentrated, with only the top 10 markets expected to account for 97 percent of all exports in the sector. Kenya tops ITA’s list of projected export markets through 2017, keeping the same rank as last year’s report. By the end of 2015, Kenya had already reached 740 MW of geothermal capacity. And although it may not reach its goal in 2016, geothermal will comprise half of Kenya’s total renewable energy capacity. Fortunately, U.S.

2016 ITA Renewable Energy Top Markets Report | 14
exporters have demonstrated a strong ability to compete in the market and would benefit greatly from its continued development. Many of the top ranked markets for U.S. geothermal opportunities are in Latin America. In particular, Mexico has substantially overhauled its regulatory framework in order to encourage more geothermal development. U.S. export competitiveness is strong in the region, where ITA expects between one-third to one-half of the geothermal equipment import market to be met by products manufactured in the United States. U.S. exporters may also find short-term export opportunities in the geothermal heat pump industry. While not considered in the Renewable Energy Top Markets Report analysis, demand for geothermal heat pumps appears to be increasing globally with U.S. suppliers enjoying considerable market share. Challenges However, exporters for this industry face unique challenges. Project timetables, which include an exploration stage, are longer than other renewable energy sectors. Many announced geothermal projects never reach completion -- abandoned out of resource concerns, a lack of policy support, or development opportunities that occur elsewhere. 12 Two additional factors complicate efforts to support exports in the sector. First, while the United States
enjoys a large share of the global import market, development of geothermal projects will account for less than one percent of total renewable energy capacity growth through 2017, as other sectors attract far more investment. Second, the only segment of the geothermal industry not dominated by U.S. suppliers is also its fastest growing – “flash” geothermal turbines. Japanese firms (Toshiba, Mitsubishi, and Fuji) have captured roughly two-thirds of the “flash” turbine market. 13 While the choice of turbine is heavily dependent on the temperature of the geothermal resource being tapped, flash turbines are expected to capture a large share of new geothermal development. Most projects currently under development are greenfield projects at a site that is yet to confirm the expected resource via full diameter deep drilling (the industry standard), but drilling has commenced at those sites that are expected to be “high-grade flash” resources. This may limit the export opportunity for U.S. component providers going forward. U.S. companies excel in producing “binary” geothermal turbines, which are estimated to account for only about one sixth of global capacity.14 To the extent that markets trend toward building geothermal power plants for resources with lower temperatures, the more likely U.S. exporters will benefit from that investment.

2016 ITA Renewable Energy Top Markets Report | 15
Hydropower Export Markets (2016-2017) 1. Canada
large market; large share
2. India large market; small share
3. Venezuela large market; small share
4. Brazil large market; small share
5. Mexico small market; large share
6. Peru large market; small share
7. Russia large market; small share
8. Vietnam large market; small share
9. Philippines large market; small share
10. Malaysia small market; small share
Hydropower Despite receiving little attention within the United States, the global hydropower industry is poised to install a significant amount of new capacity by the end of the decade. Unfortunately, the international competitiveness of U.S.-based technology suppliers in the hydro sector remains constrained. Five foreign manufacturers, some of whom even have U.S. manufacturing facilities, dominate the turbine market for “large hydropower” technologies. U.S. companies enjoy a more competitive position in the “small hydro” market, particularly when projects are constructed in the Western Hemisphere.
Industry Overview Taken together, large and small hydropower capacity globally exceeds all other renewable energy sources combined. Total installed capacity worldwide now exceeds 1100 GW with new large hydro installations occurring almost exclusively in the Asia-Pacific and Central and South America. 15 Based on industry projections, ITA expects the global hydropower industry to cumulatively install over 300 GW of new capacity outside the United States between now and the end of the decade. The sector is projected to account for nearly half of all renewable energy development in that time frame. The United States has the third largest installed hydropower capacity of any country in the world behind China and Brazil.16 Today, the sector accounts for 79 GW of power capacity in the United States – the second largest source of non-fossil fuel generation behind nuclear power.17 Yet since the 1960s, major hydropower development has essentially stopped. The United States has not commissioned a new large hydropower dam in well over a generation. Only three percent of domestic hydropower capacity has been installed since 1990, with just one GW of new capacity added since 2000.18 Most forward-looking domestic capacity growth is expected to occur in the form of efficiency improvements at existing dams and the installation of power generating equipment at small dams that were constructed for some other purpose – i.e., river navigation, flood control, etc. Furthermore, the
volume of factory orders for equipment needed for such projects would be less compared to solar and wind installations, and require more customization. As a result of this stagnation in manufacturing, the global hydropower industry’s expansion over the next several years will largely occur without the involvement of U.S. equipment suppliers. In fact, according to ITA’s projections, U.S. exporters will capture just two percent of the global import market. Anecdotal evidence suggests that this number could be slightly higher for service

2016 ITA Renewable Energy Top Markets Report | 16
exporters, who often compete more effectively overseas. Export Opportunities Over the next two years, ITA expects the world to install at least 64 GW of new hydropower capacity outside the United States, trailing both wind and solar in terms of global development. China will account for the vast majority of the world’s investment in large hydropower. Driven by increasing demand for new energy sources to reduce the carbon footprint of its power mix, China is aiming to reach 350 GW of large hydropower capacity by 2020.19 However, China ranks very low for U.S. export potential. This reflects China’s reliance on its domestic manufacturing of hydro equipment and its deep supply chain. Almost all of new large hydropower projects regardless of location will be supplied with turbines from one of five dominant turbine producers.20 European producers Andritz (Austrian), Alstom (French), and Voith (German) should continue to dominate turbine sales outside of China, while Dongfang Electric and Harbin Electric will likely capture almost all turbine contracts in China. As a result, hydropower exports are expected to account for just 16 percent of U.S. clean energy exports through 2017 despite the hydropower industry accounting for one-third of the value associated with clean energy development during that time period. While U.S.-owned hydro manufacturers do not enjoy a competitive position within the large hydro market, the three dominant European turbine suppliers all have some manufacturing capacity in the United States and often export from their U.S. facilities to projects in Canada and Latin America. In fact, despite limited growth compared to other markets, Canada again ranks number one on ITA’s list of projected export markets in the sector, matching its ranking in last year’s report. ITA expects Canada to install roughly 1.5GW of new hydropower capacity over the next two years, with
U.S. suppliers capturing roughly 25 percent of the value associated with this development. More than two-thirds of hydropower exports in the near-term are expected to go to Canada and India combined, with most other markets accounting for three percent or less of total hydropower exports. Trade data with Chile, on the other hand, shows increasing imports of small and medium hydro equipment but a shrinking U.S. share of these imports. Thus our ranking for Chile has dropped from number two in last year’s report to a disappointing number 16. While large hydro projects – which are getting few and far between, even for emerging markets – do not offer U.S. exporters a likely opportunity, the United States does possess a strong small hydro industry (generally defined as supporting projects below 30 MW). The industry often produces power for off-grid communities, small towns along rivers, and generates power from existing dams used for other purposes. Additionally, many U.S. companies are already developing small run-of-river technologies that are more environmentally sustainable than traditional dams and can produce power for rural, off-grid projects. A large slice of the hydropower market is also the addition of capacity at existing dam facilities, which often requires considerable engineering expertise. Several U.S. firms excel in this subsector and should benefit from capacity upgrades globally. Challenges Like all renewable energy solutions, hydropower has its share of detractors. Concerns range from environmental to the impact of drought. This may ultimately slow the growth in this sector and reduce opportunities. Furthermore as exporters, the U.S. hydro industry does not have a strong enough domestic base to take advantage of the existing global demand. As a result, most opportunities indicated by the rankings are in the Western Hemisphere.

2016 ITA Renewable Energy Top Markets Report | 17
Solar Export Markets (2016-2017) 1. Japan
large market; small share
2. India large market; small share
3. Canada large market; large share
4. Chile large market; small share
5. France large market; small share
6. China large market; small share
7. Turkey large market; small share
8. Brazil large market; small share
9. Mexico small market; large share
10. El Salvador small market; large share
Solar Energy
ITA expects the solar sector to install more capacity through 2017 worldwide, and account for more U.S. exports, than any other renewable energy technology. The industry’s economics continue to improve, dovetailing with the movement towards reverse power auctions. Unfortunately, the United States’ share of the global import market continues to be severely hampered by a lack of domestic manufacturing capacity.
Industry Overview Since 2008, the solar industry has grown rapidly as a source of energy and economic activity, both in the United States and around the world. Residential use of photovoltaic (PV) panels could increase by an impressive 20GW worldwide over the 2016-2017 time frame. But the rise of utility-scale solar power, in addition to rapidly increasing commercial rooftop deployment, will be the major contributors, accounting for nearly 79 percent of solar installations by the end of 2017.21 Combined with the sector’s evolving cost competitiveness and continued technological improvements, it is clear that growth in solar will be supported well into the future. The industry, which is decidedly global, involves a wide range of companies, each with different needs, opportunities, and challenges. Companies are often headquartered in one country but operate worldwide, shipping products easily across borders. Large manufacturers typically have supply chains in several countries at once, importing components from many different suppliers at once. Of the solar manufacturing firms operating in the United States, more than 90 percent of their production capacity resides outside the U.S. market.22 As a result, the United States maintains only a small share of global manufacturing capacity in the sector – roughly five percent, despite inventing or innovating most solar technologies deployed globally over the last three decades. Unless losses in manufacturing capacity are reversed, this lack of market share will decline further. While falling prices in solar have helped bring it closer to grid parity compared to fossil fuels, there is a negative impact as well. The volatility has resulted in many closures, mergers, and acquisitions – both in
the United States and around the world. Competition for investors, projects, and market share, however, remains fierce. On the other hand, the industry’s consolidation, as well as improvements in processes, has left the remaining solar manufacturers more financially secure. Based on forecasts from Bloomberg New Energy Finance and Business Monitor International, ITA projects the solar industry will install an astounding 107 GW of new capacity outside the United States in 2016-2017 – more than any other clean energy technology.

2016 ITA Renewable Energy Top Markets Report | 18
Over the next two years, however, foreign suppliers will meet much of this growth, as the United States is expected to capture just 4.1 percent of the global solar import market. The small U.S. market share is limited by a general lack of domestic manufacturing capacity and the United States’ status as a net importer of solar technologies. Export Opportunities Through 2017, ITA expects Japan to account for nearly one-third of all U.S. exports in the sector – more than any other country. Despite installing about 15 GW less solar capacity than China, U.S. exporters are expected to be far more competitive in Japan. In the wake of the Paris climate agreement, China has increased its 2020 goal to 143GW of solar power.23 Imports of solar cells to China are substantial in recent years, but according to trade data these have come almost entirely from Asian suppliers, and the U.S. share of those imports is expected to continue being low compared to its market share in other countries. While much smaller markets, U.S. exporters enjoy considerably better market share in the Western Hemisphere. Five markets in the hemisphere rank in the top 20 projected export markets, including Canada (3rd), Chile (4th), Mexico (9th), El Salvador (10th) and Ecuador (12th). France makes a surprising leap in the solar rankings this year, despite Europe being a historically difficult market for U.S. suppliers to penetrate. This may reflect France’s renewed interest in clean energy following landmark reforms in July 2015. As one example, the government has announced a quarterly solar auction schedule until 2019 for 9GW of projects greater than 100kW.24 U.S. suppliers have averaged a healthy 7 percent share of France’s imports of solar PV cells, according to trade data
from 2013-2015, so they are well positioned for the expected surge of deployment. One important opportunity in the near-term will likely be the export of services, particularly financial and other consultancy services that have changed the way solar power is delivered to customers in the United States. Solar leasing, crowd sourcing, and the use of on-bill repayment, for example, should all improve the attractiveness of distributed PV for customers, with U.S. companies providing the know-how and expertise to finance these projects around the world. Challenges Despite the positive outlook for cost competitiveness, U.S. suppliers will continue to find steep competition from lower-cost manufacturers, particularly Asian suppliers. Recent announcements of U.S. manufacturing capacity expansion from several solar equipment manufacturers indicates a strengthening of the domestic industry. However, with the extensions of the Production Tax Credit and Investment Tax credit provided in December 2015, most of the components are probably destined for U.S. solar projects rather than exports. In fact, an increase of as much as 45 percent in new U.S. solar capacity over the time frame of the tax credit extensions is expected.25 As the solar industry approaches and eventually surpasses grid parity, long-term performance and efficiency should become key differentiating factors between module manufacturers. If the United States can maintain, or even expand, its share of global solar manufacturing, this dynamic should signify increased in U.S. export competitiveness.

2016 ITA Renewable Energy Top Markets Report | 19
Wind Export Markets (2016-2017) 1. Canada
large market; large share
2. Brazil large market; large share
3. Mexico large market; large share
4. Uruguay large market; small share
5. China large market; small share
6. South Africa small market; large share
7. South Korea small market; large share
8. Chile small market; large share
9. Egypt small market; large share
10. Honduras small market; large share
Wind Energy
Most U.S. wind energy exports currently are destined for only a small group of markets – namely Canada, Mexico, Brazil, Uruguay, and China. These five markets alone will account for nearly 70 percent of all wind exports through 2017. Yet, continued global investment in the industry outside these markets will very likely increase going forward, broadening export opportunities for U.S.-based suppliers.
Industry Overview The wind industry is a large and growing sector with a supply chain that produces thousands of component parts as well as a service sector that is increasingly advanced in its use of technology to design turbines, organize wind farms, and map wind potential. Most of the industry is vertically integrated, but deep supply chains have emerged to provide technology and components to the largest turbine manufacturers. The global wind market is in the midst of a recovery after a brief decline in 2013. Orders for nearly all manufacturers have increased year-over-year and turbine prices have stabilized around the world. Wind power component factories can be found in a diverse range of locations around the world, although the vast majority of manufacturing capacity is in China, Brazil, India, and the United States.26 Global wind capacity in 2015 increased 17 percent over the previous year.27 This included over 4GW of offshore wind projects, most of which was in Europe.28 However, although this segment is growing rapidly, offshore wind only accounts for 3 percent of total global wind capacity. Meanwhile, demand continues shifting towards Asia and other emerging markets and away from the saturated European market. China, in particular, will be the focal point of the industry going forward; after installing roughly 33 GW of new capacity in 2015, it intends to install another 30GW in 2016,29 aiming to reach 200GW by 2020. Other key markets will include India, Brazil, Canada, Germany, the United Kingdom, France, Mexico, and Turkey. Most demand will be met with locally-sourced products, as the wind industry’s preferred method of global expansion has been foreign direct investment.
Export Opportunities Despite ongoing logistical challenges and higher labor costs, ITA expects the market share captured by U.S. exporters to be around 7 percent, which is better than other faster-growing sectors such as solar and hydro. The largest five export destinations –Canada, Brazil, Mexico, Uruguay, and China – should account for the majority of all U.S. exports in the sector through 2020, as export markets are expected to remain

2016 ITA Renewable Energy Top Markets Report | 20
highly concentrated. Notably, the U.S. market share in the previously mentioned European markets for this sector is no greater than 2 percent. Beyond these markets, other opportunities exist depending on the planned development of individually large projects, and the availability of financing. In markets that are large, but which are far from the United States, only component parts and services will likely be exported. In China, for example, where re-powering existing wind farms with new technology has become a priority, American companies that can provide efficiency solutions may find considerable demand for their expertise. For manufacturers of large component parts, Latin American markets may provide the greatest opportunity, particularly when pairing their technology with ExIm financing. In this region, U.S. exporters are expected to capture an average 27 percent of the import market. While these will not necessarily be the largest wind markets in the world, they may provide an attractive environment in which to do business due to lower shipping costs. Although wind power will always be capital intensive, as prices decline, the importance of upfront cost should lessen, creating an opportunity for more efficient, innovative turbines perhaps produced in the United States. It should also create export opportunities for U.S. service providers that specialize in plant design, engineering, and site assessment. Challenges Two important competitors have emerged in Latin America that policy-makers should consider when helping firms develop an export strategy. First,
Chinese manufacturers now compete directly with American firms in these markets – a new phenomenon, since Chinese manufacturers have traditionally focused exclusively on China’s domestic market. To compete in the region, U.S. exporters must differentiate their often higher-cost equipment by focusing on quality. Second, the largest Latin American market – Brazil – has used local content requirements and high import tariffs to protect and grow its domestic manufacturing base. Today, Brazil has the capability to supply wind technologies to markets elsewhere in South America, competing for the first time with U.S.-based suppliers. This capability has been limited to date, but will very likely increase, as the Brazilian wind market expands. If Mexico continues to invest heavily in wind development, it too could become a supplier of low-cost equipment to the region, rivaling both the United States and Brazil. Given the interlinked nature of wind supply chains between Mexico and the United States, this development – while not helpful to export competitiveness – would be far more supportive of export growth than an active and export-minded Brazilian manufacturing sector. The offshore wind market will likely continue to be concentrated in Northern European markets – namely, the United Kingdom and Germany – although some growth can be expected in Japan, China and possibly India. In some ways, low oil prices may actually help offshore development, as there could be less competition for large crane vessels and thus lower development costs. Until the U.S. wind industry can successfully deploy major offshore wind projects domestically, spurring its manufacturing of related technologies, it cannot expect to be a key player globally in the subsector.

2016 ITA Renewable Energy Top Markets Report | 21
Country Case Studies
The following pages include country case studies that summarize U.S. renewable energy export opportunities in selected markets. The overviews outline ITA’s analysis of the U.S. export potential in each market and offer recommendations to exporters that can improve their competitiveness. The markets represent a range of countries to illustrate a variety of points – and not the top markets overall.

2016 ITA Renewable Energy Top Markets Report | 22
This Page Intentionally Left Blank

2016 ITA Renewable Energy Top Markets Report | 23
Brazil
With the reelection of President Dilma Rousseff, Brazil appeared to be on the upward trajectory when it came to its renewable energy policy environment. However, Brazil has been mired in an economic downturn, with high interest rates and a weak currency, as well as uncertainty surrounding ongoing corruption scandals. Despite these challenges, Brazil continues to chart a favorable course for its renewable energy sector, with capacity and growth expected to rise in 2016-2017. While wind and hydropower have been the source of Brazil’s renewable energy expansion to date, ITA expects new solar development to begin in earnest, eventually rivaling new investment in wind power. U.S. exporters have a smaller market share in Brazil (3.8 percent) compared to other markets in the region (around 20 percent or higher in Mexico, Uruguay, Honduras, and El Salvador, all markets that have substantially lower projected imports of renewable energy equipment than Brazil). This demonstrates how a small slice of a large market can still generate significant exports. The factors which limit the U.S. market share of Brazil’s renewable energy imports are outlined below. In 2014, renewable energy investment was catalyzed by one of the worst droughts in Brazilian history, which reduced power generation at some of its most important hydroelectric facilities and even stoked talk of power rationing and electricity rate hikes.30 Higher prices would weaken economic growth in Brazil further, as consumer buying power is eroded.
The ongoing drought in Brazil has increased the awareness in the Brazilian energy sector (private and public) of the need to diminish Brazil’s dependence on hydropower and further diversify its renewable energy sources to non-hydro sources. This could create a market opportunity for non-hydro distributed renewable energy providers, particularly roof-mounted solar PV. Brazilian government’s support towards energy diversification may shift even further with the continuing low oil prices, which make investments in oil and gas reserves, already difficult to access, less likely. Overview of the Renewable Energy Market The Brazilian Ministry of Mines and Energy releases an annual 10-year plan for energy policy (Plano Decenal de Expansão de Energia), which describes the country’s renewable energy targets. According to the latest plan of September 2015, Brazil wants to increase capacity by 24 GW of wind power, 7GW of solar power, and 27GW of hydropower. In addition, at the Paris 2015 climate summit, Brazil confirmed that it wants to increase the share of non-hydropower renewables in its electricity mix to 28-33percent by 2030. Under the plan, Brazil will maintain a significant hydropower industry, but it will decrease from 67.7 percent of the power mix in 2014 to 56.7 percent by 2024. The largest growth targets are in solar energy (from 0.2 percent in 2014 to 3.3 percent in 2024) and wind power (from 3.7 percent in 2014 to 11.6 percent in 2024).
Type: Large Market; Small Market Share
Brazil is Latin America’s largest renewable energy market. Despite Brazil’s stagnant economic growth, ITA expects continued investment in wind, solar, and hydropower capacity growth into the future. However, substantial import barriers often make the market complicated and frustrating for American exporters. Exporters are expected to face strong headwinds from local content restrictions, but may find niche opportunities providing technologies not already manufactured locally.
Geothermal
N/A
Hydropower
4 Solar
8
Wind
2
Sector Rankings
6
Overall Ranking

2016 ITA Renewable Energy Top Markets Report | 24
In 2009, Brazil began a series of successful reverse auctions to govern and facilitate the deployment of renewable energy technologies. Through the reverse auction system, which has since been duplicated in other markets around the world, developers seeking to build renewable energy projects compete against proposed conventional energy projects in regular tenders. The auctions thus reduce the price paid by Brazilian consumers for renewable energy, as developers are incentivized to offer the lowest possible cost. The focus on price competition traditionally limited opportunities for solar or other higher priced technologies, but in October 2014, Brazil tendered 889.6 MW of solar capacity through the reverse auction system for the first time. These projects are expected to come online in 2017.31 Since the first solar auction, there have been a couple of other solar-specific auctions, and solar has been able to compete successfully alongside wind at other energy auctions. As the cost of installing solar energy technologies continues to decline, future auctions will likely see more solar projects submitted. For technology suppliers, the reverse auction system provides a long pipeline of planned and approved projects. Two paths may lead to export opportunities: partnering with developers of projects who intend to bid in the auctions, or seeking out the winners afterwards for potential equipment demand, whether for the main components or secondary equipment of the project. Challenges and Barriers to Renewable Energy Exports Exporters should compete well in Brazil given its proximity to the United States, but a multitude of challenges – such as local content requirements for financing, a complex and burdensome tax system, an underdeveloped grid network, and inconsistent state and federal regulations -- have restricted market access and catalyzed investment in local manufacturing. As a result, Brazil remains one of the most frustrating and complicated markets in which U.S. renewable energy exporters compete, despite the government’s efforts to develop its renewable energy sector. The ability of local suppliers to underbid U.S. exporters is particularly bolstered by the financing
terms offered by Brazil’s national development bank, Banco Nacional de Desenvolvimento Econȏmico e Social (BNDES). For most renewable technologies, project developers can technically use non-locally sourced equipment, but BNDES frequently limits its financing to companies that meet local content requirements (LCRs). When combined with often significant import tariffs, the lack of BNDES financing leaves U.S. companies at a strong competitive disadvantage in Brazil. BNDES amended its LCRs for wind projects in 2012, announcing its intention to have all wind turbine components manufactured in Brazil by 2016. In August 2014, BNDES announced similar plans for the solar industry. For crystalline silicon PV panels, the roadmap includes three phases and ends with all cell produced locally by 2020. For thin-film, the plan has only two phases that end in 2018 with all module assembly and cell definition done in Brazil. It is still unclear whether BNDES policies will result in attracting foreign solar manufacturers to Brazil. According to industry sources, 500 MW of capacity must be contracted annually via Brazil’s reverse auction system to justify investments in new manufacturing facilities; 880 MW was announced in the first-ever auction that included solar with larger capacity installations likely in the future.32 In August 2014, a major Chinese solar supplier announced that it would establish a manufacturing plant for PV panels in the State of São Paulo. If others follow suit, this could limit export opportunities in the medium-term to component parts and materials, particularly for those manufacturers that have deep supply chains in the United States. In other instances, Brazilian firms may seek to license U.S. technology directly. Historically, almost all projects relied on BNDES and thus were subjected to LCRs. However, as the Bank has been facing closer scrutiny on its transactions, disbursement levels have been decreasing and other sources of financing have been sought out by local project developers. Capital markets might therefore need to play a larger role in the Brazilian market, potentially creating more opportunity for U.S. exporters to sell to projects not supported by BNDES and thus without such restrictions.

2016 ITA Renewable Energy Top Markets Report | 25
Opportunities for U.S. Companies For the foreseeable future, ITA expects exports to Brazil to be largely a circumstance of its sheer market volume and geographic proximity, as opposed to distinct U.S. competitiveness. Nevertheless, exporters should be able to find niche opportunities, particularly with the help of U.S. export promotion professionals. Solar Today, Brazil has almost no solar capacity installed, although exponential growth is anticipated in 2017 and beyond. By 2024, Brazil expects to have 7 GW of solar capacity online. According to BNDES’s investment plan, it will invest $2.5 billion in solar development through 2018. For U.S. exporters, the opportunity is now – and will likely diminish over time. Through 2017, BNDES’s LCRs mandate that solar modules be assembled in Brazil, but cells and other equipment can be imported.33 While this will change as LCR mandates intensify, U.S. exports should find some opportunities in the short-term. As Brazil does not currently have a completed solar supply chain in-country, imports will be required.34 There are additional opportunities for U.S. companies offering technical services to the solar energy sector, as Brazil lacks expertise in this area. Polysilicon producers, wafer manufacturing, and solar cell providers should all find opportunities. Solar project developers and other service providers may find more lasting opportunities, as the market expands over the remainder of the decade. Wind Wind capacity in Brazil – already the largest in Latin America – should continue to bolster
renewable energy growth for the foreseeable future, as much of the country’s wind potential remains underutilized. Brazil enjoys one of the world’s strongest wind resource bases; and with wind energy expected to reach grid parity in the near future, even more investment is all-but-certain. According to the Brazilian Government’s Energy Research Agency, the wind industry will need to install 19 GW of new wind capacity over the next decade to meet the country’s target of 24 GW of capacity by 2024.35 Historically U.S. wind turbine suppliers have enjoyed a good market share in Brazil, but consistent with the BNDES rules, the overall imports of these components have gradually decreased since 2011 – and the U.S. share of those shrinking exports dropped dramatically in 2015. Wind service providers such as resource mapping, turbine design, environmental impact assessments, and other types of consultancy are likely to still be in high demand and should offer opportunities for U.S. companies. Hydropower Despite the emphasis on wind and solar by Brazilian policymakers, they have not completely abandoned large hydro, which currently generates about two-thirds of the country’s electricity. According to the Ministry of Mines and Energy, Brazil will attempt to increase hydropower’s capacity by 27 GW by 2024. In the meantime, due to the ongoing drought, the expertise of engineering firms that can increase hydro capacity through technological services is desperately sought. Small hydropower, an area where U.S. technology is often highly competitive, has also been steadily increasing in Brazil, including over 1,000MW of additional capacity between 2014 and 2015 alone.36

2016 ITA Renewable Energy Top Markets Report | 26
This Page Intentionally Left Blank

2016 ITA Renewable Energy Top Markets Report | 27
Canada
Canada’s vast renewable energy potential and its national commitment to greenhouse gas reductions suggest significant clean energy investment through at least 2020. All Canadian provinces have similar strategic objectives in developing renewables and there is no large-scale investment in fossil fuel-based power generation. However, differences in provincial regulations and emphasis will ensure that sector growth remains regional, with some provinces supporting large export markets for U.S. suppliers and others attracting little overall investment. Canada has undergone dramatic changes in its energy sector over the past few years, including the development of new renewable energy capacity alongside unconventional fossil fuel development.37 Although coal and other fossil fuels should remain a part of Canada’s energy mix for the foreseeable future, some provinces are working to reduce or eliminate coal-based energy entirely. Therefore, clean energy investment should create opportunities for U.S. suppliers in both the near- and medium-term. The country’s potential has only been buoyed by the new Canadian government under Prime Minister Justin Trudeau.38
The United States’ competitive position within Canada is strong enough to ensure that even sporadic growth will support exports. North American supply chains are so interlinked that any renewable energy project, regardless of the technology used or even the project developer in charge, will often source technology from the United States.
Overview of the Renewable Energy Market ITA expects Canada’s new capacity through 2017 to be focused on wind, solar and hydropower development. According to some forecasts, Canada may commission a small amount of geothermal power in 2018 which could result in near-term exports (due to the long project timetable).
National level policies exist or are being planned, including the new government’s Energy Strategy and its Low Carbon Economy Trust, and Prime Minister Trudeau has stated that he would like to have greater centralization and management of Canada’s clean energy goals. However, most of Canada’s clean energy policies are created and enforced at the provincial level.39 For example, Nova Scotia’s tidal energy program and Québec’s provincial clean energy mandate have all led to increased investment in the sector. In November 2015, Alberta and Saskatchewan announced goals for shares of renewables to reach 30 percent and 50 percent by 2030.40 Despite the challenge of following the various regional policies, the United States will remain the main supplier by volume and share in Canadian imports of renewable equipment and technology in the near future.
Challenges and Barriers to Renewable Energy Exports Canada’s two most populated provinces, Québec and Ontario, are also the two with the most challenging policy environment for U.S. exporters to
Type: Large Market; Large Market Share
Over the next year, Canada will account for nearly one-fourth of all U.S. exports in the sector. Its proximity to the United States and the close commercial relationship enjoyed by many U.S. suppliers provides exporters a favorable environment to sell their products or services. Thus, while the market will remain much smaller than other, more dynamic clean energy markets across the globe, no market will account for more exports. As such, Canada ranks first on ITA’s list of top renewable energy export markets for the third year in a row.
Geothermal
9
Solar
3
Wind
1
Sector Rankings
1
Overall Ranking
Hydropower
1

2016 ITA Renewable Energy Top Markets Report | 28
compete. For example, Québec has the most stringent local content provisions in Canada, requiring that 60 percent of a project’s cost, and 30 percent of wind turbine costs (in the case of wind power), are spent in the province. Ontario has implemented several renewable energy policies expressly designed to attract foreign investment and increase local jobs, rather than rely on imported equipment. On the plus side, new contracts under the Feed-In Tariff no longer include local content requirements.
Moreover, exporters may be better positioned in provinces without substantial manufacturing sectors. Alberta for example – Canada’s only completely deregulated electricity market – has strong wind resources, and falling clean energy prices may make the sector competitive economically with other forms of energy. It does not mandate the use of local content and could be a good candidate for off-grid renewable energy technologies – namely, solar PV, distributed wind, and co-generation geothermal –ironically, at existing fossil fuel extraction sites in remote areas. Canada faces three other issues in the near- and long-term: public opinion on renewables, chiefly wind power; lower global oil prices; and lackluster electrical consumption growth.41 Firstly, while Canadians remain overwhelmingly supportive of renewables, wind power has been associated with higher electricity costs for consumers. Secondly, given the centrality of oil revenues to Canada, the declining price of crude may have an impact on investment in other sectors as Canada attempts to protect its primary export. Finally, Canada’s promotion of renewables remains tied to environmental targets, rather than response to increasing electricity demand, which tempers the long-term outlook for renewables investment. Opportunities for U.S. Companies Most export sales in Canada are the result of existing commercial relationships between companies in both countries. Yet, with its growing clean energy market (albeit at a slower rate than elsewhere) and its proximity to the United States, Canada can be a great place for new-to-export firms to make their first sales abroad. Companies interested in becoming exporters should work with their local U.S. Export Assistance Center to determine their export readiness and develop an export plan.
Wind Canada tops ITA’s list as the largest wind export market in the near-term, despite only 2 GW of expected capacity growth in the report’s timeframe. Its status as the largest export destination for U.S. wind energy exports is a result of the highly competitive nature of U.S. suppliers in the market. Nearly one-fourth of all Canadian imports (measured by value) in the sector are expected to be met by U.S. suppliers. Many of these exports will occur with or without export promotion support or even U.S. government financing. While no off-shore wind market exists in Canada, the country’s geography offers immense possibilities for future development. However, unlike other developed countries, most of Canada’s citizens do not live near the coast and thus offshore wind is less attractive. Its attractiveness is further diminished by the presence of low cost hydropower resources that are often far closer to population centers. Hydropower Canada is the world’s largest generator of hydropower and plans to increase its capacity going forward.42 Nova Scotia, Québec, British Columbia, and Labrador are expected to add the most hydropower capacity, although smaller development can be expected elsewhere. Given the competitive position of U.S exporters in the market, this expected development should support considerable U.S. exports over both the near- and medium-term. While some hydropower turbines may be sourced locally or imported from Europe, the services associated with Canada’s hydropower investment should provide export opportunities, as should the supply of component parts, which enter the market duty free as a result of the North American Free Trade Agreement (NAFTA). Canada therefore ranks number one on ITA’s list of top hydropower export markets. The market should account for over half of all exports in the sector– more than any market in any other renewable energy subsector. Notably, Canada has also made significant strides in tidal and ocean power, with continued development expected. Nova Scotia, which has some of the world’s highest and fastest tides, announced it is on track to

2016 ITA Renewable Energy Top Markets Report | 29
produce 20 MW of tidal power by 2020.43 Estimates indicate that Nova Scotia alone could provide as much as 30 GW of tidal energy. Solar Canada rose higher in this year’s Top Markets projection for potential solar exports. The combination of accelerated investment in new solar capacity (rooftop commercial projects and utility scale) and Canada’s lack of manufacturing capacity in the sector should support export opportunities for U.S. equipment suppliers.
Geothermal Despite an abundance of geothermal potential, there are no policy incentives for geothermal development in any Canadian province. Canada therefore has not commissioned a single geothermal facility to date. Saskatchewan, however, announced Canada’s first planned geothermal project in 2014.44 ITA expects future growth in the sector to be small, with isolated projects used for small-scale distributed generation or district heating (particularly in Northern Canada) the primary driver of any development.

2016 ITA Renewable Energy Top Markets Report | 30
This Page Intentionally Left Blank

2016 ITA Renewable Energy Top Markets Report | 31
Chile
Few countries have as much renewable energy potential, and as much need for renewable energy as Chile. The Atacama Desert in Northern Chile is widely considered the world’s best solar resource. Similarly, strong wind, geothermal, and hydropower resources exist across the country. Partly as a result of this potential and partly because Chile has limited fossil fuel resources, Chilean policy-makers have made a firm commitment to support clean energy investment. Today, the country is home to a prodigious array of renewable energy projects across each technology subsector – many with the expectation of selling electricity on the spot market (almost unique among clean energy projects globally). While most development is expected in the solar sector, export opportunities are expected across all clean energy technologies and services. Chile is one of only four markets to rank in the top ten in three different subsectors (along with Canada, Mexico, and Brazil), and ranks in the top 20 in all four. Overview of Renewable Energy Market Chile must rely on imported oil and gas (electricity) to fuel its economic growth, which has been consistent and robust for over a decade. Imports have grown dramatically as a result, rising from 42 percent of all energy consumption in 1980 to almost 75 percent today. The country’s import dependence has caused electricity spot market prices to reach an average of
$112.3/MWh on the country’s main electricity grid in 2013 – far more than other regional markets and a distinct competitiveness disadvantage for the Chilean economy. The high prices have in turn led to an incredibly robust and attractive renewable energy market, supported by both private-sector consumers in Chile – namely, large mining operations – and the Chilean government. The country is also characterized by wind and solar projects being developed and financed for the spot market or single offtakers.45 While low oil prices may make imports less problematic for the Chilean economy, ITA believes electricity prices will remain high enough – and volatile enough – to make it likely that Chile will continue to invest in renewable energy going forward. The Chilean government has long emphasized the need for diversification, adopting a bill in 2013 to set renewables at 20 percent of the energy mix by 2025. In January 2016, President Michelle Bachelet signed Chile’s new energy strategy, “Energy 2050,” which set a target of generating 70 percent of the country’s electricity from renewables by 2050. 46 Energy 2050 grew out of the President’s 2014 Energy Agenda, which highlighted Chile’s deep commitment towards developing its renewable energy sector. Moreover, Chile became the first country in Latin America to impose a carbon tax when in September 2014 its Congress passed the “green tax” (impuesto
Type: Small Market; Large Market Share
Chile’s resource potential, its traditionally high electricity prices, its stable business climate, and the expected market share captured by U.S. suppliers strongly suggests export competitiveness across each renewable energy technology through 2020. Chile is one of the few markets that should support exports in each renewable energy technology and, as such, remains a critical market for many U.S. exporters. Most export opportunities are expected in the solar sector, including both PV and Concentrated Solar Power (CSP).
Geothermal
4
Hydropower
16 Solar
4
Wind
8
Sector Rankings
7
Overall Ranking

2016 ITA Renewable Energy Top Markets Report | 32
verde). Becoming operational in 2017, the tax is set to impose a $5 per tonne of CO2 tax on emitters with installed capacity equal to or larger than 50 MW, excluding those that use biomass as a feedstock.47 This tax is widely expected to improve the cost-competitiveness of investing in renewable power sources. The tax is the latest in a series of favorable regulations set by Chile, in addition to net metering, energy auctions, attractive tax policies, and utility obligation quotas. Challenges and Barriers to Renewable Energy Exports Despite its projected growth, Chile still faces transmission challenges, which remain both persistent and disruptive.48 The country’s electricity infrastructure is entirely privatized and its grid is split in four systems. The Chilean Government thus faces hurdles incentivizing the development of new transmission lines, particularly in remote areas where renewable energy projects are often located.49 Chilean utilities, not having experience with large amounts of renewable power, have also shown signs of uneasiness about allowing additional renewable energy onto their electricity grids. Nevertheless, utility operators may have no choice but to support the use of intermittent renewable sources in their power mix, as the Chilean Government has announced that renewable energy will account for more than 75 percent of the nearly 5 GW of new capacity added to Chile main electricity grid through 2030. The Chilean government has also announced plans for a transmission line between Mejillones and Copiapó that should be completed by 2017.50 This transmission line will unify two grids: SING (Sistema Interconectado del Norte Grande) and SIC (Sistema Interconectado Central), accounting for almost 90 percent of Chile’s grid. In addition, in January 2016, Chile's Council of Deputies approved restructuring of the transmission system to improve overall efficiency, including the establishment of a new system operator.51 Growth in the Chilean economy remains largely tied to the price of minerals and other commodities. Given Chile’s reliance on fuel imports, electricity pricing is tied to fluctuating global prices for oil, natural gas, and coal.52 Chile relies mostly on market conditions to support clean energy development (unlike other markets), because of these changes in
market dynamics and their influence on investment. However, in late 2015, Deutsche Bank reported that the cost of solar and wind energy in Chile is lower than fossil fuels, with solar energy as the cheapest form of electricity available.53 Generally, project developers appear to be gaining greater access to both international and local financiers and this should support further capacity installations. Opportunities for U.S. Companies U.S. exporters are well-positioned in Chile due to the existing U.S.-Chile Free Trade Agreement and the strong bilateral commercial relationship between the United States and Chile. Solar Chile ranks fourth on ITA’s list of largest projected solar export markets through 2016 – down two spots from last year’s ranking. The drop is a result of fewer projects expected to come online; not a loss of market share captured by U.S. firms. Chile’s Environmental Assessment Service recently approved 698 MW of new solar projects in September 2014, a number far smaller than other potential solar markets. 54 While capacity growth may be somewhat limited in the short-term, ITA expects the solar industry to account for over half of all renewable energy exports to Chile through 2016. With no solar manufacturing capacity currently in operation, all of Chile’s solar development will be met by imports, creating an important opportunity for U.S. equipment and service providers. In October 2014, President Bachelet helped break ground on a 141 MW solar project in Atacama Region III, which is being developed by First Solar.55 Once completed, the project will be the largest solar project in Latin America and should drive further interest in the sector, particularly for large mining companies with operations in the Atacama region.
Going forward, it will be important to keep Chilean decision-makers aware of the latest U.S. solar technology developments. In particular, Chile’s mining sector has routinely required solar investments to demonstrate an energy storage component to fuel their 24/7 operations. Demonstrating advances in storage related to concentrated solar power may therefore help create

2016 ITA Renewable Energy Top Markets Report | 33
opportunities for firms able to meet these requirements. Wind Chile’s wind development is expected to be limited in both the near and medium-term. Some development should take place, as the country’s high priced electricity and tremendous resource potential make projects attractive to developers. For example, the Italian firm Enel Green Power constructed a 61 MW wind project, which was completed in March 2015.56 Hydropower Chile ranked highly in 2015 for projected hydropower exports. In fact, most opportunities are in the small- to medium-sized projects, such as run-of-river hydropower projects in low-flow areas like irrigation and already constructed navigational dams. However, as Chile’s import market grows for this type of hydro equipment, U.S. exporters have unfortunately lost some market share. ITA does not expect significant opportunities in the large hydropower sector. In early 2014, the Chilean
Government cancelled the environmental permit for the proposed 2.7 GW HydroAysen project in Patagonia, likely signaling a dampening of support for large hydro development in the future.57 Geothermal Despite its vast geothermal potential, Chile has commissioned no projects to date, largely due to the existence of cheaper renewable alternatives. Chile has three geothermal fields in advanced development phases, Cerro Pabellon (50MW), Curacautin (70MW) and Mariposa (50MW), alongside more than 75 geothermal exploration concessions. State-owned Empresa Nacional del Petróleo (ENAP) has estimated that Chile’s total geothermal potential could reach 3,350MW.58 Most of Chile’s geothermal development, however, will be brought online between 2017 and 2020.59 U.S. suppliers are expected to capture around 35 percent of Chile’s geothermal import market, making it one of the most U.S.-friendly business destinations of any renewable energy market globally.

2016 ITA Renewable Energy Top Markets Report | 34
This Page Intentionally Left Blank

2016 ITA Renewable Energy Top Markets Report | 35
China
China is both the world’s largest producer and consumer of renewable energy technologies. In 2016-2017, its rapid capacity growth will account for over 40 percent of all renewable energy capacity installed outside the United States, with at least 100 GW added in the solar, wind, and hydropower sectors combined. Despite the opportunity presented by China’s renewables sector, U.S. exporter continues to face challenges in exporting. U.S. exporters are projected to capture less than two percent of the Chinese import market overall; and far less of the overall market, much of which will be met by domestic suppliers. Overview of the Renewable Energy Market A number of factors will drive renewable energy investment in China; not only is China the world’s most populous country but it also has the largest installed generating capacity for electricity in general. Furthermore it has the largest electricity demand, which surged over 50 percent in just the last five years.60 China also encourages investment by offering feed-in tariffs for wind and solar PV. On the negative side, China also has the highest total CO2 emissions of any country and persistent environmental challenges, which every year become more and more acute. While China has long supported clean energy development to boost its own international competitiveness in the sector, it has increasingly viewed the sector as mutually supportive
of its domestic and international environmental commitments. As a result, it supercharged its investment in the sector since the 12th Five-Year Plan in 2010.61 In December 2015, it reaffirmed its climate change targets in the United Nations COP21 dialogue, stating that it will cut pollution from coal-fired power facilities by 60 percent by 2020.62 Moreover, a national carbon cap-and-trade program is set to begin in 2017, which will encourage the greater use of renewables.63 Coal, the traditional backbone of China’s power mix, still accounts for 64 percent of primary energy consumption.64 At 884 GW, coal-fired electricity capacity in China is formidable but has been slowly decreasing in its share of the overall energy supply in recent years. Also, as electricity growth slows down, particularly in the manufacturing sector, the timing is convenient for China to embrace clean energy.65 Today, renewable energy alone accounts for the majority of all new capacity additions.66 According to industry sources, the industry cleared $116 billion in renewable energy investment transactions in 2015, the most of any country in the world.67 In March 2015, China unveiled its 13th Five-Year Plan, further enshrining the country’s turn from coal-hungry industry to sustainability, environmental technologies and renewable energy sources.68 The plan’s focus on energy is centered on expansion in wind and solar power generation, doubling wind’s level and quintupling solar’s level from the previous Five-Year Plan. The move follows the Chinese Government’s
Type: Large Market; Small Market Share
Over the past few years, China has overtaken all other countries for installed capacity of solar, wind, and hydro power. China’s unprecedented investment continues to be driven – despite slowing growth in electricity demand – by the policy consensus in support of clean energy within the Chinese government, which has only grown stronger in the wake of the Paris climate agreement. But, U.S. exporters often struggle to maintain even a small market share and, as a result, ITA expects exports to grow based only on China’s sheer market size rather than U.S. export promotion activities.
Geothermal
N/A
Hydropower
23
Solar
6
Wind
5
Sector Rankings
8
Overall Ranking
2016 ITA Renewable Energy Top Markets Report | 36
attempts to diversify its energy mix, particularly in light of environmental concerns. Increased capacity has not always led to increased power generation from renewables. Some clean power has been left idle due to transmission bottlenecks, particularly in the northern and western provinces. However, the Chinese Government took aggressive steps to remedy this in March 2016, ordering power transmission companies to provide grid connectivity for all renewable power generation sources that meet the technical standards.69 Challenges and Barriers to Renewable Energy Exports Anecdotal evidence suggests that few markets are more challenging for U.S. exporters than China’s. The poor intellectual property (IP) rights protection and enforcement remains a consistent deterrent for many U.S. technology suppliers, especially in light of the AMSC case. Small- and medium-sized firms are often hesitant to export to China, although it is these firms, with innovative new technologies not yet introduced to the market, which may offer the greatest opportunity for export success. The structure of China’s power sector is another deterrent. State-owned enterprises dominate the market and are highly regulated. The government directly controls wholesale and retail electricity prices and often determines which renewable energy projects go forward and which stay on the drawing board. The lack of transparency of the regulatory environment and widespread corruption, including in the tendering process, remain troublesome. U.S. developers often complain that projects developed by local companies move faster and garner more support from Chinese authorities. Moreover, Chinese industry has been experiencing a period of intense restructuring, as demand for products reaches the availability of supply. Many Chinese solar manufacturers, for example, carry large amounts of debt and have exhibited poor capital control, making volatility in the sector all the more likely. Larger players may well be able to purchase the assets of debt-ridden firms at discount prices, if the market continues on its current path. These mergers could leave a few, very powerful Chinese manufacturers able to dominate the Chinese market, while also competing even more effectively in third-country markets around the world.
Opportunities for U.S. Companies Although relatively high transportation costs make manufactured goods exported from the United States to China more expensive, U.S. companies can find success exporting high value-added products. As products are commoditized, the opportunity to export from the United States decreases substantially.70 U.S. exporters are encouraged to view the Chinese renewable energy market by region or province, with each distinct location offering different opportunities. The resource-rich west, including Xinjiang, Qinghai, and Gansu, has been targeted by the Chinese Government for increased renewable energy development and will likely be the location of many projects going forward.71 The eastern and southern manufacturing centers, while not the location of most renewable energy projects, are often where component manufacturers and developers can find buyers for their products and services. The third region, the transmission-constrained north, may be an area for distributed generation, but at this point should not be targeted as a region of particular potential for U.S. exporters. Solar China is already the largest producer of solar technologies globally, supplying not only its own market, but roughly 70 percent of global PV cell and module demand.72 It became the world’s largest consumer of solar products as well in 2013, with continued growth projected well into the future. With regards to its own fast-growing solar development, China installed over 15 GW of new photovoltaic capacity in 2015, accounting for quarter of global solar installation. It is reported that during the 13th Five-Year Plan (2016-2020), the average annual new PV installed capacity will reach 20 GW for a total new installed capacity of 150 GW. China is also very ambitious in developing Concentrated Solar Power (CSP) and established a 10 GW target during the 13th Five-Year Plan period. China’s National Development and Reform Commission is expected to announce a Feed-in-Tariff rate for CSP in 2016, which should drive investment.

2016 ITA Renewable Energy Top Markets Report | 37
Wind China’s vast wind market and an unprecedented investment in the sector should support a reasonable amount of exports from the United States. The country maintains a complete wind supply chain, and ITA’s 2016-2017 ranking reflects the fact that imports of the main system component have not significantly increased in recent years. However, China often imports or licenses critical components for the wind industry. As the country shifts towards small- and medium-sized wind farms, increased technical and safety standards, and newer technologies, the demand for innovative products and technical components may provide opportunities for U.S. exporters, although competition will be fierce.73 Chinese buyers often base their purchasing decisions on upfront price, reducing the competitive position of U.S. suppliers, which win based on long-term quality and lifetime cost. Despite initial industry excitement over a potential Chinese offshore wind market, ITA does not expect large-scale development in the short term, due to opaque offshore regulations, high development costs and lower returns, and grid limitations. In fact, China missed its 12th Five-Year Plan target of 50 GW for
offshore wind projects. In June 2014, China’s National Development and Reform Commission (NDRC) released its long-awaited feed-in-tariff for offshore wind, but the new NDRC scheme offered prices that were the lowest in the world, making other offshore markets far more attractive.74 Moreover, foreign developers remain limited in the market, as they may only take a minority share (up to 49 percent) in a Chinese offshore project. Hydropower Hydropower has always been a priority for China’s infrastructure investment funds, and approval for projects is relatively easy compared to other markets. China will continue to increase its hydropower capacity. By the end of 2015, China's hydropower installed capacity reached 319 GW, with an annual generating capacity of 1.11 trillion kWh. The volume of China’s installed capacity and power generation rank first in the world. While China’s domestic companies should dominate its main component market, U.S. exporters should find opportunities selling expertise (design, engineering, and development), control systems, and environmental consultancy services.

2016 ITA Renewable Energy Top Markets Report | 38
This Page Intentionally Left Blank

2016 ITA Renewable Energy Top Markets Report | 39
India
India is already a major renewable energy market (with the sixth largest renewable energy capacity)75 despite fossil fuels still accounting for 75 percent of its energy mix.76 A new national government commitment to clean energy should facilitate growth over the next several years. According to ITA’s projections, only two markets will install more renewable energy capacity through 2017 than India – China and Japan. In 2014, India elected Narendra Modi in a sweeping election that carried with it a broad mandate to improve India’s power sector. Modi had a strong track record of developing renewable energy from his time as chief minister in Gujarat and he has continued to support clean energy development during his time as Prime Minister. This has been bolstered by India’s participation in the COP21 negotiations, where it emphasized climate financing that would benefit the country’s transition to renewable energy sources.77 The Modi administration’s largest and most perplexing challenge is arguably India’s significant need for power, especially in rural areas. Rolling brownouts have hampered economic growth and limited foreign investment in the country. The July 2012 blackout that affected 620 million people, for example, was seen as a global embarrassment and remains a politically contentious topic to this day.78 This has been combined with a growing realization of the need to reduce the country’s emissions profile, which means India must address its dependence on heavy, coal-fired electricity generation. Encouraging energy efficiency upgrades for coal power plants, doubling the tax on coal power production, and pairing new coal power
plants with solar installations are among the ways India is tackling this long-term problem. Upon entering office, Modi reiterated his campaign pledge to ensure 24/7 power for all Indians. Given India’s ongoing difficulties in thermal generation, new renewable energy investment will likely need to be relied on to meet this commitment. While significant development is expected in the wind and hydropower sectors, solar is expected to play the most important role in India’s power mix among renewables going forward – both as a result of falling solar prices and Prime Minister Modi’s history with the technology. Overview of the Renewable Energy Market Renewable energy projects in India have begun to be developed and commissioned at a higher rate, as the market responds to positive steps by the Modi government to encourage investment and make projects more attractive. In particular, new financing mechanisms announced by India should facilitate increased investment and installed capacity, and help India get closer to meeting its installation goals for both wind and solar. Since July 2014, Prime Minister Modi has doubled the tax on coal three times, the latest proposal of which will generate an estimated $4 billion to fund several important clean energy subsidies.79 A 10-year tax holiday has also been extended to power companies that begin operations in India by 2017.80
Type: Large Market; Small Market Share
Under reform-minded Prime Minister Narendra Modi, India set new goals for renewable energy that go above and beyond its own manufacturing capacity. This has stimulated investment in the sector and promoted increased deployment across a range of technologies, particularly solar energy. U.S. exporters, however, have found the Indian market frustrating, and are often perplexed by bureaucratic obstacles, infrastructure weakness and continuing emphasis on local content in certain projects.
Geothermal
N/A
Hydropower
2
Solar
2
Wind
22
Sector Rankings
3
Overall Ranking
2016 ITA Renewable Energy Top Markets Report | 40
In an effort to support additional investment opportunities for renewable energy development, India’s finance minister allowed Indian banks to raise long-term funds for lending to the infrastructure sector through the easing of constraints on liquidity, cash reserves, and priority lending.81 In November 2014, India again garnered international attention by announcing it would dramatically increase its solar energy targets to 100 GW by 2022 and 40 GW of wind by 2022. While ITA does not expect India to meet these targets, the ambitious nature of their announcement sends a positive signal to the market of India’s willingness to use its policy tools to drive development. One of the steps that India has taken to ensure successful implementation of its ambitious renewable energy goals is to make its distribution companies financially strong in order to ensure positive offtake of the renewable energy power generated. In November 2015, the Indian government announced a fixed tenure package to revive these electricity distribution companies, which have been mired in deep financial crises. The program intends to empower distribution companies with the opportunity to break even in the next 2-3 years.82 Challenges and Barriers to Renewable Energy Exports While many positive developments do suggest growing U.S. export competitiveness in India, exporters face several important structural challenges. First, India continues to have a complex business environment and the electricity sector is no exception. Exporters must engage with a slow, often bureaucratic regulatory system that includes highly regulated electricity prices and inefficient state-owned distribution companies. Developers of all power generation technologies face the same hurdles, which can slow development and make investment decisions less attractive. India is conducting reverse auctions for the capacity of new projects at both the federal and state level, but local content requirements (LCRs) are currently implemented on a case-by-case basis with no clear pattern. Secondly, India’s underdeveloped transmission and distribution (T&D) system also remains an impediment to projects.83 Losses stemming from the inefficiency of T&D are estimated at nearly 17 percent of total electrical output.
Barriers also exist regarding the availability of land for renewable energy development, a problem epitomized by the struggle to get the parliament to sign off on the Land Acquisition Bill.84 Despite Prime Minister Modi’s strong majority in India’s lower house of Parliament, he does not have a majority in the upper house to press his land acquisition reform agenda. Opportunities for U.S. Companies The size of the Indian renewable energy market should drive export growth, as should the surprisingly high market share enjoyed by U.S. suppliers, which have often benefited from the presence of the U.S. Export-Import Bank in the country. As such, India moved up to number three on this year’s Renewable Energy Top Markets Report. Like other large markets, exporters and policy-makers are well served to consider distinct regions or states as different opportunities. Karnataka and Tamil Nadu, in India’s far south, enjoy strong regional clusters of wind, solar, and hydropower companies and thus can be good destinations for export promotion activities. Gujarat and Rajasthan have excellent wind and solar resources and a history of successful clean energy projects. However, India’s northern and eastern states do not offer strong resource potential and future development there is unlikely. Wind India’s wind supply chain remains extensive, with local companies dominating the market. In fact, India enjoys 10 GW of wind turbine manufacturing capacity – three times its domestic demand, making it a key exporter to the international turbine market.85 The restoration of accelerated depreciation benefits in July 2014, which had supported wind investment in the past, should increase funding for the sector and accelerate development in the years ahead.86 American exporters unfortunately can expect to be at a severe disadvantage. According to ITA projections, only around one percent of the Indian wind import market will be captured by U.S. exports. U.S. companies may find some opportunities exporting component parts, as India does not charge an import duty for wind turbine components and exporters like AMSC, for example, have successfully licensed wind turbine technology for years.87

2016 ITA Renewable Energy Top Markets Report | 41
Notably, the Indian offshore market appears to be gaining momentum. In October 2014, the Indian Government announced the first offshore wind project, which is still under development off the coast of Gujarat.88 In September 2015, the Government of India introduced a new national offshore wind policy.89 The policy designated the Minister of New and Renewable Energy as the agency in charge of implementation and tasked the National Institute of Wind Energy with allocating offshore blocks. Solar The outlook for exports in this sector has been murky over the past several years due to the LCRs of the Jawaharlal Nehru National Solar Mission (JNNSM), India’s flagship solar incentive program. The World Trade Organization (WTO) established a panel in May 2014 on India’s solar LCRs at the request of the United States. In February 2016, a WTO dispute settlement panel found that India’s domestic content requirements under the JNNSM are inconsistent with India’s obligations under international trade agreements.90 Under WTO rules, India may appeal the panel’s decision. While LCRs limit the opportunity for Indian buyers and project developers to source technology on international markets, some solar technologies have continued to be imported. At this stage, the Modi Government even appears willing to allow some foreign imports in an effort to stimulate investment
and deploy technology more quickly. With domestic manufacturing capacity covering at best 10 percent of their lofty solar goal, the prospects for U.S. exporters have increased dramatically, despite historically facing local content barriers. Even so, the exporters must still contend with competition from China and other regional suppliers. With all of these factors taken into consideration, ITA projects that U.S. exporters will capture nearly 9 percent of India’s import market – more than double the market share of U.S.-based solar suppliers globally and nearly triple the expected market share in China. India therefore ranks second on ITA’s list of top solar export markets in the short-term and its overall ranking has been propelled higher this year as well. Exporters may also find opportunities to supply wafers or polysilicon to Indian buyers, as India maintains almost no production capability in these technologies. Hydropower With its own fully developed hydropower supply chain, 46 GW of installed capacity, and only 2 GW of planned development, the Indian hydropower market remains both mature and difficult to enter for U.S. firms.

2016 ITA Renewable Energy Top Markets Report | 42
This Page Intentionally Left Blank

2016 ITA Renewable Energy Top Markets Report | 43
Japan
Since the earthquake and tsunami that significantly damaged the Fukushima Daiichi nuclear plant in 2011, and led to its shutdown Japan’s power sector has been marked by significant turmoil. Almost immediately, Japan switched off its nuclear fleet, creating an important and unprecedented opportunity for renewable energy developers. While the Japanese renewable energy market has always been significant, the decision to use policy incentives to adjust its energy mix meant that growth was all-but-assured. Over the last four years, these early projections were borne out and today, Japan is one of the world’s largest markets with significant growth projected well into the future. Demand has been so strong for renewable energy equipment that U.S. companies, despite a historic lack of market share, have often found that Japanese buyers are showing a greater interest in their products. ITA expects this to continue, including in the solar industry, where the extent of Japan’s investment should create important export opportunities for many U.S. suppliers. Over the next two years, ITA expects Japan to account for roughly 11 percent of all renewable energy exports – and nearly one-third of all solar exports. However, ITA notes some downside risk to these projections, due to economic concerns and potential policy changes that could restrict growth in the clean energy sector. Economic conditions have been mixed over the past several years, and Japan faces some long-
term challenges due to an aging population, persistent deflationary forces, and a high level of national debt. Furthermore, the reelection of Prime Minister Shinzo Abe has signaled a rejuvenated mandate to restart Japan’s nuclear capacity.91 Despite the fact that only a small number of reactors have been brought back online, there has been increased interest in restarting others and maintaining a robust security and monitoring regime. This could crowd out and limit renewable energy development. Prime Minister Abe is a clear advocate for the nuclear industry and seems to have sided with Japan’s ten vertically-integrated and politically-important electric utilities, who have argued forcefully for the right to curtail renewable energy deployed on their grids. However, Abe has also spearheaded electricity market reforms in order to secure supply and reduce costs for consumers.92 In April 2016 Japan opened the market to independent power producers, as continued reforms transform the market over the next five years. Overview of the Renewable Energy Market While previously supported through targets and some tax incentives, Japan’s clean energy push was substantially improved with the launch of one of the highest feed-in-tariff (FIT) regimes in the world in July 2012. Almost immediately international investors and developers flocked to the market, making it one of the most attractive in the world. In the months that followed, almost every major renewable energy manufacturer had either signed an agreement with a
Type: Large Market; Small Market Share Japan remains one of the premier markets in Asia for renewables investment. However, policy reforms in 2015 make longer-term export projections less clear. While acknowledging some downside risk, ITA nonetheless remains bullish on the ability of the Japanese market to support U.S. exports, despite a persistent lack of market share captured by U.S. suppliers. Successful exporters often enjoy strong partnerships with Japanese conglomerates, who have traditionally dominated the market. While these firms manufacture most products themselves, American suppliers can help fill gaps in Japan’s supply chain.
Geothermal
11
Hydropower
20
Solar
1
Wind
40
Sector Rankings
2
Overall Ranking

2016 ITA Renewable Energy Top Markets Report | 44
Japanese conglomerate to supply the market, or was seeking to enter the market under its own label. In the year following the introduction of the FIT, Japan brought 7 GW of new renewable energy capacity online. By 2015, renewables accounted for 65GW, compared to 34GW at the end of 2012. The overwhelming majority (96 percent) of this new capacity has been in the solar sector, but wind, biomass, and geothermal projects have also been approved. Despite an almost ten percent reduction in the solar FIT in April 2013 and a further 11 percent reduction in 2014, the rate was relatively attractive to investors and developers. Finally, in early 2015 the Japanese Government began to discuss introducing power auctioning to replace the country’s FIT regime for large scale solar projects.93 This system still needs to be approved by the Japanese parliament, but if it is confirmed, it will begin in April 2017 and the FIT will be phased out. Challenges and Barriers to Renewable Energy Exports Despite the size of the Japanese market and the near-term export opportunity associated with continued investment in the sector, renewable energy exports are limited by the persistent lack of market share captured by U.S. suppliers. Since a large portion of Japan’s overall demand for clean energy projects will be met by domestic suppliers, as well as from manufacturing established overseas by Japanese companies, the share of the overall market supplied by U.S. firms remains small. Moreover, questions remain as to whether all the approved projects will be fully commissioned. Changes to grid connection and curtailment rules could make renewable energy projects more difficult to finance and construct. The new rules allow Japan’s utilities to reject previously approved renewable energy projects and stop accepting renewable power generating at existing facilities for up to 30 days a year without compensation.94 In many ways, these changes are far more troubling than potential lowering of the FIT rates, as they impact previously installed projects and could reduce or even exhaust the profitability of some assets. At the same time, Japan is having a difficult time merging its renewables capacity with its grid system.95 In December 2014, a report from the Ministry of Economy, Trade and Industry, said that seven out of
the ten utilities would not be able to integrate the planned solar capacity under the FIT mechanism with their existing network. This conclusion has been confirmed by other renewable actors in the country, including the Japan Renewable Energy Foundation. Opportunities for U.S. Companies In April 2014, Japan’s Cabinet approved the country’s first Basic Energy Plan since the Fukushima disaster. In it, the Government calls for Japan to surpass its previous targets of 13.5 percent power generation from renewable sources by 2020 and 20 percent by 2030.96 While opportunities should exist in every clean energy sector, ITA projects the most promising and most valuable opportunities will be in the solar sector. Solar Japan ranks first on ITA’s list of top solar export markets through 2016. The government does not impose any local content policies or import tariffs and thus U.S. exporters benefit from a market in which they should compete fairly with foreign and domestic suppliers. Nonetheless, intense competition from lower cost suppliers elsewhere in Asia continues to limit the share of the solar import market captured by U.S. exporters. Chinese, Korean, and Taiwanese firms have all captured a significant share of the import market and many of these firms have partnered successfully with Japanese distributors, making further market penetration difficult for American manufacturers. Many domestic Japanese firms that produce technology abroad for other markets have also begun shipping products back to Japan from their facilities elsewhere. Sharp and Kyocera, for example, now “export” solar products from Mexico and Eastern Europe back to Japan.97 U.S. firms may find a willing partner with Japanese manufacturers not currently involved in the solar sector. Many of these firms appear to be taking steps to either enter the solar market for the first time or to deploy more resources to growing their solar business. Licensing solar technologies to these conglomerates or providing equipment to manufacture solar panels could be two areas of potential export growth to this market segment.

2016 ITA Renewable Energy Top Markets Report | 45
A further opportunity may result from the sharing of best practices associated with financing off-grid solar systems in the United States. In particular, solar leasing arrangements may find a ready market in Japan thanks to the country’s well established financial sector and growing demand for roof-mounted PV. Wind U.S. exports in the wind sector are expected to be limited to niche opportunities, as the United States enjoys very little market share in Japan. According to trade data, imports seem to historically favor European (particularly German) manufacturers. Anecdotal evidence suggests that small wind turbines, for example, may provide an opportunity for American companies to compete. Another issue is that some of the most promising wind resources in northern Japan are also the most difficult to connect to the grid. Hydropower Japan’s hydropower market is expected to be limited through 2016 with only modest export growth projected into the future. Small hydro FIT rates have facilitated the approval of several small hydropower projects.98 As these projects are developed, U.S. firms may find some opportunities exporting hydropower services, like environmental assessment consulting or engineering expertise. Most hydro products, however, are expected to be procured locally.99 In the medium-term, Japan is expected to develop more hydropower, as it seeks to develop new baseload
electricity sources. Should the nuclear industry experience a renaissance in Japan, additional hydropower development would likely be limited. Geothermal Estimates indicate that Japan has the third most geothermal potential of any country in the world, ranking behind the United States and Indonesia (15.7 GW of geothermal potential).100 Due to permitting, public opposition and land use issues (most of the best geothermal spots are near national parks or hot springs), however, only 537 MW of this potential has been developed. Ironically, three Japanese companies -- Mitsubishi, Fuji, and Toshiba – collectively dominate the geothermal market (see Geothermal Snapshot). Japan’s need to produce baseload power suggests that this resource can no longer be ignored. Japan may begin to revise its environmental regulations over the next several years to enable greater use of its geothermal resources, especially if anti-nuclear sentiment persists. While no megaprojects are expected to be constructed through 2016, exports of equipment and services may be possible in the surveying, drilling, and resource assessment sectors.101

2016 ITA Renewable Energy Top Markets Report | 46
This Page Intentionally Left Blank

2016 ITA Renewable Energy Top Markets Report | 47
Mexico Mexico is a key destination for U.S. renewable energy exports already, ranking fifth on ITA’s list of top export markets in 2016. It is in the top 10 markets for each of the four technology subsectors covered in the report. Exporters are often closely connected with firms on the other side of the border, with renewable energy goods typically crossing the border several times before they become finished products. Mexico possesses world-class wind, solar, and geothermal potential, but faces several hurdles to fostering a robust renewables industry. These include a rapidly-changing regulatory regime, a politically important oil sector, falling electricity prices, and an interest in installing gas-fired plants to capture a cheap U.S. supply.102 Despite these challenges, ITA notes significant potential for renewable energy development, given President Enrique Pena Nieto’s reform efforts, the country’s avowed climate change targets, and high investor interest.103 Should Mexico develop a strong and thriving clean energy market as a result of these combined factors, it is likely that no other market would support more U.S. exports. Overview of the Renewable Energy Market ITA’s outlook for the Mexican renewable energy market has improved in recent years due to the widespread energy reforms of the Electric Industry Law that was passed into law in August 2014. Although the reform package was largely focused on PEMEX, Mexico’s state-run oil company, and was designed to facilitate foreign investment in unconventional oil and
gas development, the law has had a positive impact on Mexico’s entire power sector, including renewables. The law, which was passed as a series of amendments, was designed to liberalize the electricity generation market; open future development to private firms; and create competition between energy producers. Previously, the majority of Mexico’s electricity was generated by the Federal Electricity Commission (CFE), Mexico’s state-owned utility company. The reform package created an independent grid operator (CENACE) who will control a new, wholesale market and enable customers to purchase power directly from producers, creating an independent power producer market for the first time in Mexico. The reforms also mandate the creation of a clean energy certification scheme – to be administered by Mexico’s Energy Regulatory Commission – as the primary mechanism for encouraging the development of clean energy capacity, though the overall effectiveness of this program will depend on details that have yet to be announced. These reforms have been further buttressed by the passing of the Energy Transition Law in December 2015.104 The law set targets of 25 percent for clean energy generation by 2018 and 30 percent by 2021. The law also codified the efforts of the Ministry of Energy (SENER) to establish a tradable Clean Energy Certificate market, which will require many industries to have 5 percent of their power consumption from clean sources (which include renewables, large hydro, nuclear and efficient cogeneration) by 2018.
Type: Large Market; Small Market Share
In 2016-2017, climate change commitments and energy sector reforms will improve the outlook for Mexico’s renewable industry. These developments, combined with Mexico’s favorable renewable resources and its proximity to the United States, underscore the market’s tremendous export potential. U.S. firms are encouraged to participate in the Mexican market, working with local colleagues to both shape the newly liberalized regulatory environment and benefit from an important first-mover advantage.
Geothermal
2
Hydropower
5
Solar
9
Wind
3
Sector Rankings
5
Overall Ranking

2016 ITA Renewable Energy Top Markets Report | 48
Exporters are highly encouraged to monitor developments of the energy reform effort closely for opportunities to position themselves for success in the market, as early adopters to the reform regulations may be able to capture new opportunities. In particular, off-grid or roof-mounted solar development appears far more likely after the reforms – a technology that could support significant U.S. exports. Further buttressing Mexico’s clean energy development is the country’s “General Law on Climate Change” enacted in June 2012. The law affirmed Mexico’s target to increase its electricity generated from clean energy sources to 35 percent by 2024. These clean goals also include clean energy generation to be 40 percent by 2035 and 50 percent by 2050. In addition, Mexico set a national goal to reduce greenhouse gas emissions by 30 percent by the end of the decade. The continued investment in the sector indicates that global financiers are confident in future development of Mexico’s renewable energy market, amid the ongoing policy changes. Most industry analysts also believe that wind power will continue to dominate the renewable energy market in Mexico regardless of changes to regulation. But greater opportunities for consumers to produce their own power may create additional solar opportunities, particularly as the price of solar continues to fall. Over the medium-term, ITA expects some hydropower development as well. Challenges and Barriers to Renewable Energy Exports Many of the challenges associated with the Mexican market impact U.S. suppliers equally as suppliers from other markets – namely, an unclear and changing regulatory environment and a national focus on oil and gas development, which is increasingly uncertain amid a lower global price for oil and worldwide trends to diversify energy mixes away from fossil fuels. At the same time, Mexico faces a similar problem to other emerging markets, namely losses in the transmission and distribution (T&D) network.105 For Mexico to capture the greater renewables capacity that is planned, it will need to strengthen the existing grid network. To date, almost all renewable energy development was either approved or purchased directly by the Mexican government. As a result, negotiating power resided almost exclusively in the hands of the government. As a result, prices offered to developers were often far
below those offered in other markets, rendering Mexico an unattractive market for most clean energy developers.106 Furthermore, Mexico lacks instruments for encouraging investment, such as a feed-in tariff program.107 Instead, Mexico has opted to implement reverse power auctions, the first of which launched at the end of March 2016 with 69 prequalified bidders participating. Through these auctions, CENACE was seeking to contract 6.3TWh of clean energy, which would generate 6.3 million clean energy certificates.108 A total of 18 projects were ultimately awarded in that round, with 1,691 MW for solar and 394 MW for wind. The auction’s average contract price ($47.6/MWh) was one of the lowest and most competitive worldwide, with the lowest bid coming in for a solar project at $35.5/MWh.109 One of the effects of the reform of the power sector has been declining electricity prices, which could erode the cost competiveness of renewable projects vis-à-vis conventional power.110 Previously, high electricity prices have been a boon to renewables, with many companies buying power directly from renewables plants. There is a risk, however, that lower prices – influenced by rising cheaper fossil fuels from the United States and reduced global prices – could disincentivize renewable energy production. Opportunities for U.S. Companies Mexico’s proximity to the United States means that most companies that manufacture in the United States, whether U.S. headquartered or not, will export from their U.S. facilities to Mexico. This presents a unique opportunity that should not be missed or underestimated. Wind ITA expects wind energy to be the dominant player in Mexico’s renewable energy market for the foreseeable future. Wind projects continue to command a large portion of clean energy investment in Mexico, attracting over $1 billion alone in 2014, nearly half of total clean energy investment within the country. The Mexican Wind Power Association, CFE and SENER announced in January investments for $14 billion by 2018, an increase in almost 7,000 MW for a total of 9,500 MW of installed wind energy.

2016 ITA Renewable Energy Top Markets Report | 49
Mexico currently lacks a full wind supply chain, indicating that any future development will require imports. Many component parts will be shipped from the United States if a foreign turbine manufacturer ultimately supplies a project. Solar Mexico’s solar industry remains in its infancy. ITA expects the industry to emerge over the next six years, installing 613 MW of new capacity, primarily through distributed PV. The market is already valued at $2.3 billion, and investment should increase once the new energy reforms are fully implemented. In fact, falling solar prices and high capacity factors should make the industry far more competitive going forward and for consumers located in remote areas, could become the energy source of choice. Geothermal Over the past few years, new regulations from President Pena Nieto have improved the prospects for the geothermal industry. A framework is now in place to facilitate the issuance of permits for site study, as well as concessions for exploration and development of geothermal resources. In addition, SENER
announced in June 2014 a partnership with Nacional Financiera and the Inter-American Development Bank to provide risk mitigation and financing for private geothermal energy projects.111 ITA projects U.S. exporters will capture nearly two-thirds of all geothermal imports in Mexico. Several U.S. firms are active in the market already, and benefit from Mexico’s incomplete geothermal supply chain. Opportunities are likely to include operation and management, as well as engineering and drilling services. Hydropower In the near term, most of the new capacity in this subsector will be in large hydropower. U.S. exporters are fairly competitive in Mexico for a wide range of hydropower equipment and services (with an overall estimated market share of 11 percent). However there is still potential to further encourage Mexican authorities to consider small hydro projects, in which U.S. suppliers can offer innovative and affordable solutions.

2016 ITA Renewable Energy Top Markets Report | 50
This Page Intentionally Left Blank

2016 ITA Renewable Energy Top Markets Report | 51
South Africa
Over the past five years, South Africa has developed a renewable energy independent power producer (IPP) program that has proven very successful in bringing renewable energy projects to commercial operation, with just over 2,000MW operating today, out of 6,000MW planned or under construction. These projects include wind, solar (both PV and concentrating solar power) small hydro, landfill gas and biogas as sources of energy. After more than four bid rounds under REIPPP, the cost of wind and solar technology has declined over 70 percent and is now cost-competitive with new build coal and gas.112 These technologies are also successful in South Africa as they are able to be built and scaled-up quickly, a feature central to the government’s plan to bring the energy capacity to a more sustainable level in the short-term. The IPP office within the South African Department of Energy (DOE) is responsible for overseeing the REIPPP auctions and, ultimately, the procurement of energy from each IPP. All REIPPP projects sell their electricity to the State owned electrical utility, Eskom. The National Energy Regulator of South Africa (NERSA) approves electricity rates based on submissions from Eskom. As retail electricity rates continue to rise, renewable energy is becoming increasingly cost-competitive. While Eskom has commissioned the addition of new coal-fired plants, coal as a percentage of the overall energy mix is expected to decrease in coming years as penetration of renewables increases.
Overview of the Renewable Energy Market The utility-scale renewable energy market in South Africa has taken off in recent years, attracting $4.6 billion in new investment in 2014 alone.113 In January 2015, South Africa’s Minister of Energy announced another doubling of goals for the renewable energy generation capacity in the country.114 Over the next few years, South Africa can expect an additional $16 billion of investment in renewables, thanks to its reverse auctioning program.115 Since the start of REIPPP, wind projects accounted for slightly over half of total capacity, followed by solar PV (30 percent), solar thermal (14 percent), with the balance comprised of landfill gas and biomass. South African energy policies are guided by the Integrated Resource Plan (IRP), the last of which was issued in 2011; an update is expected in 2016. The 2011 IRP included a strong mix of renewables, and it is likely the version to be released this year will continue this trend, highlighting the potential for renewables development. A tradeable carbon tax is under consideration, which when combined with electricity price adjustments, will help to bring renewable technologies in line with the cost of existing generation sources.116 These policies, coupled with a government push to reach a 97 percent electrification rate by 2025 means that renewable technologies will play an increasing role in the energy mix of the country.
Type: Small Market; Large Market Share
South Africa is a growing renewable energy market with major upside potential for U.S. exporters. The threat of continued power shortages is a strong driver for government commitment to renewable energy investment and technology solutions from foreign suppliers. Much of South Africa’s upside potential depends on the Renewable Energy Independent Power Producer Procurement Program (REIPPP) – a successful program for independent power producers that provides an open playing field for foreign competitors. REIPPP provides opportunities for U.S. renewables suppliers that rival major markets around the world.
Geothermal
N/A
Solar
20
Wind
6
13
Hydropower
11
Sector Rankings Overall Ranking

2016 ITA Renewable Energy Top Markets Report | 52
Competition in the REIPPP procurement system has driven down the prices across all technologies. REIPPP allocates specific MW targets per renewable energy technology, so there is potential for U.S. company participation across all resource-viable and cost-competitive renewable technologies. The REIPPP program has successfully concluded four rounds of public tenders totaling more than 6,000 MW procured. An additional announcement of preferred bidders—as a carry-over part of Round 4—is scheduled to be announced in the second quarter of 2016 with plans to announce the opening of the Fifth Round to be made shortly thereafter. The success of the REIPPP program has already led to an announcement by the Minister of Energy to expand the program into subsequent rounds to include another 6,300 MW of renewables technologies. Challenges and Barriers to Renewable Energy Exports South African local content requirements (LCRs) on REIPPP bids have increased in subsequent rounds. For example, the LCR for REIPPP Bid Round 3 was 45 percent. Additionally, DOE has implemented a black identity shareholder requirement, which mandates that a firm or project have black South Africans as shareholders. This is part of the Government’s larger mandate under its Broad-Based Black Economic Empowerment (BBBEE) program which seeks to redress the inequalities of Apartheid by giving certain previously disadvantaged groups greater economic privileges. Enterprises in South Africa are assessed on an annual basis by receiving a federal scorecard based on benefits they provide to South African communities including employment preference to disadvantaged groups, skills development, equity ownership and management, socioeconomic development, enterprise development and preferential procurement. In addition, in order to serve the rapidly growing generation capacity, South Africa will need to address its transmission losses and improvement of the national grid.117 There has been a lack of investment into the network, which has already been a contributing factor to project delays, including the bids from REIPPP’s November 2014 fourth round auction. This, coupled with concerns in the conventional power sector over Eskom’s financial viability, may soften lofty expectations of renewables in the country.
Opportunities for U.S. Companies Current energy shortages are slowing economic growth in Africa’s second largest economy. Due to the need for energy, South Africa is currently seeking power projects that can go online quickly to boost energy supplies. Any future development should enjoy relatively easy access to international financial support. Another opportunity in the South African market is the energy poverty gap of over 3.5 million people without access to reliable electricity (approximately 8 percent of the population in 2012).118 Increasing electricity access to these people will require infrastructure upgrades including grid expansion, as well increased distributed generation. Renewable energy companies would be well positioned to supply technologies for these smaller-scale electrification efforts. Additionally, many large industries in South Africa, such as the mining and construction sectors, are looking to alleviate the supply-demand mismatch that had led to load-shedding (rolling blackouts). Many of these industries have traditionally relied on diesel-powered back-up generators to run while the electricity is off, however, distributed generation using renewables is becoming increasingly attractive as renewables require no fuel inputs and typically function during working hours, as is the case for solar PV. In these cases, U.S. companies should work with these large industries to facilitate deals outside of the bounds of REIPPP. Several municipalities in South African, including Johannesburg and Cape Town, have expressed an interest in developing their own separate energy sources. Rooftop solar has been identified as a preferred renewable source to fill this gap. However, with 95 percent of the South African grid being controlled by Eskom, the market is awaiting new federal regulations that would create the framework for municipalities to source their own energy and be able to feed into the national grid. Wind South Africa’s onshore wind sector, under the South Africa Wind Energy Programme (SAWEP), is expected to contribute the largest share to renewables development in South Africa in the near future. The potential for the industry will likely be tempered by a

2016 ITA Renewable Energy Top Markets Report | 53
continued reliance on coal-fired plants for electricity production and the need to expand transmission lines to more areas suited for wind power. Hydropower South Africa has several small hydroelectricity facilities and there is a great potential for additional small plants in the Eastern Cape and KwaZulu-Natal. South Africa’s participation in the Southern African Power Pool (SAPP) of the Southern African Development Community (SADC) allows it to trade electricity freely between SADC member countries, including those with larger hydropower sectors, but South Africa’s electrical grid is many times larger than any of its neighbors, and cross border trade is a small portion of South Africa’s energy mix.
Solar ITA expects strong growth in South Africa’s solar industry, on both a utility scale and in commercial, industrial, and residential rooftop applications. While much of the new utility-scale generation has focused on PV technologies, several companies have been successful in introducing Concentrated Solar Power (CSP) solutions into South Africa. In addition to solar developers, South Africa is also attracting manufacturers that are interested in establishing production facilities. For example, in 2015, SunPower broke ground on a solar PV factory in Cape Town that it hopes will generate 160 MW annually.119

2016 ITA Renewable Energy Top Markets Report | 54
This Page Intentionally Left Blank

2016 ITA Renewable Energy Top Markets Report | 55
The U.S. Government has numerous resources available to help U.S. exporters: from additional market research, to guides to export financing, to overseas trade missions, to staff around the country and the world. A few key resources are highlighted below. For additional information about services from the International Trade Administration (ITA), please visit www.export.gov.
Addendum: Resources for U.S. Exporters
Renewable Energy & Energy Efficiency (RE&EE) Exporter Portal http://export.gov/reee/ This online portal provides a one-stop shop for RE&EE exporters – including renewable power, biofuels, T&D equipment, smart grid ICT, and energy storage – to connect to news, events, and market intelligence resources from U.S. Government agencies under the National Export Initiative. RE&EE exporters can also sign up to receive a quarterly e-newsletter. Additionally, the portal includes the latest information from the Department of Commerce’s Renewable Energy and Energy Efficiency Advisory Committee, a Federal Advisory committee that advises the Secretary regarding the development and administration of programs and policies to expand the competitiveness of U.S. exports of RE&EE goods and services. Country Commercial Guides http://export.gov/ccg/ Written by U.S. Embassy trade experts worldwide, the Country Commercial Guides provide an excellent starting point for what you need to know about exporting and doing business in a foreign market. The reports include sections addressing: market overview, challenges, opportunities, and entry strategies; political environment; selling U.S. products and services; trade regulations, customs, and standards; and much more. Basic Guide to Exporting http://export.gov/basicguide/ A Basic Guide to Exporting addresses virtually every issue a company looking to export might face. Numerous sections, charts, lists and definitions throughout the book’s 19 chapters provide in-depth information and solid advice about the key activities and issues relevant to any prospective exporter. Trade Finance Guide: A Quick Reference for U.S. Exporters http://www.export.gov/tradefinanceguide/index.asp Trade Finance Guide: A Quick Reference for U.S. Exporters is designed to help U.S. companies, especially
small and medium-sized enterprises, learn the basics of trade finance so that they can turn their export opportunities into actual sales and achieve the ultimate goal of getting paid on time for those sales. Concise, two-page chapters offer the basics of numerous financing techniques, from open accounts to forfaiting and government assisted foreign-buyer financing. Trade Missions http://www.export.gov/trademissions/ Department of Commerce trade missions are overseas programs for U.S. firms that wish to explore and pursue export opportunities by meeting directly with potential clients in local markets. Trade missions include, among other activities, one-on-one meetings with foreign industry executives and government officials that are pre-screened to match specific business objectives. Certified Trade Fairs http://www.export.gov/eac/show_short_trade_events.asp?CountryName=null&StateName=null&IndustryName=null&TypeName=International%20Trade%20Fair&StartDate=null&EndDate=null The Department of Commerce's trade fair certification program endorses overseas trade shows that are reliable venues and good markets for U.S. firms to sell their products and services abroad. These shows serve as vital access vehicles for U.S. firms to enter and expand into foreign markets. The certified show/U.S. pavilion ensures a high-quality, multi-faceted opportunity for American companies to successfully market overseas. Among other benefits, certified trade fairs provide U.S. exhibitors with help facilitating contacts, market information, counseling and other services to enhance their marketing efforts. Upcoming certified trade fairs include:
• MIREC Week; Mexico City, Mexico May 16-20, 2016
• Power-GEN Asia; Seoul, Korea September 20-22, 2016
• European Utility Week; Barcelona, Spain November 15-17, 2016

2016 ITA Renewable Energy Top Markets Report | 56
International Buyer Program http://export.gov/ibp/ The International Buyer Program (IBP) brings thousands of international buyers to the United States for business-to-business matchmaking with U.S. firms exhibiting at major industry trade shows. Every year, the International Buyer Program results in millions of dollars in new business for U.S. companies by bringing pre-screened international buyers, representatives and distributors to selected shows. U.S. country and industry experts are on site at IBP shows to provide hands-on export counseling, market analysis, and matchmaking services. Each IBP show also has an International Business Center where U.S. companies can meet privately with prospective international buyers, prospective sales representatives, and business partners and obtain assistance from experienced ITA staff. Upcoming IBPs include:
• HydroVision; Minneapolis, MN July 26-29, 2016
• Solar Power International; Las Vegas, NV September 12-15, 2016
The Advocacy Center http://www.export.gov/advocacy/ The Advocacy Center coordinates U.S. government interagency advocacy efforts on behalf of U.S. exporters that are bidding on public-sector contracts with overseas governments and government agencies. The Advocacy Center helps to ensure that sales of U.S.
products and services have the best possible chance competing abroad. Advocacy assistance is wide and varied but often involves companies that want the U.S. Government to communicate a message to foreign governments or government-owned corporations on behalf of their commercial interest, typically in a competitive bid contest. Global Energy Team http://www.export.gov/industry/energy/index.asp The Global Energy Team is a network of ITA’s global energy specialists that draws on experiences across the U.S. Commercial Service, Foreign Commercial Services, and Department of Commerce headquartered industry analysts. The team provides information to clients on upcoming events, trade leads, and market research. U.S. Commercial Service http://www.export.gov/usoffices/index.asp With offices throughout the United States and in U.S. Embassies and consulates in nearly 80 countries, the U.S. Commercial Service utilizes its global network of trade professionals to connect U.S. companies with international buyers worldwide. Whether looking to make their first export sale or expand to additional international markets, companies will find the expertise they need to tap into lucrative opportunities and increase their bottom line. This includes trade counseling, actionable market intelligence, business matchmaking, and commercial diplomacy.

2016 ITA Renewable Energy Top Markets Report | 57
Appendix 1: Full Rankings Overall Rankings (2016-2017) Rank Country
1 Canada 50 Netherlands 2 Japan 51 Spain 3 India 52 Cote D'Ivoire 4 Kenya 53 Sweden 5 Mexico 54 Saudi Arabia 6 Brazil 55 Switzerland 7 Chile 56 Ethiopia 8 China 57 Cameroon 9 France 58 Norway
10 Turkey 59 Kazakhstan 11 Indonesia 60 Pakistan 12 Uruguay 61 Greece 13 South Africa 62 Lithuania 14 Venezuela 63 Finland 15 Nicaragua 64 Ukraine 16 El Salvador 65 Zambia 17 Philippines 66 Slovakia 18 United Kingdom 67 Romania 19 Germany 68 Czech Republic 20 South Korea 69 Poland 21 Ecuador 70 Bulgaria 22 Guatemala 71 Azerbaijan 23 Egypt 72 Estonia 24 Russia 73 Sri Lanka (Ceylon) 25 Peru 74 Taiwan 26 Honduras 27 Argentina 28 Vietnam 29 Panama 30 Thailand 31 Israel 32 Australia 33 Costa Rica 34 Italy 35 Ireland 36 Morocco 37 New Zealand 38 Malaysia 39 Belgium 40 Denmark 41 Algeria 42 Colombia 43 Hong Kong 44 Iceland 45 Tunisia 46 Austria 47 Ghana 48 Portugal 49 Hungary

2016 ITA Renewable Energy Top Markets Report | 58
Appendix 2: Subsector Rankings
Projected Geothermal Export Markets (2016-2017)
Rank Country 1 Kenya
2 Mexico
3 Indonesia
4 Chile
5 Turkey 6 Nicaragua 7 Guatemala 8 Philippines 9 Canada
10 Argentina 11 Japan 12 New Zealand 13 Iceland 14 Portugal 15 Hungary 16 Greece 17 Russia
18 Germany 19 Italy 20 France

2016 ITA Renewable Energy Top Markets Report | 59
Projected Hydropower Export Markets (2016-2017)
Rank Country
1 Canada
2 India
3 Venezuela
4 Brazil
5 Mexico 6 Peru 7 Russia 8 Vietnam 9 Philippines
10 Malaysia 11 South Africa 12 Australia 13 Argentina 14 Morocco 15 Indonesia 16 Chile 17 Germany
18 Colombia 19 Honduras 20 Japan 21 Austria 22 South Korea 23 China 24 Turkey 25 Cote D'Ivoire 26 Italy 27 Sweden 28 Ethiopia 29 Cameroon 30 Guatemala 31 Norway 32 Pakistan 33 Panama 34 Switzerland 35 El Salvador 36 Thailand 37 Kazakhstan 38 France 39 Zambia 40 New Zealand 41 Bulgaria 42 Sri Lanka (Ceylon) 43 Ukraine 44 Nicaragua 45 Poland 46 Finland 47 Romania 48 Belgium 49 Hungary

2016 ITA Renewable Energy Top Markets Report | 60
Projected Solar Energy Export Markets (2016-2017)
Rank Country
1 Japan
2 India
3 Canada
4 Chile
5 France 6 China 7 Turkey 8 Brazil 9 Mexico
10 El Salvador 11 Germany 12 Ecuador 13 United Kingdom 14 Israel 15 Thailand 16 Australia 17 Egypt
18 Russia 19 Denmark 20 South Africa 21 Algeria 22 Philippines 23 Morocco 24 Nicaragua 25 Ghana 26 Argentina 27 Spain 28 Peru 29 Belgium 30 Malaysia 31 Costa Rica 32 Panama 33 Saudi Arabia 34 Austria 35 South Korea 36 Vietnam 37 Italy 38 Finland 39 Ukraine 40 Sweden 41 Netherlands 42 Tunisia 43 Indonesia 44 Romania 45 Greece 46 Portugal 47 Bulgaria 48 Poland

2016 ITA Renewable Energy Top Markets Report | 61
Projected Wind Energy Export Markets (2016-2017)
Rank Country
1 Canada 47 Slovakia 2 Brazil 48 Austria 3 Mexico 49 Finland 4 Uruguay 50 Czech Republic 5 China 51 Poland 6 South Africa 52 Morocco 7 South Korea 53 Azerbaijan 8 Chile 54 Estonia 9 Egypt 55 Norway
10 Honduras 56 Taiwan 11 Nicaragua 57 Ethiopia 12 Panama 58 Sweden 13 United Kingdom 59 Pakistan 14 France 60 Bulgaria 15 Kenya 61 Greece 16 Philippines 17 Costa Rica
18 Ireland 19 Vietnam 20 Italy 21 El Salvador 22 India 23 Indonesia 24 Germany 25 Belgium 26 Argentina 27 Thailand 28 Hong Kong 29 Venezuela 30 Colombia 31 Tunisia 32 Israel 33 Peru 34 Netherlands 35 Guatemala 36 Portugal 37 Ecuador 38 Hungary 39 Turkey 40 Japan 41 Lithuania 42 Switzerland 43 Kazakhstan 44 Spain 45 Russia 46 Australia

2016 ITA Renewable Energy Top Markets Report | 62
Appendix 3: Citations
1 IEA World Energy Outlook, 2015 2 USITC, Renewable Energy and Related Services: Recent Developments, August 2013 3 Bloomberg New Energy Finance, Market Size: Generation and Capacity. 4 Geothermal Energy Association, 2016 Annual U.S. & Global Geothermal Power Production Report. 5 Bloomberg New Energy Finance, United States country profile. 6 Bloomberg New Energy Finance, database of manufacturing plants. 7 Bloomberg New Energy Finance Press Release, January14, 2016, “Clean energy defies fossil fuel price crash to attract record $329bn global investment in 2015 8 IRENA, 2013 “Renewable Energy Auctions in Developing Countries” http://www.irena.org/DocumentDownloads/Publications/IRENA_Renewable_energy_auctions_in_developing_countries.pdf 9 Geothermal Energy Association, 2016 Annual U.S. & Global Geothermal Power Production Report, p.8. 10 Geothermal Energy Association, 2016 Annual U.S. & Global Geothermal Power Production Report, p.13. 11 Bloomberg New Energy Finance, “H2 2014 Geothermal Market Outlook” 28 August 2014 12 Bloomberg New Energy Finance, “Q2 2013 Geothermal Market Outlook” (27 June 2013) pp. 3 13 Bloomberg New Energy Finance, “H2 2014 Geothermal Market Outlook” 28 August 2014 14 Geothermal Energy Association, 2016 Annual U.S. & Global Geothermal Power Production Report, p. 18 15 Bloomberg New Energy Finance, Market Size database. 16 Bloomberg New Energy Finance, “Hydropower Research Note: US Hydro in 2013 – a trickle or a flood” (9 July 2013) pp. 2 17 Bloomberg New Energy Finance, “Hydropower Research Note: US Hydro in 2013 – a trickle or a flood” (9 July 2013) pp. 1 18 Bloomberg New Energy Finance, “Hydropower Research Note: US Hydro in 2013 – a trickle or a flood” (9 July 2013) pp. 1 19 China’s 2014 National Energy Development Strategic Plan, as summarized by Bloomberg New Energy Finance 20 Bloomberg New Energy Finance, “Hydropower Research Note: Sizing up global hydropower growth in 2012” (4 April 2013) pp. 1 21 Bloomberg New Energy Finance, Market Size database. 22 Goodrich, Powell, et al., Journal of Energy and Environmental Science, “Assessing the drivers of regional trends in solar photovoltaic manufacturing” pp. 2812. 23 Bloomberg New Energy Finance, “China to More Than Triple Solar Capacity in Five Years,” March 21, 2016. 24 Bloomberg New Energy Finance, France Country Profile. 25 Bloomberg New Energy Finance, “Q1 2016 PV Market Outlook,” February 18, 2016, p.19. 26 Bloomberg New Energy Finance, Manufacturing Plants database. 27 Bloomberg New Energy Finance, Market Size database. 28 Bloomberg New Energy Finance, “Q1 2016 Global Wind Market Outlook: Stable Market,” February 18, 2016. 29 Bloomberg New Energy Finance, “China Plans 22% Boost for Wind Power Capacity After Record 2015,” March 21, 2016. 30 BNEF, “Tractebel sees Brazil Power Rationing in 2015 if no Rain,” 28 October 2014 31 Business Monitor International, “Brazil Renewables Report” 32 Bloomberg New Energy Finance, “In run-up to solar auction, Brazil sets content rules,” 14 August 2014 33 Bloomberg New Energy Finance, “In run-up to solar auction, Brazil sets content rules,” 14 August 2014 34 Bloomberg New Energy Finance, “Climatescope 2014” 35 Bloomberg New Energy Finance, “Brazil will boost wind energy as drought undermines hydro,” 11 September 2014 36 Bloomberg New Energy Finance, Market Size database. 37 Business Monitor International, “Canada Renewables Report,” 16 October 2014. 38 CBC News, “Justin Trudeau's environment plan,” 29 June 2015. http://www.cbc.ca/news/politics/justin-trudeau-s-environment-plan-end-fossil-fuel-subsidies-invest-in-clean-tech-1.3131607 39 Business Monitor International, “Canada Renewables Report Q1 2016,” December 2015. 40 Business Monitor International, “Canada Renewables Report Q1 2016,” December 2015. 41 Business Monitor International, “Canada Renewables Report Q1 2016,” December 2015. 42 Business Monitor International, “Canada Renewables Report,” 16 October 2014. 43 Business Monitor International, “Canada Renewables Report,” 16 October 2014. 44 Business Monitor International, “Canada Renewables Report,” 16 October 2014. 45 Bloomberg New Energy Finance, “Climatescope 2014: Chile.” 46 Business Monitor International, “Chile Renewables Report Q2 2016,” February 2015. 47 Bloomberg New Energy Finance, “Climatescope 2014: Chile.” 48 Business Monitor International, “Chile Renewables Report ,” 1 January 2015. 49 Government of Chile, NES, pp. 28-29. 50 Business Monitor International, “Chile Renewables Report Q2 2016,” February 2016. 51 PV Magazine, “Chile: Transelec ganó licitación de obras en interconexión del SIC y SING,” 17 March 2016.

2016 ITA Renewable Energy Top Markets Report | 63
http://www.pv-magazine-latam.com/noticias/detalles/articulo/chile--transelec-gan-licitacin-de-obras-en-interconexin-del-sic-y-sing_100022458/ 52 Business Monitor International, “Chile Renewables Report Q2 2016,” February 2015. 53 PV Magazine, “Chile: Solar cheaper than fossil fuels,” 5 November 2015. http://www.pv-magazine.com/news/details/beitrag/chile--solar-cheaper-than-fossil-fuels_100021869/#axzz43h48KGav 54 Business Monitor International, “Chile Renewables Report ,” 1 January 2015. 55 La Nación, “Bachelet inaugural primera planta de energía solar en Atacama,” 17 October 2014.http://www.lanacion.cl/noticias/regiones/atacama/bachelet-inaugura-primera-planta-de-energia-solar-en-atacama/2014-10-17/142439.html 56 Enel, “Enel Green Power brings Talinay Poniente wind farm online in Chile,” 11 March 2015. https://www.enelgreenpower.com/ewcm/salastampa/comunicati_eng/1663411-1_PDF-1.pdf 57 Bloomberg New Energy Finance, “Climatescope 2014: Chile.” 58 Business Monitor International, “Chile Renewables Report Q2 2016,” February 2016. 59 Country Energy Profile: Chile – Clean Energy Information Portal. www.reegle.info/countries/chile-energy-profile/CL 60 Bloomberg New Energy Finance, “Power Demand Means $65 Billion a year Task for China State Grid” 04 December 2014. 61 Bloomberg New Energy Finance, “Onwards and upwards: China’s renewable targets for 2013,” 23 January 2013. 62 Business Monitor International, “China Renewables Report Q1 2016,” December 2015. 63 Business Monitor International, “China Renewables Report Q1 2016,” December 2015. 64 U.S. Energy Information Administration, China Energy Overview, March 2015 https://www.eia.gov/beta/international/analysis.cfm?iso=CHN 65 “China's Slowing Power Consumption Highlights Clean Energy Gains,” Bloomberg News, January 19, 2016 http://www.bloomberg.com/news/articles/2016-01-19/china-s-slowing-power-consumption-highlights-clean-energy-gains 66 Bloomberg New Energy Finance, “H2 2014 China Market Outlook,” 28 August 2014. 67 Bloomberg New Energy Finance, China country profile 68 Foreign Policy, “China’s Leaner and Greener 5-Year Plan,” 30 October 2015. http://foreignpolicy.com/2015/10/30/chinas-leaner-and-greener-5-year-plan/ 69 Reuters, “China pushes for mandatory integration of renewable power,” March 28, 2016. http://uk.reuters.com/article/us-china-power-renewables-idUKKCN0WU0RF 70 Bloomberg reference in 2012 study. 71 Bloomberg New Energy Finance, “Climatescope 2014: China.” 72 Bloomberg New Energy Finance, “Climatescope 2014: China.” 73 Global Wind Energy Council, “Global Wind Energy Outlook 2012,” November 2012. 74 Bloomberg New Energy Finance, “H2 2014 China Market Outlook,” 28 August 2014. 75 Bloomberg New Energy Finance, India County Profile. 76 IEA, India Energy Outlook 2015, http://www.worldenergyoutlook.org/media/weowebsite/2015/IndiaEnergyOutlook_WEO2015.pdf 77 Hindustan Times, “COP21 Agreement,” 13 December 2015.http://www.hindustantimes.com/world/cop21-agreement-all-you-need-to-know-about-paris-climate-change-deal/story-BrmIrkuHIJ0jBahYxbjdqL.html 78 Ernst & Young, Renewable energy country attractiveness indices, Issue 35, November 2012. 79 Bloomberg New Energy Finance,”India Doubles Clean EnergyTax on Coal, Risking Debt Revamp,” February 29, 2016. 80 Business Monitor International, “India Renewables Report” 16 December 2014. 81 Bloomberg New Energy Finance,” H2 2014 India Market Outlook” 8 August 2014. 82 Reuters, “India unveils rescue package for power sector,” 5 November 2015. http://in.reuters.com/article/india-power-rescue-idINKCN0SU22E20151105 83 Business Monitor International, “India Renewables Report Q2 2016,” February 2016. 84 Quartz India, “Timeline: 200 years of India’s struggle with land acquisition laws,” 5 August 2015.http://qz.com/471117/timeline-200-years-of-indias-struggle-with-land-acquisition-laws/ 85 Bloomberg New Energy Finance, “Climatescope 2014: India.” 86 Bloomberg New Energy Finance,” H2 2014 India Market Outlook” 8 August 2014. 87 Bloomberg New Energy Finance, “H1 2013 India Market Outlook.” 88 Business Monitor International, “India Renewables Report” 16 December 2014 89 Mondaq India, “National Offshore Wind Energy Policy, 2015,” 6 November 2015. http://www.mondaq.com/india/x/441280/Renewables/National+Offshore+Wind+Energy+Policy+2015 90 World Trade Organization, “WTO issues panel report on India’s domestic content requirements for solar products,” 24 February 2016.https://www.wto.org/english/news_e/news16_e/456r_e.htm 91 Business Monitor International, “Japan Renewables Report Q2 2016,” January 2016. 92 Business Monitor International, “Japan Renewables Report Q2 2016,” January 2016.

2016 ITA Renewable Energy Top Markets Report | 64
93 PV Magazine, “Japan solar auctions approved by cabinet,” 9 February 2016. 94 Bloomberg New Energy Finance, “Japan Toughens Rules for Renewable Energy Incentive Payments” 18 December 2014. 95 Business Monitor International, “Japan Renewables Report Q2 2016,” January 2016. 96 Business Monitor International, “Japan Renewables Report,” 16 October 2014. 97 Ibid. 98 Bloomberg New Energy Finance, “H1 2013 Japan Market Outlook: FIT Drives Solar Surge,” 21 June 2013. 99 Bloomberg New Energy Finance, “H1 2012 Japan Market Outlook.” 100 Bloomberg New Energy Finance, “H1 2013 Japan Market Outlook: FIT Drives Solar Surge,” 21 June 2013. 101 Ibid. 102 Business Monitor International, “Mexico Renewables Report Q2 2016,” February 2016. 103 Business Monitor International, “Mexico Renewables Report Q2 2016,” February 2016. 104 Bloomberg New Energy Finance, “H2 2015 Mexico and Central America Market Outlook,” 23 December 2015. 105 Business Monitor International, “Mexico Renewables Report Q2 2016,” February 2016. 106 Bloomberg New Energy Finance, “Climatescope 2013.” 107 Business Monitor International, “Mexico Renewables Report Q2 2016,” February 2016. 108 Bloomberg New Energy Finance Insight, “What to Expect from Mexico’s First Auction,” March 18, 2016. 109 Bloomberg New Energy Finance Insight, “Mexico Auction Results in Record Low PV Prices,” March 31, 2016. 110 Business Monitor International, “Mexico Renewables Report Q2 2016,” February 2016. 111 Inter-American Development Bank press release, June 2, 2014, “Mexico to develop a Risk Mitigation Program for private geothermal energy projects with support from the IDB” http://www.iadb.org/en/news/news-releases/2014-06-02/mexico-to-develop-geothermal-energy-with-idb-support,10830.html 112 Business Monitor International, “South Africa Renewables Report Q2 2016,” January 2016. 113 Bloomberg New Energy Finance, “H1 2015 Sub-Saharan Africa Market Outlook,” 19 February 2015. 114 Monteiro, Ana. Bloomberg Business, “South Africa Doubles Plans for Renewable Energy on Program Wins.” December 2014. http://www.bloomberg.com/news/articles/2014-12-12/south-africa-doubles-plans-for-renewable-energy-on-program-wins. 115 Bloomberg New Energy Finance, “H1 2015 Sub-Saharan Africa Market Outlook,” 19 February 2015. 116 Republic of South Africa, “Draft Carbon Tax Bill.” http://www.treasury.gov.za/public%20comments/CarbonTaxBill2015/Carbon%20Tax%20Bill%20final%20for%20release%20for%20comment.pdf 117 Business Monitor International, “South Africa Renewables Report Q2 2016,” January 2016. 118 International Energy Agency, “Africa Energy Outlook 2014.” http://www.iea.org/publications/freepublications/publication/WEO2014_AfricaEnergyOutlook.pdf 119 PV Magazine, “SunPower to build 160 MW panel fab in South Africa.” http://www.pv-magazine.com/news/details/beitrag/sunpower-to-build-160-mw-panel-fab-in-south-africa_100017053/#axzz43fToXf3M

U.S. Department of Commerce | International Trade Administration | Industry & Analysis (I&A)
Industry & Analysis’ (I&A) staff of industry, trade and economic analysts devise and implement international trade, investment, and export promotion strategies that strengthen the global competitiveness of U.S. industries. These initiatives unlock export, and investment opportunities for U.S. businesses by combining in-depth quantitative and qualitative analysis with ITA’s industry relationships.
For more information, visit www.trade.gov/industry
I&A is part of the International Trade Administration, Whose mission is to create prosperity by strengthening the competitiveness of U.S. industry, promoting trade and investment, and ensuring fair trade and compliance with trade laws and agreements.