MSc Financial Markets Financial Markets and Regulation MSc Finance Financial Markets and Crises
2016 Top Markets ReportFinancial Technology
A Market Assessment Tool for U.S. Exporters
U.S. Department of Commerce | International Trade Administration | Industry & Analysis (I&A)
August 2016
Industry & Analysis’ (I&A) staff of industry, trade and economic analysts
devise and implement international trade, investment, and export
promotion strategies that strengthen the global competitiveness of U.S.
industries. These initiatives unlock export, and investment opportunities
for U.S. businesses by combining in‐depth quantitative and qualitative
analysis with ITA’s industry relationships.
For more information, visit www.trade.gov/industry
I&A is part of the International Trade Administration, whose mission is to
create prosperity by strengthening the competitiveness of U.S. industry,
promoting trade and investment, and ensuring fair trade and compliance
with trade laws and agreements.
Scott Schmith served as the lead author on this report. Vincent Tran and
Tino Perera of the Office of Finance and Insurance Industries were co‐
authors and major contributors. The team would like to thank Karen
Ballard, Duncan Archibald, Ryan Hollowell, and Sweehoon Chia of the U.S.
Commercial Service and Alex deKeyserling for their gracious support.
2016 ITA FinTech Top Markets Report | 1
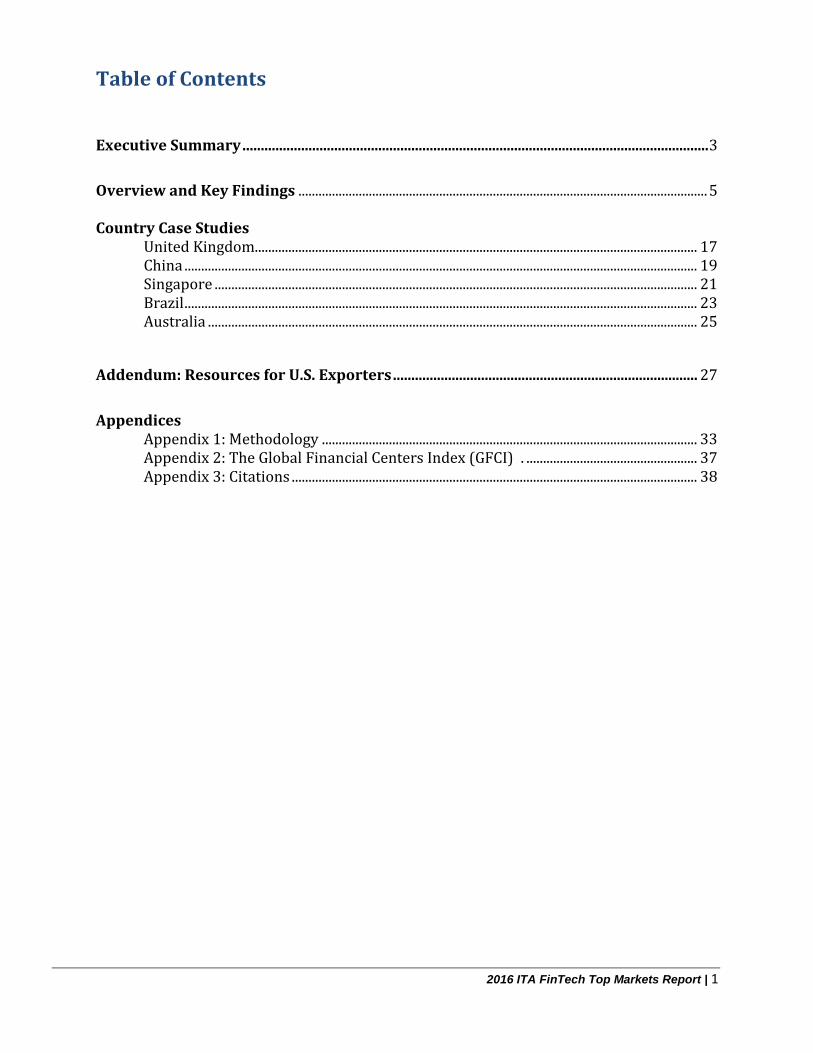
Table of Contents
Executive Summary ............................................................................................................................... 3
Overview and Key Findings .......................................................................................................................... 5 Country Case Studies
United Kingdom.................................................................................................................................... 17 China ......................................................................................................................................................... 19 Singapore ................................................................................................................................................ 21 Brazil ......................................................................................................................................................... 23 Australia .................................................................................................................................................. 25
Addendum: Resources for U.S. Exporters ................................................................................... 27
Appendices
Appendix 1: Methodology ................................................................................................................ 33 Appendix 2: The Global Financial Centers Index (GFCI) . ................................................... 37 Appendix 3: Citations ......................................................................................................................... 38

2016 ITA FinTech Top Markets Report | 2
This Page Intentionally Left Blank
2016 ITA FinTech Top Markets Report | 3
Executive Summary The emergence of financial technology companies (FinTech) –companies whose line of business combines software and technology to deliver financial services – will reshape and improve finance by cutting costs and expanding access to financial services. FinTech companies can create a more diverse and stable credit landscape by gathering data from social-media and other sources to assess the needs of young businesses and borrowers on the fringes of the banking system.
From payments to wealth management, from marketplace lending to equity crowdfunding, a new generation of startups is emerging within the FinTech sector, with firms attracting $19 billion in investment in 2015 (up from $12 billion in 2014). Goldman Sachs forecasts that over $4.7 trillion of revenue at traditional financial services companies is at risk of disruption by the new FinTech entrants. There are several factors that help explain FinTech’s emergence as a growth sector, including technology (social networks, big data), a favorable regulatory environment and demographics (rise of the millennials) that may give FinTech options an increasing advantage over traditional financial services.
1
Sectors
There are four main roles that financial services companies perform in any economy: 1) facilitate payments, 2) create credit, 3) manage wealth and 4) manage risk.
2 Within the FinTech sector, payment services have the highest
acceptance, followed by savings and investments, insurance services and online lending.3
Overview of Rankings and Methodology
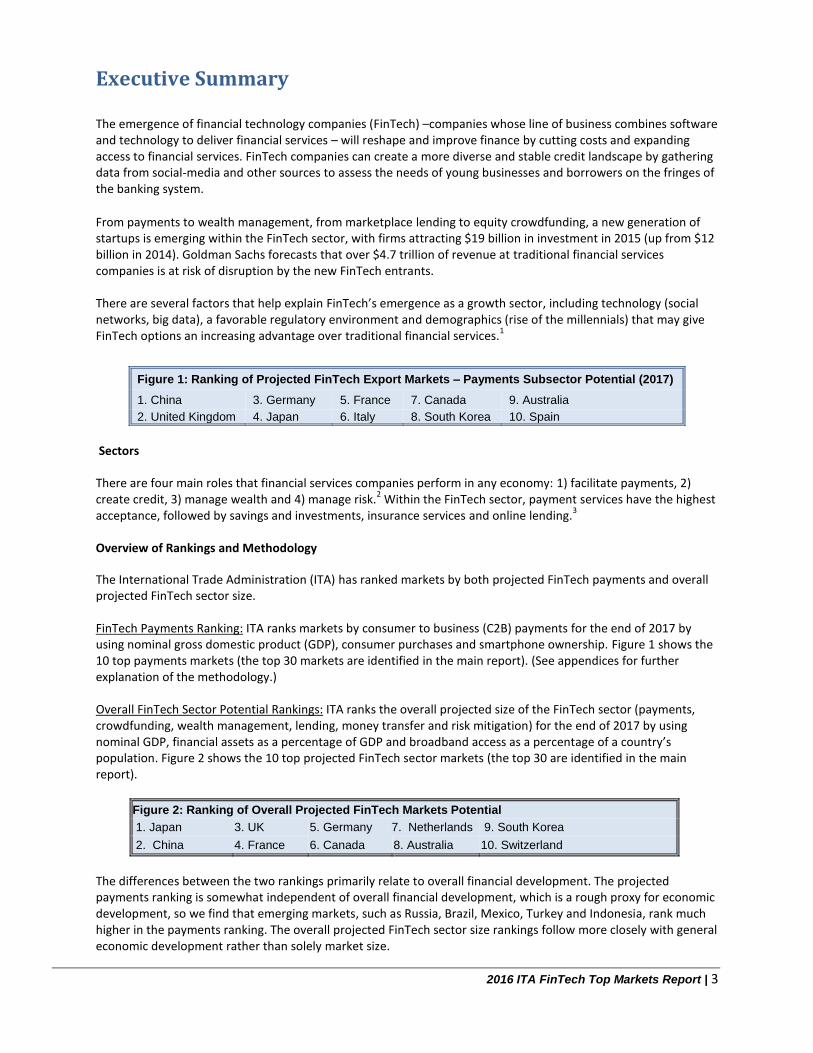
The International Trade Administration (ITA) has ranked markets by both projected FinTech payments and overall projected FinTech sector size. FinTech Payments Ranking: ITA ranks markets by consumer to business (C2B) payments for the end of 2017 by using nominal gross domestic product (GDP), consumer purchases and smartphone ownership. Figure 1 shows the 10 top payments markets (the top 30 markets are identified in the main report). (See appendices for further explanation of the methodology.)
Overall FinTech Sector Potential Rankings: ITA ranks the overall projected size of the FinTech sector (payments, crowdfunding, wealth management, lending, money transfer and risk mitigation) for the end of 2017 by using nominal GDP, financial assets as a percentage of GDP and broadband access as a percentage of a country’s population. Figure 2 shows the 10 top projected FinTech sector markets (the top 30 are identified in the main report).
Figure 2: Ranking of Overall Projected FinTech Markets Potential
1. Japan 3. UK 5. Germany 7. Netherlands 9. South Korea
2. China 4. France 6. Canada 8. Australia 10. Switzerland
The differences between the two rankings primarily relate to overall financial development. The projected payments ranking is somewhat independent of overall financial development, which is a rough proxy for economic development, so we find that emerging markets, such as Russia, Brazil, Mexico, Turkey and Indonesia, rank much higher in the payments ranking. The overall projected FinTech sector size rankings follow more closely with general economic development rather than solely market size.
Figure 1: Ranking of Projected FinTech Export Markets – Payments Subsector Potential (2017)
1. China 3. Germany 5. France 7. Canada 9. Australia
2. United Kingdom 4. Japan 6. Italy 8. South Korea 10. Spain
2016 ITA FinTech Top Markets Report | 4
The infrastructure needed to support a vibrant FinTech sector includes telecommunications, widespread electronic payment acceptance devices, big-data-supported credit information systems, consumer education and sound and efficient regulations that support innovation and provide sufficient consumer protection.
An emerging FinTech market with cities known for their strength in the financial sector is better positioned than a similar country without such financial centers. A financial center is typically home to a cluster of nationally or internationally significant financial services providers, such as banks, investment managers or stock exchanges that funnel investment towards innovation and growth. These centers are an important determiner for FinTech activity as they connect industries and activities to broader global financial networks. Product awareness and general financial literacy are important for the growth of FinTech within a market. Understanding a country’s consumer culture is also important for U.S. FinTech companies looking to enter a new international market.
Government Action
Regulations need to support a sound FinTech system by addressing consumer protection issues and promoting competition in the marketplace. There is also the danger of the regulatory environment becoming less favorable to FinTech companies. If regulations ease for traditional financial services companies or tighten for emerging ones, the balance of growth could change dramatically.
4
The United States remains a premier destination to develop a FinTech business due to the size of its market, availability of technology and vibrant entrepreneurial ecosystem. As such, U.S. fintech companies are globally competitive.
The U.S. government (USG) can play a role in stimulating greater U.S. competiveness in FinTech export markets through participation in trade and investment agreements.
The USG, through the United States Agency for International Development (USAID) or other USG technical assistance programs, could also support U.S. FinTech companies focused on smaller or less-developed markets. By working with governments, USAID facilitates the development of institutions and infrastructures to bolster many market sectors, including FinTech.
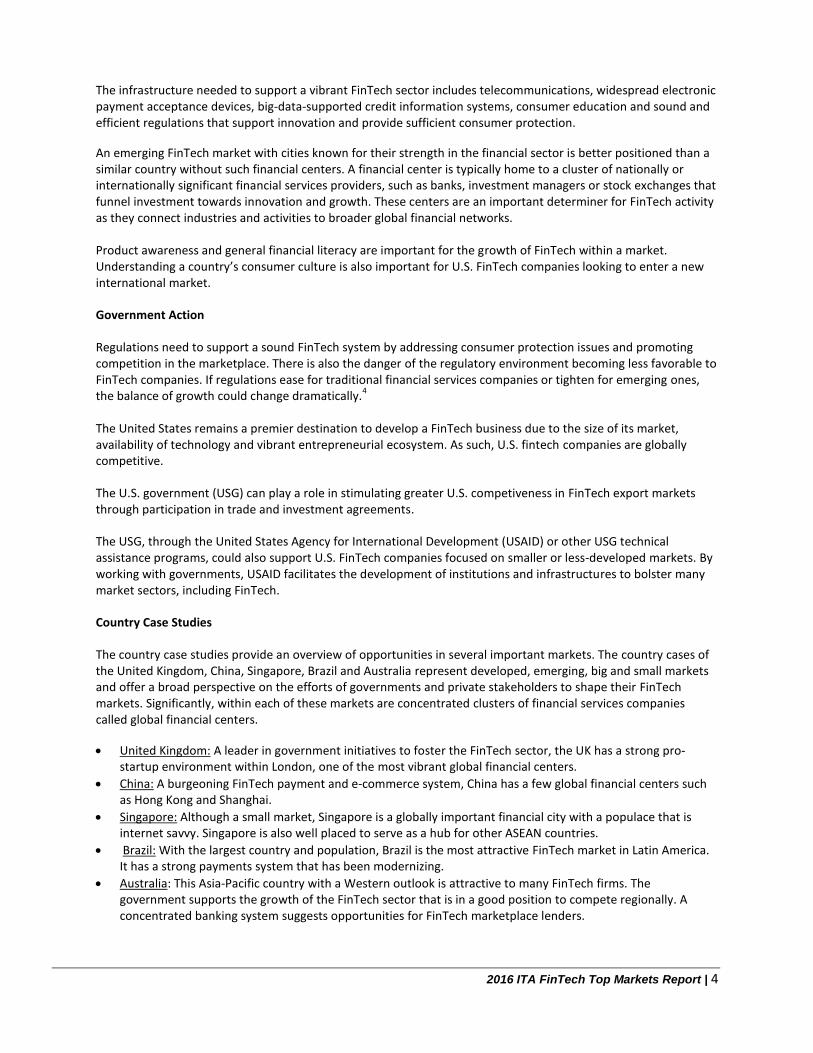
Country Case Studies
The country case studies provide an overview of opportunities in several important markets. The country cases of the United Kingdom, China, Singapore, Brazil and Australia represent developed, emerging, big and small markets and offer a broad perspective on the efforts of governments and private stakeholders to shape their FinTech markets. Significantly, within each of these markets are concentrated clusters of financial services companies called global financial centers.
United Kingdom: A leader in government initiatives to foster the FinTech sector, the UK has a strong pro-startup environment within London, one of the most vibrant global financial centers.
China: A burgeoning FinTech payment and e-commerce system, China has a few global financial centers such as Hong Kong and Shanghai.
Singapore: Although a small market, Singapore is a globally important financial city with a populace that is internet savvy. Singapore is also well placed to serve as a hub for other ASEAN countries.
Brazil: With the largest country and population, Brazil is the most attractive FinTech market in Latin America. It has a strong payments system that has been modernizing.
Australia: This Asia-Pacific country with a Western outlook is attractive to many FinTech firms. The government supports the growth of the FinTech sector that is in a good position to compete regionally. A concentrated banking system suggests opportunities for FinTech marketplace lenders.
2016 ITA FinTech Top Markets Report | 5
Overview and Key Findings Introduction The FinTech "revolution," or the merging of financial services with communications technology, promises to reshape finance by cutting costs and improving the quality of financial services, creating a more diverse and stable financial landscape.
5 From payments to
wealth management, from peer-to-peer lending to crowdfunding, a new generation of startups is emerging, with FinTech firms attracting $19 billion in investment in 201 (up from $12 billion in 2013). A 2015 survey of over 10,000 digitally active consumers suggests that adoption rates of FinTech products could double within the next 12 months.
6
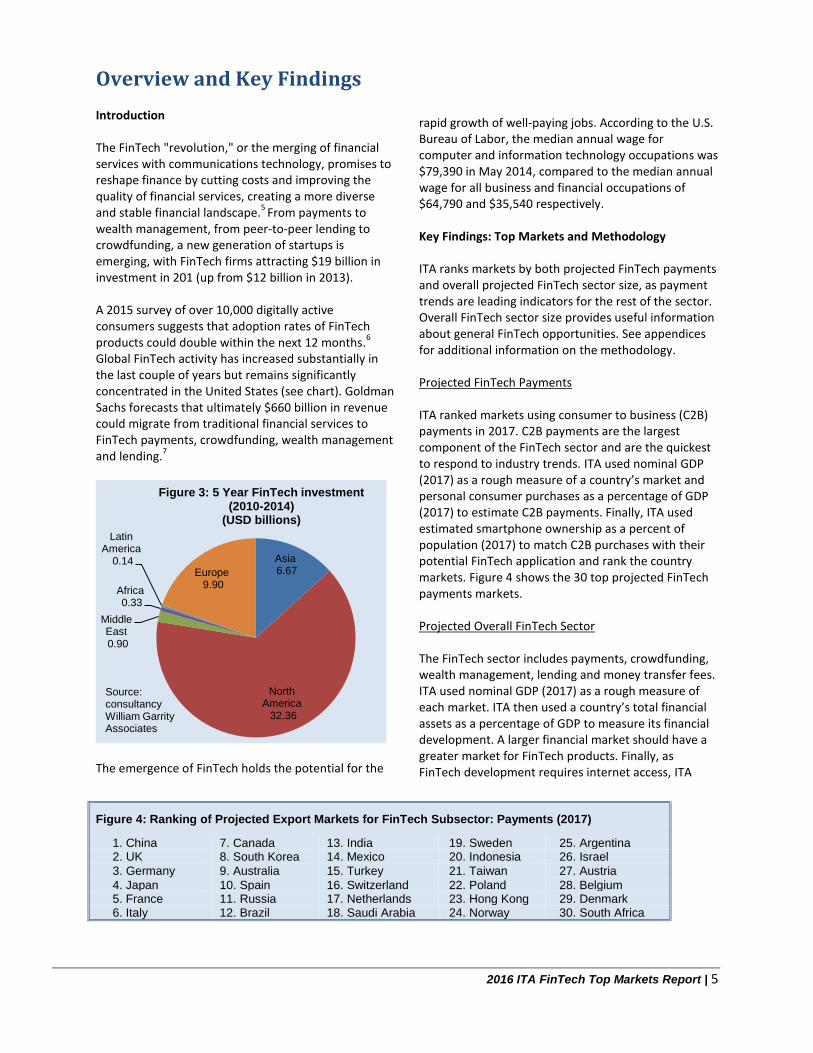
Global FinTech activity has increased substantially in the last couple of years but remains significantly concentrated in the United States (see chart). Goldman Sachs forecasts that ultimately $660 billion in revenue could migrate from traditional financial services to FinTech payments, crowdfunding, wealth management and lending.
7
The emergence of FinTech holds the potential for the
rapid growth of well-paying jobs. According to the U.S. Bureau of Labor, the median annual wage for computer and information technology occupations was $79,390 in May 2014, compared to the median annual wage for all business and financial occupations of $64,790 and $35,540 respectively. Key Findings: Top Markets and Methodology ITA ranks markets by both projected FinTech payments and overall projected FinTech sector size, as payment trends are leading indicators for the rest of the sector. Overall FinTech sector size provides useful information about general FinTech opportunities. See appendices for additional information on the methodology. Projected FinTech Payments ITA ranked markets using consumer to business (C2B) payments in 2017. C2B payments are the largest component of the FinTech sector and are the quickest to respond to industry trends. ITA used nominal GDP (2017) as a rough measure of a country’s market and personal consumer purchases as a percentage of GDP (2017) to estimate C2B payments. Finally, ITA used estimated smartphone ownership as a percent of population (2017) to match C2B purchases with their potential FinTech application and rank the country markets. Figure 4 shows the 30 top projected FinTech payments markets. Projected Overall FinTech Sector The FinTech sector includes payments, crowdfunding, wealth management, lending and money transfer fees. ITA used nominal GDP (2017) as a rough measure of each market. ITA then used a country’s total financial assets as a percentage of GDP to measure its financial development. A larger financial market should have a greater market for FinTech products. Finally, as FinTech development requires internet access, ITA
Asia 6.67
North America 32.36
Middle East 0.90
Africa 0.33
Latin America
0.14 Europe 9.90
Figure 3: 5 Year FinTech investment (2010-2014)
(USD billions)
Source: consultancy William Garrity Associates
Figure 4: Ranking of Projected Export Markets for FinTech Subsector: Payments (2017) 1. China 7. Canada 13. India 19. Sweden 25. Argentina 2. UK 8. South Korea 14. Mexico 20. Indonesia 26. Israel
3. Germany 9. Australia 15. Turkey 21. Taiwan 27. Austria
4. Japan 10. Spain 16. Switzerland 22. Poland 28. Belgium 5. France 11. Russia 17. Netherlands 23. Hong Kong 29. Denmark 6. Italy 12. Brazil 18. Saudi Arabia 24. Norway 30. South Africa
2016 ITA FinTech Top Markets Report | 6
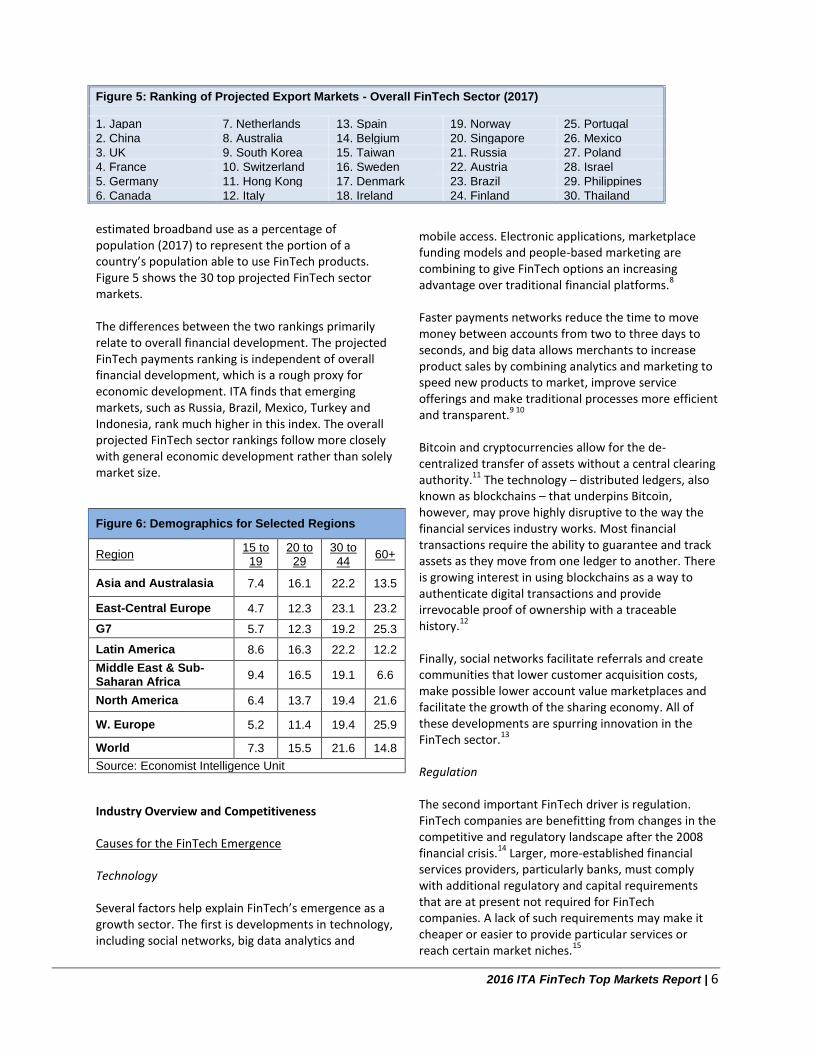
estimated broadband use as a percentage of population (2017) to represent the portion of a country’s population able to use FinTech products. Figure 5 shows the 30 top projected FinTech sector markets. The differences between the two rankings primarily relate to overall financial development. The projected FinTech payments ranking is independent of overall financial development, which is a rough proxy for economic development. ITA finds that emerging markets, such as Russia, Brazil, Mexico, Turkey and Indonesia, rank much higher in this index. The overall projected FinTech sector rankings follow more closely with general economic development rather than solely market size.
Industry Overview and Competitiveness
Causes for the FinTech Emergence
Technology Several factors help explain FinTech’s emergence as a growth sector. The first is developments in technology, including social networks, big data analytics and
mobile access. Electronic applications, marketplace funding models and people-based marketing are combining to give FinTech options an increasing advantage over traditional financial platforms.
8
Faster payments networks reduce the time to move money between accounts from two to three days to seconds, and big data allows merchants to increase product sales by combining analytics and marketing to speed new products to market, improve service offerings and make traditional processes more efficient and transparent.
9 10
Bitcoin and cryptocurrencies allow for the de-centralized transfer of assets without a central clearing authority.
11 The technology – distributed ledgers, also
known as blockchains – that underpins Bitcoin, however, may prove highly disruptive to the way the financial services industry works. Most financial transactions require the ability to guarantee and track assets as they move from one ledger to another. There is growing interest in using blockchains as a way to authenticate digital transactions and provide irrevocable proof of ownership with a traceable history.
12
Finally, social networks facilitate referrals and create communities that lower customer acquisition costs, make possible lower account value marketplaces and facilitate the growth of the sharing economy. All of these developments are spurring innovation in the FinTech sector.
13
Regulation
The second important FinTech driver is regulation. FinTech companies are benefitting from changes in the competitive and regulatory landscape after the 2008 financial crisis.
14 Larger, more-established financial
services providers, particularly banks, must comply with additional regulatory and capital requirements that are at present not required for FinTech companies. A lack of such requirements may make it cheaper or easier to provide particular services or reach certain market niches.
15
Figure 5: Ranking of Projected Export Markets - Overall FinTech Sector (2017)
1. Japan 7. Netherlands 13. Spain 19. Norway 25. Portugal
2. China 8. Australia 14. Belgium 20. Singapore 26. Mexico
3. UK 9. South Korea 15. Taiwan 21. Russia 27. Poland
4. France 10. Switzerland 16. Sweden 22. Austria 28. Israel
5. Germany 11. Hong Kong 17. Denmark 23. Brazil 29. Philippines
6. Canada 12. Italy 18. Ireland 24. Finland 30. Thailand
Figure 6: Demographics for Selected Regions
Region 15 to
19 20 to
29 30 to
44 60+
Asia and Australasia 7.4 16.1 22.2 13.5
East-Central Europe 4.7 12.3 23.1 23.2
G7 5.7 12.3 19.2 25.3
Latin America 8.6 16.3 22.2 12.2
Middle East & Sub-Saharan Africa
9.4 16.5 19.1 6.6
North America 6.4 13.7 19.4 21.6
W. Europe 5.2 11.4 19.4 25.9
World 7.3 15.5 21.6 14.8
Source: Economist Intelligence Unit
2016 ITA FinTech Top Markets Report | 7
All financial services companies, including FinTech companies, also benefit from strong consumer protections that help insulate consumers from fraudulent charges and identity theft.
Demographics
The third factor driving FinTech’s growth is favorable demographics. Increasing mobile-first habits, the willingness of consumers to share experiences and the desire for very specific information characterize the millennial demographic (roughly those between the age of 18 and 34). Millennials constitute a significant portion of the population in most countries.
16
A 2014 survey on consumers and mobile financial services indicates that mobile banking use (among those that have both mobile phones and bank accounts) is 60 percent for those in the 18-to-29 age range and 54 percent for those in the 30-to-44 age group. By comparison, only 13 percent of individuals age 60 or older reported having used mobile banking.
17
Another survey found that the use of FinTech services is greatest among younger, wealthier customers. Early FinTech adopters tend to be younger, urban and higher-income customers.
18 Figure 6 on page 6 roughly
shows how developing market demographics (compared to the G7 countries) favor these trends.
Transition from Cash Economy
Before smart phones and social networks, governments’ decisions on how to pay their transfer payments were already driving trends in the FinTech sector. Only 25 percent of developing countries process their cash transactions and social benefits electronically, yet 90 percent of governments see the
need to improve the overall efficiency of their payment systems.
19 The World Bank found that governments
can save up to 75 percent by using electronic payment programs to eliminate the handling, transportation and distribution fees associated with cash-based payments and help eliminate the risk of fraud and theft. Electronic payments reduce corruption, increase accountability and are quicker in response to a natural disaster.
20 Electronic payments also expand the
consumer market, increase banking access to the unbanked, improve macroeconomic efficiency and encourage entrepreneurial activity.
21
FinTech Subsectors
There are four main roles that financial services companies perform in any economy: facilitate payments, create credit, manage wealth and manage risk.
22
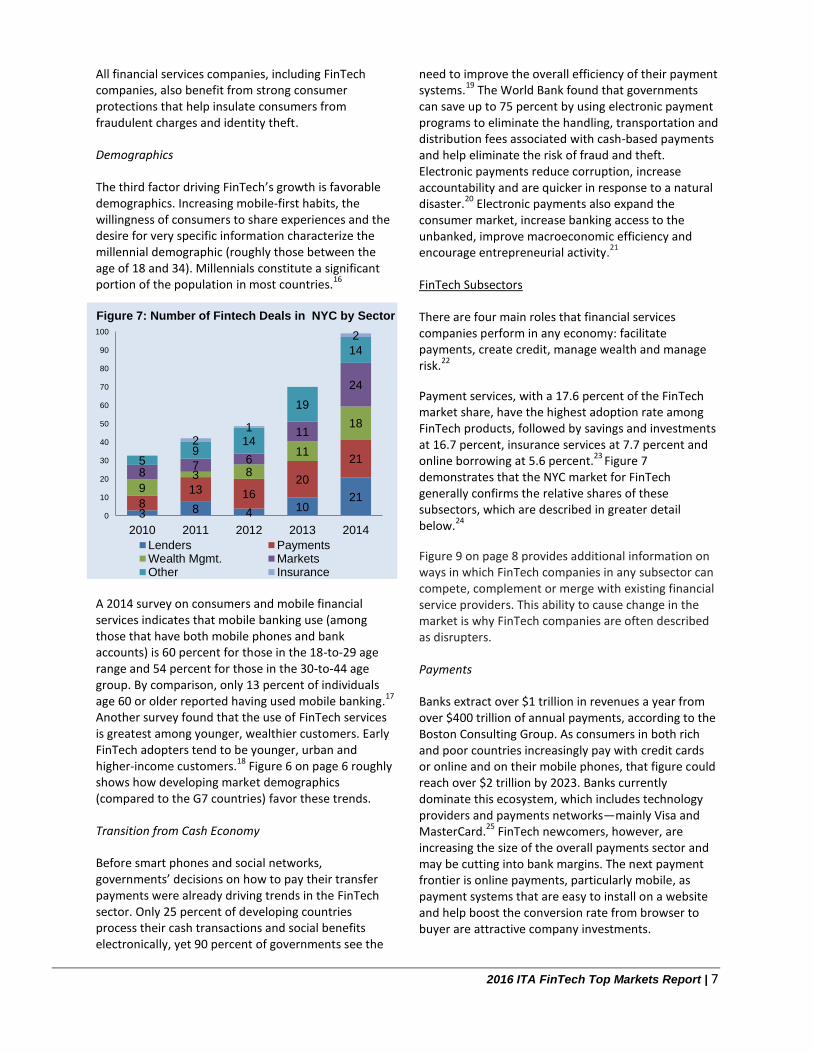
Payment services, with a 17.6 percent of the FinTech market share, have the highest adoption rate among FinTech products, followed by savings and investments at 16.7 percent, insurance services at 7.7 percent and online borrowing at 5.6 percent.
23 Figure 7
demonstrates that the NYC market for FinTech generally confirms the relative shares of these subsectors, which are described in greater detail below.
24
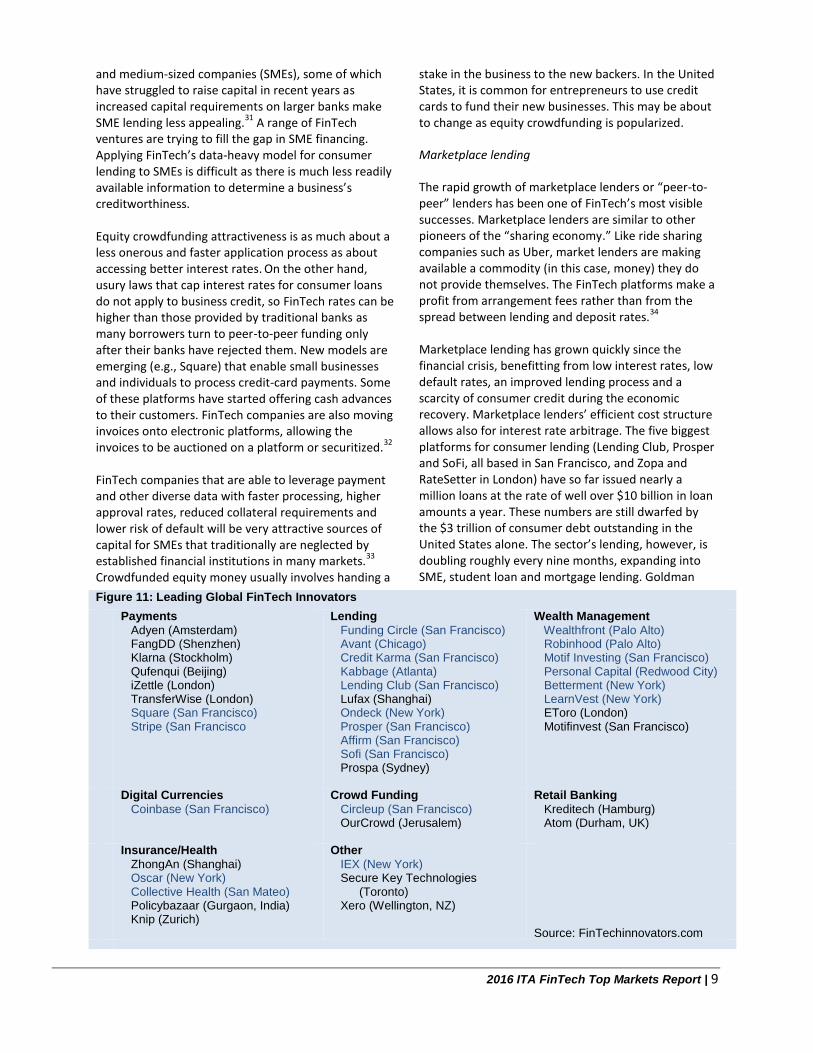
Figure 9 on page 8 provides additional information on ways in which FinTech companies in any subsector can compete, complement or merge with existing financial service providers. This ability to cause change in the market is why FinTech companies are often described as disrupters.
Payments
Banks extract over $1 trillion in revenues a year from over $400 trillion of annual payments, according to the Boston Consulting Group. As consumers in both rich and poor countries increasingly pay with credit cards or online and on their mobile phones, that figure could reach over $2 trillion by 2023. Banks currently dominate this ecosystem, which includes technology providers and payments networks—mainly Visa and MasterCard.
25 FinTech newcomers, however, are
increasing the size of the overall payments sector and may be cutting into bank margins. The next payment frontier is online payments, particularly mobile, as payment systems that are easy to install on a website and help boost the conversion rate from browser to buyer are attractive company investments.
3 8 4 10 21
8 13 16
20
21
9 3 8
11
18
8 7
6
11
24
5 9
14
19
14
2 1
2
0
10
20
30
40
50
60
70
80
90
100
2010 2011 2012 2013 2014
Lenders PaymentsWealth Mgmt. MarketsOther Insurance
Figure 7: Number of Fintech Deals in NYC by Sector
2016 ITA FinTech Top Markets Report | 8
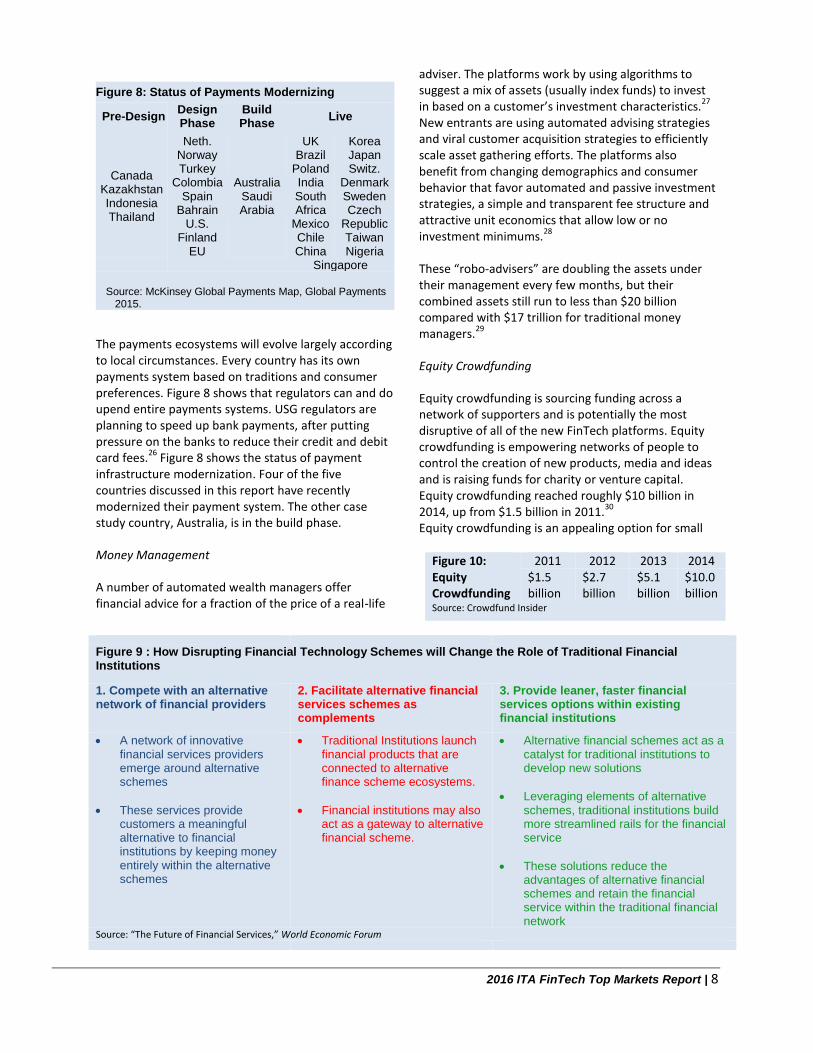
The payments ecosystems will evolve largely according to local circumstances. Every country has its own payments system based on traditions and consumer preferences. Figure 8 shows that regulators can and do upend entire payments systems. USG regulators are planning to speed up bank payments, after putting pressure on the banks to reduce their credit and debit card fees.
26 Figure 8 shows the status of payment
infrastructure modernization. Four of the five countries discussed in this report have recently modernized their payment system. The other case study country, Australia, is in the build phase.
Money Management
A number of automated wealth managers offer financial advice for a fraction of the price of a real-life
adviser. The platforms work by using algorithms to suggest a mix of assets (usually index funds) to invest in based on a customer’s investment characteristics.
27
New entrants are using automated advising strategies and viral customer acquisition strategies to efficiently scale asset gathering efforts. The platforms also benefit from changing demographics and consumer behavior that favor automated and passive investment strategies, a simple and transparent fee structure and attractive unit economics that allow low or no investment minimums.
28
These “robo-advisers” are doubling the assets under their management every few months, but their combined assets still run to less than $20 billion compared with $17 trillion for traditional money managers.
29
Equity Crowdfunding
Equity crowdfunding is sourcing funding across a network of supporters and is potentially the most disruptive of all of the new FinTech platforms. Equity crowdfunding is empowering networks of people to control the creation of new products, media and ideas and is raising funds for charity or venture capital. Equity crowdfunding reached roughly $10 billion in 2014, up from $1.5 billion in 2011.
30
Equity crowdfunding is an appealing option for small
Figure 8: Status of Payments Modernizing
Pre-Design Design Phase
Build Phase
Live
Canada Kazakhstan Indonesia Thailand
Neth. Norway Turkey
Colombia Spain
Bahrain U.S.
Finland EU
Australia Saudi Arabia
UK Brazil
Poland India South Africa
Mexico Chile China
Korea Japan Switz.
Denmark Sweden Czech
Republic Taiwan Nigeria
Singapore Source: McKinsey Global Payments Map, Global Payments
2015.
Figure 9 : How Disrupting Financial Technology Schemes will Change the Role of Traditional Financial Institutions
1. Compete with an alternative network of financial providers
2. Facilitate alternative financial services schemes as complements
3. Provide leaner, faster financial services options within existing financial institutions
A network of innovative financial services providers emerge around alternative schemes
These services provide customers a meaningful alternative to financial institutions by keeping money entirely within the alternative schemes
Traditional Institutions launch financial products that are connected to alternative finance scheme ecosystems.
Financial institutions may also act as a gateway to alternative financial scheme.
Alternative financial schemes act as a catalyst for traditional institutions to develop new solutions
Leveraging elements of alternative schemes, traditional institutions build more streamlined rails for the financial service
These solutions reduce the advantages of alternative financial schemes and retain the financial service within the traditional financial network
Source: “The Future of Financial Services,” World Economic Forum
Figure 10: Equity Crowdfunding
2011 2012 2013 2014 $1.5 billion
$2.7 billion
$5.1 billion
$10.0 billion
Source: Crowdfund Insider
2016 ITA FinTech Top Markets Report | 9
and medium-sized companies (SMEs), some of which have struggled to raise capital in recent years as increased capital requirements on larger banks make SME lending less appealing.
31 A range of FinTech
ventures are trying to fill the gap in SME financing. Applying FinTech’s data-heavy model for consumer lending to SMEs is difficult as there is much less readily available information to determine a business’s creditworthiness. Equity crowdfunding attractiveness is as much about a less onerous and faster application process as about accessing better interest rates.
On the other hand,
usury laws that cap interest rates for consumer loans do not apply to business credit, so FinTech rates can be higher than those provided by traditional banks as many borrowers turn to peer-to-peer funding only after their banks have rejected them. New models are emerging (e.g., Square) that enable small businesses and individuals to process credit-card payments. Some of these platforms have started offering cash advances to their customers. FinTech companies are also moving invoices onto electronic platforms, allowing the invoices to be auctioned on a platform or securitized.
32
FinTech companies that are able to leverage payment and other diverse data with faster processing, higher approval rates, reduced collateral requirements and lower risk of default will be very attractive sources of capital for SMEs that traditionally are neglected by established financial institutions in many markets.
33
Crowdfunded equity money usually involves handing a
stake in the business to the new backers. In the United States, it is common for entrepreneurs to use credit cards to fund their new businesses. This may be about to change as equity crowdfunding is popularized.
Marketplace lending
The rapid growth of marketplace lenders or “peer-to-peer” lenders has been one of FinTech’s most visible successes. Marketplace lenders are similar to other pioneers of the “sharing economy.” Like ride sharing companies such as Uber, market lenders are making available a commodity (in this case, money) they do not provide themselves. The FinTech platforms make a profit from arrangement fees rather than from the spread between lending and deposit rates.
34
Marketplace lending has grown quickly since the financial crisis, benefitting from low interest rates, low default rates, an improved lending process and a scarcity of consumer credit during the economic recovery. Marketplace lenders’ efficient cost structure allows also for interest rate arbitrage. The five biggest platforms for consumer lending (Lending Club, Prosper and SoFi, all based in San Francisco, and Zopa and RateSetter in London) have so far issued nearly a million loans at the rate of well over $10 billion in loan amounts a year. These numbers are still dwarfed by the $3 trillion of consumer debt outstanding in the United States alone. The sector’s lending, however, is doubling roughly every nine months, expanding into SME, student loan and mortgage lending. Goldman
Figure 11: Leading Global FinTech Innovators
Payments
Adyen (Amsterdam) FangDD (Shenzhen) Klarna (Stockholm) Qufenqui (Beijing) iZettle (London) TransferWise (London) Square (San Francisco) Stripe (San Francisco
Lending
Funding Circle (San Francisco) Avant (Chicago) Credit Karma (San Francisco) Kabbage (Atlanta) Lending Club (San Francisco) Lufax (Shanghai) Ondeck (New York) Prosper (San Francisco) Affirm (San Francisco) Sofi (San Francisco) Prospa (Sydney)
Wealth Management
Wealthfront (Palo Alto) Robinhood (Palo Alto) Motif Investing (San Francisco) Personal Capital (Redwood City) Betterment (New York) LearnVest (New York) EToro (London) Motifinvest (San Francisco)
Digital Currencies
Coinbase (San Francisco)
Crowd Funding
Circleup (San Francisco) OurCrowd (Jerusalem)
Retail Banking
Kreditech (Hamburg) Atom (Durham, UK)
Insurance/Health
ZhongAn (Shanghai) Oscar (New York) Collective Health (San Mateo) Policybazaar (Gurgaon, India) Knip (Zurich)
Other
IEX (New York) Secure Key Technologies
(Toronto) Xero (Wellington, NZ)
Source: FinTechinnovators.com
2016 ITA FinTech Top Markets Report | 10
Sachs estimates that when the marketplace lending industry comes of age, it could reduce profits at America’s banks by $11 billion, or 7 percent.
35
Although most of the money for marketplace lending comes from institutional investors, the FinTech model is very different from a regulatory point of view, as those who lend money through peer-to-peer platforms are not guaranteed by the state (unlike depository institutions deposits that support lending) and are not susceptible to runs.
36
A good example of marketplace lending's allure is using customer transaction history to underwrite loans when other credit information is scarce. In Australia, OnDeck has partnered with local companies to lend on the basis of accounting data. In China, e-commerce site JD.com recently partnered with U.S.-based ZestFinance to offer micro loans to SMEs and entrepreneurs by using machine-learning technology to score small businesses on the basis of diverse data. The result is faster processing, higher approval rates, reduced collateral requirements and lower risk of default. The customers also gain through convenience, accessible loans and favorable interest rates. By contrast, banks across Asia have traditionally neglected the SME segment, largely due to the difficulty of assessing risk. If they are not able to support market-place like lending practices, incumbent banks risk ceding dominance of this profitable segment to digital innovators.
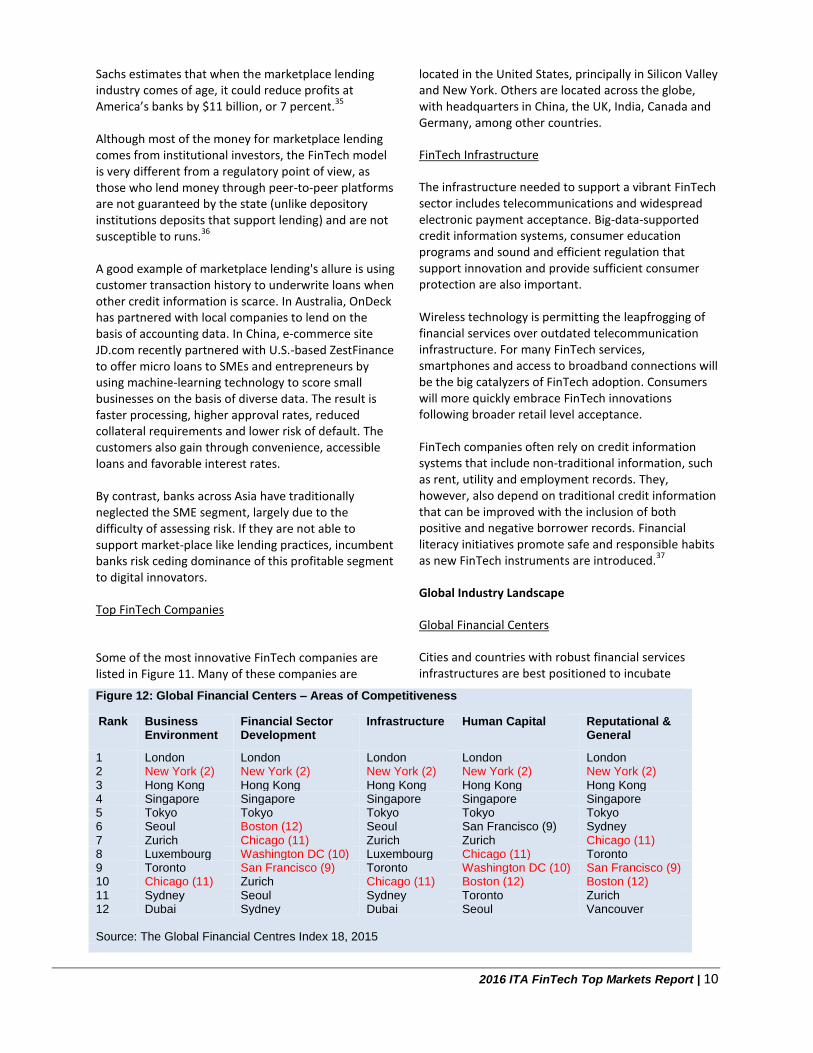
Top FinTech Companies
Some of the most innovative FinTech companies are listed in Figure 11. Many of these companies are
located in the United States, principally in Silicon Valley and New York. Others are located across the globe, with headquarters in China, the UK, India, Canada and Germany, among other countries.
FinTech Infrastructure
The infrastructure needed to support a vibrant FinTech sector includes telecommunications and widespread electronic payment acceptance. Big-data-supported credit information systems, consumer education programs and sound and efficient regulation that support innovation and provide sufficient consumer protection are also important. Wireless technology is permitting the leapfrogging of financial services over outdated telecommunication infrastructure. For many FinTech services, smartphones and access to broadband connections will be the big catalyzers of FinTech adoption. Consumers will more quickly embrace FinTech innovations following broader retail level acceptance. FinTech companies often rely on credit information systems that include non-traditional information, such as rent, utility and employment records. They, however, also depend on traditional credit information that can be improved with the inclusion of both positive and negative borrower records. Financial literacy initiatives promote safe and responsible habits as new FinTech instruments are introduced.
37
Global Industry Landscape
Global Financial Centers
Cities and countries with robust financial services infrastructures are best positioned to incubate
Figure 12: Global Financial Centers – Areas of Competitiveness
Rank Business Environment
Financial Sector Development
Infrastructure Human Capital Reputational & General
1 London London London London London 2 New York (2) New York (2) New York (2) New York (2) New York (2) 3 Hong Kong Hong Kong Hong Kong Hong Kong Hong Kong 4 Singapore Singapore Singapore Singapore Singapore 5 Tokyo Tokyo Tokyo Tokyo Tokyo 6 Seoul Boston (12) Seoul San Francisco (9) Sydney 7 Zurich Chicago (11) Zurich Zurich Chicago (11) 8 Luxembourg Washington DC (10) Luxembourg Chicago (11) Toronto 9 Toronto San Francisco (9) Toronto Washington DC (10) San Francisco (9) 10 Chicago (11) Zurich Chicago (11) Boston (12) Boston (12) 11 Sydney Seoul Sydney Toronto Zurich 12 Dubai Sydney Dubai Seoul Vancouver Source: The Global Financial Centres Index 18, 2015
2016 ITA FinTech Top Markets Report | 11
emerging FinTech companies. A global financial center (GFC) is typically home to a cluster of nationally or internationally significant financial services providers, such as banks, investment managers, insurance companies and stock exchanges, which funnel investment towards innovation and growth. A strong financial center connects the wider economy to a global network. All five of the FinTech country cases that are highlighted in this report have at least one financial center, as recognized by an online survey. This survey also scores each financial center’s business environment, finance, infrastructure, human capital and reputation.
38
Figure 12 shows how cities rank in each of the five categories for global financial centers. The United States has several strong GFCs, including New York (#2), San Francisco (#9), Washington DC (#10), Chicago (#11) and Boston (#12).Los Angeles (#49) is also in the rankings.
Challenges and Barriers
Global Barriers for the Adaption of FinTech
Product awareness may still be an obstacle for FinTech’s growth. According to a survey for digitally active respondents who have not used two or more FinTech products in the past six months, 53 percent said they were unaware the products existed, 33 percent said that they do not have a need to use the products, 28 percent preferred to use a traditional financial services provider, and 21 percent said they do not understand how the products work. Trust, however, has not been a major obstacle to FinTech use, with only 11 percent of respondents saying they do not trust FinTech products.
39
Understanding consumer culture is also important for U.S. FinTech companies looking to enter a new market. For example, in the United States, McKinsey has identified five different consumer segments for digital wallets. According to the report, each of these niche markets requires FinTech companies to present a differentiated marketing and business approach to be successful.
40
Regulations to support a sound FinTech system include regulations addressing consumer protection issues and promoting competition in the marketplace. There is also the danger of the regulatory environment within a certain country becoming less favorable to FinTech. If regulations ease for traditional financial services companies or tighten for emerging ones, the balance of growth could change dramatically.
41
The U.S. government (USG) can play a role in stimulating greater U.S. competiveness in these markets through participation in trade and investment agreements, such as the Trans-Pacific Partnership (TPP), the Transatlantic Trade and Investment Partnership (T-TIP) and the Trade in Services Agreement (TiSA). Additionally, the United States can work to lower or remove trade barriers to FinTech business through bilateral engagement and informal dialogues in select FinTech markets.
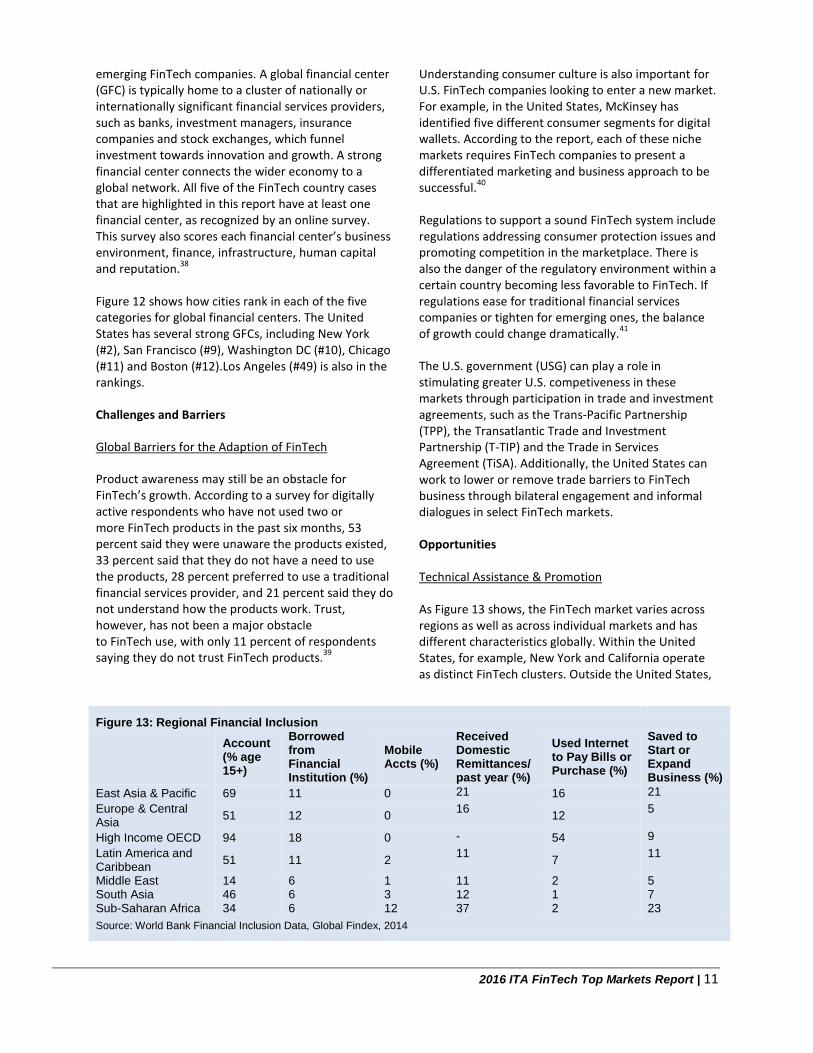
Opportunities Technical Assistance & Promotion As Figure 13 shows, the FinTech market varies across regions as well as across individual markets and has different characteristics globally. Within the United States, for example, New York and California operate as distinct FinTech clusters. Outside the United States,
Figure 13: Regional Financial Inclusion
Account (% age 15+)
Borrowed from Financial Institution (%)
Mobile Accts (%)
Received Domestic Remittances/ past year (%)
Used Internet to Pay Bills or Purchase (%)
Saved to Start or Expand Business (%)
East Asia & Pacific 69 11 0 21 16 21
Europe & Central Asia
51 12 0 16
12 5
High Income OECD 94 18 0 - 54 9
Latin America and Caribbean
51 11 2 11
7 11
Middle East 14 6 1 11 2 5 South Asia 46 6 3 12 1 7 Sub-Saharan Africa 34 6 12 37 2 23
Source: World Bank Financial Inclusion Data, Global Findex, 2014
2016 ITA FinTech Top Markets Report | 12
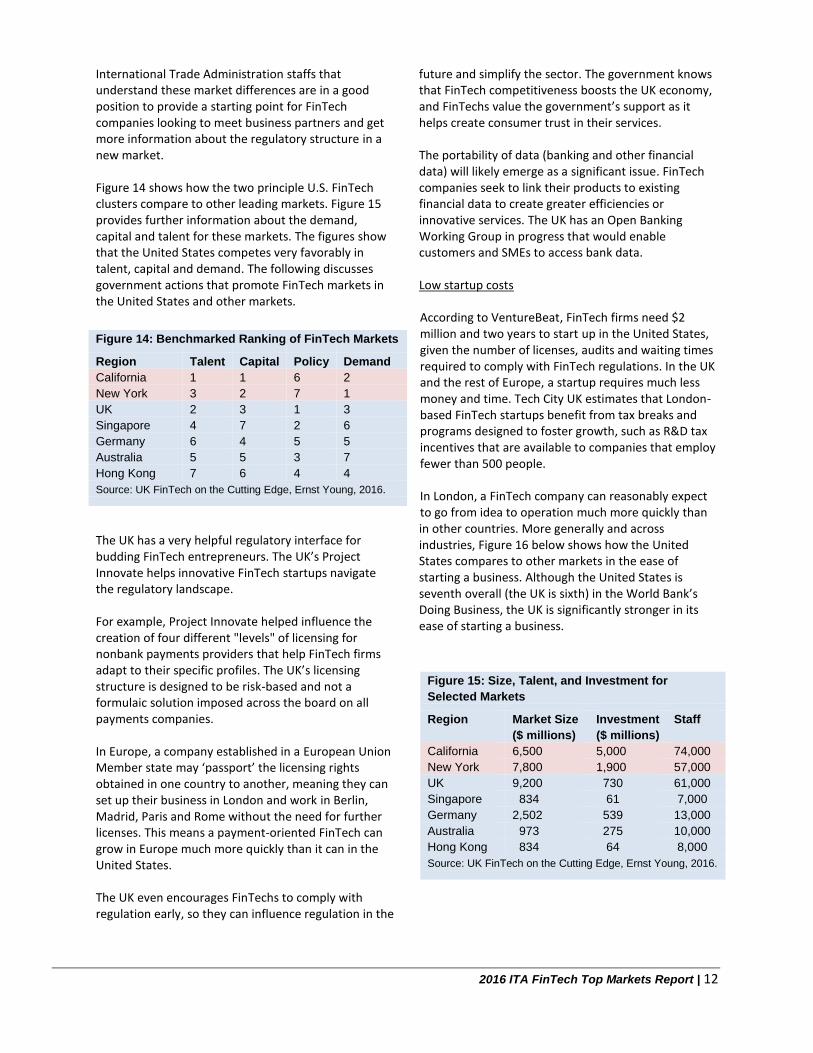
International Trade Administration staffs that understand these market differences are in a good position to provide a starting point for FinTech companies looking to meet business partners and get more information about the regulatory structure in a new market. Figure 14 shows how the two principle U.S. FinTech clusters compare to other leading markets. Figure 15 provides further information about the demand, capital and talent for these markets. The figures show that the United States competes very favorably in talent, capital and demand. The following discusses government actions that promote FinTech markets in the United States and other markets.
The UK has a very helpful regulatory interface for budding FinTech entrepreneurs. The UK’s Project Innovate helps innovative FinTech startups navigate the regulatory landscape. For example, Project Innovate helped influence the creation of four different "levels" of licensing for nonbank payments providers that help FinTech firms adapt to their specific profiles. The UK’s licensing structure is designed to be risk-based and not a formulaic solution imposed across the board on all payments companies. In Europe, a company established in a European Union Member state may ‘passport’ the licensing rights obtained in one country to another, meaning they can set up their business in London and work in Berlin, Madrid, Paris and Rome without the need for further licenses. This means a payment-oriented FinTech can grow in Europe much more quickly than it can in the United States. The UK even encourages FinTechs to comply with regulation early, so they can influence regulation in the
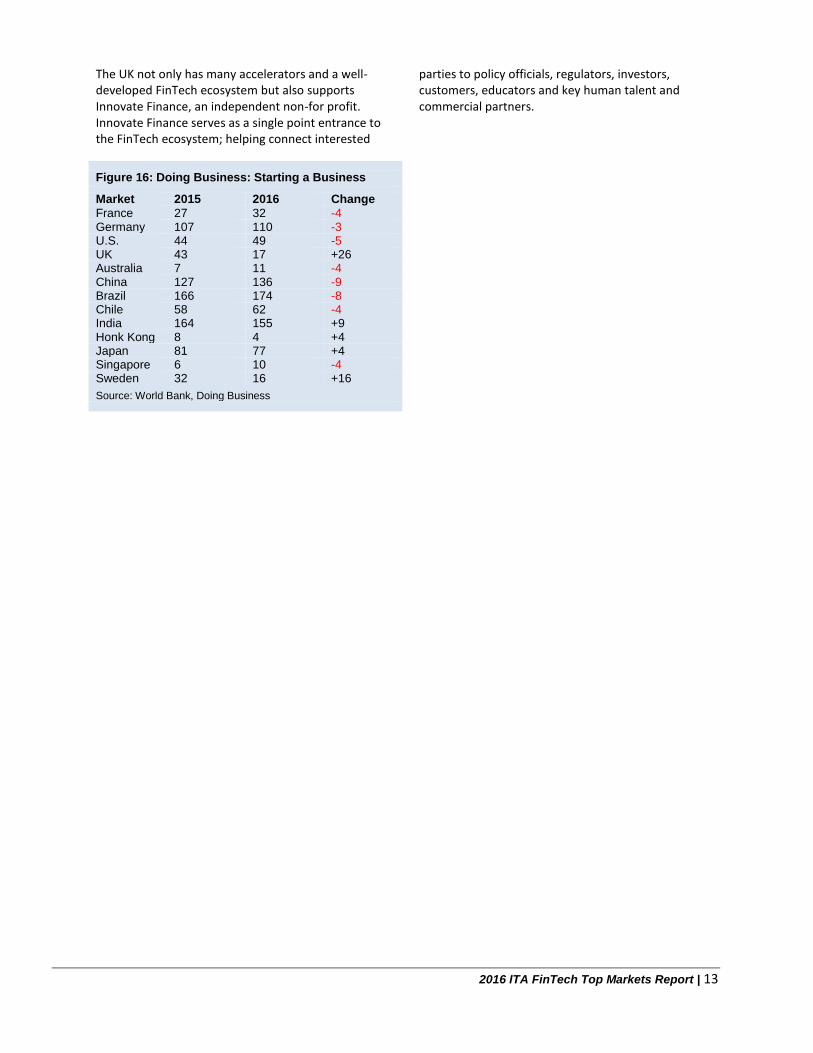
future and simplify the sector. The government knows that FinTech competitiveness boosts the UK economy, and FinTechs value the government’s support as it helps create consumer trust in their services. The portability of data (banking and other financial data) will likely emerge as a significant issue. FinTech companies seek to link their products to existing financial data to create greater efficiencies or innovative services. The UK has an Open Banking Working Group in progress that would enable customers and SMEs to access bank data. Low startup costs According to VentureBeat, FinTech firms need $2 million and two years to start up in the United States, given the number of licenses, audits and waiting times required to comply with FinTech regulations. In the UK and the rest of Europe, a startup requires much less money and time. Tech City UK estimates that London-based FinTech startups benefit from tax breaks and programs designed to foster growth, such as R&D tax incentives that are available to companies that employ fewer than 500 people. In London, a FinTech company can reasonably expect to go from idea to operation much more quickly than in other countries. More generally and across industries, Figure 16 below shows how the United States compares to other markets in the ease of starting a business. Although the United States is seventh overall (the UK is sixth) in the World Bank’s Doing Business, the UK is significantly stronger in its ease of starting a business.
Figure 14: Benchmarked Ranking of FinTech Markets
Region Talent Capital Policy Demand
California 1 1 6 2
New York 3 2 7 1
UK 2 3 1 3
Singapore 4 7 2 6
Germany 6 4 5 5
Australia 5 5 3 7
Hong Kong 7 6 4 4
Source: UK FinTech on the Cutting Edge, Ernst Young, 2016.
Figure 15: Size, Talent, and Investment for
Selected Markets
Region Market Size
($ millions)
Investment
($ millions)
Staff
California 6,500 5,000 74,000
New York 7,800 1,900 57,000
UK 9,200 730 61,000
Singapore 834 61 7,000
Germany 2,502 539 13,000
Australia 973 275 10,000
Hong Kong 834 64 8,000
Source: UK FinTech on the Cutting Edge, Ernst Young, 2016.
2016 ITA FinTech Top Markets Report | 13
The UK not only has many accelerators and a well-developed FinTech ecosystem but also supports Innovate Finance, an independent non-for profit. Innovate Finance serves as a single point entrance to the FinTech ecosystem; helping connect interested
parties to policy officials, regulators, investors, customers, educators and key human talent and commercial partners.
Figure 16: Doing Business: Starting a Business
Market 2015 2016 Change
France 27 32 -4 Germany 107 110 -3 U.S. 44 49 -5 UK 43 17 +26 Australia 7 11 -4 China 127 136 -9 Brazil 166 174 -8 Chile 58 62 -4 India 164 155 +9 Honk Kong 8 4 +4 Japan 81 77 +4 Singapore 6 10 -4 Sweden 32 16 +16
Source: World Bank, Doing Business

2016 ITA FinTech Top Markets Report | 14
This Page Intentionally Left Blank

2016 ITA FinTech Top Markets Report | 15
Country Case Studies
The following pages include country case studies that summarize export opportunities in selected markets. The overviews outline ITA’s analysis of the U.S. export potential in each market. The markets represent a range of countries to illustrate a variety of points and not the top five markets overall.

2016 ITA FinTech Top Markets Report | 16
This Page Intentionally Left Blank
2016 ITA FinTech Top Markets Report | 17
United Kingdom
Leading Financial Center According to the Global Financial Centre Index (GFCI), London is the leading GFC ranked city ahead of New York and Hong Kong. Uncertainty surrounding the UK’s referendum on its membership in the European Union, however, could have a significant impact on London as the leading financial center.
Since 2010, UK tech companies have raised $9.7 billion in financing, with London-based companies accounting for more than half of the national total. In 2015, many UK FinTech companies were involved in significant funding rounds, including Ebury, a group that helps small businesses trade internationally and raised $83 million; Funding Circle, a peer-to-peer lender that raised $150 million; and WorldRemit, a money transfer group that raised $100 million. At this time it is still too early to determine the impact of the UK’s decision to leave the European Union (Brexit) on its Fin Tech sector. Brexit effects will be based on whether the UK and EU can negotiate a productive way forward to ensure continued trade and investment.
Sectors The UK FinTech industry has historically been focused on business models that served consumers and small business lending, crowdfunding, remittances, foreign exchange, pre-paid debit cards and mobile payments.
There is now a bigger trend of FinTech firms focusing on business-to business opportunities and “back-end” financial systems in areas such as fraud detection and data analysis (“reg-tech”). This trend is supported by the British government, which has tailored its regulations to be more lax and private sector driven with the aim of nurturing this development. As the city with the headquarters for many major financial institutions, there is already an existing market in the area of IT compliance in the traditional banking system that can be a target for U.S. Fintech companies.
As of the end of 2015, UK-based FinTech unicorns (defined as a large start-up company exceeding $1 billion in market value) include TransferWise, an international money transfer service; Oscar Health, an online health insurance provider; Powa Technologies, which makes mobile payment products; and Markit, which provides financial information and data. Payments Infrastructure & Regulation The UK’s Fast Payments Services (FPS), focused on bank execution and confirmation of payment loops, has led the global shift towards efficient and faster payments. Since the implementation of the FPS program, instant payments for purchases have increased on average by 40 percent annually from 2009 to 2014 and accounted for 8 percent of total
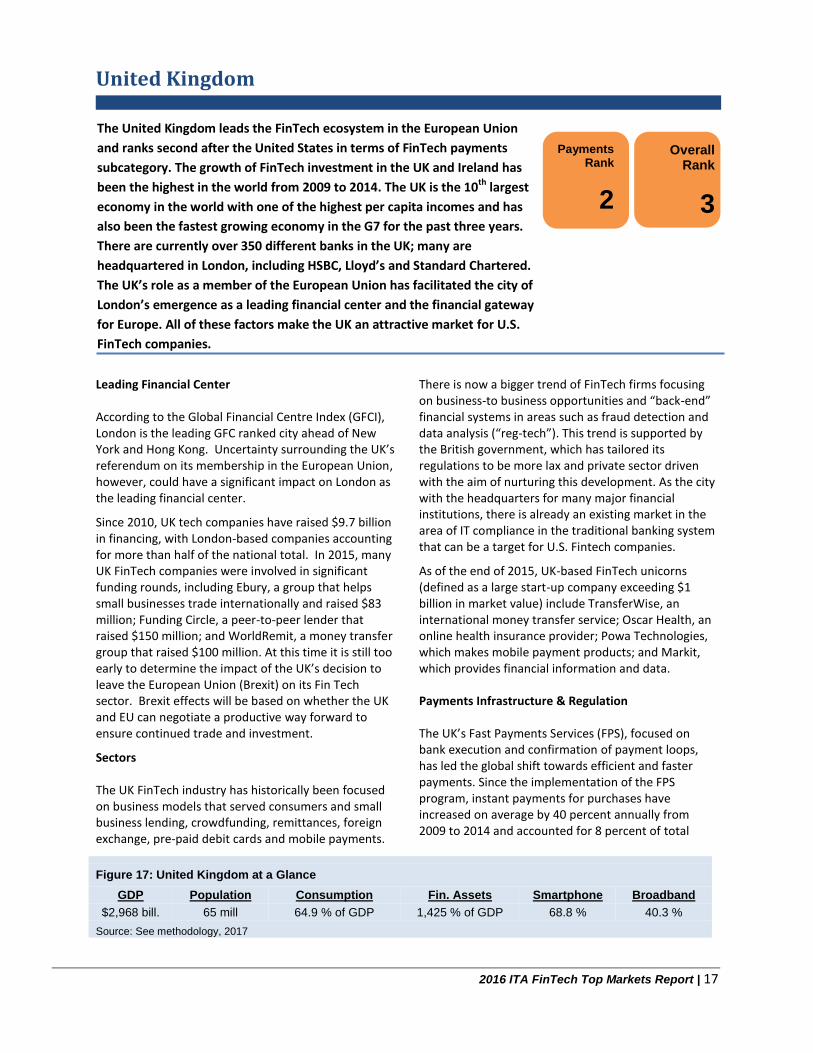
Figure 17: United Kingdom at a Glance
GDP Population Consumption Fin. Assets Smartphone Broadband
$2,968 bill. 65 mill 64.9 % of GDP 1,425 % of GDP 68.8 % 40.3 %
Source: See methodology, 2017
The United Kingdom leads the FinTech ecosystem in the European Union
and ranks second after the United States in terms of FinTech payments
subcategory. The growth of FinTech investment in the UK and Ireland has
been the highest in the world from 2009 to 2014. The UK is the 10th largest
economy in the world with one of the highest per capita incomes and has
also been the fastest growing economy in the G7 for the past three years.
There are currently over 350 different banks in the UK; many are
headquartered in London, including HSBC, Lloyd’s and Standard Chartered.
The UK’s role as a member of the European Union has facilitated the city of
London’s emergence as a leading financial center and the financial gateway
for Europe. All of these factors make the UK an attractive market for U.S.
FinTech companies.
Payments Rank
2
Overall Rank
3
2016 ITA FinTech Top Markets Report | 18
payments in the UK by the end of 2014. The system also allows consumers to purchase public services such as bus rides through smartphones or trade gift card balances via mobile payments. Most of the UK’s payments infrastructure is owned by major banks. Pingit, which enables users to send and receive payments using a mobile number, is owned by Barclays.
The UK government Financial Conduct Authority's (FCA) Project Innovate helps FinTech startups navigate the regulatory landscape. Through this program, FCA regulators provide feedback to private sector companies that are developing new business models and platforms that may fall outside current UK regulations.
The UK government has also appointed a Chief Scientific Adviser to lead a review into the future of FinTech. The review is on-going and will look at the technologies, forces and barriers that are shaping the FinTech sector through to 2025, and the policy implications for the government.
Fintech Payments
The mobile payments sector in the UK is growing rapidly due to a developed financial infrastructure, high per capita income and a technology-literate population. The UK boasts a widely deployed payment acceptance infrastructure on its transport system and enjoys high levels of consumer awareness and adoption. The market size for mobile payments in the UK is around £10bn. Two companies in this market are ApplePay and Zapp. Apple Pay entered the market in mid-2015 with mixed success. Zapp is another mobile payments FinTech company that uses FPS service infrastructure. Zapp can be integrated into existing mobile banking apps for users to make in-store and online purchases through mobile devices. Zapp uses fraud detection technology from a Cambridge University spin-off startup called Featurespace to protect users with their electronic payments.
Subsector: Marketplace Lending
According to the Bank of England, Funding Circle, a peer-to-peer lender launched in 2010, is the third-largest lender to small businesses in the UK after the Royal Bank of Scotland (RBS) and Lloyds Banking Group. Funding Circle has raised $150 million in 2015 and passed a key milestone by loaning more than £1 billion to firms in the UK, allowing the company to be considered a FinTech unicorn.
42
Regulations
The UK regulatory structure that impacts financial technology has been conducive to growth of FinTech startups and other companies operating in the FinTech space. The FCA and, to some limited extent, the Bank of England are the two institutions that are most important to UK FinTech regulations. In addition, the UK’s FinTech private sector has pushed for a self-regulating regime that is mostly dictated through the P2P Association. This association has been instrumental in setting industry standards for operations, underwriting procedures, marketing, fraud and money laundering.
2016 ITA FinTech Top Markets Report | 19
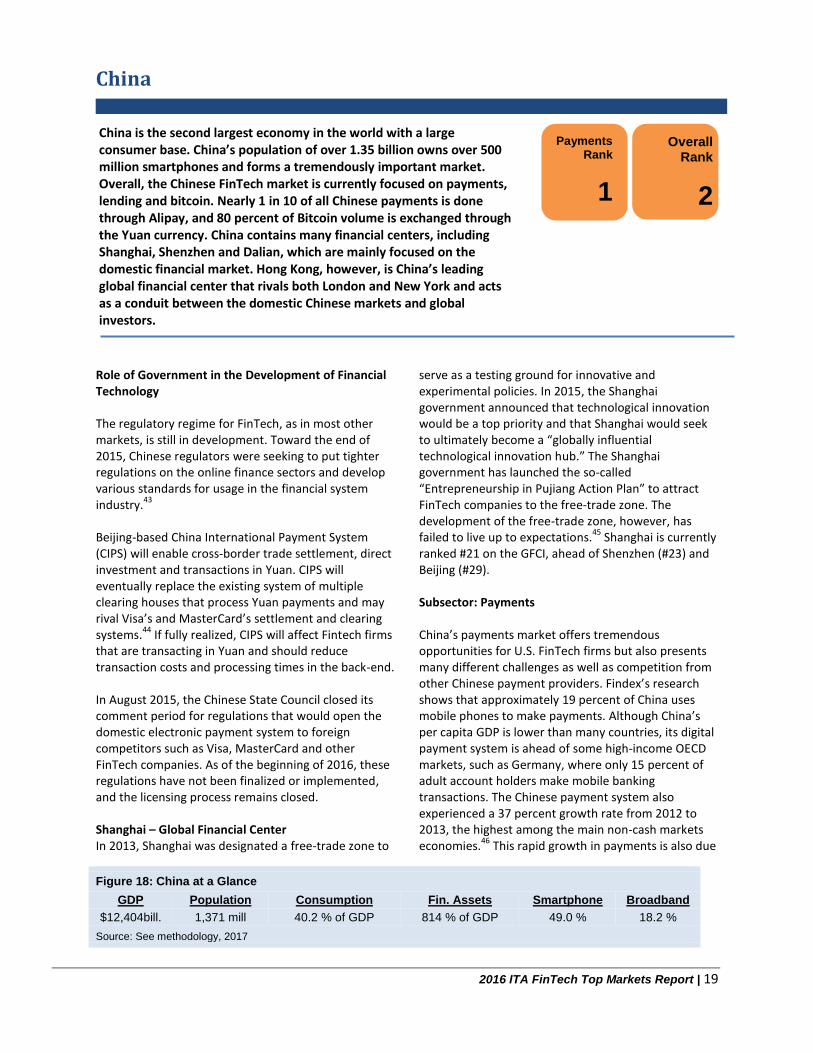
China is the second largest economy in the world with a large consumer base. China’s population of over 1.35 billion owns over 500 million smartphones and forms a tremendously important market. Overall, the Chinese FinTech market is currently focused on payments, lending and bitcoin. Nearly 1 in 10 of all Chinese payments is done through Alipay, and 80 percent of Bitcoin volume is exchanged through the Yuan currency. China contains many financial centers, including Shanghai, Shenzhen and Dalian, which are mainly focused on the domestic financial market. Hong Kong, however, is China’s leading global financial center that rivals both London and New York and acts as a conduit between the domestic Chinese markets and global investors.
China
Role of Government in the Development of Financial Technology The regulatory regime for FinTech, as in most other markets, is still in development. Toward the end of 2015, Chinese regulators were seeking to put tighter regulations on the online finance sectors and develop various standards for usage in the financial system industry.
43
Beijing-based China International Payment System (CIPS) will enable cross-border trade settlement, direct investment and transactions in Yuan. CIPS will eventually replace the existing system of multiple clearing houses that process Yuan payments and may rival Visa’s and MasterCard’s settlement and clearing systems.
44 If fully realized, CIPS will affect Fintech firms
that are transacting in Yuan and should reduce transaction costs and processing times in the back-end. In August 2015, the Chinese State Council closed its comment period for regulations that would open the domestic electronic payment system to foreign competitors such as Visa, MasterCard and other FinTech companies. As of the beginning of 2016, these regulations have not been finalized or implemented, and the licensing process remains closed. Shanghai – Global Financial Center In 2013, Shanghai was designated a free-trade zone to
serve as a testing ground for innovative and experimental policies. In 2015, the Shanghai government announced that technological innovation would be a top priority and that Shanghai would seek to ultimately become a “globally influential technological innovation hub.” The Shanghai government has launched the so-called “Entrepreneurship in Pujiang Action Plan” to attract FinTech companies to the free-trade zone. The development of the free-trade zone, however, has failed to live up to expectations.
45 Shanghai is currently
ranked #21 on the GFCI, ahead of Shenzhen (#23) and Beijing (#29). Subsector: Payments China’s payments market offers tremendous opportunities for U.S. FinTech firms but also presents many different challenges as well as competition from other Chinese payment providers. Findex’s research shows that approximately 19 percent of China uses mobile phones to make payments. Although China’s per capita GDP is lower than many countries, its digital payment system is ahead of some high-income OECD markets, such as Germany, where only 15 percent of adult account holders make mobile banking transactions. The Chinese payment system also experienced a 37 percent growth rate from 2012 to 2013, the highest among the main non-cash markets economies.
46 This rapid growth in payments is also due
Figure 18: China at a Glance
GDP Population Consumption Fin. Assets Smartphone Broadband
$12,404bill. 1,371 mill 40.2 % of GDP 814 % of GDP 49.0 % 18.2 %
Source: See methodology, 2017
Payments Rank
1
Overall Rank
2
2016 ITA FinTech Top Markets Report | 20
to the large number of mobile phones usage with over 600 million users in 2014. Over 80 percent of the Chinese population also access the web via their mobile device, providing a great opportunity for mobile payments providers. Payments made on mobile devices in China could approach half a trillion dollars by 2017, more than double the $200 billion mark in 2015.
47 In 2014, China
recorded a total of 15.9 billion non-cash transactions, fueled by the rising penetration of mobile phones in smaller cities and more mobile payments equipment in businesses. The central government’s push to open the domestic payments card market to competition has also increased volumes for mobile non-cash transactions. Chinese transaction volumes of mobile payments grew by 170 percent in 2014 to reach a total of 4.5 billion. In general, payments services are more developed in economies more mature than China's. There are also cultural differences, such as user habits, that differentiate the Chinese market. For instance, in the United States, users are more comfortable with credit whereas Chinese consumers focus more on savings and traditional transactions via cash or debit cards. In addition to increased merchant sales, the ability to track customer behavior and use this behavior data to drive sales is making the payment space in China very attractive, especially to e-commerce giants. Subsector: Crowd-lending As of the end of 2015, P2P lending has now topped $150 billion or 982.3 billion Yuan, four times more than the amount in 2014.
48 China's P2P lending platforms
have cumulatively brokered a total of 1.37 trillion Yuan transactions as of the end of December 2015. There
are currently 2,595 P2P platforms in China, an increase of 1,020 since 2014. Due to low returns in traditional bank deposits and limits on the movement of money, P2P lending has grown quickly in China in the past few years as Chinese investors are seeking higher returns than those provided by bank deposits. SMEs also are finding it easier to obtain funds through these platforms. The historical lack of consumer protection supervision in the FinTech sector, however, has made the industry risky for investors as some P2P platforms have been implicated in questionable fund raising activities. For instance, Ezubao was implicated in a fraud case involving over 1 million investors and $7.6 billion in funds. Tighter regulation could slow the growth in the number of P2P platforms. A draft regulation released in December 2015 would impose restrictions on P2P platforms, including the prohibition of platforms from accepting public deposits, pooling investors' money to fund their own projects or providing any kind of lender guarantee. There are currently three main players in the peer-to-peer lending market in China with Dianrong leading the segment. Monthly online lending volume reached 120 billion Yuan ($19 billion) in October 2015, four times the level of October 2014, according to a report jointly published by online lender Wangdaizhijia and consulting firm Yingcan. Dianrong.com has set up 26 offices within the country, has 300,000 active lenders and originates about one billion Yuan in new loans monthly, according to the company.
49
2016 ITA FinTech Top Markets Report | 21
Singapore
Lead Financial Center for ASEAN
Singapore’s highly developed financial and regulatory system, as well as the ease of doing business in the country, allows it to play a leading role in the ASEAN region. Currently the ASEAN Financial Integration Framework sets out a framework to create a more integrated financial region by 2020, which would complement Singapore’s role as a global financial center. Singapore is currently ranked fourth on the GFCI. Within ASEAN, the city-state is far ahead of other ASEAN cities, such as Kuala Lumpur (#45), Bangkok (#48) and Manila (#55). In January 2015, the ASEAN countries’ central banks adopted principles for product transparency and disclosure on cross-border trade settlements. These principles will ensure that customers have clear, timely accessible data and information for cross-border transactions and will promote the use of local ASEAN currencies. The ASEAN Financial Integration Framework (AFIF), envisages a more integrated financial region by 2020. Each ASEAN member country will be able to designate local bank(s) as a Qualified ASEAN Bank (QAB) to expand and operate within the region. Key subjects include the removal of restrictions to the intra-ASEAN provision of financial services between member firms, and the increase of capacity and infrastructure to develop and integrate ASEAN capital markets. This will liberalize the flow of capital across the ASEAN region
and harmonize payments and settlements systems for FinTech companies. U.S. FinTech firms could use Singapore as a launching pad for the whole of Southeast Asia particularly ASEAN countries. Payments Infrastructure The payment ecosystem in Singapore is one of the best and strongest in the world due to close and effective collaboration between government entities, such as the Monetary Authority of Singapore (MAS), private players and telecommunications companies. Singapore enjoys a high mobile penetration rate of approximately 1.5 phones per person.
50 Singapore is also one of the
leading nations in the world in terms of smartphone adoption with 80 percent of its inhabitants using smartphones.
51
Singapore’s FinTech ecosystem is a good example of how a strong private sector payments industry develops through high mobile usage, proper technology infrastructure and support by conducive government regulations. These factors will also help drive the next wave of payment innovation. Subsector: Payments The non-cash payments market in Singapore reached 3.8 billion transactions in 2013, the majority of which (80 percent) were prepaid as e-payments or e-money.
52 The establishment of the Contactless e-Purse
Application (CEPAS) by the Government of Singapore in
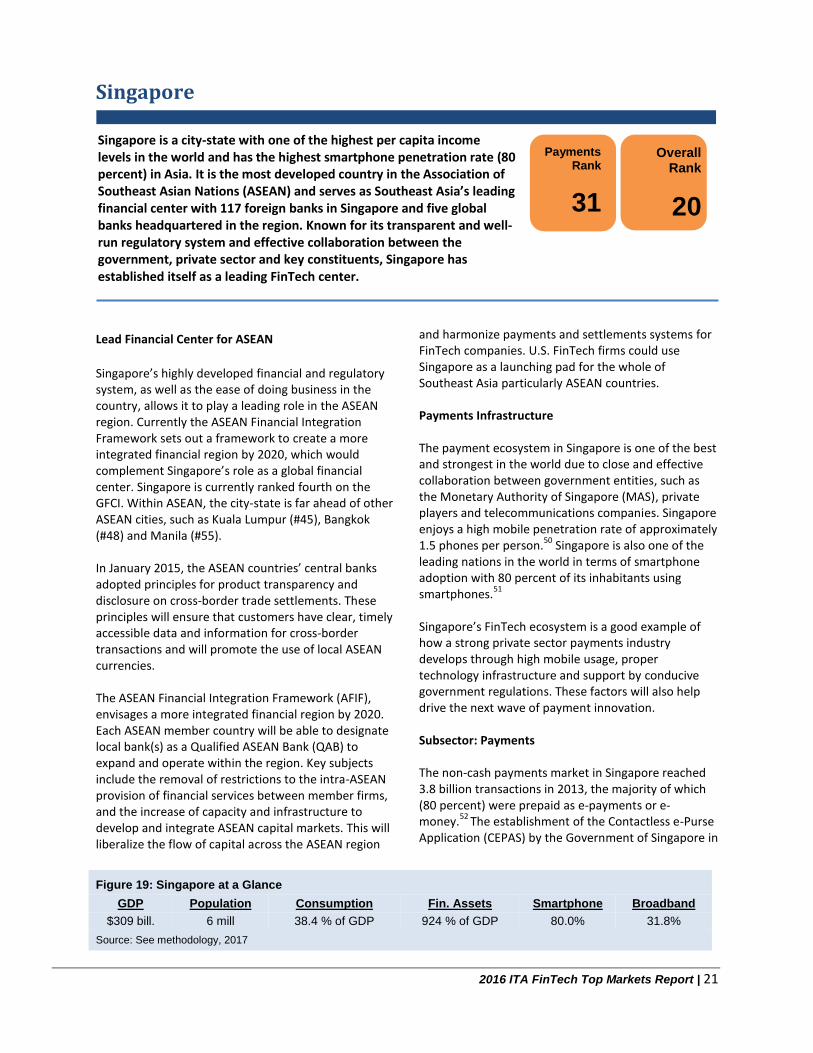
Figure 19: Singapore at a Glance
GDP Population Consumption Fin. Assets Smartphone Broadband
$309 bill. 6 mill 38.4 % of GDP 924 % of GDP 80.0% 31.8%
Source: See methodology, 2017
Singapore is a city-state with one of the highest per capita income levels in the world and has the highest smartphone penetration rate (80 percent) in Asia. It is the most developed country in the Association of Southeast Asian Nations (ASEAN) and serves as Southeast Asia’s leading financial center with 117 foreign banks in Singapore and five global banks headquartered in the region. Known for its transparent and well-run regulatory system and effective collaboration between the government, private sector and key constituents, Singapore has established itself as a leading FinTech center.
Payments Rank
31
Overall Rank
20
2016 ITA FinTech Top Markets Report | 22
2009 was a driving force in increasing e-money usage as it created a nationwide standard for a micro-payment platform that acts as a conduit for multiple stakeholders from financial institutions to retail e-commerce and end-users. Subsector: Marketplace-lending Singapore’s marketplace-lending is still underdeveloped compared to other markets considered as its peers on the GFCI due to its small size of only 5.5 million people. There have been a variety of different crowd-lending companies established in Singapore with mixed success. Some crowdfunding platforms, such as Crowdo, are using Singapore as a base for all of ASEAN and have already successfully launched in Malaysia and Indonesia. Though Singapore’s crowd-lending market is small, SMEs and financing for SMEs are a very important priority for the ASEAN economies of Indonesia,
Malaysia, Philippines, Singapore and Thailand. These countries’ SMEs contribute between 30 to 60 percent of the countries’ GDP and employ between 60 to 90 percent of their respective workforces. With the exception of Thailand, SME loan volumes in these countries are less than 60 percent of their GDP contribution and constitute less than 20 percent of total loans. This presents a significant opportunity for FinTech companies to target lending and crowd-lending applications.
53
Demographic Section Singapore enjoys a demographic that is likely to use FinTech and innovative payment services. Singapore, with 33.9 percent of the population between the age of 20 and 44 in comparison to 31.5 percent for G7 countries, exhibits a higher proportion of the younger population group that is more likely to use FinTech products.
5455
2016 ITA FinTech Top Markets Report | 23
Brazil
Brazil also contains, in São Paulo and Rio de Janeiro, two of the leading GFC’s. São Paulo remains the top Latin American center in GFCI 18’s ranking and, along with Rio de Janeiro, made significant progress in climbing the rankings last year.
56 Furthermore,
according to Di Markets, São Paulo is the GFC that attracted the largest foreign direct investment (FDI) volumes among financial centers in Latin America and the Caribbean in 2014.
Sectors Private sector credit to GDP as a share of GDP in Brazil is only estimated to be about 39 percent of GDP for 2017. In Australia, China and the United States, it is 193 percent, 143 percent and 121 percent, respectively. This suggests that the opportunities for FinTech in the credit subsector may lag those in the payments subsector. The more immature asset management and insurance markets will likely lag both the credit and the payments subsectors in FinTech opportunities. Brazil’s non-life insurance premium volumes as a percentage of GDP were only 1.05 percent in 2013 (compared to 3.16 for the United States), suggesting that insurance might not be a good sector for FinTech opportunities in the near-term.
57 The asset
management sector, however, might provide opportunities for growth in the long-term, as the mutual fund system is 49 percent of GDP, as opposed to only 10 percent in Mexico and even smaller shares in India and China (the share in the United States is 91
percent).
58 The payments and marketplace lending
subsectors are likely to be some of the most vital subsectors for FinTech over the next few years.
Payments Subsector Payments revenue surged 22 percent in Brazil in 2014 to over $200 billion, and Brazil accounted for about 60 percent of the total payments market in Latin America.
59 Brazil’s demographics are advantageous for
payments, with over 39.4 percent of its population predicted to be between 20 and 44 in 2017, compared to 31.5 percent in the G7.
60
Given Brazil's large unbanked population, financial education focused on the benefits of using electronic payments would increase consumer use of this type of payment.
61 Mobile payments could be
another solution to bringing Brazil's large unbanked (65 million) and underbanked population into the electronic payment mainstream. Brazilians' use of mobile phones exceeds that of payment cards.
62
Regulations governing Brazil mobile payments allow non-banks to offer payments services on a relatively equal playing field. Entrants in the mobile payments sector are classified as “payment institutions” and have non-discriminatory access to the domestic payment and settlement system.
63 These regulations
reduce uncertainty for mobile payments providers, which continue to operate with fewer capital restrictions than traditional financial institutions. Payment institutions are required to hold BRL2m
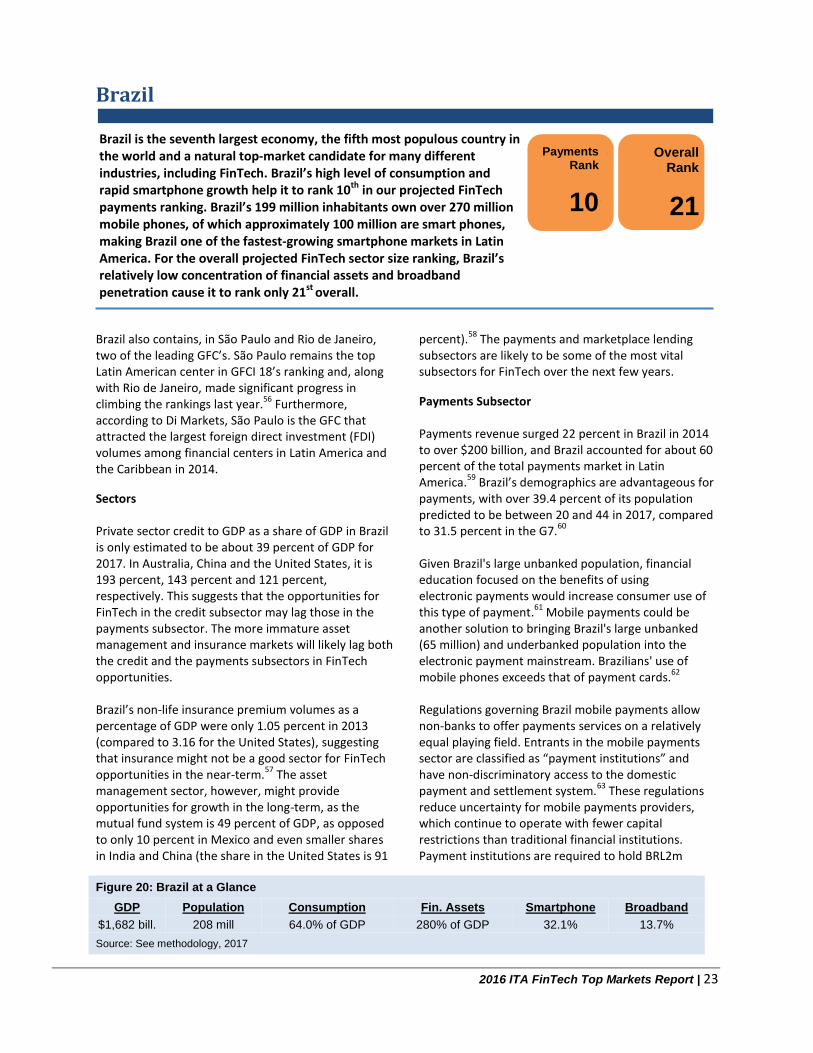
Figure 20: Brazil at a Glance
GDP Population Consumption Fin. Assets Smartphone Broadband
$1,682 bill. 208 mill 64.0% of GDP 280% of GDP 32.1% 13.7%
Source: See methodology, 2017
Brazil is the seventh largest economy, the fifth most populous country in the world and a natural top-market candidate for many different industries, including FinTech. Brazil’s high level of consumption and rapid smartphone growth help it to rank 10th in our projected FinTech payments ranking. Brazil’s 199 million inhabitants own over 270 million mobile phones, of which approximately 100 million are smart phones, making Brazil one of the fastest-growing smartphone markets in Latin America. For the overall projected FinTech sector size ranking, Brazil’s relatively low concentration of financial assets and broadband penetration cause it to rank only 21st overall.
Payments Rank
10
Overall Rank
21
2016 ITA FinTech Top Markets Report | 24
($703,000) in minimum capital and a minimum equity of 2 percent of the average monthly value of transactions they have handled in the last 12 months.
64
Visa is already in a good position to benefit as it announced in October 2015 that it had launched its online payment service (Visa Checkout) in Brazil.
65
Crowd-Funding Subsector
The equity crowdfunding scene in Brazil is growing fast but remains small with only a few platforms operating in Brazil, such as Broota and EqSeed. The Comissão de Valores Mobiliários (CVM), the securities regulator, listed 40 requests for funding in 2015, compared to three in 2014. Non-equity crowdfunding destined for products and services also experienced significant growth in 2015, with Kickante, for example, making 24 times the number of offerings than in 2014.
66
CVM Instruction 400 regulates public offerings in Brazil and provides for several exemptions that allow SMEs (defined as firms with annual turnover of US$1 million) to forego registration requirements. The only other restriction in place is that companies can only raise up to R$2.4 million ($690,000) per year.
67
Most market participants expect that the CVM will pass regulations in 2016 to guarantee more security to the investor and increase capitalization limits.
68 If the
CVM does issue rules that encourage the development of the equity crowdfunding subsector in 2016, Brazil will solidify its place as one of the global crowdfunding leaders. The equity crowdfunding-specific rules may require more stringent documentation requirements, and there are also likely to be investment limits of up to 10 percent of individuals’ total financial investments or their annual income, whichever is higher. The CVM is also expected to open up the exemptions to all company types.
69
2016 could be a tumultuous year for the Brazilian FinTech sector as the country experiences joint political and economic crises. Last year, for the first time, although more than half of all Brazilians had internet access, smartphone sales suffered the first year of declining sales (13 percent) after a growth of 55 percent in 2014.
70 This decline appears to be due to
the ongoing recession in Brazil.
2016 ITA FinTech Top Markets Report | 25
Australia
The financial services industry is the largest industry in Australia as measured by its sector share to the national economy (9 percent in 2013). Australia’s big banks are among the most profitable in the world, providing an attractive market for would-be FinTech disrupters, such as peer-to-peer lenders.
71
The first green shoots in the Australian FinTech sector, however, are only starting to appear. Until recently, customers have been satisfied with institutions’ internal innovations, and Australia’s regulatory environment has made it difficult for young startups to enter the market.
72 73 The recent appointment of Prime
Minister Malcolm Turnbull, however, has been a catalyst for Australia's FinTech sector. Australia has begun to incorporate FinTech into the recent budget’s innovation and science package, including policies and initiatives to help boost startup and entrepreneurial activity.
Australia is home to two GFCs: Sydney (#15) and Melbourne (#27).
74 Sydney is Australia’s primary
financial center and is closely aligned with Australia’s most significant cluster of service industries, such as information and communication technology, digital, tertiary education and creative services.
75 Payments,
peer-to-peer lending, crowdfunding and asset management are the most promising subsectors for FinTech.
Payments Subsector
Perhaps the most noteworthy absence of FinTech startups in Australia is in payments. Large firms, such as PayPal and Google Pay, have been slow to enter Australia. The country already has one of the world’s most advanced online and cashless payments systems, the highest proportion of contactless payments (60 percent of face-to-face credit card transactions) and one of the highest proportions of smartphone ownership.
76 Australian banks have also
emerged from the 2008 financial crisis and have retained consumer trust.
77
Australians may have embraced mobile banking and "tap and go" payments more enthusiastically than most, but the country has been slow to adopt digital money transfers between people, or "P2P" payments.
78
According to industry sources, Australia remains reliant on cash, checks and electronic bank transfers for payments, but this will soon change with the introduction of more digital firms, such as Facebook and Snapchat.
79 Only 13 percent of customers had
made electronic bank transfers, such as a transfer through their bank's digital application (compared to 22 percent of U.S. smartphone owners), and only 1 percent had used an app for making payments provided by other non-bank businesses. Although this
figure compares unfavorably to the 22 percent of U.S.
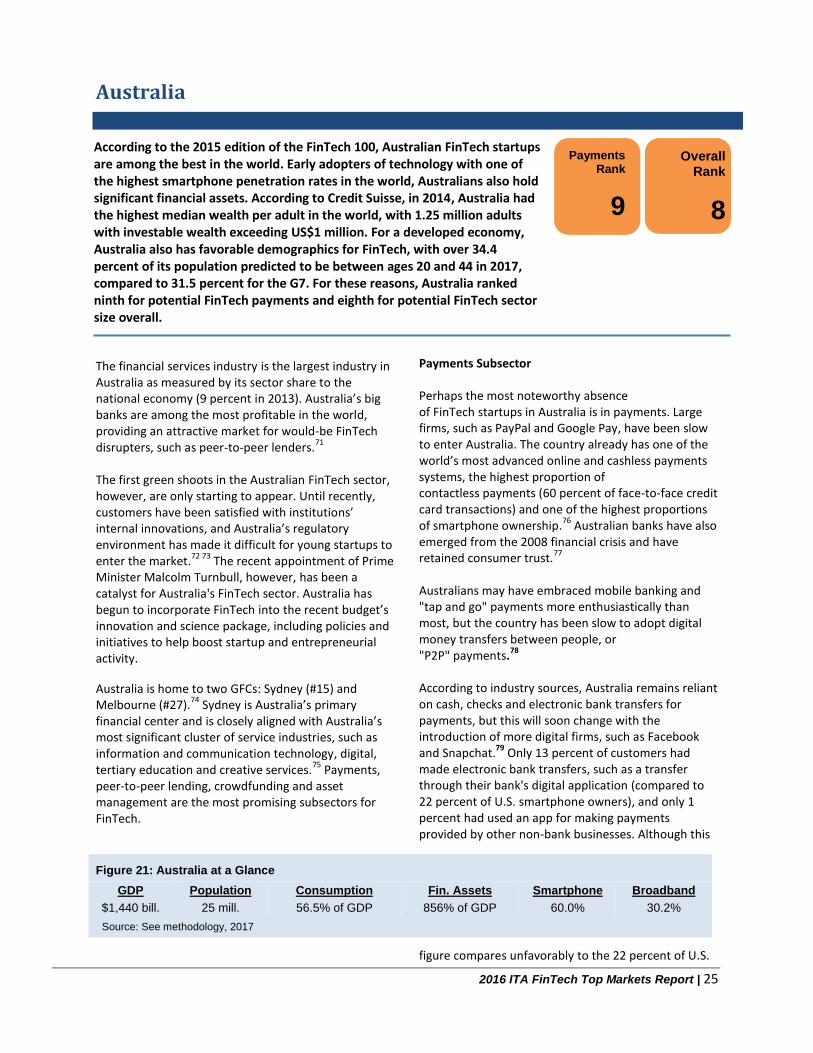
Figure 21: Australia at a Glance
GDP Population Consumption Fin. Assets Smartphone Broadband
$1,440 bill. 25 mill. 56.5% of GDP 856% of GDP 60.0% 30.2%
Source: See methodology, 2017
According to the 2015 edition of the FinTech 100, Australian FinTech startups are among the best in the world. Early adopters of technology with one of the highest smartphone penetration rates in the world, Australians also hold significant financial assets. According to Credit Suisse, in 2014, Australia had the highest median wealth per adult in the world, with 1.25 million adults with investable wealth exceeding US$1 million. For a developed economy, Australia also has favorable demographics for FinTech, with over 34.4 percent of its population predicted to be between ages 20 and 44 in 2017, compared to 31.5 percent for the G7. For these reasons, Australia ranked ninth for potential FinTech payments and eighth for potential FinTech sector size overall.
Payments Rank
9
Overall Rank
8
2016 ITA FinTech Top Markets Report | 26
smartphone owners that have made electronic transfers through banks’ digital applications, Australians remain among the world’s fastest adopters of mobile banking.
80 The implementation of
Australia's New Payments Platform (NPP), which should go live in 2017, will provide the domestic messaging channeling, settling, clearing and routing needed to satisfy this growth.
81
Marketplace Lending/Crowdfunding
By 2020, marketplace lending to Australian consumers could soar to $10.4 billion and comprise 6 percent of total consumer lending in Australia. Marketplace lending in the SME market is predicted to grow from zero in 2014 to A$11.4 billion (US$8.55 billion) by 2020, accounting for 12 percent of the viable market.
82
The opportunity for marketplace lending to establish a meaningful presence in Australia is due to a high online and mobile banking penetration (70 percent broadband/smartphone and 75 percent online banking). High returns in unsecured lending and a concentrated banking industry that is not focused on consumer and SME lending are additional factors.
83
Australia’s four major banks have a market share of 75-85 percent in retail mortgages, deposits, credit cards and personal lending. The spreads between rates on personal loans and credit cards versus deposit rates in Australia are very wide compared to those in the mortgage market. Although there has been significant product innovation in mortgages, deposits and credit cards in the past 10 to 20 years, the key features of unsecured personal loans have hardly changed. Customers have had little reason to choose banks over marketplace lenders on price, convenience or speed. Finally, in early 2014 Australia introduced comprehensive credit reporting (positive and negative information), which now makes it favorable for alternative lenders to assess a borrower's creditworthiness.
84 Marketplace lending growth may
still face the risk of regulatory scrutiny by the Australian Securities and Investments Commission. The sustainability of the business model has not yet been tested through an economic downturn.
85
In December 2015, the Australian government released its Corporations Amendment Crowd-sourced Funding Act legislation that details how non-listed public companies, including startups, can access crowdsourced equity funding from external investors.
86 Under the proposed legislation, businesses
with $5 million or less in turnover and assets would be able to raise up to $5 million a year through crowdfunding without issuing a prospectus.
87
Money Management
Although the number of robo-advice providers in the Australian market is still relatively small, this sector is poised to grow given the estimated 80 percent of Australian fund holders who do not seek professional financial advice and financial advisers looking for less expensive ways to service their customers.
88
Stockspot is Australia’s fastest growing automated investment service. Simply Wall Street is another app that visualizes stocks, portfolios and exchange-traded funds using infographics. Both of these companies’ products are not very well-integrated into existing social media. It remains to be seen how popular they will be compared to the traditional investment adviser approach.
Going Forward
The Australian Government has proactively responded to the growth of the FinTech sector with the release of a set of its proposals to make the FinTech sector more globally competitive.
89 For example, the Turnbull
government’s innovation statement in December provided for a 20 percent, non-refundable tax offset based on the size of the investment (capped at $200,000 an investor per annum).
90 The government’s
FinTech growth statement also discusses its FinTech priorities for data reporting, blockchain technology, wealth management and other FinTech sectors.
91
2016 ITA FinTech Top Markets Report | 27
The U.S. Government has numerous resources available to help U.S. exporters: from additional market research,
to guides to export financing, to overseas trade missions, to staff around the country and the world. A few key
resources are highlighted below. For additional information about services from the International Trade
Administration (ITA), please visit www.export.gov.
Addendum: Resources for U.S. Exporters
Country Commercial Guides http://export.gov/ccg/ Written by U.S. Embassy trade experts worldwide, the Country Commercial Guides provide an excellent starting point for what you need to know about exporting and doing business in a foreign market. The reports include sections addressing: market overview, challenges, opportunities, and entry strategies; political environment; selling U.S. products and services; trade regulations, customs, and standards; and much more. Basic Guide to Exporting http://export.gov/basicguide/ A Basic Guide to Exporting addresses virtually every issue a company looking to export might face. Numerous sections, charts, lists and definitions throughout the book’s 19 chapters provide in-depth information and solid advice about the key activities and issues relevant to any prospective exporter. Trade Finance Guide: A Quick Reference for U.S. Exporters http://www.export.gov/tradefinanceguide/index.asp Trade Finance Guide: A Quick Reference for U.S. Exporters is designed to help U.S. companies, especially small and medium-sized enterprises, learn the basics of trade finance so that they can turn their export opportunities into actual sales and achieve the ultimate goal of getting paid on time for those sales. Concise, two-page chapters offer the basics of numerous financing techniques, from open accounts to forfaiting and government assisted foreign-buyer financing. Trade Missions http://www.export.gov/trademissions/ Department of Commerce trade missions are overseas programs for U.S. firms that wish to explore and pursue export opportunities by meeting directly with potential clients in their markets.
Trade missions include among other activities: one-on-one meetings with foreign industry executives and
government officials that are pre-screened to match specific business objectives. Certified Trade Fairs http://www.export.gov/eac/show_short_trade_events.asp?CountryName=null&StateName=null&IndustryName=null&TypeName=International%20Trade%20Fair&StartDate=null&EndDate=null The Department of Commerce's trade fair certification program endorses overseas trade shows that are reliable venues and good markets for U.S. firms to sell their products and services abroad. These shows serve as vital access vehicles for U.S. firms to enter and expand into foreign markets. The certified show/U.S. pavilion ensures a high-quality, multi-faceted opportunity for American companies to successfully market overseas. Among other benefits, certified trade fairs provide U.S. exhibitors with help facilitating contacts, market information, counseling and other services to enhance their marketing efforts. The Advocacy Center http://www.export.gov/advocacy/ The Advocacy Center coordinates U.S. government interagency advocacy efforts on behalf of U.S. exporters that are bidding on public-sector contracts with overseas governments and government agencies. The Advocacy Center helps to ensure that sales of U.S. products and services have the best possible chance competing abroad. Advocacy assistance is wide and varied but often involves companies that want the U.S. Government to communicate a message to foreign governments or government-owned corporations on behalf of their commercial interest, typically in a competitive bid contest. U.S. Commercial Service http://www.export.gov/usoffices/index.asp With offices throughout the United States and in U.S. Embassies and consulates in nearly 80 countries, the U.S. Commercial Service utilizes its global network of trade professionals to connect U.S. companies with international buyers worldwide. Whether looking to make their first export sale or expand to additional
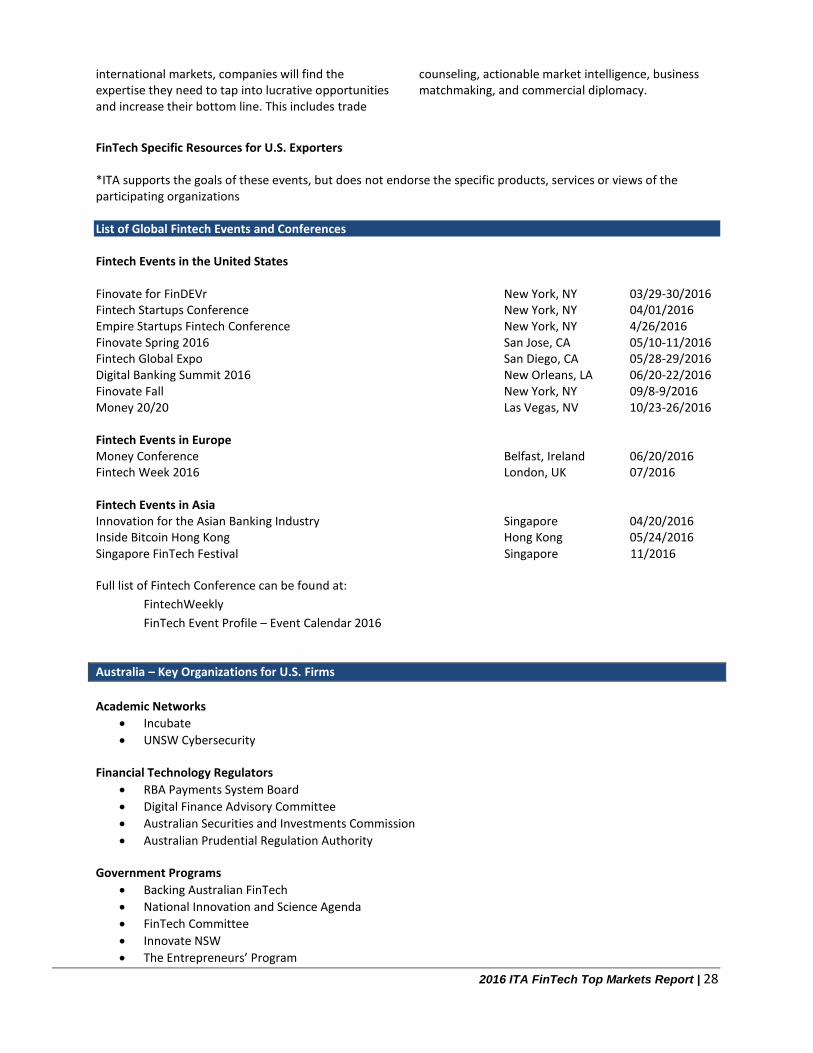
2016 ITA FinTech Top Markets Report | 28
international markets, companies will find the expertise they need to tap into lucrative opportunities and increase their bottom line. This includes trade
counseling, actionable market intelligence, business matchmaking, and commercial diplomacy.
FinTech Specific Resources for U.S. Exporters *ITA supports the goals of these events, but does not endorse the specific products, services or views of the participating organizations List of Global Fintech Events and Conferences Fintech Events in the United States Finovate for FinDEVr New York, NY 03/29-30/2016 Fintech Startups Conference New York, NY 04/01/2016 Empire Startups Fintech Conference New York, NY 4/26/2016 Finovate Spring 2016 San Jose, CA 05/10-11/2016 Fintech Global Expo San Diego, CA 05/28-29/2016 Digital Banking Summit 2016 New Orleans, LA 06/20-22/2016 Finovate Fall New York, NY 09/8-9/2016 Money 20/20 Las Vegas, NV 10/23-26/2016 Fintech Events in Europe Money Conference Belfast, Ireland 06/20/2016 Fintech Week 2016 London, UK 07/2016 Fintech Events in Asia Innovation for the Asian Banking Industry Singapore 04/20/2016 Inside Bitcoin Hong Kong Hong Kong 05/24/2016 Singapore FinTech Festival Singapore 11/2016
Full list of Fintech Conference can be found at:
FintechWeekly
FinTech Event Profile – Event Calendar 2016
Australia – Key Organizations for U.S. Firms
Academic Networks
Incubate
UNSW Cybersecurity
Financial Technology Regulators
RBA Payments System Board
Digital Finance Advisory Committee
Australian Securities and Investments Commission
Australian Prudential Regulation Authority
Government Programs
Backing Australian FinTech
National Innovation and Science Agenda
FinTech Committee
Innovate NSW
The Entrepreneurs’ Program
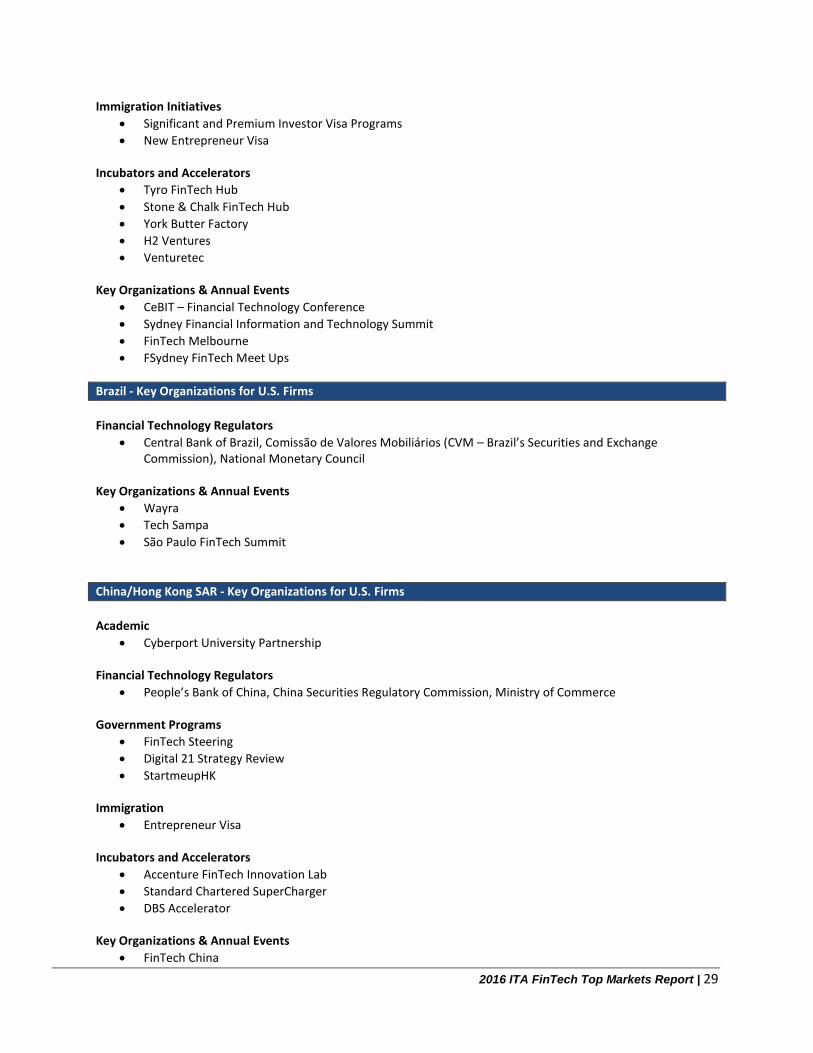
2016 ITA FinTech Top Markets Report | 29
Immigration Initiatives
Significant and Premium Investor Visa Programs
New Entrepreneur Visa
Incubators and Accelerators
Tyro FinTech Hub
Stone & Chalk FinTech Hub
York Butter Factory
H2 Ventures
Venturetec
Key Organizations & Annual Events
CeBIT – Financial Technology Conference
Sydney Financial Information and Technology Summit
FinTech Melbourne
FSydney FinTech Meet Ups
Brazil - Key Organizations for U.S. Firms
Financial Technology Regulators
Central Bank of Brazil, Comissão de Valores Mobiliários (CVM – Brazil’s Securities and Exchange Commission), National Monetary Council
Key Organizations & Annual Events
Wayra
Tech Sampa
São Paulo FinTech Summit
China/Hong Kong SAR - Key Organizations for U.S. Firms
Academic
Cyberport University Partnership Financial Technology Regulators
People’s Bank of China, China Securities Regulatory Commission, Ministry of Commerce
Government Programs
FinTech Steering
Digital 21 Strategy Review
StartmeupHK Immigration
Entrepreneur Visa Incubators and Accelerators
Accenture FinTech Innovation Lab
Standard Chartered SuperCharger
DBS Accelerator
Key Organizations & Annual Events
FinTech China
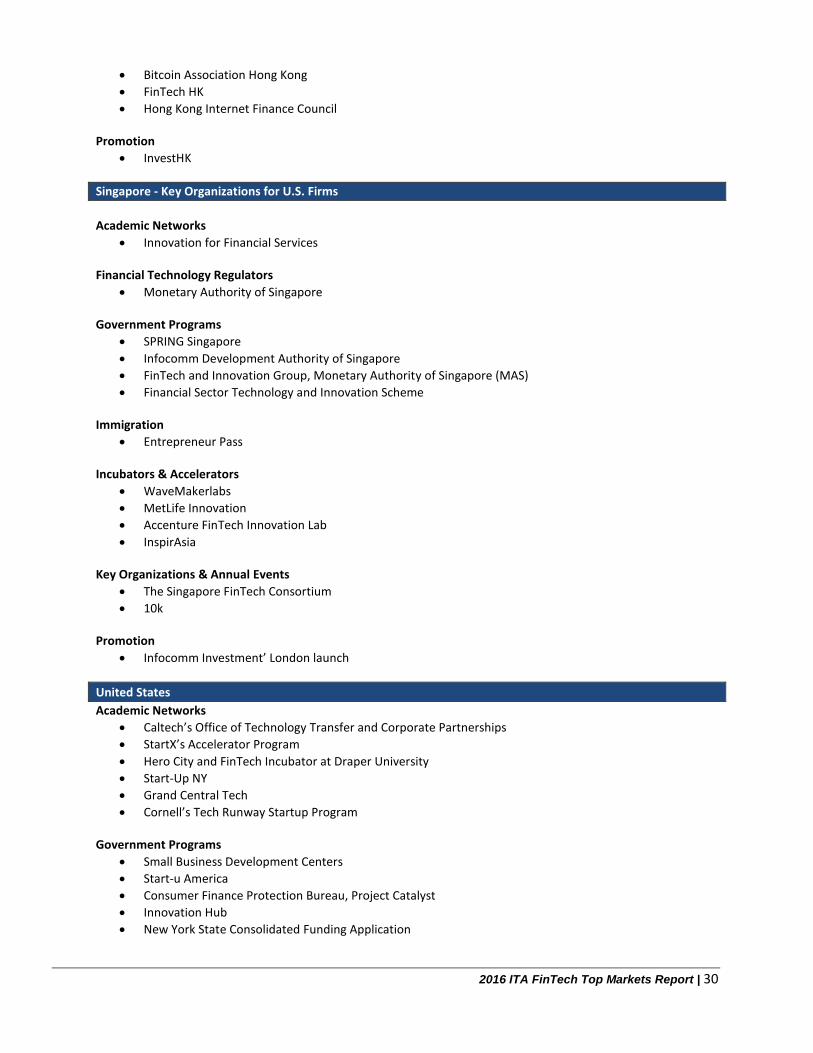
2016 ITA FinTech Top Markets Report | 30
Bitcoin Association Hong Kong
FinTech HK
Hong Kong Internet Finance Council Promotion
InvestHK
Singapore - Key Organizations for U.S. Firms
Academic Networks
Innovation for Financial Services Financial Technology Regulators
Monetary Authority of Singapore Government Programs
SPRING Singapore
Infocomm Development Authority of Singapore
FinTech and Innovation Group, Monetary Authority of Singapore (MAS)
Financial Sector Technology and Innovation Scheme
Immigration
Entrepreneur Pass Incubators & Accelerators
WaveMakerlabs
MetLife Innovation
Accenture FinTech Innovation Lab
InspirAsia
Key Organizations & Annual Events
The Singapore FinTech Consortium
10k
Promotion
Infocomm Investment’ London launch
United States
Academic Networks
Caltech’s Office of Technology Transfer and Corporate Partnerships
StartX’s Accelerator Program
Hero City and FinTech Incubator at Draper University
Start-Up NY
Grand Central Tech
Cornell’s Tech Runway Startup Program Government Programs
Small Business Development Centers
Start-u America
Consumer Finance Protection Bureau, Project Catalyst
Innovation Hub
New York State Consolidated Funding Application
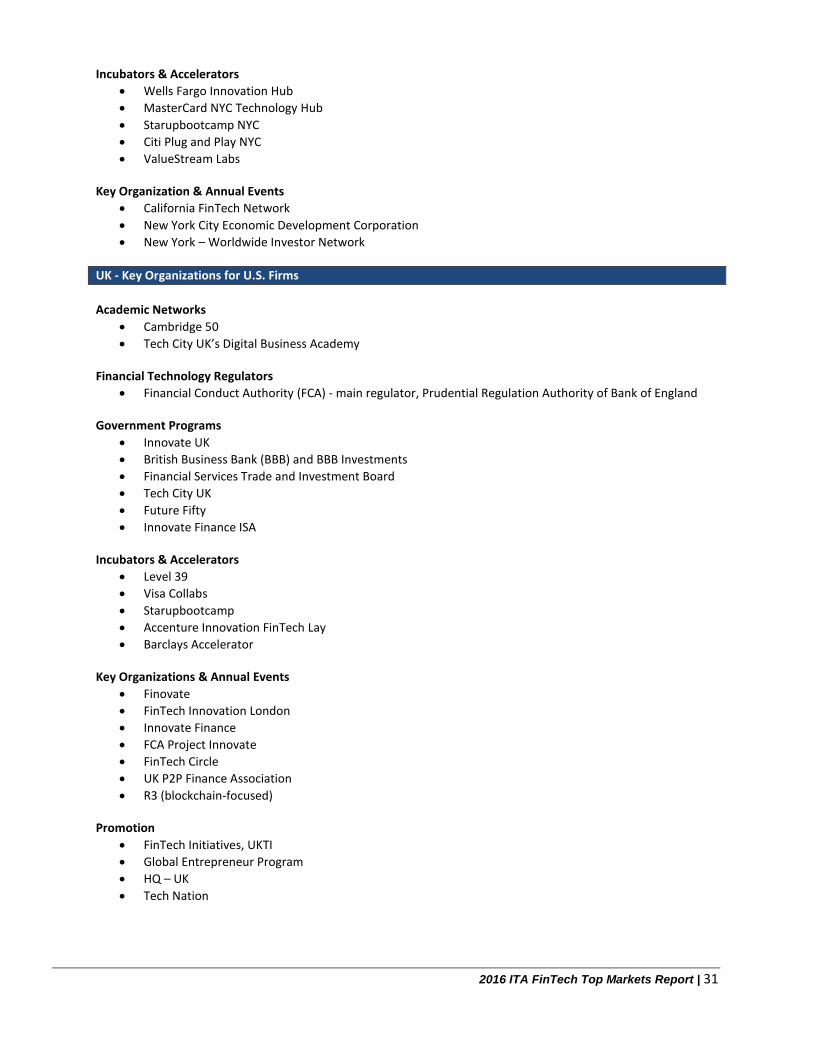
2016 ITA FinTech Top Markets Report | 31
Incubators & Accelerators
Wells Fargo Innovation Hub
MasterCard NYC Technology Hub
Starupbootcamp NYC
Citi Plug and Play NYC
ValueStream Labs Key Organization & Annual Events
California FinTech Network
New York City Economic Development Corporation
New York – Worldwide Investor Network
UK - Key Organizations for U.S. Firms
Academic Networks
Cambridge 50
Tech City UK’s Digital Business Academy
Financial Technology Regulators
Financial Conduct Authority (FCA) - main regulator, Prudential Regulation Authority of Bank of England
Government Programs
Innovate UK
British Business Bank (BBB) and BBB Investments
Financial Services Trade and Investment Board
Tech City UK
Future Fifty
Innovate Finance ISA
Incubators & Accelerators
Level 39
Visa Collabs
Starupbootcamp
Accenture Innovation FinTech Lay
Barclays Accelerator
Key Organizations & Annual Events
Finovate
FinTech Innovation London
Innovate Finance
FCA Project Innovate
FinTech Circle
UK P2P Finance Association
R3 (blockchain-focused)
Promotion
FinTech Initiatives, UKTI
Global Entrepreneur Program
HQ – UK
Tech Nation

2016 ITA FinTech Top Markets Report | 32
This Page Intentionally Left Blank
2016 ITA FinTech Top Markets Report | 33
Appendix 1: Methodology
The FinTech sector is comprised of various subsectors that, although related, are each driven by a unique set of factors. ITA makes its market projections out until 2017, which is far enough into the future for their forecasts to be realistic and close enough to the publishing date of this report to be timely. The payments subsector represents about one-third of the total FinTech sector and is often the earliest market opportunity in many countries. Accordingly, we have ranked markets based on projected FinTech payments opportunities, as well as the overall projected size of the FinTech sector.
Payments Subsector
Within the FinTech payments sector there are a number of subsectors: consumer to business (C2B), business to business (B2B) and consumer to consumer (C2C). We focus on the C2B subsector because it is larger than the B2B subsector (and significantly larger than the C2C subsector) and is more closely linked to publicly available payments data.
ITA used anticipated nominal gross domestic product (GDP) for 2017 in U.S. dollars to estimate the size of the market, as the overall size of a country’s economy is a principal indicator for targeting top markets. Source: The Economist Intelligence unit (EIU).
ITA used 2017 projected personal consumer purchases as a percentage of GDP to estimate the portion of the economy that is most likely to represent the payment market. The FinTech payments market primarily involves consumer purchases, not business or government purchases, and this is also where the best data is available. Source: EIU
ITA used estimated smartphone ownership as a percent of population (2017) to represent the portion of a country’s population most likely to use a FinTech payment product. While some payment options (e.g., m-pesa) are available to all mobile phones, these payment markets typically represent smaller market opportunities for FinTech companies. A 2014 Survey by the Board of Governors of the Federal Reserve reported that 32 percent of consumers reported not using mobile banking because they did not have a smartphone and 39 percent because the mobile phone screen is too small (typically on an earlier pre-smartphone phone). Sources: E-marketer and Consumer Barometer.
The projected FinTech payment market size was then calculated as Nominal GDP * Private Consumption * Smartphone Penetration
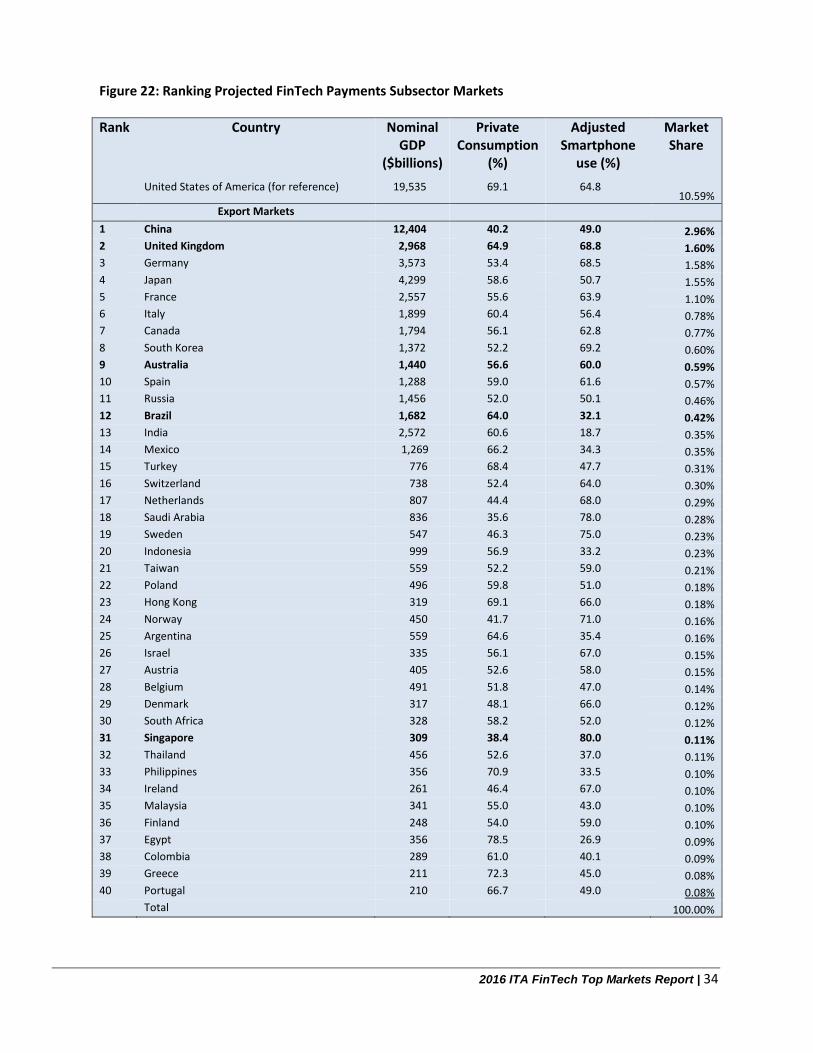
2016 ITA FinTech Top Markets Report | 34
Figure 22: Ranking Projected FinTech Payments Subsector Markets
Rank Country Nominal GDP
($billions)
Private Consumption
(%)
Adjusted Smartphone
use (%)
Market Share
United States of America (for reference) 19,535 69.1 64.8 10.59%
Export Markets
1 China 12,404 40.2 49.0 2.96% 2 United Kingdom 2,968 64.9 68.8 1.60% 3 Germany 3,573 53.4 68.5 1.58% 4 Japan 4,299 58.6 50.7 1.55% 5 France 2,557 55.6 63.9 1.10% 6 Italy 1,899 60.4 56.4 0.78% 7 Canada 1,794 56.1 62.8 0.77% 8 South Korea 1,372 52.2 69.2 0.60% 9 Australia 1,440 56.6 60.0 0.59% 10 Spain 1,288 59.0 61.6 0.57% 11 Russia 1,456 52.0 50.1 0.46% 12 Brazil 1,682 64.0 32.1 0.42% 13 India 2,572 60.6 18.7 0.35% 14 Mexico 1,269 66.2 34.3 0.35% 15 Turkey 776 68.4 47.7 0.31% 16 Switzerland 738 52.4 64.0 0.30% 17 Netherlands 807 44.4 68.0 0.29% 18 Saudi Arabia 836 35.6 78.0 0.28% 19 Sweden 547 46.3 75.0 0.23% 20 Indonesia 999 56.9 33.2 0.23% 21 Taiwan 559 52.2 59.0 0.21% 22 Poland 496 59.8 51.0 0.18% 23 Hong Kong 319 69.1 66.0 0.18% 24 Norway 450 41.7 71.0 0.16% 25 Argentina 559 64.6 35.4 0.16% 26 Israel 335 56.1 67.0 0.15% 27 Austria 405 52.6 58.0 0.15% 28 Belgium 491 51.8 47.0 0.14% 29 Denmark 317 48.1 66.0 0.12% 30 South Africa 328 58.2 52.0 0.12% 31 Singapore 309 38.4 80.0 0.11% 32 Thailand 456 52.6 37.0 0.11% 33 Philippines 356 70.9 33.5 0.10% 34 Ireland 261 46.4 67.0 0.10% 35 Malaysia 341 55.0 43.0 0.10% 36 Finland 248 54.0 59.0 0.10% 37 Egypt 356 78.5 26.9 0.09% 38 Colombia 289 61.0 40.1 0.09% 39 Greece 211 72.3 45.0 0.08% 40 Portugal 210 66.7 49.0 0.08% Total 100.00%
2016 ITA FinTech Top Markets Report | 35
Overall Projected FinTech sector size
The overall projected FinTech sector size includes the FinTech subsectors of crowdfunding, wealth management, lending and money transfer fees. Our estimates are based on the non-bank share of the market.
ITA used projected nominal gross domestic product (GDP) for 2017 in U.S. dollars to estimate the size of the market, as the overall size of a country’s economy is a principal indicator for targeting top markets. Source: The Economist Intelligence unit (EIU).
ITA used total financial assets as a percentage of GDP to get a better indicator for the size of a country’s financial sector as this is one of the best overall indicators for the size of the financial services sector in a country. All other factors held equal, a larger financial market should have a greater market for FinTech products. Sources: EIU
ITA used projected broadband use as a percent of population (2017) to represent the portion of a country’s population most likely to use FinTech products. Although the correlation between the broadband and smartphone indicators is roughly 80 percent, broadband use is not only a better indicator for the use of services, such as lending or wealth management, than smartphone access but also captures payment services. Source: EIU
o The EIU defines broadband use as subscriber lines with a transmission speed greater than 128 Kbps and includes primary rate interface (PRI) ISDN connections, xDSL connections, cable modem and cable telephony connections and high-speed fixed wireless connections.
Rough projected overall FinTech sector size is then calculated as Nominal GDP * Total Assets as a percent of GDP * Broadband Subscription as a percent of Total Population
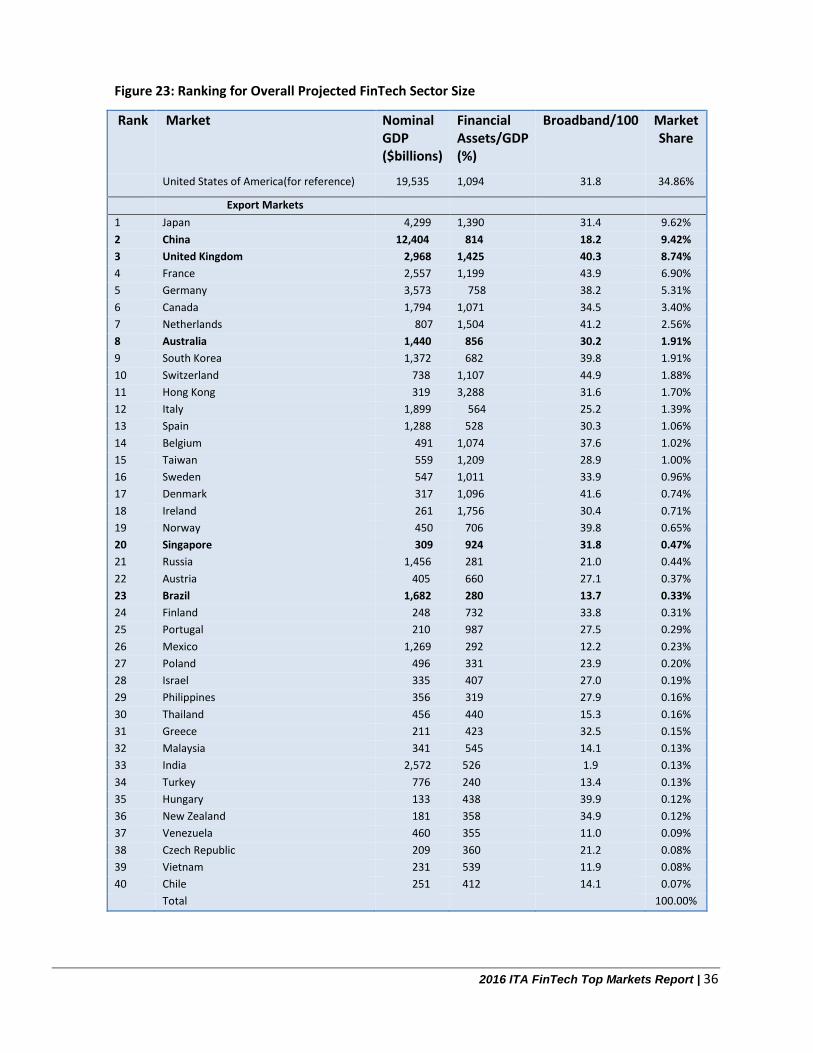
2016 ITA FinTech Top Markets Report | 36
Figure 23: Ranking for Overall Projected FinTech Sector Size
Rank Market Nominal GDP ($billions)
Financial Assets/GDP (%)
Broadband/100 Market Share
United States of America(for reference) 19,535 1,094 31.8 34.86%
Export Markets
1 Japan 4,299 1,390 31.4 9.62%
2 China 12,404 814 18.2 9.42%
3 United Kingdom 2,968 1,425 40.3 8.74%
4 France 2,557 1,199 43.9 6.90%
5 Germany 3,573 758 38.2 5.31%
6 Canada 1,794 1,071 34.5 3.40%
7 Netherlands 807 1,504 41.2 2.56%
8 Australia 1,440 856 30.2 1.91%
9 South Korea 1,372 682 39.8 1.91%
10 Switzerland 738 1,107 44.9 1.88%
11 Hong Kong 319 3,288 31.6 1.70%
12 Italy 1,899 564 25.2 1.39%
13 Spain 1,288 528 30.3 1.06%
14 Belgium 491 1,074 37.6 1.02%
15 Taiwan 559 1,209 28.9 1.00%
16 Sweden 547 1,011 33.9 0.96%
17 Denmark 317 1,096 41.6 0.74%
18 Ireland 261 1,756 30.4 0.71%
19 Norway 450 706 39.8 0.65%
20 Singapore 309 924 31.8 0.47%
21 Russia 1,456 281 21.0 0.44%
22 Austria 405 660 27.1 0.37%
23 Brazil 1,682 280 13.7 0.33%
24 Finland 248 732 33.8 0.31%
25 Portugal 210 987 27.5 0.29%
26 Mexico 1,269 292 12.2 0.23%
27 Poland 496 331 23.9 0.20%
28 Israel 335 407 27.0 0.19%
29 Philippines 356 319 27.9 0.16%
30 Thailand 456 440 15.3 0.16%
31 Greece 211 423 32.5 0.15%
32 Malaysia 341 545 14.1 0.13%
33 India 2,572 526 1.9 0.13%
34 Turkey 776 240 13.4 0.13%
35 Hungary 133 438 39.9 0.12%
36 New Zealand 181 358 34.9 0.12%
37 Venezuela 460 355 11.0 0.09%
38 Czech Republic 209 360 21.2 0.08%
39 Vietnam 231 539 11.9 0.08%
40 Chile 251 412 14.1 0.07%
Total 100.00%
2016 ITA FinTech Top Markets Report | 37
Appendix 2: The Global Financial Centers Index (GFCI) This ranking is of the competitiveness of financial centers based on over 29,000 financial cities assessments. The compilation is made based on an online questionnaire, as well as over 100 indices from organizations, such as the World Bank, the Organization for Economic Co-operation and Development (OECD) and the Economist Intelligence Unit. It is compiled and published twice a year by Z/Yen Group and sponsored by the Qatar Financial Centre Authority. It is widely quoted as a source for ranking financial centers. The ranking is an aggregate of indices from five key areas: business environment, financial sector development, infrastructure factors, human capital and reputation and general factors.
2016 ITA FinTech Top Markets Report | 38
Appendix 3: Citations
1 Ibid.
2 “Tyro Chief on FinTech Startups bloom in Australia in Next Two Years”. StartUpSmart. (May 27, 2015).
3 “EY FinTech Adoption Index” Earnest & Young Report. (December 21, 2015).
4 ‘The Future of Finance Part 3: the Socialization of Finance, Goldman Sachs Global Investment Research, (March 13, 2015).
5 “The FinTech Revolution, a Wave of Startups is Changing Finance – for the Better,” The Economist (May 9
th, 2015).
6 “Adoption of FinTech Could Double Among Digitally Active Consumers within Next 12 Months,” Malta Today (December 24, 2015).
7 ‘The Future of Finance Part 3: the Socialization of Finance,” Goldman Sachs Global Investment Research (March 13, 2015).
8 Ibid.
9 “The Future of Financial Services: How Disruptive Innovations are Reshaping the Way Financial Services are Structured, Provisioned
and Consumed,” World Economic Forum (June 2015). 10
“The Future of Finance Part 3: the Socialization of Finance,” Goldman Sachs Global Investment Research (March 13, 2015). 11
“The Future of Financial Services: How Disruptive Innovations are Reshaping the Way Financial Services are Structured, Provisioned and Consumed,” World Economic Forum (June 2015).
12 “Why Bitcoin May Herald a New Era in Finance,” The Economist (May 9, 2015).
13 “The Future of Finance Part 3: the Socialization of Finance,” Goldman Sachs Global Investment Research (March 13, 2015).
14 Ibid.
15 “The Future of Finance Part 2: Redefining the “Way We Pay” in the Next Decade,” Goldman Sachs (March 10, 2015).
16 ‘The Future of Finance Part 3: the Socialization of Finance,” Goldman Sachs Global Investment Research (March 13, 2015).
17 “Consumers and Mobile Financial Services,” Board of Governors of the Federal Reserve System (March 2015).
18 “Adoption of FinTech.”
19 Benjamin D. Mazzotta and Bhaskar Chakravorti, “Who Pays More to Use Cash?,” Institute for Business in the Global Context, The
Fletcher School at Tufts University, Medford, MA 02115, USA “Received: 15th December, 2013. 20
“The Journey Toward ‘Cash Lite’” Better Than Cash White Paper (Accessed in August 2014). 21
Mark Zandi, Virendra Singh, and Justin Irving. “The Impact of Electronic Payments on Economic Growth, Moody’s Analytics. (February 2013).
22 “Tyro Chief on FinTech Startups bloom in Australia in Next Two Years”. StartUpSmart. (May 27, 2015).
23 “EY FinTech Adoption Index” Earnest & Young Report. (December 21, 2015).
24 Graph information. Account Management, Accounting and Finance. Source: Accenture, Partnership Fund analysis of CB Insights
25 “A Penny Here, a Penny There If You Have Money—and Even If You Don’t,” The Economist (May 9
th, 2015).
26 Ibid.
27 “Ask the Algorithm: Human Wealth Advisers Are Going Out of Fashion, “The Economist (May 9
th, 2015).
28 ‘The Future of Finance Part 3: the Socialization of Finance,” Goldman Sachs Global Investment Research (March 13, 2015).
29 “Ask the Algorithm:” The Economist (May 9, 2015)
30 “‘The Future of Finance Part 3: the Socialization of Finance,” Goldman Sachs Global Investment Research (March 13, 2015).
31 “Crowdfunding: Cool, Man,” The Economist (May 9, 2015).
32 Ibid.
33 “Payments in Asia: At the Vanguard of Digital Innovation,” McKinsey on Payments (October 2015).
34 “Peer-to-Peer Lending: From the People, for the People,” The Economist (May 9
th, 2015).
35 Ibid.
36 Ibid.
37 The Journey Toward ‘Cash Lite.” Better Than Cash Alliance Research. (August 19, 2015)
38 Mark Yeandle, “The Global Financial Centres Index 18,” Z/Yen Group and Qatar Financial Centre Authority, Long Finance, Financial
Centres Future (September 2015). 39
“Adoption of FinTech Could Double.” 40
Digital wallets in the U.S.: Minding the consumer adoption curve”,” McKinsey on Payments, Volume 8, #22 (October 2015). 41
‘The Future of Finance Part 3: the Socialization of Finance, Goldman Sachs Global Investment Research, (March 13, 2015). 42
“Funding Circle Loans Small UK Business Lender” The Guardian. ( December 29, 2015) 43
“China Moves to Cool Off Web Finance”. Wall Street Journal. ( December 29, 2015) 44
“Global Payments 2015” Capgemini Consulting and Royal Bank of Scotland. (October 6, 2015) 45
“Too Ambitious? Shanghai aims to be both top financial hub and “China’s Silicon Valley” South China Morning Post (April 1, 2015) 46
Global Payments 2015” Capgemini Consulting and Royal Bank of Scotland. . (October 6, 2015) 47
“China Moves to Cool Off Web Finance”. Wall Street Journal. (December 29, 2015) 48
“China's online P2P lending almost quadrupled in 2015” Xinhua (January 2, 2016) 49
P2P Lender Rides a Wave, Wall Street Journal (November, 24 2015) 50
“Statistics on Telecom Services for 2015” iDA Singapore. (January – June 2015) 51
“Asia’s mobile first world” Google Asia Pacific Blog (October 28, 2014) 52
“World Payments Report 2015” by Capgemini and The Royal Bank of Scotland 53
“Digital Banking for SMES” Deloitte Consulting, Mohit Mehrotra. (2015) 54
“Population in Brief 2015” National Population and Talent Division of the Singapore Department of Statistics. (September, 2015) 55
Consumers and Mobile Financial Services 2015, Board of Governors of the Federal Reserve System, (March 2015) 56
“Global Financial Centres Index” Mark Yeandle at Z/Yen Group. (May 4, 2015) 57
“Startups Bet on Financial Services and Still Dreams from Banks,” O Estado de São Paulo by Claudia Tozetto and Laura Macdonald, (October 12, 2015).
58 World Bank Financial Development database.
59 “World Payments Report 2015” by Capgemini and The Royal Bank of Scotland
60 EIU Statistics.
2016 ITA FinTech Top Markets Report | 39
61
“Cash Dominates Brazilian,” MarketLine Expert View (April 17, 2015). 62
“Brazil Lagging Behind Colombia.” Electronic Payments International by Robin Arnfeld. (March 23, 2015) 63
“The Biggest Mobile Payments Story You’ve Never Heard” by Elizabeth McQuerry (January 30, 2014) 64
“Brazil Lagging Behind Colombia.” Electronic Payments International by Robin Arnfeld. (March 23, 2015) 65
Angelia Mari, “Visa Launches Online Payments Service in Brazil,” Brazil Tech (October 23, 2015). 66
Daniel Vivacqua, “Busca por Finaciamento Coletivo Cresce na Crise,” Folha de São Paulo (December 28, 2015). 67
Ibid. 68
Gabriela Lara, “Nos EUA, Modelo Deve Movimentar US$ 3,5 bi neste ano,”O Estado de São Paulo (January 21, 2016). 69
“A look at Equity Crowdfunding Regulations in Brazil,” Crowdsourcing.org by Anton Root, (December 17, 2015). 70
“Retrocesso Digital,” O Estado de São Paulo (December 13, 2015). 71
Paul Fletcher, “Firms Must be Supported in Embracing FinTech,” The Australian (June 15, 2015). 72
“Unlocking the Potential: The FinTech Opportunity for Sydney,”KPMG (October 2014). 73
“The Term "FinTech" - the Marriage of Financial Services with Technology Companies,” StartUpSmart (May 27, 2015). 74
“Global Financial Centres Index 18” Z/Yen Group. (May 4, 2015) 75
“Unlocking the potential: The FinTech opportunity for Sydney” KMPG (October, 2014) 76
“Digital Payments are Coming – and Life will be Different,” Premium Official News (December 10, 2015). 77
“Digital Payments are Coming – and Life will be Different,” Premium Official News (December 10, 2015). 78
Clancy Yeates, “Australia Behind on P2P Payments,” Australian Financial Review (November 30, 2015). 79
Clancy Yeates, “Australia Behind on P2P Payments,” Australian Financial Review (November 30, 2015). 80
Ibid. 81
John Adams, “Australia’s Slow Move to Faster Payments,” Payments Source (April 15, 2015). 82
J James Eyers, “P2P Loans tipped to Hit $22B in Australia by 2020,”The Sydney Morning Herald (May 22, 2015). 83
James Eyers, “P2P Loans tipped to Hit $22B in Australia by 2020,”The Sydney Morning Herald (May 22, 2015). 84
“Global Marketplace Lending Disruptive Innovation in Financials,” Morgan Stanley Blue Paper (May 19, 2015). 85
James Eyers, “P2P Loans tipped to Hit $22B in Australia by 2020,”The Sydney Morning Herald (May 22, 2015). 86
Morgan Stanley. 87
“Crowdfunding Still too Costly,” Australian Financial Review (December 20, 2015) 88
“The Term "FinTech." 89 “Government Response to Australia’s FinTech Priorities,” http://fintech.treasury.gov.au/government-response-to-australias-fintech-
priorities/ (last accessed April 8, 2016). 90
James Eyers, “FinTechs Want a Touch More Disruption,” Australian Financial Review (December 9, 2015). 91
“Government Response to Australia’s FinTech Priorities,” http://fintech.treasury.gov.au/government-response-to-australias-fintech-priorities/ (last accessed April 8, 2016).
U.S. Department of Commerce | International Trade Administration | Industry & Analysis (I&A)
Industry & Analysis’ (I&A) staff of industry, trade and economic analysts devise and implement international trade, investment, and export promotion strategies that strengthen the global competitiveness of U.S. industries. These initiatives unlock export, and investment opportunities for U.S. businesses by combining in-depth quantitative and qualitative analysis with ITA’s industry relationships.
For more information, visit www.trade.gov/industry
I&A is part of the International Trade Administration, Whose mission is to create prosperity by strengthening the competitiveness of U.S. industry, promoting trade and investment, and ensuring fair trade and compliance with trade laws and agreements.