
2016 Teacher Preparation Report Card Technical Report · 2 2016 Teacher Preparation Report Card...
18
Technical Report 2016 Teacher Preparation Report Card
Transcript of 2016 Teacher Preparation Report Card Technical Report · 2 2016 Teacher Preparation Report Card...

Technical Report
2016 Teacher Preparation Report Card

22016 Teacher Preparation Report Card | Technical Report
Tennessee State Board of Education
Table of Contents
Report Card History and Changes 3
Key Terms 4-6
Report Card Generation and Performance Framework 7-10
Profile Page 11-12
Metric Tables 13-18
Candidate Profile 13-14
Employment 15-16
Provider Impact 17-18

32016 Teacher Preparation Report Card | Technical Report
Tennessee State Board of Education
Report Card History and Changes
In 2007, the Tennessee General Assembly passed legislation (T.C.A. § 49-1-606) requiring an annual,
public report on the effectiveness of teacher training programs. Since then, the state of Tennessee has
published a yearly report card that provides information such as rates of placement and retention,
demographic information, and teacher effectiveness data of recent graduates for each of the state’s
educator preparation providers.
Beginning in 2015, the State Board of Education, in partnership with the Department of Education,
assumed primary responsibility for the issuance of the Teacher Preparation Report Card (formerly the
Report Card on the Effectiveness of Teacher Training Programs). In previous years, the Tennessee Higher
Education Commission had primary responsibility for the data collection, design, and publication of the
report card.
In early spring 2016, the State Board began to solicit input from stakeholders at all levels of the
Tennessee education system in order to improve the content, format, and overall effectiveness of the
report card. In total, 468 unique stakeholders provided feedback via surveys and focus groups that was
carefully considered in the effort to produce the redesigned 2016 Report Card.
The new Teacher Preparation Report Card is also intended to reach a wider range of stakeholders
including school districts, aspiring teacher candidates, and other members of the public and provide
a range of consumer-friendly information about the state’s educator preparation providers and their
program completers.
42016 Teacher Preparation Report Card | Technical Report
Tennessee State Board of Education
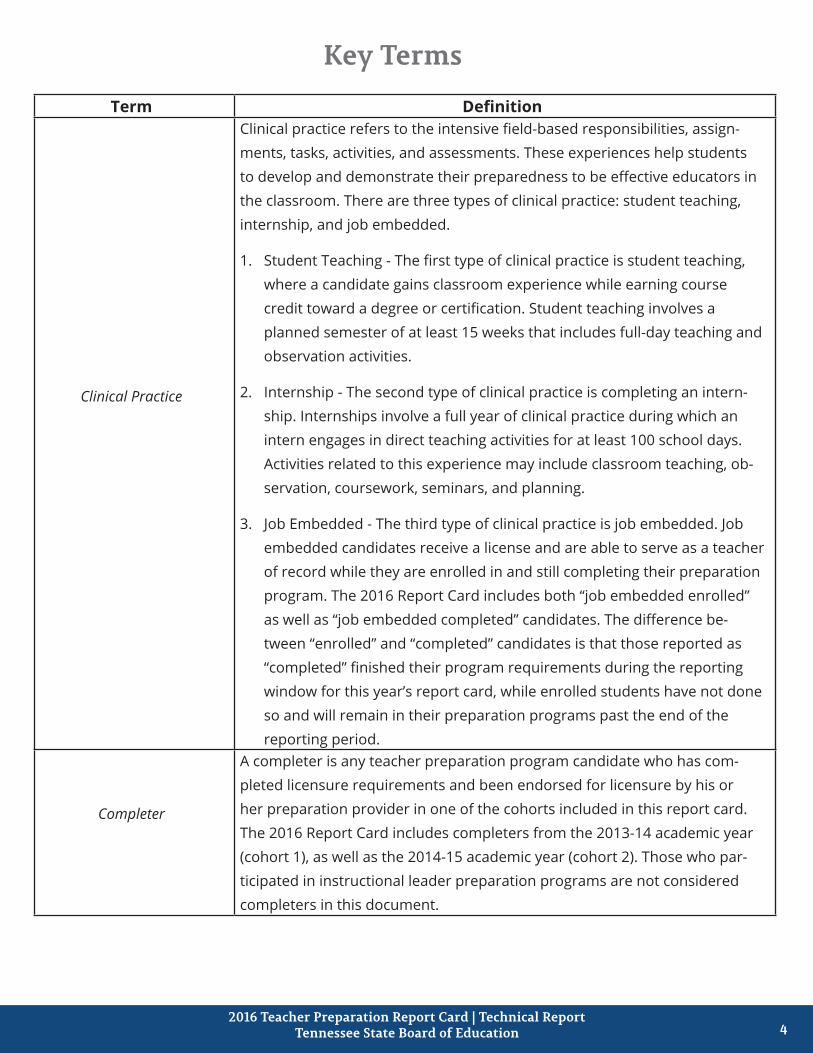
Key TermsTerm Definition
Clinical Practice
Clinical practice refers to the intensive field-based responsibilities, assign-ments, tasks, activities, and assessments. These experiences help students to develop and demonstrate their preparedness to be effective educators in the classroom. There are three types of clinical practice: student teaching, internship, and job embedded.
1. Student Teaching - The first type of clinical practice is student teaching, where a candidate gains classroom experience while earning course credit toward a degree or certification. Student teaching involves a planned semester of at least 15 weeks that includes full-day teaching and observation activities.
2. Internship - The second type of clinical practice is completing an intern-ship. Internships involve a full year of clinical practice during which an intern engages in direct teaching activities for at least 100 school days. Activities related to this experience may include classroom teaching, ob-servation, coursework, seminars, and planning.
3. Job Embedded - The third type of clinical practice is job embedded. Job embedded candidates receive a license and are able to serve as a teacher of record while they are enrolled in and still completing their preparation program. The 2016 Report Card includes both “job embedded enrolled” as well as “job embedded completed” candidates. The difference be-tween “enrolled” and “completed” candidates is that those reported as “completed” finished their program requirements during the reporting window for this year’s report card, while enrolled students have not done so and will remain in their preparation programs past the end of the reporting period.
Completer
A completer is any teacher preparation program candidate who has com-pleted licensure requirements and been endorsed for licensure by his or her preparation provider in one of the cohorts included in this report card. The 2016 Report Card includes completers from the 2013-14 academic year (cohort 1), as well as the 2014-15 academic year (cohort 2). Those who par-ticipated in instructional leader preparation programs are not considered completers in this document.

52016 Teacher Preparation Report Card | Technical Report
Tennessee State Board of Education
Term Definition
Educator Preparation Provider (EPP)
Educator preparation providers, also referred to as Providers or EPPs, are the universities, colleges, and education-related organizations that prepare Tennessee educators. Thirty of the state’s forty-one providers currently received scored report cards this year. The report card examines data at the provider level, rather than looking into specific programs or divisions within each institution.
Endorsement Area
Endorsement areas indicate the subject and/or grade level for which a licensed educator is prepared to provide instruction, leadership, or services in schools or districts. When applying for licensure, each teacher candidate must meet requirements in at least one area of endorsement, though many are endorsed in multiple areas.
Observation
Observation data refers to the 50% qualitative portion of data required by the state’s Teacher and Principal Evaluation Policy. All teachers receive mul-tiple observations that result in a yearly observation average. Districts must use one of the state’s approved observation instruments and submit data through TNCompass, the Tennessee Department of Education’s evaluation data system. More information regarding teacher observation can be found in the State Board of Education’s Teacher and Principal Evaluation Policy: http://tn.gov/sbe/topic/policies
Partnerships
There are two state-approved partnerships between providers who share responsibility for the preparation of completers. These two partnerships are between Lipscomb University and Teach for America Nashville as well as between Union University and the Memphis Teacher Residency. Completers involved with these partnerships are reported by both providers as com-pleters.

62016 Teacher Preparation Report Card | Technical Report
Tennessee State Board of Education
Term Definition
Program
Each educator preparation provider offers a number of different programs through which its candidates can prepare for licensure as Tennessee educa-tors. A complete list of the programs offered at each EPP can be found at the following link: https://www.tn.gov/education/article/educator-prep-programs-by-provider.
Report Card Advisory Council
In order to solicit detailed feedback throughout the 2016 Report Card rede-sign process, the State Board convened a twelve-member Advisory Council. The members of the Advisory Council included stakeholders from a variety of school districts and educator preparation providers, partner organizations with a strong stake in Tennessee education, a student member, and a State Board member representative.
Tennessee Value-Added Assessment System (TVAAS)
The Tennessee Value-Added Assessment System (TVAAS) measures the impact that teachers have on their students’ academic progress. Rather than measuring proficiency, TVAAS specifically captures student growth, so as to better represent the effect that teachers and their schools can have on students. TVAAS is scored from Levels 1-5, with Level 1 representing “Least Effective,” Level 3 representing “Average Effectiveness,” and Level 5 repre-senting “Most Effective”.

72016 Teacher Preparation Report Card | Technical Report
Tennessee State Board of Education
Report Card Generation and Performance FrameworkReport Card Generation
The 2016 Report Card was generated through partnerships between the State Board of Education,
individual preparation providers, the Tennessee Higher Education Commission, and the Tennessee
Department of Education. The data included in the report card represents multiple data sources and the
collective efforts of all the aforementioned partners to ensure that high quality data is presented on the
report card.
Data Included in the 2016 Report Card
The 2016 Report Card includes data from two cohorts of preparation completers:
• Cohort 1: Those who completed preparation between September 1, 2013 and August 31, 2014
• Cohort 2: Those who completed preparation and those who were candidates enrolled in a job
embedded preparation program between September 1, 2014 and August 31, 2014
In future years, the report card will use three cohorts of data.
The addition of the job-embedded enrolled candidate reporting requirement for cohort 2 was made so
that more accurate data on those candidates could be presented this year and in future years of the
report card. Job-embedded candidates receive a license and are able to serve as a teacher of record
while they are enrolled in and still completing their preparation program. As a result, it is important
that the report card begin to capture the effectiveness of these educators in their first year of teaching.
Previously, the report card captured these candidates only after they had fully completed their
preparation program.
Completers of instructional leader programs are not included in the report card.
Data Collection Process
Initial data for the report card is provided to the State Board of Education by individual providers.
Providers submit a roster of individuals who completed their preparation program (and in the case
of cohort 2, also job-embedded enrolled candidates), along with key demographic and assessment
information. The State Board of Education works with providers to verify the accuracy of their data
submissions. A variety of state data systems are then used to gather additional information on the
reported completers, such as license number, observation scores, value-added scores, and placement
data, to calculate the report card’s nine metrics.
82016 Teacher Preparation Report Card | Technical Report
Tennessee State Board of Education
Performance Framework
Each provider is assigned an overall performance category based on their performance on the nine
metrics that comprise the 2016 Report Card’s Performance Framework. The Performance Framework’s
three domains are Candidate Profile, Employment, and Provider Impact.
Weighting System
Point values for each metric were set after thoroughly reviewing completer data and consulting with a
variety of stakeholders at all levels of Tennessee’s education system. In addition to ensuring that each
metric was properly considered, the report card’s weighing system also took into account the relative
value of the data in each domain. The Report Card Advisory Council provided significant input throughout
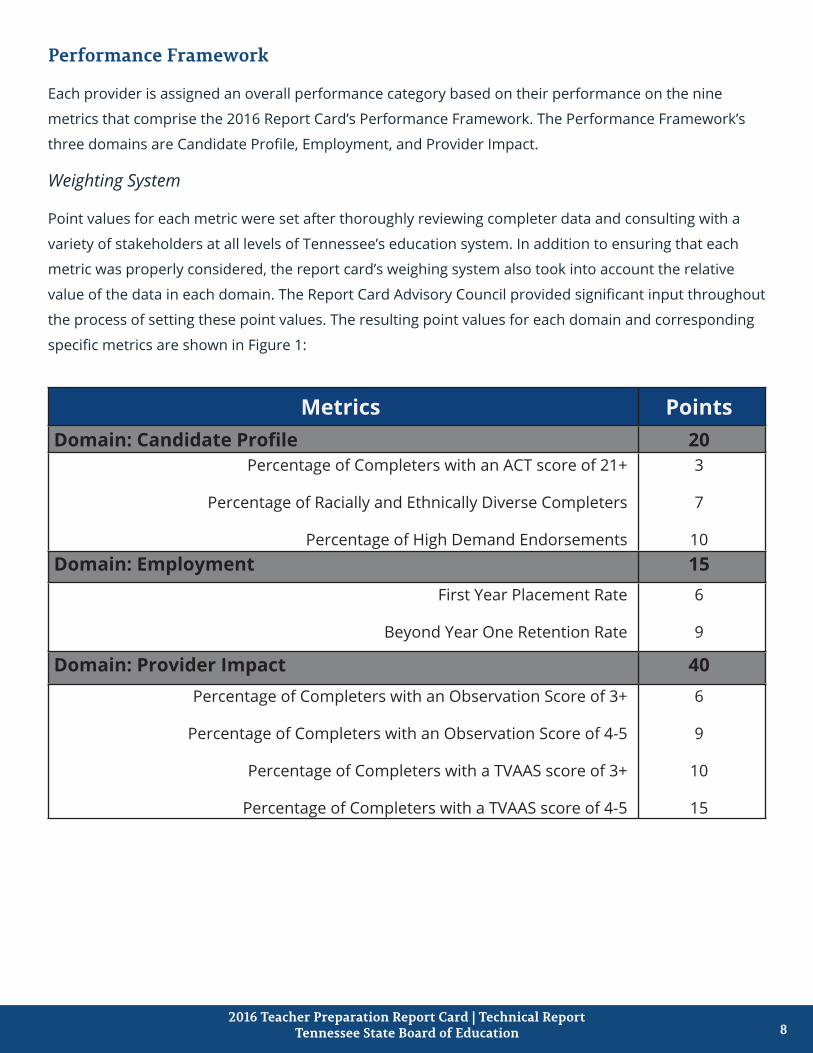
the process of setting these point values. The resulting point values for each domain and corresponding
specific metrics are shown in Figure 1:
Metrics PointsDomain: Candidate Profile 20
Percentage of Completers with an ACT score of 21+
Percentage of Racially and Ethnically Diverse Completers
Percentage of High Demand Endorsements
3
7
10Domain: Employment 15
First Year Placement Rate
Beyond Year One Retention Rate
6
9
Domain: Provider Impact 40Percentage of Completers with an Observation Score of 3+
Percentage of Completers with an Observation Score of 4-5
Percentage of Completers with a TVAAS score of 3+
Percentage of Completers with a TVAAS score of 4-5
6
9
10
15

92016 Teacher Preparation Report Card | Technical Report
Tennessee State Board of Education
There are 25 points remaining for future allocation, when new metrics and the Satisfaction domain are
added in future years.
Metric Scores
Providers are able to earn up to the maximum number of points for each of the nine metrics (Figure 1)
based on their performance. Points are awarded based on the provider’s performance relative to the
minimum standard and target.
The minimum standard represents the value below which providers will earn zero points for a metric,
while the target represents the value that earns all possible points. The minimum standard and targets
were set at the 10th and 90th percentiles of scored providers on the initial data set compiled. All values
between the minimum standard and the target will receive a proportionate percentage of the available
points. This can be calculated by subtracting the minimum standard from the value and dividing the
result by the difference between the target and the minimum. An example how metric scores are illus-
trated on the report card is included in Figure 2.

102016 Teacher Preparation Report Card | Technical Report
Tennessee State Board of Education
Domain Scores
Providers are assigned a performance category of 1-4 for each domain. Domain-level performance cate-
gory designations are based on the percentage of available points providers earn on all of the domain’s
metrics. The amount of points available for each metric is weighted based on the framework detailed in
Figure 1.
In cases where the provider is missing a metric but still received a score for the domain, the points for
the missing metric will be dropped from the numerator as well as the denominator. As a result, not
every report card will have the same number of possible points. This will not affect the overall perfor-
mance category, which is based on the provider’s percentage of possible points earned rather than total
points.
Overall Performance Category
Each provider is assigned to an overall performance category based on the percentage of points earned
across the nine metrics. The overall performance categories are detailed in Figure 3:
N-Size Requirements
There must be at least ten completers for a metric value to be calculated. Whenever the n-size require-
ment is met for a paticular metric value, that provider’s metric score will be reported.
If a provider does not meet n-size requirements for more than half of the metrics within a domain, a
domain score will not be calculated. Any provider with a missing domain score will not receive an overall
performance category in the 2016 Report Card.
Report cards are not produced for any provider with fewer than ten combined completers in cohorts 1
and 2.

112016 Teacher Preparation Report Card | Technical Report
Tennessee State Board of Education
Profile PageEach report card includes a profile page, which contains descriptive information shared by each provider.
The profile page also contains background and demographic information for each provider’s completers.
Specific details for each of the measures on the profile page are included in the following table:
Measure Description
Number of CompletersThis represents the total number of completers at each provider across all years represented in the report card. For 2016, this includes completers from cohorts 1 and 2.
Percentage of Total State Completers
This metric reports the percentage of the state’s total completers that come from each provider. The number of completers from cohorts 1 and 2 are in-cluded in this value.
Percentage of Completers by Race and Ethnicity
This represents the percentages of each provider’s completers that are report-ed as coming from each racial or ethnic background. Providers reported the race and ethnicity of their students based on the requirements of Title II of the Higher Education Act. Students whose race was not provided or whose race was indicated as “unknown” are not included in these calculations.
Percentage of Completers by State of Residency
This metric tracks the percentage of in-state versus out-of-state completers. All students who are reported as having a Tennessee residence are recorded as in-state, and all other completers, including international completers, are recorded as out-of-state.
Percentage of Completers by Type of Program
There are three different types of programs included in this measure: bac-calaureate, post-baccalaureate, and licensure-only. All baccalaureate and post-baccalaureate candidates who completed their licensure and degree requirements during the report card’s reporting window are included in those respective categories. The licensure-only category includes completers that did not receive a degree but completed licensure requirements through an ap-proved preparation provider during the reporting period.
122016 Teacher Preparation Report Card | Technical Report
Tennessee State Board of Education
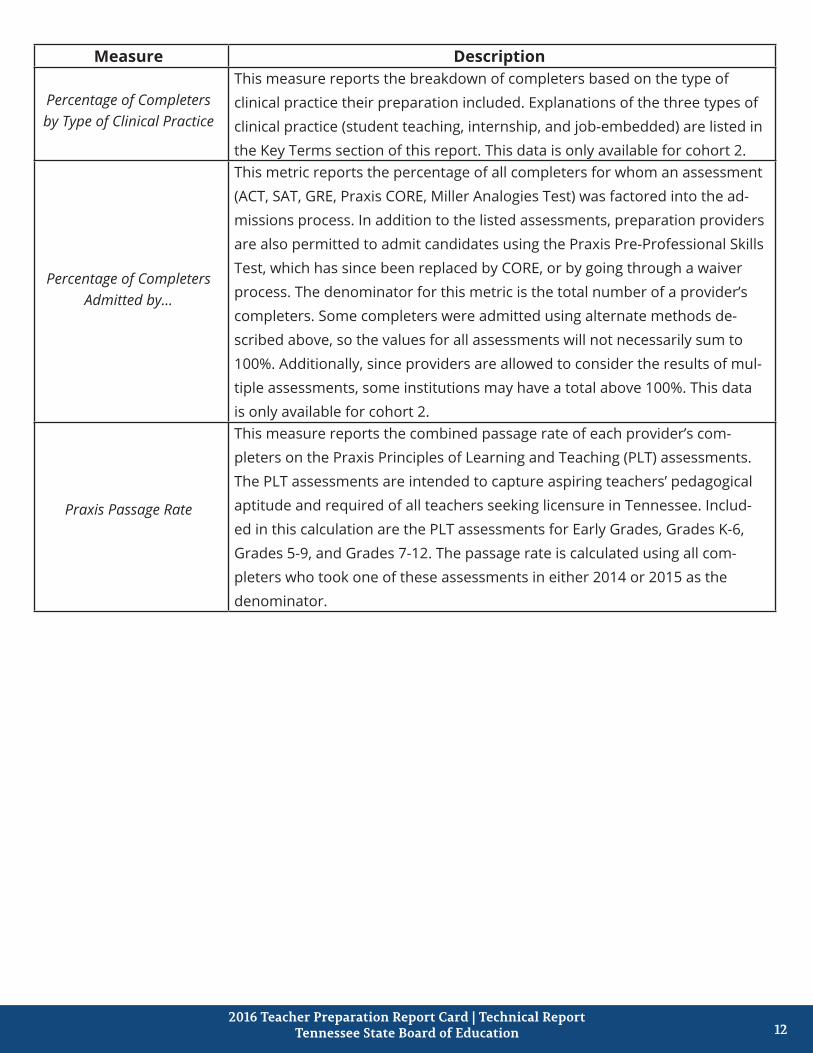
Measure Description
Percentage of Completers by Type of Clinical Practice
This measure reports the breakdown of completers based on the type of clinical practice their preparation included. Explanations of the three types of clinical practice (student teaching, internship, and job-embedded) are listed in the Key Terms section of this report. This data is only available for cohort 2.
Percentage of Completers Admitted by...
This metric reports the percentage of all completers for whom an assessment (ACT, SAT, GRE, Praxis CORE, Miller Analogies Test) was factored into the ad-missions process. In addition to the listed assessments, preparation providers are also permitted to admit candidates using the Praxis Pre-Professional Skills Test, which has since been replaced by CORE, or by going through a waiver process. The denominator for this metric is the total number of a provider’s completers. Some completers were admitted using alternate methods de-scribed above, so the values for all assessments will not necessarily sum to 100%. Additionally, since providers are allowed to consider the results of mul-tiple assessments, some institutions may have a total above 100%. This data is only available for cohort 2.
Praxis Passage Rate
This measure reports the combined passage rate of each provider’s com-pleters on the Praxis Principles of Learning and Teaching (PLT) assessments. The PLT assessments are intended to capture aspiring teachers’ pedagogical aptitude and required of all teachers seeking licensure in Tennessee. Includ-ed in this calculation are the PLT assessments for Early Grades, Grades K-6, Grades 5-9, and Grades 7-12. The passage rate is calculated using all com-pleters who took one of these assessments in either 2014 or 2015 as the denominator.
132016 Teacher Preparation Report Card | Technical Report
Tennessee State Board of Education
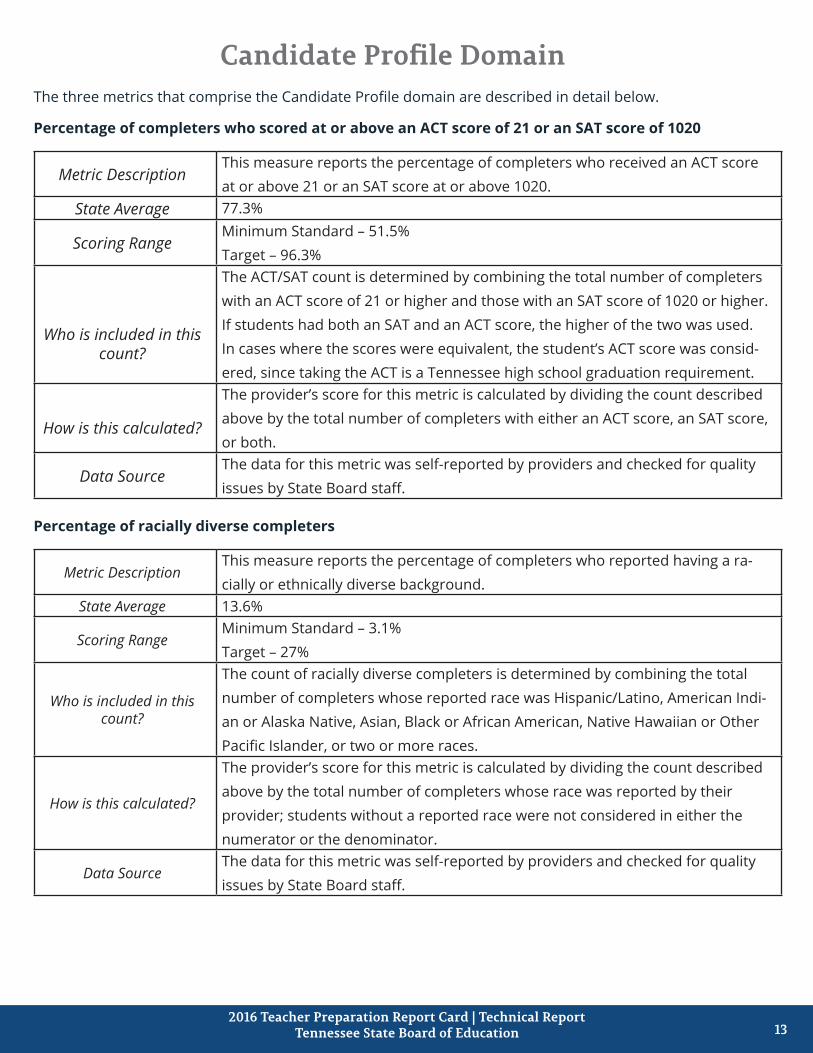
Candidate Profile DomainThe three metrics that comprise the Candidate Profile domain are described in detail below.
Percentage of completers who scored at or above an ACT score of 21 or an SAT score of 1020
Metric DescriptionThis measure reports the percentage of completers who received an ACT score at or above 21 or an SAT score at or above 1020.
State Average 77.3%
Scoring RangeMinimum Standard – 51.5%Target – 96.3%
Who is included in this count?
The ACT/SAT count is determined by combining the total number of completers with an ACT score of 21 or higher and those with an SAT score of 1020 or higher. If students had both an SAT and an ACT score, the higher of the two was used. In cases where the scores were equivalent, the student’s ACT score was consid-ered, since taking the ACT is a Tennessee high school graduation requirement.
How is this calculated?
The provider’s score for this metric is calculated by dividing the count described above by the total number of completers with either an ACT score, an SAT score, or both.
Data SourceThe data for this metric was self-reported by providers and checked for quality issues by State Board staff.
Percentage of racially diverse completers
Metric DescriptionThis measure reports the percentage of completers who reported having a ra-cially or ethnically diverse background.
State Average 13.6%
Scoring RangeMinimum Standard – 3.1%Target – 27%
Who is included in this count?
The count of racially diverse completers is determined by combining the total number of completers whose reported race was Hispanic/Latino, American Indi-an or Alaska Native, Asian, Black or African American, Native Hawaiian or Other Pacific Islander, or two or more races.
How is this calculated?
The provider’s score for this metric is calculated by dividing the count described above by the total number of completers whose race was reported by their provider; students without a reported race were not considered in either the numerator or the denominator.
Data SourceThe data for this metric was self-reported by providers and checked for quality issues by State Board staff.

142016 Teacher Preparation Report Card | Technical Report
Tennessee State Board of Education
Percentage of high-demand endorsements
Metric Description
This measure reports the percentage of all endorsements issued in the area of English as a Second Language, Secondary Math, Secondary Science (Biology, Chemistry, and Physics), Spanish, and Special Education (Modified, Comprehen-sive, and Interventionist).
State Average 21.7%
Scoring RangeMinimum Standard – 5.9%Target – 33.7%
Who is included in this count?
The high-demand endorsement count is determined by combining the total number of licenses issued to a provider’s completers in the following areas: En-glish as a Second Language: 490; Secondary Math: 125, 413; Secondary Science (which includes Biology: 126, 415; Chemistry: 127, 416; and Physics: 129, 417); Spanish: 169, 409, 495; and Special Education (which includes Modified: 460; Comprehensive: 461; and Interventionist: 144, 145).
How is this calculated?
The provider’s score for this metric is calculated by dividing the count described above by the total number of endorsements issued to completers in cohorts 1 and 2. Both primary and additional endorsements are included in this calcula-tion.
Data SourceThe data for this metric was self-reported by providers and checked for quality issues by State Board staff.

152016 Teacher Preparation Report Card | Technical Report
Tennessee State Board of Education
EmploymentThe two metrics that comprise the Employment domain are described in detail below.
First year placement rate
Metric DescriptionThis measure reports the rate at which completers were placed in Tennessee public schools within one year of receiving their initial license.
State Average 65.5%
Scoring RangeMinimum Standard – 52.7%Target – 80.7%
Who is included in this count?
The placement count is determined by combining the total number of com-pleters who were employed in Tennessee public schools in the first year after receiving their initial license. Starting with cohort 2, placement for those in job-embedded programs will be based on the first academic year in which they are reported. Completers who were employed in private schools or in schools in another state are not considered in this count. This count also may not currently capture all completers who are placed in charter schools.
How is this calculated?
The provider’s score for this metric is calculated by dividing the count described above by the total number of completers who were given a Tennessee Teacher License Number. Those who did not seek or receive a Tennessee license are excluded from this calculation.
Data Source
This data was collected using a combination of resources including administra-tive and licensure data synthesized by the University of Tennessee, Knoxville’s Center for Business and Economic Research and evaluation data stored in TNCompass, the Tennessee Department of Education’s evaluation data system, and provided to the State Board by the Tennessee Department of Education. In addition, all completers with a TVAAS score are counted toward this metric.

162016 Teacher Preparation Report Card | Technical Report
Tennessee State Board of Education
Beyond year one retention rate
Metric DescriptionThis measure reports the percentage of completers who were placed and re-main teaching in Tennessee public schools the following year.
State Average 91.4%
Scoring RangeMinimum Standard – 77.8%Target – 95.5%
Who is included in this count?
The retention count is determined by combining the total number of completers who were employed in a Tennessee public school in their first year after com-pleting their teacher preparation program that also remained in a Tennessee public school the following year. For job-embedded completers in cohort 2, retention is based on the year after the first year in which they were reported. Completers who were employed in private schools or in schools in another state are not considered in this count. This count may not currently capture all com-pleters who are placed in charter schools.
How is this calculated?The provider’s score for this metric is calculated by dividing the count described above by the total number of completers who were employed in a Tennessee public school in the first year after completing their preparation program.
Data Source
This data was collected using a combination of resources including administra-tive and licensure data synthesized by the University of Tennessee, Knoxville’s Center for Business and Economic Research and evaluation data stored in TNCompass and provided to the State Board by the Tennessee Department of Education. In addition, all completers with a TVAAS score are counted toward this metric.
172016 Teacher Preparation Report Card | Technical Report
Tennessee State Board of Education
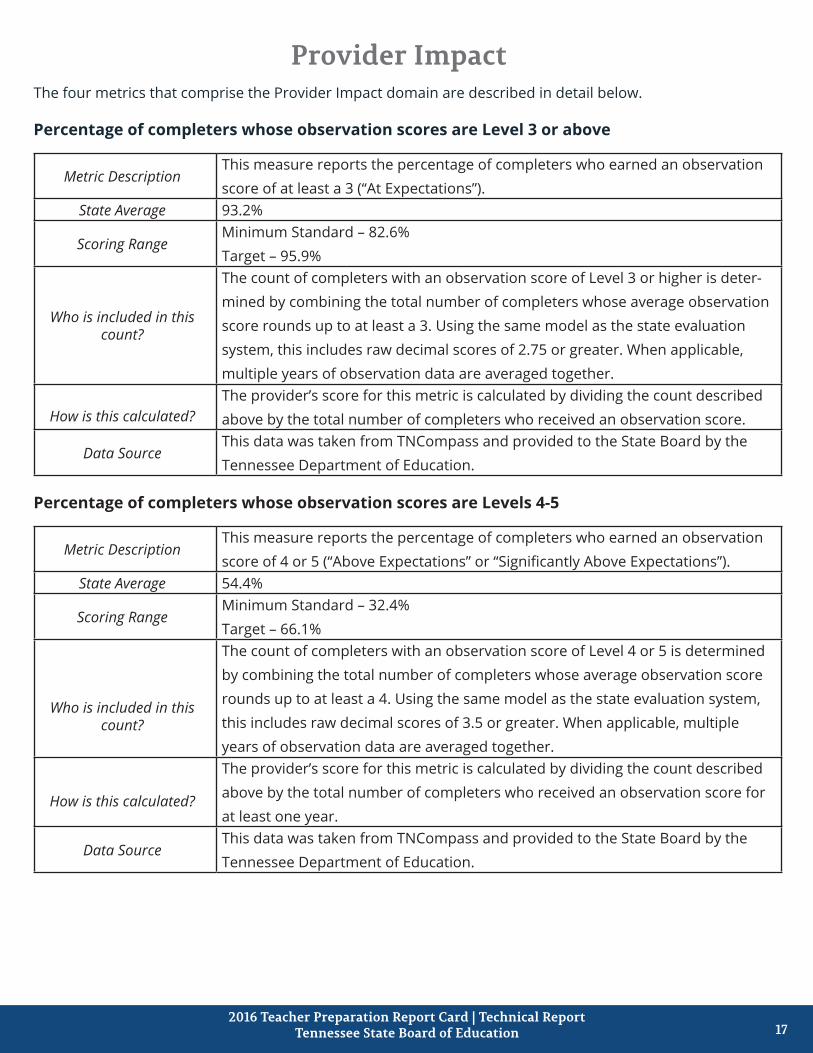
Provider ImpactThe four metrics that comprise the Provider Impact domain are described in detail below.
Percentage of completers whose observation scores are Level 3 or above
Metric DescriptionThis measure reports the percentage of completers who earned an observation score of at least a 3 (“At Expectations”).
State Average 93.2%
Scoring RangeMinimum Standard – 82.6%Target – 95.9%
Who is included in this count?
The count of completers with an observation score of Level 3 or higher is deter-mined by combining the total number of completers whose average observation score rounds up to at least a 3. Using the same model as the state evaluation system, this includes raw decimal scores of 2.75 or greater. When applicable, multiple years of observation data are averaged together.
How is this calculated?The provider’s score for this metric is calculated by dividing the count described above by the total number of completers who received an observation score.
Data SourceThis data was taken from TNCompass and provided to the State Board by the Tennessee Department of Education.
Percentage of completers whose observation scores are Levels 4-5
Metric DescriptionThis measure reports the percentage of completers who earned an observation score of 4 or 5 (“Above Expectations” or “Significantly Above Expectations”).
State Average 54.4%
Scoring RangeMinimum Standard – 32.4%Target – 66.1%
Who is included in this count?
The count of completers with an observation score of Level 4 or 5 is determined by combining the total number of completers whose average observation score rounds up to at least a 4. Using the same model as the state evaluation system, this includes raw decimal scores of 3.5 or greater. When applicable, multiple years of observation data are averaged together.
How is this calculated?
The provider’s score for this metric is calculated by dividing the count described above by the total number of completers who received an observation score for at least one year.
Data SourceThis data was taken from TNCompass and provided to the State Board by the Tennessee Department of Education.

182016 Teacher Preparation Report Card | Technical Report
Tennessee State Board of Education
Percentage of completers whose TVAAS scores are Level 3 or above
Metric DescriptionThis measure reports the percentage of completers who earned a Tennessee Value-Added Assessment System (TVAAS) score of at least a 3 (“At Expectations”).
State Average 61.4%
Scoring RangeMinimum Standard – 45.5%Target – 69.9%
Who is included in this count?
The count of completers with a TVAAS score of Level 3 or higher is determined by combining the total number of completers who received a TVAAS composite score of 3, 4, or 5. TVAAS composites assess the growth made by a teacher’s students, rather than overall levels of proficiency. Level 3 indicates that students are making expected growth, while Levels 4 and 5 indicate that the teacher’s students are exceeding expected growth. When applicable, the multi-year com-posite score was used.
How is this calculated?
The provider’s score for this metric is calculated by dividing the count described above by the total number of completers who received a TVAAS composite score for at least one year.
Data SourceThis data was provided to the State Board by SAS Institute, which conducts TVAAS analysis for Tennessee.
Percentage of completers whose TVAAS scores are Levels 4-5
Metric DescriptionThis measure reports the percentage of completers who earned a Tennessee Value-Added Assessment System (TVAAS) score of 4 or 5 (“Above Expectations” or “Significantly Above Expectations”).
State Average 29.2%
Scoring RangeMinimum Standard – 9.1%Target – 37.7%
Who is included in this count?
The count of completers with a TVAAS score of Level 4 or 5 is determined by combining the total number of completers who received a Tennessee Val-ue-Added Assessment System (TVAAS) composite score of 4 or 5. TVAAS com-posites assess the growth made by a teacher’s students, rather than overall levels of proficiency. Levels 4 and 5 indicate that the teacher’s students are exceeding expected growth. When applicable, the multi-year composite score was used.
How is this calculated?The provider’s score for this metric is calculated by dividing the count described above by the total number of completers who received a TVAAS composite score for at least one year.
Data SourceThis data was provided to the State Board by SAS Institute, which conducts TVAAS analysis for Tennessee.