2016 TC Rainfall - World Weather Information...
64
Tropical Cyclone Rainfall Jessica Schauer National Hurricane Center Tropical Analysis and Forecast Branch Lead Forecaster
Transcript of 2016 TC Rainfall - World Weather Information...

Tropical Cyclone Rainfall
Jessica SchauerNational Hurricane Center
Tropical Analysis and Forecast BranchLead Forecaster

Outline
• Tropical Cyclone (TC) rainfall climatology
• Factors influencing TC rainfall
• TC rainfall forecasting tools
• TC rainfall forecasting process

Tropical Cyclone Rainfall Climatology

Tropical Cyclone Tracks
COMET (2011)

Global Mean Monthly TC Rainfall During the TC Season and Percent of Total Annual Rainfall
Jiang and
Zipser (2010)
Data from TRMM 2A25 Precipitation Radar from 1998-2006

Annual TC Rainfall
� TC rainfall makes up a larger percentage of total rainfall during years when global rainfall is low
� Asymmetric - generally more TC rainfall in the Northern Hemisphere
� TCs produce 10-17% of global rain from 15-25°N
� TCs produce 5-10% of global rain from 15-25°S
TC Rain
Frank Marks (HRD)
Equator
TC Rain % of Total Rain

Biggest TC Rain Producers By Country/Island
Original Source: David Roth WPC (2006)
Belize 829.8 mm 32.67” Keith (2000)Bermuda 186.7 mm 7.35” October 1939 HurricaneCanada 302.0 mm 11.89” Harvey (1999)Cayman Islands 764.8 mm 31.29” Sanibel Island Hurricane (1944)Costa Rica 920.0 mm 36.22” Cesar (1996)Cuba 2550.0 mm 100.39” Flora (1963)Dominica 422.3 mm 16.63” Jeanne (2004)Dominican Rep. 1001.5 mm 39.43” Flora (1963)El Salvador 406.4 mm 16.00” Adrian (2005)Guadeloupe 508.0 mm 20.00” Marilyn (1995)Guatemala 600.0 mm 23.62” Mitch (1998)Haiti 1447.8 mm 57.00” Flora (1963)Honduras 912.0 mm 35.89” Mitch (1998)Jamaica 3429.0 mm 135.00” November 1909 HurricaneMartinique 680.7 mm 26.80” Dorothy (1970)Mexico 1576.0 mm 62.05” Wilma (2005)Nicaragua 1597.0 mm 62.87” Mitch (1998)Panama 695.0 mm 27.36” Mitch (1998)Puerto Rico 1058.7 mm 41.68” T.D. #19 (1970)St. Lucia 668.0 mm 26.30” Tomas (2010)St. Martin/Maarten 866.6 mm 34.12” Lenny (1999)Venezuela 339.0 mm 13.30” Brett (1993)

Characteristics of TC Precipitation
Stratiform and Convective MechanismsStratiform Rain ~50% of Total Rain from TC
Frank Marks (HRD)
Hurricane Irene (15 October 1999)
NOAA/HRD - Daily Radar Rainfall Estimate Study
Typical warm season 1-day total Hurricane Irene 1-day total
Primarily
Convective
Stratiform
&
Convective

TC Rainband Complexes : Stratiform Region
Didlake and
Houze (2013)
• Broad stratiform band in left-of-shear half of the storm
• Mesoscale ascending outflow & descending inflow driven by latent
heating & latent cooling patterns
• Increased rainfall along line where descending inflow halts
• Descending inflow strengthens the outer core of vortex
Marchok (2014)
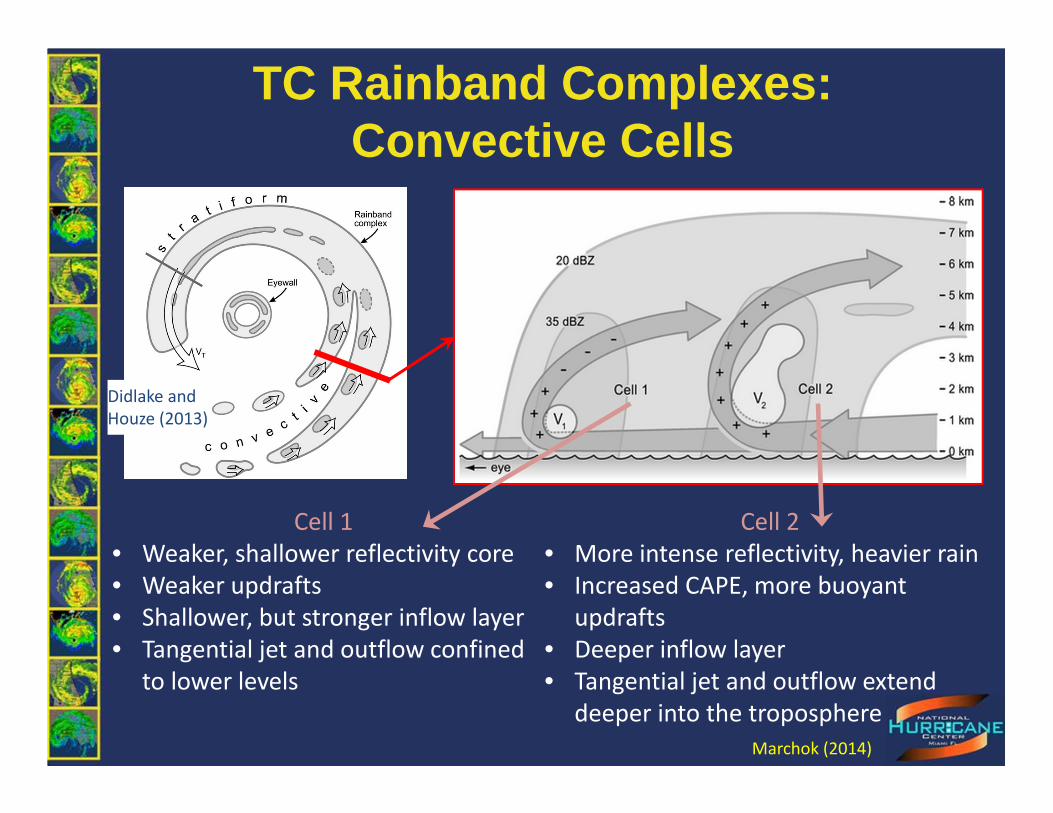
TC Rainband Complexes : Convective Cells
Marchok (2014)
Cell 1
• Weaker, shallower reflectivity core
• Weaker updrafts
• Shallower, but stronger inflow layer
• Tangential jet and outflow confined
to lower levels
Cell 2
• More intense reflectivity, heavier rain
• Increased CAPE, more buoyant
updrafts
• Deeper inflow layer
• Tangential jet and outflow extend
deeper into the troposphere
Didlake and
Houze (2013)

Factors Influencing Tropical Cyclone Rainfall

What Factors Influence Rainfall from Tropical Cyclones?
• Movement – slow forward motion can produce more rain
• Storm size – the larger the storm, the greater the area typically receiving rain
• Storm track – factor in the location of the rain
• Diurnal cycle – heaviest rainfall generally near the storm center overnight, outer band rainfall during the day
• Topography – enhances rainfall in upslope areas, but decreases rainfall past the spine of the mountains
• Moisture – Entrainment of dry air can redistribute and/or reduce the amount of precipitation; increased moisture can increase rainfall
• Interaction with other meteorological features (troughs, fronts, jets) and extratropical transition can greatly modify rainfall distribution
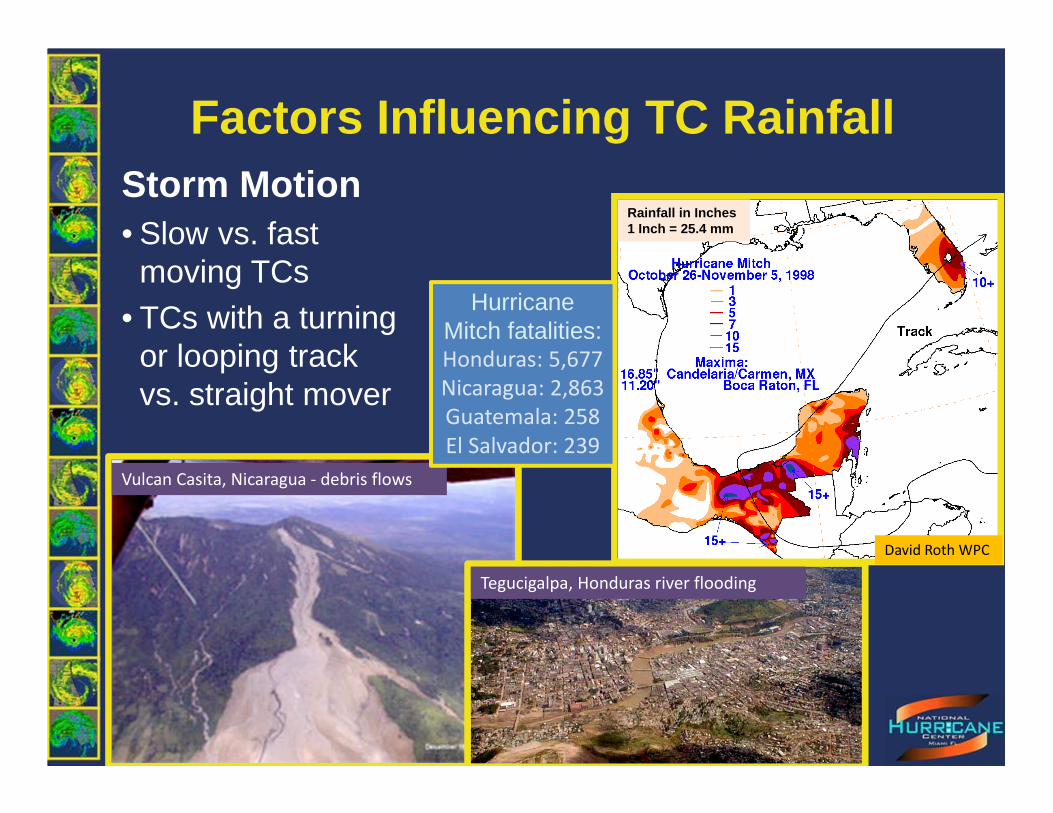
Factors Influencing TC Rainfall Storm Motion• Slow vs. fast
moving TCs• TCs with a turning
or looping track vs. straight mover
Vulcan Casita, Nicaragua - debris flows
Tegucigalpa, Honduras river flooding
Hurricane Mitch fatalities:Honduras: 5,677
Nicaragua: 2,863
Guatemala: 258
El Salvador: 239
Rainfall in Inches1 Inch = 25.4 mm
David Roth WPC

Storm Size
<2 degrees “Very small/ midget”
Marco (2008)
2-3 degrees “Small” Ida(2009)
3-6 degrees “Average” Frances(2008)
6-8 degrees “Large” Wilma(2008)
>8 degrees “Very large” Sandy(2012)
Determined by distance from center to outermost closed isobar
Original Source: Joint Typhoon Warning Center
Factors Influencing TC Rainfall

Time of DayAlberto, July 4-5, 1994
04/18z 00z
05/06z 12z 18z
Factors Influencing TC Rainfall

Factors Influencing TC Rainfall
04/18z 00z
05/06z 12z 18z
Time of DayAlberto, July 4-5, 1994

Factors Influencing TC Rainfall
Terrain ImpactsHeaviest rainfall favors mountains perpendicular to the wind
Hurricane Georges in Puerto Rico$1.75 billion in damage
28,005 homes destroyed
Rainfall in Inches1 Inch = 25.4 mm
David Roth WPC
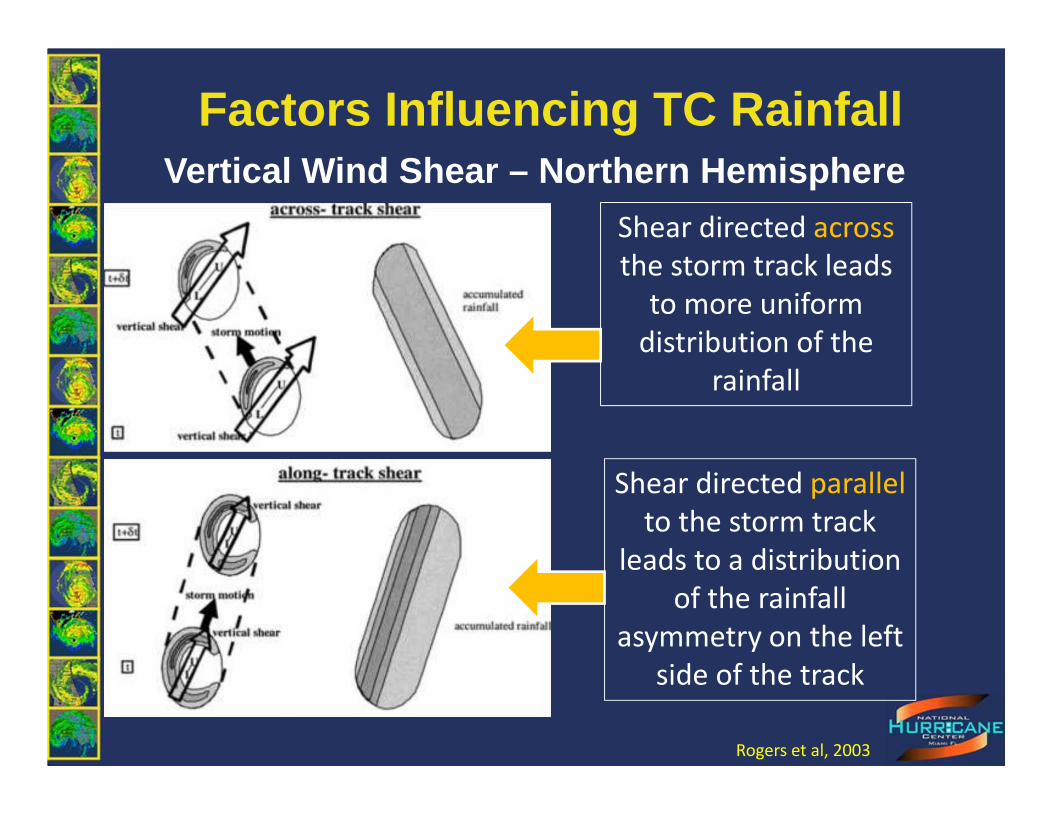
Vertical Wind Shear – Northern Hemisphere
Factors Influencing TC Rainfall
Shear directed across
the storm track leads
to more uniform
distribution of the
rainfall
Shear directed parallel
to the storm track
leads to a distribution
of the rainfall
asymmetry on the left
side of the track
Rogers et al, 2003

Environmental Steering in Northern Hemisphere• Very slow moving TCs and symmetrical TCs produce the most
rainfall near the center • Maximum rainfall at night
(especially when over land)• Weak steering flow
• TCs that move into a break in the subtropical ridge often produce most of the rain right of their track
• TCs that recurve due to significant upper troughs in the westerlies often produce most of their rain left of their track• Rainfall may spread well in advance of the TC due to interaction with the
upper jet on the leading edge of the trough
Factors Influencing TC Rainfall
Even rainfall
distribution =
Rain over
smaller area
on right side =
Higher totalsTRACK

Factors Influencing TC Rainfall
Revised & Updated from Fig. 13, Bosart
and Carr (1978)
• Moisture transport well ahead of TC itself• Coherent area of rain displaced north of the TC (near a front or over terrain)
• Maximum rainfall rates can exceed 200 mm in 24 hr• Occurs for approximately 1 of 3 landfalling TCs in U.S.
Predecessor Rainfall Event (PRE) Image from Matt Cote and Lance Bosart –
SUNY Albany
Predecessor Rainfall Events

Factors Influencing TC Rainfall
0015 UTC 8 Nov
0315 UTC 8 Nov
0615 UTC 8 Nov
0915 UTC 8 Nov
“ Twin” Disturbance or Other Secondary Features
Ida(2009)
Disturbance

Where is Flooding from Tropical Cyclones Likely to Occur?
• Areas where the ground is already saturated (low flash flood guidance values)
• Valleys/watersheds• Areas of orographic
enhancement• Areas with poor
drainage or prone to runoff
• Areas with directed drainage that can be overwhelmed
Clear Cut Areas in Haiti
Costa Rica stream flooding

TC Rainfall Forecasting Tools

NHC Satellite Tropical Disturbance Rainfall Estimat es
TCCA Products
• Estimate rainfall rates for tropical cyclones based on the cloud top temperature data acquired using infrared satellite imagery (Griffith-Woodley technique)
• Uses the infrared imagery to determine the size of the area receiving rain
• Calculates a maximum or “core” rainfall amount
• Apportions the rainfall into a distribution where 50% of the total area average rainfall occurs in the coldest 10% of the cloud top area.
NHC Satellite Tropical Disturbance Rainfall Estimat es
TCCA Products
Product Replaced
in 2013

Changes to NHC Rainfall Product
Limitation of old product: Rainfall is not physically related to cloud-top temperature (IR)
Improvements:Incorporate microwave (MW) satellite data (rainfall rates)
• NHC uses two different merged satellite rainfall estimation techniques to replace the IR-only method:
- NRL-Blend and QMORPH incorporate available MW data and propagate precipitation forward in time via IR
- Training on the NRL-Blend technique:http://www.nrlmry.navy.mil/training-bin/training.cgi
• As a third product, NHC uses the last applicable GFS forecast
- A model forecast has the advantage of dynamics, topography, moisture, etc.

NHC Rainfall Product: Why Microwave?
• Geostationary IR data provides excellent spatiotemporal resolution, but is not optimal for rain estimation
• Microwave provides improved rainfall accuracy but at low temporal resolution
• Quantitative precipitation estimate (QPE) products leverage each method’s strength…
Coldest cloud tops not precipitating!

Satellite Rainfall EstimatesInternational Precipitation Working Group (IPWG) has an exhaustive list of data
sources for precipitation information, some of it in real time. http://www.isac.cnr.it/~ipwg/data/datasets.html
TRMM MPA
NRL-Blend
Meteosat
Hydro-Estimator
SCaMPER

Satellite Rainfall EstimatesThe TRMM-based, near-real time Multi- satellite Precipitation Analysis (MPA)
International Precipitation Working Group (IPWG) has an exhaustive list of data sources for precipitation information, some of it in real time.
http://www.isac.cnr.it/~ipwg/data/datasets.html
TRMM MPAhttp://pmm.nasa.gov/node/171
NRL-Blend http://www.nrlmry.navy.mil/sat-bin/rain.cgi
Meteosathttp://oiswww.eumetsat.org/IPPS/html/MSG/PRODUCTS/MPE/
Hydro-Estimator http://www.star.nesdis.noaa.gov/smcd/emb/ff/HEcentralAmerica.php
SCaMPERhttp://www.star.nesdis.
noaa.gov/smcd/emb/ff
/SCaMPR.php

New NHC Rainfall Product: TextCreated for every “invest” system
Can be created for any disturbance
Rainfall product still available in text format like the old product
Differences in content and format compared to the old product:� 6-hour quantitative precipitation estimates
from 3 methods
� Presented as a range of rainfall within a 1ºx1º box
� Covers total area of 6ºx6º centered near disturbance
• Earth-relative coordinates (i.e. no reference to “left-of-center”/”right of center”)

- 24-hour QPE from 3 methods
- Lat-lon grid of rainfall accumulation
- 6-h accumulation ranges (in mm)
- Differences in the 3 rainfall estimates reveal uncertainty
New NHC Rainfall Product: Text

Experimental NHC Rainfall Product: QPE Graphics
6-hour quantitative precipitation estimates from 3 methods:
t-6h GFS QMORPH NRL-Blend
These 6-hour QPE graphics correspond to the values in the tables in the text product
24-hour quantitative precipitation estimate graphics are also available

New NHC Rainfall Webpage
http://www.nhc.noaa.gov/
marine/rainfall/
34
Tropical cyclone or disturbance
identifier
24-hr model quantitative
precipitation forecast (QPF) graphics
Link to the “new” text product
6-hour quantitative precipitation
estimate (QPE) graphics
Link to 24-hour QPE graphics
Product descriptions
Other tropical rainfall tools and
resources
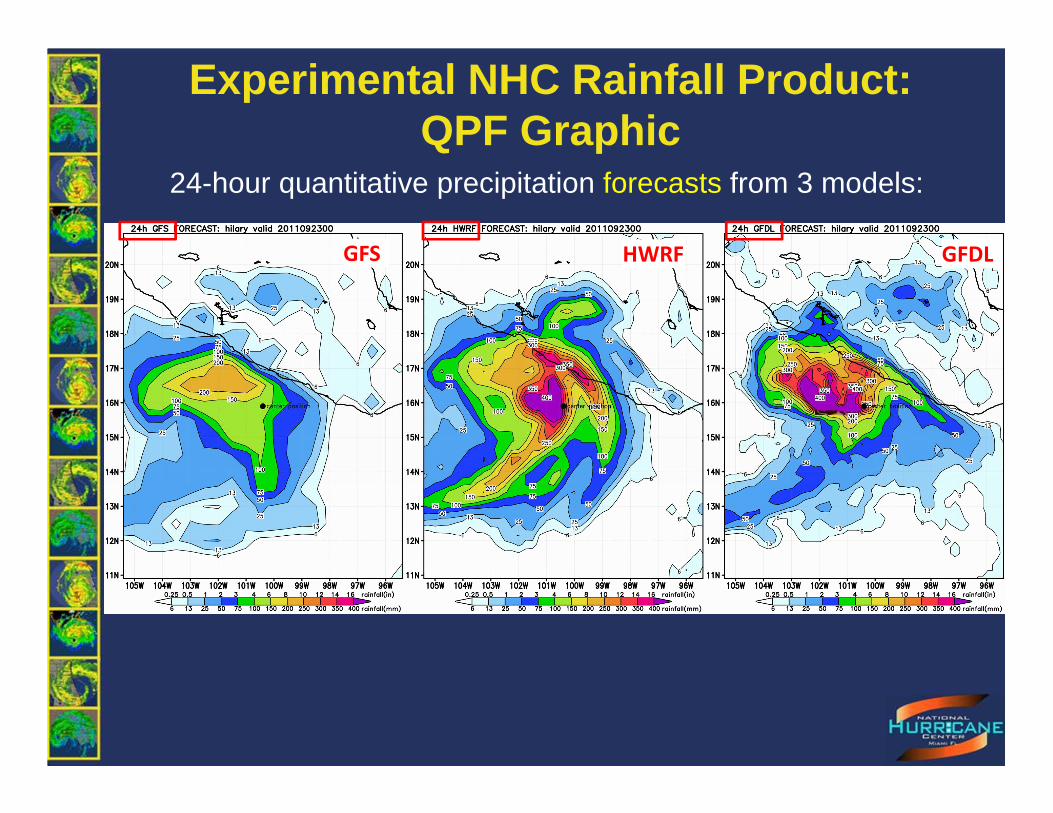
24-hour quantitative precipitation forecasts from 3 models:
GFS GFDLHWRF
Experimental NHC Rainfall Product: QPF Graphic

GEFS Probabilities of ExceedancePotential Addition to NHC Rainfall Webpage
Probability of measurable precipitation Probability of exceeding 10 mm
Probability of exceeding 25 mm Probability of exceeding 50 mm

GEFS Probabilities of ExceedancePotential Addition to NHC Rainfall Webpage
Probability of measurable precipitation Probability of exceeding 10 mm
Probability of exceeding 25 mm Probability of exceeding 50 mm
2018?

• 6-hourly Day 1 forecasts: Extrapolates polar orbiting satellite rain rate along TC forecast tracks
(AMSU, SSMI, & AMSRE)
• A satellite “member” is included when its path passes over the TC
• “Members” are weighted according to age of pass and past performance of sensor
• Official forecast of TC track & at least 2 members needed to create a forecast
• Updated daily at 0315, 0915, 1515, and 2115 UTC
Ensemble Tropical Rainfall Potential Product (eTRaP )
Probability of
exceedance
Quantitative Precipitation
ForecastForecast Period
http://www.ssd.noaa.gov/PS/TROP/etrap.html

eTRaP: http://www.ssd.noaa.gov/PS/TROP/etrap.html
Probability of > 25 mm
Probability of > 50 mm
Probability of > 100 mm
QPF
Typhoon Ului06-12 hreTRaP
forecast
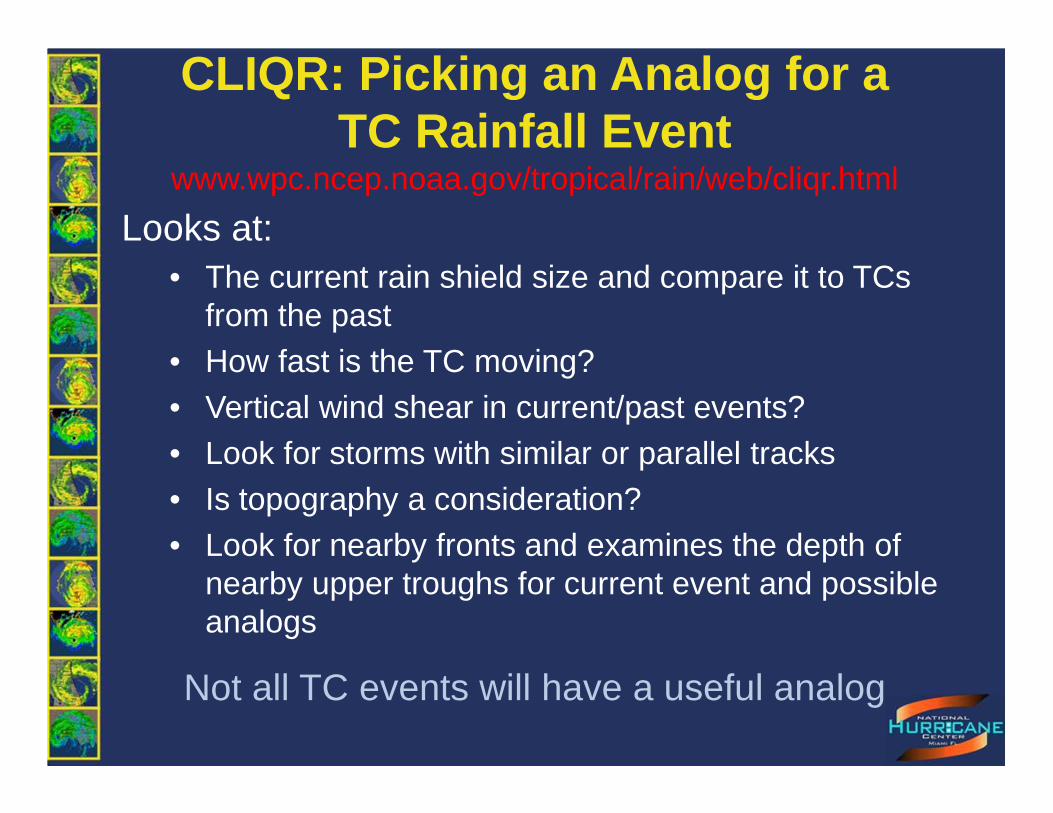
CLIQR: Picking an Analog for a TC Rainfall Event
www.wpc.ncep.noaa.gov/tropical/rain/web/cliqr.html
Looks at:• The current rain shield size and compare it to TCs
from the past• How fast is the TC moving?• Vertical wind shear in current/past events?• Look for storms with similar or parallel tracks• Is topography a consideration?• Look for nearby fronts and examines the depth of
nearby upper troughs for current event and possible analogs
Not all TC events will have a useful analog

Tropical Cyclone Rainfall Datahttp://www.wpc.ncep.noaa.gov/tropical/rain/tcrainfall.html
Available for active TCs at: www.wpc.ncep.noaa.gov/tropical/rain/web/cliqr.html
CLIQR Matching TC List (Rainfall Matches Accessible via
Hyperlink)
David Roth WPC

GOES-R ProductsScheduled for Launch in Late 2016
Rainfall Rate Algorithm
Rainfall Potential Algorithm
Probability of Rainfall Algorithm

GOES-R ProductsRainfall Rate
• The algorithm generates estimates of the instantaneous rainfall rate at each IR pixel
• Uses IR brightness temperatures and is calibrated in real time against microwave-derived rain rates to enhance accuracy
• The higher spatial and temporal resolution available from GOES-R will be able to automatically resolve rainfall rates on a finer scale

GOES-R ProductsRainfall Potential
• Predicted rainfall accumulation for the next 3 hours at the satellite pixel scale
• Extrapolation from current and previous rainfall rates from the GOES-R Rainfall Rate Algorithm
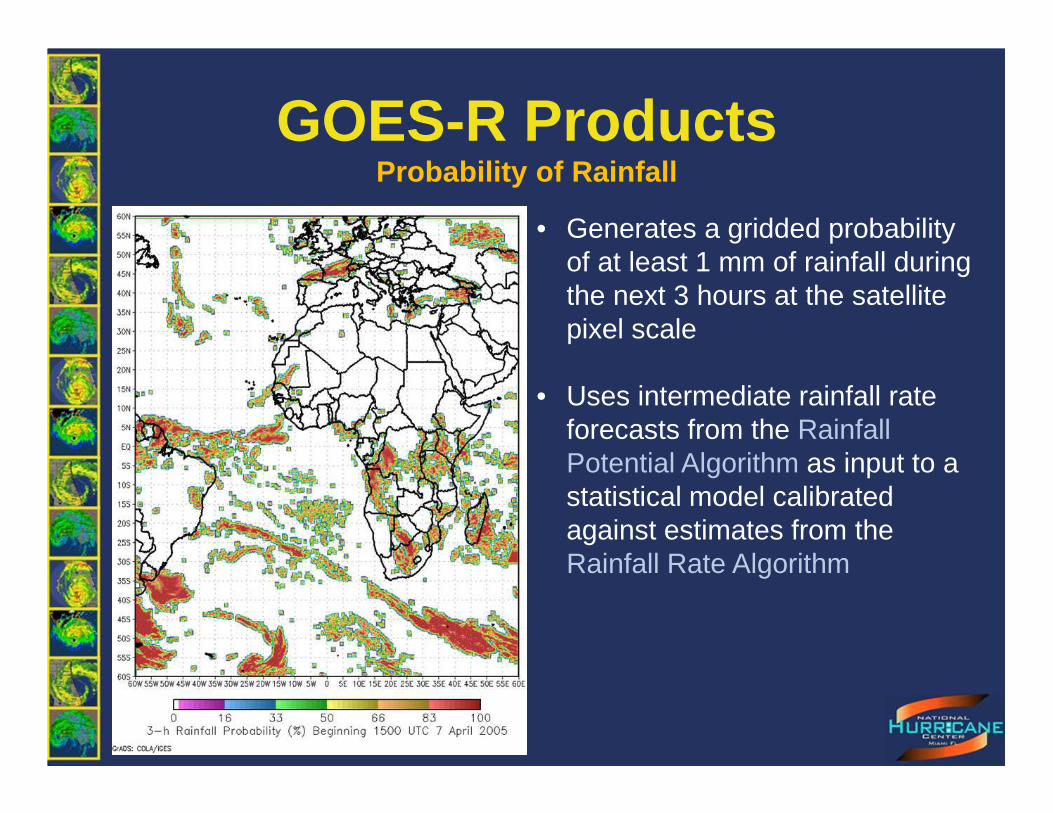
GOES-R ProductsProbability of Rainfall
• Generates a gridded probability of at least 1 mm of rainfall during the next 3 hours at the satellite pixel scale
• Uses intermediate rainfall rate forecasts from the Rainfall Potential Algorithm as input to a statistical model calibrated against estimates from the Rainfall Rate Algorithm

Model Forecasts
NAM QPF
GEFS Prob. of
Excedence
NAEFS Prob.
of Excedence
GFS QPFGFDL QPF
HWRF QPF

NCEP Model QPF Biases• NCEP models are updated frequently which makes it
difficult to isolate distinct biases• Run-to-run consistency increases confidence of occurrence
• Convective feedback problems
• Updraft overtakes the grid cell
• WPC estimates that QPF maximum amounts are reasonable about half the time when convective feedback is noted, but the location can be far off (Roth, 2008)

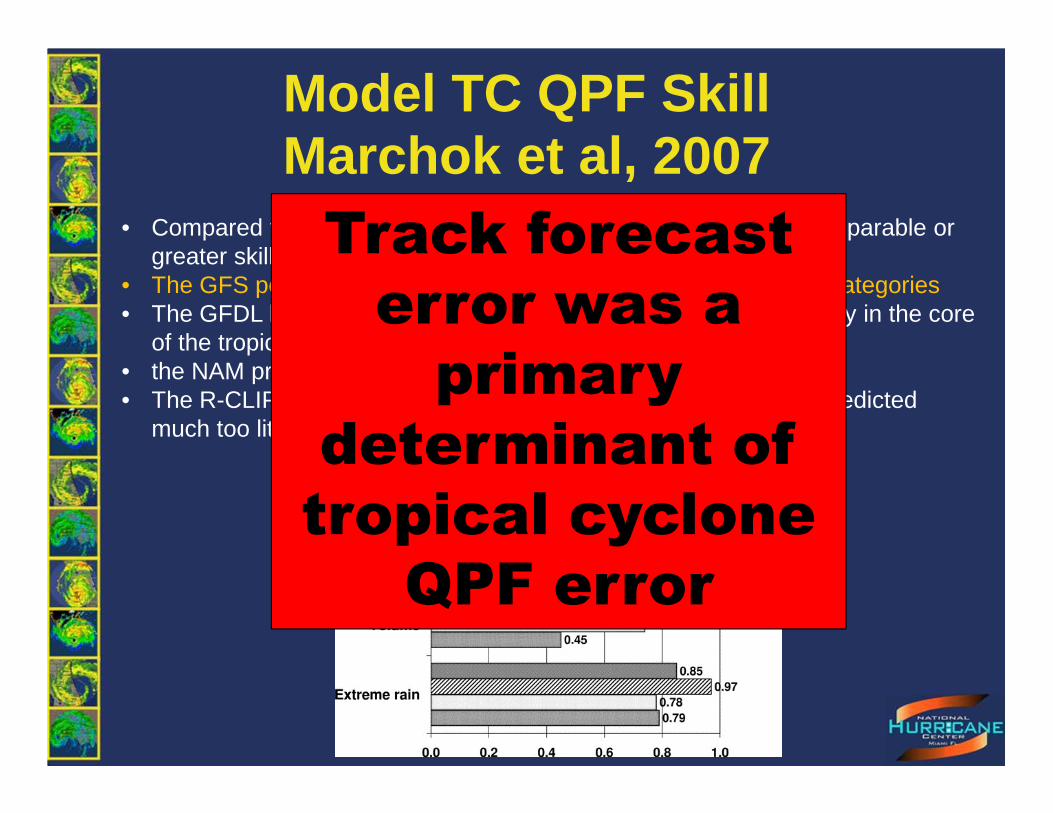
Model TC QPF SkillMarchok et al, 2007
1998-2004 U.S. landfalling TC QPFs from the GFS, GFDL hurricane model, the NAM, and the R-CLIPER (Rainfall Climatology and Persistence)
Three elements of TC rainfall forecasts used as a basis for comparing models:• model ability to match the large-scale
rainfall pattern,• model ability to match the mean rainfall
and the distribution of rain volume, and• model ability to produce the extreme
amounts often observed in TCs

Model TC QPF SkillMarchok et al, 2007
• Compared to R-CLIPER, all of the numerical models showed comparable or greater skill for all of the attributes
• The GFS performed the best of all of the models for each of the categories• The GFDL had a bias of predicting too much heavy rain, especially in the core
of the tropical cyclones • the NAM predicted too little of the heavy rain. • The R-CLIPER performed well near the track of the core, but it predicted
much too little rain at large distances from the track.
Track forecast
error was a
primary
determinant of
tropical cyclone
QPF error

Where to Find Model QPFs• NHC Tropical Rainfall Webpage (storm -specific GFS,
HWRF, and GFDL forecasts)http://www.nhc.noaa.gov/marine/rainfall/
• NCEP models (GFS, NAM, GEFS, NAEFS) including tropical guidance (HWRF and GFDL)
http://mag.ncep.noaa.gov• Canadian Global GEMhttp://www.weatheroffice.gc.ca/model_forecast/global_e.html
• Canadian Global GEM Ensembleshttp://www.weatheroffice.gc.ca/ensemble/index_e.html• NAVGEMhttp://www.nrlmry.navy.mil/metoc/nogaps/• ECMWFhttp://schumacher.atmos.colostate.edu/weather/ecmwf.php• Penn State Tropical Atlantic E-Wallhttp://mp1.met.psu.edu/~fxg1/ewalltropatl.html

TC QPF Forecast Process

NWS Tropical Cyclone Quantitative Precipitation Forecasts (QPF)
WPC QPF
WFO QPF

Day 1 QPF 24-h ending 12Z 21 Aug 2008 –
T.S. Fay
NHC Track Forecast Issued at 09Z 20 Aug
“a primary determinant of tropical cyclone QPF errors is track forecast error” – Marchok et al 2007
A good place to start is the model closest to the NHC track forecast
Production of Tropical CycloneQuantitative Precipitation Forecasts

Day 1 QPF 24-h ending 12Z 21 Aug 2008 –
T.S. Fay
How well do the models match the NHC rainfall statement?
Production of Tropical CycloneQuantitative Precipitation Forecasts
6-7 inch
maximum
rainfall
forecast
over 24
hours

Production of Tropical CycloneQuantitative Precipitation ForecastsUse observations and recent model data to determine the
current structure/rainfall rates
Gauge data
Radar
Model data Satellite QPEs

Production of Tropical CycloneQuantitative Precipitation Forecasts
Locate relevant synoptic scale and meso-scale boundaries
Hurricane
Rina (2011)

Production of Tropical CycloneQuantitative Precipitation ForecastsUse conceptual models and pattern recognition as well as the
forecast upper level winds to further adjust QPF

Production of Tropical CycloneQuantitative Precipitation Forecasts
Identify areas of orographic enhancement

Production of Tropical CycloneQuantitative Precipitation Forecasts
LOW LEVEL
WIND
SLOPES FAVORED FOR
HEAVY PRECIPITATION
Identify areas of orographic enhancement

Determine how a change in available moisture could increase, decrease, or redistribute rainfall
Production of Tropical CycloneRelated QPF

Use climatology (CLIQR, R-CLIPER, TC Rainfall Climatology) and data from past storms to:
• Increase/decrease amounts
• Adjust numerical guidance biases
• Reality check
• Highlight areas significantly impacted by terrain effects
Production of Tropical CycloneRelated QPF
In Conclusion
• Remember the factors that influence TC rainfall (size of storm, time of day, speed etc.)
• Evaluate the quality of the model data available to you compared to the current conditions
• Assess the amount of shear in the environment How will it influence rainfall?
• Are there past TCs that resemble the rainfall distribution and forecast of the TC?
• Use all of the tools available (eTRaP, TCCA products from NHC, NWP models, etc.)
• Remember, heavy rain can also occur well away from the TC itself (PRE, secondary disturbances, etc.)

Thank YouQuestions?