2016 Supervisory Scenarios for Annual Stress Tests ... · for this stress test cycle; that a BHC or...
28
2016 Supervisory Scenarios for Annual Stress Tests Required under the Dodd-Frank Act Stress Testing Rules and the Capital Plan Rule January 28, 2016 B O A R D O F G O V E R N O R S O F T H E F EDERAL R ESERVE S YSTEM
Transcript of 2016 Supervisory Scenarios for Annual Stress Tests ... · for this stress test cycle; that a BHC or...

2016 Supervisory Scenarios for Annual Stress Tests Required under the
Dodd-Frank Act Stress Testing Rules and the Capital Plan Rule
January 28, 2016
B O A R D O F G O V E R N O R S O F T H E F E D E R A L R E S E R V E S Y S T E M


2016 Supervisory Scenarios for Annual Stress Tests Required under the
Dodd-Frank Act Stress Testing Rules and the Capital Plan Rule
January 28, 2016
B O A R D O F G O V E R N O R S O F T H E F E D E R A L R E S E R V E S Y S T E M

This and other Federal Reserve Board reports and publications are available online at
www.federalreserve.gov/publications/default.htm.
To order copies of Federal Reserve Board publications offered in print,
see the Board’s Publication Order Form (www.federalreserve.gov/pubs/orderform.pdf)
or contact:
Publications Fulfillment
Mail Stop N-127
Board of Governors of the Federal Reserve System
Washington, DC 20551
(ph) 202-452-3245
(fax) 202-728-5886
(e-mail) [email protected]

Introduction ............................................................................................................................... 1
Supervisory Scenarios ............................................................................................................ 3
Baseline, Adverse, and Severely Adverse Scenarios ..................................................................... 3 Global Market Shock Components for Supervisory Adverse and Severely Adverse
Scenarios ........................................................................................................................... 7 Counterparty Default Component for Supervisory Adverse and Severely Adverse
Scenarios ........................................................................................................................... 8
Variables Considered in Scenarios ..................................................................................... 9
iii
Contents


Introduction
The Dodd-Frank Wall Street Reform and Consumer
Protection Act requires the Board of Governors of
the Federal Reserve System (Board) to conduct an
annual supervisory stress test of bank holding com-
panies (BHCs) with $50 billion or greater in total
consolidated assets (large BHCs), and to require
BHCs and state member banks with total consoli-
dated assets of more than $10 billion to conduct
company-run stress tests at least once a year.1
This publication describes the three supervisory
scenarios—baseline, adverse, and severely adverse—
that the Board will use in its supervisory stress test
for this stress test cycle; that a BHC or state member
bank must use in conducting its annual company-run
stress test; and that a large BHC must use to estimate
projected revenues, losses, reserves, and pro forma
capital levels as part of its 2016 capital plan submis-
sion.2 The publication also details additional compo-
nents that certain BHCs will be required to incorpo-
rate into the supervisory scenarios—the global mar-
ket shock component and the counterparty default
component.
1 12 U.S.C. 5365(i). 2 See 12 CFR 252.14(b), 12 CFR 252.54(b), and 12 CFR 225.8.
1


Supervisory Scenarios
The adverse and severely adverse scenarios describe
hypothetical sets of conditions designed to assess the
strength of banking organizations and their resilience
to adverse economic environments. The baseline sce-
nario follows a similar profile to the average projec-
tions from a survey of economic forecasters. The sce-
narios are not forecasts of the Federal Reserve.3
The scenarios start in the first quarter of 2016 and
extend through the first quarter of 2019. Each sce-
nario includes 28 variables; this set of variables is the
same as the set provided in last year’s supervisory
scenarios. The variables describing economic devel-
opments within the United States include:
• Six measures of economic activity and prices: per-
cent changes (at an annual rate) in real and nomi-
nal gross domestic product (GDP); the unemploy-
ment rate of the civilian noninstitutional popula-
tion aged 16 years and over; percent changes (at an
annual rate) in real and nominal disposable per-
sonal income; and the percent change (at an annual
rate) in the consumer price index (CPI);
• Four aggregate measures of asset prices or financial
conditions: indexes of house prices, commercial
property prices, equity prices, and U.S. stock mar-
ket volatility; and,
• Six measures of interest rates: the rate on the
3-month Treasury bill; the yield on the 5-year
Treasury bond; the yield on the 10-year Treasury
bond; the yield on a 10-year BBB corporate secu-
rity; the interest rate associated with a conforming,
conventional, fixed-rate 30-year mortgage; and the
prime rate.
The variables describing international economic con-
ditions in each scenario include three variables in
four countries or country blocks:
• The three variables for each country or country
block: the percent change (at an annual rate) in real
GDP, the percent change (at an annual rate) in the
CPI or local equivalent, and the level of the U.S.
dollar/foreign currency exchange rate.
• The four countries or country blocks included: the
euro area (the 19 European Union member states
that have adopted the euro as their common cur-
rency), the United Kingdom, developing Asia (the
nominal GDP-weighted aggregate of China, India,
South Korea, Hong Kong Special Administrative
Region, and Taiwan), and Japan.
Baseline, Adverse, and Severely Adverse Scenarios
The following sections describe the baseline scenario,
the adverse scenario, and the severely adverse sce-
nario. The variables included in these scenarios are
provided in tables at the end of this document. They
can also be downloaded as a spreadsheet (together
with the historical time series of the variables) from
the Board’s website, at http://www.federalreserve.gov/
bankinforeg/dfa-stress-tests.htm.
Baseline Scenario
The baseline outlook for U.S. real activity, inflation,
and interest rates (see Table 1A) is similar to the
January 2016 consensus projections from Blue Chip
Economic Indicators.4 This scenario does not repre-
sent the forecast of the Federal Reserve.
The baseline scenario for the United States is a mod-
erate economic expansion through the projection
period. Real GDP grows at an average rate of
2½ percent per year. The unemployment rate declines
to 4½ percent in the middle of 2017 and remains
near that level through the end of the scenario
period. CPI inflation rises to 2½ percent at an annual
rate by the middle of 2017 before dropping back to
3 For more on the Federal Reserve’s framework for designing sce-narios for stress testing, see 12 CFR 252, appendix A.
4 See Wolters Kluwer Legal and Regulatory Solutions (2016), “Blue Chip Economic Indicators,” vol. 41, no. 1 (January 10).
3

about 2 percent in the first quarter of 2018 and
remaining near that level thereafter.
Accompanying the moderate economic expansion,
Treasury yields are assumed to rise steadily across the
maturity spectrum. Short-term Treasury rates
increase from about ½ percent at the beginning of
2016 to about 2¾ percent by the beginning of 2019,
while the yields on 10-year Treasury securities rise
from 2½ percent to about 3¾ percent over the same
period. The prime rate increases in line with short-
term Treasury rates and mortgage rates rise in line
with long-term Treasury rates. Reflecting strengthen-
ing economic conditions, spreads between yields on
investment-grade corporate bonds and yields on
long-term Treasury securities narrow modestly over
the scenario period. Equity prices rise an average of
about 4¾ percent per year and equity market volatil-
ity is assumed to remain near its historical average
level. Nominal house prices rise an average of
2¾ percent per year and commercial real estate prices
rise an average of 4¼ percent per year.
The outlook for international variables (see Table 1B)
is similar to that reported in the January 2016 Blue
Chip Economic Indicators and the International
Monetary Fund’s October 2015 World Economic
Outlook.5 The baseline scenario features an expan-
sion in international economic activity, albeit one
that proceeds at different rates in the four countries
or country blocks under consideration. Real GDP
growth in developing Asia averages 6 percent per
year over the scenario period; real GDP growth in
the United Kingdom averages 2¼ percent per year;
and real GDP growth in the euro area and Japan
averages 1¾ percent per year and 1 percent per year,
respectively.
Adverse Scenario
The adverse scenario is characterized by weakening
economic activity across all countries or country
blocks included in the scenario. The economic down-
turn is accompanied by a period of deflation in the
United States and in the other countries and country
blocks. It is important to note that this is a hypotheti-
cal scenario designed to assess the strength of bank-
ing organizations and their resilience to adverse eco-
nomic conditions. This scenario does not represent a
forecast of the Federal Reserve.
The adverse scenario features a moderate U.S. reces-
sion that begins in the first quarter of 2016 (see
Table 2A). Real GDP in the United States falls
1¾ percent from the pre-recession peak in the fourth
quarter of 2015 to the recession trough in the first
quarter of 2017, while the unemployment rate rises
steadily, peaking at 7½ percent in the middle of 2017.
The U.S. recession is accompanied by a mild defla-
tionary period, with consumer prices falling about
½ percent over the four quarters of 2016.
Reflecting weak economic conditions and deflation-
ary pressures, short-term interest rates in the United
States remain near zero over the projection period.
The 10-year Treasury yield declines to 1¼ percent in
early 2016 before rising gradually thereafter to 3 per-
cent in the first quarter of 2019. Financial conditions
tighten for corporations and households during the
recession, with spreads between investment-grade
corporate bond yields and 10-year Treasury yields
and spreads between mortgage rates and 10-year
Treasury yields widening through the end of 2016.
Asset prices decline in the adverse scenario. Equity
prices fall approximately 25 percent through the
fourth quarter of 2016, accompanied by a moderate
rise in equity market volatility. Aggregate house
prices and commercial real estate prices experience
moderate declines; commercial real estate prices fall
12 percent through the third quarter of 2017 and
house prices fall 12 percent through the third quarter
of 2018.
Following the end of the recession in the United
States, real activity picks up slowly at first and then
gains speed; real U.S. GDP growth rises from 1¼ per-
cent at an annual rate in the second quarter of
2017 to 3 percent at an annual rate by the middle of
2018. The unemployment rate declines modestly, to
about 7 percent by the end of the scenario period.
Consumer prices begin to rise slowly in the first quar-
ter of 2017 and inflation remains subdued through
the end of the scenario window. Consumer price
inflation reaches 1¾ percent at an annual rate in the
first quarter of 2019.
Outside of the United States, the adverse scenario
features moderate recessions in the euro area, the
United Kingdom, and Japan, as well as below-trend
growth in developing Asia (see Table 2B). Weakness
in global demand results in deflation across all of the
foreign economies under consideration as well as a
broad-based decline in commodity prices. Headline
consumer prices decline modestly through the end of
5 See International Monetary Fund (2015), "World Economic Outlook," www.imf.org/external/pubs/ft/weo/2015/02.
4 Federal Reserve Supervisory Scenarios
2016 in the euro area and the United Kingdom, and
decline through the middle of 2017 in developing
Asia. Japan experiences a sharper and more pro-
longed deflationary period, with prices falling
through the second quarter of 2018. The U.S. dollar
appreciates relative to the currencies of the countries
and country blocks under consideration, reflecting
flight-to-safety capital flows; the dollar appreciates
most strongly against the euro and the currencies of
developing Asia.
Comparison of 2015 Adverse Scenario and
2016 Adverse Scenario
The main difference relative to the 2015 adverse sce-
nario is that this year’s adverse scenario features a
decline in the CPI—i.e., deflation—in the United
States. Deflation in the euro area and Japan was fea-
tured as a component of the 2015 adverse scenario,
but that scenario also featured a considerable rise in
headline U.S. inflation. In this year’s adverse sce-
nario, U.S. deflation implies substantially different
paths of U.S. Treasury yields relative to the paths in
last year’s scenario. In this year’s scenario, the yield
curve is lower and initially flatter than under baseline
assumptions, but then steepens over the scenario
period. In last year’s scenario, by contrast, the yield
curve was higher and flatter than under baseline
assumptions.
Compared with the 2015 adverse scenario, the period
of U.S. deflation that is featured in the 2016 adverse
scenario may be expected to reduce nominal house-
hold income growth and raise real effective interest
rates. These are conditions that may be expected to
reduce loan repayments and increase credit losses.
The lower path of Treasury rates may be expected to
reduce pre-provision net revenue (PPNR), largely
through reduced net interest income. However, in
addition to these scenario changes, the Federal
Reserve’s supervisory stress test projections will also
reflect changes in the structure, business focus, and
recent performance of the BHCs participating in the
exercise.
Additional Key Features of the Adverse
Scenario
As in last year’s adverse scenario, the slowdown in
euro area economic activity should be interpreted as
a broad-based contraction in euro area demand, not
as a contraction that is concentrated in a few specific
economies. In addition, the slowdown in developing
Asia should be interpreted as a weakening in eco-
nomic conditions across emerging market economies
and not merely as a weakening in Asia-specific condi-
tions. Declines in aggregate U.S. real estate prices
should be assumed to be concentrated in regions that
have experienced rapid price gains over the past sev-
eral years. Declines in prices of U.S. housing and
commercial real estate should also be assumed to be
representative of risks to house prices and commer-
cial real estate prices in foreign regions and econo-
mies that have experienced rapid price gains over the
past several years.
Severely Adverse Scenario
The severely adverse scenario is characterized by a
severe global recession, accompanied by a period of
heightened corporate financial stress and negative
yields for short-term U.S. Treasury securities. It is
important to note that this is a hypothetical scenario
designed to assess the strength of banking organiza-
tions and their resilience to unfavorable economic
conditions. This scenario does not represent a fore-
cast of the Federal Reserve.
In this scenario, the level of U.S. real GDP begins to
decline in the first quarter of 2016 and reaches a
trough in the first quarter of 2017 that is 6¼ percent
below the pre-recession peak (see Table 3A). The
unemployment rate increases by 5 percentage points,
to 10 percent, by the middle of 2017 and headline
consumer price inflation rises from about ¼ percent
at an annual rate in the first quarter of 2016 to about
1¼ percent at an annual rate by the end of the
recession.
Asset prices drop sharply in the scenario, consistent
with the developments described above. Equity prices
fall approximately 50 percent through the end of
2016, accompanied by a surge in equity market vola-
tility, which approaches the levels attained in 2008.
House prices and commercial real estate prices also
experience considerable declines, with house prices
dropping 25 percent through the third quarter of
2018 and commercial real estate prices falling 30 per-
cent through the second quarter of 2018. Corporate
financial conditions are stressed severely, reflecting
mounting credit losses, heightened investor risk aver-
sion, and strained market liquidity conditions; the
spread between yields on investment-grade corporate
bonds and yields on long-term Treasury securities
increases to 5¾ percent by the end of 2016.
As a result of the severe decline in real activity and
subdued inflation, short-term Treasury rates fall to
January 28, 2016 5

negative ½ percent by mid-2016 and remain at that
level through the end of the scenario. For the pur-
poses of this scenario, it is assumed that the adjust-
ment to negative short-term interest rates proceeds
with no additional financial market disruptions. The
10-year Treasury yield drops to about ¼ percent in
the first quarter of 2016, rising gradually thereafter
to reach about ¾ percent by the end of the recession
in early 2017 and about 1¾ percent by the first quar-
ter of 2019.
The international component of this scenario fea-
tures severe recessions in the euro area, the United
Kingdom, and Japan, and a mild recession in devel-
oping Asia (see Table 3B). As a result of acute eco-
nomic weakness, all foreign economies included in
the scenario experience a pronounced decline in con-
sumer prices. Reflecting flight-to-safety capital flows
during weak economic conditions, the U.S. dollar is
assumed to appreciate against the euro, the pound
sterling, and the currencies of developing Asia. The
dollar is assumed to depreciate modestly against the
yen, also in line with flight-to-safety capital flows.
Comparison of 2015 Severely Adverse
Scenario and 2016 Severely Adverse Scenario
This year’s severely adverse scenario features a more
severe downturn in the U.S. economy as compared to
last year’s scenario. This increase in severity reflects
the Federal Reserve’s scenario design framework for
stress testing, which includes countercyclical ele-
ments.6 Under this framework, the unemployment
rate in the severely adverse scenario will reach a peak
of at least 10 percent, which leads to a progressively
greater increase in the unemployment rate if the
starting unemployment rate is below 6 percent. In
line with the more severe U.S. recession, this year’s
severely adverse scenario also features a path of
negative short-term U.S. Treasury rates. Further-
more, this year’s scenario does not feature the pro-
nounced increase in inflation that was featured in last
year’s scenario.
Compared with the 2015 severely adverse scenario,
weaker economic conditions in the 2016 severely
adverse scenario may be expected to result in higher
credit losses on a wide range of loans and securities.
Lower interest rates on Treasury securities suggest
larger gains on the existing portfolio of these securi-
ties. Negative short-term interest rates may be
expected to reduce banks’ net interest margins and
ultimately, to lower PPNR. However, in addition to
these scenario changes, the Federal Reserve’s supervi-
sory stress test projections will also reflect changes in
the structure, business focus, and recent performance
of the BHCs participating in the exercise.
Additional Key Features of the Severely
Adverse Scenario
As in the adverse scenario, the weakness in euro area
economic conditions should be interpreted as a
broad-based contraction in euro area demand,
although the impact of this contraction should be
assumed to be more protracted in countries with little
room for fiscal policy intervention. The sharp slow-
down in developing Asia is distributed unevenly
across countries, with decelerations more pronounced
in the larger economies. Economic conditions in
developing Asia should be assumed to be representa-
tive of conditions across emerging market economies.
In Europe as well as in emerging markets, the eco-
nomic downturn heightens investor concerns about
credit risk for countries with high levels of public
debt. Spreads on credit default swaps for these coun-
tries increase by magnitudes in line with those experi-
enced by Italy, Portugal, and Spain during 2011 and
by emerging markets in 2008.
Declines in aggregate U.S. commercial and residential
real estate prices should be assumed to be concen-
trated in regions that have experienced rapid price
gains over the past several years. Declines in prices of
U.S. housing and commercial real estate should also
be assumed to be representative of risks to house
prices and commercial real estate prices in foreign
regions and economies, particularly where real estate
prices have been growing at a fast clip. Domestically,
credit losses on commercial real estate loans backing
commercial mortgage-backed securities are greater
than would be expected given the general economic
and financial stress in the scenario, prompting wide-
spread investor pull-back. Spreads on commercial
mortgage-backed securities widen to attain the same
peaks reached in the 2007–2009 recession.6 See 12 CFR 252, appendix A.
6 Federal Reserve Supervisory Scenarios

Global Market Shock Components for Supervisory Adverse and Severely Adverse Scenarios
The global market shock is a set of instantaneous,
hypothetical shocks to a large set of risk factors.
Generally, these shocks involve large and sudden
changes in asset prices, interest rates, and spreads,
reflecting general market distress and heightened
uncertainty.7 BHCs with significant trading activity
will be required to include the global market shock as
part of their supervisory adverse and severely adverse
scenarios.8 In addition, as discussed below, certain
large and highly interconnected BHCs must apply the
same global market shock to their counterparty
exposures to project losses under the counterparty
default scenario component.
The as-of date for the global market shock is Janu-
ary 4, 2016.9
2016 Severely Adverse Scenario
The severely adverse scenario’s global market shock
is designed around three main elements: a sudden
sharp increase in general risk premiums and credit
risk; significant market illiquidity; and the distress of
one or more large entities that rapidly sell a variety of
assets into an already fragile market. Liquidity dete-
rioration is most severe in those asset markets that
are typically less liquid, such as corporate debt and
private equity markets, and is less pronounced in
those markets that are typically more liquid such as
publicly traded equity and U.S. Treasury markets.
Markets facing a significant deterioration in liquidity
experience conditions that are generally comparable
to the peak-to-trough changes in asset valuations
during the 2007–2009 period. The severity of dete-
rioration reflects the market conditions that could
occur in the event of a significant pullback in market
liquidity in which market participants are less able to
engage in market transactions that could offset and
moderate the price dislocations. Declines in markets
less affected by the deterioration in liquidity condi-
tions are generally comparable to those experienced
in the second half of 2008.
Worsening liquidity also leads prices of related assets
that would ordinarily be expected to move together
to diverge markedly. In particular, the valuation of
certain cash market securities and their derivative
counterparts—so-called basis spreads—fail to move
together because the normal market mechanics that
would ordinarily result in small pricing differentials
are impeded by a lack of market liquidity. Notably,
option-adjusted spreads on agency mortgage-backed
securities (MBS) increase significantly. Illiquidity
driven dislocations between the cash and to-be-
announced (TBA) forward markets result in larger
increases in the option adjusted spreads on securities
than in the TBA market. Similarly, relationships
between the prices of other financial assets that
would normally be expected to move together come
under pressure and are weakened. As a result, certain
hedging strategies are less effective and resulting
losses are larger.
Globally, government bond yield curves undergo
marked shifts in level and shape due to market par-
ticipants’ increased risk aversion. The flight-to-
quality and lack of liquidity in affected markets
pushes risk-free rates down across the term structure
in the United States, with some short-term rates
dropping below zero. The yield curves for govern-
ment bonds flatten or invert across Europe and Asia
while volatility increases across the term structure.
The potential for a prolonged and more acute reces-
sion in Europe drive up sovereign credit spreads in
the euro zone periphery in a manner generally consis-
tent with the experience of 2011. Emerging market
countries with deteriorating economic and fiscal
accounts would also experience a sharp increase in
sovereign spreads.
The major differences between the 2016 and 2015
severely adverse scenarios include (1) a larger widen-
ing in credit spreads for municipal, sovereign, and
advanced economies’ corporate products; (2) gener-
ally, greater declines in the value of private equity
investments, recently issued securitized products, and
non-agency residential MBS; (3) a more severe wid-
ening in basis spreads between closely related assets
such as agency MBS and TBA forwards as well as
corporate bonds and credit default swaps; and (4) a
7 The global market shock components consist of shocks to a large number of risk factors that include a wide range of finan-cial market variables that affect asset prices, such as a credit spread or the yield on a bond, and, also include, in some cases, shocks to the value of the position itself (for example, the mar-ket value of private-equity positions).
8 For this cycle, six BHCs are subject to the global market shock components: Bank of America Corporation; Citigroup Inc.; The Goldman Sachs Group, Inc.; JPMorgan Chase & Co.; Morgan Stanley; and Wells Fargo & Company. See 12 CFR 252.54(b)(2)(i)
9 A BHC may use data as of the date that corresponds to its weekly internal risk reporting cycle as long as it falls during the business of the as-of date for the global market shock (i.e., January 4, 2016 to January 8, 2016).
January 28, 2016 7
general decline in U.S. Treasury rates, resulting in
negative short-term rates, while short-term govern-
ment rates in Europe rise to positive or slightly nega-
tive levels, and Asian government rates across the
term structure flatten or invert. These differences are
intended to reflect the result of a more significant
drop in liquidity than was assumed in the 2015
severely adverse scenario and would be expected to
result in notably higher losses on more illiquid assets.
2016 Adverse Scenario
The global market shock component for the adverse
scenario simulates an extended low-growth environ-
ment and muted market volatility across most asset
classes and term structures. Domestic interest rates
move lower, particularly for longer-maturity securi-
ties, with lower volatility. Due to reduced demand,
global commodity prices decline moderately. MBS
and credit spreads widen moderately. Internationally,
yield curves move lower and flatten while sovereign
credit spreads widen moderately. Select currency mar-
kets also experience small flight-to-quality moves.
Equity markets experience a mild correction with a
measured increase in volatility.
The major difference between the 2016 and 2015
adverse scenarios is the addition of elements that are
distinct from and not mechanically linked to the
severely adverse scenario. In particular, compared to
2015, the 2016 adverse scenario includes (1) more
muted changes in price, spread, and volatility levels
across most markets; and (2) a general decline in U.S.
Treasury rates, with short-term government rates in
most other countries and regions rising in the short
term and declining in the longer term.
Counterparty Default Component for Supervisory Adverse and Severely Adverse Scenarios
In CCAR 2016, the eight BHCs with substantial
trading or custodial operations will be required to
incorporate a counterparty default scenario compo-
nent into their supervisory adverse and severely
adverse stress scenarios.10 In connection with the
counterparty default scenario component, these
BHCs will be required to estimate and report the
potential losses and related effects on capital associ-
ated with the instantaneous and unexpected default
of the counterparty that would generate the largest
losses across their derivatives and securities financing
activities, including securities lending, and repur-
chase or reverse repurchase agreement activities. The
counterparty default scenario component is an
add-on to the macroeconomic conditions and finan-
cial market environment specified in the Federal
Reserve’s adverse and severely adverse stress
scenarios.
The counterparty default scenario component
involves the instantaneous and unexpected default of
the BHC’s largest counterparty.11 Each BHC’s larg-
est counterparty will be determined by net stressed
losses; estimated by applying the global market shock
to revalue non-cash securities financing activity
assets (securities or collateral) posted or received; and
for derivatives, to the value of the trade position and
non-cash collateral exchanged. The as-of date for the
counterparty default scenario component is Janu-
ary 4, 2016—the same date as the global market
shock.12
10 The eight BHCs subject to the counterparty default component are as follows: Bank of America Corporation; The Bank of New York Mellon Corp.; Citigroup Inc.; The Goldman Sachs Group, Inc.; JPMorgan Chase & Co.; Morgan Stanley; State Street Corp.; and Wells Fargo & Company. See 12 CFR 252.54(b)(2)(ii).
11 In selecting its largest counterparty, a BHC will not consider certain sovereign entities (Canada, France, Germany, Italy, Japan, the United Kingdom, and the United States) or desig-nated central clearing counterparties.
12 As with the global market shock, a BHC may use data as of the date that corresponds to its weekly internal risk reporting cycle as long as it falls during the business week of the as-of date for the counterparty default scenario component (i.e., January 4 to January 8, 2016).
8 Federal Reserve Supervisory Scenarios
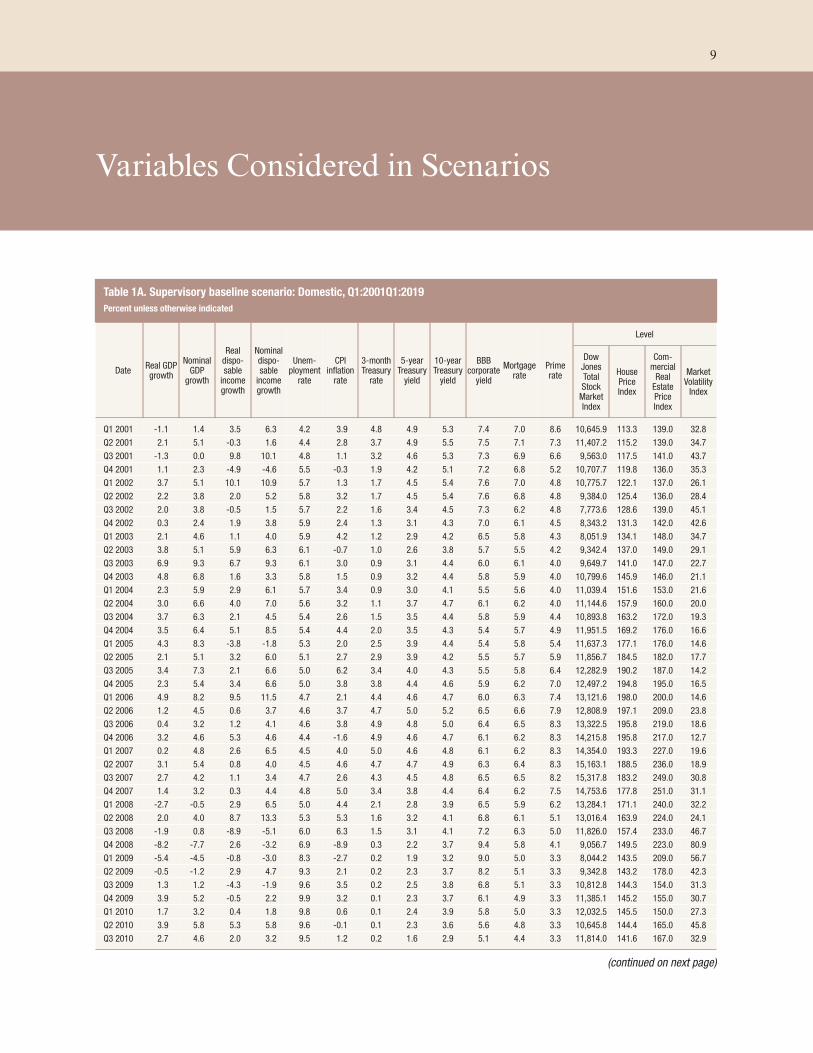
Variables Considered in Scenarios
Table 1A. Supervisory baseline scenario: Domestic, Q1:2001Q1:2019
Percent unless otherwise indicated
DateReal GDP growth
Nominal GDP
growth
Real dispo-sable
income growth
Nominal dispo-sable
income growth
Unem-ployment
rate
CPI inflation
rate
3-month Treasury
rate
5-year Treasury
yield
10-year Treasury
yield
BBB corporate
yield
Mortgagerate
Primerate
Level
Dow Jones Total Stock
Market Index
HousePrice Index
Com-mercial
Real Estate Price Index
Market Volatility
Index
Q1 2001 -1.1 1.4 3.5 6.3 4.2 3.9 4.8 4.9 5.3 7.4 7.0 8.6 10,645.9 113.3 139.0 32.8
Q2 2001 2.1 5.1 -0.3 1.6 4.4 2.8 3.7 4.9 5.5 7.5 7.1 7.3 11,407.2 115.2 139.0 34.7
Q3 2001 -1.3 0.0 9.8 10.1 4.8 1.1 3.2 4.6 5.3 7.3 6.9 6.6 9,563.0 117.5 141.0 43.7
Q4 2001 1.1 2.3 -4.9 -4.6 5.5 -0.3 1.9 4.2 5.1 7.2 6.8 5.2 10,707.7 119.8 136.0 35.3
Q1 2002 3.7 5.1 10.1 10.9 5.7 1.3 1.7 4.5 5.4 7.6 7.0 4.8 10,775.7 122.1 137.0 26.1
Q2 2002 2.2 3.8 2.0 5.2 5.8 3.2 1.7 4.5 5.4 7.6 6.8 4.8 9,384.0 125.4 136.0 28.4
Q3 2002 2.0 3.8 -0.5 1.5 5.7 2.2 1.6 3.4 4.5 7.3 6.2 4.8 7,773.6 128.6 139.0 45.1
Q4 2002 0.3 2.4 1.9 3.8 5.9 2.4 1.3 3.1 4.3 7.0 6.1 4.5 8,343.2 131.3 142.0 42.6
Q1 2003 2.1 4.6 1.1 4.0 5.9 4.2 1.2 2.9 4.2 6.5 5.8 4.3 8,051.9 134.1 148.0 34.7
Q2 2003 3.8 5.1 5.9 6.3 6.1 -0.7 1.0 2.6 3.8 5.7 5.5 4.2 9,342.4 137.0 149.0 29.1
Q3 2003 6.9 9.3 6.7 9.3 6.1 3.0 0.9 3.1 4.4 6.0 6.1 4.0 9,649.7 141.0 147.0 22.7
Q4 2003 4.8 6.8 1.6 3.3 5.8 1.5 0.9 3.2 4.4 5.8 5.9 4.0 10,799.6 145.9 146.0 21.1
Q1 2004 2.3 5.9 2.9 6.1 5.7 3.4 0.9 3.0 4.1 5.5 5.6 4.0 11,039.4 151.6 153.0 21.6
Q2 2004 3.0 6.6 4.0 7.0 5.6 3.2 1.1 3.7 4.7 6.1 6.2 4.0 11,144.6 157.9 160.0 20.0
Q3 2004 3.7 6.3 2.1 4.5 5.4 2.6 1.5 3.5 4.4 5.8 5.9 4.4 10,893.8 163.2 172.0 19.3
Q4 2004 3.5 6.4 5.1 8.5 5.4 4.4 2.0 3.5 4.3 5.4 5.7 4.9 11,951.5 169.2 176.0 16.6
Q1 2005 4.3 8.3 -3.8 -1.8 5.3 2.0 2.5 3.9 4.4 5.4 5.8 5.4 11,637.3 177.1 176.0 14.6
Q2 2005 2.1 5.1 3.2 6.0 5.1 2.7 2.9 3.9 4.2 5.5 5.7 5.9 11,856.7 184.5 182.0 17.7
Q3 2005 3.4 7.3 2.1 6.6 5.0 6.2 3.4 4.0 4.3 5.5 5.8 6.4 12,282.9 190.2 187.0 14.2
Q4 2005 2.3 5.4 3.4 6.6 5.0 3.8 3.8 4.4 4.6 5.9 6.2 7.0 12,497.2 194.8 195.0 16.5
Q1 2006 4.9 8.2 9.5 11.5 4.7 2.1 4.4 4.6 4.7 6.0 6.3 7.4 13,121.6 198.0 200.0 14.6
Q2 2006 1.2 4.5 0.6 3.7 4.6 3.7 4.7 5.0 5.2 6.5 6.6 7.9 12,808.9 197.1 209.0 23.8
Q3 2006 0.4 3.2 1.2 4.1 4.6 3.8 4.9 4.8 5.0 6.4 6.5 8.3 13,322.5 195.8 219.0 18.6
Q4 2006 3.2 4.6 5.3 4.6 4.4 -1.6 4.9 4.6 4.7 6.1 6.2 8.3 14,215.8 195.8 217.0 12.7
Q1 2007 0.2 4.8 2.6 6.5 4.5 4.0 5.0 4.6 4.8 6.1 6.2 8.3 14,354.0 193.3 227.0 19.6
Q2 2007 3.1 5.4 0.8 4.0 4.5 4.6 4.7 4.7 4.9 6.3 6.4 8.3 15,163.1 188.5 236.0 18.9
Q3 2007 2.7 4.2 1.1 3.4 4.7 2.6 4.3 4.5 4.8 6.5 6.5 8.2 15,317.8 183.2 249.0 30.8
Q4 2007 1.4 3.2 0.3 4.4 4.8 5.0 3.4 3.8 4.4 6.4 6.2 7.5 14,753.6 177.8 251.0 31.1
Q1 2008 -2.7 -0.5 2.9 6.5 5.0 4.4 2.1 2.8 3.9 6.5 5.9 6.2 13,284.1 171.1 240.0 32.2
Q2 2008 2.0 4.0 8.7 13.3 5.3 5.3 1.6 3.2 4.1 6.8 6.1 5.1 13,016.4 163.9 224.0 24.1
Q3 2008 -1.9 0.8 -8.9 -5.1 6.0 6.3 1.5 3.1 4.1 7.2 6.3 5.0 11,826.0 157.4 233.0 46.7
Q4 2008 -8.2 -7.7 2.6 -3.2 6.9 -8.9 0.3 2.2 3.7 9.4 5.8 4.1 9,056.7 149.5 223.0 80.9
Q1 2009 -5.4 -4.5 -0.8 -3.0 8.3 -2.7 0.2 1.9 3.2 9.0 5.0 3.3 8,044.2 143.5 209.0 56.7
Q2 2009 -0.5 -1.2 2.9 4.7 9.3 2.1 0.2 2.3 3.7 8.2 5.1 3.3 9,342.8 143.2 178.0 42.3
Q3 2009 1.3 1.2 -4.3 -1.9 9.6 3.5 0.2 2.5 3.8 6.8 5.1 3.3 10,812.8 144.3 154.0 31.3
Q4 2009 3.9 5.2 -0.5 2.2 9.9 3.2 0.1 2.3 3.7 6.1 4.9 3.3 11,385.1 145.2 155.0 30.7
Q1 2010 1.7 3.2 0.4 1.8 9.8 0.6 0.1 2.4 3.9 5.8 5.0 3.3 12,032.5 145.5 150.0 27.3
Q2 2010 3.9 5.8 5.3 5.8 9.6 -0.1 0.1 2.3 3.6 5.6 4.8 3.3 10,645.8 144.4 165.0 45.8
Q3 2010 2.7 4.6 2.0 3.2 9.5 1.2 0.2 1.6 2.9 5.1 4.4 3.3 11,814.0 141.6 167.0 32.9
(continued on next page)
9

Table 1A.—continued
DateReal GDP growth
Nominal GDP
growth
Real dispo-sable
income growth
Nominal dispo-sable
income growth
Unem-ployment
rate
CPI inflation
rate
3-month Treasury
rate
5-year Treasury
yield
10-year Treasury
yield
BBB corporate
yield
Mortgagerate
Primerate
Level
Dow Jones Total Stock
Market Index
HousePrice Index
Com-mercial
Real Estate Price Index
Market Volatility
Index
Q4 2010 2.5 4.7 2.8 5.0 9.5 3.3 0.1 1.5 3.0 5.0 4.5 3.3 13,131.5 140.3 173.0 23.5
Q1 2011 -1.5 0.2 5.0 8.2 9.1 4.3 0.1 2.1 3.5 5.4 4.9 3.3 13,908.5 138.5 180.0 29.4
Q2 2011 2.9 6.0 -0.6 3.5 9.1 4.7 0.0 1.8 3.3 5.1 4.6 3.3 13,843.5 137.7 177.0 22.7
Q3 2011 0.8 3.3 2.1 4.3 9.0 2.6 0.0 1.1 2.5 4.9 4.2 3.3 11,676.5 137.7 177.0 48.0
Q4 2011 4.6 5.2 0.2 1.6 8.6 1.7 0.0 1.0 2.1 5.0 4.0 3.3 13,019.3 137.6 188.0 45.5
Q1 2012 2.7 4.9 6.7 9.2 8.3 2.2 0.1 0.9 2.1 4.7 3.9 3.3 14,627.5 139.6 188.0 23.0
Q2 2012 1.9 3.8 3.1 4.4 8.2 1.0 0.1 0.8 1.8 4.5 3.8 3.3 14,100.2 142.8 189.0 26.7
Q3 2012 0.5 2.7 -0.2 1.1 8.0 1.8 0.1 0.7 1.6 4.2 3.5 3.3 14,894.7 145.7 197.0 20.5
Q4 2012 0.1 1.7 10.9 13.3 7.8 2.6 0.1 0.7 1.7 3.9 3.4 3.3 14,834.9 149.3 198.0 22.7
Q1 2013 1.9 3.6 -15.9 -14.7 7.7 1.4 0.1 0.8 1.9 4.0 3.5 3.3 16,396.2 153.8 202.0 19.0
Q2 2013 1.1 2.1 2.7 3.1 7.5 -0.1 0.1 0.9 2.0 4.1 3.7 3.3 16,771.3 158.8 213.0 20.5
Q3 2013 3.0 4.9 2.2 3.9 7.2 2.3 0.0 1.5 2.7 4.9 4.4 3.3 17,718.3 163.0 224.0 17.0
Q4 2013 3.8 5.6 0.6 2.0 7.0 1.4 0.1 1.4 2.8 4.8 4.3 3.3 19,413.2 166.3 229.0 20.3
Q1 2014 -0.9 0.6 4.0 5.6 6.7 2.1 0.0 1.6 2.8 4.6 4.4 3.3 19,711.2 169.3 230.0 21.4
Q2 2014 4.6 6.9 3.0 5.2 6.2 2.4 0.0 1.7 2.7 4.3 4.2 3.3 20,568.7 170.7 239.0 17.0
Q3 2014 4.3 6.0 2.7 3.9 6.1 1.2 0.0 1.7 2.5 4.2 4.1 3.3 20,458.8 172.5 245.0 17.0
Q4 2014 2.1 2.2 4.7 4.2 5.7 -0.9 0.0 1.6 2.3 4.2 3.9 3.3 21,424.6 174.5 252.0 26.3
Q1 2015 0.6 0.8 3.9 1.9 5.6 -3.1 0.0 1.5 2.0 4.0 3.7 3.3 21,707.6 177.3 260.0 22.4
Q2 2015 3.9 6.1 2.6 4.9 5.4 3.0 0.0 1.5 2.2 4.2 3.8 3.3 21,630.9 179.4 264.0 18.9
Q3 2015 2.0 3.3 3.8 5.1 5.2 1.6 0.0 1.6 2.3 4.5 3.9 3.3 19,959.3 181.7 270.0 40.7
Q4 2015 1.9 1.9 3.5 3.8 5.0 0.2 0.1 1.6 2.2 4.6 3.9 3.3 21,100.9 183.1 273.4 24.4
Q1 2016 2.5 4.0 2.8 3.5 4.9 1.2 0.4 1.8 2.4 4.5 4.1 3.6 21,336.7 184.0 276.8 24.8
Q2 2016 2.6 4.0 2.5 4.3 4.8 2.2 0.6 2.0 2.6 4.7 4.2 3.8 21,578.3 185.2 280.3 24.6
Q3 2016 2.6 4.3 2.6 4.5 4.7 2.3 0.9 2.2 2.7 4.8 4.3 4.0 21,834.8 186.3 283.8 23.2
Q4 2016 2.5 4.3 2.6 4.6 4.6 2.3 1.0 2.4 2.9 4.9 4.5 4.1 22,093.2 187.5 287.4 22.7
Q1 2017 2.4 4.1 2.8 4.8 4.6 2.2 1.3 2.6 3.0 5.0 4.6 4.4 22,347.4 188.7 291.0 22.5
Q2 2017 2.5 4.6 2.6 4.8 4.6 2.4 1.5 2.7 3.1 5.1 4.7 4.6 22,626.3 189.9 294.7 22.0
Q3 2017 2.3 4.6 2.5 4.7 4.5 2.4 1.9 2.9 3.3 5.2 4.9 5.0 22,908.0 191.1 298.4 21.4
Q4 2017 2.3 4.4 2.6 4.7 4.5 2.3 2.2 3.0 3.4 5.3 5.0 5.3 23,183.2 192.2 302.1 21.7
Q1 2018 2.6 4.3 2.9 4.7 4.5 2.0 2.4 3.1 3.5 5.4 5.2 5.5 23,458.2 193.7 304.4 21.4
Q2 2018 2.4 4.2 2.6 4.6 4.6 2.1 2.6 3.2 3.6 5.5 5.3 5.7 23,733.2 195.2 306.7 21.5
Q3 2018 2.3 4.2 2.6 4.5 4.6 2.1 2.7 3.2 3.7 5.6 5.4 5.8 24,008.9 196.6 309.0 21.4
Q4 2018 2.3 4.1 2.5 4.5 4.7 2.1 2.8 3.3 3.8 5.6 5.5 5.9 24,285.1 198.1 311.4 21.5
Q1 2019 2.1 4.0 2.4 4.3 4.7 2.1 2.8 3.4 3.8 5.6 5.5 5.9 24,555.9 199.6 313.7 21.4
Note: Refer to Notes Regarding Scenario Variables for more information on variables.
10 Federal Reserve Supervisory Scenarios

Table 1B. Supervisory baseline scenario: International, Q1:2001Q1:2019
Percent unless otherwise indicated
Date Euro areareal GDPgrowth
Euro area inflation
Euro area bilateral dollar
exchange rate
(USD/euro)
Developing Asia
real GDP growth
Developing Asia
inflation
Developing Asia
bilateral dollar
exchange rate
(F/USD, index)
Japan real GDP growth
Japan inflation
Japan bilateral dollar
exchange rate
(yen/USD)
U.K. real GDP growth
U.K. inflation
U.K. bilateral dollar
exchange rate
(USD/pound)
Q1 2001 3.8 1.1 0.879 5.0 1.7 106.0 2.6 -1.2 125.5 4.6 0.1 1.419
Q2 2001 0.1 4.1 0.847 5.5 2.2 106.1 -0.7 -0.3 124.7 3.1 3.1 1.408
Q3 2001 0.3 1.4 0.910 4.7 1.1 106.4 -4.4 -1.1 119.2 2.6 1.0 1.469
Q4 2001 0.5 1.7 0.890 8.4 0.2 106.9 -0.5 -1.4 131.0 1.4 0.0 1.454
Q1 2002 0.9 3.0 0.872 7.6 0.4 107.3 -0.9 -2.7 132.7 1.6 1.9 1.425
Q2 2002 2.0 2.0 0.986 8.1 1.2 104.8 4.3 1.7 119.9 3.3 0.9 1.525
Q3 2002 1.6 1.6 0.988 7.3 1.3 105.5 2.6 -0.7 121.7 3.9 1.4 1.570
Q4 2002 0.3 2.4 1.049 6.4 0.9 104.5 1.5 -0.4 118.8 3.6 1.9 1.610
Q1 2003 -0.9 3.3 1.090 6.5 3.6 105.5 -2.2 -1.6 118.1 2.9 1.6 1.579
Q2 2003 0.4 0.3 1.150 2.3 1.2 104.0 5.2 1.7 119.9 3.7 0.3 1.653
Q3 2003 2.0 2.2 1.165 14.2 0.0 102.6 1.7 -0.7 111.4 3.1 1.7 1.662
Q4 2003 3.1 2.2 1.260 12.9 5.6 103.4 4.2 -0.6 107.1 3.0 1.7 1.784
Q1 2004 2.0 2.3 1.229 5.5 4.0 101.4 3.8 -0.9 104.2 2.7 1.3 1.840
Q2 2004 2.2 2.4 1.218 7.1 4.1 102.8 0.3 1.1 109.4 2.2 1.0 1.813
Q3 2004 1.3 2.0 1.242 8.2 3.9 102.7 0.6 0.1 110.2 0.9 1.1 1.809
Q4 2004 1.5 2.4 1.354 6.3 0.9 98.9 -1.0 1.7 102.7 1.9 2.4 1.916
Q1 2005 0.6 1.5 1.297 10.3 2.9 98.6 0.8 -2.7 107.2 2.8 2.6 1.889
Q2 2005 2.8 2.2 1.210 8.9 1.5 98.9 5.4 -1.2 110.9 4.4 1.9 1.793
Q3 2005 3.0 3.2 1.206 9.3 2.3 98.6 1.4 -1.3 113.3 4.1 2.7 1.770
Q4 2005 2.4 2.5 1.184 11.6 1.7 98.1 0.7 0.7 117.9 5.9 1.4 1.719
Q1 2006 3.7 1.7 1.214 10.9 2.4 96.8 1.7 1.3 117.5 1.5 1.9 1.739
Q2 2006 4.4 2.5 1.278 7.1 3.2 96.7 1.7 -0.1 114.5 1.2 3.0 1.849
Q3 2006 2.6 2.0 1.269 10.3 2.1 96.4 -0.3 0.5 118.0 0.5 3.3 1.872
Q4 2006 4.4 0.9 1.320 11.1 3.8 94.6 5.2 -0.4 119.0 2.3 2.6 1.959
Q1 2007 3.2 2.2 1.337 13.7 3.6 94.0 4.0 -0.2 117.6 3.9 2.6 1.969
Q2 2007 2.5 2.3 1.352 10.6 4.9 91.9 0.6 0.0 123.4 2.4 1.7 2.006
Q3 2007 2.0 2.1 1.422 8.6 7.4 90.6 -1.5 0.1 115.0 3.1 0.2 2.039
Q4 2007 2.0 4.9 1.460 12.9 6.1 89.4 3.4 2.2 111.7 3.1 4.0 1.984
Q1 2008 2.3 4.2 1.581 7.1 8.1 88.0 2.7 1.3 99.9 1.0 3.7 1.986
Q2 2008 -1.3 3.2 1.575 6.1 6.4 88.7 -4.6 1.6 106.2 -2.2 5.7 1.991
Q3 2008 -2.2 3.2 1.408 3.1 2.8 91.6 -4.1 3.6 105.9 -6.6 5.8 1.780
Q4 2008 -7.1 -1.4 1.392 0.1 -0.9 92.3 -12.5 -2.2 90.8 -8.7 0.5 1.462
Q1 2009 -11.3 -1.1 1.326 3.8 -1.4 94.2 -15.1 -3.6 99.2 -6.1 -0.1 1.430
Q2 2009 -0.8 0.0 1.402 15.4 2.3 92.3 7.1 -1.7 96.4 -0.8 2.2 1.645
Q3 2009 1.2 1.1 1.463 12.6 3.9 91.3 0.4 -1.2 89.5 0.6 3.5 1.600
Q4 2009 2.0 1.6 1.433 9.0 5.2 90.7 7.1 -1.6 93.1 1.4 3.0 1.617
Q1 2010 1.7 1.8 1.353 9.8 4.6 89.8 5.8 0.9 93.4 1.5 4.0 1.519
Q2 2010 3.9 2.0 1.229 9.8 3.4 91.1 4.6 -1.2 88.5 3.3 3.2 1.495
Q3 2010 1.9 1.6 1.360 8.8 3.9 88.4 6.1 -2.1 83.5 2.0 2.3 1.573
Q4 2010 2.1 2.6 1.327 9.3 7.7 87.4 -2.0 1.3 81.7 0.4 4.0 1.539
Q1 2011 3.5 3.6 1.418 9.5 6.3 86.5 -7.7 -0.4 82.8 3.0 6.7 1.605
Q2 2011 0.0 3.2 1.452 7.1 5.4 85.3 -2.2 -0.4 80.6 1.4 4.7 1.607
Q3 2011 -0.1 1.4 1.345 5.9 5.0 87.4 11.2 0.3 77.0 3.3 3.7 1.562
Q4 2011 -1.2 3.5 1.297 6.1 3.4 87.4 0.9 -0.7 77.0 0.6 3.4 1.554
Q1 2012 -0.7 2.7 1.333 7.1 3.2 86.4 3.6 1.9 82.4 0.9 2.1 1.599
Q2 2012 -1.3 2.3 1.267 5.9 4.0 88.1 -1.3 -0.7 79.8 -0.7 2.0 1.569
Q3 2012 -0.6 1.6 1.286 6.5 1.9 86.3 -1.9 -2.1 77.9 4.1 2.3 1.613
Q4 2012 -1.7 2.4 1.319 7.2 3.7 86.0 -0.4 0.0 86.6 -0.2 4.0 1.626
Q1 2013 -1.0 1.1 1.282 6.3 4.2 86.3 4.0 0.4 94.2 2.7 2.9 1.519
Q2 2013 1.6 0.5 1.301 7.0 3.1 87.3 3.1 0.6 99.2 2.4 1.7 1.521
Q3 2013 1.0 1.3 1.354 7.4 3.5 86.8 2.0 2.4 98.3 3.8 2.1 1.618
(continued on next page)
January 28, 2016 11
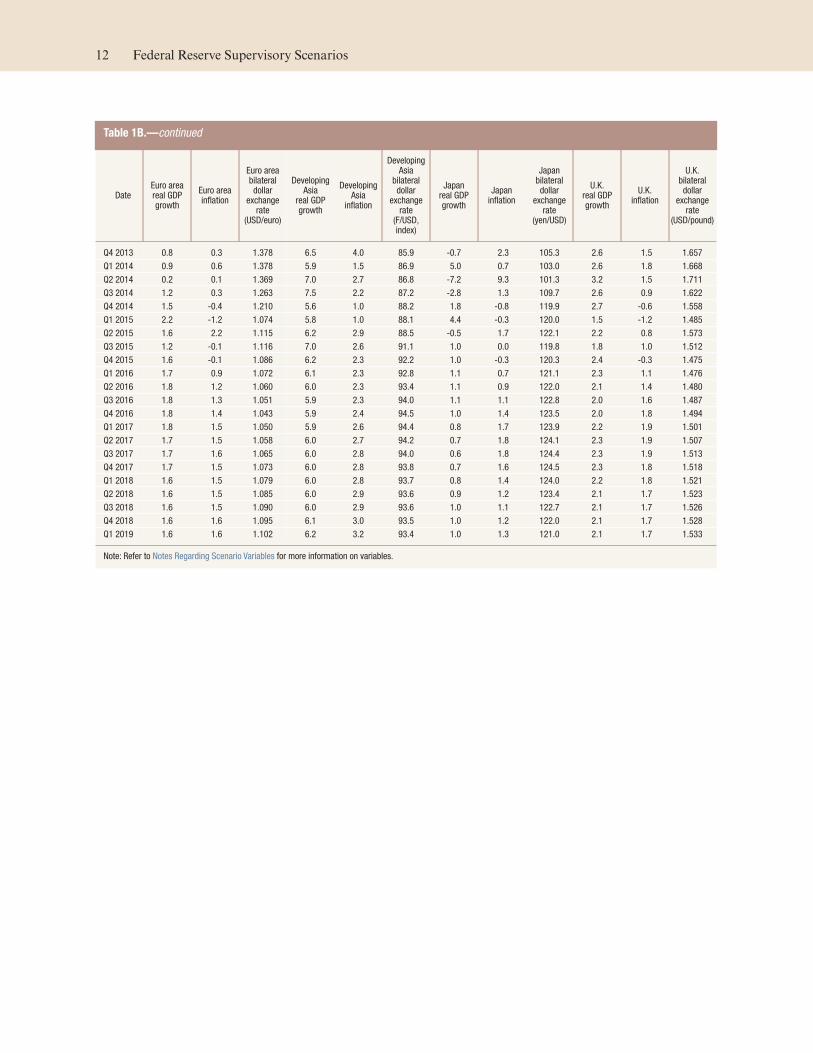
Table 1B.—continued
Date Euro areareal GDPgrowth
Euro area inflation
Euro area bilateral dollar
exchange rate
(USD/euro)
Developing Asia
real GDP growth
Developing Asia
inflation
Developing Asia
bilateral dollar
exchange rate
(F/USD, index)
Japan real GDP growth
Japan inflation
Japan bilateral dollar
exchange rate
(yen/USD)
U.K. real GDP growth
U.K. inflation
U.K. bilateral dollar
exchange rate
(USD/pound)
Q4 2013 0.8 0.3 1.378 6.5 4.0 85.9 -0.7 2.3 105.3 2.6 1.5 1.657
Q1 2014 0.9 0.6 1.378 5.9 1.5 86.9 5.0 0.7 103.0 2.6 1.8 1.668
Q2 2014 0.2 0.1 1.369 7.0 2.7 86.8 -7.2 9.3 101.3 3.2 1.5 1.711
Q3 2014 1.2 0.3 1.263 7.5 2.2 87.2 -2.8 1.3 109.7 2.6 0.9 1.622
Q4 2014 1.5 -0.4 1.210 5.6 1.0 88.2 1.8 -0.8 119.9 2.7 -0.6 1.558
Q1 2015 2.2 -1.2 1.074 5.8 1.0 88.1 4.4 -0.3 120.0 1.5 -1.2 1.485
Q2 2015 1.6 2.2 1.115 6.2 2.9 88.5 -0.5 1.7 122.1 2.2 0.8 1.573
Q3 2015 1.2 -0.1 1.116 7.0 2.6 91.1 1.0 0.0 119.8 1.8 1.0 1.512
Q4 2015 1.6 -0.1 1.086 6.2 2.3 92.2 1.0 -0.3 120.3 2.4 -0.3 1.475
Q1 2016 1.7 0.9 1.072 6.1 2.3 92.8 1.1 0.7 121.1 2.3 1.1 1.476
Q2 2016 1.8 1.2 1.060 6.0 2.3 93.4 1.1 0.9 122.0 2.1 1.4 1.480
Q3 2016 1.8 1.3 1.051 5.9 2.3 94.0 1.1 1.1 122.8 2.0 1.6 1.487
Q4 2016 1.8 1.4 1.043 5.9 2.4 94.5 1.0 1.4 123.5 2.0 1.8 1.494
Q1 2017 1.8 1.5 1.050 5.9 2.6 94.4 0.8 1.7 123.9 2.2 1.9 1.501
Q2 2017 1.7 1.5 1.058 6.0 2.7 94.2 0.7 1.8 124.1 2.3 1.9 1.507
Q3 2017 1.7 1.6 1.065 6.0 2.8 94.0 0.6 1.8 124.4 2.3 1.9 1.513
Q4 2017 1.7 1.5 1.073 6.0 2.8 93.8 0.7 1.6 124.5 2.3 1.8 1.518
Q1 2018 1.6 1.5 1.079 6.0 2.8 93.7 0.8 1.4 124.0 2.2 1.8 1.521
Q2 2018 1.6 1.5 1.085 6.0 2.9 93.6 0.9 1.2 123.4 2.1 1.7 1.523
Q3 2018 1.6 1.5 1.090 6.0 2.9 93.6 1.0 1.1 122.7 2.1 1.7 1.526
Q4 2018 1.6 1.6 1.095 6.1 3.0 93.5 1.0 1.2 122.0 2.1 1.7 1.528
Q1 2019 1.6 1.6 1.102 6.2 3.2 93.4 1.0 1.3 121.0 2.1 1.7 1.533
Note: Refer to Notes Regarding Scenario Variables for more information on variables.
12 Federal Reserve Supervisory Scenarios
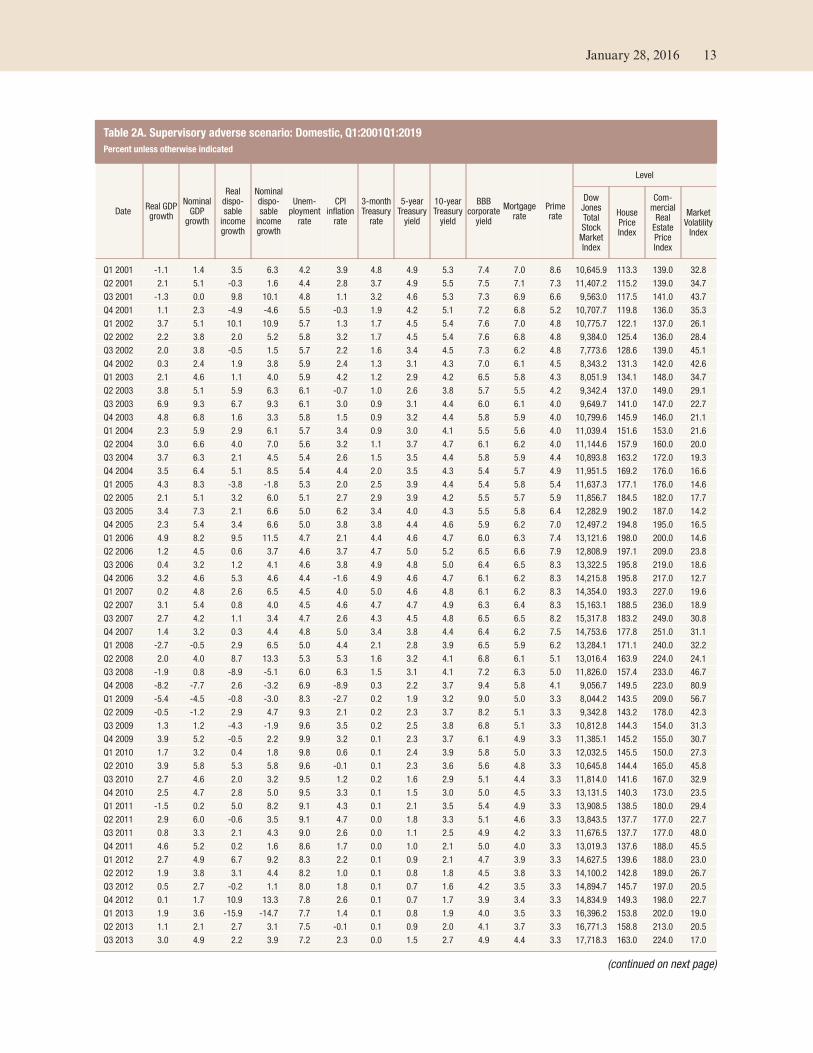
Table 2A. Supervisory adverse scenario: Domestic, Q1:2001Q1:2019
Percent unless otherwise indicated
DateReal GDP growth
Nominal GDP
growth
Real dispo-sable
income growth
Nominal dispo-sable
income growth
Unem-ployment
rate
CPI inflation
rate
3-month Treasury
rate
5-year Treasury
yield
10-year Treasury
yield
BBB corporate
yield
Mortgagerate
Primerate
Level
Dow Jones Total Stock
Market Index
HousePrice Index
Com-mercial
Real Estate Price Index
Market Volatility
Index
Q1 2001 -1.1 1.4 3.5 6.3 4.2 3.9 4.8 4.9 5.3 7.4 7.0 8.6 10,645.9 113.3 139.0 32.8
Q2 2001 2.1 5.1 -0.3 1.6 4.4 2.8 3.7 4.9 5.5 7.5 7.1 7.3 11,407.2 115.2 139.0 34.7
Q3 2001 -1.3 0.0 9.8 10.1 4.8 1.1 3.2 4.6 5.3 7.3 6.9 6.6 9,563.0 117.5 141.0 43.7
Q4 2001 1.1 2.3 -4.9 -4.6 5.5 -0.3 1.9 4.2 5.1 7.2 6.8 5.2 10,707.7 119.8 136.0 35.3
Q1 2002 3.7 5.1 10.1 10.9 5.7 1.3 1.7 4.5 5.4 7.6 7.0 4.8 10,775.7 122.1 137.0 26.1
Q2 2002 2.2 3.8 2.0 5.2 5.8 3.2 1.7 4.5 5.4 7.6 6.8 4.8 9,384.0 125.4 136.0 28.4
Q3 2002 2.0 3.8 -0.5 1.5 5.7 2.2 1.6 3.4 4.5 7.3 6.2 4.8 7,773.6 128.6 139.0 45.1
Q4 2002 0.3 2.4 1.9 3.8 5.9 2.4 1.3 3.1 4.3 7.0 6.1 4.5 8,343.2 131.3 142.0 42.6
Q1 2003 2.1 4.6 1.1 4.0 5.9 4.2 1.2 2.9 4.2 6.5 5.8 4.3 8,051.9 134.1 148.0 34.7
Q2 2003 3.8 5.1 5.9 6.3 6.1 -0.7 1.0 2.6 3.8 5.7 5.5 4.2 9,342.4 137.0 149.0 29.1
Q3 2003 6.9 9.3 6.7 9.3 6.1 3.0 0.9 3.1 4.4 6.0 6.1 4.0 9,649.7 141.0 147.0 22.7
Q4 2003 4.8 6.8 1.6 3.3 5.8 1.5 0.9 3.2 4.4 5.8 5.9 4.0 10,799.6 145.9 146.0 21.1
Q1 2004 2.3 5.9 2.9 6.1 5.7 3.4 0.9 3.0 4.1 5.5 5.6 4.0 11,039.4 151.6 153.0 21.6
Q2 2004 3.0 6.6 4.0 7.0 5.6 3.2 1.1 3.7 4.7 6.1 6.2 4.0 11,144.6 157.9 160.0 20.0
Q3 2004 3.7 6.3 2.1 4.5 5.4 2.6 1.5 3.5 4.4 5.8 5.9 4.4 10,893.8 163.2 172.0 19.3
Q4 2004 3.5 6.4 5.1 8.5 5.4 4.4 2.0 3.5 4.3 5.4 5.7 4.9 11,951.5 169.2 176.0 16.6
Q1 2005 4.3 8.3 -3.8 -1.8 5.3 2.0 2.5 3.9 4.4 5.4 5.8 5.4 11,637.3 177.1 176.0 14.6
Q2 2005 2.1 5.1 3.2 6.0 5.1 2.7 2.9 3.9 4.2 5.5 5.7 5.9 11,856.7 184.5 182.0 17.7
Q3 2005 3.4 7.3 2.1 6.6 5.0 6.2 3.4 4.0 4.3 5.5 5.8 6.4 12,282.9 190.2 187.0 14.2
Q4 2005 2.3 5.4 3.4 6.6 5.0 3.8 3.8 4.4 4.6 5.9 6.2 7.0 12,497.2 194.8 195.0 16.5
Q1 2006 4.9 8.2 9.5 11.5 4.7 2.1 4.4 4.6 4.7 6.0 6.3 7.4 13,121.6 198.0 200.0 14.6
Q2 2006 1.2 4.5 0.6 3.7 4.6 3.7 4.7 5.0 5.2 6.5 6.6 7.9 12,808.9 197.1 209.0 23.8
Q3 2006 0.4 3.2 1.2 4.1 4.6 3.8 4.9 4.8 5.0 6.4 6.5 8.3 13,322.5 195.8 219.0 18.6
Q4 2006 3.2 4.6 5.3 4.6 4.4 -1.6 4.9 4.6 4.7 6.1 6.2 8.3 14,215.8 195.8 217.0 12.7
Q1 2007 0.2 4.8 2.6 6.5 4.5 4.0 5.0 4.6 4.8 6.1 6.2 8.3 14,354.0 193.3 227.0 19.6
Q2 2007 3.1 5.4 0.8 4.0 4.5 4.6 4.7 4.7 4.9 6.3 6.4 8.3 15,163.1 188.5 236.0 18.9
Q3 2007 2.7 4.2 1.1 3.4 4.7 2.6 4.3 4.5 4.8 6.5 6.5 8.2 15,317.8 183.2 249.0 30.8
Q4 2007 1.4 3.2 0.3 4.4 4.8 5.0 3.4 3.8 4.4 6.4 6.2 7.5 14,753.6 177.8 251.0 31.1
Q1 2008 -2.7 -0.5 2.9 6.5 5.0 4.4 2.1 2.8 3.9 6.5 5.9 6.2 13,284.1 171.1 240.0 32.2
Q2 2008 2.0 4.0 8.7 13.3 5.3 5.3 1.6 3.2 4.1 6.8 6.1 5.1 13,016.4 163.9 224.0 24.1
Q3 2008 -1.9 0.8 -8.9 -5.1 6.0 6.3 1.5 3.1 4.1 7.2 6.3 5.0 11,826.0 157.4 233.0 46.7
Q4 2008 -8.2 -7.7 2.6 -3.2 6.9 -8.9 0.3 2.2 3.7 9.4 5.8 4.1 9,056.7 149.5 223.0 80.9
Q1 2009 -5.4 -4.5 -0.8 -3.0 8.3 -2.7 0.2 1.9 3.2 9.0 5.0 3.3 8,044.2 143.5 209.0 56.7
Q2 2009 -0.5 -1.2 2.9 4.7 9.3 2.1 0.2 2.3 3.7 8.2 5.1 3.3 9,342.8 143.2 178.0 42.3
Q3 2009 1.3 1.2 -4.3 -1.9 9.6 3.5 0.2 2.5 3.8 6.8 5.1 3.3 10,812.8 144.3 154.0 31.3
Q4 2009 3.9 5.2 -0.5 2.2 9.9 3.2 0.1 2.3 3.7 6.1 4.9 3.3 11,385.1 145.2 155.0 30.7
Q1 2010 1.7 3.2 0.4 1.8 9.8 0.6 0.1 2.4 3.9 5.8 5.0 3.3 12,032.5 145.5 150.0 27.3
Q2 2010 3.9 5.8 5.3 5.8 9.6 -0.1 0.1 2.3 3.6 5.6 4.8 3.3 10,645.8 144.4 165.0 45.8
Q3 2010 2.7 4.6 2.0 3.2 9.5 1.2 0.2 1.6 2.9 5.1 4.4 3.3 11,814.0 141.6 167.0 32.9
Q4 2010 2.5 4.7 2.8 5.0 9.5 3.3 0.1 1.5 3.0 5.0 4.5 3.3 13,131.5 140.3 173.0 23.5
Q1 2011 -1.5 0.2 5.0 8.2 9.1 4.3 0.1 2.1 3.5 5.4 4.9 3.3 13,908.5 138.5 180.0 29.4
Q2 2011 2.9 6.0 -0.6 3.5 9.1 4.7 0.0 1.8 3.3 5.1 4.6 3.3 13,843.5 137.7 177.0 22.7
Q3 2011 0.8 3.3 2.1 4.3 9.0 2.6 0.0 1.1 2.5 4.9 4.2 3.3 11,676.5 137.7 177.0 48.0
Q4 2011 4.6 5.2 0.2 1.6 8.6 1.7 0.0 1.0 2.1 5.0 4.0 3.3 13,019.3 137.6 188.0 45.5
Q1 2012 2.7 4.9 6.7 9.2 8.3 2.2 0.1 0.9 2.1 4.7 3.9 3.3 14,627.5 139.6 188.0 23.0
Q2 2012 1.9 3.8 3.1 4.4 8.2 1.0 0.1 0.8 1.8 4.5 3.8 3.3 14,100.2 142.8 189.0 26.7
Q3 2012 0.5 2.7 -0.2 1.1 8.0 1.8 0.1 0.7 1.6 4.2 3.5 3.3 14,894.7 145.7 197.0 20.5
Q4 2012 0.1 1.7 10.9 13.3 7.8 2.6 0.1 0.7 1.7 3.9 3.4 3.3 14,834.9 149.3 198.0 22.7
Q1 2013 1.9 3.6 -15.9 -14.7 7.7 1.4 0.1 0.8 1.9 4.0 3.5 3.3 16,396.2 153.8 202.0 19.0
Q2 2013 1.1 2.1 2.7 3.1 7.5 -0.1 0.1 0.9 2.0 4.1 3.7 3.3 16,771.3 158.8 213.0 20.5
Q3 2013 3.0 4.9 2.2 3.9 7.2 2.3 0.0 1.5 2.7 4.9 4.4 3.3 17,718.3 163.0 224.0 17.0
(continued on next page)
January 28, 2016 13

Table 2A.—continued
DateReal GDP growth
Nominal GDP
growth
Real dispo-sable
income growth
Nominal dispo-sable
income growth
Unem-ployment
rate
CPI inflation
rate
3-month Treasury
rate
5-year Treasury
yield
10-year Treasury
yield
BBB corporate
yield
Mortgagerate
Primerate
Level
Dow Jones Total Stock
Market Index
HousePrice Index
Com-mercial
Real Estate Price Index
Market Volatility
Index
Q4 2013 3.8 5.6 0.6 2.0 7.0 1.4 0.1 1.4 2.8 4.8 4.3 3.3 19,413.2 166.3 229.0 20.3
Q1 2014 -0.9 0.6 4.0 5.6 6.7 2.1 0.0 1.6 2.8 4.6 4.4 3.3 19,711.2 169.3 230.0 21.4
Q2 2014 4.6 6.9 3.0 5.2 6.2 2.4 0.0 1.7 2.7 4.3 4.2 3.3 20,568.7 170.7 239.0 17.0
Q3 2014 4.3 6.0 2.7 3.9 6.1 1.2 0.0 1.7 2.5 4.2 4.1 3.3 20,458.8 172.5 245.0 17.0
Q4 2014 2.1 2.2 4.7 4.2 5.7 -0.9 0.0 1.6 2.3 4.2 3.9 3.3 21,424.6 174.5 252.0 26.3
Q1 2015 0.6 0.8 3.9 1.9 5.6 -3.1 0.0 1.5 2.0 4.0 3.7 3.3 21,707.6 177.3 260.0 22.4
Q2 2015 3.9 6.1 2.6 4.9 5.4 3.0 0.0 1.5 2.2 4.2 3.8 3.3 21,630.9 179.4 264.0 18.9
Q3 2015 2.0 3.3 3.8 5.1 5.2 1.6 0.0 1.6 2.3 4.5 3.9 3.3 19,959.3 181.7 270.0 40.7
Q4 2015 1.9 1.9 3.5 3.8 5.0 0.2 0.1 1.6 2.2 4.6 3.9 3.3 21,100.9 183.1 273.4 24.4
Q1 2016 -1.5 -0.1 2.3 1.2 5.5 -0.9 0.1 0.5 1.3 4.4 3.5 3.3 20,899.6 181.2 270.6 40.7
Q2 2016 -2.8 -3.0 0.3 -0.6 6.1 -0.7 0.1 0.7 1.4 4.9 3.8 3.3 18,454.3 178.7 264.2 37.0
Q3 2016 -2.0 -2.1 -0.2 -1.0 6.7 -0.5 0.1 0.8 1.5 5.1 4.0 3.3 16,692.8 175.9 257.7 38.4
Q4 2016 -1.1 -1.1 0.0 -0.3 7.1 -0.1 0.1 1.0 1.7 5.4 4.2 3.2 15,536.2 172.8 251.8 36.0
Q1 2017 0.0 0.2 0.9 1.0 7.4 0.3 0.1 1.2 1.8 5.4 4.3 3.2 15,745.4 169.8 246.6 32.0
Q2 2017 1.3 1.8 1.4 1.9 7.5 0.7 0.1 1.3 1.9 5.3 4.3 3.2 16,052.6 167.0 243.5 29.1
Q3 2017 1.7 2.6 1.1 1.9 7.5 1.0 0.1 1.5 2.2 5.4 4.5 3.2 16,396.9 164.5 240.5 26.8
Q4 2017 2.6 3.4 2.1 3.1 7.5 1.2 0.1 1.6 2.3 5.4 4.6 3.2 17,115.4 162.9 240.6 24.7
Q1 2018 2.6 3.4 2.3 3.4 7.4 1.3 0.1 1.8 2.4 5.4 4.7 3.2 17,806.7 161.7 241.0 23.1
Q2 2018 3.0 3.9 2.5 3.7 7.3 1.4 0.1 1.9 2.6 5.5 4.8 3.2 18,645.6 161.1 242.2 21.7
Q3 2018 3.0 4.0 2.6 3.8 7.2 1.5 0.1 2.1 2.8 5.5 4.9 3.2 19,184.9 161.0 244.4 21.0
Q4 2018 3.0 4.1 2.6 3.9 7.1 1.6 0.1 2.3 2.9 5.6 5.0 3.2 19,756.4 161.2 246.8 20.3
Q1 2019 3.0 4.2 2.4 3.9 7.0 1.7 0.1 2.4 3.0 5.6 5.1 3.2 20,341.0 161.6 249.4 19.8
Note: Refer to Notes Regarding Scenario Variables for more information on variables.
14 Federal Reserve Supervisory Scenarios

Table 2B. Supervisory adverse scenario: International, Q1:2001Q1:2019
Percent unless otherwise indicated
Date Euro areareal GDPgrowth
Euro area inflation
Euro area bilateral dollar
exchange rate
(USD/euro)
Developing Asia
real GDP growth
Developing Asia
inflation
Developing Asia
bilateral dollar
exchange rate
(F/USD, index)
Japan real GDP growth
Japan inflation
Japan bilateral dollar
exchange rate
(yen/USD)
U.K. real GDP growth
U.K. inflation
U.K. bilateral dollar
exchange rate
(USD/pound)
Q1 2001 3.8 1.1 0.879 5.0 1.7 106.0 2.6 -1.2 125.5 4.6 0.1 1.419
Q2 2001 0.1 4.1 0.847 5.5 2.2 106.1 -0.7 -0.3 124.7 3.1 3.1 1.408
Q3 2001 0.3 1.4 0.910 4.7 1.1 106.4 -4.4 -1.1 119.2 2.6 1.0 1.469
Q4 2001 0.5 1.7 0.890 8.4 0.2 106.9 -0.5 -1.4 131.0 1.4 0.0 1.454
Q1 2002 0.9 3.0 0.872 7.6 0.4 107.3 -0.9 -2.7 132.7 1.6 1.9 1.425
Q2 2002 2.0 2.0 0.986 8.1 1.2 104.8 4.3 1.7 119.9 3.3 0.9 1.525
Q3 2002 1.6 1.6 0.988 7.3 1.3 105.5 2.6 -0.7 121.7 3.9 1.4 1.570
Q4 2002 0.3 2.4 1.049 6.4 0.9 104.5 1.5 -0.4 118.8 3.6 1.9 1.610
Q1 2003 -0.9 3.3 1.090 6.5 3.6 105.5 -2.2 -1.6 118.1 2.9 1.6 1.579
Q2 2003 0.4 0.3 1.150 2.3 1.2 104.0 5.2 1.7 119.9 3.7 0.3 1.653
Q3 2003 2.0 2.2 1.165 14.2 0.0 102.6 1.7 -0.7 111.4 3.1 1.7 1.662
Q4 2003 3.1 2.2 1.260 12.9 5.6 103.4 4.2 -0.6 107.1 3.0 1.7 1.784
Q1 2004 2.0 2.3 1.229 5.5 4.0 101.4 3.8 -0.9 104.2 2.7 1.3 1.840
Q2 2004 2.2 2.4 1.218 7.1 4.1 102.8 0.3 1.1 109.4 2.2 1.0 1.813
Q3 2004 1.3 2.0 1.242 8.2 3.9 102.7 0.6 0.1 110.2 0.9 1.1 1.809
Q4 2004 1.5 2.4 1.354 6.3 0.9 98.9 -1.0 1.7 102.7 1.9 2.4 1.916
Q1 2005 0.6 1.5 1.297 10.3 2.9 98.6 0.8 -2.7 107.2 2.8 2.6 1.889
Q2 2005 2.8 2.2 1.210 8.9 1.5 98.9 5.4 -1.2 110.9 4.4 1.9 1.793
Q3 2005 3.0 3.2 1.206 9.3 2.3 98.6 1.4 -1.3 113.3 4.1 2.7 1.770
Q4 2005 2.4 2.5 1.184 11.6 1.7 98.1 0.7 0.7 117.9 5.9 1.4 1.719
Q1 2006 3.7 1.7 1.214 10.9 2.4 96.8 1.7 1.3 117.5 1.5 1.9 1.739
Q2 2006 4.4 2.5 1.278 7.1 3.2 96.7 1.7 -0.1 114.5 1.2 3.0 1.849
Q3 2006 2.6 2.0 1.269 10.3 2.1 96.4 -0.3 0.5 118.0 0.5 3.3 1.872
Q4 2006 4.4 0.9 1.320 11.1 3.8 94.6 5.2 -0.4 119.0 2.3 2.6 1.959
Q1 2007 3.2 2.2 1.337 13.7 3.6 94.0 4.0 -0.2 117.6 3.9 2.6 1.969
Q2 2007 2.5 2.3 1.352 10.6 4.9 91.9 0.6 0.0 123.4 2.4 1.7 2.006
Q3 2007 2.0 2.1 1.422 8.6 7.4 90.6 -1.5 0.1 115.0 3.1 0.2 2.039
Q4 2007 2.0 4.9 1.460 12.9 6.1 89.4 3.4 2.2 111.7 3.1 4.0 1.984
Q1 2008 2.3 4.2 1.581 7.1 8.1 88.0 2.7 1.3 99.9 1.0 3.7 1.986
Q2 2008 -1.3 3.2 1.575 6.1 6.4 88.7 -4.6 1.6 106.2 -2.2 5.7 1.991
Q3 2008 -2.2 3.2 1.408 3.1 2.8 91.6 -4.1 3.6 105.9 -6.6 5.8 1.780
Q4 2008 -7.1 -1.4 1.392 0.1 -0.9 92.3 -12.5 -2.2 90.8 -8.7 0.5 1.462
Q1 2009 -11.3 -1.1 1.326 3.8 -1.4 94.2 -15.1 -3.6 99.2 -6.1 -0.1 1.430
Q2 2009 -0.8 0.0 1.402 15.4 2.3 92.3 7.1 -1.7 96.4 -0.8 2.2 1.645
Q3 2009 1.2 1.1 1.463 12.6 3.9 91.3 0.4 -1.2 89.5 0.6 3.5 1.600
Q4 2009 2.0 1.6 1.433 9.0 5.2 90.7 7.1 -1.6 93.1 1.4 3.0 1.617
Q1 2010 1.7 1.8 1.353 9.8 4.6 89.8 5.8 0.9 93.4 1.5 4.0 1.519
Q2 2010 3.9 2.0 1.229 9.8 3.4 91.1 4.6 -1.2 88.5 3.3 3.2 1.495
Q3 2010 1.9 1.6 1.360 8.8 3.9 88.4 6.1 -2.1 83.5 2.0 2.3 1.573
Q4 2010 2.1 2.6 1.327 9.3 7.7 87.4 -2.0 1.3 81.7 0.4 4.0 1.539
Q1 2011 3.5 3.6 1.418 9.5 6.3 86.5 -7.7 -0.4 82.8 3.0 6.7 1.605
Q2 2011 0.0 3.2 1.452 7.1 5.4 85.3 -2.2 -0.4 80.6 1.4 4.7 1.607
Q3 2011 -0.1 1.4 1.345 5.9 5.0 87.4 11.2 0.3 77.0 3.3 3.7 1.562
Q4 2011 -1.2 3.5 1.297 6.1 3.4 87.4 0.9 -0.7 77.0 0.6 3.4 1.554
Q1 2012 -0.7 2.7 1.333 7.1 3.2 86.4 3.6 1.9 82.4 0.9 2.1 1.599
Q2 2012 -1.3 2.3 1.267 5.9 4.0 88.1 -1.3 -0.7 79.8 -0.7 2.0 1.569
Q3 2012 -0.6 1.6 1.286 6.5 1.9 86.3 -1.9 -2.1 77.9 4.1 2.3 1.613
Q4 2012 -1.7 2.4 1.319 7.2 3.7 86.0 -0.4 0.0 86.6 -0.2 4.0 1.626
Q1 2013 -1.0 1.1 1.282 6.3 4.2 86.3 4.0 0.4 94.2 2.7 2.9 1.519
Q2 2013 1.6 0.5 1.301 7.0 3.1 87.3 3.1 0.6 99.2 2.4 1.7 1.521
Q3 2013 1.0 1.3 1.354 7.4 3.5 86.8 2.0 2.4 98.3 3.8 2.1 1.618
(continued on next page)
January 28, 2016 15

Table 2B.—continued
Date Euro areareal GDPgrowth
Euro area inflation
Euro area bilateral dollar
exchange rate
(USD/euro)
Developing Asia
real GDP growth
Developing Asia
inflation
Developing Asia
bilateral dollar
exchange rate
(F/USD, index)
Japan real GDP growth
Japan inflation
Japan bilateral dollar
exchange rate
(yen/USD)
U.K. real GDP growth
U.K. inflation
U.K. bilateral dollar
exchange rate
(USD/pound)
Q4 2013 0.8 0.3 1.378 6.5 4.0 85.9 -0.7 2.3 105.3 2.6 1.5 1.657
Q1 2014 0.9 0.6 1.378 5.9 1.5 86.9 5.0 0.7 103.0 2.6 1.8 1.668
Q2 2014 0.2 0.1 1.369 7.0 2.7 86.8 -7.2 9.3 101.3 3.2 1.5 1.711
Q3 2014 1.2 0.3 1.263 7.5 2.2 87.2 -2.8 1.3 109.7 2.6 0.9 1.622
Q4 2014 1.5 -0.4 1.210 5.6 1.0 88.2 1.8 -0.8 119.9 2.7 -0.6 1.558
Q1 2015 2.2 -1.2 1.074 5.8 1.0 88.1 4.4 -0.3 120.0 1.5 -1.2 1.485
Q2 2015 1.6 2.2 1.115 6.2 2.9 88.5 -0.5 1.7 122.1 2.2 0.8 1.573
Q3 2015 1.2 -0.1 1.116 7.0 2.6 91.1 1.0 0.0 119.8 1.8 1.0 1.512
Q4 2015 1.6 -0.1 1.086 6.2 2.3 92.2 1.0 -0.3 120.3 2.4 -0.3 1.475
Q1 2016 -3.4 -0.5 0.991 -1.1 0.2 102.3 -4.0 -2.1 122.7 -2.1 -0.7 1.414
Q2 2016 -3.2 -0.8 0.982 0.4 -0.3 104.6 -5.7 -2.4 121.6 -2.6 -0.8 1.422
Q3 2016 -1.8 -0.6 0.976 3.8 -0.8 104.4 -5.0 -2.2 122.1 -1.9 -0.5 1.430
Q4 2016 -0.7 -0.3 0.972 5.5 -0.7 104.1 -3.8 -1.7 122.6 -0.9 -0.2 1.440
Q1 2017 0.2 0.1 0.981 6.2 -0.4 103.0 -2.8 -1.2 122.6 0.1 0.2 1.449
Q2 2017 0.9 0.4 0.991 6.3 -0.1 101.8 -1.9 -0.7 122.6 1.0 0.6 1.457
Q3 2017 1.5 0.6 1.000 6.3 0.3 100.6 -1.1 -0.4 122.6 1.7 0.8 1.464
Q4 2017 1.8 0.8 1.010 6.3 0.6 99.5 -0.3 -0.2 122.6 2.2 1.0 1.470
Q1 2018 2.0 0.9 1.019 6.3 0.8 98.6 0.4 -0.2 122.0 2.4 1.1 1.473
Q2 2018 2.1 1.0 1.027 6.4 1.1 97.8 0.9 -0.1 121.4 2.6 1.2 1.475
Q3 2018 2.1 1.1 1.035 6.5 1.4 97.1 1.2 0.0 120.8 2.7 1.3 1.477
Q4 2018 2.1 1.2 1.043 6.6 1.7 96.5 1.5 0.3 120.3 2.7 1.4 1.479
Q1 2019 2.0 1.3 1.051 6.7 2.0 96.1 1.6 0.6 119.4 2.7 1.5 1.484
Note: Refer to Notes Regarding Scenario Variables for more information on variables.
16 Federal Reserve Supervisory Scenarios

Table 3A. Supervisory severely adverse scenario: Domestic, Q1:2001Q1:2019
Percent unless otherwise indicated
DateReal GDP growth
Nominal GDP
growth
Real dispo-sable
income growth
Nominal dispo-sable
income growth
Unem-ployment
rate
CPI inflation
rate
3-month Treasury
rate
5-year Treasury
yield
10-year Treasury
yield
BBB corporate
yield
Mortgagerate
Primerate
Level
Dow Jones Total Stock
Market Index
HousePrice Index
Com-mercial
Real Estate Price Index
Market Volatility
Index
Q1 2001 -1.1 1.4 3.5 6.3 4.2 3.9 4.8 4.9 5.3 7.4 7.0 8.6 10,645.9 113.3 139.0 32.8
Q2 2001 2.1 5.1 -0.3 1.6 4.4 2.8 3.7 4.9 5.5 7.5 7.1 7.3 11,407.2 115.2 139.0 34.7
Q3 2001 -1.3 0.0 9.8 10.1 4.8 1.1 3.2 4.6 5.3 7.3 6.9 6.6 9,563.0 117.5 141.0 43.7
Q4 2001 1.1 2.3 -4.9 -4.6 5.5 -0.3 1.9 4.2 5.1 7.2 6.8 5.2 10,707.7 119.8 136.0 35.3
Q1 2002 3.7 5.1 10.1 10.9 5.7 1.3 1.7 4.5 5.4 7.6 7.0 4.8 10,775.7 122.1 137.0 26.1
Q2 2002 2.2 3.8 2.0 5.2 5.8 3.2 1.7 4.5 5.4 7.6 6.8 4.8 9,384.0 125.4 136.0 28.4
Q3 2002 2.0 3.8 -0.5 1.5 5.7 2.2 1.6 3.4 4.5 7.3 6.2 4.8 7,773.6 128.6 139.0 45.1
Q4 2002 0.3 2.4 1.9 3.8 5.9 2.4 1.3 3.1 4.3 7.0 6.1 4.5 8,343.2 131.3 142.0 42.6
Q1 2003 2.1 4.6 1.1 4.0 5.9 4.2 1.2 2.9 4.2 6.5 5.8 4.3 8,051.9 134.1 148.0 34.7
Q2 2003 3.8 5.1 5.9 6.3 6.1 -0.7 1.0 2.6 3.8 5.7 5.5 4.2 9,342.4 137.0 149.0 29.1
Q3 2003 6.9 9.3 6.7 9.3 6.1 3.0 0.9 3.1 4.4 6.0 6.1 4.0 9,649.7 141.0 147.0 22.7
Q4 2003 4.8 6.8 1.6 3.3 5.8 1.5 0.9 3.2 4.4 5.8 5.9 4.0 10,799.6 145.9 146.0 21.1
Q1 2004 2.3 5.9 2.9 6.1 5.7 3.4 0.9 3.0 4.1 5.5 5.6 4.0 11,039.4 151.6 153.0 21.6
Q2 2004 3.0 6.6 4.0 7.0 5.6 3.2 1.1 3.7 4.7 6.1 6.2 4.0 11,144.6 157.9 160.0 20.0
Q3 2004 3.7 6.3 2.1 4.5 5.4 2.6 1.5 3.5 4.4 5.8 5.9 4.4 10,893.8 163.2 172.0 19.3
Q4 2004 3.5 6.4 5.1 8.5 5.4 4.4 2.0 3.5 4.3 5.4 5.7 4.9 11,951.5 169.2 176.0 16.6
Q1 2005 4.3 8.3 -3.8 -1.8 5.3 2.0 2.5 3.9 4.4 5.4 5.8 5.4 11,637.3 177.1 176.0 14.6
Q2 2005 2.1 5.1 3.2 6.0 5.1 2.7 2.9 3.9 4.2 5.5 5.7 5.9 11,856.7 184.5 182.0 17.7
Q3 2005 3.4 7.3 2.1 6.6 5.0 6.2 3.4 4.0 4.3 5.5 5.8 6.4 12,282.9 190.2 187.0 14.2
Q4 2005 2.3 5.4 3.4 6.6 5.0 3.8 3.8 4.4 4.6 5.9 6.2 7.0 12,497.2 194.8 195.0 16.5
Q1 2006 4.9 8.2 9.5 11.5 4.7 2.1 4.4 4.6 4.7 6.0 6.3 7.4 13,121.6 198.0 200.0 14.6
Q2 2006 1.2 4.5 0.6 3.7 4.6 3.7 4.7 5.0 5.2 6.5 6.6 7.9 12,808.9 197.1 209.0 23.8
Q3 2006 0.4 3.2 1.2 4.1 4.6 3.8 4.9 4.8 5.0 6.4 6.5 8.3 13,322.5 195.8 219.0 18.6
Q4 2006 3.2 4.6 5.3 4.6 4.4 -1.6 4.9 4.6 4.7 6.1 6.2 8.3 14,215.8 195.8 217.0 12.7
Q1 2007 0.2 4.8 2.6 6.5 4.5 4.0 5.0 4.6 4.8 6.1 6.2 8.3 14,354.0 193.3 227.0 19.6
Q2 2007 3.1 5.4 0.8 4.0 4.5 4.6 4.7 4.7 4.9 6.3 6.4 8.3 15,163.1 188.5 236.0 18.9
Q3 2007 2.7 4.2 1.1 3.4 4.7 2.6 4.3 4.5 4.8 6.5 6.5 8.2 15,317.8 183.2 249.0 30.8
Q4 2007 1.4 3.2 0.3 4.4 4.8 5.0 3.4 3.8 4.4 6.4 6.2 7.5 14,753.6 177.8 251.0 31.1
Q1 2008 -2.7 -0.5 2.9 6.5 5.0 4.4 2.1 2.8 3.9 6.5 5.9 6.2 13,284.1 171.1 240.0 32.2
Q2 2008 2.0 4.0 8.7 13.3 5.3 5.3 1.6 3.2 4.1 6.8 6.1 5.1 13,016.4 163.9 224.0 24.1
Q3 2008 -1.9 0.8 -8.9 -5.1 6.0 6.3 1.5 3.1 4.1 7.2 6.3 5.0 11,826.0 157.4 233.0 46.7
Q4 2008 -8.2 -7.7 2.6 -3.2 6.9 -8.9 0.3 2.2 3.7 9.4 5.8 4.1 9,056.7 149.5 223.0 80.9
Q1 2009 -5.4 -4.5 -0.8 -3.0 8.3 -2.7 0.2 1.9 3.2 9.0 5.0 3.3 8,044.2 143.5 209.0 56.7
Q2 2009 -0.5 -1.2 2.9 4.7 9.3 2.1 0.2 2.3 3.7 8.2 5.1 3.3 9,342.8 143.2 178.0 42.3
Q3 2009 1.3 1.2 -4.3 -1.9 9.6 3.5 0.2 2.5 3.8 6.8 5.1 3.3 10,812.8 144.3 154.0 31.3
Q4 2009 3.9 5.2 -0.5 2.2 9.9 3.2 0.1 2.3 3.7 6.1 4.9 3.3 11,385.1 145.2 155.0 30.7
Q1 2010 1.7 3.2 0.4 1.8 9.8 0.6 0.1 2.4 3.9 5.8 5.0 3.3 12,032.5 145.5 150.0 27.3
Q2 2010 3.9 5.8 5.3 5.8 9.6 -0.1 0.1 2.3 3.6 5.6 4.8 3.3 10,645.8 144.4 165.0 45.8
Q3 2010 2.7 4.6 2.0 3.2 9.5 1.2 0.2 1.6 2.9 5.1 4.4 3.3 11,814.0 141.6 167.0 32.9
Q4 2010 2.5 4.7 2.8 5.0 9.5 3.3 0.1 1.5 3.0 5.0 4.5 3.3 13,131.5 140.3 173.0 23.5
Q1 2011 -1.5 0.2 5.0 8.2 9.1 4.3 0.1 2.1 3.5 5.4 4.9 3.3 13,908.5 138.5 180.0 29.4
Q2 2011 2.9 6.0 -0.6 3.5 9.1 4.7 0.0 1.8 3.3 5.1 4.6 3.3 13,843.5 137.7 177.0 22.7
Q3 2011 0.8 3.3 2.1 4.3 9.0 2.6 0.0 1.1 2.5 4.9 4.2 3.3 11,676.5 137.7 177.0 48.0
Q4 2011 4.6 5.2 0.2 1.6 8.6 1.7 0.0 1.0 2.1 5.0 4.0 3.3 13,019.3 137.6 188.0 45.5
Q1 2012 2.7 4.9 6.7 9.2 8.3 2.2 0.1 0.9 2.1 4.7 3.9 3.3 14,627.5 139.6 188.0 23.0
Q2 2012 1.9 3.8 3.1 4.4 8.2 1.0 0.1 0.8 1.8 4.5 3.8 3.3 14,100.2 142.8 189.0 26.7
Q3 2012 0.5 2.7 -0.2 1.1 8.0 1.8 0.1 0.7 1.6 4.2 3.5 3.3 14,894.7 145.7 197.0 20.5
Q4 2012 0.1 1.7 10.9 13.3 7.8 2.6 0.1 0.7 1.7 3.9 3.4 3.3 14,834.9 149.3 198.0 22.7
Q1 2013 1.9 3.6 -15.9 -14.7 7.7 1.4 0.1 0.8 1.9 4.0 3.5 3.3 16,396.2 153.8 202.0 19.0
Q2 2013 1.1 2.1 2.7 3.1 7.5 -0.1 0.1 0.9 2.0 4.1 3.7 3.3 16,771.3 158.8 213.0 20.5
Q3 2013 3.0 4.9 2.2 3.9 7.2 2.3 0.0 1.5 2.7 4.9 4.4 3.3 17,718.3 163.0 224.0 17.0
(continued on next page)
January 28, 2016 17
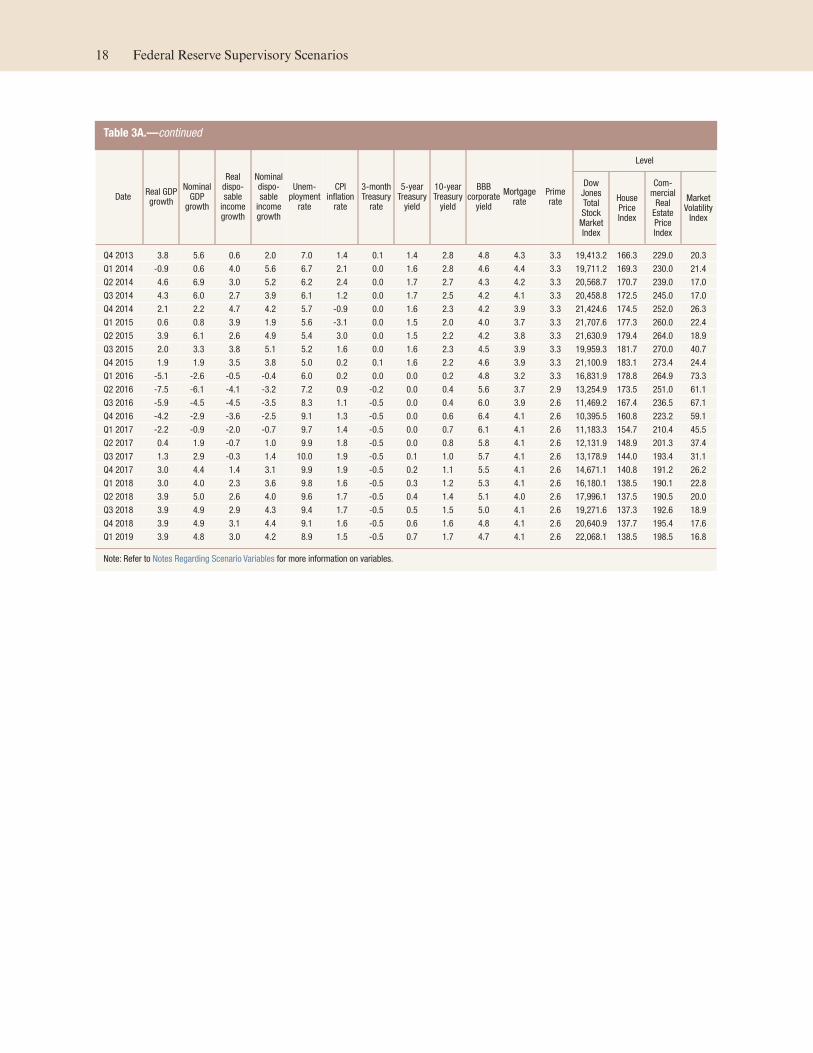
Table 3A.—continued
DateReal GDP growth
Nominal GDP
growth
Real dispo-sable
income growth
Nominal dispo-sable
income growth
Unem-ployment
rate
CPI inflation
rate
3-month Treasury
rate
5-year Treasury
yield
10-year Treasury
yield
BBB corporate
yield
Mortgagerate
Primerate
Level
Dow Jones Total Stock
Market Index
HousePrice Index
Com-mercial
Real Estate Price Index
Market Volatility
Index
Q4 2013 3.8 5.6 0.6 2.0 7.0 1.4 0.1 1.4 2.8 4.8 4.3 3.3 19,413.2 166.3 229.0 20.3
Q1 2014 -0.9 0.6 4.0 5.6 6.7 2.1 0.0 1.6 2.8 4.6 4.4 3.3 19,711.2 169.3 230.0 21.4
Q2 2014 4.6 6.9 3.0 5.2 6.2 2.4 0.0 1.7 2.7 4.3 4.2 3.3 20,568.7 170.7 239.0 17.0
Q3 2014 4.3 6.0 2.7 3.9 6.1 1.2 0.0 1.7 2.5 4.2 4.1 3.3 20,458.8 172.5 245.0 17.0
Q4 2014 2.1 2.2 4.7 4.2 5.7 -0.9 0.0 1.6 2.3 4.2 3.9 3.3 21,424.6 174.5 252.0 26.3
Q1 2015 0.6 0.8 3.9 1.9 5.6 -3.1 0.0 1.5 2.0 4.0 3.7 3.3 21,707.6 177.3 260.0 22.4
Q2 2015 3.9 6.1 2.6 4.9 5.4 3.0 0.0 1.5 2.2 4.2 3.8 3.3 21,630.9 179.4 264.0 18.9
Q3 2015 2.0 3.3 3.8 5.1 5.2 1.6 0.0 1.6 2.3 4.5 3.9 3.3 19,959.3 181.7 270.0 40.7
Q4 2015 1.9 1.9 3.5 3.8 5.0 0.2 0.1 1.6 2.2 4.6 3.9 3.3 21,100.9 183.1 273.4 24.4
Q1 2016 -5.1 -2.6 -0.5 -0.4 6.0 0.2 0.0 0.0 0.2 4.8 3.2 3.3 16,831.9 178.8 264.9 73.3
Q2 2016 -7.5 -6.1 -4.1 -3.2 7.2 0.9 -0.2 0.0 0.4 5.6 3.7 2.9 13,254.9 173.5 251.0 61.1
Q3 2016 -5.9 -4.5 -4.5 -3.5 8.3 1.1 -0.5 0.0 0.4 6.0 3.9 2.6 11,469.2 167.4 236.5 67.1
Q4 2016 -4.2 -2.9 -3.6 -2.5 9.1 1.3 -0.5 0.0 0.6 6.4 4.1 2.6 10,395.5 160.8 223.2 59.1
Q1 2017 -2.2 -0.9 -2.0 -0.7 9.7 1.4 -0.5 0.0 0.7 6.1 4.1 2.6 11,183.3 154.7 210.4 45.5
Q2 2017 0.4 1.9 -0.7 1.0 9.9 1.8 -0.5 0.0 0.8 5.8 4.1 2.6 12,131.9 148.9 201.3 37.4
Q3 2017 1.3 2.9 -0.3 1.4 10.0 1.9 -0.5 0.1 1.0 5.7 4.1 2.6 13,178.9 144.0 193.4 31.1
Q4 2017 3.0 4.4 1.4 3.1 9.9 1.9 -0.5 0.2 1.1 5.5 4.1 2.6 14,671.1 140.8 191.2 26.2
Q1 2018 3.0 4.0 2.3 3.6 9.8 1.6 -0.5 0.3 1.2 5.3 4.1 2.6 16,180.1 138.5 190.1 22.8
Q2 2018 3.9 5.0 2.6 4.0 9.6 1.7 -0.5 0.4 1.4 5.1 4.0 2.6 17,996.1 137.5 190.5 20.0
Q3 2018 3.9 4.9 2.9 4.3 9.4 1.7 -0.5 0.5 1.5 5.0 4.1 2.6 19,271.6 137.3 192.6 18.9
Q4 2018 3.9 4.9 3.1 4.4 9.1 1.6 -0.5 0.6 1.6 4.8 4.1 2.6 20,640.9 137.7 195.4 17.6
Q1 2019 3.9 4.8 3.0 4.2 8.9 1.5 -0.5 0.7 1.7 4.7 4.1 2.6 22,068.1 138.5 198.5 16.8
Note: Refer to Notes Regarding Scenario Variables for more information on variables.
18 Federal Reserve Supervisory Scenarios

Table 3B. Supervisory severely adverse scenario: International, Q1:2001Q1:2019
Percent unless otherwise indicated
Date Euro areareal GDPgrowth
Euro area inflation
Euro area bilateral dollar
exchange rate
(USD/euro)
Developing Asia
real GDP growth
Developing Asia
inflation
Developing Asia
bilateral dollar
exchange rate
(F/USD, index)
Japan real GDP growth
Japan inflation
Japan bilateral dollar
exchange rate
(yen/USD)
U.K. real GDP growth
U.K. inflation
U.K. bilateral dollar
exchange rate
(USD/pound)
Q1 2001 3.8 1.1 0.879 5.0 1.7 106.0 2.6 -1.2 125.5 4.6 0.1 1.419
Q2 2001 0.1 4.1 0.847 5.5 2.2 106.1 -0.7 -0.3 124.7 3.1 3.1 1.408
Q3 2001 0.3 1.4 0.910 4.7 1.1 106.4 -4.4 -1.1 119.2 2.6 1.0 1.469
Q4 2001 0.5 1.7 0.890 8.4 0.2 106.9 -0.5 -1.4 131.0 1.4 0.0 1.454
Q1 2002 0.9 3.0 0.872 7.6 0.4 107.3 -0.9 -2.7 132.7 1.6 1.9 1.425
Q2 2002 2.0 2.0 0.986 8.1 1.2 104.8 4.3 1.7 119.9 3.3 0.9 1.525
Q3 2002 1.6 1.6 0.988 7.3 1.3 105.5 2.6 -0.7 121.7 3.9 1.4 1.570
Q4 2002 0.3 2.4 1.049 6.4 0.9 104.5 1.5 -0.4 118.8 3.6 1.9 1.610
Q1 2003 -0.9 3.3 1.090 6.5 3.6 105.5 -2.2 -1.6 118.1 2.9 1.6 1.579
Q2 2003 0.4 0.3 1.150 2.3 1.2 104.0 5.2 1.7 119.9 3.7 0.3 1.653
Q3 2003 2.0 2.2 1.165 14.2 0.0 102.6 1.7 -0.7 111.4 3.1 1.7 1.662
Q4 2003 3.1 2.2 1.260 12.9 5.6 103.4 4.2 -0.6 107.1 3.0 1.7 1.784
Q1 2004 2.0 2.3 1.229 5.5 4.0 101.4 3.8 -0.9 104.2 2.7 1.3 1.840
Q2 2004 2.2 2.4 1.218 7.1 4.1 102.8 0.3 1.1 109.4 2.2 1.0 1.813
Q3 2004 1.3 2.0 1.242 8.2 3.9 102.7 0.6 0.1 110.2 0.9 1.1 1.809
Q4 2004 1.5 2.4 1.354 6.3 0.9 98.9 -1.0 1.7 102.7 1.9 2.4 1.916
Q1 2005 0.6 1.5 1.297 10.3 2.9 98.6 0.8 -2.7 107.2 2.8 2.6 1.889
Q2 2005 2.8 2.2 1.210 8.9 1.5 98.9 5.4 -1.2 110.9 4.4 1.9 1.793
Q3 2005 3.0 3.2 1.206 9.3 2.3 98.6 1.4 -1.3 113.3 4.1 2.7 1.770
Q4 2005 2.4 2.5 1.184 11.6 1.7 98.1 0.7 0.7 117.9 5.9 1.4 1.719
Q1 2006 3.7 1.7 1.214 10.9 2.4 96.8 1.7 1.3 117.5 1.5 1.9 1.739
Q2 2006 4.4 2.5 1.278 7.1 3.2 96.7 1.7 -0.1 114.5 1.2 3.0 1.849
Q3 2006 2.6 2.0 1.269 10.3 2.1 96.4 -0.3 0.5 118.0 0.5 3.3 1.872
Q4 2006 4.4 0.9 1.320 11.1 3.8 94.6 5.2 -0.4 119.0 2.3 2.6 1.959
Q1 2007 3.2 2.2 1.337 13.7 3.6 94.0 4.0 -0.2 117.6 3.9 2.6 1.969
Q2 2007 2.5 2.3 1.352 10.6 4.9 91.9 0.6 0.0 123.4 2.4 1.7 2.006
Q3 2007 2.0 2.1 1.422 8.6 7.4 90.6 -1.5 0.1 115.0 3.1 0.2 2.039
Q4 2007 2.0 4.9 1.460 12.9 6.1 89.4 3.4 2.2 111.7 3.1 4.0 1.984
Q1 2008 2.3 4.2 1.581 7.1 8.1 88.0 2.7 1.3 99.9 1.0 3.7 1.986
Q2 2008 -1.3 3.2 1.575 6.1 6.4 88.7 -4.6 1.6 106.2 -2.2 5.7 1.991
Q3 2008 -2.2 3.2 1.408 3.1 2.8 91.6 -4.1 3.6 105.9 -6.6 5.8 1.780
Q4 2008 -7.1 -1.4 1.392 0.1 -0.9 92.3 -12.5 -2.2 90.8 -8.7 0.5 1.462
Q1 2009 -11.3 -1.1 1.326 3.8 -1.4 94.2 -15.1 -3.6 99.2 -6.1 -0.1 1.430
Q2 2009 -0.8 0.0 1.402 15.4 2.3 92.3 7.1 -1.7 96.4 -0.8 2.2 1.645
Q3 2009 1.2 1.1 1.463 12.6 3.9 91.3 0.4 -1.2 89.5 0.6 3.5 1.600
Q4 2009 2.0 1.6 1.433 9.0 5.2 90.7 7.1 -1.6 93.1 1.4 3.0 1.617
Q1 2010 1.7 1.8 1.353 9.8 4.6 89.8 5.8 0.9 93.4 1.5 4.0 1.519
Q2 2010 3.9 2.0 1.229 9.8 3.4 91.1 4.6 -1.2 88.5 3.3 3.2 1.495
Q3 2010 1.9 1.6 1.360 8.8 3.9 88.4 6.1 -2.1 83.5 2.0 2.3 1.573
Q4 2010 2.1 2.6 1.327 9.3 7.7 87.4 -2.0 1.3 81.7 0.4 4.0 1.539
Q1 2011 3.5 3.6 1.418 9.5 6.3 86.5 -7.7 -0.4 82.8 3.0 6.7 1.605
Q2 2011 0.0 3.2 1.452 7.1 5.4 85.3 -2.2 -0.4 80.6 1.4 4.7 1.607
Q3 2011 -0.1 1.4 1.345 5.9 5.0 87.4 11.2 0.3 77.0 3.3 3.7 1.562
Q4 2011 -1.2 3.5 1.297 6.1 3.4 87.4 0.9 -0.7 77.0 0.6 3.4 1.554
Q1 2012 -0.7 2.7 1.333 7.1 3.2 86.4 3.6 1.9 82.4 0.9 2.1 1.599
Q2 2012 -1.3 2.3 1.267 5.9 4.0 88.1 -1.3 -0.7 79.8 -0.7 2.0 1.569
Q3 2012 -0.6 1.6 1.286 6.5 1.9 86.3 -1.9 -2.1 77.9 4.1 2.3 1.613
Q4 2012 -1.7 2.4 1.319 7.2 3.7 86.0 -0.4 0.0 86.6 -0.2 4.0 1.626
Q1 2013 -1.0 1.1 1.282 6.3 4.2 86.3 4.0 0.4 94.2 2.7 2.9 1.519
Q2 2013 1.6 0.5 1.301 7.0 3.1 87.3 3.1 0.6 99.2 2.4 1.7 1.521
Q3 2013 1.0 1.3 1.354 7.4 3.5 86.8 2.0 2.4 98.3 3.8 2.1 1.618
(continued on next page)
January 28, 2016 19

Table 3B.—continued
Date Euro areareal GDPgrowth
Euro area inflation
Euro area bilateral dollar
exchange rate
(USD/euro)
Developing Asia
real GDP growth
Developing Asia
inflation
Developing Asia
bilateral dollar
exchange rate
(F/USD, index)
Japan real GDP growth
Japan inflation
Japan bilateral dollar
exchange rate
(yen/USD)
U.K. real GDP growth
U.K. inflation
U.K. bilateral dollar
exchange rate
(USD/pound)
Q4 2013 0.8 0.3 1.378 6.5 4.0 85.9 -0.7 2.3 105.3 2.6 1.5 1.657
Q1 2014 0.9 0.6 1.378 5.9 1.5 86.9 5.0 0.7 103.0 2.6 1.8 1.668
Q2 2014 0.2 0.1 1.369 7.0 2.7 86.8 -7.2 9.3 101.3 3.2 1.5 1.711
Q3 2014 1.2 0.3 1.263 7.5 2.2 87.2 -2.8 1.3 109.7 2.6 0.9 1.622
Q4 2014 1.5 -0.4 1.210 5.6 1.0 88.2 1.8 -0.8 119.9 2.7 -0.6 1.558
Q1 2015 2.2 -1.2 1.074 5.8 1.0 88.1 4.4 -0.3 120.0 1.5 -1.2 1.485
Q2 2015 1.6 2.2 1.115 6.2 2.9 88.5 -0.5 1.7 122.1 2.2 0.8 1.573
Q3 2015 1.2 -0.1 1.116 7.0 2.6 91.1 1.0 0.0 119.8 1.8 1.0 1.512
Q4 2015 1.6 -0.1 1.086 6.2 2.3 92.2 1.0 -0.3 120.3 2.4 -0.3 1.475
Q1 2016 -4.4 -0.4 1.002 -1.4 0.1 100.9 -4.1 -2.8 117.0 -2.6 -0.8 1.439
Q2 2016 -5.4 -1.0 0.970 -0.8 -1.1 105.0 -7.5 -3.7 115.5 -4.4 -1.3 1.425
Q3 2016 -4.4 -1.3 0.952 1.5 -1.9 107.2 -9.0 -4.3 114.9 -4.1 -1.4 1.422
Q4 2016 -3.4 -1.2 0.935 2.9 -2.4 108.7 -9.6 -4.6 114.2 -3.4 -1.3 1.418
Q1 2017 -1.6 -0.9 0.946 5.0 -2.2 107.1 -8.1 -3.8 114.2 -1.9 -0.9 1.428
Q2 2017 -0.2 -0.5 0.957 6.1 -1.9 105.3 -6.0 -3.1 114.2 -0.4 -0.4 1.438
Q3 2017 0.9 -0.1 0.968 6.4 -1.4 103.5 -4.1 -2.5 114.3 0.8 0.0 1.446
Q4 2017 1.6 0.2 0.979 6.5 -1.0 101.9 -2.4 -2.1 114.3 1.7 0.3 1.453
Q1 2018 2.1 0.4 0.989 6.5 -0.5 100.5 -1.0 -1.7 113.8 2.3 0.6 1.456
Q2 2018 2.3 0.6 0.999 6.6 -0.1 99.2 0.1 -1.4 113.4 2.7 0.8 1.457
Q3 2018 2.4 0.7 1.009 6.7 0.3 98.1 0.9 -1.1 113.1 3.0 1.0 1.459
Q4 2018 2.4 0.9 1.018 6.8 0.8 97.3 1.4 -0.7 112.7 3.1 1.1 1.461
Q1 2019 2.3 1.0 1.028 7.0 1.2 96.5 1.7 -0.2 112.1 3.1 1.3 1.466
Note: Refer to Notes Regarding Scenario Variables for more information on variables.
Notes Regarding Scenario Variables
Sources for data through 2015:Q4 (as released
through 1/20/2016). The 2015:Q4 values of variables
marked with an asterisk (*) are projected.
*U.S. real GDP growth: Percent change in real gross
domestic product at an annualized rate, Bureau of
Economic Analysis.
*U.S. nominal GDP growth: Percent change in nomi-
nal gross domestic product at an annualized rate,
Bureau of Economic Analysis.
*U.S. real disposable income growth: Percent change
in nominal disposable personal income divided by the
price index for personal consumption expenditures at
an annualized rate, Bureau of Economic Analysis.
*U.S. nominal disposable income growth: Percent
change in nominal disposable personal income at an
annualized rate, Bureau of Economic Analysis.
U.S. unemployment rate: Quarterly average of
monthly data, Bureau of Labor Statistics.
U.S. CPI inflation: Percent change in the quarterly
average of the consumer price index at an annualized
rate, Bureau of Labor Statistics.
U.S. 3-month Treasury rate: Quarterly average of
3-month Treasury bill secondary market rate on a
discount basis, H.15 Release, Selected Interest Rates,
Federal Reserve Board.
U.S. 5-year Treasury yield: Quarterly average of the
yield on 5-year U.S. Treasury bonds, constructed for
the FRB/U.S. model by Federal Reserve staff based
on the Svensson smoothed term structure model; see
Lars E. O. Svensson (1995), “Estimating Forward
Interest Rates with the Extended Nelson-Siegel
Method,” Quarterly Review, no. 3, Sveriges Riks-
bank, pp. 13–26.
U.S. 10-year Treasury yield: Quarterly average of the
yield on 10-year U.S. Treasury bonds, constructed for
the FRB/U.S. model by Federal Reserve staff based
on the Svensson smoothed term structure model;
see id.
20 Federal Reserve Supervisory Scenarios

U.S. BBB corporate yield: Quarterly average of the
yield on 10-year BBB-rated corporate bonds, con-
structed for the FRB/U.S. model by Federal Reserve
staff using a Nelson-Siegel smoothed yield curve
model; see Charles R. Nelson and Andrew F. Siegel
(1987), “Parsimonious Modeling of Yield Curves,”
Journal of Business, vol. 60, pp. 473–89). Data prior
to 1997 is based on the WARGA database. Data after
1997 is based on the Merrill Lynch database.
U.S. mortgage rate: Quarterly average of weekly
series for the interest rate of a conventional, con-
forming, 30-year fixed-rate mortgage, obtained from
the Primary Mortgage Market Survey of the Federal
Home Loan Mortgage Corporation.
U.S. prime rate: Quarterly average of monthly series,
H.15 Release, Selected Interest Rates, Federal
Reserve Board.
U.S. Dow Jones Total Stock Market (Float Cap)
Index: End of quarter value, Dow Jones.
*U.S. House Price Index: CoreLogic, index level, sea-
sonally adjusted by Federal Reserve staff.
*U.S. Commercial Real Estate Price Index: From the
Financial Accounts of the United States, Federal
Reserve Board (Z.1 release); the series corresponds to
the data for price indexes: Commercial Real Estate
Price Index (series FL075035503.Q divided by 1000).
U.S. Market Volatility Index (VIX): Chicago Board
Options Exchange, converted to quarterly by using
the maximum close-of-day value in any quarter.
*Euro area real GDP growth: Percent change in real
gross domestic product at an annualized rate, staff
calculations based on Statistical Office of the Euro-
pean Communities via Haver, extended back using
ECB Area Wide Model dataset (ECB Working Paper
series no. 42).
Euro area inflation: Percent change in the quarterly
average of the harmonized index of consumer prices
at an annualized rate, staff calculations based on Sta-
tistical Office of the European Communities via
Haver.
*Developing Asia real GDP growth: Percent change in
real gross domestic product at an annualized rate,
staff calculations based on Bank of Korea via Haver;
Chinese National Bureau of Statistics via CEIC;
Indian Central Statistical Organization via CEIC;
Census and Statistics Department of Hong Kong via
CEIC; and Taiwan Directorate-General of Budget,
Accounting, and Statistics via CEIC.
*Developing Asia inflation: Percent change in the
quarterly average of the consumer price index, or
local equivalent, at an annualized rate, staff calcula-
tions based on Chinese National Bureau of Statistics
via CEIC; Indian Ministry of Statistics and Pro-
gramme Implementation via Haver; Labour Bureau
of India via CEIC; National Statistical Office of
Korea via CEIC; Census and Statistic Department of
Hong Kong via CEIC; and Taiwan Directorate-
General of Budget, Accounting, and Statistics via
CEIC.
*Japan real GDP growth: Percent change in gross
domestic product at an annualized rate, Cabinet
Office via Haver.
*Japan inflation: Percent change in the quarterly
average of the consumer price index at an annualized
rate, Ministry of Internal Affairs and Communica-
tions via Haver.
*U.K. real GDP growth: Percent change in gross
domestic product at an annualized rate, Office for
National Statistics via Haver.
U.K. inflation: Percent change in the quarterly aver-
age of the consumer price index at an annualized
rate, Office for National Statistics via Haver.
Exchange rates: Quarterly average of daily rates,
Bloomberg.
January 28, 2016 21

0116
www.federalreserve.gov
@FederalReserve Flickr.com/FederalReserve YouTube.com/FedReserveBoard