2016 STATE OF THE NOAA California CALIFORNIA … · Salmon faced drought, warm water, minimal...
39
NOAA California Current IEA Team 2016 STATE OF THE CALIFORNIA CURRENT ECOSYSTEM REPORT D ELIVERED TO THE PACIFIC F ISHERY M ANAGEMENT C OUNCIL , M ARCH 9, 2016, S ACRAMENTO , CA Agenda Item D.1.a Supplemental PPT March 2016
Transcript of 2016 STATE OF THE NOAA California CALIFORNIA … · Salmon faced drought, warm water, minimal...

NOAA California Current IEA Team
2016 STATE OF THE CALIFORNIA CURRENT ECOSYSTEM REPORT
DELIVERED TO THE PACIFIC FISHERY MANAGEMENTCOUNCIL, MARCH 9, 2016, SACRAMENTO, CA
Agenda Item D.1.aSupplemental PPT
March 2016

Climate drivers continue to be a major story
Record-high sea surface temperature anomalies in the NE Pacific and off Baja California in 2014–2015
One of the largest El Niño events of the past 100 years in 2015-2016; its impacts are now reaching the West Coast
Oceanographic indices (MEI, PDO, NPGO) indicated warmer conditions throughout
Ecology of the system is responding
Northern copepod index decreased off of Newport, indicating lower energy content for higher trophic levels
High-energy forage species were at low levels
Other forage species were patchy; juvenile rockfish and market squid were high south of Cape Mendocino
SUMMARY

Salmon faced drought, warm water, minimal snowpack and poor feeding conditions in 2015; snowpack in 2016 is improved but still below normal
Unusual mortality events for California sea lions and Guadalupe fur seals
Anomalously large, coast-wide common murre wreck
Other indicators we are tracking
Salmon escapements through 2014 were generally stable or rising
Groundfish stocks and mortality generally in favorable status
Commercial fishing landings through 2014 remained high, driven mainly by landings of Pacific hake and coastal pelagic species
Socioeconomic vulnerability increased in fishery-dependent coastal communities from 2000 to 2010
SUMMARY, CONTINUED

Interpreting time series plots
Horizontal lines: Long-term mean,
± 1 s.d.
Shaded region: Fitted model mean ± 95% confidence
intervals
Recent mean relative to long-term
mean
Slope of recent years
Green region:Most recent
5 years of dataRaw data

Unprecedented physical conditions: The “Warm Blob” and El Niño
Sea surface temperature anomalies, June 14, 2015 (NOAA NCDC)
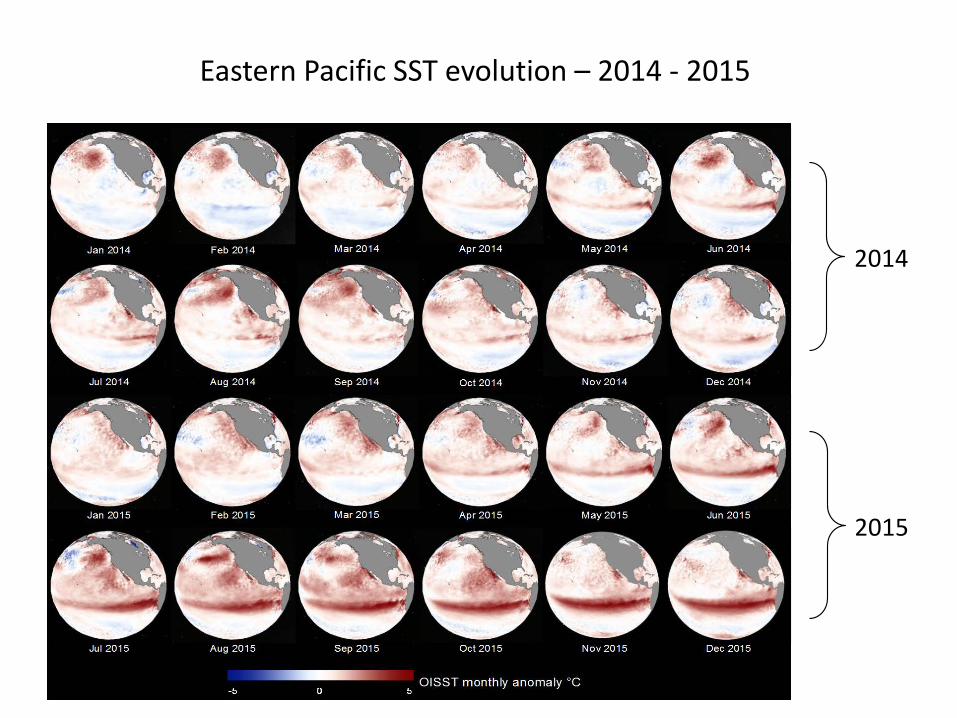
Eastern Pacific SST evolution – 2014 - 2015
2014
2015

The sea surface temperature average in the California Current isn’t directly coupled to El Niño. North Pacific Atmospheric conditions dominate.
El Niños are important, but certainly not the whole story.
Figure from Fiedler & Mantua 2016

BASIN SCALE INDICATORS
Pacific Decadal Oscillation (PDO) and Multivariate ENSO Index (MEI)


Blob “areas” vs Time
Threshold = 1 SDTDEV
Threshold = 2 SDTDEV
Threshold = 3 SDTDEV
Blob
Are
a (k
m2 )
Blue Line = Area of Alaska
Calculated blob size depends on the threshold
Colored lines show the three largest blobs from any timepoint
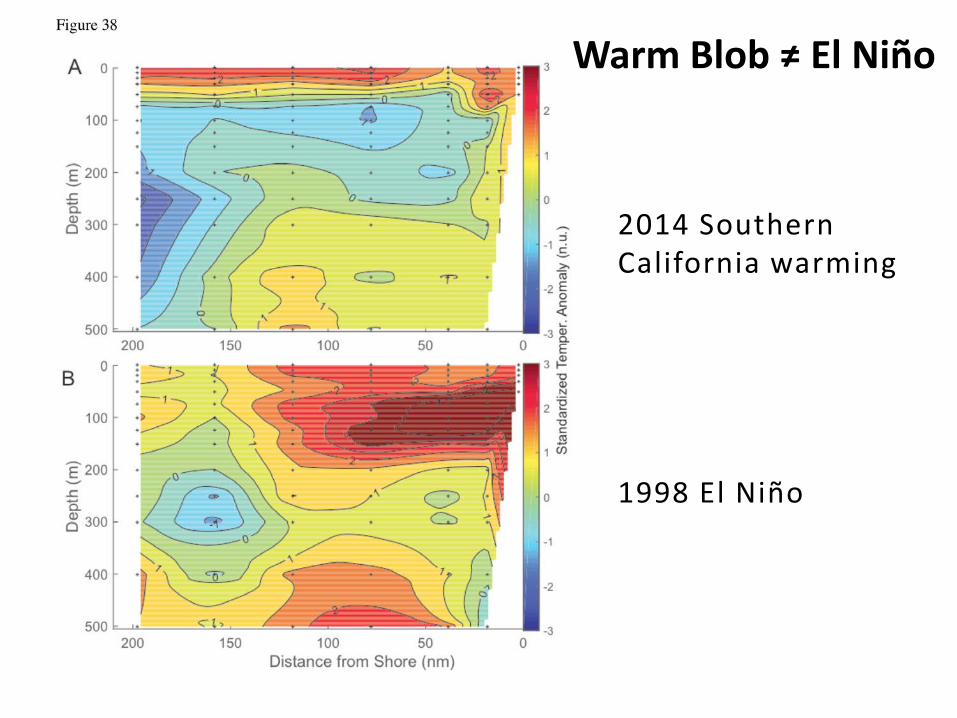
2014 Southern California warming
1998 El Niño
Warm Blob ≠ El Niño


5 sites, 1982 – 2015
39 sites, 1969 – 2015
113 sites, 1968 – 2015
33 sites, 1940 – 2015
255 sites, 1913 – 2015
April 1st Snow Water Equivalent at record lows in every basin in 2015

Wind driven coastal upwelling(From http://www/nwfsc.noaa.gov)
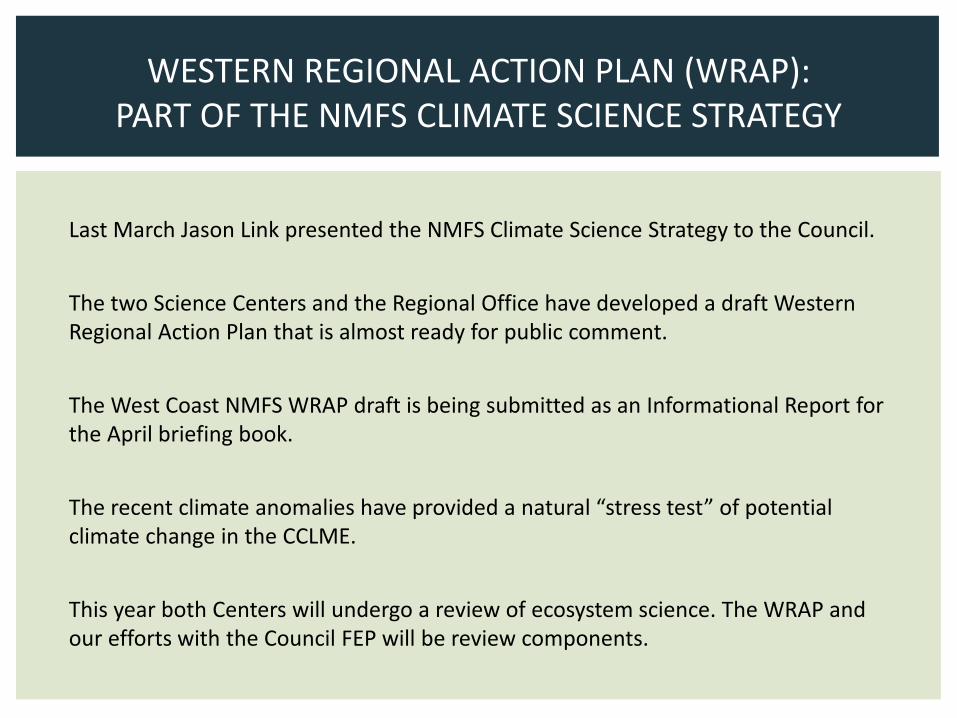
WESTERN REGIONAL ACTION PLAN (WRAP): PART OF THE NMFS CLIMATE SCIENCE STRATEGY
Last March Jason Link presented the NMFS Climate Science Strategy to the Council.
The two Science Centers and the Regional Office have developed a draft Western Regional Action Plan that is almost ready for public comment.
The West Coast NMFS WRAP draft is being submitted as an Informational Report for the April briefing book.
The recent climate anomalies have provided a natural “stress test” of potential climate change in the CCLME.
This year both Centers will undergo a review of ecosystem science. The WRAP and our efforts with the Council FEP will be review components.

Unprecedented physical conditions: Ecological responses
Joe Orsi and friend,off SE Alaska, June 2015
(NOAA AFSC)

Northern copepod biomass anomaly
≈
≈
• “Northern” copepods are cool-water species and rich in lipids that support fish production
• Off Newport, OR: Northern copepods abundant, 2011-2014
• Major shift in late 2014, continued in 2015; less-fatty “Southern” copepods now dominant

≈
• Value of indicator is its relationship to fish production off Newport area, particularly salmon
• Examples: correlation between Northern copepod anomaly and salmon returns to Bonneville Dam (data from Bill Peterson, NOAA)
Northern copepod biomass anomaly

These physical and ecological conditions are indicative of poor salmon returns in 2016
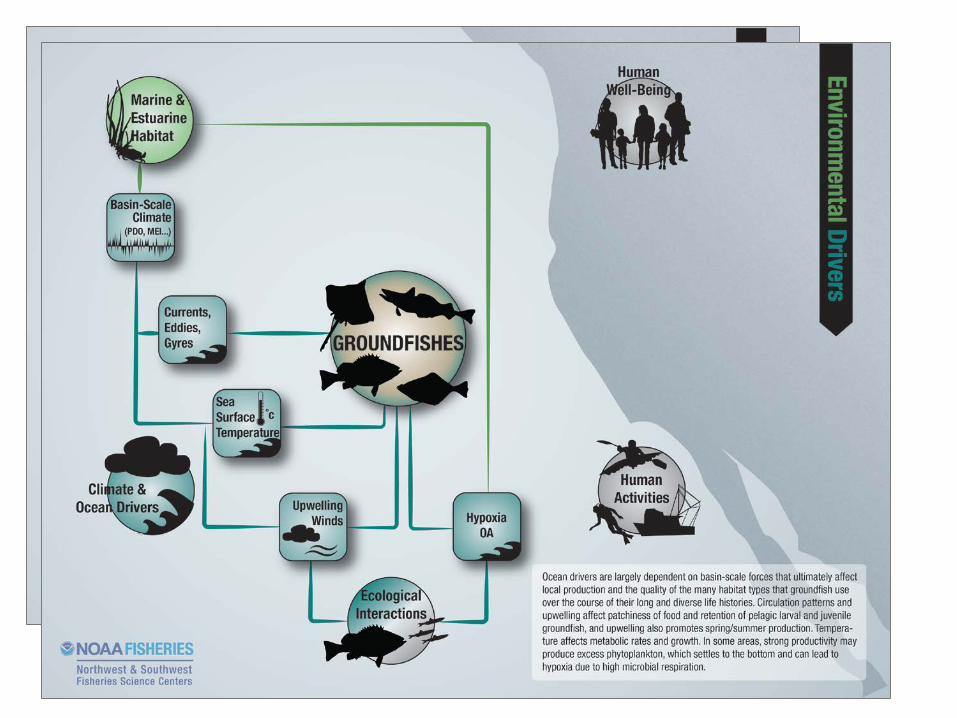
Mapping climate anomaly indicators in the salmon conceptual model

Top predators suffered due to poor foraging conditions
Cohort
• California sea lions again experienced unusual mortality event (UME)
• 2014 pup cohort had very poor growth from fall 2014 to early 2015
• Reflects poor foraging conditions for mothers
• UME also occurred for Guadalupe fur seals, which feed further offshore
• Also apparent die-off of abundant piscivorousseabird, common murres
Photo: Sharon Melin, NOAA

Other anomalies in 2015 (Warm Blob)
• Massive coastwide harmful algal bloom (HAB), leading to domoicacid toxicity
• Mass pre-spawn mortalities of sockeye salmon in Columbia River, due to high river temperatures
• Record numbers of baleen whales entangled in nearshore crab gear
• Large numbers of juvenile loggerhead turtles in Southern California Bight
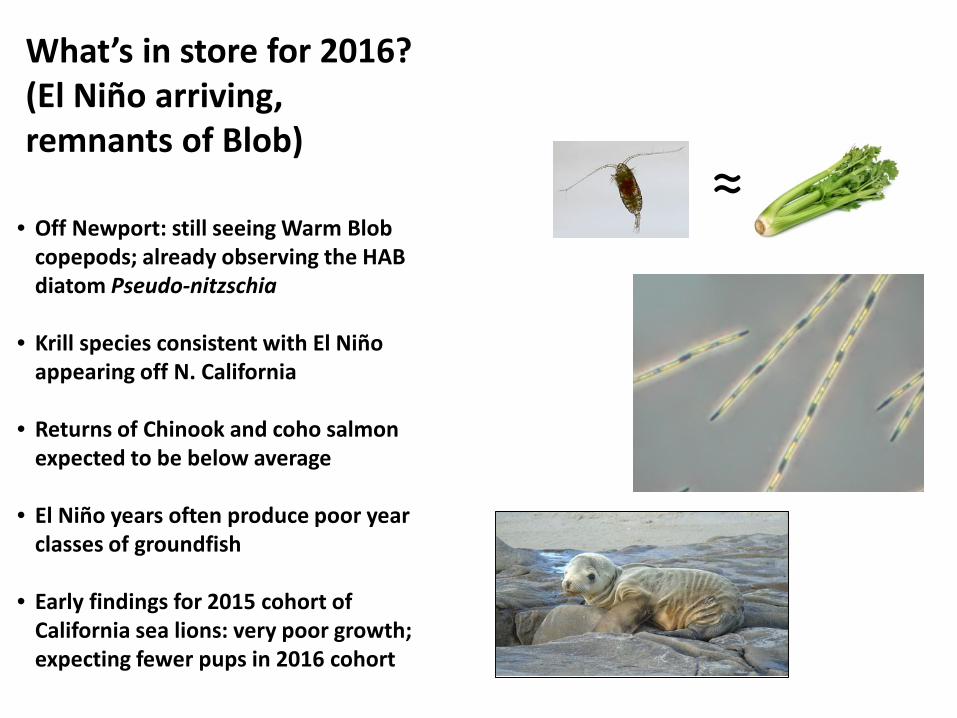
What’s in store for 2016? (El Niño arriving, remnants of Blob)
• Off Newport: still seeing Warm Blob copepods; already observing the HAB diatom Pseudo-nitzschia
• Krill species consistent with El Niño appearing off N. California
• Returns of Chinook and coho salmon expected to be below average
• El Niño years often produce poor year classes of groundfish
• Early findings for 2015 cohort of California sea lions: very poor growth; expecting fewer pups in 2016 cohort
≈

Other indicators of ecological integrity
Yellowtail and canary rockfishes over sponges (NOAA)
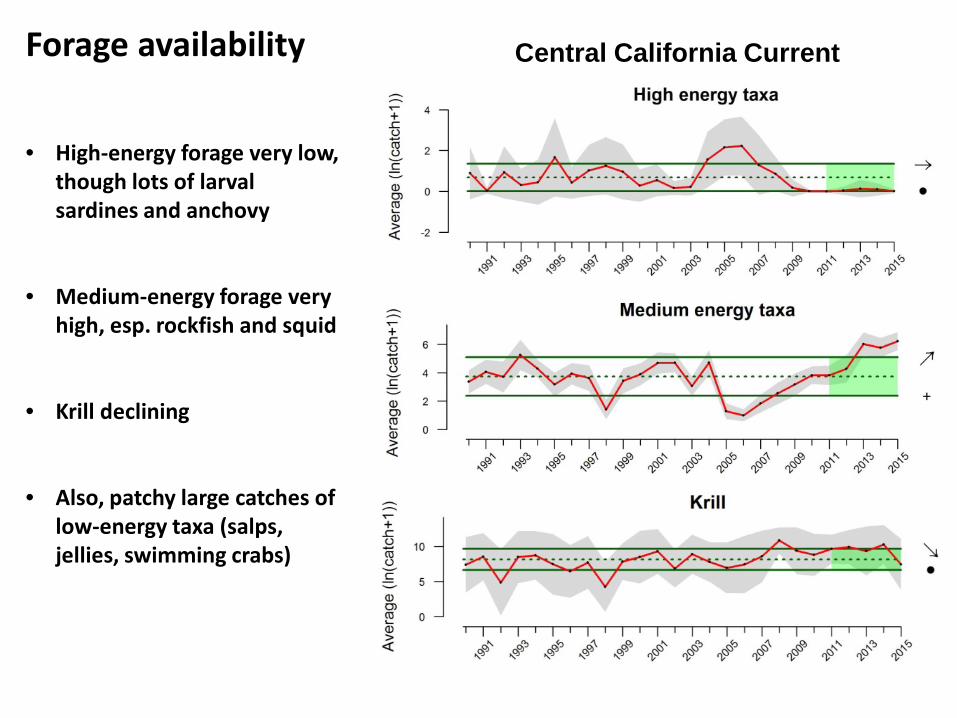
Central California CurrentForage availability
• High-energy forage very low, though lots of larval sardines and anchovy
• Medium-energy forage very high, esp. rockfish and squid
• Krill declining
• Also, patchy large catches of low-energy taxa (salps, jellies, swimming crabs)

25Sea surface temp anomaly June 14, 2015
• Phytoplankton was patchy and lower than previous years
• Sardine and Anchovy went north; larvae very abundant in some areas
• Market squid shifted north
• Krill decreased
• Rockfish juveniles catches very high along central coast
• Relatively poor forage availability in southern area
Sardine and Anchovy larvae
krill
krill
Spatial changes in forage availability

• Most stocks near long-term averages
• Central Valley winter Chinook trending downward since 2005
• Coastal and Columbia River stocks generally trending up since 2005
• These data precede the anomalous warming
Chinook salmon escapementtrends through 2014

Groundfish
SplitnosePOP
Yelloweye
Cowcod
LSTSSTYellowtail_N
Aurora
Rougheye
Sharpchin
Black_CA
Black_OR
Black_WA
Bocaccio
CanaryDarkblotched
WidowChina_S
China_CChina_N
0
0.2
0.4
0.6
0.8
1
1.2
1.4
0 0.5 1 1.5 2 2.5 3 3.5
20072009201120132015
Rockfish/thornyheads
Chilipepper
Bterminal / BMSY proxy
F term
inal
/ F M
SY p
roxy
Longnose skate
Cabezon_OR
Cabezon_NCA
Cabezon_SCA
Lingcod_N
HakeSablefish
Kelp_greenling
0
0.2
0.4
0.6
0.8
1
1.2
1.4
0 0.5 1 1.5 2 2.5 3 3.5
Other groundfish
Petrale
Rex DoverATF
English
• Most stocks at or above biomass target (to the right of the vertical dashed line)
• Only 2 overfished stocks: yelloweye and POP
• Most stocks below proxy for heavy fishing mortality (below the horizontal dashed line)
• Only two stocks above fishing mortality target, both black rockfish
• Note: 2015 may prove to be a good year class

Human activities
Commercial fishing vessels in Westport, WA (Craig D’Angelo, NOAA)
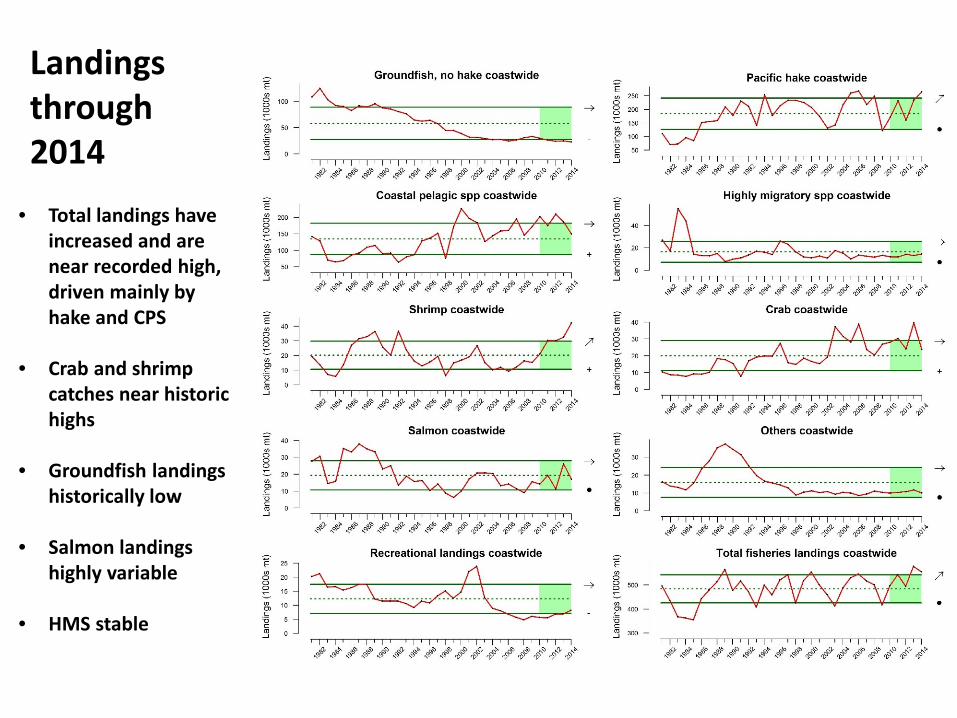
Landings through 2014
• Total landings have increased and are near recorded high, driven mainly by hake and CPS
• Crab and shrimp catches near historic highs
• Groundfish landings historically low
• Salmon landings highly variable
• HMS stable
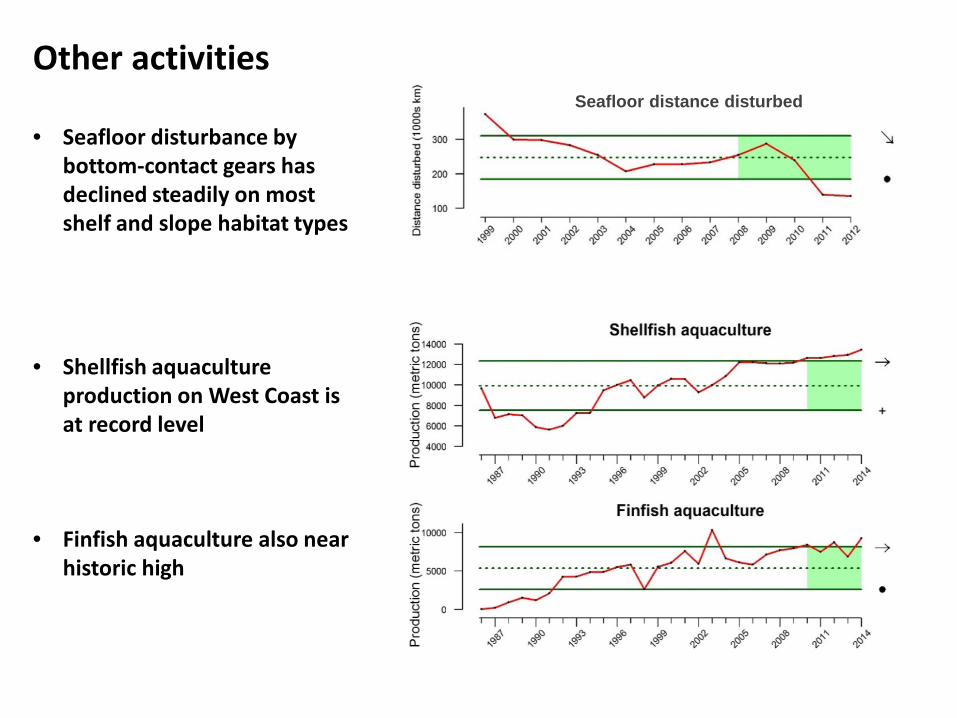
Other activitiesSeafloor distance disturbed
• Seafloor disturbance by bottom-contact gears has declined steadily on most shelf and slope habitat types
• Shellfish aquaculture production on West Coast is at record level
• Finfish aquaculture also near historic high

Human wellbeing
Harbor area of Westport, Washington (photo: Joe Mabel)

Social vulnerability in fishery-dependent coastal communities
-10-505
1015202530
Bellingham, WANeah Bay, WA
Westport, WA
Tokeland, WA
Ilwaco, WA
Astoria, OR
Garibaldi, OR
Newport, OR
Winchester Bay, OR
Coos Bay, OR
Crescent City, CA
Trinidad, CAFort Bragg, CAEureka, CA
McKinleyville, CA
Bodega Bay, CA
San Francisco, CA
El Granada, CA
Half Moon Bay, CA
Moss Landing, CA
Santa Barbara, CA
Ventura, CA
Port Hueneme, CA
Los Angeles, CASan Diego, CA
Commercial Fishing Dependence Score
CSVI (social vulnerability) Score
• We compiled composite indexes of fishing dependence and social vulnerability for 880 coastal communities
• Top five fishing dependent communities from WA, OR, N CA, C CA and S CA are shown here
• Gives relative idea of how changes in fishing might affect overall community wellbeing

Social vulnerability in fishery-dependent coastal communities
• We now have enough data to compile “time series” of changes in coastal community vulnerability
• In eight communities with consistently high fishery dependence, vulnerability is generally increasing

Fishery diversification
1.4
1.6
1.8
2.0
2.2
2.4
Aver
age E
ffect
ive Sh
anno
n Ind
ex
Vessel with West Coast and Alaska Revenue >$5K
>$5K 2014 Fleet 1981-2014
1.4
1.6
1.8
2.0
2.2
2.4
Vessels with 2014 West Coast Revenue >$5K
2014 WA>$5K 2014 OR>$5K 2014 CA>$5K
1.2
1.4
1.6
1.8
2.0
2.2
2.4
2.6
2.8
3.0
3.2
3.4Vessels with 2014 West Coast Revenue >$5K
WC <=40 Feet WC 41-80 Feet WC 81-125 Feet
1.2
1.4
1.6
1.8
2.0
2.2
2.4
2.6
2.8
3.0
3.2
3.4
Aver
age E
ffect
ive Sh
anno
n Ind
ex
Vessels with 2014 West Coast Revenue >$5K
WC $5K-$25K WC $25K-$100K WC >$100K
• Measures how evenly revenues are distributed across fisheries in which vessels participate
• Through 2014, diversification continues to decline across nearly all regions, vessel sizes, and revenue classes
• Newer participants tend to be less diverse than long-standing participants, but all are declining

Synthesis
The NOAA Research Vessel Reuben Lasker (SWFSC/NOAA)

Mechanisms driving recruitment variability of sablefish across contrasting climate conditions(Tolimieri, Haltuch, Lee, Jacox, Bograd)
To develop a mechanistic framework for testing hypotheses regarding oceanographic drivers of sablefish recruitment, in order to improve assessments and forecasts
Potential drivers – specific to stage, time, location• Transport• Temperature• Predators• Prey
Life-history model – detailed conceptual model to identify potential drivers from pre-spawning female conditioning to age-1 recruits
Framework should apply to other groundfish of PFMC interest

Potential drivers – specific to stage, time, location• Transport• Temperature• Predators• Prey(represented at right by yellow arrows, )
• The sablefish project is supported by indicators work
• It will also improve our indicator sets and assessments (spatial & temporal scales, gaps)
• Similar approaches can be taken for other Council-relevant concerns, such as:
• Effects of climate anomalies• Short-term forecasts of target spp
distributions• Fishery interactions with protected species• HABs

Questions and Discussion
School of jack mackerel near Catalina (Adam Obaza, NOAA)