2016 - Spending Affordability Committee Report and ...
109
• • •• Spending Affordability Committee 2016 Interim Report Annapolis, Maryland December 2016
Transcript of 2016 - Spending Affordability Committee Report and ...

• •
• •
Spending AffordabilityCommittee
2016 Interim Report
Annapolis, MarylandDecember 2016

Contributing Staff
Writers Hiram L. Burch, Jr.
Patrick S. Frank Scott P. Gates
David B. Juppe Matthew D. Klein
Steven D. McCulloch Simon G. Powell
Michael C. Rubenstein Rebecca J. Ruff
Theresa M. Tuszynski
Reviewers Warren G. Deschenaux
David C. Romans
Support Staff Kimberly J. Landry
For further information concerning this document contact:
Library and Information Services Office of Policy Analysis
Department of Legislative Services 90 State Circle
Annapolis, Maryland 21401
Baltimore Area: 410-946-5400 ● Washington Area: 301-970-5400 Other Areas: 1-800-492-7122, Extension 5400
TTY: 410-946-5401 ● 301-970-5401 TTY users may also use the Maryland Relay Service
to contact the General Assembly.
Email: [email protected] Home Page: http://mgaleg.maryland.gov
The Department of Legislative Services does not discriminate on the basis of age, ancestry, color, creed, marital status, national origin, race, religion, gender, gender identity, sexual orientation, or disability in the admission or access to its programs, services, or activities. The Department’s Information Officer has been designated to coordinate compliance with the nondiscrimination requirements contained in Section 35.107 of the Department of Justice Regulations. Requests for assistance should be directed to the Information Officer at the telephone numbers shown above.
ii

iii

iv

v

vi

Maryland General Assembly Spending Affordability Committee
2016 Interim Membership Roster
Delegate Ben Barnes, Presiding Chair Senator Roger Manno, Senate Chair
Senators
James E. DeGrange, Sr. George C. Edwards
J. B. Jennings Edward J. Kasemeyer
Richard S. Madaleno, Jr. Nathaniel J. McFadden Thomas M. Middleton
Thomas V. Mike Miller, Jr. Douglas J. J. Peters Catherine E. Pugh
Delegates Wendell R. Beitzel Michael E. Busch
Tawanna P. Gaines Sheila E. Hixson
Adrienne A. Jones Anne R. Kaiser
Nicholaus R. Kipke Maggie McIntosh
Samuel I. Rosenberg
Citizens Advisory Committee John L. Bohanan Dana M. Jones
Committee Staff
Rebecca J. Ruff Kaitlyn S. Shulman
Support Staff
Kimberly J. Landry
vii

viii

Contents
Governor’s Letter of Transmittal ................................................................................................... iii
Legislative Policy Committee’s Letter of Transmittal .....................................................................v
Membership Roster ....................................................................................................................... vii
2016 Spending Affordability Committee Report and Recommendations to the Governor and the Legislative Policy Committee...................................................................................................1
Part 1 Economic Outlook .................................................................................................11
Part 2 General Fund Revenues .........................................................................................17
Part 3 Revenue Volatility .................................................................................................25
Part 4 General Fund Budget and Forecast ........................................................................33
Part 5 Local Government Assistance ...............................................................................47
Part 6 Capital Program .....................................................................................................53
Part 7 Transportation ........................................................................................................69
Part 8 State Employment and Employee Benefits............................................................75
Part 9 Supporting Material ...............................................................................................83
ix

x

2016 Spending Affordability Committee Report and Recommendations to the Governor and the
Legislative Policy Committee The Spending Affordability Committee was created in 1982 (Chapter 585). The committee is composed of equal numbers of senators and delegates and includes the Presiding Officers, the majority and minority leaders, the chairmen of the fiscal committees (or their designees), and other members appointed by the Presiding Officers. A citizen advisory committee assists the committee.
The committee’s primary responsibility is to recommend to the Governor and the General Assembly a level of spending for the State operating budget that is reflective of the current and prospective condition of the State’s economy. The full list of the committee’s prior recommendations and legislative action on the operating budget are reflected in the table in Appendix 1. Since its inception 34 years ago, the recommendation of the committee has been adhered to by the legislature in all but one year. More recently, efforts to close the structural budget gap had been the focus of the committee’s recommendations. After working diligently for several years to resolve the structural deficit and restore the State economy following the Great Recession, estimates at the close of the 2016 session projected full resolution of the State’s structural imbalance. However, slower than anticipated economic growth and increases in operating spending have contributed to the return of the structural imbalance.
The committee notes that operating spending in relation to the State’s economy, as measured by the personal income statistic, has fluctuated between 6.7% and 7.6%. The unprecedented increases under the Bridge to Excellence in Public Schools Act raised spending as a percentage of income during the period of 2004 to 2008. By 2009, the ratio reached 7.5%, the highest level since 1991, in part, due to falling income. Conversely, rising income and reduced State spending caused the ratio to drop to 7.2% in 2010; the rate has fluctuated between 7.3% and 7.5% since.
The committee’s statutory responsibility is to consider spending in relation to the State’s economy. In its review of the State’s economy, the committee considered income and wealth factors in developing a broad understanding of Maryland’s economic position. In determining the spending recommendation, the committee has considered economic performance, revenue estimates, and budget requirements.
1

Economy
Since the recession ended, Maryland has generally underperformed relative to the nation as a whole, with employment growth below the United States in each year from 2011 to 2015. Maryland’s recovery from the recession was derailed as the federal budget reductions of recent years, along with the government shutdown in fall 2013, had a significant impact on the economy. Inflation-adjusted wage income per worker fell in Maryland for three years in a row (2011 to 2013) and grew 0.8% in 2014. The economy improved in 2015 with employment growth of 1.5%, the strongest since 2005. The real wage per worker was up 3.0% in 2015 due, in part, to extraordinarily low inflation. The data available for 2016 shows employment growth of 1.8%, but alternate measures of the labor market suggest the increase is similar to the 1.5% gain in 2015. Wage income grew 3.5% in the first half of 2016 and the real wage per worker was up just 0.5%. In September, the Board of Revenue Estimates (BRE) issued a revised economic forecast for Maryland, its first since December 2015. BRE revised the economic outlook largely in line with recent performance. Employment growth for 2016 was revised up from 1.3% to 1.9%, but BRE did not alter the forecast of employment in future years. The projection for personal income growth was lowered a full percentage point in 2016, from 4.7% to 3.7%, and reduced in 2017 from 5.1% to 4.4%. In December 2016, BRE reduced the expected increase in 2016 employment to 1.6% in light of alternate measures of the labor market. Personal income growth was further reduced to 3.3% in 2016 and 4.0% in 2017. Revenues
Fiscal 2016 general fund revenues were below the estimate by $250 million, or 1.5%. General fund revenues totaled $16.2 billion in fiscal 2016, an increase of 1.7% over fiscal 2015. The underattainment was due almost entirely to the personal income tax. General fund personal income tax revenues were below the estimate by $262 million and grew 2.1% over fiscal 2015. Fiscal 2017 general fund revenues through October are up 1.2% over fiscal 2016. In September, BRE lowered their estimate for fiscal 2017 general fund revenues by $365.0 million or 2.1%. The personal income tax estimate was revised down by $307.0 million. In December, BRE reduced the general fund estimate for fiscal 2017 by $13.8 million in light of the revised economic assumptions and the year-to-date performance which includes a large increase in corporate income tax refunds. BRE’s fiscal 2017 estimate also now includes a transfer of $47.4 million from the local income tax reserve account to the General Fund reflecting over funding of the account as of the end of fiscal 2016. BRE lowered their general fund revenue estimate for fiscal 2018 by $24.5 million. Budget Requirements Taking into consideration the revenue projections by BRE in December 2016, the committee is currently projecting an ending general fund deficit of $209.4 million at the close of fiscal 2017. This projected deficit reflects revenue write-downs, November 2, 2016 Board of
2

Public Works (BPW) reductions, anticipated reversions based on the Administration’s decisions concerning funds withheld by the legislature in the fiscal 2017 budget, and anticipated spending shortfalls requiring fiscal 2017 general fund deficiency appropriations of $234.2 million. Major areas that are expected to require deficiency funding include: Medicaid, based on the impact of both a mid-year calendar 2016 as well as calendar 2017 Managed Care Organization (MCO) rate increase plus higher than anticipated spending on substance use disorder treatment; the Developmental Disabilities Administration based on a recent federal audit disallowance of previously claimed federal funds; projected underattainment of federal funds in the Department of Human Resources; and the impact of a revision of the federal reimbursement methodology in the Maryland State Department of Education’s child care subsidy program. After considering the impact of BPW reductions on fiscal 2017 and 2018, the baseline estimate for fiscal 2018 projects general fund growth of 2.9% when capital and reserve fund appropriations are included, resulting in an ending general fund deficit of $544.1 million. General fund budget growth includes $419.6 million for entitlements, mandated formulas, and other ongoing requirements. By far, the largest increase is in the Medicaid program which is estimated to see general fund growth of $427.4 million. This growth is driven by MCO rate increases, the assumption by the State of a larger share of the costs for the Affordable Care Act expansion population, rate increases for other providers, and modestly higher enrollment levels. Growth in Medicaid and other ongoing requirements are moderated by lower general fund expenditures on teacher and librarian retirement payments and debt service for example. In terms of State agency spending, the baseline assumes $373.3 million in general fund growth. In fiscal 2018, personnel costs, excluding higher education, account for $90.4 million of this growth. The baseline assumes a 1% general salary increase for fiscal 2018 effective July 1, 2017, with a general fund cost of $21.3 million plus regular increment increases totaling $51.2 million. Health insurance and employee retirement costs grow relatively little from fiscal 2017, $14.1 million and $3.8 million, respectively. Other significant State agency costs include: general fund support for the University System of Maryland to cover growth in base costs not supported by tuition and Higher Education Investment Fund revenue ($71.1 million); rate increases and placement costs in the Developmental Disabilities Administration ($39.9 million); the impact of 2016 legislation ($44.9 million); costs supported by fiscal 2017 deficiencies that carry over into fiscal 2018 ($38.7 million); and accounting for the one-time impact of many of the November BPW reductions ($25.4 million). The committee projects that the State will close fiscal 2018 with a balance of $1,059.3 million in the Rainy Day Fund, which represents 6.2% of general fund revenues. The statutorily mandated appropriation for fiscal 2018 will be $50 million. It should be noted that the baseline also assumes that the level of the unappropriated general fund balance at the close of fiscal 2016 will result in a $50 million fiscal 2018 appropriation to the Dedicated Purpose Account to be subsequently transferred to the pension fund as provided for in the Budget Reconciliation and Financing Act of 2015.
3

Recommendations In light of the considerations discussed earlier, the committee proposes the following recommendations for the 2017 session: 1. Operating Budget Spending Limit and Sustainability The spending affordability process was put in place in 1982 with the goal of calibrating the growth in State spending to growth in the State’s economy. In implementing that objective, a unique method of classifying and accounting for State spending was developed and has been periodically revised as circumstance has required. In five of the last seven years, the recommendation of the committee focused on closing the sizeable structural deficit that had been generated by extraordinary fiscal issues – plummeting revenues, substantial short-term federal assistance, and extensive reliance on one-time budget balancing actions. During those years, the traditional establishment of a growth limit was replaced with recommendations to reduce the structural deficit by a specified amount.
The significant efforts undertaken since fiscal 2011 to close the structural imbalance combined with favorable revenue projections resulted in the elimination of the spending gap one year ahead of the schedule set in fiscal 2015 and created a projected structural surplus for the near future. As such, the committee’s recommendation for operating budget spending during the 2016 session returned to the more traditional method for maintaining spending affordability for the upcoming session, limiting growth in the budget in line with average anticipated growth in personal income for calendar 2016 and 2017 (4.85%).
Despite a favorable fiscal outlook at the close of the 2016 session, slower than anticipated
economic growth has resulted in the downward revision of general fund revenues and a sizeable structural imbalance for fiscal 2018 and subsequent years. Current projections indicate a structural deficit totaling $377 million in fiscal 2018, growing to nearly $1.5 billion by fiscal 2022. Ongoing operating spending growth is projected to outpace revenue growth by 1.4 percentage points annually.
As such, the committee recommends that the budget as submitted by the Governor
and as approved by the General Assembly shall reduce the structural deficit for fiscal 2018 by at least 50% leaving a structural gap of no more than $189 million.
The committee further recommends that the Administration prepare a detailed
report with specific proposals for achieving structural balance in fiscal 2019. The report should specify actions to the program level. The report should be submitted to the Spending Affordability Committee, the House Appropriations Committee, and the Senate Budget and Taxation Committee no later than July 1, 2017.
4

2. Fund Balances
A. Rainy Day Fund In addition to its general fund recommendations, the committee recommends a prudent use of the Revenue Stabilization Account (“Rainy Day” Fund) to address general fund needs. The committee projects a Rainy Day Fund balance totaling $998.6 million at the end of fiscal 2017, which is 6.0% of ongoing general fund revenues. Statutes require that the Governor include an appropriation of at least $50.0 million if the Rainy Day Fund balance is less than 7.5% of general fund revenues. This appropriation, as well as interest earnings, is expected to increase the fiscal 2018 balance to $1,059.3 million. The committee recommends that the balance in the Rainy Day Fund be maintained at 5.0% of estimated revenue and authorizes the use of any funds above that balance to address imminent cash shortfalls in fiscal 2017 and 2018.
B. General Fund Balance
The committee recognizes that general fund revenues are volatile, which can result in actual revenues underperforming compared to estimated revenues. Underperforming revenues could result in end-of-year budget deficits. This necessitates continued attentiveness to maintaining alignment between spending and ongoing revenues. Therefore, the committee recommends a minimum ending balance of at least $100 million in the General Fund for fiscal 2018. 3. Revenue Volatility
Since Maryland’s economy is affected by the ups and downs of the business cycle, revenue volatility is unavoidable. The committee is concerned that ongoing spending may be supported by unstable revenues that will not be realized during recessions. Minimizing reliance on unstable revenue sources can help soften the impact of recessions and avoid building unsustainable ongoing spending into the budget during economic booms.
In recent years, states such as California, Colorado, Florida, Massachusetts, Michigan, Missouri, and Virginia have adopted or considered changes to their forecasting and budgetary practices to reduce their vulnerability to revenue volatility. Generally, these approaches focus on the most volatile aspects of the personal income tax, such as capital gains. Virginia has taken an approach that focuses on nonwithholding income tax revenue, rather than capital gains specifically. Virginia puts a cap, referred to as a collar, on nonwithholding income tax revenue to limit the nonwithholding estimate as a share of estimated total general fund revenues. A recent review of Maryland’s revenue structure, conducted jointly by the Department of Legislative Services (DLS), the Department of Budget and Management (DBM), and BRE of the State Comptroller’s Office, determined that nonwithholding personal income tax revenues are extremely volatile and difficult to accurately forecast. After a thorough evaluation of the strategies adopted by other states to address revenue volatility, DBM, DLS, and BRE recommended that the State consider limiting estimated revenues from nonwithholding income tax revenues. This can
5

be accomplished by placing a cap, or collar, on the amount of nonwithholding income tax revenues assumed during the budget process. The cap would limit nonwithholding revenues to their share of total general fund revenues over the 10 most recently completed fiscal years. If revenues exceed this cap, amounts in excess of the cap will not be appropriated in the upcoming budget. Advantages of this approach include encouraging savings at the height of the business cycle, promoting structural balance by constraining the amount of unstable revenues supporting ongoing spending, and softening the impact of a recession by limiting the State’s reliance on a volatile revenue source. The collar approach will periodically generate surpluses of nonwithholding personal income tax revenues. Such a surplus could be applied against any shortfall should other general fund revenues underperform. Additionally, since the revenues are one-time, the surpluses could support one-time appropriations to increase the balance in the Rainy Day Fund, fund pay-as-you-go capital projects, and reduce unfunded liabilities.
The Spending Affordability Committee recommends that the appropriate committees consider legislation to mitigate the impact of revenue volatility on the State budget. 4. Capital Budget A. General Obligation Debt
In its 2016 report, the Capital Debt Affordability Committee (CDAC) recommended limiting general obligation (GO) bond authorizations to $995 million each year through fiscal 2026. This is consistent with the recommendation made by CDAC in its 2015 report with the purpose of slowing the growth in debt service costs and preserving additional debt capacity for the future.
CDAC’s recommendation is advisory and the committee is not bound by the recommendation. In recent years for instance, debt limits recommended by the committee have differed from limits recommended by CDAC. In 2013, CDAC recommended increasing the out-year authorizations by $75 million annually, but the committee recommended that out-year authorizations not be increased. In 2014, the committee recommended that the authorizations in the upcoming session’s capital budget bill be $75 million less than the level recommended by CDAC in September 2014. In 2015, the committee recommended increasing the 2016 session authorization by $60 million more than CDAC’s recommendation but the capital bill passed by the General Assembly kept the authorization level at the lower CDAC recommendation.
The committee supports CDAC’s debt affordability criteria, which limits debt service to 8% of State revenues and debt outstanding to 4% of State personal income. The committee also supports the objective to slow the growth in debt service costs and reduce the debt service to revenue ratio. The committee is concerned, however, that CDAC’s recommendation to freeze authorizations through fiscal 2026 will reduce the purchasing power of the capital program. It is estimated that construction inflation at 2% per annum will diminish the purchasing power by a total of $191 million from fiscal 2018 through 2022.
6

CDAC’s objective can be achieved without substantially eroding the purchasing power of the capital program. In its 2015 report, the committee recommended increasing the fiscal 2016 authorization, which totaled $1,045 million, by 1% annually through the planning period. This 1% annual growth rate would equate to an authorization level of $1,065 million for the 2017 session. This moderate growth rate limits increases in GO bond authorizations to projected State property tax revenue increases. Since general funds and other State revenues are projected to increase at an annual rate in excess of 1%, this reduces the ratio of debt service to revenues in the out-years.
The committee recommends the authorization of $1,065 million in new GO bonds for the 2017 session. In addition, for planning purposes, out-year annual authorizations should be limited to 1% growth, so that capital spending does not increase at a greater rate than State property tax revenues, which is the primary revenue source supporting debt service. The proposed limit keeps the State well within CDAC’s debt affordability criteria.
B. Higher Education Debt
The University System of Maryland intends to issue up to $32.0 million in academic debt for fiscal 2018. This is $7.5 million more than was authorized for fiscal 2017 but is consistent with the amount programmed in the 2016 Capital Improvement Program for fiscal 2018. This level of issuance will result in a debt service ratio within the 4.5% of current unrestricted funds and mandatory transfers criterion recommended by the system’s financial advisers. Morgan State University, St. Mary’s College of Maryland, and Baltimore City Community College do not plan on issuing any debt in fiscal 2018. The committee concurs in the recommendation of CDAC that $32.0 million in new academic revenue bonds may be authorized at the 2017 session for the University System of Maryland. 5. State Employment
Personnel costs comprise approximately 20% of the State’s operating budget. Position ceilings, voluntary separation programs, and cost containment actions have resulted in a decline in the size of the State’s regular workforce from 81,113 in fiscal 2002 to 80,323 at the start of fiscal 2017. Declines have been sharpest in Executive Branch agencies, dropping from 55,980 in fiscal 2002 to 49,992 in fiscal 2017. Over 4,200 positions have been added in higher education during this period.
In recent years, there has been a substantial increase in vacant positions and vacancy rates
in Executive Branch agencies, despite cost containment actions to reduce vacant positions. Vacancies increased by 645 positions over the course of a year, from 4,422 positions in October 2015 to 5,067 positions in October 2016 (increasing the vacancy rate from 8.7% to 10.0%, respectively). The committee is concerned that a significant number of these vacancies are again within agencies that have been historically identified as chronically understaffed and are responsible for providing public safety and health-related services for the State.
7
The committee finds that, given the State’s fiscal condition, 80,323 positions are appropriate for the delivery of State services. The fiscal 2018 budget should not exceed this maximum number of positions across all functions (including the Executive, Legislative, and Judicial branches, and higher education). Agencies should make maximum use of existing vacant positions to address staffing needs. The Governor should use the budget and his authority to abolish and create positions to reallocate personnel resources as necessary to address service needs. Layoffs should be avoided as sufficient opportunities for savings should exist within the existing State workforce authorization. Additionally, the committee recommends that language be included in the fiscal 2018 budget requiring the Governor to conduct a thorough and statewide evaluation of the causes underlying the chronic staffing issues plaguing State agencies and make recommendations for strategies to improve the hiring and retention of State employees, including the potential need to increase starting salaries and offer retention bonuses for certain critical positions.
8

Appendix 1
Prior Recommendations and Legislative Action on the Operating Budget ($ in Millions)
12000 legislative action does not reflect $266 million of Cigarette Restitution Fund (CRF) appropriations. CRF dollars were excluded because it had not previously been available to the State. The 2000 growth rate, including CRF dollars, was 9.16%. 2Methodology revised effective with the 2001 session. 3The committee initially approved a limit of 5.70% for 2005 and 8.90% for 2006. 4Legislative action calculation includes federal funds under the American Recovery and Reinvestment Act of 2009 used in lieu of ongoing general fund spending. 5Spending reduction/total reduction.
Committee Recommendation Legislative Action Session Year Growth Rate Amount Growth
Amount
1983 9.00% $428.0 5.70% $269.8 1984 6.15% 326.7 8.38% 402.0 1985 8.00% 407.2 7.93% 404.6 1986 7.70% 421.5 7.31% 402.2 1987 7.28% 430.2 7.27% 429.9 1988 8.58% 557.5 8.54% 552.9 1989 8.79% 618.9 8.78% 618.2 1990 9.00% 691.6 8.98% 689.7 1991 5.14% 421.8 5.00% 410.0 1992 No recommendation 10.00% 823.3 1993 2.50% 216.7 2.48% 215.0 1994 5.00% 443.2 5.00% 443.2 1995 4.50% 420.1 4.50% 420.0 1996 4.25% 415.0 3.82% 372.8 1997 4.15% 419.6 4.00% 404.6 1998 4.90% 514.9 4.82% 506.6 1999 5.90% 648.8 5.82% 640.6
20001 6.90% 803.0 6.87% 800.0 20012 6.95% 885.3 6.94% 884.6 2002 3.95% 543.2 3.40% 468.1 2003 2.50% 358.2 0.94% 134.1 2004 4.37% 635.2 4.33% 629.0 20053 6.70% 1,037.1 6.69% 1,036.3 20063 9.60% 1,604.7 9.57% 1,599.0 2007 7.90% 1,450.0 7.51% 1,378.4 2008 4.27% 848.7 4.16% 826.8 20094 0.70% 145.7 0.19% 39.2 20104 0.00% 0.0 -3.00% -626.9 2011 Reduce FY 2012 structural deficit by 33⅓% 36.90%/46.00%5 2012 Reduce FY 2013 structural deficit by 50.0% 50.60% 2013 Reduce FY 2014 structural deficit by $200.0 million -211.2 2014 4.00% 937.8 2.76% 646.4 Reduce FY 2015 structural deficit by $125.0 million -126.1
2015 Reduce FY 2016 structural deficit by 50.0% 68.27%
2016 4.85% 1.184.2 4.55% 1,111.2
9

10

Part 1
Economic Outlook
11

12

Une
mpl
oym
ent
Initi
alEx
istin
gM
edia
nVe
hicl
eM
onth
-Yea
rC
ESQ
CEW
Rat
eU
I Cla
ims
Hom
e Sa
les
Hom
e Pr
ice
Sale
sJa
n-16
1.7%
1.8%
4.8%
3.0%
14.2
%4.
8%-8
.1%
Feb-
161.
6%1.
6%4.
7%-2
.3%
21.2
%1.
3%12
.2%
Mar
-16
2.5%
2.0%
4.7%
-2.6
%6.
6%2.
3%17
.0%
Apr-1
62.
2%4.
6%-3
.0%
13.8
%5.
2%0.
0%M
ay-1
61.
7%4.
5%20
.8%
15.6
%2.
6%11
.5%
Jun-
162.
2%4.
3%-2
.6%
10.8
%3.
8%16
.1%
Jul-1
62.
3%4.
3%0.
3%-0
.7%
3.6%
-5.1
%Au
g-16
1.7%
4.3%
15.2
%12
.1%
4.1%
10.3
%Se
p-16
1.6%
4.2%
6.4%
6.3%
3.8%
0.3%
00%
CES
: C
urre
nt E
stab
lishm
ent S
urve
y; Q
CEW
: Q
uarte
rly C
ensu
s of
Em
ploy
men
t and
Wag
es; U
I: u
nem
ploy
men
t ins
uran
ce
Mar
ylan
d Ec
onom
ic P
erfo
rman
ceYe
ar-o
ver-
year
Per
cent
Cha
nge
Empl
oym
ent
Not
e:Th
eun
empl
oym
ent
rate
isba
sed
onse
ason
ally
adju
sted
data
.M
onth
lyun
empl
oym
ent
insu
ranc
ecl
aim
sfro
mth
eU
.S.
Bure
auof
Labo
rSt
atis
tics
with
sea
sona
l adj
ustm
ent b
y M
oody
’s A
naly
tics.
0.0%
1.0%
2.0%
3.0%
4.0%
5.0%
6.0%
7.0%
14-Q
114
-Q2
14-Q
314
-Q4
15-Q
115
-Q2
15-Q
315
-Q4
16-Q
116
-Q2
U.S
.M
aryl
and
Virg
inia
Wag
e an
d Sa
lary
Inco
me:
Yea
r-ov
er-y
ear P
erce
nt C
hang
e
13

Jan-
Jun
Jan-
Jun
2015
2015
2015
2015
2016
Impr
oved
?20
1520
16Im
prov
ed?
% E
mp.
% W
age
Avg.
Wag
e
Tota
l1.
5%1.
9%Y
4.6%
3.5%
10
0%10
0%$5
9,87
3
Priv
ate
Sect
or1.
9%2.
4%Y
5.0%
4.2%
81
%77
%$5
7,03
6C
onst
ruct
ion
3.0%
5.7%
Y6.
1%10
.1%
Y6%
6%62
,625
Educ
atio
nal S
ervi
ces
1.0%
3.9%
Y3.
6%4.
0%Y
3%2%
47,4
44M
anuf
actu
ring
0.8%
2.9%
Y4.
4%0.
9%
4%5%
74,7
95O
ther
Ser
vice
s*2.
0%2.
8%Y
3.8%
3.9%
Y4%
4%50
,361
Prof
essi
onal
Ser
vice
s*0.
9%3.
0%Y
2.8%
4.6%
Y10
%16
%96
,885
Rec
reat
ion,
Hot
els,
Res
taur
ants
3.1%
4.4%
Y7.
3%6.
6%
10%
4%24
,932
Ret
ail T
rade
0.7%
1.3%
Y5.
5%4.
5%
11%
6%31
,591
Adm
in/S
uppo
rt/W
aste
Ser
vice
s2.
5%0.
3%
7.4%
5.8%
6%
4%42
,362
Fina
nce,
Insu
ranc
e, a
nd R
eal E
stat
e1.
3%1.
3%
5.1%
1.6%
6%
8%87
,687
Hea
lth C
are
and
Soci
al A
ssis
tanc
e2.
2%1.
3%
6.5%
3.5%
13
%12
%53
,217
Info
rmat
ion
-1.6
%-2
.6%
-0
.4%
0.7%
Y1%
2%86
,183
Tran
spor
tatio
n an
d U
tiliti
es5.
3%3.
2%
8.8%
6.6%
3%
3%60
,942
Who
lesa
le T
rade
1.4%
1.0%
4.
0%0.
5%
3%4%
80,1
31
Fede
ral G
over
nmen
t0.
7%1.
3%Y
3.8%
3.9%
Y5%
11%
117,
111
**St
ate
and
Loca
l Gov
ernm
ent
-0.3
%-0
.6%
3.
6%-0
.5%
13
%12
%53
,978
Wag
es:
Perc
ent C
hang
eEm
ploy
men
t: P
erce
nt C
hang
e
Mar
ylan
d Em
ploy
men
t and
Wag
e G
row
th b
y In
dust
ry
**Th
eav
erag
ew
age
fort
hefe
dera
lgov
ernm
enti
sov
erst
ated
beca
use
whi
leth
ew
age
data
incl
udes
anes
timat
eof
wag
esat
clas
sifie
dag
enci
es,t
heem
ploy
men
tdat
aex
clud
esth
ejo
bsat
thos
e ag
enci
es.
Both
the
empl
oym
ent a
nd w
age
data
exc
lude
s th
e un
iform
ed m
ilitar
y.
Sour
ce:
Bure
au o
f Lab
or S
tatis
tics;
U.S
. Dep
artm
ent o
f Lab
or; B
urea
u of
Eco
nom
ic A
naly
sis;
U.S
. Dep
artm
ent o
f Com
mer
ce
*O
ther
Serv
ices
incl
udes
pers
onal
,lau
ndry
,and
repa
iran
dm
aint
enan
cese
rvic
esal
ong
with
mem
bers
hip
orga
niza
tions
.Pr
ofes
sion
alSe
rvic
esin
clud
esPr
ofes
sion
al,S
cien
tific
,and
Tech
nica
l Ser
vice
s pl
us M
anag
emen
t of C
ompa
nies
.
14

CalendarYear Dec. 2015 Sep. 2016 Dec. 2015 Sep. 2016
2013 0.9% 0.9% -0.2% -0.6%2014 0.9% 0.9% 3.8% 3.4%2015 1.5% 1.5% 4.2% 4.1%
2016E 1.3% 1.9% 4.6% 3.7%2017E 1.0% 1.0% 5.1% 4.4%2018E 0.8% 0.8% 4.5% 4.6%2019E 0.5% 0.5% 4.2% 4.2%
CalendarYear Dec. 2015 Sep. 2016 Dec. 2015 Sep. 2016
2013 0.8% 0.8% -0.1% -0.1%2014 3.4% 3.3% 2.4% 2.4%2015 3.9% 4.6% 2.4% 3.1%
2016E 4.2% 4.0% 2.9% 2.1%2017E 4.1% 3.9% 3.1% 2.9%2018E 4.0% 4.0% 3.2% 3.2%2019E 3.8% 3.8% 3.2% 3.2%
CalendarYear Dec. 2015 Sep. 2016 Dec. 2015 Sep. 2016
2013 -2.0% -2.5% -15.6% -15.6%2014 4.3% 5.9% 24.5% 43.0%2015 4.7% 3.5% 0.0% -15.0%
2016E 6.8% 3.0% 1.3% 0.0%2017E 8.9% 5.2% 3.8% 0.0%2018E 6.9% 7.5% 6.9% 0.0%2019E 5.5% 6.0% 6.0% 0.0%
Maryland Economic ForecastsYear-over-year Percent Change
Wage and Salary Income
* The payroll tax holiday expired in calendar 2013 depressing growth in total personal income for that year.Total personal income growth in calendar 2013 was about 0.3%, excluding the impact of the tax holidayexpiration.
Average Wage
** The calender 2014 figure is an estimate for December 2015, and calendar 2015 figures are estimates forboth December 2015 and September 2016.
Employment Personal Income*
Taxable Capital Gains Income**Dividends, Interest, and Rent
15

16

Part 2
General Fund Revenues
17

18

FY 2
015
Sour
ceAc
tual
Estim
ate(1
)Ac
tual
$ D
iff.
% D
iff.
Estim
ated
Actu
al
Pers
onal
Inco
me
Tax
$8,3
46.1
$8,7
79.1
$8,5
17.6
-$26
1.5
-3.0
%5.
2%2.
1%Sa
les
and
Use
Tax
4,35
0.7
4,44
9.7
4,44
4.5
-5.2
-0.1
%2.
3%2.
2%St
ate
Lotte
ry50
6.5
520.
452
9.8
9.4
1.8%
2.7%
4.6%
Cor
pora
te In
com
e Ta
x77
7.3
866.
687
4.5
7.8
0.9%
11.5
%12
.5%
Busi
ness
Fra
nchi
se T
axes
225.
723
0.4
222.
0-8
.4-3
.7%
2.1%
-1.7
%In
sura
nce
Prem
ium
s Ta
x (2
)31
6.1
297.
628
7.4
-10.
2-3
.4%
-5.8
%-9
.1%
Esta
te a
nd In
herit
ance
Tax
es24
3.4
251.
126
1.9
10.8
4.3%
3.2%
7.6%
Toba
cco
Tax
391.
539
2.4
395.
32.
90.
7%0.
2%1.
0%Al
coho
l Bev
erag
es T
ax31
.331
.531
.90.
41.
4%0.
7%2.
0%M
otor
Veh
icle
Fue
l Tax
(3)
5.0
4.6
4.6
0.0
0.0%
-7.5
%-7
.5%
Dis
trict
Cou
rts77
.777
.772
.3-5
.4-6
.9%
0.0%
-6.9
%C
lerk
s of
the
Cou
rt34
.437
.634
.2-3
.3-8
.9%
9.1%
-0.7
%H
ospi
tal P
atie
nt R
ecov
erie
s65
.259
.757
.5-2
.2-3
.7%
-8.4
%-1
1.8%
Inte
rest
on
Inve
stm
ents
10
.711
.015
.04.
036
.4%
2.7%
40.1
%M
isce
llane
ous
396.
732
3.3
334.
110
.93.
4%-1
8.5%
-15.
8%Su
btot
al$1
5,77
8.4
$16,
332.
7$1
6,08
2.6
-$25
0.1
-1.5
%3.
5%1.
9%
Tran
sfer
Tax
(4)
$144
.2$1
15.4
$115
.4$0
.00.
0%-2
0.0%
-20.
0%
Tota
l Rev
enue
s$1
5,92
2.6
$16,
448.
1$1
6,19
8.0
-$25
0.1
-1.5
%3.
3%1.
7%(1
) Fro
m th
e Bo
ard
of R
even
ue E
stim
ates
, Mar
ch 2
016,
with
adj
ustm
ents
for a
ctio
n at
the
2016
legi
slat
ive
sess
ion.
Sour
ce:
Boar
d of
Rev
enue
Est
imat
es
Not
e:C
hapt
er50
of20
15re
quire
dth
eC
ompt
rolle
r’sO
ffice
toco
nduc
tata
xam
nest
ypr
ogra
mfro
mSe
ptem
ber1
,201
5,to
Oct
ober
30,2
015.
Fisc
al20
16ge
nera
l fun
dre
venu
es in
clud
e ap
prox
imat
ely
$23.
2 m
illion
from
the
tax
amne
sty,
$11
.8 m
illion
mor
e th
an e
xpec
ted.
Fisc
al 2
016
Gen
eral
Fun
d R
even
ues
($ in
Mill
ions
)FY
201
5-20
16
(4)Th
eBR
FAof
2013
(Cha
pter
425)
esta
blis
hed
adi
strib
utio
nof
trans
fert
axre
venu
esto
the
Gen
eral
Fund
forf
isca
l201
4to
2018
.Th
eBR
FAof
2014
(Cha
pter
464
)in
crea
sed
the
dist
ribut
ion
in fi
scal
201
5 by
$69
.1 m
illion
. Th
e BR
FA o
f 201
5 (C
hapt
er 4
89) i
ncre
ased
the
dist
ribut
ion
in fi
scal
201
6 by
$37
.7 m
illion
.% C
hang
e
(3)Th
eBu
dget
Rec
onci
liatio
nan
dFi
nanc
ing
Act(
BRFA
)of2
011
(Cha
pter
397)
dive
rted
$5.0
milli
onin
mot
orfu
elta
xre
venu
eto
the
Gen
eral
Fund
that
wou
ldot
herw
ise
have
gon
e to
the
Che
sape
ake
Bay
2010
Fun
d fo
r fis
cal 2
012
thro
ugh
2015
and
$4.
6 m
illion
in fi
scal
201
6.
Fisc
al 2
016
(2)Th
edi
strib
utio
nof
insu
ranc
epr
emiu
mta
xre
venu
eto
the
Mar
ylan
dH
ealth
Bene
fitEx
chan
gein
crea
sed
from
$13.
0m
illion
infis
cal2
015
to$3
2.8
milli
onin
fisca
l 201
6as
requ
ired
by th
e M
aryl
and
Hea
lth P
rogr
ess
Act o
f 201
3 (C
hapt
er 1
59).
Rev
enue
s be
fore
the
dist
ribut
ion
wer
e do
wn
2.7%
in fi
scal
201
6.
19

% Chng.
Withholding $11,988 $12,510 4.4%Estimated 1,903 2,021 6.2%Subtotal $13,891 $14,532 4.6%
Payments with Returns 1,464 1,416 -3.2%
Refunds (1) 2,202 2,389 8.5%
Net Receipts $13,154 $13,559 3.1%
TY: tax year
% Chng.
Withholding $6,095 $6,169 1.2%Estimated 709 703 -0.8%Subtotal $6,803 $6,872 1.0%
% Chng.
Withholding $2,528 $2,741 8.4%Estimated 397 495 24.4%Subtotal $2,925 $3,235 10.6%
% Chng.
Withholding $8,623 $8,910 3.3%Estimated 1,106 1,198 8.2%Subtotal $9,729 $10,107 3.9%
Source: Comptroller of Maryland
TY 2014
TY 2015
Maryland State and Local Personal Income Tax
(1) TY 2014 excludes Wynne refunds, but TY 2015 would include refunds due to the use of the out-of-state tax creditagainst the local income tax. Refund data is not available by tax year so it is assumed that refunds in calendar 2016 arefor TY 2015 and refunds in calendar 2015 were for TY 2014.
Jan 2014 to Sep 2015TY 2015
Jan 2015 to Sep 2016
TY 2016Jan 2015 to Jun 2015
($ in Millions)
TY 2015 TY 2016Jan 2015 to Sep 2015 Jan 2016 to Sep 2016
Jan 2015 to Jun 2016
TY 2015 TY 2016Jul 2015 to Sep 2015 Jul 2016 to Sep 2016
20

Full-
year
Estim
ated
Sour
ceFY
201
6FY
201
7$
Diff
eren
ce%
Diff
eren
ceG
row
th R
ate
Pers
onal
Inco
me
Tax
$2,2
82.5
$2,3
93.8
$111
.34.
9%5.
2%Sa
les
and
Use
Tax
(1)
1,11
7.2
1,15
1.0
33.7
3.0%
2.9%
Stat
e Lo
ttery
156.
115
0.9
-5.2
-3.3
%-3
.2%
Cor
pora
te In
com
e Ta
x21
0.0
158.
8-5
1.2
-24.
4%-2
.4%
Busi
ness
Fra
nchi
se T
axes
46.6
44.3
-2.3
-5.0
%2.
0%In
sura
nce
Prem
ium
s Ta
x78
.868
.3-1
0.5
-13.
3%2.
6%Es
tate
and
Inhe
ritan
ce T
axes
81.4
75.2
-6.2
-7.6
%-2
0.7%
Toba
cco
Tax
112.
511
2.5
0.1
0.0%
-0.5
%Al
coho
l Bev
erag
es T
ax8.
18.
20.
11.
2%1.
4%D
istri
ct C
ourts
29.7
26.5
-3.2
-10.
7%-0
.6%
Cle
rks
of th
e C
ourt
19.0
17.8
-1.2
-6.2
%8.
0%In
tere
st a
nd M
isce
llane
ous (2
)52
.037
.8-1
4.2
-27.
3%-1
.7%
Tota
l Rev
enue
s$4
,193
.8$4
,245
.1$5
1.3
1.2%
3.0%
● ● ● (1)
(2)
Dat
are
flect
ssa
les
tax
reve
nue
rem
itted
toth
eC
ompt
rolle
rfro
mAu
gust
thro
ugh
Oct
ober
,whi
chw
ere
colle
cted
byre
taile
rsfro
mJu
lyth
roug
hSe
ptem
ber.
Incl
udes
inte
rest
onin
vest
men
ts;h
ospi
talp
atie
ntre
cove
ryre
venu
esfro
mM
edic
are,
insu
ranc
e,an
dsp
onso
rs;g
ener
alfu
ndm
otor
fuel
tax
reve
nue
in fi
scal
201
6 an
d ot
her m
isce
llane
ous
reve
nues
.
Sour
ce:
Com
ptro
ller o
f Mar
ylan
d; S
tate
Lot
tery
and
Gam
ing
Con
trol A
genc
y
Fisc
al 2
017
Gen
eral
Fun
d R
even
ues
($ in
Mill
ions
)
Fisc
al Y
ear t
hrou
gh O
ctob
er
Fisc
al20
17pe
rson
alin
com
eta
xre
venu
esw
ere
up11
.5%
atth
een
dof
Sept
embe
rbu
tgro
wth
isno
w4.
9%as
ofth
een
dof
Oct
ober
. Th
is w
as e
xpec
ted
as ti
min
g is
sues
wer
e ar
tific
ially
infla
ting
reve
nue
grow
th in
the
first
thre
e m
onth
s of
fisc
al 2
017.
Inco
me
tax
estim
ated
paym
ents
thro
ugh
Oct
ober
are
belo
wye
arag
ole
vels
by3.
8%.
Asof
the
end
ofSe
ptem
ber
estim
ated
paym
enth
adbe
enup
24%
beca
use
asi
gnifi
cant
amou
ntof
reve
nue
that
isno
rmal
lybo
oked
inSe
ptem
ber
was
dela
yed
and
repo
rted
in O
ctob
er la
st y
ear (
fisca
l 201
6).
The
year
-ove
r-yea
r com
paris
on is
now
mor
e co
nsis
tent
.
Inco
me
tax
with
oldi
nggr
owth
rem
ains
quite
good
alth
ough
itsl
ippe
dfro
m8.
4%at
the
end
ofSe
ptem
bert
o6.
8%as
ofth
een
dof
Oct
ober
.The
stro
nggr
owth
inw
ithho
ldin
gis
due
inpa
rtto
the
split
ofJu
lyw
ithho
ldin
gbe
twee
nth
eam
ount
accr
ued
back
toJu
ne(fi
scal
201
6)an
dth
eam
ount
book
edin
fisca
l201
7.Th
eac
crua
lwas
very
low
resu
lting
insi
gnifi
cant
lym
ore
reve
nue
than
norm
al fa
lling
in J
uly,
con
tribu
ting
to th
e la
rge
year
-ove
r-yea
r inc
reas
e.
21

"Cur
rent
as
of D
ecem
ber 1
3, 2
016"
FY 2
016
% C
hang
e%
Cha
nge
Sour
ceAc
tual
Sep.
Dec
.D
iffer
ence
over
FY1
6Se
p.D
ec.
Diff
eren
ceov
er F
Y17
Pers
onal
Inco
me
Tax
$8,5
17.6
$8,9
63.5
$8,9
91.4
$27.
85.
6%$9
,370
.4$9
,389
.6$1
9.2
4.4%
Sale
s an
d U
se T
ax4,
444.
54,
574.
84,
592.
617
.83.
3%4,
725.
34,
741.
215
.93.
2%St
ate
Lotte
ry (1
)52
9.8
512.
749
2.3
-20.
4-7
.1%
523.
950
5.2
-18.
72.
6%C
orpo
rate
Inco
me
Tax (2
)87
4.5
853.
477
1.6
-81.
8-1
1.8%
898.
283
0.1
-68.
17.
6%Bu
sine
ss F
ranc
hise
Tax
es22
2.0
226.
422
3.5
-2.9
0.7%
193.
122
7.3
34.2
1.7%
Insu
ranc
e Pr
emiu
ms
Tax
287.
429
4.8
294.
80.
02.
6%30
4.6
304.
60.
03.
3%Es
tate
and
Inhe
ritan
ce T
axes
261.
920
7.8
206.
7-1
.1-2
1.1%
184.
818
4.5
-0.3
-10.
7%To
bacc
o Ta
x39
5.3
393.
539
3.8
0.3
-0.4
%39
1.9
392.
20.
3-0
.4%
Alco
hol B
ever
ages
Tax
31.9
32.4
32.9
0.6
3.1%
32.8
33.4
0.5
1.3%
Mot
or V
ehic
le F
uel T
ax (3
)4.
60.
00.
00.
0-1
00.0
%0.
00.
00.
0n.
a.D
istri
ct C
ourts
72.3
71.9
70.3
-1.6
-2.9
%71
.970
.2-1
.60.
0%C
lerk
s of
the
Cou
rt34
.236
.936
.90.
08.
0%36
.236
.40.
2-1
.5%
Hos
pita
l Pat
ient
Rec
over
ies
57.5
58.3
57.8
-0.6
0.5%
58.3
58.3
-0.1
0.9%
Inte
rest
on
Inve
stm
ents
15
.020
.020
.00.
033
.3%
35.0
35.0
0.0
75.0
%M
isce
llane
ous
334.
132
6.0
326.
50.
5-2
.3%
332.
432
6.3
-6.0
-0.1
%
Subt
otal
$16,
082.
6$1
6,57
2.4
$16,
511.
1-$
61.2
2.7%
$17,
158.
8$1
7,13
4.3
-$24
.53.
8%Tr
ansf
er T
ax (4
)$1
15.4
$62.
8$6
2.8
$0.0
-45.
6%$4
6.0
$46.
0$0
.0-2
6.7%
GAA
P tra
nsfe
r (5)
0.0
0.0
47.4
47.4
n.a.
0.0
0.0
0.0
-100
.0%
Tota
l Rev
enue
s$1
6,19
8.0
$16,
635.
2$1
6,62
1.3
-$13
.82.
6%$1
7,20
4.8
$17,
180.
3-$
24.5
3.4%
GAA
P: g
ener
al a
ccep
ted
acco
untin
g pr
inci
ples
Sour
ce:
Boar
d of
Rev
enue
Est
imat
es
(3)
The
BRFA
of20
11di
verte
d$5
.0m
illion
inm
otor
fuel
tax
reve
nue
toth
eG
ener
alFu
ndth
atw
ould
othe
rwis
eha
vego
neto
the
Che
sape
ake
Bay
2010
Fund
for
fisca
l201
2th
roug
h 20
15 a
nd $
4.6
milli
on in
fisc
al 2
016.
(4
)Th
eBR
FAof
2013
(Cha
pter
425)
esta
blis
hed
adi
strib
utio
nof
trans
fert
axre
venu
esto
the
Gen
eral
Fund
forf
isca
l201
4to
2018
.Th
eBR
FAof
2015
(Cha
pter
489)
incr
ease
dth
e di
strib
utio
n in
fisc
al 2
016
by $
37.7
milli
on.
Cha
pter
10
of th
e 20
16 s
essi
on re
duce
d th
e di
strib
utio
n in
fisc
al 2
017
by $
20.0
milli
on a
nd in
fisc
al 2
018
by $
40.0
milli
on.
(5) T
he C
ompt
rolle
r's a
nnua
l ana
lysi
s of
the
loca
l inc
ome
tax
rese
rve
acco
unt d
eter
min
ed th
e ac
coun
t was
ove
r-fun
ded
at th
e en
d of
fisc
al 2
016
by $
47.4
milli
on.
Mar
ylan
d G
ener
al F
und
Rev
enue
For
ecas
t($
in M
illio
ns)
FY 2
017
Estim
ate
FY 2
018
Estim
ate
(1) Fi
scal
2017
and
2018
refle
cta
dist
ribut
ion
of$1
.0m
illion
toth
eho
rse
raci
ngsp
ecia
lfun
dre
quire
dby
the
Mar
ylan
dIn
tern
atio
nala
ndPr
eakn
ess
Stak
esIn
cent
ive
Acto
f201
6(C
hapt
er 7
27).
(2)
The
Budg
etR
econ
cilia
tion
and
Fina
ncin
gAc
t(BR
FA)o
f201
1(C
hapt
er39
7)se
tthe
Tran
spor
tatio
nTr
ustF
und'
ssh
are
ofth
eco
rpor
ate
inco
me
tax
at9.
5%of
netr
ecei
pts
(exc
ludi
ngth
efir
st15
.15%
)in
fisca
l201
3,19
.5%
infis
cal2
014
to20
16an
d17
.2%
forf
isca
l201
7an
dbe
yond
.Ad
just
edfo
rthi
sla
wch
ange
,bas
elin
ege
nera
lfun
dco
rpor
ate
inco
me
tax
reve
nues
are
exp
ecte
d to
fall
13.9
% in
fisc
al 2
017.
22
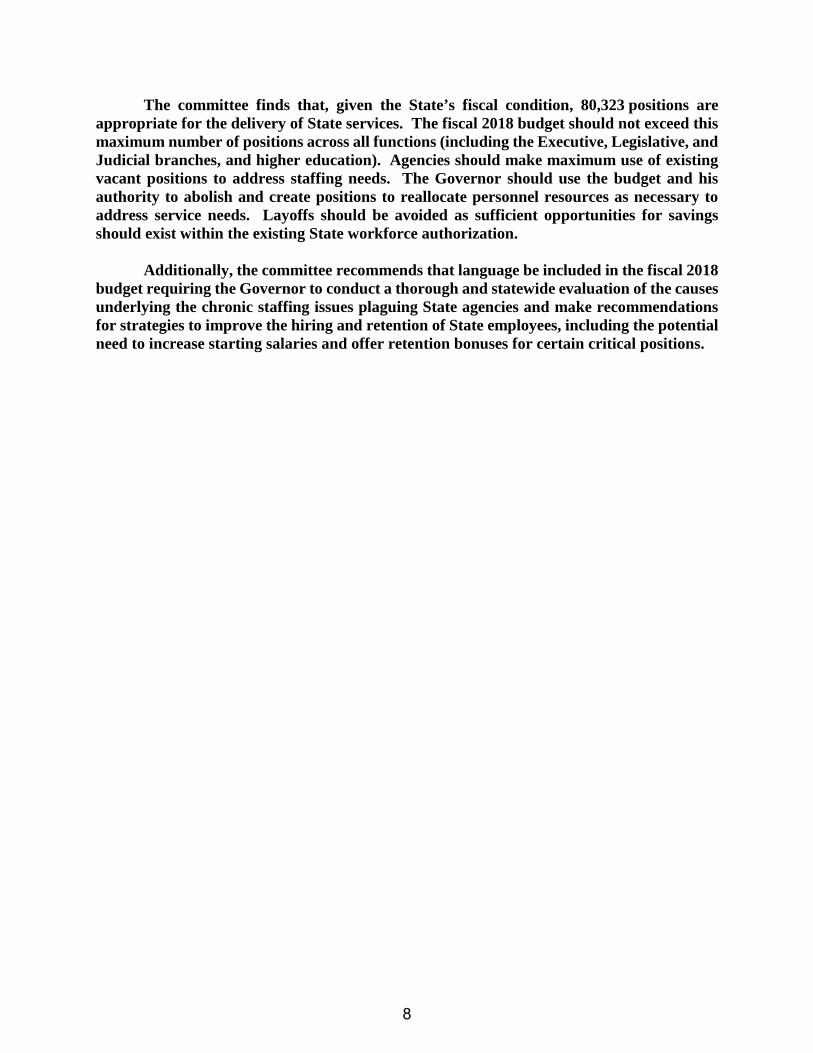
FY 2
018
Estim
ate
Actu
alD
iffer
ence
Mar
. Est
.Se
p. E
st.
Diff
eren
ceEs
timat
eEd
ucat
ion
Trus
t Fun
d$3
12.9
$322
.0$9
.2$3
82.8
$376
.3-$
6.5
$452
.3C
asin
o O
pera
tors
295.
630
4.3
8.7
408.
440
2.2
-6.2
523.
4Lo
cal I
mpa
ct G
rant
s38
.639
.71.
150
.249
.2-0
.961
.7Sm
all,
Min
ority
, and
Wom
en-o
wne
d Bu
sine
sses
10.5
10.8
0.3
13.7
13.4
-0.3
16.8
Purs
e D
edic
atio
n48
.750
.11.
458
.057
.0-1
.067
.1R
ace
Trac
ks F
acili
ty R
enew
al A
ccou
nt6.
87.
00.
28.
98.
7-0
.211
.0St
ate
Lotte
ry A
genc
y7.
67.
80.
29.
79.
6-0
.111
.9To
tal G
ross
Rev
enue
s$7
20.6
$741
.7$2
1.0
$931
.6$9
16.4
-$15
.2$1
,144
.3
FY 2
018
Estim
ate
Actu
alD
iffer
ence
Mar
. Est
.Se
p. E
st.
Diff
eren
ceEs
timat
eEd
ucat
ion
Trus
t Fun
d$7
5.0
$80.
5$5
.4$7
6.0
$86.
4$1
0.4
$94.
0C
asin
o O
pera
tors
300.
132
1.8
21.8
355.
040
6.5
51.6
501.
3Lo
cal I
mpa
ct G
rant
s0.
00.
00.
012
.715
.22.
531
.3To
tal G
ross
Rev
enue
s$3
75.1
$402
.3$2
7.2
$443
.7$5
08.2
$64.
5$6
26.6
* The
Boa
rd o
f Rev
enue
Est
imat
es’ f
orec
ast a
ssum
es th
e Pr
ince
Geo
rge’
s C
ount
y fa
cilit
y w
ill o
pen
in J
anua
ry 2
017.
Sour
ce:
Stat
e Lo
ttery
and
Gam
ing
Con
trol A
genc
y; B
oard
of R
even
ue E
stim
ates
Vide
o Lo
ttery
Ter
min
als
Tabl
e G
ames
Gam
ing
Prog
ram
Rev
enue
s an
d Im
pact
on
the
Educ
atio
n Tr
ust F
und
($ in
Mill
ions
)
FY 2
017*
FY 2
016
FY 2
017*
FY 2
016
0%10%
20%
30%
40%
50%
60%
70%
2011
2012
2013
2014
2015
2016
2017
2018
Stat
e Sh
are
Net
of G
ener
al F
und
Spen
ding
Shar
e of
Tot
al G
ross
Rev
enue
s G
oing
to S
tate
: Fi
scal
2011
to 2
018
Not
e:To
talg
ross
reve
nues
incl
udes
vide
olo
ttery
term
inal
and,
star
ting
infis
cal2
013,
tabl
ega
me
reve
nue.
The
shar
ego
ing
toth
eSt
ate
iseq
ualt
oth
eto
tall
ess
the
amou
ntth
atis
reta
ined
byth
eca
sino
oper
ator
sne
tted
agai
nstt
hege
nera
lfun
dsp
endi
ngto
supp
ortt
hepr
ogra
m.
Gen
eral
fund
spen
ding
drop
ped
betw
een
fisca
l201
4an
d20
16as
the
Hol
lyw
ood
Cas
ino
Perry
ville
and
Mar
ylan
dLI
VEfa
cilit
ies
took
over
owne
rshi
pof
the
vide
olo
ttery
term
inal
mac
hine
s.
FY 2
014
is th
e fir
st fu
ll ye
ar w
ith ta
ble
gam
es
23

24

Part 3
Revenue Volatility
25

26

Rev
enue
Vol
atili
ty W
orkg
roup
Fi
ndin
gs•
The
Join
tCha
irmen
’sR
epor
treq
uire
dth
eD
epar
tmen
tofL
egis
lativ
eSe
rvic
es,
the
Dep
artm
ent
ofBu
dget
and
Man
agem
ent,
and
the
Com
ptro
ller’s
Offi
ceto
stud
yM
aryl
and’
sre
venu
est
ruct
ure
and
reco
mm
end
stra
tegi
esfo
rred
ucin
gvo
latil
ity
•St
afff
rom
thre
eag
enci
esid
entif
ied
area
sof
vola
tility
and
exam
ined
stra
tegi
esem
ploy
edby
othe
rsta
tes
tom
inim
ize
vola
tility
•Th
ew
orkg
roup
iden
tifie
dno
nwith
hold
ing
inco
me
tax
reve
nues
(reve
nues
from
estim
ated
paym
ents
and
taxe
spa
idw
ithth
ere
turn
)as
extre
mel
yvo
latil
ean
ddi
fficu
ltto
fore
cast
•Th
ev o
latil
ityis
inpa
rtdu
eto
the
conc
entra
tion
ofca
pita
lga
ins
amon
ga
very
smal
lnum
bero
ftax
paye
rs
27

Inco
me
and
Sale
s Ta
xes
Year
-ove
r-ye
ar P
erce
nt C
hang
e
-30%
-25%
-20%
-15%
-10%-5%0%5%10%
15%
20%
25%
1988
1990
1992
1994
1996
1998
2000
2002
2004
2006
2008
2010
2012
2014
2016
Rec
essi
onPI
T G
ross
Rec
eipt
s: N
onw
ithho
ldin
gPI
T G
ross
Rec
eipt
s: W
ithho
ldin
gSa
les
Tax
Gro
ss R
ecei
pts
Fisc
al 1
988-
2016
PIT:
Stat
ean
dlo
calp
erso
nali
ncom
eta
x
Not
e:R
even
ues
have
been
adju
sted
form
ajor
law
chan
ges
and
infla
tion.
Sour
ce:
Com
ptro
llero
fMar
ylan
d
28

Mar
ylan
d Ta
xabl
e C
apita
l Gai
ns
Inco
me
Tax
Year
201
0Ta
x Ye
ar 2
011
Tax
Year
201
2Ta
x Ye
ar 2
013
Inco
me
Tax
Cla
ssR
etur
ns
Shar
e of
Cap
ital
Gai
nsIn
com
eR
etur
ns
Shar
e of
Cap
ital
Gai
nsIn
com
eR
etur
ns
Shar
e of
Cap
ital
Gai
nsIn
com
eR
etur
ns
Shar
e of
Cap
ital
Gai
nsIn
com
e
Top
0.1%
2,53
849
.7%
2,57
754
.0%
2,61
148
.8%
2,69
035
.7%
>0.1
%an
d<=
1%22
,851
23.3
%23
,198
20.5
%23
,501
23.5
%24
,213
20.4
%>1
%an
d<=
5%10
1,55
611
.5%
103,
102
10.5
%10
4,45
211
.8%
107,
615
16.1
%>5
%an
d<=
10%
126,
945
4.0%
128,
878
3.6%
130,
564
3.9%
134,
518
6.9%
>10%
and
<=25
%38
0,83
54.
1%38
6,63
24.
0%39
1,69
34.
1%40
3,55
48.
0%>2
5%an
d<=
50%
634,
725
2.1%
644,
388
2.4%
652,
821
2.5%
672,
590
4.8%
>50%
and
<=75
%63
4,72
50.
8%64
4,38
71.
1%65
2,82
11.
6%67
2,59
02.
9%>7
5%an
d<=
100%
634,
726
4.5%
644,
388
3.8%
652,
821
3.9%
672,
591
5.1%
2,53
8,90
110
0.0%
2,57
7,55
010
0.0%
2,61
1,28
410
0.0%
2,69
0,36
110
0.0%
Top
1%To
p1%
Shar
eof
Mar
ylan
dN
etSt
ate
Tax
73.0
%
20.3
%
74.5
%
20.4
%
72.3
%
23.2
%
56.1
%
20.2
%
Not
e:D
ata
incl
udes
full-
year
Mar
ylan
dre
side
nts
only
.Th
ecl
ass
isde
fined
byne
tMar
ylan
din
com
eta
x.
Sour
ce:
Com
ptro
llero
fMar
ylan
d
29

Rec
omm
enda
tions
•Ap
ply
aca
pto
the
estim
ate
ofno
nwith
hold
ing
reve
nues
assu
med
inth
ebu
dget
proc
ess
•Th
eca
psh
ould
refle
ctth
eav
erag
esh
are
ofno
nwith
hold
ing
reve
nues
toto
tal
gene
ral
fund
reve
nues
over
the
mos
tre
cent
10-y
ear
perio
d(i.
e.,
ifno
nwith
hold
ing
reve
nues
repr
esen
t15%
ofto
talg
ener
alfu
ndre
venu
esov
erth
ela
stde
cade
,the
nth
ere
venu
ees
timat
efo
rnex
tyea
rfor
nonw
ithho
ldin
gis
capp
edat
15%
ofge
nera
lfun
dre
venu
es)
•Es
timat
edno
nwith
hold
ing
amou
nts
inex
cess
ofca
psh
ould
not
beap
prop
riate
d
•R
even
ues
capt
ured
byth
eca
pat
clos
eout
shou
ldbe
utiliz
edto
incr
ease
Rai
nyD
ayFu
ndba
lanc
eto
10%
ofge
nera
lfu
ndre
venu
es(c
urre
ntly
atab
out
6%),
avoi
dde
btby
supp
ortin
gpa
y-as
-you
-go
proj
ects
,an
dad
dres
sun
fund
edre
tiree
heal
than
dw
orke
rs’c
ompe
nsat
ion
liabi
litie
s
30

Adv
anta
ges
of P
ropo
sal
•En
cour
ages
savi
ngs
atpe
akof
busi
ness
cycl
e
–In
year
sth
atre
venu
esar
ein
crea
sing
atun
sust
aina
ble
leve
ls,
the
cap
redu
ces
the
avai
labl
ere
venu
esan
dsp
endi
ngw
hile
setti
ngas
ide
addi
tiona
lfu
nds
for
rese
rves
,on
e-tim
eca
pita
lpr
ojec
ts,a
ndre
duci
ngun
fund
edlia
bilit
ies
•Pr
omot
eslo
ng-te
rmst
ruct
ural
bala
nce
–C
apco
nstra
ins
amou
ntof
unsu
stai
nabl
ere
venu
ebu
iltin
toon
goin
gsp
endi
ng
•So
ftens
impa
ctof
rece
ssio
nby
limiti
ngre
lianc
eon
vola
tile
reve
nue
sour
ce
•Ac
cum
ulat
esad
equa
teba
lanc
ein
Rai
nyD
ayFu
ndto
miti
gate
the
imm
edia
teim
pact
ofa
rece
ssio
nw
hile
still
reta
inin
gba
lanc
eof
5%of
reve
nues
tohe
lpm
aint
ain
AAA
bond
ratin
g
–R
eluc
tanc
eto
redu
ceba
lanc
ebe
low
5%th
resh
old
and
smal
lba
lanc
ein
exce
ssof
5%ha
sdi
min
ishe
dut
ility
offu
ndin
resp
ondi
ngto
econ
omic
dow
ntur
ns
–At
o uts
etof
each
ofth
ela
stth
ree
rece
ssio
ns,r
even
ues
have
falle
nsh
orto
fthe
estim
ate
forb
oth
the
curre
ntan
dsu
bseq
uent
fisca
lyea
rby
atle
ast4
%
31

Impa
ct o
f Cap
on
Clo
seou
t
$314
$230
-$71
-$27
$214
-$25
0
$314
$230
-$7
$263
$357
$6
-$30
0
-$20
0
-$10
0$0
$100
$200
$300
$400
2011
2012
2013
2014
2015
2016
Actu
al G
F R
even
ues
Com
pare
d to
BR
E Es
timat
eAc
tual
GF
Rev
enue
s C
ompa
red
to E
stim
ate
with
Cap
BRE:
Boar
dof
Rev
enue
Estim
ates
GF:
Gen
eral
Fund
Sour
ce:
Dep
artm
ento
fLeg
isla
tive
Serv
ices
Fisc
al 2
011-
2016
($ in
Mill
ions
)
32

Part 4
General Fund Budget and Forecast
33

34

"Current as of December 13, 2016"
2016 Actual
2017 Working
2018 Baseline
Funds AvailableOngoing Revenues $16,216 $16,604 $17,212Balances and Transfers 325 399 0One-time Federal Aid 0 0 0One-time Generally Accepted Accounting Principles Transfer 0 47 0Short-term Revenues 0 0 0Total Funds Available $16,541 $17,050 $17,212
Net Ongoing Operating Costs and Deficiencies $16,249 $17,033 $17,590One-time Spending 41 46 20One-time Spending/Reductions -236 -118 0Pay-as-you-go Capital 17 63 47Appropriations to Reserve Fund 85 235 100Total Spending $16,156 $17,260 $17,756
Cash Balance/Shortfall $385 -$209 -$544
StructuralBalance (Ongoing Revenues Less Operating Costs) -$33 -$429 -$377Ratio (Ongoing Revenues/Operating Costs) 99.8% 97.5% 97.9%
Reserve Fund ActivityAppropriations to Rainy Day Fund $50 $235 $50Transfers to General Fund 0 0 0
Estimated Rainy Day Fund Balance – June 30 $832 $999 $1,059
$1,217 $789 $515
Rainy Day Fund Balance In Excess of 5% $22 $167 $199
Appropriations, Deficiencies, and Cost Containment
Total Cash (Rainy Day Fund and General Fund Balance)
($ in Millions)Fiscal 2016-2018
General Fund: Recent History and Outlook
35

"Current as of December 13, 2016"
Estimated Ending Fund Balance (July 2016) $363.3
RevenuesFiscal 2016 Closeout -$250.5BRE Revisions (September and December 2016) -426.3GAAP Adjustment 47.4Tax Credit Reimbursements/Other 27.3
Subtotal -$602.0
SpendingFiscal 2016 Closeout Reversions $83.7Targeted Fiscal 2017 Reversions 97.5BPW Withdrawn Appropriations (November 2016) 82.3Estimated Fiscal 2017 Deficiencies -234.2
Subtotal $29.3
Estimated Closing Fund Balance (December 2016) -$209.4
GAAP: generally accepted accounting principles
Fiscal 2017 Fund Balance Reconciliation
BPW: Board of Public WorksBRE: Board of Revenue Estimates
($ in Millions)
36

"Current as of December 13, 2016"
Medicaid: Fiscal 2016 behavioral health costs carried into fiscal 2017 primarily forsubstance use disorder services ($10.7 million); and fiscal 2017 deficiencies($114.1 million). $124.9
Long-term Liabilities: Developmental Disabilities Administration federal fund auditdisallowance for residential habilitation services ($30.3 million) and Department ofHuman Resources (DHR) Temporary Assistance for Needy Families shortfall($9.8 million). $40.1
DHR: Underattainment of federal funds throughout the department based on the mostrecent actuals. $32.8
Other Operating Expenses: Fiscal 2016 costs carried into fiscal 2017 ($6.9 million)and fiscal 2017 deficiencies ($8.6 million). $15.5
Maryland State Department of Education: Child care subsidy costs based on revisedfederal reimbursement methodology. $12.2
Public Safety and Correctional Services: Cell phone managed access system($6.7 million) and State Law Enforcement Officers Labor Alliance collective bargainingcosts ($1.0 million). $7.7
Behavioral Health Administration: Service costs for the uninsured. $3.5
Impact of 2016 Legislation $3.0
Anticipated Fiscal 2017 Savings: Developmental Disabilities Administration lowerprogram costs based on most recent actuals ($5.6 million). -$5.6
Total Deficiencies $234.2
Potential Fiscal 2017 General Fund Deficiencies ($ in Millions)
37

Fiscal 2018 Baseline Budget Forecast Assumptions Baseline Budget Concepts • The baseline budget is an estimate of the cost of government services in the next
budget year based on a set of assumptions.
• Assumptions include that current laws, policies, and practices are continued; federal mandates and multi-year commitments are observed; legislation adopted at the prior session is funded; and full-year costs of programs, rate increases, and any other enhancements started during the previous year are included.
• Major inflation assumptions include natural gas (6.7%), gas/oil (6.1%),
medical care and medicine/drugs at State facilities (3.4%), utilities/electricity (2.8%), postage (2.6%), and food (2.3%).
• Employee compensation costs include:
• a general salary increase of 1.0% effective July 2017, and funding for employee increments on the regular July-January schedule;
• employee and retiree health insurance inflation (4.3%); and • employee retirement costs (0.4%).
• The higher education grant is calculated primarily on growth in mandatory costs and assuming a 3.0% tuition increase.
Caseload Assumptions
FY 2016 FY 2017 FY 2018
% Change FY 2017-2018
Pupil Enrollment* 842,229 845,861 853,173 0.9% Medicaid 853,863 899,028 916,410 1.9% Children’s Health 134,931 148,424 152,877 3.0% Expansion under Affordable Care Act 233,128 282,084 290,547 3.0% Temporary Cash Assistance 56,115 51,649 48,950 -5.2% Foster Care/Adoption/Guardianship 13,410 13,238 13,068 -1.3% Adult Prison Population 20,576 20,642 20,642 0.0%
* Data for fiscal 2016, 2017, and 2018 reflect September 2014, September 2015, and September 2016 (est.) full-time equivalent enrollments.
38

"Current as of December 13, 2016"
FY 2016 FY 2017Working Adj. Leg. FY 2018
Category Appropriation Appropriation Baseline $ Change % Change
Debt Service $252.4 $283.0 $231.0 -$52.0 -18.4%
County/Municipal 254.7 261.1 278.1 17.0 6.5%Community Colleges 297.5 314.3 321.0 6.7 2.1%Education/Libraries 5,827.5 5,925.6 5,952.3 26.7 0.5%Health 45.7 49.5 53.4 3.9 7.9%Aid to Local Governments $6,425.3 $6,550.6 $6,604.8 $54.2 0.8%
Foster Care Payments $185.2 $177.8 $182.8 $5.0 2.8%Assistance Payments 61.9 64.5 53.1 -11.4 -17.6%Medical Assistance 2,646.4 2,905.6 3,333.1 427.4 14.7%Property Tax Credits 81.5 82.3 78.7 -3.6 -4.4%Entitlements $2,974.9 $3,230.2 $3,647.7 $417.4 12.9%
Health $1,316.3 1,377.3 $1,453.0 $75.7 5.5%Human Resources 359.0 382.2 414.8 32.6 8.5%Children’s Cabinet Interagency Fund 22.5 16.6 19.7 3.1 18.7%Juvenile Services 272.5 276.4 286.6 10.2 3.7%Public Safety/Police 1,479.2 1,525.9 1,580.0 54.1 3.5%Higher Education 1,348.9 1,406.7 1,495.5 88.7 6.3%Other Education 411.5 420.6 466.4 45.7 10.9%Agriculture/Natural Res./Environment 113.4 122.9 130.8 7.9 6.4%Other Executive Agencies 673.3 674.5 710.3 35.8 5.3%Judiciary 452.9 481.7 500.4 18.7 3.9%Legislative 84.5 89.2 89.8 0.7 0.8%Across-the-board Cuts -0.2 0.0 0.0 0.0 n/aState Agencies $6,534.0 $6,774.0 $7,147.3 $373.3 5.5%Anticipated Deficiencies (1) $41.3 $234.2 $0.0 -$234.2 n/a
Total Operating $16,227.9 $17,072.0 $17,630.7 $558.7 3.3%Capital (2) $26.5 $72.1 $55.6 -$16.5 -22.8%Subtotal $16,254.4 $17,144.1 $17,686.4 $542.3 3.2%Reserve Funds $72.5 $155.4 $100.0 -$55.4 -35.6%Appropriations $16,326.9 $17,299.5 $17,786.4 $486.9 2.8%Reversions -$87.0 -$39.8 -$30.0 $9.8 -24.6%Grand Total $16,239.9 $17,259.7 $17,756.4 $496.7 2.9%
(1) Anticipated deficiencies for fiscal 2017. Deficiencies in the fiscal 2016 working appropriation are for prior years. (2) Includes the Sustainable Communities Tax Credit Reserve Fund.
Note: The fiscal 2016 working appropriation includes $207.3 million in deficiencies and $371.6 million in targeted reversions. The fiscal 2017adjusted legislative appropriation reflects language restrictions of $137.6 million of which $49.6 million is expected to be spent by the Governor for anet anticipated reversion of $88.0 million. It also reflects actions taken by the Board of Public Works in November 2016 which reducedgeneral fund spending by $82.3 million and increased reversions by $9.8 million.
State Expenditures – General Funds($ in Millions)
FY 2017 to FY 2018
39

"Current as of December 13, 2016"
FY 2016 FY 2017Working Adj. Leg. FY 2018
Category Appropriation Appropriation Baseline $ Change % Change
Debt Service $1,402.0 $1,485.6 $1,581.0 $95.4 6.4%
County/Municipal 534.7 603.2 667.9 64.7 10.7%Community Colleges 297.5 314.3 321.0 6.7 2.1%Education/Libraries 6,215.4 6,384.5 6,518.4 133.9 2.1%Health 45.7 49.5 53.4 3.9 7.9%Aid to Local Governments $7,093.2 $7,351.4 $7,560.7 $209.2 2.8%
Foster Care Payments $190.1 $180.0 $187.1 $7.1 3.9%Assistance Payments 78.5 77.8 64.4 -13.4 -17.2%Medical Assistance 3,644.9 3,852.4 4,283.5 431.1 11.2%Property Tax Credits 81.5 82.3 78.7 -3.6 -4.4%Entitlements $3,994.9 $4,192.6 $4,613.8 $421.2 10.0%
Health $1,804.7 $1,895.3 $1,926.8 $31.6 1.7%Human Resources 449.6 480.3 515.4 35.1 7.3%Children’s Cabinet Interagency Fund 22.5 16.6 19.7 3.1 18.7%Juvenile Services 277.4 280.3 290.4 10.2 3.6%Public Safety/Police 1,700.9 1,750.7 1,810.0 59.3 3.4%Higher Education 5,557.1 5,696.9 5,852.5 155.6 2.7%Other Education 471.5 487.5 533.1 45.6 9.4%Transportation 1,766.1 1,807.2 1,913.8 106.6 5.9%Agriculture/Natural Res./Environment 366.7 402.4 430.0 27.7 6.9%Other Executive Agencies 1,360.7 1,375.7 1,393.2 17.5 1.3%Judiciary 517.6 541.0 558.1 17.1 3.2%Legislative 84.5 89.2 89.8 0.7 0.8%Across-the-board Cuts -0.2 0.0 0.0 0.0 n/aState Agencies $14,379.2 $14,822.9 $15,332.9 $510.0 3.4%Anticipated Deficiencies (1) $35.9 $244.4 $0.0 -$244.4 -100.0%
Total Operating $26,905.2 $28,096.8 $29,088.3 $991.5 3.5%
Capital (2) $1,861.2 $2,036.6 $2,127.6 $91.0 4.5%– Transportation 1,580.3 1,650.8 1,760.5 109.6 6.6%– Environment 193.7 220.1 164.0 -56.1 -25.5%– Other 87.1 165.7 203.1 37.5 22.6%
Subtotal $28,766.3 $30,133.4 $31,215.9 $1,082.5 3.6%Reserve Funds $72.5 $155.4 $100.0 -$55.4 -35.6%Appropriations $28,838.8 $30,288.7 $31,315.9 $1,027.1 3.4%Reversions -$87.0 -$39.8 -$30.0 $9.8 -24.6%Grand Total $28,751.8 $30,249.0 $31,285.9 $1,036.9 3.4%
(2) Includes the Sustainable Communities Tax Credit Reserve Fund.
Note: The fiscal 2016 working appropriation includes $200.5 million in deficiencies and $371.6 million in targeted reversions. The fiscal 2017adjusted legislative appropriation reflects language restrictions of $170.1 million of which $76.6 million is expected to be spent by the Governor fora net anticipated reversion of $93.5 million. It also reflects actions taken by the Board of Public Works in November 2016 which reducedgeneral fund spending by $83.3 million and increased reversions by $9.8 million.
State Expenditures – State Funds($ in Millions)
FY 2017 to FY 2018
(1) Anticipated deficiencies for fiscal 2017. Deficiencies in the fiscal 2016 working appropriation are for prior years.
40

“Current as of December 13, 2016”
Components of General Fund Budget Change ($ in Millions)
Summary of Budget Growth Compared to Legislative Appropriation Dollars Share of Growth
Ongoing Requirements/Entitlements $419.6 52.9% State Agency Costs 373.3 47.1% Growth in Operating Budget, Including Anticipated Deficiencies $792.9
Pay-as-you-go (PAYGO) -$16.5 Appropriation to Reserve Fund -55.4 Total Baseline Increase in State Expenditures $721.0 Deficiency Appropriations -$234.2 Total $486.9 Ongoing Requirements/Entitlements Impact of 2016 Legislation Chapter 740 – Teacher Induction, Retention, and Advancement $8.2 Chapter 32 – Public Schools Opportunities Advancement 7.5 Chapter 738 – Additional Disparity Grant 5.3 Chapter 33 – Next Generation Scholars 4.9 Chapter 683 – Preschool Development Grants 3.7 Chapter 714 – Enoch Pratt Free Library 3.0 Chapter 696 – Food Stamp State Supplement 2.9 Chapter 516 – Internet Crimes Against Children Task Force 2.0 Chapter 549 – Regional, State, and County Library Funding 0.8 Chapter 519 – Community Law Enforcement Fund 0.5 Chapter 681 – Robotics Grant 0.3
Other Changes Medical Assistance $427.4 One-time local teacher retirement offset 20.0 Disparity Grant Formula 9.5 Education Aid Formulas 8.8 Community College Formula Plus Miscellaneous Grants 6.7
Foster Care Payments – Caseload trends versus appropriation ($2.2 million) and provider rate
increase ($2.8 million) 5.0 Local Health Department Funding 3.9 Library Aid Formulas 1.2 Other Aid -0.4 Property Tax Credit Programs -3.6 Assistance Payments – Declining enrollment trends -14.3 Teachers and Librarians Retirement Payments -31.7
Debt Service – Available bond premiums reduce need for general funds to supplement
property tax revenues -52.0
State Agency Costs Statewide Personnel Expenses (Excluding Higher Education) Merit Pay (increments) Including Fiscal 2017 Annualization $51.2 General Salary Increase (1.0%) 21.3 Health Insurance 14.1 Employee Retirement 3.8
41

“Current as of December 13, 2016”
Components of Budget Change (cont.)
Impact of 2016 Legislation Chapter 13 – Prince George’s County Regional Medical Center $15.0 Chapter 25 – University of Maryland Strategic Partnership 10.0 Chapter 515 – Justice Reinvestment Act (including 104 full-time equivalent (FTE) regular positions) 6.3 Chapter 10 – Grant for Next Generation Farmland Acquisition Program 5.0 Chapter 689 – State matching contribution under the College Affordability Act 5.0 Chapter 654 – Maryland Corps Program 1.8 Chapter 713 – Morgan State University Office of Technology transfer 1.0 Chapter 91 – New judges and associated staff (12 FTE regular positions) 0.9
Significant Fiscal 2017 Deficiencies Carried Over into Fiscal 2018 $38.7
Offset of One-time November 2016 Board of Public Works Actions $25.4
Other Major Agency Programmatic and Operating Expenses
University System of Maryland – General funds required to cover growth in base costs not
provided for through tuition and Higher Education Investment Fund (HEIF) revenue $71.1
Developmental Disabilities Administration – Mandated 3.5% provider rate increase ($20.5 million),
fiscal 2018 expansion ($10.1 million), and annualization of fiscal 2017 expansion ($9.2 million) 39.9
Maryland State Department of Education – Additional child care subsidies based on change
in federal authorization 9.5 Major Information Technology Projects 8.3 Maryland Higher Education Commission – Educational Excellence Awards 5.6 Sellinger Formula for Aid to Private Colleges and Universities 5.4 Subcabinet Fund Competitive Funding 3.1 Archives – Lower special fund support for land records 3.0 Department of Natural Resources – Park Service mandated funding 1.9 Behavioral Health Administration – Behavioral health services for the uninsured 1.8
Morgan State University – General funds required to cover growth in base costs not provided
for through tuition and HEIF revenue 1.4 Department of State Police – Backfill of Section 20 reduction 1.1 Department of Juvenile Services – Provider rate increase 1.0 Department for Public Safety and Correctional Services – Cell Phone Managed Access maintenance 1.0 Maryland School for the Deaf Formula Adjustment 0.9 St. Mary’s College of Maryland – Elimination of one-time grant -1.1 Baltimore City Convention Center Operating Subsidy -1.2 Rural Maryland Council – Elimination of one-time grant -2.0 General Fund Support for Video Lottery Terminal operations -2.3 Department of Health and Mental Hygiene – Removal of privatization contracts -3.7 Enterprise Budget System costs -6.3
Other 35.5
Reserve Fund and PAYGO
Impact of 2016 Legislation PAYGO – Chapter 29 – Baltimore Regional Neighborhood Initiative $12.0 PAYGO – Chapter 31 – Seed Community Development Anchor Institution Fund 5.0
PAYGO – Chapter 30 – Strategic Demolition and Smart Growth Impact Fund (increase over
fiscal 2017) 4.1 PAYGO – Chapters 698/699 – Shelter and Transitional Housing Facilities Grant 3.0
Other Changes PAYGO – Reduction of one-time PAYGO funding ($46.2 million) and other changes ($1.4 million) -$40.6
Rebuild of reserve fund to fund $50.0 million for the Rainy Day Fund per statute and
$50.0 million pension sweeper -55.4
Total $721.0
42

Cur
rent
as
of D
ecem
ber 1
3, 2
016
% A
vera
geFY
201
7FY
201
8FY
201
9FY
202
0FY
202
1FY
202
2An
nual
Wor
k. A
ppB
asel
ine
Est.
Est.
Est.
Est.
Cha
nge
Rev
enue
sO
peni
ng F
und
Bala
nce
$385
$0$0
$0$0
$0O
ne-ti
me
Rev
enue
s/Le
gisl
atio
n62
00
00
0Su
btot
al O
ne-ti
me
Rev
enue
$446
$0$0
$0$0
$0O
ngoi
ng R
even
ues
$16,
604
$17,
212
$17,
767
$18,
411
$19,
089
$19,
818
Subt
otal
Ong
oing
Rev
enue
$16,
604
$17,
212
$17,
767
$18,
411
$19,
089
$19,
818
3.6%
Tota
l Rev
enue
s &
Fun
d B
alan
ce$1
7,05
0$1
7,21
2$1
7,76
7$1
8,41
1$1
9,08
9$1
9,81
83.
6%O
ngoi
ng S
pend
ing
Ope
ratin
g Sp
endi
ng$1
7,48
7$1
8,11
7$1
9,12
3$2
0,04
3$2
1,02
8$2
1,91
5Ed
ucat
ion
Trus
t Fun
d1-4
63-5
66-5
54-5
62-5
70-5
79M
ulti-
year
Com
mitm
ents
939
2414
149
Subt
otal
Ong
oing
Spe
ndin
g$1
7,03
3$1
7,59
0$1
8,59
4$1
9,49
5$2
0,47
1$2
1,34
45.
0%O
ne-ti
me
Spen
ding
PAYG
O C
apita
l$5
3$4
7$9
3$6
7$9
3$2
1O
ne-ti
me
Red
uctio
ns-1
000
00
00
Legi
slat
ion/
One
-tim
e Ad
just
men
ts/S
wap
s38
200
00
0Ap
prop
riatio
n to
Res
erve
Fun
d23
510
050
5083
83Su
btot
al O
ne-ti
me
Spen
ding
$227
$167
$143
$117
$176
$104
Tota
l Spe
ndin
g$1
7,26
0$1
7,75
6$1
8,73
6$1
9,61
2$2
0,64
7$2
1,44
94.
8%En
ding
Bal
ance
-$20
9-$
544
-$96
9-$
1,20
1-$
1,55
8-$
1,63
1
Rai
ny D
ay F
und
Bala
nce
$998
$1,0
59$1
,120
$1,1
87$1
,256
$1,3
33Ba
lanc
e ov
er 5
% o
f GF
Rev
enue
s16
819
823
126
730
234
1.7
As %
of G
F R
even
ues
6.01
%6.
15%
6.30
%6.
45%
6.58
%6.
72%
Stru
ctur
al B
alan
ce-$
429
-$37
7-$
827
-$1,
084
-$1,
382
-$1,
527
GF:
Gen
eral
Fun
dPA
YGO
: pa
y-as
-you
-go
1 Educ
atio
n Tr
ust F
und
is s
uppo
rted
by re
venu
es fr
om v
ideo
lotte
ry te
rmin
als
and
tabl
e ga
mes
.
Gen
eral
Fun
d B
udge
t Out
look
Fisc
al 2
017-
2022
($ in
Mill
ions
)
43

"Cur
rent
as
of D
ecem
ber 1
3, 2
016"
$15,
500
$16,
500
$17,
500
$18,
500
$19,
500
$20,
500
$21,
500
2015
2016
2017
2018
2019
2020
2021
2022
The
Stru
ctur
al S
hort
fall
Gro
ws
to $
1.5
Bill
ion
by F
isca
l 202
2Fi
scal
201
5-20
22($
in M
illio
ns)
Ong
oing
Spe
ndin
gO
ngoi
ng R
even
ues
44

The
Stru
ctur
al P
robl
em
Fore
cast
Ann
ual I
ncre
ase
Fis
cal 2
018-
2022
Ope
ratin
g Sp
endi
ng5.
00%
Ong
oing
Rev
enue
s3.
60%
Gro
wth
Gap
1.40
%
Annu
al B
udge
t Gap
$270
Milli
on
45

Review
Evolution of a Problem ($ in Millions)
Revenue Write-down Exacerbates Structural Deficit
Fiscal 2018 Fiscal 2021
Structural Gap at Close of Session (DLS 6/16) -$30 -$519 BRE Revenue Revisions (BRE 9/16) -413 -527 DLS Spending Revisions (DLS 10/16) 104 -151 Savings from BPW Reductions (11/16) 18 Revised Structural Gap (DLS 10/16) -$339 -$1,179
DLS Estimate
June 2016 DLS Estimate October 2016
Average Annual Growth Fiscal 2018 to 2021 Revenues 3.8% 3.7% Ongoing Spending 4.6% 5.1% Gap -0.8% -1.4%
BPW: Board of Public Works BRE: Board of Revenue Estimates DLS: Department of Legislative Services
$551
$384 $384 $384 $384$363
$196
-$169-$287
-$196
$167
$0
-$445 -$486 -$486-$600
-$400
-$200
$0
$200
$400
$600
$800
2016 Session 2016 Closeout September BRE DLS Baseline After BPWActionFY 2016 FY 2017 FY 2018
46

Part 5
Local Government Assistance
47

48

Public Schools $6,426.2 85.2%
County/Municipal 667.9 8.8%
Community Colleges 321.0 4.3%
Libraries 78.3 1.0%
Local Health 53.4 0.7%
Total $7,546.8 100.0%
Public Schools $116.0 1.8%
County/Municipal 64.7 10.7%
Community Colleges 6.7 2.1%
Libraries 4.3 5.7%
Local Health 3.9 7.9%
Total $195.5 2.7%
State Aid by Governmental EntityAmount and Percent of Total
State Funds($ in Millions)
FY 2018
Change in State Aid
FY 2018State Aid Amount % of Total
Aid Change % Change
State Funds($ in Millions)
49

FY 2017-2018% Change
Public SchoolsFoundation Program $2,947.1 $2,962.0 $3,006.3 $44.3 1.5%Supplemental Grant 46.6 46.6 46.6 0.0 0.0%Geographic Cost Index 68.1 136.9 139.1 2.2 1.6%Net Taxable Income Education Grants 23.8 39.7 50.9 11.2 28.2%Foundation – Special Grants 0.1 19.4 0.0 -19.4 -100.0%Compensatory Aid 1,305.1 1,309.1 1,362.2 53.1 4.1%Student Transportation 266.2 270.8 275.7 4.9 1.8%Special Education – Formula Aid 276.0 279.6 283.8 4.2 1.5%Special Education – Nonpublic Placements 130.5 126.6 126.1 -0.5 -0.4%Limited English Proficiency Grants 217.2 227.0 246.1 19.1 8.4%Guaranteed Tax Base 53.8 54.5 52.1 -2.4 -4.5%Aging Schools Program 6.1 0.0 6.1 6.1Head Start/Pre-kindergarten 6.1 6.1 9.8 3.7 60.2%Other Education Programs 74.4 64.5 85.1 20.6 31.9%Subtotal Direct Aid $5,421.1 $5,543.0 $5,689.8 $146.9 2.6%Retirement Payments $729.3 $767.3 $736.4 -$30.9 -4.0%Total Public School Aid $6,150.4 $6,310.2 $6,426.2 $116.0 1.8%
LibrariesLibrary Aid Formula $35.4 $36.4 $40.7 $4.3 11.9%State Library Network 16.6 17.0 17.7 0.7 4.1%Subtotal Direct Aid $52.0 $53.4 $58.4 $5.0 9.4%Retirement Payments $19.7 $20.7 $19.9 -$0.8 -3.7%Total Library Aid $71.7 $74.0 $78.3 $4.3 5.7%
Community CollegesCommunity College Formula $222.7 $234.4 $242.3 $7.9 3.4%Other Programs 31.4 33.5 34.0 0.5 1.6%Subtotal Direct Aid $254.1 $267.9 $276.3 $8.4 3.2%Retirement Payments $42.0 $46.5 $44.7 -$1.8 -3.8%Total Community College Aid $296.1 $314.3 $321.0 $6.7 2.1%
Local Health Grants $45.7 $49.5 $53.4 $3.9 7.9%
County/Municipal AidTransportation $201.5 $209.6 $212.0 $2.3 1.1%Public Safety 117.9 126.7 129.9 3.2 2.6%Program Open Space 23.5 27.2 40.7 13.5 49.7%Disparity Grant 129.8 132.8 147.7 14.9 11.2%Gaming Impact Grants 38.6 62.9 93.0 30.2 48.0%Teacher Retirement Supplemental Grant 27.7 27.7 27.7 0.0 0.0%Other Grants 17.4 16.3 16.9 0.6 3.8%Total County/Municipal Aid $556.3 $603.2 $667.9 $64.7 10.7%
Total State Aid $7,120.2 $7,351.2 $7,546.8 $195.5 2.7%
State Aid by Major ProgramsFiscal 2016-2018
State Funds($ in Millions)
FY 2016 FY 2017FY 2018Baseline
FY 2017-2018$ Change
50

Annu
al C
hang
e in
Sta
te A
id to
Loc
al G
over
nmen
tsFi
scal
201
1-20
18
3.1%
1.2%
2.1%
3.0%
2.5%
1.2%
3.2%
2.7%
2011
2012
2013
2014
2015
2016
2017
2018
51

52

Part 6
Capital Program
53

54

“Current as of December 13, 2016”
State Debt Policy
Capital Debt Affordability Committee Recommends Decreasing Authorizations • The Capital Debt Affordability Committee (CDAC) reviews State debt policy each
year and issues a recommendation for the following legislative session by October 1. CDAC voting members are the State Treasurer, Comptroller, Secretary of Budget and Management, Secretary of Transportation, and an individual appointed by the Governor. The chairs of the Senate Budget and Taxation and House Appropriations capital budget committees are also on the committee.
• CDAC recommends authorizing $995 million in general obligation (GO) bonds for
the fiscal 2018 capital program. For planning purposes, the committee also recommends maintaining annual expenditures at $995 million through fiscal 2026.
State Debt Is within Affordability Ratios • CDAC’s policy is that State tax-supported debt outstanding should not exceed
4.0% of Maryland personal income, and State tax-supported debt service payments should not exceed 8.0% of State revenues.
• The proposed level of GO bond authorizations are affordable. However, the State
is closer to breaching these ratios than it was one year ago. The debt ratio and revenues are inversely related. Recent write-downs of general fund revenues increased the debt service ratio so that it peaks at 7.78%.
State Affordability Ratios Fiscal 2017-2022
Fiscal Year Debt Outstanding not to Exceed
4% of Personal Income Debt Service not to
Exceed 8% of Revenues
2017 3.54% 7.58% 2018 3.50% 7.78% 2019 3.43% 7.78% 2020 3.32% 7.59% 2021 3.20% 7.53% 2022 3.08% 7.54%
55

“Current as of December 13, 2016”
State Debt Policy (cont.)
Annuity Bond Fund Forecast
Fiscal 2017-2022 ($ in Millions)
2017 2018 2019 2020 2021 2022 Special Fund Revenues State Property Tax Receipts $780 $799 $808 $816 $825 $834 Bond Sale Premiums1 50 49 3 0 0 0 Other Revenues 3 3 3 3 3 3 Prior Year Balance 209 151 1 1 1 1 Subtotal Special Fund Revenues $1,042 $1,002 $816 $821 $829 $838 General Funds $283 $231 $477 $501 $515 $544 Transfer Tax Special Funds 7 7 7 7 7 7 Federal Funds 11 11 11 11 10 9 Total Revenues $1,343 $1,251 $1,311 $1,340 $1,361 $1,399 Debt Service Expenditures $1,192 $1,250 $1,310 $1,339 $1,359 $1,397 ABF End-of-year Fund Balance $151 $1 $1 $1 $1 $1
ABF: Annuity Bond Fund 1Estimated bond sale premiums total $49.7 million in March 2017, $25.5 million in summer 2017, $23.1 million in March 2018, and $3.0 million in summer 2018. Source: Department of Legislative Services, October 2016 • From fiscal 2017 to 2022, total debt service costs increase 3.2% annually. State
property tax revenues increase 1.4% annually. • Fiscal 2018 begins with a $151 million fund balance, which can be used to reduce
the general fund appropriation. • From fiscal 2019 to 2022, general fund appropriations are expected to increase
4.5% annually.
• If interest rates remain low throughout the forecast period, the Department of Legislative Services projects that the bond sales would generate upwards of $90 million in premiums per year, which offsets the general fund appropriation correspondingly.
56

“Current as of December 13, 2016”
State Debt Policy (cont.)
Effect of Increasing Authorizations by 1% Annually
($ in Millions)
Fiscal Year Authorization
Additional Debt
Service Debt Service to
Revenues Debt Outstanding to
Personal Income
2017 $995 $0 7.58% 3.54% 2018 1,005 0 7.78% 3.51% 2019 1,015 0 7.78% 3.44% 2020 1,025 1 7.60% 3.33% 2021 1,035 2 7.54% 3.22% 2022 1,045 4 7.55% 3.11%
Effect of Increasing Authorizations to 2015 SAC Level
($ in Millions)
Fiscal Year Authorization
Additional Debt
Service Debt Service to
Revenues Debt Outstanding to
Personal Income 2017 $995 $0 7.58% 3.54% 2018 1,065 1 7.78% 3.51% 2019 1,075 2 7.78% 3.45% 2020 1,085 5 7.61% 3.35% 2021 1,095 9 7.57% 3.25% 2022 1,105 16 7.60% 3.15%
SAC: Spending Affordability Committee
• State property tax revenues are projected to increase 1.4% annually in the
Annuity Bond Fund forecast.
57

“Current as of December 13, 2016”
State Debt Policy (cont.)
Total Cost of Authorizing $10 Million in Bonds
($ in Millions)
• Debt service costs peak at $1.05 million in the eighth year and remain at about
$1.0 million until the costs begin declining in the seventeenth year.
• The slow increase in debt service costs is attributable to: • State policy to pay only debt service in the first two years after bonds are
issued; and
• State policy to issue bonds when the cash flow is needed, so that all bonds are not issued in the first year after the authorization. CDAC assumes that 31% of bonds are issued in the first year, 25% in the second year, 20% are issued in the third year, 15% are issued in the fourth year, and 9% are issued in the fifth year.
$0.0
$0.2
$0.4
$0.6
$0.8
$1.0
$1.2
1 2 3 4 5 6 7 8 9 10 11 12 13 14 15 16 17 18 19 20
Years
58

Capital Program General Fund Pay-as-you-go Outlook • The Board of Public Works (BPW) approved reductions and the Administration’s
decision to not appropriate general funds restricted in the State Reserve Fund reduce general fund support for the fiscal 2017 capital program from $122.0 million to $62.3 million.
• Commitments made in the 2016 session are forecasted to require significantly
more general fund pay-as-you-go (PAYGO) than currently programmed for fiscal 2018 and through the planning period covered by the 2016 Capital Improvement Program (CIP).
• The Board of Revenue Estimates (BRE) recent downward revision in general fund
revenue estimates for fiscal 2017 and 2018 could constrain general fund support of the capital program in the near term. To the extent that general obligation (GO) bonds are considered a source of replacement funds for fiscal 2017 reductions and future commitment, this presents another pressure on the already strained GO bond portion of the capital program.
General Fund PAYGO Fiscal 2017 Legislative Appropriation and Working Appropriation;
Fiscal 2018 Baseline and Fiscal 2018 CIP; Fiscal 2018-2021 CIP and Forecast ($ in Millions)
$122.0
$62.3 $10.0 $55.6 $40.0
$288.8
$0
$50
$100
$150
$200
$250
$300
$350
FY 2017Legislative
Appropriation
FY 2017Working
Appropriation
FY 2018 CIP FY 2018Baseline
FY 2018-2021CIP
FY 2018-2021Forecast
CIP: Capital Improvement Program PAYGO: pay-as-you-go
Note: The fiscal 2017 legislative and working appropriations reflect new general obligation bond authorizations.
Source: 2016 capital budget bill; 2016 CIP; Department of Legislative Services general fund forecast and fiscal 2018 baseline budget
59

Capital Program (cont.)
• Restricted State Reserve Fund General Fund PAYGO: At the 2016 session,
the legislature restricted $42.9 million available in the State Reserve Fund to be used only to fund specified capital programs and projects in fiscal 2017. Shortly after the conclusion of the 2016 session, the Administration announced that the restricted funds would not be appropriated. At the time, the Administration advised that a portion of the withheld funds would be replaced but provided no detail as to the timing or fund source.
Status of Restricted PAYGO General Funds in Reserve Fund Fiscal 2017
($ in Millions)
Program
Fiscal 2017 General
Assembly Fiscal 2017 Governor
Fiscal 2018 Replacement
Governor
BPW: Facilities Renewal Program $15.000 $0 $15.000 DoIT: Public Safety Communication System 9.190 0 9.190 DPSCS: Demolition of Baltimore City Correctional Complex 6.581 0 0
MSDE: Aging Schools Program 6.109 0 0 MDA: Agricultural Cost Share Program 6.000 0 6.000 Total $42.880 $0 $30.190 BPW: Board of Public Works DoIT: Department of Information Technology DPSCS: Department of Public Safety and Correctional Services MDA: Maryland Department of Agriculture MSDE: Maryland State Department of Education PAYGO: pay-as-you-go Note: The Administration advised that $30.2 million would be made available as replacement funds but no detail has been provided concerning the timing or fund source. To the extent the recent Board of Revenue Estimates downward revision in general fund revenue estimates for fiscal 2017 and 2018 constrains the use of general funds to support the capital program, general obligation bonds could be a source of replacement funds. Source: Department of Budget and Management
• BPW’s November 2016 Action Reduces Fiscal 2017 General Fund PAYGO:
The general fund portion of the fiscal 2017 capital program is also reduced by $16.8 million, consisting of $7.0 million from the Department of Housing and Community Development and a $9.8 million reversion from the Maryland Department of the Environment (MDE). The Administration indicates that it plans to replace only the MDE general fund reduction with taxable GO bonds in the capital budget submitted at the 2017 session.
60

Capital Program (cont.)
Status of Withdrawn Fiscal 2017 General Fund PAYGO ($ in Millions)
Program
Fiscal 2017 General
Assembly
Fiscal 2017
Governor
Fiscal 2018 Replacement
Governor
DHCD: Neighborhood Business Development Program $3.400 $2.900 $0 DHCD: Community Legacy Program 3.905 2.905 0 DHCD: Rental Housing Program 10.000 9.000 0 DHCD: Housing Programs 8.500 7.600 0 DHCD: Special Loan Programs 2.100 0 0 DHCD: Partnership Rental Housing Program 6.000 5.000 0 DHCD: Housing and Building Energy Program 1.000 .500 0 MDE: Water Quality Revolving Loan Program 6.792 0 6.792 MDE: Drinking Water Revolving Loan Program 3.003 0 3.003 DHCD: Department of Housing and Community Development MDE: Maryland Department of the Environment PAYGO: pay-as-you-go Source: Department of Budget and Management
• General Fund PAYGO Forecast – Commitments Exceed Programmed Resources: General fund PAYGO commitments made in the 2016 session would require $55.6 million in fiscal 2018 compared to the $10.0 million currently programmed in the 2016 CIP. From an out-year perspective, these same commitments would require a total of $288.9 million through fiscal 2021 while only $40.0 million is currently programmed.
61

Capital Program (cont.)
General Fund PAYGO CIP Compared to Forecast
Fiscal 2018-2021 ($ in Millions)
Program 2018-2021
CIP 2018-2021 Forecast
MDP: Sustainable Communities Tax Credit $36.000 $36.000 DNR: Program Open Space – Transfer Tax Repayment
114.722
DHCD: Neighborhood Revitalization (CORE)
54.125 DHCD: Baltimore Regional Neighborhood Initiative
48.000
DHCD: Seed Community Development Anchor Institution Fund
20.000 DHCD: Shelter and Transitional Housing Program
12.000
MDE: Hazardous Substance Cleanup Program 4.000 4.000 Total $40.000 $288.847 CIP: Capital Improvement Program DHCD: Departmen of Housing and Community Development DNR: Department of Natural Resources MDE: Maryland Department of the Environment MDP: Maryland Department of Planning PAYGO: pay-as-you-go Note: The Department of Legislative Services general fund forecast assumes that general funds would be used to meet the new commitments made in the 2016 session consistent with information provided by the Administration in the 2016 session and with legislation establishing each mandate in the 2016 session. Each item is a candidate for general obligation bond funding to the extent general funds to support the capital progam are constrained. Source: Department of Legislative Services general fund forecast and fiscal 2018 baseline budget estimate The Capital Debt Affordability Committee Recommends Keeping New GO Bond Authorizations at $995 Million
The October 2016 Capital Debt Affordability Committee’s (CDAC) recommendation would keep new GO authorizations at $995 million annually through the planning period and continues the policy of scaled back annual authorizations. The 2015 Spending Affordability Committee (SAC) recommendation, recognizing the need to address the increasing reliance on general funds for debt service, established a limit on new GO bond authorizations that increased by 1% on a year-over-year basis. This moderate growth rate limits increases in GO bond authorizations to projected State property tax revenue increases. Since general funds and other State revenues are projected to increase at an annual rate in excess of 1%, the SAC recommendation reduces the ratio of debt service to revenues in the out-years.
62

Capital Program (cont.)
2015 and 2016 CDAC and 2015 SAC Recommended GO Bond
Authorization Levels Fiscal 2016-2024
($ in Millions)
CDAC: Capital Debt Affordability Committee GO: general obligation SAC: Spending Affordability Committee
Source: 2015 and 2016 CDAC report; 2015 SAC report • CDAC’s 2016 recommendation does not include the customary 3% annual inflation
adjustment. Without annual adjustments to account for the effects of inflation in the construction market, CDAC’s proposed level of annual out-year authorization is diminished.
2016 2017 2018 2019 2020 2021 2022 2023 2024CDAC Recommendation 2015 and
2016 $995 $995 $995 $995 $995 $995 $995 $995
SAC 2015 $1,055 $1,065 $1,075 $1,085 $1,095 $1,105 $1,115 $1,125FY 2016 and 2017 Legislative
Authorization $1,045 $995
$0
$200
$400
$600
$800
$1,000
$1,200
63

Capital Program (cont.)
CDAC Proposed New GO Bond Authorization Levels – Inflation Adjusted
Fiscal 2018-2024 ($ in Millions)
CDAC: Capital Debt Affordability Committee GO: general obligation Note: CDAC policy of 3% annual growth in new GO bond authorizations reflects policy of 2% construction inflation and 1% population growth. Source: 2016 CDAC report
FY 2018 FY 2019 FY 2020 FY 2021 FY 2022 FY 2023 FY 2024Inflation Adjusted (2% annual) $995.0 $975.5 $956.4 $937.6 $919.2 $901.2 $883.5
$0
$200
$400
$600
$800
$1,000
$1,200
64
Capital Program (cont.)
• Year-over-year construction inflation ranged from 4.4% in calendar 2011 to 2.5%
in calendar 2014. This measure declined precipitously to negative 2.73% in calendar 2015 attributed to a sharp decline in crude oil prices. Through September 2016, a tight construction labor market and wage increases brought about a steady increase of 3.95% relative to calendar 2015 measures. Overall, from calendar 2011 through the first nine months of 2016, regional construction inflation has increased at an average annual rate of 1.9%.
Annual Construction Cost Inflation Calendar 2011-2016
Source: Engineering News-Record Building and Construction Cost Indexes – City Cost Index Baltimore City
2011 2012 2013 2014 2015 2016Regional Building Cost Index
Baltimore 4.40% 3.90% 2.90% 2.50% -2.73% 3.95%
-4%-3%-2%-1%0%1%2%3%4%5%
65

Capital Program (cont.)
CDAC Recommended GO Bond Authorization Levels Are Insufficient to Meet the Commitments and Provide a Source of Replacement Funds
Capital commitments made in the 2016 session and other commitments that would use GO bonds as a source of replacement funds for withdrawn fiscal 2017 PAYGO general funds exceed the levels of GO bonds currently programmed and recommended in the forecast period covered by the 2016 CIP.
GO Bond Commitments Made in 2016 Session Exceed Programmed Authorization Levels
Fiscal 2018-2021 ($ in Millions)
CDAC: Capital Debt Affordability Committee CIP: Capital Improvement Program GO: general obligation Source: 2016 CIP; 2016 Capital Budget Bill
FY 2018 FY 2019 FY 2020 FY 2021Other Commitments $276.7 $45.7 $72.6 -$56.3CIP 2015 $994.5 $994.8 $994.9 $939.4CDAC 2016 $995.0 $995.0 $995.0 $995.0
-$200
$0
$200
$400
$600
$800
$1,000
$1,200
$1,400
66

Capital Program (cont.)
• Commitments Exceed Programmed GO Bond Authorization Levels: These
additional commitments include mandates established through legislation, capital programs and projects accelerated by the Administration and the General Assembly, preauthorization of projects not already included in the CIP, expressions of legislative intent through budget language, and replacement funds for BPW withdrawn appropriations. The impact these commitments could have on the fiscal 2018 capital budget depends upon how the Administration intends to treat each individual item but the estimated impact is approximately $276.6 million above what the CIP could accommodate in fiscal 2018 under the $995.0 million limit recommended by CDAC. This delta increases to a total of $338.6 million through fiscal 2021, the planning period covered by the 2016 CIP. Approximately $332.3 million in fiscal 2018 and a total of $627.5 million through fiscal 2021 would be needed above programmed GO bond authorization levels should GO bonds be used as a source of replacement funds for withdrawn fiscal 2017 PAYGO general funds and commitments made in the 2016 session forecasted to require the use of general funds.
Commitments Made in 2016 Session Exceed Programmed
General Obligation Bond Authorization Levels Fiscal 2018-2021 ($ in Thousands)
FY 2018 FY 2019 FY 2020 FY 2021
Projects Accelerated/Deferred $148,190 -$51,500 -$31,200 -$111,300 Projects Preauthorized 27,200 30,400 48,800 0 Bond Replacement BPW Reductions and Reserve Fund 30,795 0 0 0 Mandates 20,000 28,000 20,000 20,000 Expressions of Intent 23,750 23,750 20,000 20,000 Legislative and Administrative Local Initiatives 26,725 15,000 15,000 15,000 Subtotal $276,660 $45,650 $72,600 -$56,300
Potential Bond Replacement for General Fund PAYGO $55,625 $79,500 $51,000 $102,772
Total $332,285 $125,150 $123,600 $46,472
BPW: Board of Public Works PAYGO: pay-as-you-go
Note: Estimated out-year funding impacts for accelerated projects assume that items will be funded in useable phases such that no gaps exist in estimated project delivery timelines. Estimates for deferred projects reflect one-year deferral and funding in useable phases such that no gaps exist in the timing of funding and project delivery.
Source: 2016 Capital Improvement Program; Department of Legislative Services
67

68

Part 7
Transportation
69

70

Transportation Trust Fund Forecast
Transportation Trust Fund Forecast Comparison Fiscal 2016-2021 v. Fiscal 2017-2022 Six-year Totals
($ in Millions)
MDOT Final
2016-2021 MDOT Draft 2017-2022
Final-Draft
Variance DLS
2017-2022 MDOT/DLS Variance
Revenues
Taxes and Fees Motor Vehicle Fuel Taxes $7,424 $7,018 -$406 $6,785 -$233 Titling Taxes 5,423 5,545 122 5,557 12 Sales Tax – Rental Vehicles 207 215 9 215 0 Corporate Income Tax 1,051 1,066 15 1,066 0 Registration Fees 2,322 2,378 56 2,378 0 Miscellaneous Motor Vehicle Fees 1,835 1,864 29 1,864 0 Subtotal – Taxes and Fees $18,262 $18,086 -$175 $17,865 -$221
Other Revenues Operating Revenues $2,851 $2,820 -$31 $2,820 $0 Federal Operating Assistance 582 582 0 582 0 Bond Proceeds/Premiums 3,470 3,665 195 2,735 -930 Other 526 488 -38 488 0 Change in Fund Balance 119 -12 -131 -24 -12 Subtotal – Other Revenues $7,548 $7,543 -$5 $6,601 -$942
Total Revenues $25,810 $25,629 -$180 $24,467 -$1,163
Expenditures Debt Service $2,014 $2,351 $337 $2,181 -$171 Operating Budget 12,085 12,539 454 13,127 588 Deductions to Other Agencies 406 415 9 415 0 HUR and Local Grants 1,844 1,857 13 1,847 -10 State Capital Program 9,461 8,467 -994 6,897 -1,569
Total Expenditures $25,810 $25,629 -$181 $24,467 -$1,163
DLS: Department of Legislative Services HUR: Highway User Revenues MDOT: Maryland Department of Transportation
71

Transportation Trust Fund Forecast (cont.)
Observations • The six-year State capital program in the Maryland Department of Transportation
(MDOT) draft fiscal 2017-2022 Transportation Trust Fund (TTF) forecast is $994 million lower than its prior year six-year program. Lower estimated motor fuel tax revenue is only partially offset by increases in other revenue estimates and higher bond issuances with revenue down $180 million between the two forecasts. Additional spending, particularly for debt service ($337 million) and departmental operations ($454 million), is the primary cause of the reduction in the capital program.
• The Department of Legislative Services (DLS) fiscal 2017-2022 TTF forecast indicates that the State capital program in the MDOT draft forecast is still oversubscribed by $1.6 billion caused by the following: • Additional spending for departmental operations accounts for $588 million
of the reduction. The DLS forecast inflates out-year operational spending by the five-year average annual rate of increase through fiscal 2016. The budget committees instructed MDOT to use the five-year rate of change in its out-year operating projections but it chose not to do so;
• Lower motor fuel tax revenues account for a further $233 million of the reduction to the capital program. The largest difference between DLS and MDOT in this area is the estimate of the number of gallons that will be sold during the forecast period; and
• Bond issuances in the DLS forecast are $930 million less than in the MDOT
forecast. The reduction is necessary to maintain the net income to debt service coverage ratio of 2.5 that MDOT has adopted as its administrative policy (bond covenants require a minimum of 2.0 coverage.) If legislation is enacted increasing the amount of Highway User Revenues going to local governments, additional reductions to planned bond issuances will need to be made in order to maintain the minimum debt service coverage ratio.
72

Draft Consolidated Transportation Program
• The draft fiscal 2017 to 2022 Consolidated Transportation Program (CTP) reflects
$1.3 billion less in capital spending over the six-year period compared to the previous six-year plan. This results from the lower revenues and higher spending discussed previously.
Comparison of Six-year Capital Spending by Fund Source
Fiscal 2016-2022 ($ in Millions)
2016-2021 CTP Draft 2017-2022 CTP Change % Change
Special Funds $9,535.1 $8,397.3 -$1,137.8 -11.9% Federal Funds 4,956.5 4,968.1 11.6 0.2% Other Funds* 1,213.8 1,080.4 -133.4 -11.0% Total Funds $15,705.4 $14,445.8 -$1,259.6 -8.0%
CTP: Consolidated Transportation Program *Other Funds include funds from customer and passenger facility charges and certain types of federal aid that do not pass through the Transportation Trust Fund. Source: Maryland Department of Transportation 2016-2021 final CTP, 2017-2022 draft CTP • Just over 60% of the reduction is in State Highways with most of the reductions
occurring in the categories of major projects (-$332.7 million) and system preservation (-$375.9 million). This represents a 9.1% decrease in highway spending compared with the prior year six-year program. Even with the reductions, State highway capital spending accounts for almost 53.0% of the six-year program.
73

Draft Consolidated Transportation Program (cont.)
Comparison of Six-year Capital Spending by Mode Fiscal 2016-2022
($ in Millions)
2016-2021 CTP Draft 2017-2022 CTP Change % Change Administration $334.0 $246.3 -$87.7 -26.3% WMATA 1,581.3 1,583.8 2.5 0.2% State Highways 8,363.6 7,606.1 -757.5 -9.1% Port 909.1 852.0 -57.1 -6.3% Motor Vehicle 133.8 125.1 -8.7 -6.5% Mass Transit 3,744.1 3,620.4 -123.7 -3.3% Airport 639.0 412.2 -226.8 -35.5% Total $15,704.9 $14,445.9 -$1,259.0 -8.0% CTP: Consolidated Transportation Program WMATA: Washington Metropolitan Area Transit Authority Source: Maryland Department of Transportation 2016-2021 final CTP, 2017-2022 draft CTP
• The largest decrease on a percentage basis occurs in the Maryland Aviation
Administration, which sees a 35.5% decrease in its six-year program due to the completion of several large projects located at the Baltimore-Washington International Thurgood Marshall Airport, such as the connector between concourses D and E and the Runway Safety Area, Standards, and Pavement Improvements (Phases 2 through 4).
• Although the Maryland Department of Transportation has reserved $761 million in the draft Transportation Trust Fund forecast to increase the amount of Highway User Revenues going to local governments, the draft CTP does not show these funds as capital spending. It is unclear how the Administration plans to implement its proposed increase in local transportation aid.
74

Part 8
State Employment and Employee Benefits
75

76

Department/Service Area 2015
Actual2016
Working 2017
Working*2018
Baseline
2017-2018
ChangeHealth and Human ServicesHealth and Mental Hygiene 6,330 6,353 6,183 6,186 3Human Resources 6,465 6,360 6,265 6,286 21Juvenile Services 2,055 2,055 1,999 1,999 0 Subtotal 14,850 14,768 14,447 14,471 24
Public SafetyPublic Safety and Correctional Services 11,068 11,025 10,956 11,073 117Police and Fire Marshal 2,438 2,438 2,436 2,436 0 Subtotal 13,506 13,463 13,392 13,509 117
Transportation 9,086 9,126 9,108 9,120 13
Other ExecutiveLegal (Excluding Judiciary) 1,488 1,501 1,473 1,478 5Executive and Administrative Control 1,633 1,626 1,577 1,583 6Financial and Revenue Administration 2,103 2,119 2,107 2,107 0Budget and Management and DoIT 446 460 484 484 0Retirement 205 213 210 210 0General Services 578 578 582 582 0Natural Resources 1,294 1,321 1,326 1,327 1Agriculture 381 380 366 367 1Labor, Licensing, and Regulation 1,604 1,603 1,528 1,531 3MSDE and Other Education 1,938 1,940 1,957 1,963 6Housing and Community Development 337 337 330 330 0Commerce 217 208 194 194 0Environment 936 939 913 913 0 Subtotal 13,158 13,223 13,046 13,067 22
Executive Branch Subtotal 50,599 50,579 49,992 50,167 175
Higher Education 25,516 25,632 25,906 25,906 0
Executive and Higher Education Subtotal 76,115 76,211 75,899 76,074 175
Judiciary 3,733 3,914 3,951 3,966 15
Legislature 749 749 749 749 0
Total 80,597 80,874 80,598 80,788 190
DoIT: Department of Information TechnologyMSDE: Maryland State Department of Education
Source: Department of Budget and Management; Department of Legislative Services
Regular Full-time Equivalent Positions ChangesFiscal 2015 Actual to Fiscal 2018 Baseline
*Fiscal 2017 Working Appropriation reflects changes in higher education positions due to Board of Public Worksaction, and the creation and abolishment of positions due to flex authority of the institutions.
77

Department/Service Area PositionsTurnover
Rate
Vacancies to Meet
Turnover Vacancies
Vacancies Above
(or Below) Turnover
Health and Human ServicesHealth and Mental Hygiene 6,183 6.8% 422 594 171Human Resources 6,265 7.1% 443 524 81Juvenile Services 1,999 7.2% 144 229 85 Subtotal 14,447 7.0% 1,009 1,347 337
Public SafetyPublic Safety and Correctional Services 10,956 4.7% 520 1,492 973Police and Fire Marshal 2,436 4.2% 102 318 216 Subtotal 13,392 4.6% 622 1,810 1,189
Transportation 9,108 4.3% 390 682 291
Other ExecutiveLegal (Excluding Judiciary) 1,473 5.4% 80 109 29Executive and Administrative Control 1,577 4.7% 74 169 95Financial and Revenue Administration 2,107 5.5% 116 224 108Budget and Management and DoIT 484 3.5% 17 47 30Retirement 210 5.0% 11 18 7General Services 582 6.5% 38 59 21Natural Resources 1,326 3.3% 44 98 54Agriculture 366 6.6% 24 24 0Labor, Licensing, and Regulation 1,528 3.7% 56 170 114MSDE and Other Education 1,957 5.8% 114 170 56Housing and Community Development 330 5.6% 18 30 12Commerce 194 4.9% 10 24 14Environment 913 7.0% 64 88 23 Subtotal 13,046 5.1% 666 1,229 563
Executive Branch Total 49,992 5.3% 2,687 5,067 2,380
Source: Department of Budget and Management; Department of Legislative Services
Analysis of Vacancies and Turnover RateFiscal 2017 Legislative Appropriation Compared to October 2016 Vacancies
MSDE: Maryland State Department of EducationDoIT: Department of Information Technology
78

2015 Actual
2016 Actual
2017 Working
2018 Baseline
Beginning Balance $215.4 $60.0 $149.4 $161.2
ExpendituresDBM Personnel Administrative Cost $19.0 $14.6 $17.5 $17.5
Payments of ClaimsMedical $906.3 $947.0 $992.4 $1,039.7Rx 463.4 520.0 586.6 661.7Dental 46.9 46.7 46.8 46.8New Positions 0.0 0.0 0.0 4.6
Payments to Providers $1,416.7 $1,513.8 $1,625.7 $1,752.8Percent Growth in Payments 7.9% 6.9% 7.4% 7.8%
Receipts State Agencies $958.5 $1,236.9 $1,264.5 $1,318.9Employee Contributions 162.0 185.5 193.4 201.7Retiree Contributions 78.4 91.4 93.1 97.2Rx Rebates, Recoveries, and Other 81.4 104.0 104.0 104.0
Total Receipts $1,280.3 $1,617.8 $1,655.0 $1,721.7Percent Growth in Receipts 2.6% 26.4% 2.3% 4.0%
Ending Balance $60.0 $149.4 $161.2 $112.6
Incurred But Not Received -$105.5 -$105.5 -$103.0 -$103.0
Reserve for Future Provider Payments -$45.5 $43.9 $58.2 $9.6
DBM: Department of Budget and ManagementRx: prescription drug
Source: Department of Budget and Management; Department of Legislative Services
Employee and Retiree Health Insurance AccountFiscal 2015-2018
($ in Millions)
79

State Retirement and Pension System Actual Performance Compared to Post-reform Estimate
• The funded ratio for the State Retirement and Pension System has remained
consistently higher than was projected when pension reform was enacted in 2011, despite employer contributions being lower than was projected at the time.
• Although investment performance was favorable immediately after the reforms
were adopted, the average annual investment return over the past five years has been below the 7.55% assumed rate of return, and, therefore, does not explain the favorable outcomes.
25%35%45%55%65%75%
FY 2012 FY 2013 FY 2014 FY 2015 FY 2016
Funded StatusFiscal 2012-2016
Projected Funded Ratio Actual Funded Ratio
$0$500
$1,000$1,500$2,000$2,500$3,000
FY 2012 FY 2013 FY 2014 FY 2015 FY 2016 FY 2017
($ in
Mill
ions
)
Total Employer ContributionsFiscal 2012-2017
Projected Employer Contributions Actual Employer Contributions
80

State Retirement and Pension System (cont.)
• Slow growth in liabilities has been largely responsible for favorable outcomes:
• Rapid turnover in system membership has resulted in nearly one-third
(29%) of teachers and employees being in the reformed pension plan;
• Low inflation has kept cost-of-living adjustments very low (e.g., 0.1% in 2016); and
• Salary base is not growing at the expected rate of 3.2% (0.8% from 2015 to
2016).
Funding Status and Contribution Update
($ in Millions)
Funding Status as of June 30 FY 2015-16
% Change FY 2014 FY 2015 FY 2016
Actuarial Liabilities $58,027 $61,414 $62,751 2.2% Actuarial Value of Assets 39,277 42,154 43,630 3.5% Unfunded Actuarial Liabilities $18,750 $19,260 $19,121 -0.7% Funded Ratio 67.7% 68.6% 69.5%
Employer Contributions
FY 2016 FY 2017 FY 2018* FY 2017-18 % Change
Actuarial State Contribution $1,440 $1,534 $1,548 Supplemental Contributions 75 150 125 Total State Contribution $1,515 $1,684 $1,673 -0.7% School Board Contributions $255 $280 $280 Total Contributions $1,770 $1,964 $1,953 -0.6%
*Projected. Note: Exhibit does not include assets and liabilities for participating governmental units. Source: State Retirement Agency; Department of Legislative Services
81

State Retirement and Pension System (cont.)
• Liabilities are expected to continue to grow at a slow pace due to increasing
retirement rates, low inflation, and fiscal constraints on salary growth. • More than $2.0 billion in unrecognized investment losses will put increasing
upward pressure on contribution rates over the next four years unless future performance helps offset those losses.
Five-year Recognition (Smoothing) of Actuarial Gains and Losses
Valuation Date as of June 30
($ in Millions)
FY 2015 FY 2016 FY 2017 FY 2018 FY 2019 FY 2020
Actual Investment Return 2.7% 1.2% Actuarial Gain/(Loss) -$2,243 -$2,926 Amount Recognized: Current Year -$449 -$585 One Year Ago 525 -449 -$585 Two Years Ago 198 525 -449 -$585 Three Years Ago -558 198 525 -449 -$585 Four Years Ago 764 -558 198 525 -449 -$585 Net Recognized for Valuation $480 -$869 -$311 -$509 -$1,034 -$585
82

Part 9
Supporting Material
83

84

"Current as of December 13, 2016"
Starting Balance $384.5
Revenues$16,655.2
BRE Revision December 2016 -61.2November 2016 Administration Assumptions 13.0
Total $16,606.9
Transfers$31.5
GAAP Adjustment 47.4-20.0
Total $58.9
Funds Available $17,050.3
SpendingFiscal 2017 Working Appropriation $17,235.6DLS Estimated Deficiencies 234.2November 2016 BPW Withdrawn Appropriations -82.3Reversion of Fenced Off Items -87.7Estimated Agency Reversions -40.0
Net Expenditures $17,259.7
Ending Balance -$209.4
Budgeted Tax Credits
BRE: Board of Revenue EstimatesDLS: Department of Legislative Services
Status of the General FundFiscal 2017
($ in Millions)
BRE Estimated Revenue September 2016
Program Open Space
85

"Current as of December 13, 2016"
Starting Balance $0.0
Revenues$17,158.8
BRE Revision December 2016 -24.5Total $17,134.3
Transfers$31.9
46.0Total $78.0
Funds Available $17,212.3
SpendingFiscal 2018 DLS Baseline $17,804.5Ongoing Impact of Nov 2016 BPW Action -18.1Estimated Agency Reversions -30.0
Net Expenditures $17,756.4
Ending Balance -$544.1
BPW: Board of Public Works
DLS: Department of Legislative ServicesBRE: Board of Revenue Estimates
Status of the General FundFiscal 2018
($ in Millions)
BRE Estimated Revenue September 2016
Budgeted Tax CreditsProgram Open Space
86

Rainy Day Dedicated CatastrophicFund Purpose Acct. Event Acct.
Balances 6/30/16 $832.3 $1.8 $9.6
Fiscal 2017 Appropriations 235.3 0.0 0.0
Information Technology Upgrades 0.0 -1.8 0.0
Excess Revenue/Transfers -80.0 0.0 0.0
Ellicott City Flood Relief Assistance 0.0 0.0 -2.5
Interest and Other Net Revenues 10.9 0.0 0.0
Estimated Balances 6/30/17 $998.6 $0.0 $7.1
Fiscal 2018 Appropriations 50.0 50.0 0.0
Transfer to Pension Fund 0.0 -50.0 0.0
Interest and Other Net Revenues 10.7 0.0 0.0
Estimated Balances 6/30/18 $1,059.3 $0.0 $7.1Percent of Revenues in Reserve 6.2%
State Reserve Fund ActivityFiscal 2017 and 2018
($ in Millions)
Note: The fiscal 2017 budget bill restricted approximately $80.0 million from within the Rainy Day Fundappropriation to fund other projects and programs. With the Administration’s decision to not release thosefunds for the identified purposes, the restricted funds will revert to the General Fund at the close of fiscal 2017.
87

"Current as of December 13, 2016"
FY 2016 FY 2017Working Adj. Leg. FY 2018
Category Appropriation Appropriation Baseline $ Change % Change
Debt Service $1,413.5 $1,497.1 $1,592.5 $95.4 6.4%
County/Municipal 600.5 669.0 733.7 64.7 9.7%Community Colleges 297.5 314.3 321.0 6.7 2.1%Education/Libraries 7,063.0 7,321.2 7,455.1 133.9 1.8%Health 50.2 54.0 57.9 3.9 7.2%Aid to Local Governments $8,011.1 $8,358.5 $8,567.8 $209.2 2.5%
Foster Care Payments $288.7 $262.3 $265.2 $2.9 1.1%Assistance Payments 1,338.0 1,333.4 1,274.6 -58.8 -4.4%Medical Assistance 9,574.7 9,881.8 11,384.7 1,502.9 15.2%Property Tax Credits 81.5 82.3 78.7 -3.6 -4.4%Entitlements $11,282.9 $11,559.8 $13,003.2 $1,443.3 12.5%
Health $2,751.3 $2,872.0 $2,922.5 $50.6 1.8%Human Resources 944.4 985.2 1,050.2 65.0 6.6%Children’s Cabinet Interagency Fund 22.5 16.6 19.7 3.1 18.7%Juvenile Services 284.7 285.1 295.5 10.4 3.6%Public Safety/Police 1,738.3 1,793.2 1,852.0 58.7 3.3%Higher Education 5,557.1 5,696.9 5,852.5 155.6 2.7%Other Education 717.5 741.7 791.8 50.1 6.8%Transportation 1,862.6 1,904.4 2,012.3 107.8 5.7%Agriculture/Natural Res./Environment 436.5 468.9 498.1 29.2 6.2%Other Executive Agencies 1,932.3 1,989.9 2,003.8 13.9 0.7%Judiciary 518.8 541.1 558.2 17.1 3.2%Legislative 84.5 89.2 89.8 0.7 0.8%Across-the-board Cuts -0.2 0.0 0.0 0.0 n/aState Agencies $16,850.5 $17,384.2 $17,946.5 $562.2 3.2%Anticipated Deficiencies (1) $35.9 $1,133.4 $0.0 -$1,133.4 -100.0%
Total Operating $37,593.9 $39,933.1 $41,109.8 $1,176.8 2.9%
Capital (2) $2,671.5 $3,130.1 $3,138.1 $8.0 0.3%– Transportation 2,285.8 2,671.2 2,673.2 2.0 0.1%– Environment 238.6 264.4 209.2 -55.2 -20.9%– Other 147.1 194.5 255.6 61.1 31.4%
Subtotal $40,265.4 $43,063.2 $44,247.9 $1,184.7 2.8%Reserve Funds $72.5 $155.4 $100.0 -$55.4 -35.6%Appropriations $40,337.9 $43,218.6 $44,347.9 $1,129.3 2.6%Reversions -$87.0 -$39.8 -$30.0 $9.8 -24.6%Grand Total $40,250.9 $43,178.8 $44,317.9 $1,139.1 2.6%
(2) Includes the Sustainable Communities Tax Credit Reserve Fund.
Note: The fiscal 2016 working appropriation includes $210.8 million in deficiencies and $371.6 million in targeted reversions. The fiscal 2017adjusted legislative appropriation reflects language restrictions of $170.1 million of which $76.6 million is expected to be spent by the Governor fora net anticipated reversion of $93.5 million. It also reflects actions taken by the Board of Public Works in November 2016 which reducedgeneral fund spending by $83.3 million and increased reversions by $9.8 million.
State Expenditures – All Funds($ in Millions)
FY 2017 to FY 2018
(1) Anticipated deficiencies for fiscal 2017. Deficiencies in the fiscal 2016 working appropriation are for prior years.
88

FY 2016 FY 2017Working Legislative FY 2018
Category Appropriation Appropriation Baseline $ Change % Change
Debt Service $11.5 $11.5 $11.5 -$0.1 -0.5%
County/Municipal 65.9 65.9 65.9 0.0 0.0%Community Colleges 0.0 0.0 0.0 0.0 n/aEducation/Libraries 847.6 936.8 936.8 0.0 0.0%Health 4.5 4.5 4.5 0.0 0.0%Aid to Local Governments $917.9 $1,007.1 $1,007.1 $0.0 0.0%
Foster Care Payments $98.7 $82.3 $78.1 -$4.2 -5.1%Assistance Payments 1,259.5 1,255.6 1,210.1 -45.4 -3.6%Medical Assistance 5,929.8 6,029.4 7,101.2 1,071.7 17.8%Property Tax Credits 0.0 0.0 0.0 0.0 n/aEntitlements $7,288.0 $7,367.3 $8,389.4 $1,022.1 13.9%
Health $946.6 $976.7 $995.7 $19.0 1.9%Human Resources 494.9 504.9 534.8 29.9 5.9%Children’s Cabinet Interagency Fund 0.0 0.0 0.0 0.0 n/aJuvenile Services 7.4 4.8 5.0 0.2 4.3%Public Safety/Police 37.4 42.5 41.9 -0.6 -1.4%Higher Education 0.0 0.0 0.0 0.0 n/aOther Education 246.0 254.2 258.7 4.5 1.8%Transportation 96.6 97.2 98.5 1.3 1.3%Agriculture/Natural Res./Environment 69.8 66.5 68.1 1.5 2.3%Other Executive Agencies 571.6 614.2 610.6 -3.6 -0.6%Judiciary 1.2 0.2 0.2 0.0 0.8%State Agencies $2,471.3 $2,561.3 $2,613.6 $52.2 2.0%Anticipated Deficiencies $0.0 $889.0 $0.0 -$889.0 -100.0%
Total Operating $10,688.7 $11,836.3 $12,021.6 $185.3 1.6%Capital $810.4 $1,093.6 $1,010.5 -$83.1 -7.6%– Transportation 705.5 1,020.4 912.8 -107.6 -10.5%– Environment 44.9 44.3 44.2 -0.1 -0.2%– Other 60.0 28.9 53.5 24.6 85.2%
Grand Total $11,499.1 $12,929.8 $13,032.0 $102.2 0.8%
Note: The fiscal 2016 working appropriation includes $10.3 million in deficiencies.
State Expenditures – Federal Funds($ in Millions)
FY 2017-2018
89

FY 2016 FY 2017Working Legislative FY 2018
Category Appropriation Appropriation Baseline $ Change % Change
Debt Service $1,149.6 $1,202.6 $1,350.0 $147.4 12.3%
County/Municipal 280.0 342.0 389.8 47.7 14.0%Community Colleges 0.0 0.0 0.0 0.0 n/aEducation/Libraries 387.9 458.8 566.1 107.2 23.4%Health 0.0 0.0 0.0 0.0 n/aAid to Local Governments $667.9 $800.9 $955.8 $155.0 19.4%
Foster Care Payments $4.8 $2.2 $4.3 $2.1 94.1%Assistance Payments 16.6 13.3 11.3 -2.0 -15.0%Medical Assistance 998.5 946.8 950.5 3.7 0.4%Property Tax Credits 0.0 0.0 0.0 0.0 n/aEntitlements $1,020.0 $962.3 $966.1 $3.8 0.4%
Health $488.4 $518.0 $473.9 -$44.1 -8.5%Human Resources 90.6 98.1 100.6 2.5 2.6%Children’s Cabinet Interagency Fund 0.0 0.0 0.0 0.0 n/aJuvenile Services 4.9 3.9 3.8 0.0 -1.2%Public Safety/Police 221.7 224.8 230.0 5.2 2.3%Higher Education 4,208.2 4,290.2 4,357.0 66.8 1.6%Other Education 60.0 66.9 66.7 -0.1 -0.2%Transportation 1,766.1 1,807.2 1,913.8 106.6 5.9%Agriculture/Natural Res./Environment 253.3 279.5 299.3 19.8 7.1%Other Executive Agencies 687.4 702.2 682.9 -19.3 -2.7%Judiciary 64.7 59.3 57.7 -1.6 -2.7%Legislative 0.0 0.0 0.0 0.0 n/aAcross-the-board Cuts 0.0 0.0 0.0 0.0 n/aState Agencies $7,845.2 $8,049.9 $8,185.6 $135.7 1.7%Anticipated Deficiencies (1) -$5.5 $10.2 $0.0 -$10.2 -100.0%Total Operating $10,677.2 $11,025.8 $11,457.5 $431.8 3.9%Capital $1,834.7 $1,964.5 $2,072.0 $107.5 5.5%– Transportation 1,580.3 1,650.8 1,760.5 109.6 6.6%– Environment 193.3 210.1 164.0 -46.1 -21.9%– Other 61.0 103.6 147.5 44.0 42.4%
Grand Total $12,511.9 $12,990.2 $13,529.5 $539.3 4.2%
(1) Anticipated deficiencies for fiscal 2017. Deficiencies in the fiscal 2016 working appropriation are for prior years.
Note: The fiscal 2016 working appropriation reflects deficiencies of -$6.8 million. The fiscal 2017 legislative appropriation reflects language restrictions of $32.6 million of which $27.0 million is expected to be spent by the Governor for a net reduction of $5.6 million.
State Expenditures – Special and Higher Education Funds*($ in Millions)
FY 2017-2018
* Includes higher education fund (current unrestricted and current restricted) net of general and special funds.
90

Increased Managed Care Organization Rates and Higher Behavioral Health Costs Drive a Projected Fiscal 2017
Medicaid Deficit and Growth in Fiscal 2018
• Medicaid’s fiscal 2017 general fund deficiencies are estimated at $124.1 million.
• On the somatic health side, deficits are estimated at $93.4 million. The primarydriver of this deficit is managed care organization (MCO) rates. Specifically, amid-year increase of 3.7% brought the total calendar 2016 MCO rate increase to11.0%. Calendar 2017 MCO rates are scheduled to grow at 1.1%. However, ratesfor the population groups for which the State has a greater financial responsibilityincrease by an estimated 4.7%.
• Behavioral health deficits total $30.7 million, $10.7 million attributed to fiscal 2016and $20.0 million to fiscal 2017. These deficits are attributed to higher thananticipated expenditures for substance use disorder (SUD) treatment. Fiscal 2016was the first full year of expenditures for SUD treatment under fee-for-service(FFS) rather than through MCOs.
Medicaid Enrollment Bounces Back from the Effects of Redeterminations in Fiscal 2016
However, the Budgetary Impact Is Modest Fiscal 2015-2018
ACA: Affordable Care Act MCHP: Maryland Children’s Health Program
0
200,000
400,000
600,000
800,000
1,000,000
1,200,000
1,400,000
Fiscal 2015 Fiscal 2016 Fiscal 2017BUDGET
Fiscal 2017YTD
Fiscal 2018EST
Traditional Medicaid (exc. MCHP) MCHP ACA Expansion
Budget Year-to-date Estimate
91

• Projected enrollment for fiscal 2017 is considerably higher than that budgeted for, reflecting a quicker than expected bounce-back in enrollment from the impact of redetermination. However, the fiscal impact of this growth is reduced because most of the growth is in enrollment categories for which the State share of payments is low. Further, enrollment in expensive eligibility categories (e.g., disabled adults) has been revised down, and more enrollees are being served through MCOs rather than FFS, which tends to lower overall costs.
• Medicaid spending in fiscal 2018 is anticipated to grow by just under $1.5 billion,
14.7% over the fiscal 2017 legislative appropriation. Growth over the fiscal 2017 estimate is more modest, $464 million, or 4.2%. Most of the growth is in federal funds, reflecting both increased enrollment and service expenditures in eligibility groups with large federal support.
• General fund growth in fiscal 2018 is expected to be $388.7 million, or 13.3%
above the legislative appropriation, or $273.0 million, or 9.0%, above the fiscal 2017 estimate.
Fiscal 2017 Deficiencies Add to an Increased Demand for General Fund Support in Fiscal 2018 Compared to
Fiscal 2017 Appropriations Fiscal 2016-2018
($ in Millions) 2016 2017 Budget 2017 Est. 2018 Baseline General Funds $2,631.9 $2,926.5 $3,042.1 $3,315.2 Special Funds 1,001.9 946.8 948.3 950.5 Federal Funds 5,948.4 6,029.4 6,912.5 7,101.2 Reimbursable Funds 68.9 57.7 57.7 57.7 Total $9,651.1 $9,960.3 $10,960.6 $11,424.4
Source: Department of Legislative Services • Compared to the fiscal 2017 legislative appropriation, $113.4 million of the
projected general fund growth in Medicaid in the fiscal 2018 baseline is due to fiscal 2017 deficiencies that carry over into fiscal 2018. Other key cost drivers include the full impact of the calendar 2017 MCO rate increase, the assumption of a 3.1% calendar 2018 MCO rate increase due to the expiration of a one-year moratorium on an insurer fee imposed under the Affordable Care Act (ACA), accommodating the first full fiscal year of the State’s growing share of the costs associated with the ACA expansion population, modest rate increases for FFS providers, and accommodating projecting enrollment growth of 2.3%.
92

Commitments Exceed Programed Resources
FY 2018 FY2019 FY2020 FY2021 Projects Accelerated/Deferred
DoIT: Public Safety Communication System $9.190 Morgan State University: Student Services Support Building 13.700 $36.500 -$18.000 -$37.500 UMES: School of Pharmacy 3.700 27.800 34.800 -31.300 USM: Biomedical Sciences and Engineering Education Facility 88.000 6.000 -16.000 -122.500 UMBC: Interdisciplinary Life Science Building 50.000 6.500 -65.400 Department of State Police: New Cumberland Barrack 4.300 -0.200 -4.600 DPSCS: Demolition of Buildings at the Baltimore City Correctional Complex 16.900 DPSCS: New Baltimore Justice Center -20.700 -145.000 38.000 80.000 Subtotal $148.190 -$51.500 -$31.200 -$111.300
Projects Preauthorized
UMCP: New School of Public Affairs $3.000 $17.000 DHMH: Rosewood Environmental Abatement 10.000 5.000 Coppin State University: Percy Julian Science Renovation 1.300 0.300 $19.400 FSU: Education Professions and Health Sciences Center 2.400 -2.400 29.400 Misc: Strathmore Hall Performing Arts Center 3.000 3.000 Misc: Downtown Frederick Hotel and Conference Center 7.500 7.500 Subtotal $27.200 $30.400 $48.800 $0.000
Bond Replacement BPW Reductions and Reserve Fund
BPW: Facilities Renewal Program $15.000 Maryland Department of Agriculture: Agricultural Cost Share Program $6.000 MDE: Water Quality Revolving Loan Program 6.792 MDE: Drinking Water Revolving Loan Program 3.003 Subtotal $30.795 $0.000 $0.000 $0.000
Mandates
PSCP: Supplemental Capital Grant for Local School Systems $20.000 $20.000 $20.000 $20.000 Misc: Prince George’s County Regional Hospital 8.000 Subtotal $20.000 $28.000 $20.000 $20.000
Expressions of Intent
Misc: Sheppard Pratt at Elkridge $3.750 $3.750 MHEC: Community College Construction Grant Program 20.000 20.000 $20.000 $20.000 Subtotal $23.750 $23.750 $20.000 $20.000
Legislative and Administrative Local Initiatives
Legislative Bond Bills $15.000 $15.000 $15.000 $15.000 Administrative Local Initiative 11.725 Subtotal $26.725 $15.000 $15.000 $15.000
Total $276.660 $45.650 $72.600 -$56.300
93

BPW: Board of Public Works DHMH: Department of Health and Mental Hygiene DoIT: Department of Information Technology DPSCS: Department of Public Safety and Correctional Services FSU: Frostburg State University MDE: Maryland Department of the Environment MHEC: Maryland Higher Education Commission PSCP: Public School Construction Program UMBC: University of Maryland Baltimore County UMCP: University of Maryland, College Park UMES: University of Maryland Eastern Shore USM: University System of Maryland Note: Estimated out-year funding impacts for accelerated projects assume that items will be funded in useable phases such that no gaps exists in estimated project delivery timelines. Estimates for deferred projects reflect one-year deferral and funding in useable phases such that no gaps exists in the timing of funding and project delivery.
94

Transportation Trust Fund Closeout
Comparison of Fiscal 2016 Projected and Actual Revenues and Expenditures ($ in Millions)
Projected
2016 Actual 2016 Variance
Starting Fund Balance $269 $269 $0
Revenues Motor Fuel Taxes $1,046 $1,018 -$28 Titling Taxes 855 860 5 Sales Tax – Rental Vehicles 31 31 0 Corporate Income, Registrations, and Misc. Motor
Vehicle Administration Fees 845 864 19 Maryland Department of Transportation (MDOT)
Operating Revenues (MD Aviation Admin., MD Port Admin., and MD Transit Admin.) 441 437 -4
Other Receipts and Adjustments 64 120 56 Bond Proceeds and Premiums 450 325 -125
Total Revenues $3,732 $3,655 -$77
Uses of Funds MDOT Operating Expenditures $1,766 $1,830 $64 MDOT Capital Expenditures 1,607 1,472 -135 MDOT Debt Service 264 259 -5 Highway User Revenues 176 177 1 Other Expenditures 63 60 -3
Total Expenditures $3,876 $3,798 -$78
Ending Fund Balance $125 $126 $1 • The fiscal 2016 ending fund balance of $126 million was just $1 million over the
target ending balance.
• Overall, nonbond-related revenues exceeded projections by $48 million. Bond sales were $150 million below projections reflecting reduced cash flow needs and receipt of $25 million in bond premiums.
• Spending was a net of $78 million less than estimated. Increases related to winter maintenance, and other department operations were offset by decreased capital spending due to project cash flow needs; reduced highway system preservation funding to cover winter maintenance costs; and decreased special fund spending on the Purple Line due to spending federal funds first and delayed spending due to the legal challenge to the project.
95

Baseline Budget Position Changes Assumptions Workload Adjustments • A net of 275 positions are created in higher education in fiscal 2017. Using flex
authority, the institutions created 445 new positions, converted 72 positions, and abolished 128 positions. In addition, the Board of Public Works abolished 101 positions in the University System of Maryland and 12 positions in Morgan State University on November 2, 2016.
• 15 positions for 6 judges and new staff at the Judiciary are added in fiscal 2018, consistent with the judges’ certification of need plan.
• 2 positions in the Department of Planning for an Administrator and Horticulturalist
for the Jefferson Patterson Park and Museum are added in fiscal 2018. Positions Associated With Legislation
Positions Anticipated But Not Yet Created in Fiscal 2017 • 13 positions in the Department of Public Safety and Correctional Services
(DPSCS) for the Maryland Police Training Standards Commission to carry out additional responsibilities required by the Public Safety and Policing Workgroup (Chapter 519 of 2016).
• 11 positions in the Department of Human Resources (DHR) to transfer all the
functions, powers, and duties of the child support unit of the Carroll County State’s Attorney’s Office (Chapter 53 of 2016).
• 6.5 positions in the Motor Vehicle Administration to handle increased workload from the expansion of circumstances under which a participation in the Ignition Interlock System Program is required. This expansion requires 5.5 customer agents and 1.0 administrative support staff to facilitate new program participants (Chapter 512 of 2016).
• 6 positions in the Maryland Department of Transportation to hire additional staff needed to develop a project-based scoring system for transportation projects and use the system to evaluate major transportation projects; new staff includes 3 prioritization coordinators, 2 economic modelers, and 1 geographic information systems specialist (Chapter 36 of 2016).
96

Baseline Budget Position Changes Assumptions (cont.)
• 3 positions for the Department of Health and Mental Hygiene to develop and implement an outreach and education plan regarding mandatory registration of certain prescribers and all pharmacists with the Prescription Drug Monitoring Program by July 1, 2017; new staff includes a database specialist and 2 administrative officers, primarily to ensure data quality and enforce mandates (Chapter 147 of 2016).
• 2 positions in the Governor’s Office of Minority Affairs to carry out expanded responsibilities for the Small Business Reserve Program, including developing and maintaining a directory of small business owners (Chapter 119 of 2016).
• 2 positions in the Governor’s Office of Service and Volunteerism, within the
Governor’s Office of Community Initiatives, to support the Maryland Corps Program’s Board of Directors (Chapter 654 of 2016).
• 2 positions in the Maryland Insurance Administration to monitor and enforce compliance of network directory requirements, which will be established by the Insurance Commissioner by December 31, 2017 (Chapter 309 of 2016).
• 1 position in the State Board of Elections to work with and process information
received from agencies establishing electronic voter registration systems (Chapter 287 of 2016).
• 1 position in the Department of Natural Resources to hire a biologist to support a
program to control the spread of black flies in the State (Chapters 584 and 585 of 2016).
• 0.5 position in the Maryland State Department of Education (MSDE) to hire a half-time specialist to research and develop a data collection system to determine the effectiveness of community partnered school behavioral health service programs (Chapters 213 and 214 of 2016).
97

Baseline Budget Position Changes Assumptions (cont.)
Positions Assumed in Fiscal 2018 • 104 positions in DPSCS to implement various provisions of the Justice
Reinvestment Act, including 84 positions in the Division of Correction for expanded inmate requirements, 14 positions in the Division of Parole and Probation to implement provisions to issue certificates of rehabilitation, and 6 positions in the Maryland Parole Commission to implement provisions for administrative release orders (Chapter 515 of 2016).
• 10 positions in DHR to transfer all the functions, powers, and duties of the child support unit of the Charles County State’s Attorney’s Office (legislation pending).
• 5 positions in the Office of the Attorney General to handle cases filed under the
provisions of the Maryland False Claims Act (Chapters 165 of 2015). • 4 positions at the Maryland Higher Education Commission to process and approve
applications for a new tax credit for individuals who have incurred $20,000 or more in undergraduate student loan debt and have at least $5,000 in outstanding undergraduate debt (Chapters 689 and 690 of 2016).
• 1 position in the Maryland Department of Agriculture to hire an inspector to enforce new restrictions on the sale of neonicotinoid pesticides (Chapters 661 and 662 of 2016).
• 1 position in MSDE for an education program specialist to oversee the
Next Generation Scholars of Maryland Program (formerly the College Readiness Outreach Program (Chapter 33 of 2016).
98
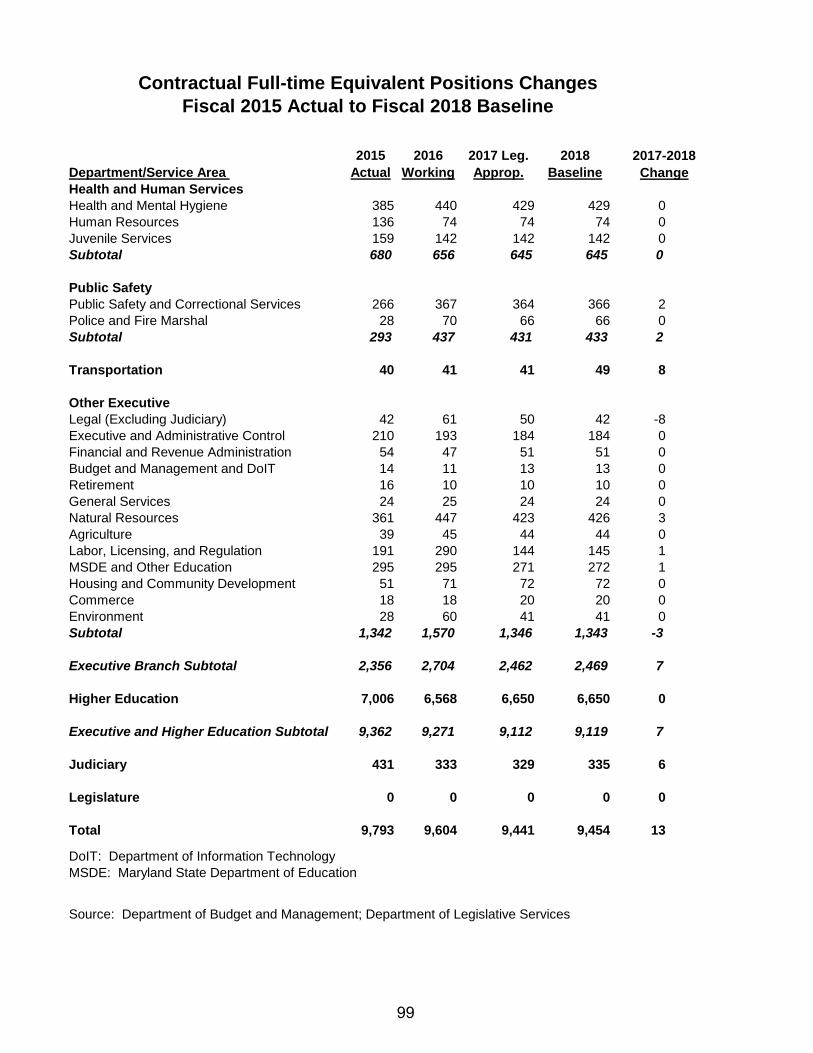
Department/Service Area 2015
Actual2016
Working2017 Leg. Approp.
2018Baseline
Health and Human ServicesHealth and Mental Hygiene 385 440 429 429 0Human Resources 136 74 74 74 0Juvenile Services 159 142 142 142 0Subtotal 680 656 645 645 0
Public SafetyPublic Safety and Correctional Services 266 367 364 366 2Police and Fire Marshal 28 70 66 66 0Subtotal 293 437 431 433 2
Transportation 40 41 41 49 8
Other ExecutiveLegal (Excluding Judiciary) 42 61 50 42 -8Executive and Administrative Control 210 193 184 184 0Financial and Revenue Administration 54 47 51 51 0Budget and Management and DoIT 14 11 13 13 0Retirement 16 10 10 10 0General Services 24 25 24 24 0Natural Resources 361 447 423 426 3Agriculture 39 45 44 44 0Labor, Licensing, and Regulation 191 290 144 145 1MSDE and Other Education 295 295 271 272 1Housing and Community Development 51 71 72 72 0Commerce 18 18 20 20 0Environment 28 60 41 41 0Subtotal 1,342 1,570 1,346 1,343 -3
Executive Branch Subtotal 2,356 2,704 2,462 2,469 7
Higher Education 7,006 6,568 6,650 6,650 0
Executive and Higher Education Subtotal 9,362 9,271 9,112 9,119 7
Judiciary 431 333 329 335 6
Legislature 0 0 0 0 0
Total 9,793 9,604 9,441 9,454 13
DoIT: Department of Information TechnologyMSDE: Maryland State Department of Education
Source: Department of Budget and Management; Department of Legislative Services
Contractual Full-time Equivalent Positions ChangesFiscal 2015 Actual to Fiscal 2018 Baseline
2017-2018Change
99