2016 - SCAD Documents/51211966-dd7b-4e04-9db4... · The Emirate of Abu Dhabi has a desert climate...
57
Environment Statistics 2016 Release Date: Oct 2017
Transcript of 2016 - SCAD Documents/51211966-dd7b-4e04-9db4... · The Emirate of Abu Dhabi has a desert climate...

Environment Statistics
2016Release Date: Oct 2017

Environmental Statistics 2016 2
Contents
Foreword ....................................................................................................................................................... 3
Key Points ..................................................................................................................................................... 7
Climate Statistics ........................................................................................................................................... 7
Temperatures ............................................................................................................................................ 7
Rainfall ...................................................................................................................................................... 9
Relative humidity ....................................................................................................................................... 9
Atmospheric Pressure ............................................................................................................................. 10
Wind Speed ............................................................................................................................................. 11
Solar Radiation ........................................................................................................................................ 13
Air Statistics................................................................................................................................................. 15
Air quality in urban areas ........................................................................................................................ 16
Air pollutant emissions - oil and gas sector ............................................................................................. 19
Carbon Dioxide Emissions – oil and gas sector...................................................................................... 20
Water statistics ............................................................................................................................................ 21
Non-conventional water resources ......................................................................................................... 21
Wastewater ............................................................................................................................................. 21
Marine water quality ................................................................................................................................ 23
Health and safety statistics ......................................................................................................................... 26
Food Poisoning and foodborne illnesses ................................................................................................ 26
Waste statistics ........................................................................................................................................... 27
Solid Waste ............................................................................................................................................. 27
Biodiversity Statistics .................................................................................................................................. 29
Known and threatened species ............................................................................................................... 29
Statistical Tables ......................................................................................................................................... 31
Explanatory Notes ....................................................................................................................................... 46
Glossary .................................................................................................................................................. 46
Abbreviations used .................................................................................................................................. 57
Data sources ............................................................................................................................................... 57
Symbols used .............................................................................................................................................. 57
Notes on tables ........................................................................................................................................... 58
More information and next release ............................................................................................................. 58
References ................................................................................................................................................. 58
Environmental Statistics 2016 3
List of Tables
8 Table 1.1: Average air temperature by region and month 2016
9 Table 1.2: Average rainfall by region and month 2016
10 Table 1.3: Average relative humidity by region and month 2016
11 Table 1.4: Average atmospheric pressure by region and month 2016
12 Table 1.5: Average wind speed by region and month 2016
13 Table 1.6: Average daily sunshine in Abu Dhabi and Al Ain regions by month 2016
14 Table 1.7: Average daily total solar radiation by region and month 2016
16 Table 2.1: Annual average of air pollution indicators in urban areas by region and station 2016
16 Table 2.2: Annual average of carbon monoxide concentration in ambient air by region
17 Table 2.3: Annual average of noise Level by region
18 Table 2.4: Air pollutant total emissions – oil and gas sector
19 Table 2.5: Per capita air pollutant total emissions - oil and gas sector
19 Table 2.6: Carbon dioxide emissions - oil and gas sector
20 Table 3.1: Total non-conventional water resources by type
20 Table 3.2: Wastewater statistics
21 Table 3.3: Total wastewater treatment plants capacity
21 Table 3.4: Wastewater quality
22 Table 3.5: Marine waters quality in the city Abu Dhabi 2016
23 Table 3.6: Concentration of natural nutrients in marine waters - 2016
24 Table 4.1: Number of food poisoning and foodborne illnesses by type
25 Table 5.1: Non-hazardous solid waste generation by region and source activity 2016
25 Table 6.1: Total known and threatened species
26 Table 1 : Air temperature by month - Abu Dhabi 2016
26 Table 2 : Air temperature by month – Al Ain 2016
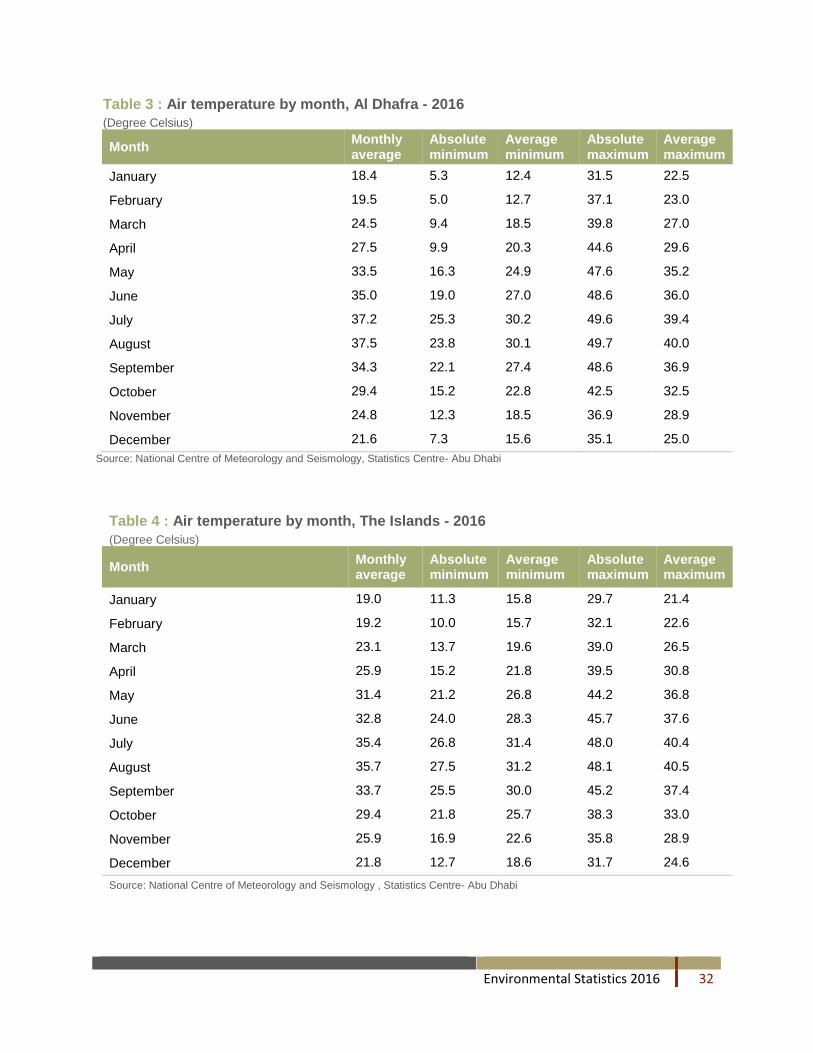
27 Table 3 : Air temperature by month – Al Dhafra 2016
27 Table 4 : Air temperature by month – The Islands 2016
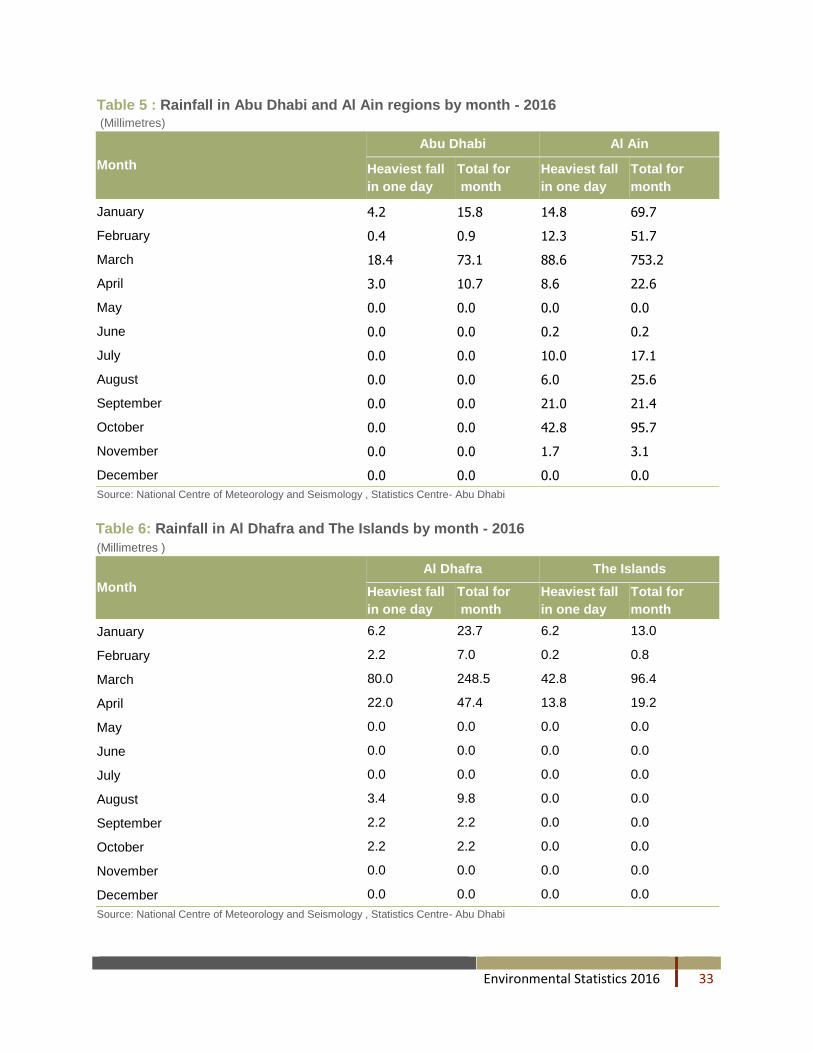
28 Table 5 : Rainfall in Abu Dhabi and Al Ain regions by month - 2016
Environmental Statistics 2016 4
30 Table 6: Rainfall in Al Dhafra and The Islands by month 2016
32 Table 7: Relative humidity by month - Abu Dhabi 2016
32 Table 8: Relative humidity by month - Al Ain 2016
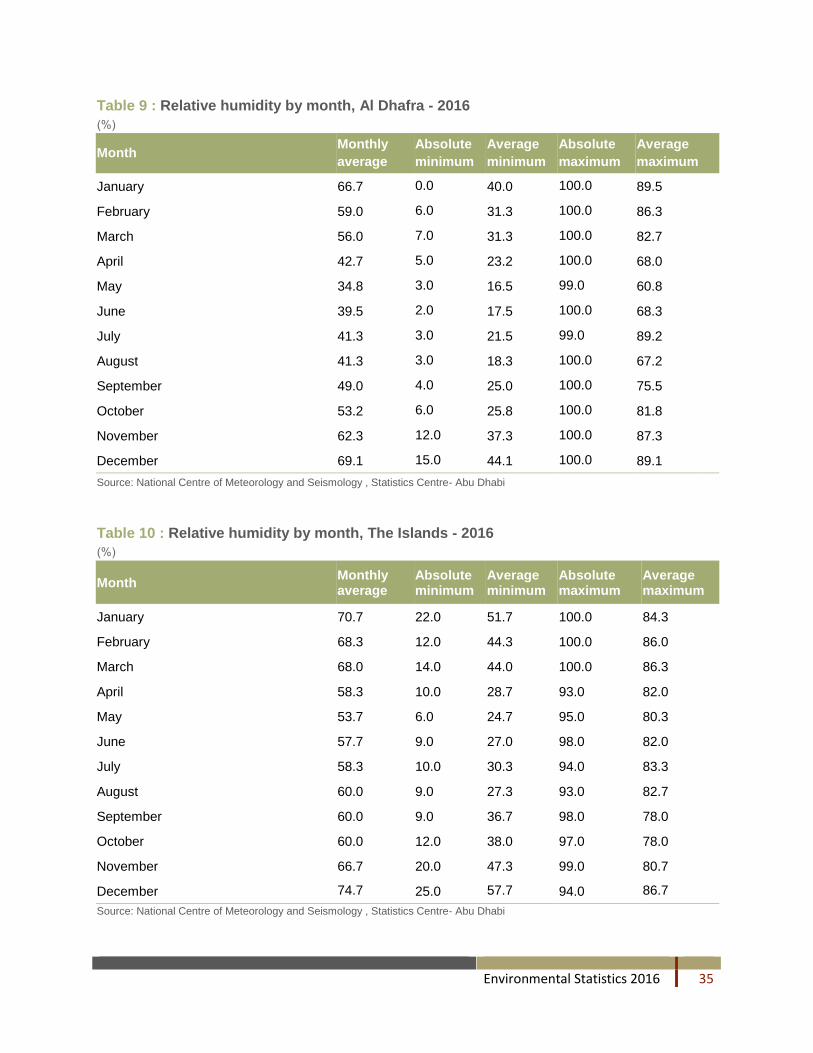
33 Table 9 : Relative humidity by month - Al Dhafra 2016
33 Table 10 : Relative humidity by month – The Islands 2016
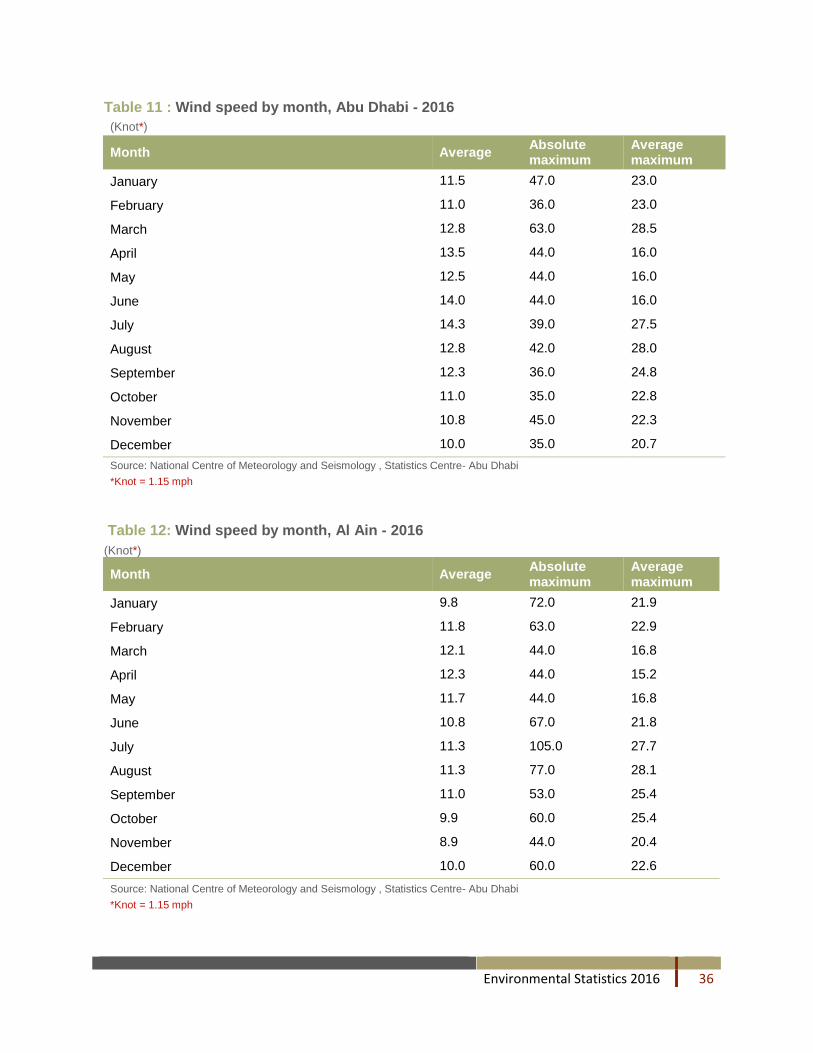
34 Table 11 : Wind speed by month - Abu Dhabi 2016
34 Table 12: Wind speed by month - Al Ain 2016
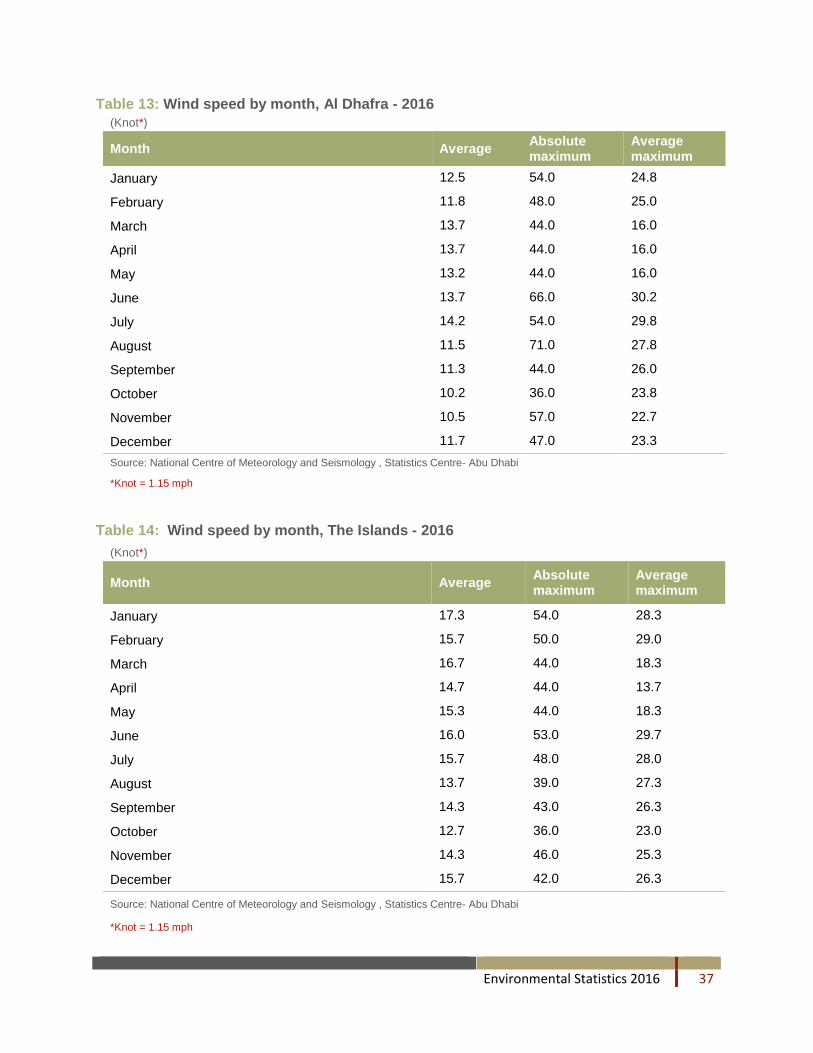
35 Table 13: Wind speed by month - Al Dhafra 2016
35 Table 14: Wind speed by month - The Islands 2016
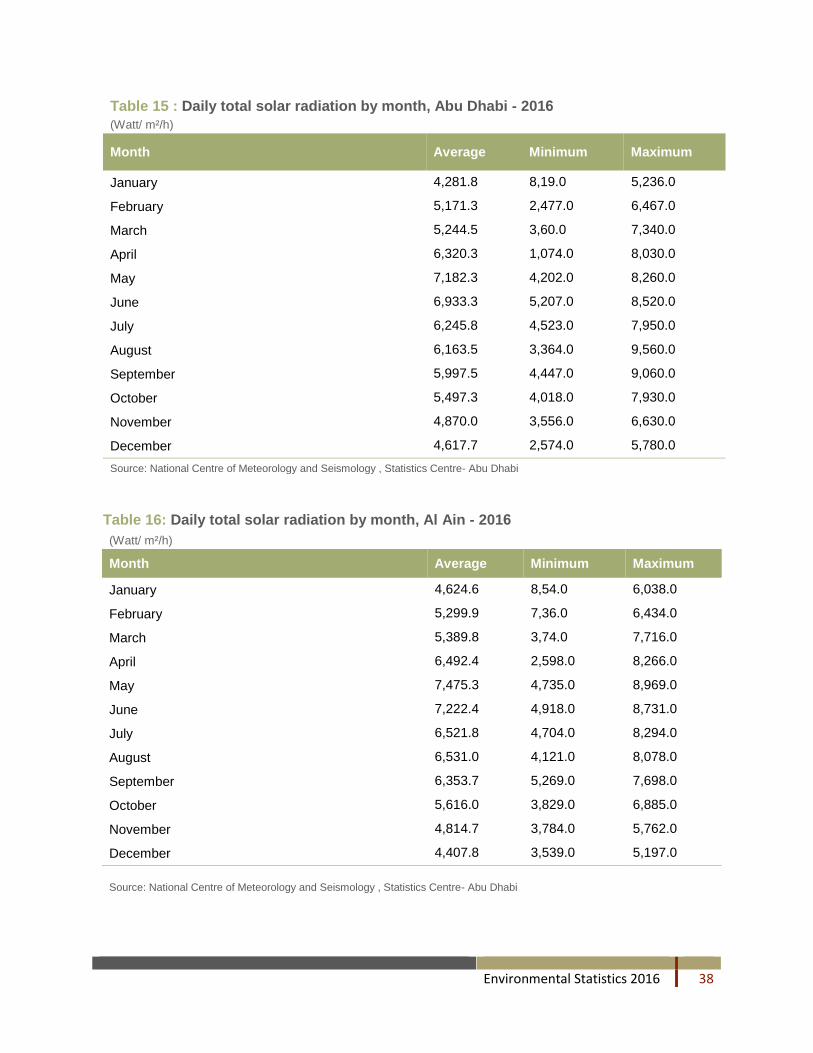
36 Table 15 : Daily total solar radiation by month - Abu Dhabi 2016
36 Table 16: Daily total solar radiation by month – Al Ain 2016
37 Table 17: Daily total solar radiation by month - Al Dhafra 2016
37 Table 18: Daily total solar radiation by month – The Islands 2016
38 Table 19: Annual average of Sulphur dioxide concentration in ambient air by region
38 Table 20: Annual average of nitrogen dioxide concentration in ambient air by region
39 Table 21 : Annual average of ground level ozone concentration in ambient air by region
39 Table 22: Annual average of particulate matter (PM10) concentration in ambient air by region
40 Table 23: Sulphur dioxide emissions – oil and gas sector
40 Table 24: Nitrogen oxides emissions - oil and gas sector
41 Table 25: Volatile organic compounds emissions - oil and gas sector
42 Table 26: Carbon dioxide emissions - oil and gas sector
43 Table 27: Per capita carbon dioxide emissions - oil and gas sector
Environmental Statistics 2016 5
List of Figures
8 Figure 1: Average maximum and minimum air temperature by region and month 2016
9 Figure 2: Annual rainfall average - Abu Dhabi Emirates
10 Figure 3: Average relative humidity by region and month 2016
11 Figure 4: Average atmospheric pressure by month 2016
14 Figure 5: Average daily total solar radiation by region and month 2016
18 Figure 6: Air pollutant total emissions - oil and gas sector
21 Figure 7: Quantity of wastewater
29 Figure 8: Percentage distribution of non-hazardous solid waste generation by region 2016
29 Figure 9: Percentage distribution of non-hazardous solid waste by disposal method 2016
31 Figure 10: Percentage of threatened species from total known species- 2016
Environmental Statistics 2016 6
Foreword
This report presents various environmental statistics of the Emirate of Abu Dhabi in 2016, including climate
statistics, air statistics, and air quality and pollutant emissions. It also contains statistics covering water,
food safety and occupational health, waste statistics as well as biodiversity statistics.
The key sources of data used in this report are the National Centre of Meteorology and Seismology,
Environment Agency - Abu Dhabi, Abu Dhabi National Oil Company (ADNOC), Abu Dhabi Water and
Electricity Company ADWEC, Abu Dhabi Water & Electricity Authority - ADWEA, Abu Dhabi Sewerage
Services Company (ADSSC), Health Authority - Abu Dhabi (HAAD), in additional to the Centre of Waste
Management - Abu Dhabi.
The "Explanatory Notes" section at the end of this report provides an explanation of the key terms and
technical concepts used in this publication. Readers are encouraged to refer to that section in conjunction
with reading the statistics and information outlined in the publication.

Environmental Statistics 2016 7
Key Points
Climate Statistics
The Emirate of Abu Dhabi has a desert climate with high temperatures, especially in summer. Abu Dhabi
is located in the dry tropical zone, where Tropic of Cancer passes in the southern part of the Emirate.
Moreover, high temperature in summer causes high relative humidity, especially in coastal areas. The
winter of Abu Dhabi is generally warm as temperatures drop to low levels. The Emirate suffers from scarcity
of rain throughout the year. The Emirate contains different geographic provinces including coastal areas,
inner desert areas in addition to highlands, where each part enjoys different temperatures. Seasonal
northerly winds blow across the UAE helping to ameliorate the weather when they are not loaded with dust,
in addition to the brief moisture-laden south-easterly winds. The wind often blows from south, southeast
and southwest or north, northwest and northeast. Another characteristic of the Emirate’s weather is the
high rate of water evaporation due to several factors, including wind speed, blowing force, high
temperatures and low rainfall.
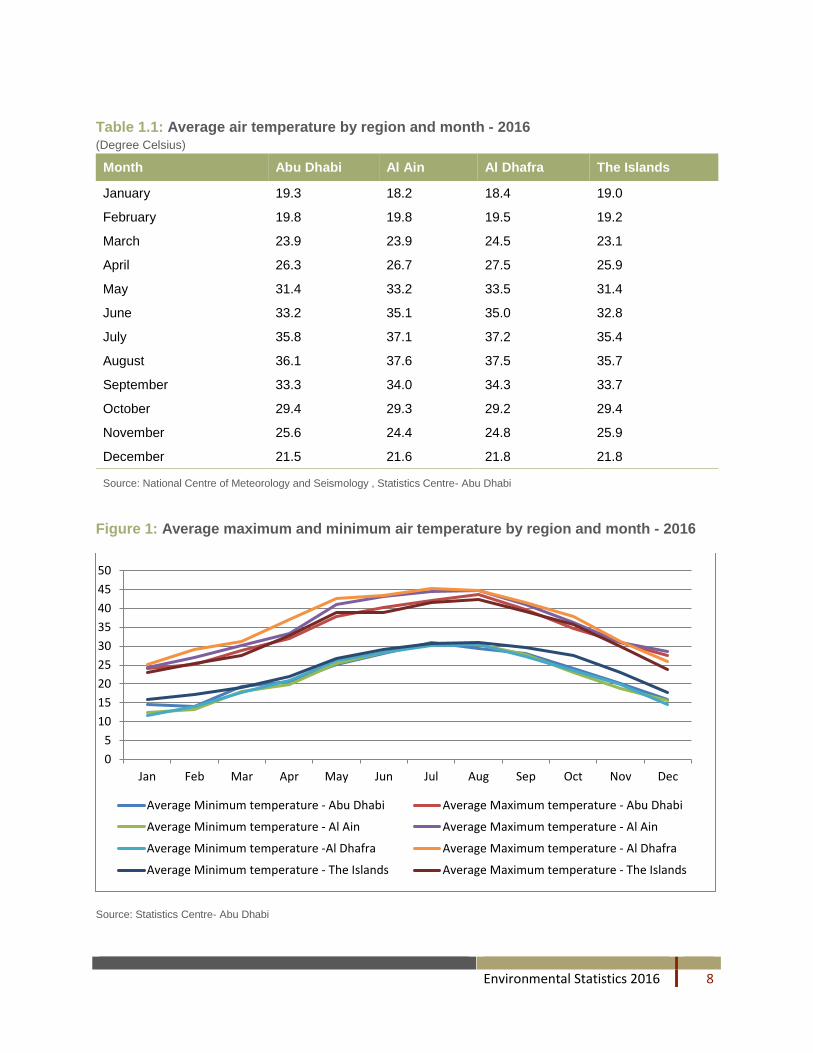
Temperatures
Abu Dhabi climate shows variation in temperatures in each season of the year. Table (1.1) displays the
change in average temperatures, where the lowest degree was 18.2 degrees Celsius and it recorded in
January in Al Ain, while the highest temperature was 37.6 degrees Celsius and it recorded in both Al Ain
and Al Dhafra regions in July. Figure (1) illustrates the average maximum and minimum temperature values
in Abu Dhabi, where it shows that the average maximum temperature is 41.8 degrees Celsius while the
minimum average temperature was less than 4.12 degrees Celsius in the winter. Statistical tables number
(1 - 4) in the Annex display the change of temperature values and average maximum and minimum in
addition to the absolute maximum and minimum for each region by month.
Environmental Statistics 2016 8
Table 1.1: Average air temperature by region and month - 2016
(Degree Celsius)
Month Abu Dhabi Al Ain Al Dhafra The Islands
January 19.3 18.2 18.4 19.0
February 19.8 19.8 19.5 19.2
March 23.9 23.9 24.5 23.1
April 26.3 26.7 27.5 25.9
May 31.4 33.2 33.5 31.4
June 33.2 35.1 35.0 32.8
July 35.8 37.1 37.2 35.4
August 36.1 37.6 37.5 35.7
September 33.3 34.0 34.3 33.7
October 29.4 29.3 29.2 29.4
November 25.6 24.4 24.8 25.9
December 21.5 21.6 21.8 21.8
Source: National Centre of Meteorology and Seismology , Statistics Centre- Abu Dhabi
Figure 1: Average maximum and minimum air temperature by region and month - 2016
Source: Statistics Centre- Abu Dhabi
0
5
10
15
20
25
30
35
40
45
50
Jan Feb Mar Apr May Jun Jul Aug Sep Oct Nov Dec
Average Minimum temperature - Abu Dhabi Average Maximum temperature - Abu Dhabi
Average Minimum temperature - Al Ain Average Maximum temperature - Al Ain
Average Minimum temperature -Al Dhafra Average Maximum temperature - Al Dhafra
Average Minimum temperature - The Islands Average Maximum temperature - The Islands
Environmental Statistics 2016 9
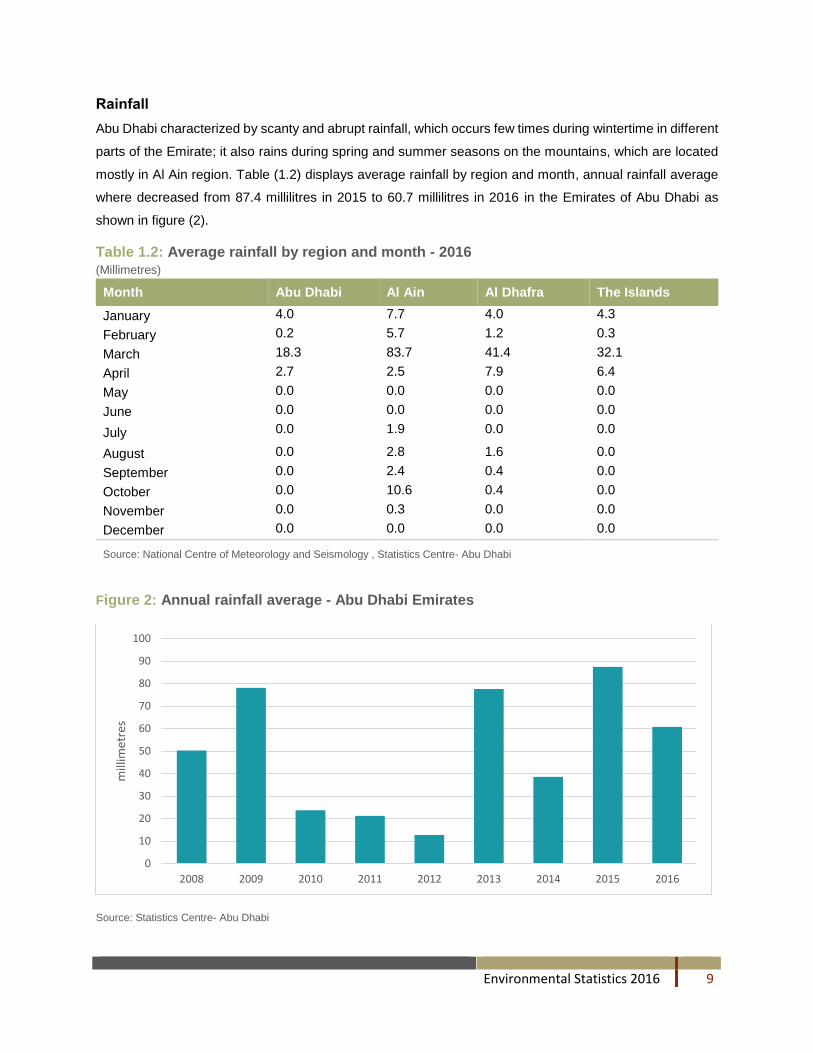
Rainfall
Abu Dhabi characterized by scanty and abrupt rainfall, which occurs few times during wintertime in different
parts of the Emirate; it also rains during spring and summer seasons on the mountains, which are located
mostly in Al Ain region. Table (1.2) displays average rainfall by region and month, annual rainfall average
where decreased from 87.4 millilitres in 2015 to 60.7 millilitres in 2016 in the Emirates of Abu Dhabi as
shown in figure (2).
Table 1.2: Average rainfall by region and month - 2016
(Millimetres)
Month Abu Dhabi Al Ain Al Dhafra The Islands
January 4.0 7.7 4.0 4.3
February 0.2 5.7 1.2 0.3
March 18.3 83.7 41.4 32.1
April 2.7 2.5 7.9 6.4
May 0.0 0.0 0.0 0.0
June 0.0 0.0 0.0 0.0
July 0.0 1.9 0.0 0.0
August 0.0 2.8 1.6 0.0
September 0.0 2.4 0.4 0.0
October 0.0 10.6 0.4 0.0
November 0.0 0.3 0.0 0.0
December 0.0 0.0 0.0 0.0
Source: National Centre of Meteorology and Seismology , Statistics Centre- Abu Dhabi
Figure 2: Annual rainfall average - Abu Dhabi Emirates
Source: Statistics Centre- Abu Dhabi
0
10
20
30
40
50
60
70
80
90
100
2008 2009 2010 2011 2012 2013 2014 2015 2016
mill
imet
res
Environmental Statistics 2016 10
Relative humidity
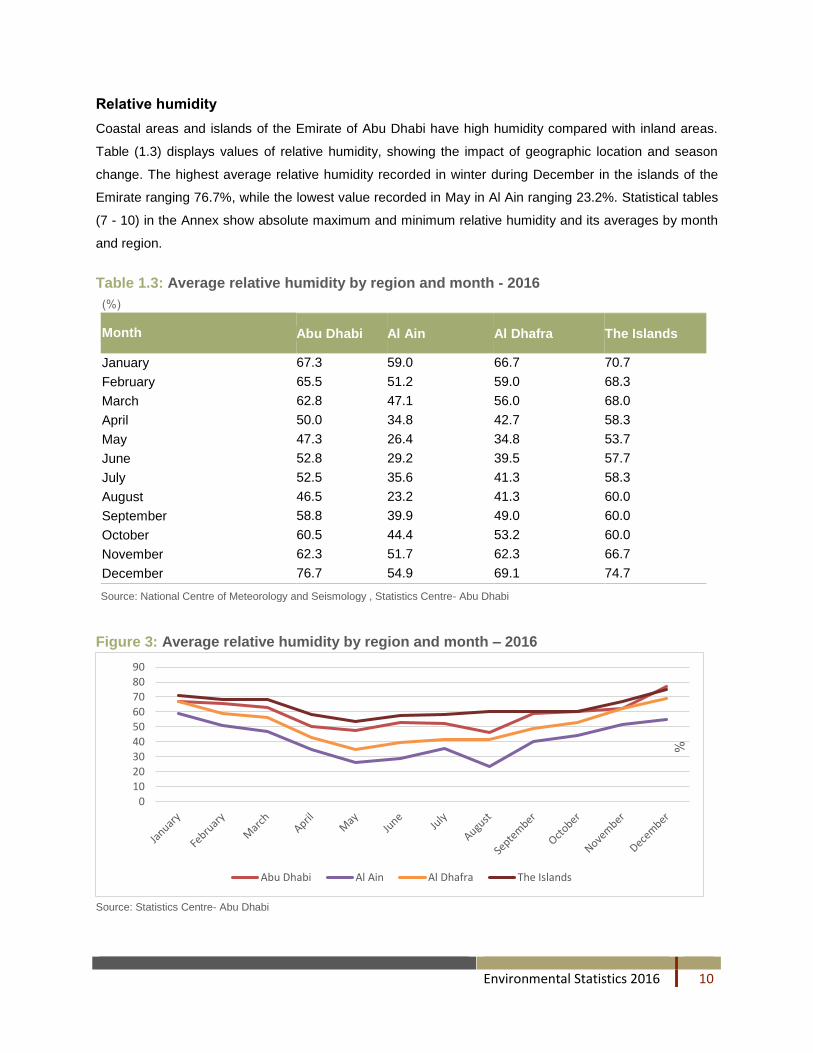
Coastal areas and islands of the Emirate of Abu Dhabi have high humidity compared with inland areas.
Table (1.3) displays values of relative humidity, showing the impact of geographic location and season
change. The highest average relative humidity recorded in winter during December in the islands of the
Emirate ranging 76.7%, while the lowest value recorded in May in Al Ain ranging 23.2%. Statistical tables
(7 - 10) in the Annex show absolute maximum and minimum relative humidity and its averages by month
and region.
Table 1.3: Average relative humidity by region and month - 2016
)%(
Month Abu Dhabi Al Ain Al Dhafra The Islands
January 67.3 59.0 66.7 70.7
February 65.5 51.2 59.0 68.3
March 62.8 47.1 56.0 68.0
April 50.0 34.8 42.7 58.3
May 47.3 26.4 34.8 53.7
June 52.8 29.2 39.5 57.7
July 52.5 35.6 41.3 58.3
August 46.5 23.2 41.3 60.0
September 58.8 39.9 49.0 60.0
October 60.5 44.4 53.2 60.0
November 62.3 51.7 62.3 66.7
December 76.7 54.9 69.1 74.7
Source: National Centre of Meteorology and Seismology , Statistics Centre- Abu Dhabi
Figure 3: Average relative humidity by region and month – 2016
Source: Statistics Centre- Abu Dhabi
0
102030405060
7080
90%
Abu Dhabi Al Ain Al Dhafra The Islands
Environmental Statistics 2016 11
Atmospheric Pressure
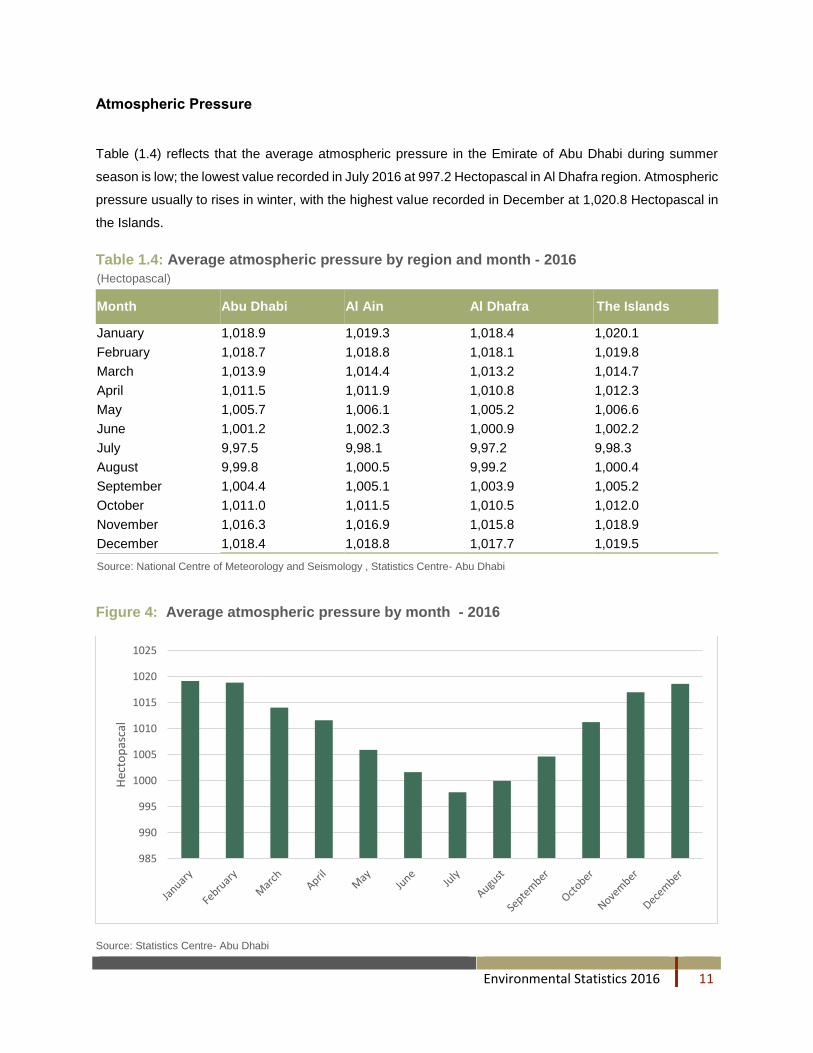
Table (1.4) reflects that the average atmospheric pressure in the Emirate of Abu Dhabi during summer
season is low; the lowest value recorded in July 2016 at 997.2 Hectopascal in Al Dhafra region. Atmospheric
pressure usually to rises in winter, with the highest value recorded in December at 1,020.8 Hectopascal in
the Islands.
Table 1.4: Average atmospheric pressure by region and month - 2016
(Hectopascal)
Month Abu Dhabi Al Ain Al Dhafra The Islands
January 1,018.9 1,019.3 1,018.4 1,020.1
February 1,018.7 1,018.8 1,018.1 1,019.8
March 1,013.9 1,014.4 1,013.2 1,014.7
April 1,011.5 1,011.9 1,010.8 1,012.3
May 1,005.7 1,006.1 1,005.2 1,006.6
June 1,001.2 1,002.3 1,000.9 1,002.2
July 9,97.5 9,98.1 9,97.2 9,98.3
August 9,99.8 1,000.5 9,99.2 1,000.4
September 1,004.4 1,005.1 1,003.9 1,005.2
October 1,011.0 1,011.5 1,010.5 1,012.0
November 1,016.3 1,016.9 1,015.8 1,018.9
December 1,018.4 1,018.8 1,017.7 1,019.5
Source: National Centre of Meteorology and Seismology , Statistics Centre- Abu Dhabi
Figure 4: Average atmospheric pressure by month - 2016
Source: Statistics Centre- Abu Dhabi
985
990
995
1000
1005
1010
1015
1020
1025
Hec
top
asca
l
Environmental Statistics 2016 12
Wind Speed
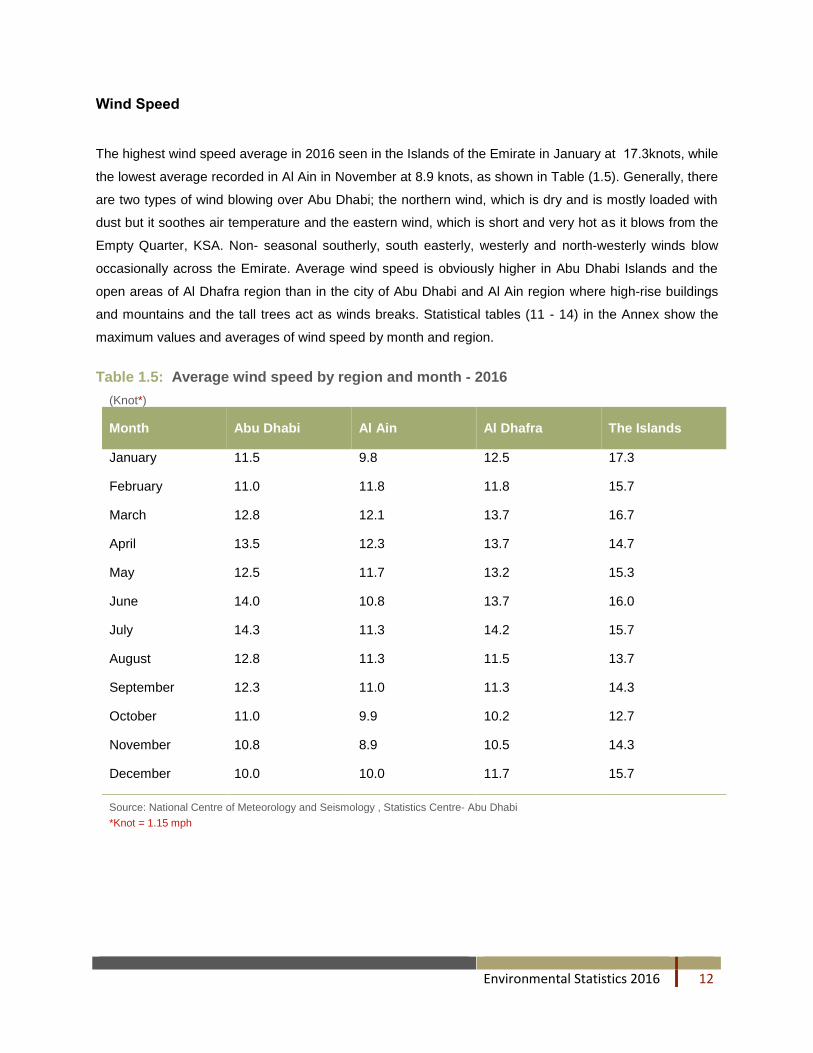
The highest wind speed average in 2016 seen in the Islands of the Emirate in January at 17.3 knots, while
the lowest average recorded in Al Ain in November at 8.9 knots, as shown in Table (1.5). Generally, there
are two types of wind blowing over Abu Dhabi; the northern wind, which is dry and is mostly loaded with
dust but it soothes air temperature and the eastern wind, which is short and very hot as it blows from the
Empty Quarter, KSA. Non- seasonal southerly, south easterly, westerly and north-westerly winds blow
occasionally across the Emirate. Average wind speed is obviously higher in Abu Dhabi Islands and the
open areas of Al Dhafra region than in the city of Abu Dhabi and Al Ain region where high-rise buildings
and mountains and the tall trees act as winds breaks. Statistical tables (11 - 14) in the Annex show the
maximum values and averages of wind speed by month and region.
Table 1.5: Average wind speed by region and month - 2016
(Knot*)
Month Abu Dhabi Al Ain Al Dhafra The Islands
January 11.5 9.8 12.5 17.3
February 11.0 11.8 11.8 15.7
March 12.8 12.1 13.7 16.7
April 13.5 12.3 13.7 14.7
May 12.5 11.7 13.2 15.3
June 14.0 10.8 13.7 16.0
July 14.3 11.3 14.2 15.7
August 12.8 11.3 11.5 13.7
September 12.3 11.0 11.3 14.3
October 11.0 9.9 10.2 12.7
November 10.8 8.9 10.5 14.3
December 10.0 10.0 11.7 15.7
Source: National Centre of Meteorology and Seismology , Statistics Centre- Abu Dhabi
*Knot = 1.15 mph
Environmental Statistics 2016 13
Solar Radiation
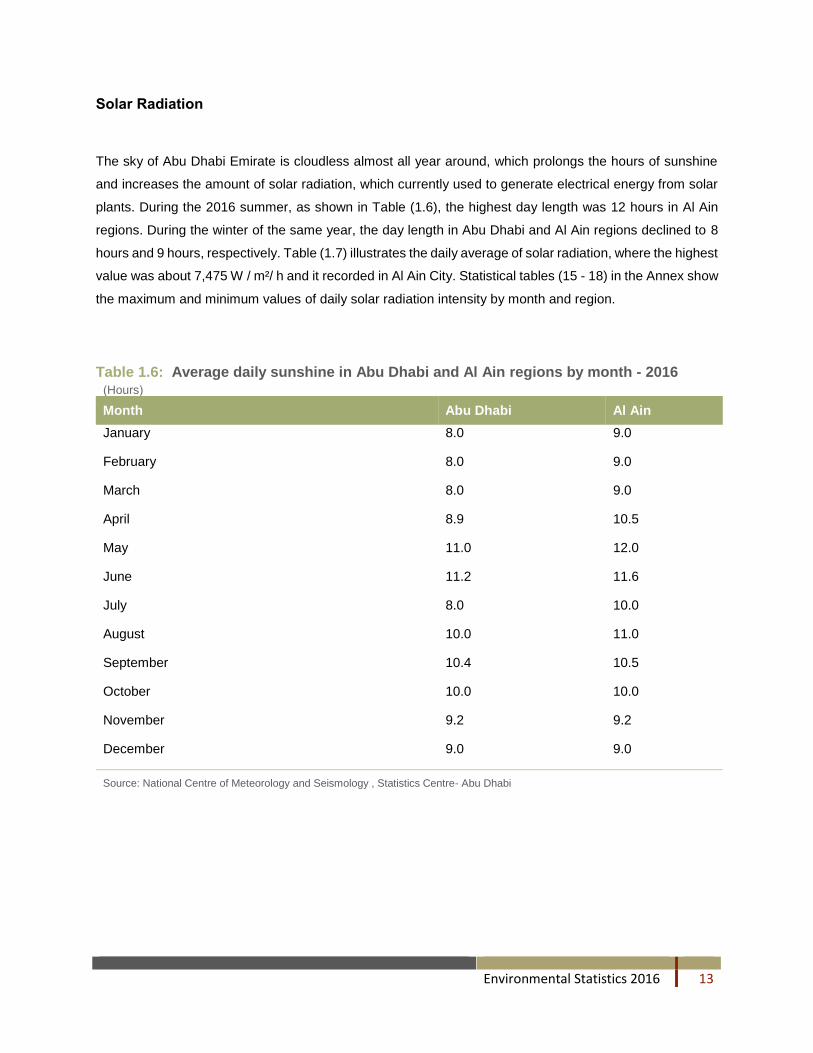
The sky of Abu Dhabi Emirate is cloudless almost all year around, which prolongs the hours of sunshine
and increases the amount of solar radiation, which currently used to generate electrical energy from solar
plants. During the 2016 summer, as shown in Table (1.6), the highest day length was 12 hours in Al Ain
regions. During the winter of the same year, the day length in Abu Dhabi and Al Ain regions declined to 8
hours and 9 hours, respectively. Table (1.7) illustrates the daily average of solar radiation, where the highest
value was about 7,475 W / m²/ h and it recorded in Al Ain City. Statistical tables (15 - 18) in the Annex show
the maximum and minimum values of daily solar radiation intensity by month and region.
Table 1.6: Average daily sunshine in Abu Dhabi and Al Ain regions by month - 2016 (Hours)
Month Abu Dhabi Al Ain
January 8.0 9.0
February 8.0 9.0
March 8.0 9.0
April 8.9 10.5
May 11.0 12.0
June 11.2 11.6
July 8.0 10.0
August 10.0 11.0
September 10.4 10.5
October 10.0 10.0
November 9.2 9.2
December 9.0 9.0
Source: National Centre of Meteorology and Seismology , Statistics Centre- Abu Dhabi
Environmental Statistics 2016 14
Table 1.7: Average daily total solar radiation by region and month - 2016 (Watt / m²/h)
Month Abu Dhabi Al Ain Al Dhafra The Islands
January 4,281.8 4,624.6 4,393.0 4,440.7
February 5,171.3 5,299.9 5,133.5 5,341.7
March 5,244.5 5,389.8 5,450.2 5,248.3
April 6,320.3 6,492.4 6,225.8 6,292.0
May 7,182.3 7,475.3 6,718.7 7,189.7
June 6,933.3 7,222.4 6,415.7 6,911.7
July 6,245.8 6,521.8 5,884.5 6,323.7
August 6,163.5 6,531.0 6,005.0 5,919.7
September 5,997.5 6,353.7 5,835.5 5,446.0
October 5,497.3 5616.0 5,227.5 5,181.3
November 4,870.0 4,814.7 4,543.8 4,397.0
December 4,617.7 4,407.8 4,171.1 4,000.3
Source: National Centre of Meteorology and Seismology , Statistics Centre- Abu Dhabi
Figure 5: Average daily total solar radiation by region and month - 2016
Source: Statistics Centre- Abu Dhabi
0
1000
2000
3000
4000
5000
6000
7000
8000
Wat
t/m
²/h
Abu Dhabi Al Ain Al Dhafra The Islands

Environmental Statistics 2016 15
Air Statistics
The Abu Dhabi government pays tireless efforts to improve air quality and to control harmful emissions;
entities and organizations established to protect environment from the dangers of pollutants, such as
reducing fuel combustion by generating electrical energy from renewable sources like sun and wind. The
Government of Abu Dhabi Emirate has issued strict laws and legislations to help reduce air pollution and
emissions and mitigate their impacts in order to maintain the health of those who live in the Emirate. In this
regard, the Council of Ministers issued Decree No. 12 of 2006 on Regulation Concerning Protection of Air
from Pollution which binding on both entities and individuals with pollutant types and maximum limits
permitted.
Air pollution figures in the Emirate of Abu Dhabi are generally within the accepted range. However, the
readings vary with different locations and activities. Stations were built on the roads to record and monitor
rates of pollution caused by emissions from vehicle exhausts. Likewise, readings taken from oil and
industrial activities, such as Mussafah industrial area, where pollution rates are higher than other regions
of the Emirate.
The location of Air Quality Monitoring stations
AbuDhabi ALain
ALDafra
Environmental Statistics 2016 16
Air quality in urban areas
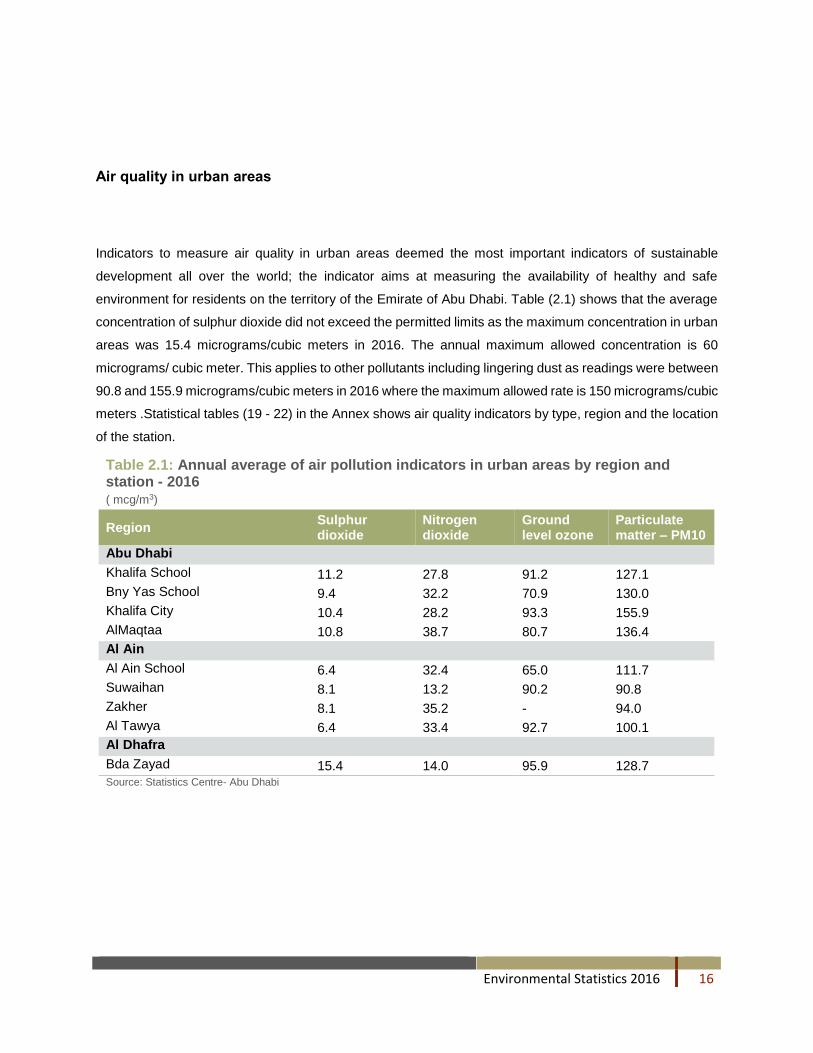
Indicators to measure air quality in urban areas deemed the most important indicators of sustainable
development all over the world; the indicator aims at measuring the availability of healthy and safe
environment for residents on the territory of the Emirate of Abu Dhabi. Table (2.1) shows that the average
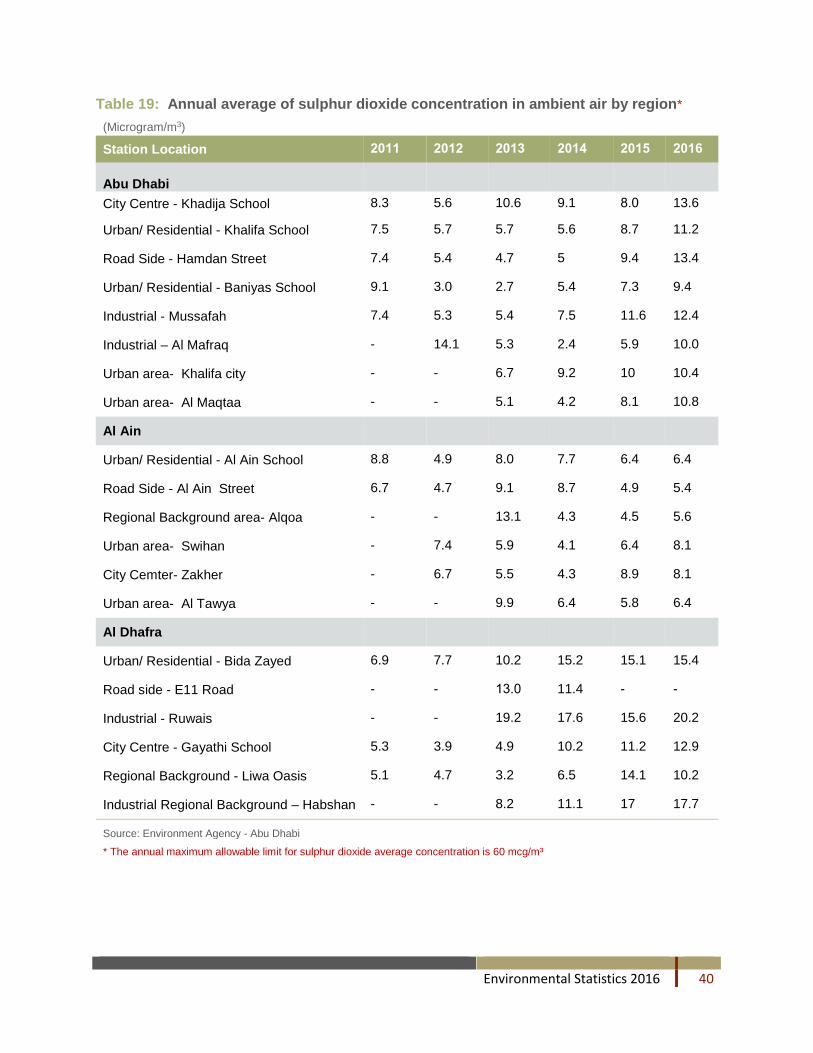
concentration of sulphur dioxide did not exceed the permitted limits as the maximum concentration in urban
areas was 15.4 micrograms/cubic meters in 2016. The annual maximum allowed concentration is 60
micrograms/ cubic meter. This applies to other pollutants including lingering dust as readings were between
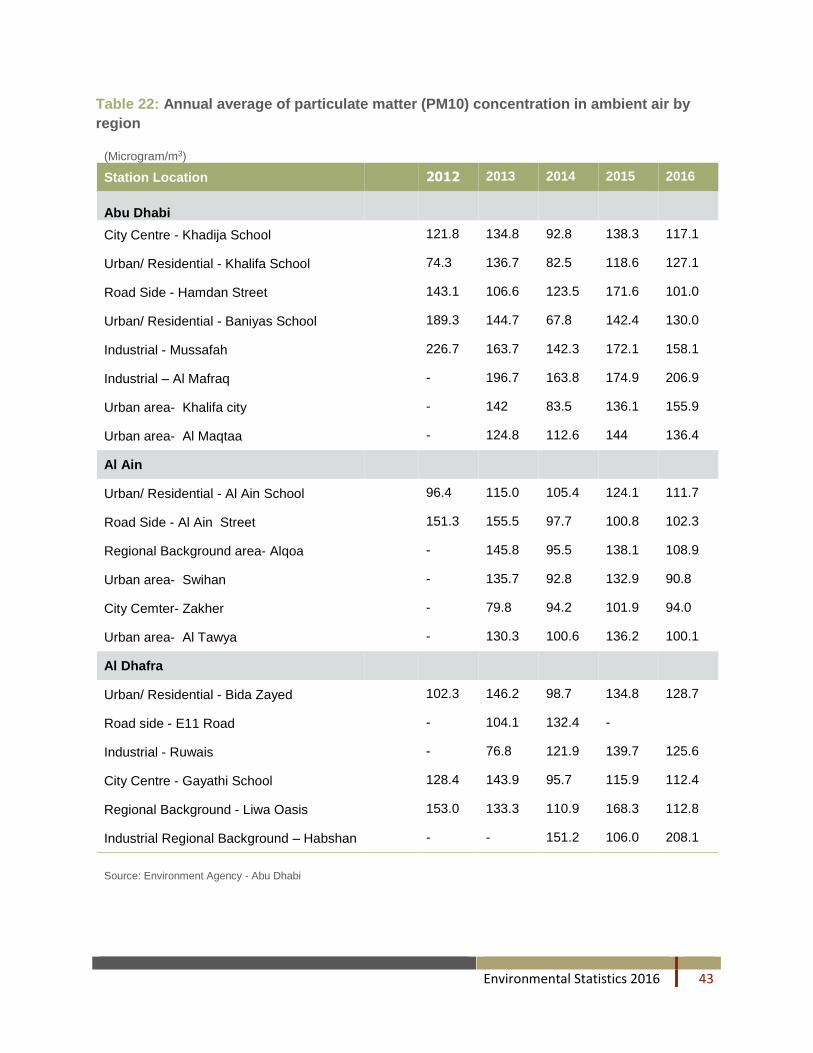
90.8 and 155.9 micrograms/cubic meters in 2016 where the maximum allowed rate is 150 micrograms/cubic
meters .Statistical tables (19 - 22) in the Annex shows air quality indicators by type, region and the location
of the station.
Table 2.1: Annual average of air pollution indicators in urban areas by region and station - 2016
( mcg/m3)
Region Sulphur dioxide
Nitrogen dioxide
Ground level ozone
Particulate matter – PM10
Abu Dhabi
Khalifa School 11.2 27.8 91.2 127.1
Bny Yas School 9.4 32.2 70.9 130.0
Khalifa City 10.4 28.2 93.3 155.9
AlMaqtaa 10.8 38.7 80.7 136.4
Al Ain
Al Ain School 6.4 32.4 65.0 111.7
Suwaihan 8.1 13.2 90.2 90.8
Zakher 8.1 35.2 - 94.0
Al Tawya 6.4 33.4 92.7 100.1
Al Dhafra
Bda Zayad 15.4 14.0 95.9 128.7 Source: Statistics Centre- Abu Dhabi

Environmental Statistics 2016 17
Concentration of carbon monoxide is measured in stations designed and placed in the roadsides to
measure the amount of gas released from car exhausts, concentration of carbon monoxide reached in
Hamdan Street in Abu Dhabi about 1.4 milligram/m3,followed by 0.8 milligram/m3 in a Ruwais station located
in Al Dhafra . Where in Al Ain region the annual average of carbon monoxide concentration did not exceed
0.6 milligram/m3.
Table 2.2: Annual average of carbon monoxide concentration in ambient air by region
(Milligram/m3)
Station Location 2012 2013 2014 2015 2016
Abu Dhabi
Road Side - Hamdan Street 0.9 0.9 1.1 1.8 1.4
Urban area- Al Maqtaa - 0.5 0.7 0.8 0.6
Al Ain
Road Side - Al Ain Street 1.2 1.2 0.9 1.0 0.6
Regional background - Alqoa - 0.3 0.3 0.6 0.3
Urban area- Swihan 0.1 0.4 0.5 0.7 0.5
Al Dhafra
Road side - E11 Road - 0.4 0.3 - -
Industrial - Ruwais - 0.3 0.3 1.1 0.8
Source: Environment Agency - Abu Dhabi
Environmental Statistics 2016 18
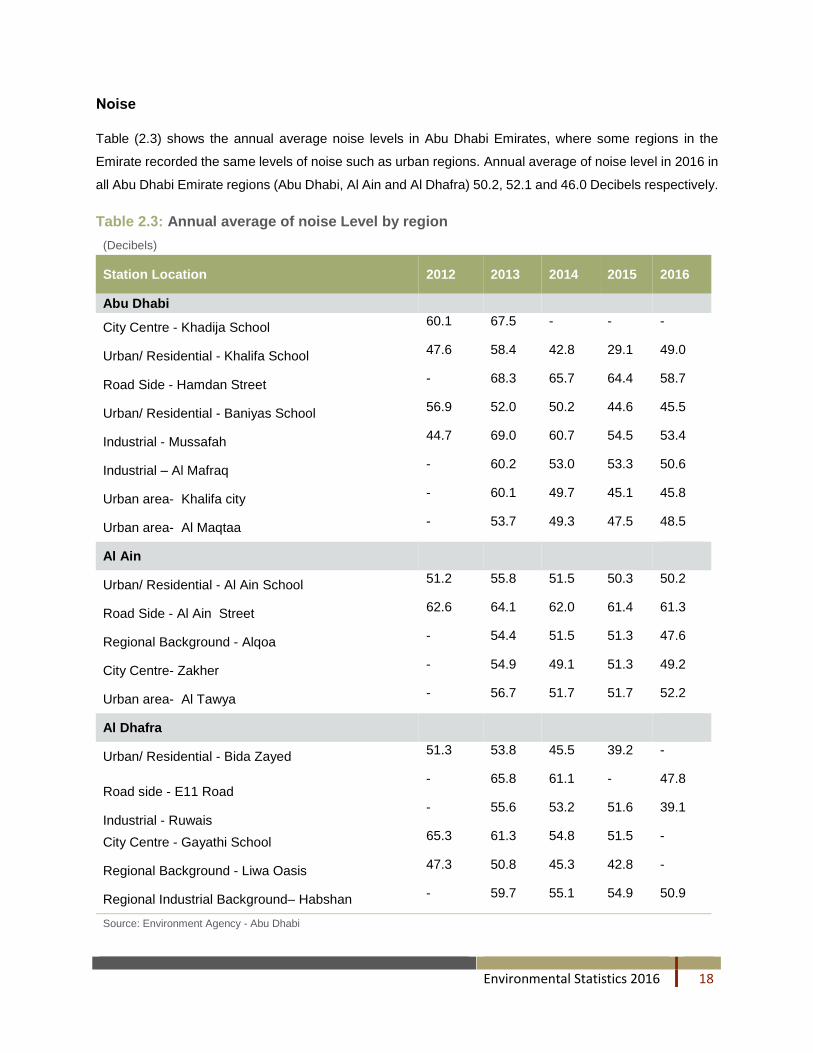
Noise
Table (2.3) shows the annual average noise levels in Abu Dhabi Emirates, where some regions in the
Emirate recorded the same levels of noise such as urban regions. Annual average of noise level in 2016 in
all Abu Dhabi Emirate regions (Abu Dhabi, Al Ain and Al Dhafra) 50.2, 52.1 and 46.0 Decibels respectively.
Table 2.3: Annual average of noise Level by region
(Decibels)
Station Location 2012 2013 2014 2015 2016
Abu Dhabi
City Centre - Khadija School 60.1 67.5 - - -
Urban/ Residential - Khalifa School 47.6 58.4 42.8 29.1 49.0
Road Side - Hamdan Street - 68.3 65.7 64.4 58.7
Urban/ Residential - Baniyas School 56.9 52.0 50.2 44.6 45.5
Industrial - Mussafah 44.7 69.0 60.7 54.5 53.4
Industrial – Al Mafraq - 60.2 53.0 53.3 50.6
Urban area- Khalifa city - 60.1 49.7 45.1 45.8
Urban area- Al Maqtaa - 53.7 49.3 47.5 48.5
Al Ain
Urban/ Residential - Al Ain School 51.2 55.8 51.5 50.3 50.2
Road Side - Al Ain Street 62.6 64.1 62.0 61.4 61.3
Regional Background - Alqoa - 54.4 51.5 51.3 47.6
City Centre- Zakher - 54.9 49.1 51.3 49.2
Urban area- Al Tawya - 56.7 51.7 51.7 52.2
Al Dhafra
Urban/ Residential - Bida Zayed 51.3 53.8 45.5 39.2 -
Road side - E11 Road - 65.8 61.1 - 47.8
Industrial - Ruwais - 55.6 53.2 51.6 39.1
City Centre - Gayathi School 65.3 61.3 54.8 51.5 -
Regional Background - Liwa Oasis 47.3 50.8 45.3 42.8 -
Regional Industrial Background– Habshan - 59.7 55.1 54.9 50.9
Source: Environment Agency - Abu Dhabi

Environmental Statistics 2016 19
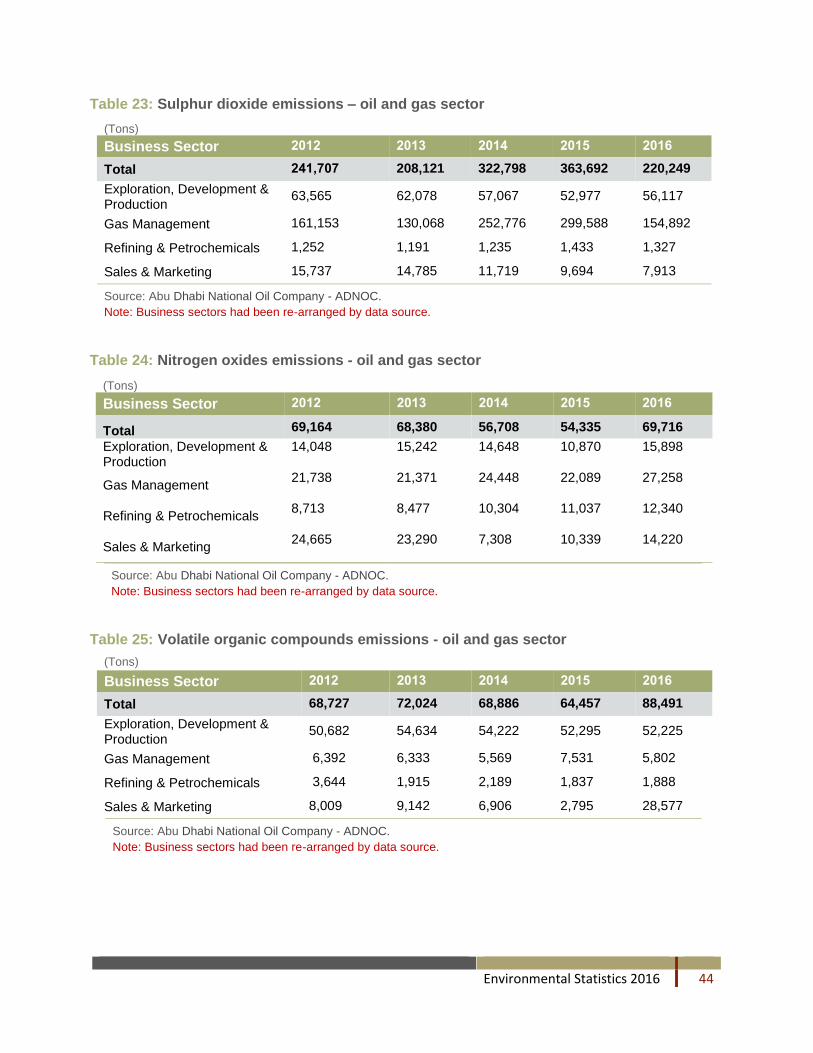
Air pollutant emissions - oil and as sector
Total air pollutant emissions sum up together the emissions of sulphur dioxide, nitrogen oxides and volatile
organic compounds. Table (2.4) and Figure (6) decrease that the total emissions form oil and gas sector in
2016 increases by 21.6% compared with 2015. Total emissions were 378,456 tons. The table shows
stability in emissions per capita in 2016 same as 2015, which recorded 0.13 tons. Statistical tables (23 -
25) show the amount of emissions by type of pollutant and by sectors in Abu Dhabi National Oil Company.
Table 2.4: Air pollutant total emissions – oil and gas sector
(Tons)
Pollutant 2012 2013 2014 2015 2016
Total 356,975 348,525 448,392 482,484 378,456
Sulphur dioxide (SO2) 217,925 208,121 322,798 363,692 220,249
Nitrogen oxides (NOx) 66,597 68,380 56,708 54,335 69,716
Volatile organic compounds (VOC) 72,453 72,024 68,886 64,457 88,491
Source: Abu Dhabi National Oil Company - ADNOC
Figure 6: Air pollutant total emissions - oil and gas sector
Source: Abu Dhabi National Oil Company, Statistics Centre- Abu Dhabi
0
100,000
200,000
300,000
400,000
500,000
600,000
2012 2013 2014 2015 2016
Sulphur dioxide (SO2) Nitrogen oxides (NOx) Volatile organic compounds (VOC)
Environmental Statistics 2016 20
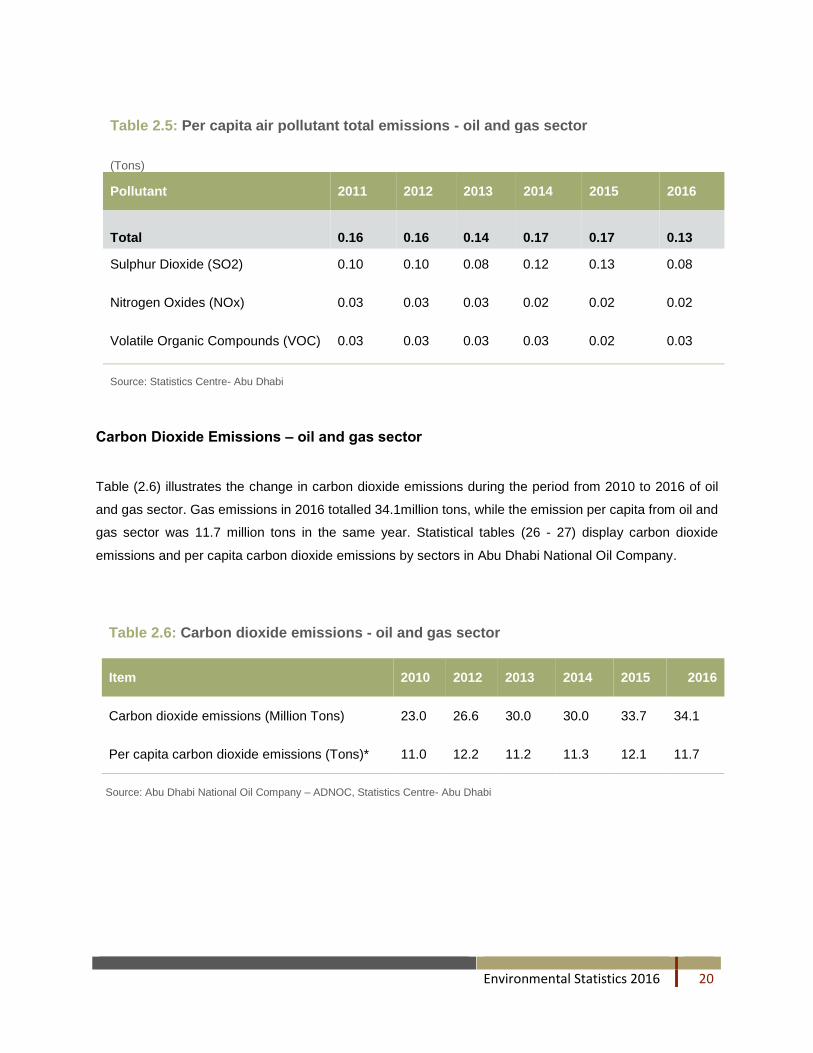
Table 2.5: Per capita air pollutant total emissions - oil and gas sector
(Tons)
Pollutant 2011 2012 2013 2014 2015 2016
Total 0.16 0.16 0.14 0.17 0.17 0.13
Sulphur Dioxide (SO2) 0.10 0.10 0.08 0.12 0.13 0.08
Nitrogen Oxides (NOx) 0.03 0.03 0.03 0.02 0.02 0.02
Volatile Organic Compounds (VOC) 0.03 0.03 0.03 0.03 0.02 0.03
Source: Statistics Centre- Abu Dhabi
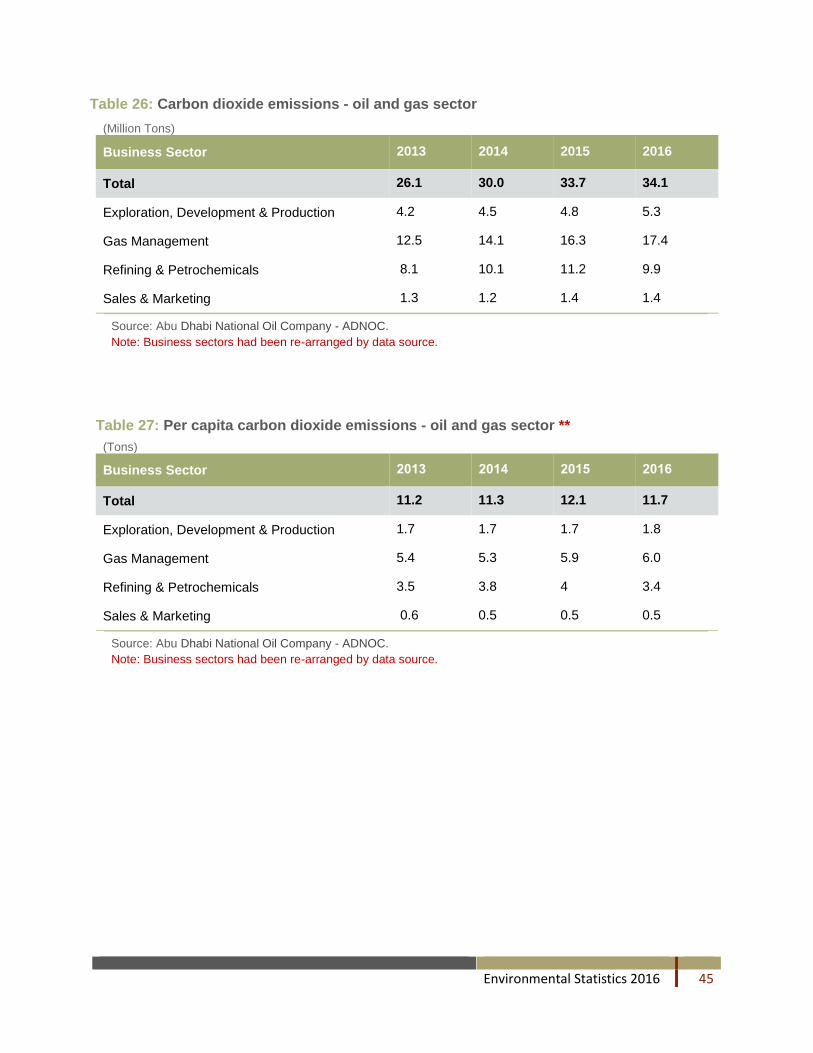
Carbon Dioxide Emissions – oil and gas sector
Table (2.6) illustrates the change in carbon dioxide emissions during the period from 2010 to 2016 of oil
and gas sector. Gas emissions in 2016 totalled 34.1million tons, while the emission per capita from oil and
gas sector was 11.7 million tons in the same year. Statistical tables (26 - 27) display carbon dioxide
emissions and per capita carbon dioxide emissions by sectors in Abu Dhabi National Oil Company.
Table 2.6: Carbon dioxide emissions - oil and gas sector
Item 2010 2012 2013 2014 2015 2016
Carbon dioxide emissions (Million Tons) 23.0 26.6 30.0 30.0 33.7 34.1
Per capita carbon dioxide emissions (Tons)* 11.0 12.2 11.2 11.3 12.1 11.7
Source: Abu Dhabi National Oil Company – ADNOC, Statistics Centre- Abu Dhabi
Environmental Statistics 2016 21
Water statistics
Non-conventional water resources
The amount of non-conventional water resources including the total amount of consumed desalinated water
and the reused sewage water in 2016 totaled 1,283 MCM, and decrease of 3.16% compared with 2015.
Table 3.1: Total amount of used waster from non-conventional resources by type
(Million cubic meter)
Type 2011 2012 2013 2014 2015 2016
Total 1,094 1,198 1,237 1,318 1,325 1,282
Desalinated water consumption 961 1,059 1,083 1,126 1,154 1,116
Quantity of treated wastewater reuse 133 139 154 192 171 166
Source: Statistics Centre- Abu Dhabi
Wastewater
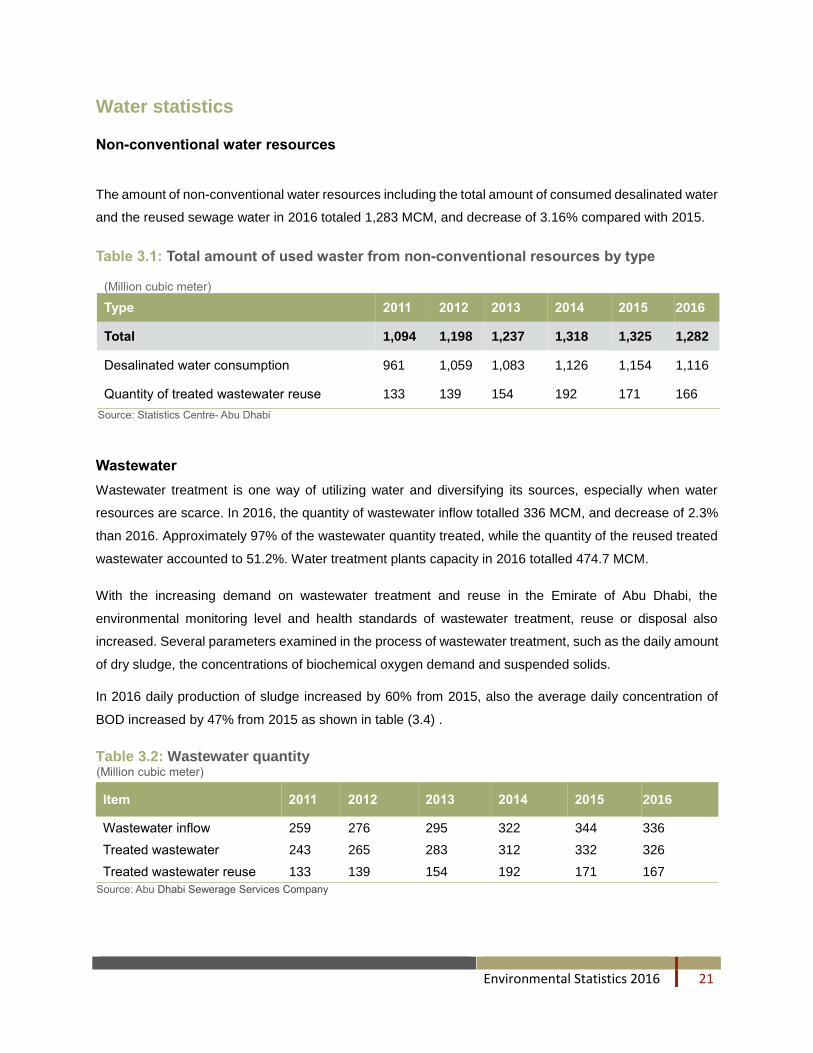
Wastewater treatment is one way of utilizing water and diversifying its sources, especially when water
resources are scarce. In 2016, the quantity of wastewater inflow totalled 336 MCM, and decrease of 2.3%
than 2016. Approximately 97% of the wastewater quantity treated, while the quantity of the reused treated
wastewater accounted to 51.2%. Water treatment plants capacity in 2016 totalled 474.7 MCM.
With the increasing demand on wastewater treatment and reuse in the Emirate of Abu Dhabi, the
environmental monitoring level and health standards of wastewater treatment, reuse or disposal also
increased. Several parameters examined in the process of wastewater treatment, such as the daily amount
of dry sludge, the concentrations of biochemical oxygen demand and suspended solids.
In 2016 daily production of sludge increased by 60% from 2015, also the average daily concentration of
BOD increased by 47% from 2015 as shown in table (3.4) .
Table 3.2: Wastewater quantity (Million cubic meter)
Item 2011 2012 2013 2014 2015 2016
Wastewater inflow 259 276 295 322 344 336
Treated wastewater 243 265 283 312 332 326
Treated wastewater reuse 133 139 154 192 171 167
Source: Abu Dhabi Sewerage Services Company
Environmental Statistics 2016 22
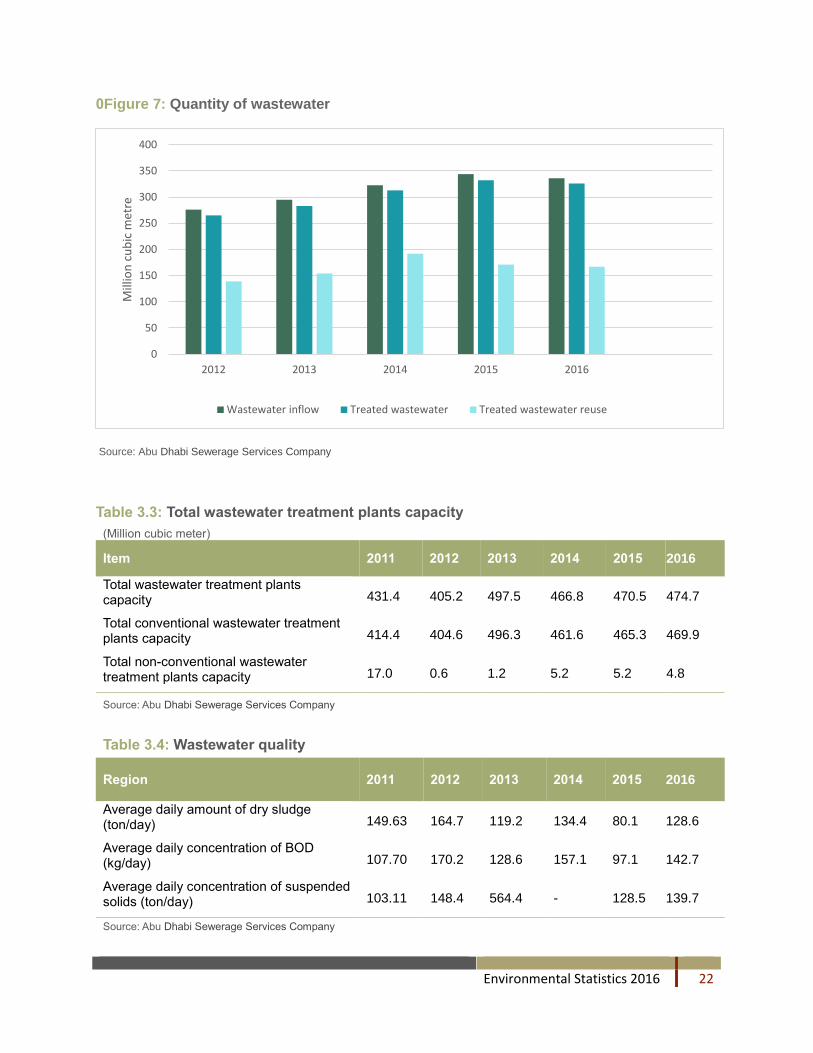
0Figure 7: Quantity of wastewater
Source: Abu Dhabi Sewerage Services Company
Table 3.3: Total wastewater treatment plants capacity
(Million cubic meter)
Item 2011 2012 2013 2014 2015 2016
Total wastewater treatment plants capacity 431.4 405.2 497.5 466.8 470.5 474.7
Total conventional wastewater treatment plants capacity 414.4 404.6 496.3 461.6 465.3 469.9
Total non-conventional wastewater treatment plants capacity 17.0 0.6 1.2 5.2 5.2 4.8
Source: Abu Dhabi Sewerage Services Company
Table 3.4: Wastewater quality
Region 2011 2012 2013 2014 2015 2016
Average daily amount of dry sludge (ton/day) 149.63 164.7 119.2 134.4 80.1 128.6
Average daily concentration of BOD (kg/day) 107.70 170.2 128.6 157.1 97.1 142.7
Average daily concentration of suspended solids (ton/day) 103.11 148.4 564.4 - 128.5 139.7
Source: Abu Dhabi Sewerage Services Company
0
50
100
150
200
250
300
350
400
2012 2013 2014 2015 2016
Mill
ion
cu
bic
met
re
Wastewater inflow Treated wastewater Treated wastewater reuse
Environmental Statistics 2016 23
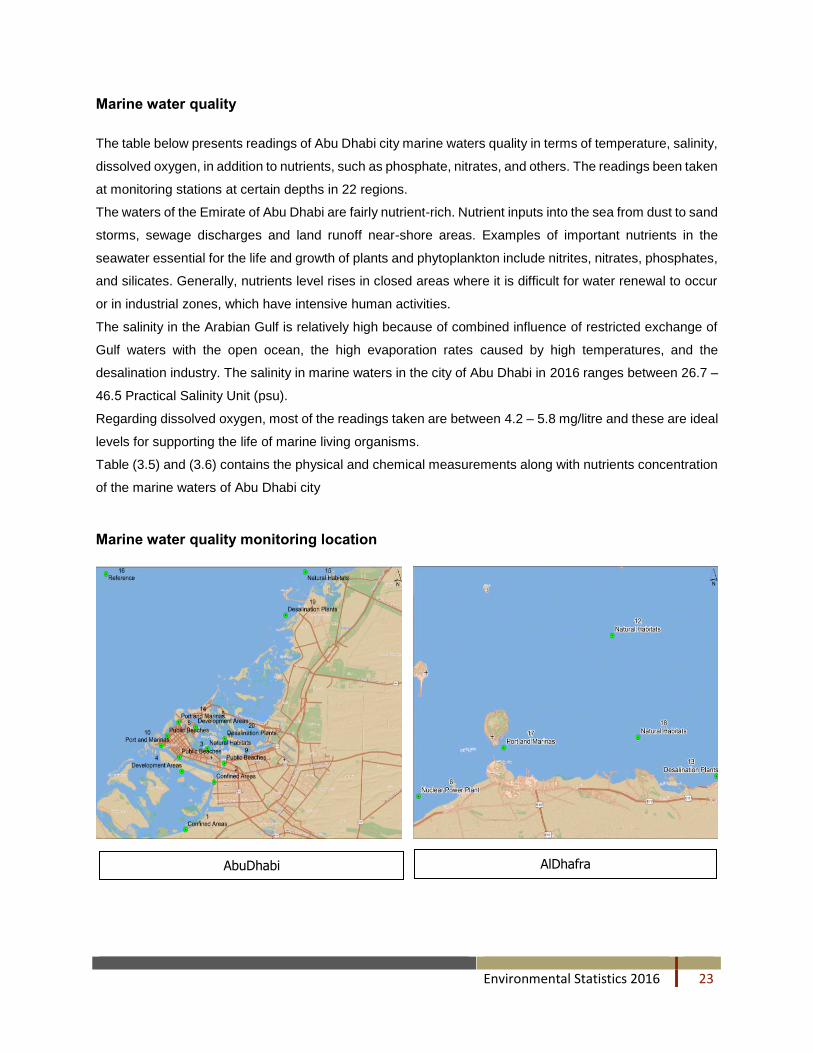
Marine water quality
The table below presents readings of Abu Dhabi city marine waters quality in terms of temperature, salinity,
dissolved oxygen, in addition to nutrients, such as phosphate, nitrates, and others. The readings been taken
at monitoring stations at certain depths in 22 regions.
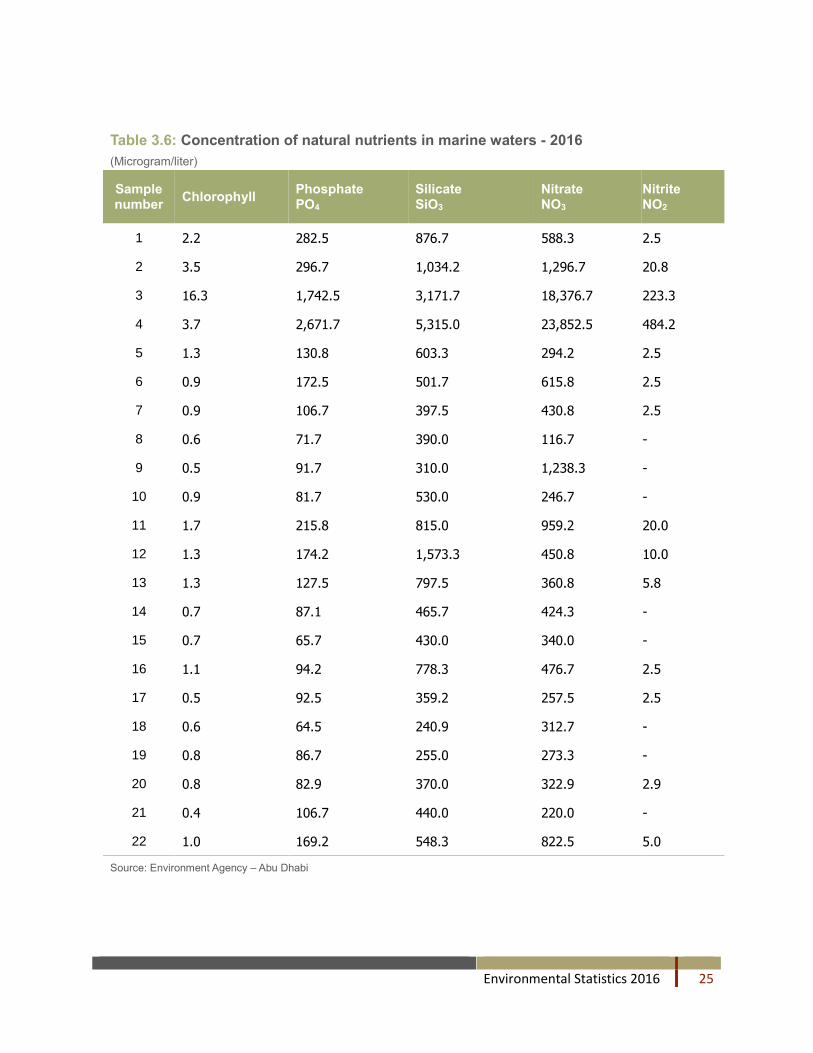
The waters of the Emirate of Abu Dhabi are fairly nutrient-rich. Nutrient inputs into the sea from dust to sand
storms, sewage discharges and land runoff near-shore areas. Examples of important nutrients in the
seawater essential for the life and growth of plants and phytoplankton include nitrites, nitrates, phosphates,
and silicates. Generally, nutrients level rises in closed areas where it is difficult for water renewal to occur
or in industrial zones, which have intensive human activities.
The salinity in the Arabian Gulf is relatively high because of combined influence of restricted exchange of
Gulf waters with the open ocean, the high evaporation rates caused by high temperatures, and the
desalination industry. The salinity in marine waters in the city of Abu Dhabi in 2016 ranges between 26.7 –
46.5 Practical Salinity Unit (psu).
Regarding dissolved oxygen, most of the readings taken are between 4.2 – 5.8 mg/litre and these are ideal
levels for supporting the life of marine living organisms.
Table (3.5) and (3.6) contains the physical and chemical measurements along with nutrients concentration
of the marine waters of Abu Dhabi city
Marine water quality monitoring location
AbuDhabi AlDhafra

Environmental Statistics 2016 24
Table 3.5: Marine waters quality in the city Abu Dhabi - 2016
Sample number
Secchi Depth
Acidity Salinity Temperature Dissolved Oxygen
Biochemical Oxygen Demand (BOD)
(m) (pH) (psu) (oC) (mg/L) (mg/L)
1 4.3 8.3 45.0 27.3 4.9 2.9
2 5.8 8.3 45.9 27.8 5.0 2.9
3 7.3 8.1 44.5 28.1 4.7 2.8
4 7.3 8.1 44.7 27.9 4.7 2.9
5 7.3 8.1 44.2 28.1 4.7 3.4
6 17.5 8.1 44.8 26.6 5.1 2.8
7 14.5 8.1 44.7 26.8 5.0 2.8
8 7.8 8.1 43.3 28.5 4.9 2.9
9 5.1 8.1 46.3 28.3 4.8 3.5
10 6.2 8.1 43.6 28.3 4.7 3.0
11 4.8 8.0 46.2 27.8 4.3 3.2
12 10.7 8.1 43.6 26.1 5.0 2.8
13 7.1 8.1 46.2 26.6 5.1 2.8
14 7.0 8.1 43.2 28.6 4.7 3.0
15 12.3 8.1 42.4 28.0 4.8 2.7
16 20.1 8.1 41.0 28.4 5.0 3.1
17 17.2 8.2 45.4 26.5 5.0 2.8
18 11.3 8.1 45.6 26.2 5.0 2.8
19 2.4 8.0 44.9 29.4 4.5 4.0
20 2.6 8.1 46.2 30.7 5.2 3.0
Source: Environment Agency – Abu Dhabi
Environmental Statistics 2016 25
Table 3.6: Concentration of natural nutrients in marine waters - 2016
(Microgram/liter)
Sample number
Chlorophyll Phosphate PO4
Silicate SiO3
Nitrate NO3
Nitrite NO2
1 2.2 282.5 876.7 588.3 2.5
2 3.5 296.7 1,034.2 1,296.7 20.8
3 16.3 1,742.5 3,171.7 18,376.7 223.3
4 3.7 2,671.7 5,315.0 23,852.5 484.2
5 1.3 130.8 603.3 294.2 2.5
6 0.9 172.5 501.7 615.8 2.5
7 0.9 106.7 397.5 430.8 2.5
8 0.6 71.7 390.0 116.7 -
9 0.5 91.7 310.0 1,238.3 -
10 0.9 81.7 530.0 246.7 -
11 1.7 215.8 815.0 959.2 20.0
12 1.3 174.2 1,573.3 450.8 10.0
13 1.3 127.5 797.5 360.8 5.8
14 0.7 87.1 465.7 424.3 -
15 0.7 65.7 430.0 340.0 -
16 1.1 94.2 778.3 476.7 2.5
17 0.5 92.5 359.2 257.5 2.5
18 0.6 64.5 240.9 312.7 -
19 0.8 86.7 255.0 273.3 -
20 0.8 82.9 370.0 322.9 2.9
21 0.4 106.7 440.0 220.0 -
22 1.0 169.2 548.3 822.5 5.0
Source: Environment Agency – Abu Dhabi
Environmental Statistics 2016 26
Health and safety statistics
Maintaining public health is the core base in improving living standards in developed countries, therefore
governments establish regulatory bodies and institutions that work to ensure the safety of food, and in return
they sought to improve medical and therapeutic services to ensure the preservation of public health. Food
safety deals with food preparation and storage. It aims at preventing food poisoning and foodborne illnesses
and the preparation of plans and working methods to solve problems facing various business sectors in the
Emirate. It also aims at providing secure working environments through identifying and controlling risks and
minimizing the possibility of accidents occurrence.
Food Poisoning and foodborne illnesses
Food poisoning is defined as an illness caused by consuming foods or drinks contaminated with bacteria,
viruses, or poisons, with different severity levels that may sometimes cause death. Symptoms of food
poisoning usually include nausea, vomiting, and abdominal cramps, diarrhoea, fever, shivering, and others.
Such symptoms may affect one person or a group of people who have had the same contaminated foods
or drinks. As a result of the increasing number of problems related to food safety and consumer worries,
governments exert huge efforts to improve food safety and human health.
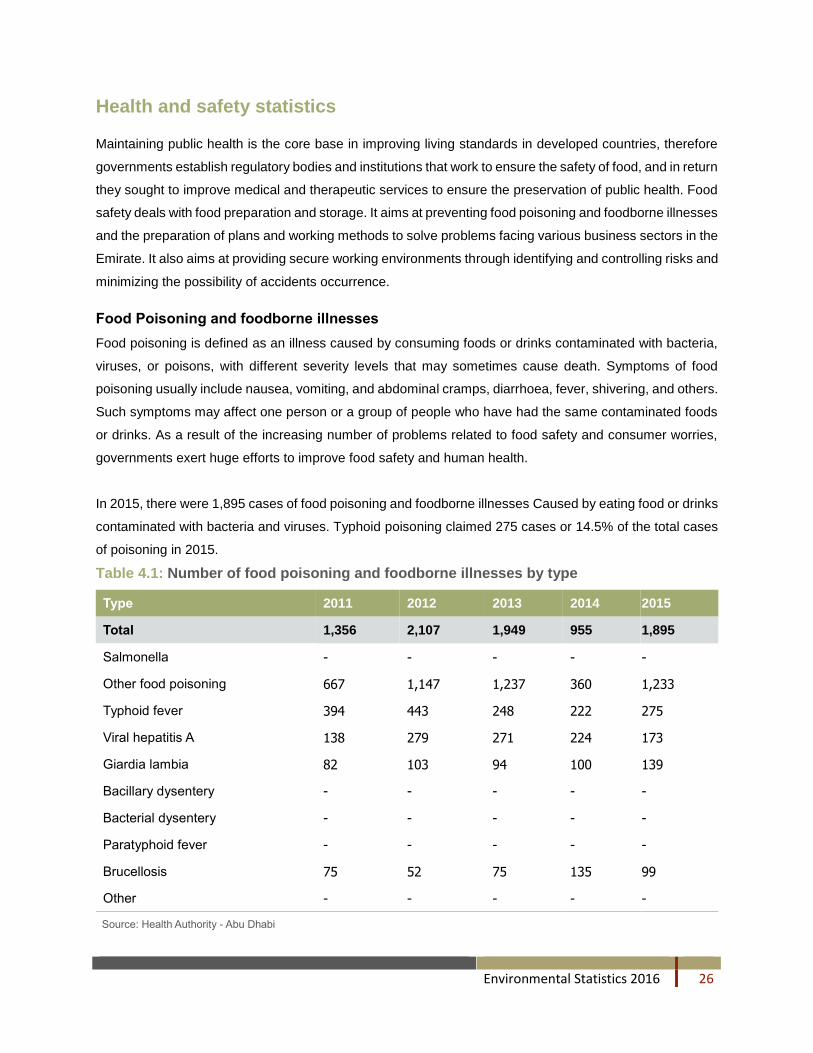
In 2015, there were 1,895 cases of food poisoning and foodborne illnesses Caused by eating food or drinks
contaminated with bacteria and viruses. Typhoid poisoning claimed 275 cases or 14.5% of the total cases
of poisoning in 2015.
Table 4.1: Number of food poisoning and foodborne illnesses by type
Type 2011 2012 2013 2014 2015
Total 1,356 2,107 1,949 955 1,895
Salmonella - - - - -
Other food poisoning 667 1,147 1,237 360 1,233
Typhoid fever 394 443 248 222 275
Viral hepatitis A 138 279 271 224 173
Giardia lambia 82 103 94 100 139
Bacillary dysentery - - - - -
Bacterial dysentery - - - - -
Paratyphoid fever - - - - -
Brucellosis 75 52 75 135 99
Other - - - - -
Source: Health Authority - Abu Dhabi
Environmental Statistics 2016 27
Waste statistics
Abu Dhabi government ensures applying the proper and sustainable use of natural resources and
encourages decreasing the production of waste from its sources, in addition to monitoring all activities
related to waste management in order to overcome the environmental and economic damages resulted
from improper disposal of waste. Improper disposal of waste may result in polluting ground and seawater
and harming both coastal and urban areas. Even if waste is disposed through the proper means of
imbedding, it requires large areas of land, which may not be available for many countries.
Consequently, an increasing need for safe and effective waste management system emerges along with
waste recycling that conserves the environment and contributes economic benefits to society and its
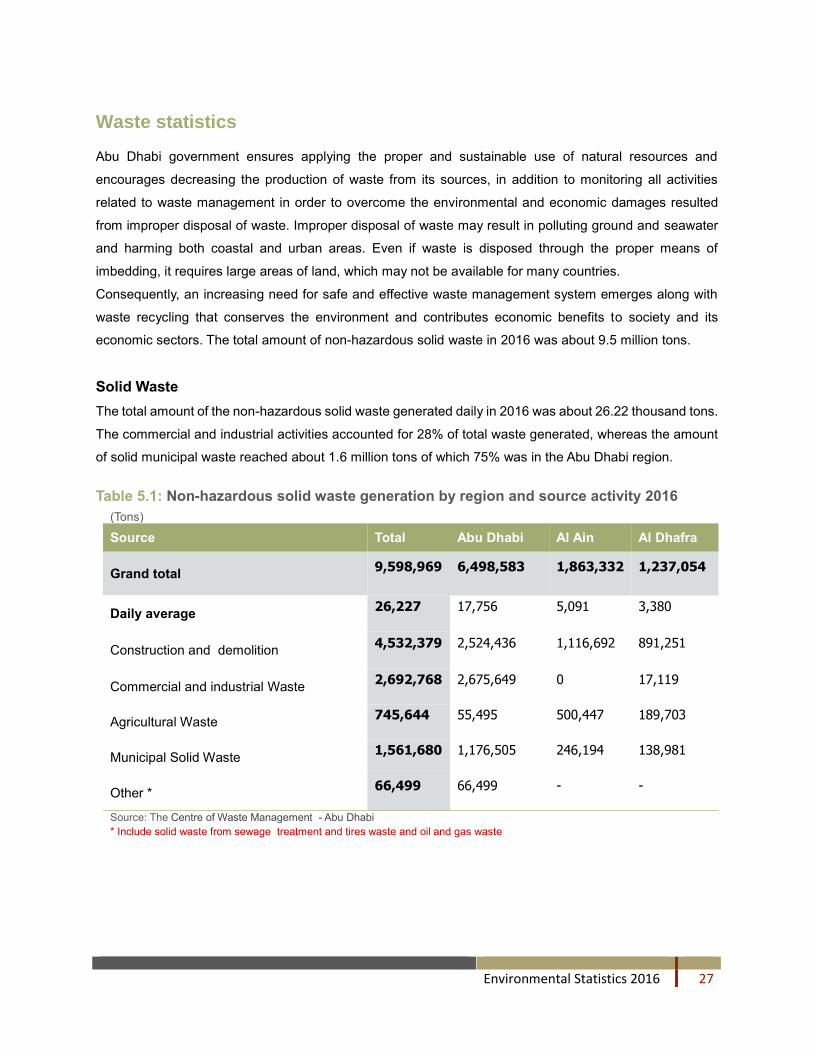
economic sectors. The total amount of non-hazardous solid waste in 2016 was about 9.5 million tons.
Solid Waste
The total amount of the non-hazardous solid waste generated daily in 2016 was about 26.22 thousand tons.
The commercial and industrial activities accounted for 28% of total waste generated, whereas the amount
of solid municipal waste reached about 1.6 million tons of which 75% was in the Abu Dhabi region.
Table 5.1: Non-hazardous solid waste generation by region and source activity 2016
(Tons)
Source Total Abu Dhabi Al Ain Al Dhafra
Grand total 9,598,969 6,498,583 1,863,332 1,237,054
Daily average 26,227 17,756 5,091 3,380
Construction and demolition 4,532,379 2,524,436 1,116,692 891,251
Commercial and industrial Waste 2,692,768 2,675,649 0 17,119
Agricultural Waste 745,644 55,495 500,447 189,703
Municipal Solid Waste 1,561,680 1,176,505 246,194 138,981
Other * 66,499 66,499 - -
Source: The Centre of Waste Management - Abu Dhabi
* Include solid waste from sewage treatment and tires waste and oil and gas waste
Environmental Statistics 2016 28
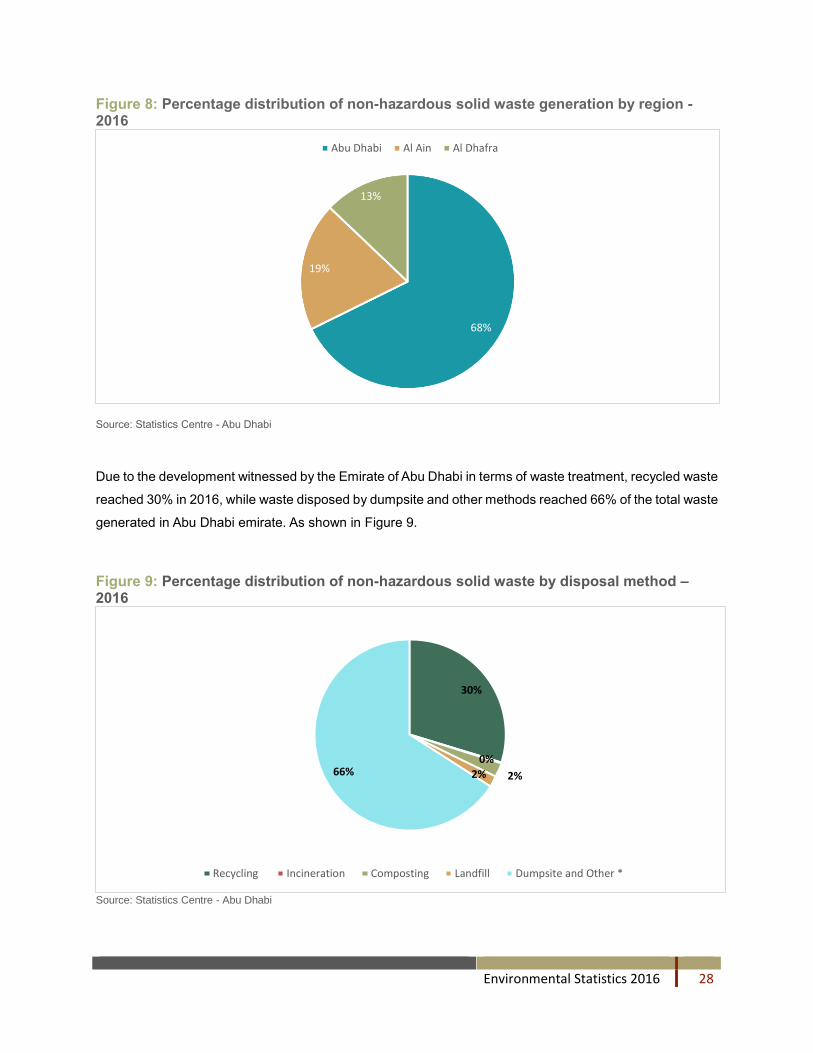
Figure 8: Percentage distribution of non-hazardous solid waste generation by region - 2016
Source: Statistics Centre - Abu Dhabi
Due to the development witnessed by the Emirate of Abu Dhabi in terms of waste treatment, recycled waste
reached 30% in 2016, while waste disposed by dumpsite and other methods reached 66% of the total waste
generated in Abu Dhabi emirate. As shown in Figure 9.
Figure 9: Percentage distribution of non-hazardous solid waste by disposal method – 6201
Source: Statistics Centre - Abu Dhabi
68%
19%
13%
Abu Dhabi Al Ain Al Dhafra
30%
0%
2%2%66%
Recycling Incineration Composting Landfill Dumpsite and Other *
Environmental Statistics 2016 29
Biodiversity Statistics
Biodiversity supports life on earth since people ultimately depend on biodiversity products and services on
a daily basis, such as clean water, clean air and food products, as well as many other products such as
wood products. Biodiversity is also essential in the medical field; medicinal plants still considered the most
common medication tools in traditional medicine. On the other hand, diversity of plants, animals and
microbes is an integral part of bio-medical research and pharmacology. Thus, loss in biodiversity means
that we are losing, before discovery, many health benefits that ecosystems can provide. Ecotourism is
another key service provided by biodiversity, in addition to the important role, that biodiversity play in
preserving local heritage and symbols such as the connection between falcons and falconry.
Known and threatened species
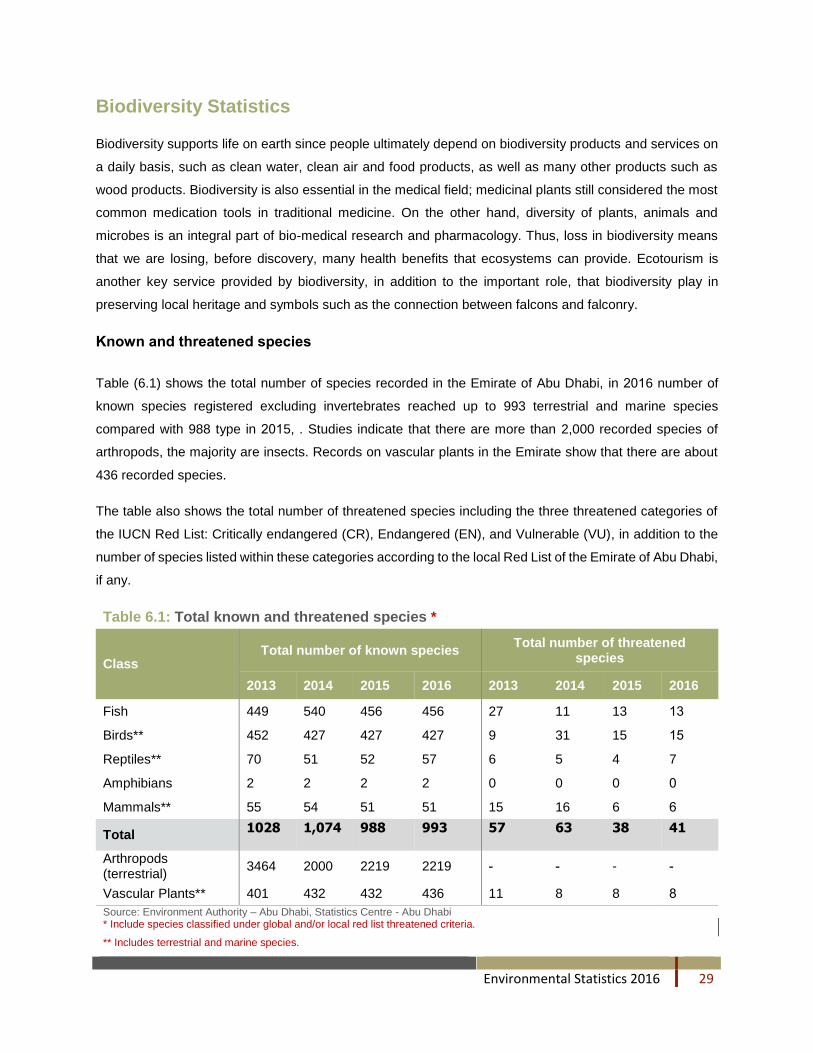
Table (6.1) shows the total number of species recorded in the Emirate of Abu Dhabi, in 2016 number of
known species registered excluding invertebrates reached up to 993 terrestrial and marine species
compared with 988 type in 2015, . Studies indicate that there are more than 2,000 recorded species of
arthropods, the majority are insects. Records on vascular plants in the Emirate show that there are about
436 recorded species.
The table also shows the total number of threatened species including the three threatened categories of
the IUCN Red List: Critically endangered (CR), Endangered (EN), and Vulnerable (VU), in addition to the
number of species listed within these categories according to the local Red List of the Emirate of Abu Dhabi,
if any.
Table 6.1: Total known and threatened species *
Class Total number of known species
Total number of threatened species
2013 2014 2015 2016 2013 2014 2015 2016
Fish 449 540 456 456 27 11 13 13
Birds** 452 427 427 427 9 31 15 15
Reptiles** 70 51 52 57 6 5 4 7
Amphibians 2 2 2 2 0 0 0 0
Mammals** 55 54 51 51 15 16 6 6
Total 1028 1,074 988 993 57 63 38 41
Arthropods (terrestrial)
3464 2000 2219 2219 - - - -
Vascular Plants** 401 432 432 436 11 8 8 8
Source: Environment Authority – Abu Dhabi, Statistics Centre - Abu Dhabi * Include species classified under global and/or local red list threatened criteria.
** Includes terrestrial and marine species.

Environmental Statistics 2016 30
Figure 10, shows the percentage distribution of the total threatened species from the total known species.
The endangered species falls within the threatened categories of the global Red List, and other species
within the threatened categories of the local Red List. The rate of threaten reptiles increased in 2016 by
75% from 2015. While each of birds and mammals, threaten species rates 2015 and 2016 about 3.5% and
11.8% of the total known species of each class, respectively.
Figure 10: Percentage of threatened species from total known species - 2016
Source: Statistics Centre - Abu Dhabi
3% 3%
12%
0%
12%
2%
0%
2%
4%
6%
8%
10%
12%
14%
Fish Birds** Reptiles** Amphibians Mammals** Vascular Plants**

Environmental Statistics 2016 31
Statistical Tables
Table 1 : Air temperature by month, Abu Dhabi - 2016
(Degree Celsius)
Month Monthly average
Absolute minimum
Average minimum
Absolute maximum
Average maximum
January 19.3 7.3 14.6 31.5 22.9
February 19.8 5.0 14.0 35.2 23.5
March 23.9 9.4 19.3 38.1 26.9
April 26.3 10.5 20.6 43.4 29.8
May 31.4 16.4 25.0 45.8 34.9
June 33.2 19.0 28.0 49.0 37.0
July 35.8 24.9 30.9 49.3 39.6
August 36.1 22.9 30.1 48.9 41.0
September 33.3 22.4 28.2 47.4 37.4
October 29.1 16.2 22.7 40.7 33.6
November 25.6 11.9 20.2 36.0 30.0
December 22.0 7.6 17.3 33.8 25.5
Source: National Centre of Meteorology and Seismology , Statistics Centre- Abu Dhabi
Table 2 : Air temperature by month, Al Ain - 2016
(Degree Celsius)
Month Monthly average
Absolute minimum
Average minimum
Absolute maximum
Average maximum
January 18.2 3.9 12.5 31.8 17.3
February 19.8 7.0 13.1 36.0 19.7
March 24.0 11.3 18.0 37.2 23.0
April 26.7 9.8 19.9 43.5 25.7
May 33.2 18.2 25.3 47.6 33.0
June 35.6 22.0 28.3 49.3 43.1
July 37.0 23.5 30.6 50.7 36.9
August 37.6 20.4 31.0 48.9 37.2
September 34.0 19.5 27.8 48.2 33.4
October 29.1 18.6 22.9 42.2 28.4
November 24.4 13.7 18.7 36.6 23.7
December 21.6 8.9 15.6 37.0 21.9
Source: National Centre of Meteorology and Seismology, Statistics Centre- Abu Dhabi
Environmental Statistics 2016 32
Table 3 : Air temperature by month, Al Dhafra - 2016
(Degree Celsius)
Month Monthly average
Absolute minimum
Average minimum
Absolute maximum
Average maximum
January 18.4 5.3 12.4 31.5 22.5
February 19.5 5.0 12.7 37.1 23.0
March 24.5 9.4 18.5 39.8 27.0
April 27.5 9.9 20.3 44.6 29.6
May 33.5 16.3 24.9 47.6 35.2
June 35.0 19.0 27.0 48.6 36.0
July 37.2 25.3 30.2 49.6 39.4
August 37.5 23.8 30.1 49.7 40.0
September 34.3 22.1 27.4 48.6 36.9
October 29.4 15.2 22.8 42.5 32.5
November 24.8 12.3 18.5 36.9 28.9
December 21.6 7.3 15.6 35.1 25.0
Source: National Centre of Meteorology and Seismology, Statistics Centre- Abu Dhabi
Table 4 : Air temperature by month, The Islands - 2016
(Degree Celsius)
Month Monthly average
Absolute minimum
Average minimum
Absolute maximum
Average maximum
January 19.0 11.3 15.8 29.7 21.4
February 19.2 10.0 15.7 32.1 22.6
March 23.1 13.7 19.6 39.0 26.5
April 25.9 15.2 21.8 39.5 30.8
May 31.4 21.2 26.8 44.2 36.8
June 32.8 24.0 28.3 45.7 37.6
July 35.4 26.8 31.4 48.0 40.4
August 35.7 27.5 31.2 48.1 40.5
September 33.7 25.5 30.0 45.2 37.4
October 29.4 21.8 25.7 38.3 33.0
November 25.9 16.9 22.6 35.8 28.9
December 21.8 12.7 18.6 31.7 24.6
Source: National Centre of Meteorology and Seismology , Statistics Centre- Abu Dhabi
Environmental Statistics 2016 33
Table 5 : Rainfall in Abu Dhabi and Al Ain regions by month - 2016 (Millimetres)
Month
Abu Dhabi Al Ain
Heaviest fall
in one day
Total for
month
Heaviest fall
in one day
Total for
month
January 4.2 15.8 14.8 69.7
February 0.4 0.9 12.3 51.7
March 18.4 73.1 88.6 753.2
April 3.0 10.7 8.6 22.6
May 0.0 0.0 0.0 0.0
June 0.0 0.0 0.2 0.2
July 0.0 0.0 10.0 17.1
August 0.0 0.0 6.0 25.6
September 0.0 0.0 21.0 21.4
October 0.0 0.0 42.8 95.7
November 0.0 0.0 1.7 3.1
December 0.0 0.0 0.0 0.0
Source: National Centre of Meteorology and Seismology , Statistics Centre- Abu Dhabi
Table 6: Rainfall in Al Dhafra and The Islands by month - 2016
(Millimetres )
Month
Al Dhafra The Islands
Heaviest fall
in one day
Total for
month
Heaviest fall
in one day
Total for
month
January 6.2 23.7 6.2 13.0
February 2.2 7.0 0.2 0.8
March 80.0 248.5 42.8 96.4
April 22.0 47.4 13.8 19.2
May 0.0 0.0 0.0 0.0
June 0.0 0.0 0.0 0.0
July 0.0 0.0 0.0 0.0
August 3.4 9.8 0.0 0.0
September 2.2 2.2 0.0 0.0
October 2.2 2.2 0.0 0.0
November 0.0 0.0 0.0 0.0
December 0.0 0.0 0.0 0.0
Source: National Centre of Meteorology and Seismology , Statistics Centre- Abu Dhabi

Environmental Statistics 2016 34
Table 7: Relative humidity by month, Abu Dhabi - 2016
)%(
Month Monthly
average
Absolute
minimum
Average
minimum
Absolute
maximum
Average
maximum
January 67.3 15.0 44.5 100.0 84.8
February 65.5 5.0 40.0 100.0 86.8
March 62.8 5.0 38.0 100.0 85.3
April 50.0 3.0 26.3 100.0 73.3
May 47.3 2.0 23.8 100.0 71.5
June 52.8 2.0 24.8 100.0 79.3
July 52.5 5.0 27.5 100.0 84.5
August 46.5 2.0 16.5 100.0 74.5
September 58.8 6.0 29.5 100.0 83.3
October 60.5 3.0 35.8 100.0 82.5
November 62.3 10.0 36.5 100.0 82.8
December 76.7 18.0 48.7 100.0 92.7
Source: National Centre of Meteorology and Seismology , Statistics Centre- Abu Dhabi
Table 8: Relative humidity by month, Al Ain - 2016
)%(
Month Monthly
average
Absolute
minimum
Average
minimum
Absolute
maximum
Average
maximum
January 59.0 0.0 31.4 100.0 85.2
February 51.2 4.0 23.1 100.0 81.7
March 47.1 2.0 23.2 100.0 76.8
April 34.8 3.0 17.0 98.0 58.1
May 26.4 1.0 10.3 98.0 50.3
June 29.2 1.0 9.9 95.0 55.0
July 35.6 4.0 16.3 95.0 70.6
August 23.2 2.0 10.3 95.0 41.9
September 39.9 5.0 17.0 100.0 67.2
October 44.4 5.0 19.1 100.0 73.8
November 51.7 1.0 26.1 100.0 79.7
December 54.9 3.0 27.6 100.0 82.1
Source: National Centre of Meteorology and Seismology , Statistics Centre- Abu Dhabi
Environmental Statistics 2016 35
Table 9 : Relative humidity by month, Al Dhafra - 2016
)%(
Month Monthly
average
Absolute
minimum
Average
minimum
Absolute
maximum
Average
maximum
January 66.7 0.0 40.0 100.0 89.5
February 59.0 6.0 31.3 100.0 86.3
March 56.0 7.0 31.3 100.0 82.7
April 42.7 5.0 23.2 100.0 68.0
May 34.8 3.0 16.5 99.0 60.8
June 39.5 2.0 17.5 100.0 68.3
July 41.3 3.0 21.5 99.0 89.2
August 41.3 3.0 18.3 100.0 67.2
September 49.0 4.0 25.0 100.0 75.5
October 53.2 6.0 25.8 100.0 81.8
November 62.3 12.0 37.3 100.0 87.3
December 69.1 15.0 44.1 100.0 89.1
Source: National Centre of Meteorology and Seismology , Statistics Centre- Abu Dhabi
Table 10 : Relative humidity by month, The Islands - 2016
)%(
Month Monthly average
Absolute minimum
Average minimum
Absolute maximum
Average maximum
January 70.7 22.0 51.7 100.0 84.3
February 68.3 12.0 44.3 100.0 86.0
March 68.0 14.0 44.0 100.0 86.3
April 58.3 10.0 28.7 93.0 82.0
May 53.7 6.0 24.7 95.0 80.3
June 57.7 9.0 27.0 98.0 82.0
July 58.3 10.0 30.3 94.0 83.3
August 60.0 9.0 27.3 93.0 82.7
September 60.0 9.0 36.7 98.0 78.0
October 60.0 12.0 38.0 97.0 78.0
November 66.7 20.0 47.3 99.0 80.7
December 74.7 25.0 57.7 94.0 86.7
Source: National Centre of Meteorology and Seismology , Statistics Centre- Abu Dhabi
Environmental Statistics 2016 36
Table 11 : Wind speed by month, Abu Dhabi - 2016
(Knot*)
Month Average Absolute maximum
Average maximum
January 11.5 47.0 23.0
February 11.0 36.0 23.0
March 12.8 63.0 28.5
April 13.5 44.0 16.0
May 12.5 44.0 16.0
June 14.0 44.0 16.0
July 14.3 39.0 27.5
August 12.8 42.0 28.0
September 12.3 36.0 24.8
October 11.0 35.0 22.8
November 10.8 45.0 22.3
December 10.0 35.0 20.7
Source: National Centre of Meteorology and Seismology , Statistics Centre- Abu Dhabi
*Knot = 1.15 mph
Table 12: Wind speed by month, Al Ain - 2016
(Knot*)
Month Average Absolute maximum
Average maximum
January 9.8 72.0 21.9
February 11.8 63.0 22.9
March 12.1 44.0 16.8
April 12.3 44.0 15.2
May 11.7 44.0 16.8
June 10.8 67.0 21.8
July 11.3 105.0 27.7
August 11.3 77.0 28.1
September 11.0 53.0 25.4
October 9.9 60.0 25.4
November 8.9 44.0 20.4
December 10.0 60.0 22.6
Source: National Centre of Meteorology and Seismology , Statistics Centre- Abu Dhabi
*Knot = 1.15 mph
Environmental Statistics 2016 37
Table 13: Wind speed by month, Al Dhafra - 2016
(Knot*)
Month Average Absolute maximum
Average maximum
January 12.5 54.0 24.8
February 11.8 48.0 25.0
March 13.7 44.0 16.0
April 13.7 44.0 16.0
May 13.2 44.0 16.0
June 13.7 66.0 30.2
July 14.2 54.0 29.8
August 11.5 71.0 27.8
September 11.3 44.0 26.0
October 10.2 36.0 23.8
November 10.5 57.0 22.7
December 11.7 47.0 23.3
Source: National Centre of Meteorology and Seismology , Statistics Centre- Abu Dhabi
*Knot = 1.15 mph
Table 14: Wind speed by month, The Islands - 2016
(Knot*)
Month Average Absolute maximum
Average maximum
January 17.3 54.0 28.3
February 15.7 50.0 29.0
March 16.7 44.0 18.3
April 14.7 44.0 13.7
May 15.3 44.0 18.3
June 16.0 53.0 29.7
July 15.7 48.0 28.0
August 13.7 39.0 27.3
September 14.3 43.0 26.3
October 12.7 36.0 23.0
November 14.3 46.0 25.3
December 15.7 42.0 26.3
Source: National Centre of Meteorology and Seismology , Statistics Centre- Abu Dhabi
*Knot = 1.15 mph
Environmental Statistics 2016 38
Table 15 : Daily total solar radiation by month, Abu Dhabi - 2016
(Watt / m²/h)
Month Average Minimum Maximum
January 4,281.8 8,19.0 5,236.0
February 5,171.3 2,477.0 6,467.0
March 5,244.5 3,60.0 7,340.0
April 6,320.3 1,074.0 8,030.0
May 7,182.3 4,202.0 8,260.0
June 6,933.3 5,207.0 8,520.0
July 6,245.8 4,523.0 7,950.0
August 6,163.5 3,364.0 9,560.0
September 5,997.5 4,447.0 9,060.0
October 5,497.3 4,018.0 7,930.0
November 4,870.0 3,556.0 6,630.0
December 4,617.7 2,574.0 5,780.0
Source: National Centre of Meteorology and Seismology , Statistics Centre- Abu Dhabi
Table 16: Daily total solar radiation by month, Al Ain - 2016
(Watt / m²/h)
Month Average Minimum Maximum
January 4,624.6 8,54.0 6,038.0
February 5,299.9 7,36.0 6,434.0
March 5,389.8 3,74.0 7,716.0
April 6,492.4 2,598.0 8,266.0
May 7,475.3 4,735.0 8,969.0
June 7,222.4 4,918.0 8,731.0
July 6,521.8 4,704.0 8,294.0
August 6,531.0 4,121.0 8,078.0
September 6,353.7 5,269.0 7,698.0
October 5,616.0 3,829.0 6,885.0
November 4,814.7 3,784.0 5,762.0
December 4,407.8 3,539.0 5,197.0
Source: National Centre of Meteorology and Seismology , Statistics Centre- Abu Dhabi

Environmental Statistics 2016 39
Table 17: Daily total solar radiation by month, Al Dhafra - 2016
(Watt / m²/h)
Month Average Minimum Maximum
January 4,393.0 1,308.0 5,590.0
February 5,133.5 2,138.0 6,457.0
March 5,450.2 9,55.0 7,640.0
April 6,225.8 8,48.0 7,934.0
May 6,718.7 4,583.0 8,295.0
June 6,415.7 4,641.0 8,096.0
July 5,884.5 4,111.0 7,774.0
August 6,005.0 3,738.0 7,509.0
September 5,835.5 4,537.0 7,131.0
October 5,227.5 3,854.0 6,404.0
November 4,543.8 2,691.0 5,360.0
December 4,171.1 3,263.0 4,959.0
Source: National Centre of Meteorology and Seismology , Statistics Centre- Abu Dhabi
Table 18: Daily total solar radiation by month, The Islands - 2016
(Watt / m²/h)
Month Average Minimum Maximum
January 4,440.7 1,205.0 5,623.0
February 5,341.7 2,342.0 6,607.0
March 5,248.3 1,016.0 7,563.0
April 6,292.0 1,201.0 8,122.0
May 7,189.7 4,476.0 8,190.0
June 6,911.7 5,340.0 8,082.0
July 6,323.7 5,291.0 7,565.0
August 5,919.7 4,472.0 6,713.0
September 5,446.0 4,660.0 5,973.0
October 5,181.3 3,917.0 6,347.0
November 4,397.0 2,410.0 5,526.0
December 4,000.3 2,576.0 4,994.0
Source: National Centre of Meteorology and Seismology , Statistics Centre- Abu Dhabi
Environmental Statistics 2016 40
Table 19: Annual average of sulphur dioxide concentration in ambient air by region*
(Microgram/m3)
Station Location 2011 2012 2013 2014 2015 2016
Abu Dhabi
City Centre - Khadija School 8.3 5.6 10.6 9.1 8.0 13.6
Urban/ Residential - Khalifa School 7.5 5.7 5.7 5.6 8.7 11.2
Road Side - Hamdan Street 7.4 5.4 4.7 5 9.4 13.4
Urban/ Residential - Baniyas School 9.1 3.0 2.7 5.4 7.3 9.4
Industrial - Mussafah 7.4 5.3 5.4 7.5 11.6 12.4
Industrial – Al Mafraq - 14.1 5.3 2.4 5.9 10.0
Urban area- Khalifa city - - 6.7 9.2 10 10.4
Urban area- Al Maqtaa - - 5.1 4.2 8.1 10.8
Al Ain
Urban/ Residential - Al Ain School 8.8 4.9 8.0 7.7 6.4 6.4
Road Side - Al Ain Street 6.7 4.7 9.1 8.7 4.9 5.4
Regional Background area- Alqoa - - 13.1 4.3 4.5 5.6
Urban area- Swihan - 7.4 5.9 4.1 6.4 8.1
City Cemter- Zakher - 6.7 5.5 4.3 8.9 8.1
Urban area- Al Tawya - - 9.9 6.4 5.8 6.4
Al Dhafra
Urban/ Residential - Bida Zayed 6.9 7.7 10.2 15.2 15.1 15.4
Road side - E11 Road - - 13.0 11.4 - -
Industrial - Ruwais - - 19.2 17.6 15.6 20.2
City Centre - Gayathi School 5.3 3.9 4.9 10.2 11.2 12.9
Regional Background - Liwa Oasis 5.1 4.7 3.2 6.5 14.1 10.2
Industrial Regional Background – Habshan - - 8.2 11.1 17 17.7
Source: Environment Agency - Abu Dhabi
* The annual maximum allowable limit for sulphur dioxide average concentration is 60 mcg/m³

Environmental Statistics 2016 41
Table 20: Annual average of nitrogen dioxide concentration in ambient air by region
(Microgram/m3)
Station Location 2011 2012 2012 2013 2014 2015
Abu Dhabi
City Centre - Khadija School 30.1 33.5 34.7 28.8 35.7 30.8
Urban/ Residential - Khalifa School 29.2 33.3 32.1 27.8 28.3 27.8
Road Side - Hamdan Street 46.4 46.2 56.7 47.7 49.9 50.1
Urban/ Residential - Baniyas School 28.1 29.3 31.3 32.5 30.7 32.2
Industrial - Mussafah 49.8 43.0 49.3 53.3 49.8 52.4
Industrial – Al Mafraq - 44.0 41.2 49.8 47.7 45.8
Urban area- Khalifa city - - 25.6 34.7 25.4 28.2
Urban area- Al Maqtaa - - 31 42 36.9 38.7
Al Ain
Urban/ Residential - Al Ain School 26.6 27.0 29.3 36.3 34.3 32.4
Road Side - Al Ain Street 4.1 48.7 42 52 42 42.7
Regional Background area- Alqoa - - 3.8 6.5 4.9 4.5
Urban area- Swihan - 12.2 10.1 15.1 13.8 13.2
City Cemter- Zakher - 40.8 29 28.4 31.5 35.2
Urban area- Al Tawya - - 18.4 20.5 25.2 33.4
Al Dhafra
Urban/ Residential - Bida Zayed 17.3 22.4 19.8 17 16.5 14.0
Road side - E11 Road - - 17.9 26.4 - -
Industrial - Ruwais - - 21.2 28.7 25.6 24.8
City Centre - Gayathi School 12.7 13.2 12.7 16.8 15.6 14.9
Regional Background - Liwa Oasis 3.7 3.4 2.7 4.6 3.8 4.1
Industrial Regional Background – Habshan - - 12.8 17.2 13.8 13.1
Source: Environment Agency - Abu Dhabi
Environmental Statistics 2016 42
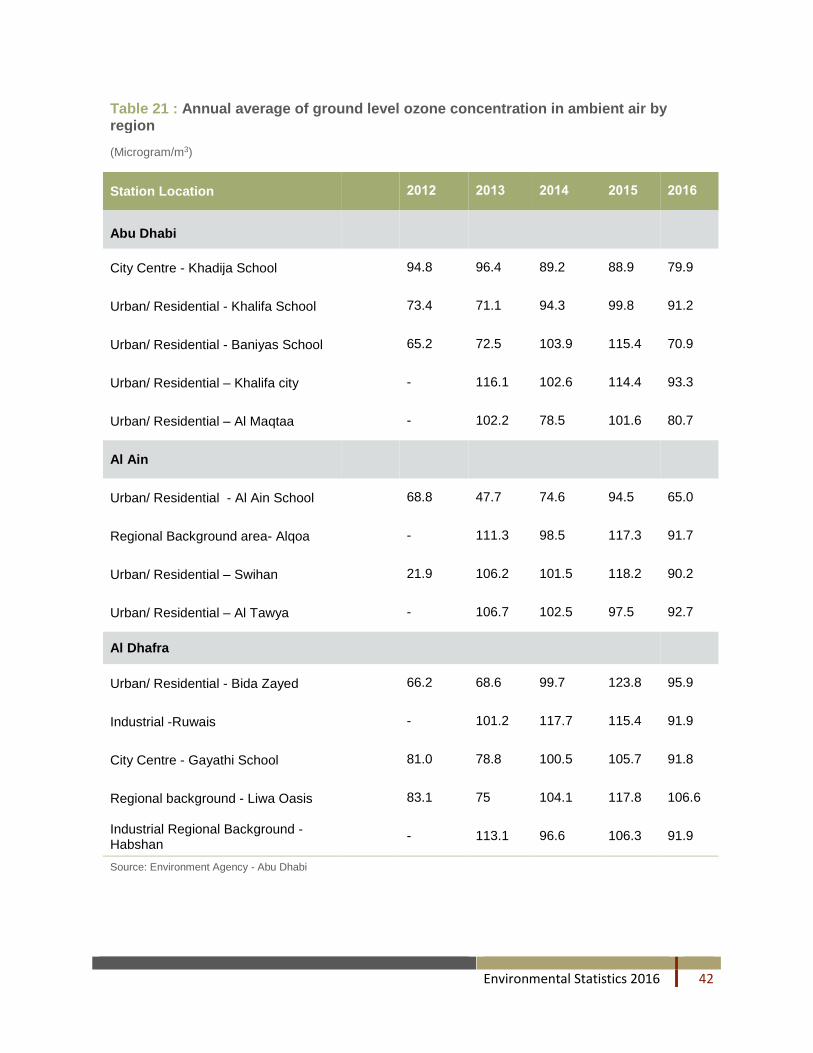
Table 21 : Annual average of ground level ozone concentration in ambient air by region
(Microgram/m3)
Station Location 2012 2013 2014 2015 2016
Abu Dhabi
City Centre - Khadija School 94.8 96.4 89.2 88.9 79.9
Urban/ Residential - Khalifa School 73.4 71.1 94.3 99.8 91.2
Urban/ Residential - Baniyas School 65.2 72.5 103.9 115.4 70.9
Urban/ Residential – Khalifa city - 116.1 102.6 114.4 93.3
Urban/ Residential – Al Maqtaa - 102.2 78.5 101.6 80.7
Al Ain
Urban/ Residential - Al Ain School 68.8 47.7 74.6 94.5 65.0
Regional Background area- Alqoa - 111.3 98.5 117.3 91.7
Urban/ Residential – Swihan 21.9 106.2 101.5 118.2 90.2
Urban/ Residential – Al Tawya - 106.7 102.5 97.5 92.7
Al Dhafra
Urban/ Residential - Bida Zayed 66.2 68.6 99.7 123.8 95.9
Industrial -Ruwais - 101.2 117.7 115.4 91.9
City Centre - Gayathi School 81.0 78.8 100.5 105.7 91.8
Regional background - Liwa Oasis 83.1 75 104.1 117.8 106.6
Industrial Regional Background - Habshan
- 113.1 96.6 106.3 91.9
Source: Environment Agency - Abu Dhabi
Environmental Statistics 2016 43
Table 22: Annual average of particulate matter (PM10) concentration in ambient air by
region
(Microgram/m3)
Station Location 2012 2013 2014 2015 2016
Abu Dhabi
City Centre - Khadija School 121.8 134.8 92.8 138.3 117.1
Urban/ Residential - Khalifa School 74.3 136.7 82.5 118.6 127.1
Road Side - Hamdan Street 143.1 106.6 123.5 171.6 101.0
Urban/ Residential - Baniyas School 189.3 144.7 67.8 142.4 130.0
Industrial - Mussafah 226.7 163.7 142.3 172.1 158.1
Industrial – Al Mafraq - 196.7 163.8 174.9 206.9
Urban area- Khalifa city - 142 83.5 136.1 155.9
Urban area- Al Maqtaa - 124.8 112.6 144 136.4
Al Ain
Urban/ Residential - Al Ain School 96.4 115.0 105.4 124.1 111.7
Road Side - Al Ain Street 151.3 155.5 97.7 100.8 102.3
Regional Background area- Alqoa - 145.8 95.5 138.1 108.9
Urban area- Swihan - 135.7 92.8 132.9 90.8
City Cemter- Zakher - 79.8 94.2 101.9 94.0
Urban area- Al Tawya - 130.3 100.6 136.2 100.1
Al Dhafra
Urban/ Residential - Bida Zayed 102.3 146.2 98.7 134.8 128.7
Road side - E11 Road - 104.1 132.4 -
Industrial - Ruwais - 76.8 121.9 139.7 125.6
City Centre - Gayathi School 128.4 143.9 95.7 115.9 112.4
Regional Background - Liwa Oasis 153.0 133.3 110.9 168.3 112.8
Industrial Regional Background – Habshan - - 151.2 106.0 208.1
Source: Environment Agency - Abu Dhabi
Environmental Statistics 2016 44
Table 23: Sulphur dioxide emissions – oil and gas sector
(Tons) Business Sector 2012 2013 2014 2015 2016
Total 241,707 208,121 322,798 363,692 220,249
Exploration, Development & Production
63,565 62,078 57,067 52,977 56,117
Gas Management 161,153 130,068 252,776 299,588 154,892
Refining & Petrochemicals 1,252 1,191 1,235 1,433 1,327
Sales & Marketing 15,737 14,785 11,719 9,694 7,913
Source: Abu Dhabi National Oil Company - ADNOC.
Note: Business sectors had been re-arranged by data source.
Table 24: Nitrogen oxides emissions - oil and gas sector
(Tons) Business Sector 2012 2013 2014 2015 2016
Total 69,164 68,380 56,708 54,335 69,716
Exploration, Development & Production
14,048 15,242 14,648 10,870 15,898
Gas Management 21,738 21,371 24,448 22,089 27,258
Refining & Petrochemicals 8,713 8,477 10,304 11,037 12,340
Sales & Marketing 24,665 23,290 7,308 10,339 14,220
Source: Abu Dhabi National Oil Company - ADNOC.
Note: Business sectors had been re-arranged by data source.
Table 25: Volatile organic compounds emissions - oil and gas sector
(Tons)
Business Sector 2012 2013 2014 2015 2016
Total 68,727 72,024 68,886 64,457 88,491
Exploration, Development & Production
50,682 54,634 54,222 52,295 52,225
Gas Management 6,392 6,333 5,569 7,531 5,802
Refining & Petrochemicals 3,644 1,915 2,189 1,837 1,888
Sales & Marketing 8,009 9,142 6,906 2,795 28,577
Source: Abu Dhabi National Oil Company - ADNOC.
Note: Business sectors had been re-arranged by data source.
Environmental Statistics 2016 45
Table 26: Carbon dioxide emissions - oil and gas sector
(Million Tons)
Business Sector 2013 2014 2015 2016
Total 26.1 30.0 33.7 34.1
Exploration, Development & Production 4.2 4.5 4.8 5.3
Gas Management 12.5 14.1 16.3 17.4
Refining & Petrochemicals 8.1 10.1 11.2 9.9
Sales & Marketing 1.3 1.2 1.4 1.4
Source: Abu Dhabi National Oil Company - ADNOC.
Note: Business sectors had been re-arranged by data source.
Table 27: Per capita carbon dioxide emissions - oil and gas sector **
(Tons)
Business Sector 2013 2014 2015 2016
Total 11.2 11.3 12.1 11.7
Exploration, Development & Production 1.7 1.7 1.7 1.8
Gas Management 5.4 5.3 5.9 6.0
Refining & Petrochemicals 3.5 3.8 4 3.4
Sales & Marketing 0.6 0.5 0.5 0.5
Source: Abu Dhabi National Oil Company - ADNOC.
Note: Business sectors had been re-arranged by data source.
Environmental Statistics 2016 46
Explanatory Notes
Glossary
This report contains certain terms specific to environment and necessary when analysing the environment
statistics of Abu Dhabi Emirate. They include the following terms:
Environment:
Environment is the whole external conditions which affect the life, growth, and existence of a living organism
on earth including climate, air, water, soil, metals, and the living organisms.
Environmental statistics:
Environmental statistics are statistics that describe the state and trends of the environment covering the
natural environment (air/ climate, water, land/soil), living organisms in their ecosystems and human
settlements. Environmental statistics are integrative in nature, measuring human activities and natural
events that affect the environment, the impact of these activities and events, and the social responses to
environmental impacts. Broad definitions include environmental indicators, indices and accounting (2)
Climate
Atmospheric pressure:
Atmospheric pressure is the weight of the air column that extends from the surface of the ground until the
end of the atmosphere of the Earth. Air pressure is one of the most important weather elements. The
difference in atmospheric pressure leads to the emergence of descendant force which is the main cause of
air movement from one place to another and that is wind. Thus transferring energy from one place to
another and causing fluctuations in weather and climate.
Atmospheric pressure at sea level is equivalent to the mercury column of height 76 cm. and the atmospheric
pressure is inversely proportional to the degree of air temperature. When temperature rises, air expands
and density decreases, then decreasing the weight and pressure, and vice versa. If temperature decreases,
air shrinks and gains weight, the pressure rises. In addition, air pressure rises or decreases with increasing
or decreasing the altitude from sea level.
Average rainfall:
Average rainfall is the average of the amounts of falling rain in millimeter within one month or year.
Environmental Statistics 2016 47
Climate:
Climate is the condition of weather at a particular location or region over a long period of time that can be
a month, a year, a season, or several years. It is the long-term result in the atmosphere including elements,
such as temperature, solar radiation humidity, rainfall, atmospheric pressure, wind speed and direction, and
the variations of these elements.
Heaviest fall:
Heaviest fall is the highest amount of rainfall in millimetre on a certain location within one month or year (a
period of time).
Relative humidity:
It is a percentage of water vapor mass per unit volume of air relative to the mass of water vapor necessary
to satisfy the same volume unit, at the same temperature and atmospheric pressure.
Relative humidity % = (Actual water vapor pressure / Saturation water vapor pressure) * 100 OR
Relative humidity % = (Specific humidity / Saturation specific humidity) * 100
The relative humidity changes during the day depending on temperature because the saturation vapor
pressure controlled by temperature. Relative humidity is low during the day and rises gradually to reach its
highest levels in the last hours of the night at the minimum temperatures. Sometimes the saturation may
lead to formation of dew, if temperature is higher than zero degree centigrade or frost if the temperature is
below zero centigrade.
Solar radiation
It is a set of ethereal radiation from the sun such as light and radiant heat, and others.
Sunshine:
It is the number of hours of sunshine during the daytime. It is measures in the period where sun light not
veiled as a result of clouds, fog or particles stuck (e.g., smog).
Winds:
It is the horizontal movement of air, and air moves either up or down causing what is known as updrafts
and downdrafts. The sun is the primary source of climatic changes on earth as the sun rays heat and stretch
the air and consequently its pressure decreases and winds move from areas with high atmospheric
pressure to areas of low atmospheric pressure. Because the earth rotates around itself, the wind does not
blow go directly from high pressure areas to low pressure, but deviates to the right direction in the northern
hemisphere and to the left direction in the southern hemisphere because of the "Coriolis effect" resulting
from the earth's rotation on its axis.

Environmental Statistics 2016 48
Air Statistics
Air Pollution:
It is the presence of contaminant or pollutant substances a pollutant in air that do not disperse properly and
interfere with human health or welfare, or produce other harmful environmental effects (2) .
Annual mean concentration:
It is the arithmetic mean over all valid measurements for the respective year (1).
Carbon Dioxide (CO2):
It is a colorless, odorless and non-poisonous gas that results from fossil fuel combustion and is normally a
part of ambient air. It is also produced in the respiration of living organisms (plants and animals), and
considered to be the main greenhouse gas, contributing to climate change (2).
Carbon dioxide emissions (per Capita):
Carbon dioxide emissions per capita is the total amount of carbon dioxide emitted by a country as a
consequence of human (production and consumption) activities, divided by the population of the country.
This include emissions of carbon dioxide include emissions from consumption of solid, liquid and gas fuels;
cement production; and gas flaring. National reporting to the United Nations Framework Convention on
Climate Change, which follows the Intergovernmental Panel on Climate Change guidelines, is based on
national emission inventories and covers all sources of anthropogenic carbon dioxide emissions as well as
carbon sinks (such as forests). Carbon dioxide emissions per capita are calculated by dividing carbon
dioxide emissions by the number of people in the national population (1).
Carbon Monoxide (CO):
Colorless, odorless and poisonous gas produced by incomplete fossil fuel combustion. Carbon monoxide
combines with the hemoglobin of human beings, reducing its oxygen carrying capacity, with effects harmful
to human beings (2).
Decibel:
It is the unit of sound measurement on a logarithmic scale, with sound approximately doubling in loudness
for every increase of 10 decibels (2).
Ground Level Ozone (O3):
Ozone presents as a secondary pollutant in the lower atmosphere, where its formation can be enhanced
by other pollutants. It is highly toxic at levels above 0.1 parts per million (p.p.m) (2).
Environmental Statistics 2016 49
Nitrogen dioxide (NO2):
It is a reddish - brown very toxic gas with a strong irritating smell. When present in high concentrations, it
causes serious damage to the lungs. Nitrogen dioxide is an oxidant which reacts in air forming nitric acid
causing corrosion in addition to the formation of toxic organic nitrates that contribute to the production of
ground-level ozone and smog.
Nitrogen oxides (NOx):
Nitrogen oxides are formed quickly from emissions from cars, in addition to contributing to the formation of
ground-level ozone.
Noise:
Audible sound from traffic, construction and so on that may generate unpleasant and harmful effects
(hearing loss). It is measured in decibels (2).
Ozone (O3):
A pungent, colorless, toxic gas contains three atoms of oxygen in each molecule. It occurs naturally at a
concentration of about 0.01 parts per million (p.p.m) of air. Levels of 0.1 p.p.m. ppm considered toxic. In
the stratosphere, ozone provides a protective layer shielding the earth from the harmful effects of ultraviolet
radiation on human beings and other biota. In the troposphere, it is a major component of photochemical
smog, which seriously affects the human respiratory system (2).
Suspended Particulate Matter
Fine liquid or solid particles, such as dust, smoke, mist, fumes or smog found in air or emissions (2).
Remote regions/ background site:
It refers to monitoring stations far from any industrial or densely populated area (1).
Sulphur dioxide (SO2):
It is a heavy, pungent colorless gas formed by the combustion of fossil fuels. It is harmful to human beings
and vegetation, and contributes to the acidity in precipitation (2).
Suspended particulate matter (SPM10):
It refers to finely divided solids or liquids, less than 10 (micrometers) that maybe dispersed through the air
from combustion processes, industrial activities or natural sources (1).

Environmental Statistics 2016 50
Volatile Organic Compounds
They are organic compounds that evaporate readily and contribute to air pollution mainly through the
production of photochemical oxidants (2).
Volatile organic compounds except for methane (NMVOCs):
They are emissions produced mainly in fuel combustion and in processes that use solvents or solvent-
based products such as painting, metal degreasing etc. Several of these chemicals are harmful to human
health if inhaled, ingested, and drunk or get in contact with skin. NM-VOCs are significant precursors to
ground level ozone formation. NM-VOCs are the sum of all hydrocarbon air pollutants except methane (1).
Water Statistics
Biochemical oxygen demands (BOD)
Amount of dissolved oxygen required by organisms for the aerobic decomposition of organic matter present
in water. This measured at 20 degrees Celsius for a period of five days. The parameter yields information
on the degree of water pollution with organic matter (3).
Biological treatment:
It is a wastewater treatment employing aerobic and anaerobic micro-organisms that results in decanted
effluents and separate sludge containing microbial mass together with pollutants. Biological treatment
processes also used in combination or in conjunction with mechanical treatment (1).
Desalinated Water:
Total volume of water obtained from desalination of (i.e., removal of salt from) seawater and brackish water
(3).
Mechanical treatment:
It is the treatment of a physical and mechanical nature that results in decanted effluents and separate
sludge. Mechanical processes are also used in combination and/or in conjunction with biological and
advanced unit operations. Mechanical treatment includes processes as sedimentation, flotation, etc. (1).
Seawater:
Seawater is water from a sea or ocean. On average, seawater in the world's oceans has a salinity of ~3.5
percent. This means that for every 1 liter (1000 ml) of seawater there are 35 grams of salts (mostly, but not
entirely, sodium chloride) dissolved in it (3).
Environmental Statistics 2016 51
Sewage sludge production (dry matter)
The accumulated settled solids, either moist or mixed, with a liquid component as a result of natural or
artificial processes, that have been separated from various types of waste water during treatment (3).
Total public water supply:
Water supplied by economic units engaged in collection, purification and distribution of water (including
desalting of seawater to produce water as the principal product of interest, and excluding system operation
for agricultural purposes and treatment of wastewater solely in order to prevent pollution.) It corresponds
to ISIC division 41. Deliveries of water from one pubic supply undertaking to another are excluded (1).
Total reuse of freshwater:
Freshwater that has undergone wastewater treatment and is deliverable to a user as reclaimed wastewater.
This means the direct supply of treated effluent to the use. Excluded is wastewater discharged into
watercourse and used again downstream (1).
Total wastewater generated:
The quantity of water in cubic meters (m3) that is discharged due to being of no further immediate value to
the purpose for which it was used or in the pursuit of which it was produced because of its quality, quantity
or time of occurrence (1).
Total wastewater treatment:
Process to render waste water fit to meet applicable environmental standards or other quality norms for
recycling or reuse (1).
Treated in other treatment plants:
Treatment of wastewater in any non-public treatment plants, i.e. industrial wastewater plants. Excluded
from 'Other wastewater treatment' is treatment in under independent treatment facilities such as septic
tanks (1).
Treatment in independent treatment facilities:
Individual private treatment facilities to treat domestic and other wastewater in cases where a public waste
water network is not available or not justified either because it would produce no environmental benefits .
Examples of such systems are treatment in wastewater tanks (1).
Environmental Statistics 2016 52
Wastewater treated in public treatment plants:
All treatment of wastewater in municipal treatment plants by official authorities, or by private companies for
local authorities, whose main purpose is wastewater treatment (1).
Water transmission system availability:
Water Transmission System Availability calculated in percentage in terms of the summation of the
availabilities of transmission system components, such as pumps, water transmission lines, storage tanks,
and surge vessels.
Health and safety Statistics
Food poisoning:
It refers to any illness caused by infection or poisoning resulting from food or water consumption. Food
poisoning may affect individuals or group of people who have consumed the same contaminated food or
drinks that contained harmful substance (toxin) or pathogens (bacteria, virus, and parasite) or chemical or
allergic substances. Food poisoning has various factors and symptoms.
Occupational health and safety:
It is a discipline concerned with protecting the health and safety of people engaged with work by fostering
a safe illness and accident-free environment. In other words, it is a set of procedure and rules within
legislative framework aiming at protecting man from injures and possessions from being damaged or lost.
Occupational accident:
The harm that happens to a worker because of an accident is defined as “injury” as a direct result of an
accident to that labor. Occupational accident defined as work-related injury that occurs to the worker at the
workplace or because of it, is also one of the injuries occurring to workers on their way to work or returning
from work, if the labor used the regular route without interruption or deviation. The occupational diseases
also considered as work injuries.

Environmental Statistics 2016 53
Waste Statistics
Agriculture wastes:
All waste from agricultural and forestry activities (1).
Composting:
A biological process that submits biodegradable waste to anaerobic or aerobic decomposition, and that
results in a product that is recovered (1).
Construction waste:
All waste from construction activities. This category refers to waste generated in ISIC division 45(1).
Hazardous waste:
It is the wastes that, owing to their toxic, infectious, radioactive or flammable properties pose a substantial
actual or potential hazard to the health of humans and other living organisms and the environment (1).
Incineration:
It is a controlled burning of waste materials with or without energy restoration (1).
Incineration plants:
Facilities for burning waste under controlled conditions, with or without energy recovery (1).
Industrial waste:
Include wastes from mine, quarries, manufacturing industries, energy production, and construction (1).
Landfilled waste:
This includes all amounts of waste transferred to landfill, either directly, or after sorting and/or treatment, as
well as residues from recovery and disposal operations for dispatch to landfill. Landfill is the final placement
of waste into or onto the land in a controlled or uncontrolled way. The definition covers both in-house
landfills, where a generator of waste is carries out its own waste disposal on site) as well as in external
landfills (1).
Landfills:
It refers to the sites that manage the final placement of waste in or on the land in a controlled or uncontrolled
way (1).

Environmental Statistics 2016 54
Liquid waste:
Liquid products or outputs resulting from the use of water produced by manufacturing processes and
leftover industrial materials, such as oils that are disposed of by on-site treatment, sewage network,
dumping into the sea or via other disposal routes.
Municipal waste:
Municipal waste includes household waste and similar waste. The definition also includes bulky waste (e.g.
white goods, old furniture, mattresses) and yard waste, leaves, grass clippings, street sweepings, the
content of litter containers, and market cleansing waste, if managed as waste. It includes waste originating
from: households, commerce and trade, small businesses, office buildings and institutions (schools,
hospitals, government buildings). It also includes waste from selected municipal services, i.e. waste from
park and garden maintenance, waste from street cleaning services (street sweepings, the content of litter
containers, market cleansing waste), if managed as waste. The definition excludes waste from municipal
sewage network and treatment, municipal construction and demolition waste (1).
Municipal waste collected:
Municipal waste collected by or on behalf of municipalities, as well as municipal waste collected by the
private sector. It includes mixed household waste, and fractions collected separately for recovery operations
(through door-to-door collection and/or through voluntary deposits) (1).
Municipal waste generated:
This amount is the sum of the amount of municipal waste collected plus the estimated amount of municipal
waste from areas not served by a municipal waste collection service (1).
Municipal waste managed in a country:
The amount of municipal waste collected in the country –amount exported before treatment or disposal +
amount imported for treatment or disposal (1).
Oil spill:
Oil, discharged accidentally or intentionally, that floats on the surface of water bodies as a discrete mass
and is carried by the wind, currents and tides. Oil spills can be partially controlled by chemical dispersion,
combustion, mechanical containment and adsorption. They have destructive effects on coastal ecosystems
(2).
Other (waste treatment/disposal):
It refers to any other final treatment or disposal different from recycling (composting), incineration and
landfill. Permanent storage of waste is included here (1).
Environmental Statistics 2016 55
Recycling:
It is the reusing of waste materials in production process by restoring them from wastes, except reusing as
fuel (1).
Treatment Plants:
Facilities for the physical, thermal, chemical, or biological processing of waste that change the
characteristics of the waste in order to reduce its volume or hazardous nature, facilitate its handling, or
enhance recycling. Composting plants are included in this type of treatment (1).
Wastes:
Materials that are not prime products (that is, products produced for the market) for which the generator
has no further use in terms of his/her own purposes of production, transformation or consumption, and of
which he/she wants to dispose, with the exception of wastes recycled or reused in place of production (i.e.
establishments) and wastes discharged directly to waster or ambient air (1).
Biodiversity Statistics
Biodiversity
The range of genetic differences, species differences and ecosystem differences in a given area (United
Nations, 1997).
IUCN red list
The IUCN Red list classification consists of the following categories:
Extinct (EX)
A species is Extinct when there is no reasonable doubt that the last individual has died. A species is
presumed Extinct when exhaustive surveys in known and/or expected habitat, at appropriate times
(diurnal, seasonal, annual), and throughout its historic range have failed to record an individual. Surveys
should be over a time frame appropriate to the species’ life cycle and life form (IUCN, 2001).
Extinct in the wild (EW)
A species is Extinct in the wild when it is known only to survive in cultivation, in captivity or as a
naturalized population (or populations) well outside the past range. A species is presumed extinct in
the wild when exhaustive surveys in known and/or expected habitat, at appropriate times (diurnal,
seasonal, annual), and throughout its historic range have failed to record an individual. Surveys should
be over a time frame appropriate to the species’ life cycle and life form (IUCN, 2001).

Environmental Statistics 2016 56
Threat Categories
Threat categories include the three threat categories: Endangered (CR), Endangered (EN) and
Vulnerable (VU).
Species is classified into Critically Endangered (CR), Endangered (EN) or Vulnerable (VU)
When its best available evidence meet one of the five criteria (A to E) of each category (see part five
of the IUCN categories and criteria in the sources), which indicates that it’s facing an extremely high
risk of extinction in the wild in the immediate future (IUCN, 2001).
Near Threatened (NT)
A species is Near Threatened when it has been evaluated against the criteria but does not qualify for
Critically Endangered, Endangered or Vulnerable now, but is close to qualifying for or is likely to qualify
for a threatened category in the near future (IUCN, 2001).
Least Concern (LC)
A species is Least Concern when it has been evaluated against the criteria and does not qualify for
Critically Endangered, Endangered, Vulnerable or Near Threatened. Widespread and abundant taxa
are included in this category (IUCN, 2001).
Data Deficient (DD)
A species is Data Deficient when there is inadequate information to make a direct, or indirect,
assessment of its risk of extinction based on its distribution and/or population status. A species in this
category may be well studied, and its biology well known, but appropriate data on abundance and/or
distribution is lacking. Data Deficient is therefore not a category of threat or Lower Risk. Listing of taxa
in this category indicates that more information is required and acknowledges the possibility that future
research will show that threatened classification is appropriate (IUCN, 2001).
Not Evaluated (NE)
A species is Not Evaluated when it is has not yet been assessed against the criteria (IUCN, 2001).
Total Number of Known species refers to the total number of a particular type of species known,
described and documented in a given class in a particular country or region (Abu Dhabi Emirate). Total
number of known mammals and reptiles recorded include marine species. Total number of known bird
species recorded includes residential and migratory bird species.
Total Number of threatened species refers to the total number of species facing a higher risk of global
extinction or/and local extinction; those which are critically endangered (CR), endangered (EN), or
vulnerable (VU) in the IUCN Red List and/or Local Red List.
Number of threatened species should be interpreted as the number of species known to be threatened
within those that have been assessed to date; there are still species that have not yet been assessed.

2
Envi
ronm
ent S
tatis
tic 2
014
PublicationsLibrary