
2016 Polaris SKS Axys 800 - DynoTech Research - … 2016 Polaris... · 2016 Polaris SKS Axys 800...
9
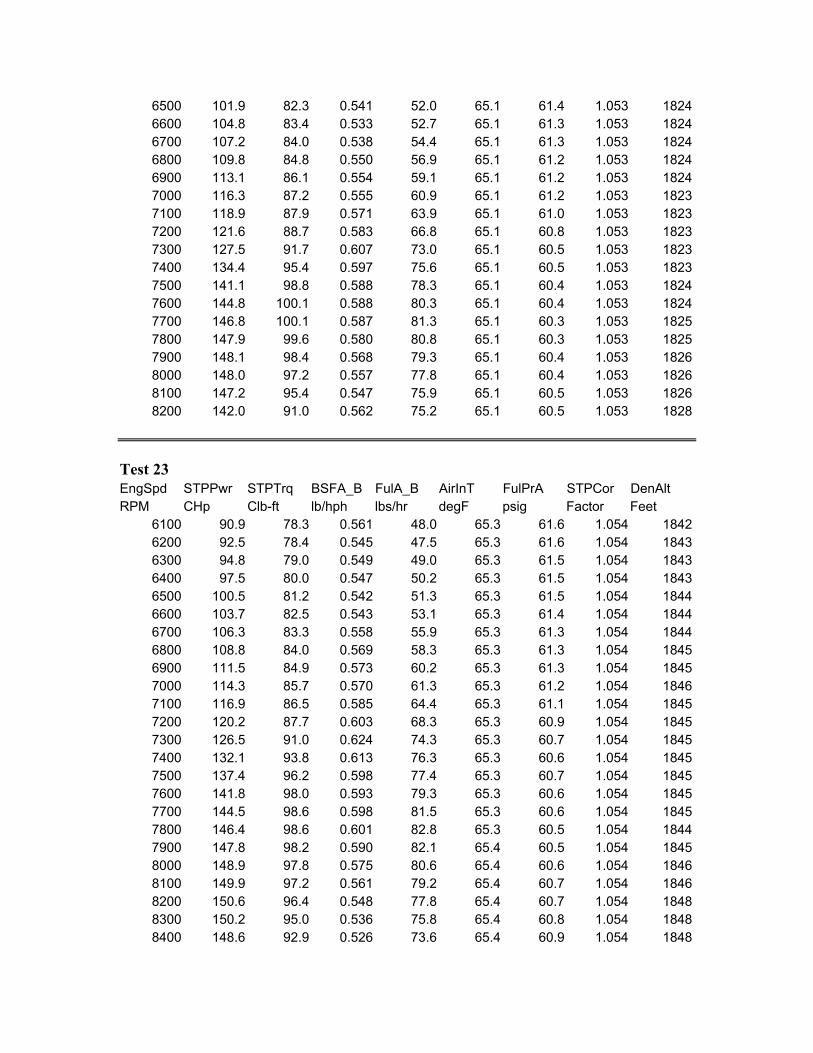
2016 Polaris SKS Axys 800 test/ text by Jim Czekala Heath Lynk, of Cobleskill, NY, came again to DTR, this time with a new zero mile long track SKS Axys 800 for breakin and to test a new SSI (Speed Shop Inc) modified “pipe mod” stock pipe that Heath had done. We also have a new BMP (Bikeman Performance) ceramic coated single pipe here that we wanted to test, sent here by a Canadian DTR member who will be tuning his new Axys here in a few weeks. Heath brought the first 2015 Axys 800 HO here back in Oct 2014 that we spent several hours breaking in, obtaining base numbers. Then Heath brought the same 2015 sled back to DTR last February after putting a few thousand miles on the trail, to see what it would finally produce after field running/ eliminating breakin mode from the 2015 ECU. Both test sessions are documented on this website, with the good running engine ultimately making HP in the mid 150’s with ethanol fuel used in the non-ethanol ECU setting. We did all of our testing today with 91 octane non-ethanol fuel (that we forgot to analyze) premixed with Polaris VES oil at 50-1, with the ECU switched to the leaner, more advanced timing non-ethanol fuel mode. The hood/ gauge pod was left in place, so air intake was through the stock ducting with frogskin covering the dash intake openings. With no mechanical airflowmeter used, there is no airflow or A/F data included today. The dyno cooling tower was tied into the sled’s cooling system—with cooling tower Tstat set above 100F. This enabled us to do back-to-back dyno acceleration tests without the need for cooldown of the engine. We would do three or four back to back 10-12 second dyno tests, then the HP would level off, or tail off a bit as the ECU would add cooling fuel at elevated pipe Center Section temps. By running the engine for extended periods of time at WOT, we would see pipe Center Section temperature climb from 800F to 1100F and even higher—temperatures very likely experienced by mountain climbers and lake runners who run at WOT for minutes at a time! Initial dyno test results showed much more HP than Heath’s then-new 2015—where the 2015 was in the mid 140’s HP initially, the 2016 was right at 150+ out of the box. This is due at least in part to the 2016’s much leaner “breakin mode” fuel flow (after breakin, the 2016’s final fuel flow is said to be 3% leaner than the 2015’s calibration. We ran about 40 full throttle 10-12 second dyno tests before switching to the SSI and BMP exhausts. But the engine seemed to settle in to 152+ HP quickly. Here are four back-to-back dyno tests with the stock exhaust—tests 22-25—showing the midrange HP drop, and peak HP, and peak HP RPM slide up to 8300-8400, as CS temps slid up from 800 to 1100+. Here’s the run by run data, with a comparison graph. Test 22 EngSpd STPPwr STPTrq BSFA_B FulA_B AirInT FulPrA STPCor DenAlt RPM CHp Clb-ft lb/hph lbs/hr degF psig Factor Feet 6100 92.1 79.3 0.565 49.0 65.1 61.5 1.053 1824 6200 93.6 79.3 0.570 50.3 65.1 61.5 1.053 1824 6300 95.8 79.8 0.571 51.5 65.1 61.4 1.053 1824 6400 98.8 81.1 0.563 52.5 65.1 61.4 1.053 1824
Transcript of 2016 Polaris SKS Axys 800 - DynoTech Research - … 2016 Polaris... · 2016 Polaris SKS Axys 800...

2016 Polaris SKS Axys 800 test/ text by Jim Czekala Heath Lynk, of Cobleskill, NY, came again to DTR, this time with a new zero mile long track SKS Axys 800 for breakin and to test a new SSI (Speed Shop Inc) modified “pipe mod” stock pipe that Heath had done. We also have a new BMP (Bikeman Performance) ceramic coated single pipe here that we wanted to test, sent here by a Canadian DTR member who will be tuning his new Axys here in a few weeks. Heath brought the first 2015 Axys 800 HO here back in Oct 2014 that we spent several hours breaking in, obtaining base numbers. Then Heath brought the same 2015 sled back to DTR last February after putting a few thousand miles on the trail, to see what it would finally produce after field running/ eliminating breakin mode from the 2015 ECU. Both test sessions are documented on this website, with the good running engine ultimately making HP in the mid 150’s with ethanol fuel used in the non-ethanol ECU setting. We did all of our testing today with 91 octane non-ethanol fuel (that we forgot to analyze) premixed with Polaris VES oil at 50-1, with the ECU switched to the leaner, more advanced timing non-ethanol fuel mode. The hood/ gauge pod was left in place, so air intake was through the stock ducting with frogskin covering the dash intake openings. With no mechanical airflowmeter used, there is no airflow or A/F data included today. The dyno cooling tower was tied into the sled’s cooling system—with cooling tower Tstat set above 100F. This enabled us to do back-to-back dyno acceleration tests without the need for cooldown of the engine. We would do three or four back to back 10-12 second dyno tests, then the HP would level off, or tail off a bit as the ECU would add cooling fuel at elevated pipe Center Section temps. By running the engine for extended periods of time at WOT, we would see pipe Center Section temperature climb from 800F to 1100F and even higher—temperatures very likely experienced by mountain climbers and lake runners who run at WOT for minutes at a time! Initial dyno test results showed much more HP than Heath’s then-new 2015—where the 2015 was in the mid 140’s HP initially, the 2016 was right at 150+ out of the box. This is due at least in part to the 2016’s much leaner “breakin mode” fuel flow (after breakin, the 2016’s final fuel flow is said to be 3% leaner than the 2015’s calibration. We ran about 40 full throttle 10-12 second dyno tests before switching to the SSI and BMP exhausts. But the engine seemed to settle in to 152+ HP quickly. Here are four back-to-back dyno tests with the stock exhaust—tests 22-25—showing the midrange HP drop, and peak HP, and peak HP RPM slide up to 8300-8400, as CS temps slid up from 800 to 1100+. Here’s the run by run data, with a comparison graph. Test 22 EngSpd STPPwr STPTrq BSFA_B FulA_B AirInT FulPrA STPCor DenAlt RPM CHp Clb-ft lb/hph lbs/hr degF psig Factor Feet
6100 92.1 79.3 0.565 49.0 65.1 61.5 1.053 18246200 93.6 79.3 0.570 50.3 65.1 61.5 1.053 18246300 95.8 79.8 0.571 51.5 65.1 61.4 1.053 18246400 98.8 81.1 0.563 52.5 65.1 61.4 1.053 1824
6500 101.9 82.3 0.541 52.0 65.1 61.4 1.053 18246600 104.8 83.4 0.533 52.7 65.1 61.3 1.053 18246700 107.2 84.0 0.538 54.4 65.1 61.3 1.053 18246800 109.8 84.8 0.550 56.9 65.1 61.2 1.053 18246900 113.1 86.1 0.554 59.1 65.1 61.2 1.053 18247000 116.3 87.2 0.555 60.9 65.1 61.2 1.053 18237100 118.9 87.9 0.571 63.9 65.1 61.0 1.053 18237200 121.6 88.7 0.583 66.8 65.1 60.8 1.053 18237300 127.5 91.7 0.607 73.0 65.1 60.5 1.053 18237400 134.4 95.4 0.597 75.6 65.1 60.5 1.053 18237500 141.1 98.8 0.588 78.3 65.1 60.4 1.053 18247600 144.8 100.1 0.588 80.3 65.1 60.4 1.053 18247700 146.8 100.1 0.587 81.3 65.1 60.3 1.053 18257800 147.9 99.6 0.580 80.8 65.1 60.3 1.053 18257900 148.1 98.4 0.568 79.3 65.1 60.4 1.053 18268000 148.0 97.2 0.557 77.8 65.1 60.4 1.053 18268100 147.2 95.4 0.547 75.9 65.1 60.5 1.053 18268200 142.0 91.0 0.562 75.2 65.1 60.5 1.053 1828
Test 23 EngSpd STPPwr STPTrq BSFA_B FulA_B AirInT FulPrA STPCor DenAlt RPM CHp Clb-ft lb/hph lbs/hr degF psig Factor Feet
6100 90.9 78.3 0.561 48.0 65.3 61.6 1.054 18426200 92.5 78.4 0.545 47.5 65.3 61.6 1.054 18436300 94.8 79.0 0.549 49.0 65.3 61.5 1.054 18436400 97.5 80.0 0.547 50.2 65.3 61.5 1.054 18436500 100.5 81.2 0.542 51.3 65.3 61.5 1.054 18446600 103.7 82.5 0.543 53.1 65.3 61.4 1.054 18446700 106.3 83.3 0.558 55.9 65.3 61.3 1.054 18446800 108.8 84.0 0.569 58.3 65.3 61.3 1.054 18456900 111.5 84.9 0.573 60.2 65.3 61.3 1.054 18457000 114.3 85.7 0.570 61.3 65.3 61.2 1.054 18467100 116.9 86.5 0.585 64.4 65.3 61.1 1.054 18457200 120.2 87.7 0.603 68.3 65.3 60.9 1.054 18457300 126.5 91.0 0.624 74.3 65.3 60.7 1.054 18457400 132.1 93.8 0.613 76.3 65.3 60.6 1.054 18457500 137.4 96.2 0.598 77.4 65.3 60.7 1.054 18457600 141.8 98.0 0.593 79.3 65.3 60.6 1.054 18457700 144.5 98.6 0.598 81.5 65.3 60.6 1.054 18457800 146.4 98.6 0.601 82.8 65.3 60.5 1.054 18447900 147.8 98.2 0.590 82.1 65.4 60.5 1.054 18458000 148.9 97.8 0.575 80.6 65.4 60.6 1.054 18468100 149.9 97.2 0.561 79.2 65.4 60.7 1.054 18468200 150.6 96.4 0.548 77.8 65.4 60.7 1.054 18488300 150.2 95.0 0.536 75.8 65.4 60.8 1.054 18488400 148.6 92.9 0.526 73.6 65.4 60.9 1.054 1848

Test 24 EngSpd STPPwr STPTrq BSFA_B FulA_B AirInT FulPrA STPCor DenAlt RPM CHp Clb-ft lb/hph lbs/hr degF psig Factor Feet
6100 88.6 76.3 0.578 48.2 65.6 61.6 1.054 18646200 91.4 77.4 0.595 51.2 65.6 61.6 1.054 18656300 94.0 78.4 0.588 52.1 65.6 61.5 1.054 18666400 96.9 79.5 0.571 52.1 65.7 61.5 1.054 18686500 100.3 81.0 0.551 52.0 65.7 61.5 1.054 18696600 102.8 81.8 0.549 53.1 65.7 61.4 1.054 18696700 105.1 82.4 0.554 54.8 65.7 61.3 1.054 18706800 107.7 83.2 0.565 57.3 65.7 61.3 1.054 18716900 110.6 84.2 0.563 58.6 65.7 61.3 1.054 18737000 113.3 85.0 0.561 59.8 65.7 61.3 1.054 18737100 115.7 85.6 0.578 62.9 65.7 61.1 1.054 18757200 118.3 86.3 0.591 65.8 65.7 61.0 1.054 18757300 123.2 88.7 0.612 71.0 65.8 60.7 1.054 18767400 128.9 91.5 0.601 73.0 65.8 60.7 1.054 18767500 135.1 94.6 0.591 75.2 65.8 60.7 1.054 18777600 139.5 96.4 0.599 78.7 65.8 60.6 1.054 18797700 142.8 97.4 0.609 81.9 65.8 60.6 1.054 18807800 145.4 97.9 0.609 83.4 65.8 60.5 1.054 18807900 147.6 98.2 0.604 83.9 65.8 60.6 1.054 18818000 149.8 98.3 0.591 83.3 65.8 60.6 1.054 18838100 151.5 98.2 0.567 80.9 65.9 60.7 1.054 18838200 152.4 97.6 0.542 77.7 65.9 60.8 1.054 18848300 152.7 96.6 0.515 74.0 65.9 60.9 1.054 18858400 152.3 95.3 0.503 72.1 65.9 60.9 1.055 1886
Test 25 EngSpd STPPwr STPTrq BSFA_B FulA_B AirInT FulPrA STPCor DenAlt RPM CHp Clb-ft lb/hph lbs/hr degF psig Factor Feet
6100 88.1 75.9 0.584 48.4 66.3 61.6 1.055 19146200 90.4 76.6 0.594 50.5 66.3 61.6 1.055 19146300 93.2 77.7 0.596 52.3 66.3 61.6 1.055 19166400 96.1 78.8 0.586 52.9 66.3 61.6 1.055 19166500 98.8 79.9 0.566 52.6 66.3 61.6 1.055 19176600 101.7 80.9 0.568 54.3 66.3 61.5 1.055 19176700 104.3 81.7 0.578 56.7 66.3 61.4 1.055 19186800 107.0 82.7 0.581 58.4 66.4 61.4 1.055 19206900 109.6 83.4 0.573 59.1 66.4 61.3 1.055 19207000 112.1 84.1 0.566 59.6 66.4 61.3 1.055 19207100 114.4 84.7 0.579 62.3 66.4 61.2 1.055 19217200 117.1 85.4 0.589 64.8 66.4 61.0 1.055 19217300 122.7 88.3 0.618 71.3 66.4 60.8 1.055 1922
7400 129.1 91.6 0.607 73.7 66.4 60.7 1.055 19237500 134.1 93.9 0.596 75.1 66.4 60.7 1.055 19247600 137.8 95.2 0.592 76.7 66.4 60.6 1.055 19247700 141.3 96.3 0.598 79.5 66.4 60.6 1.055 19247800 144.4 97.2 0.602 81.7 66.4 60.5 1.055 19257900 147.0 97.7 0.596 82.4 66.5 60.6 1.055 19268000 149.1 97.9 0.584 81.9 66.5 60.6 1.055 19278100 150.5 97.6 0.571 80.8 66.5 60.7 1.055 19288200 151.6 97.1 0.552 78.7 66.5 60.8 1.055 19288300 152.5 96.5 0.531 76.1 66.5 60.9 1.055 19298400 152.7 95.5 0.518 74.4 66.5 61.0 1.055 1930
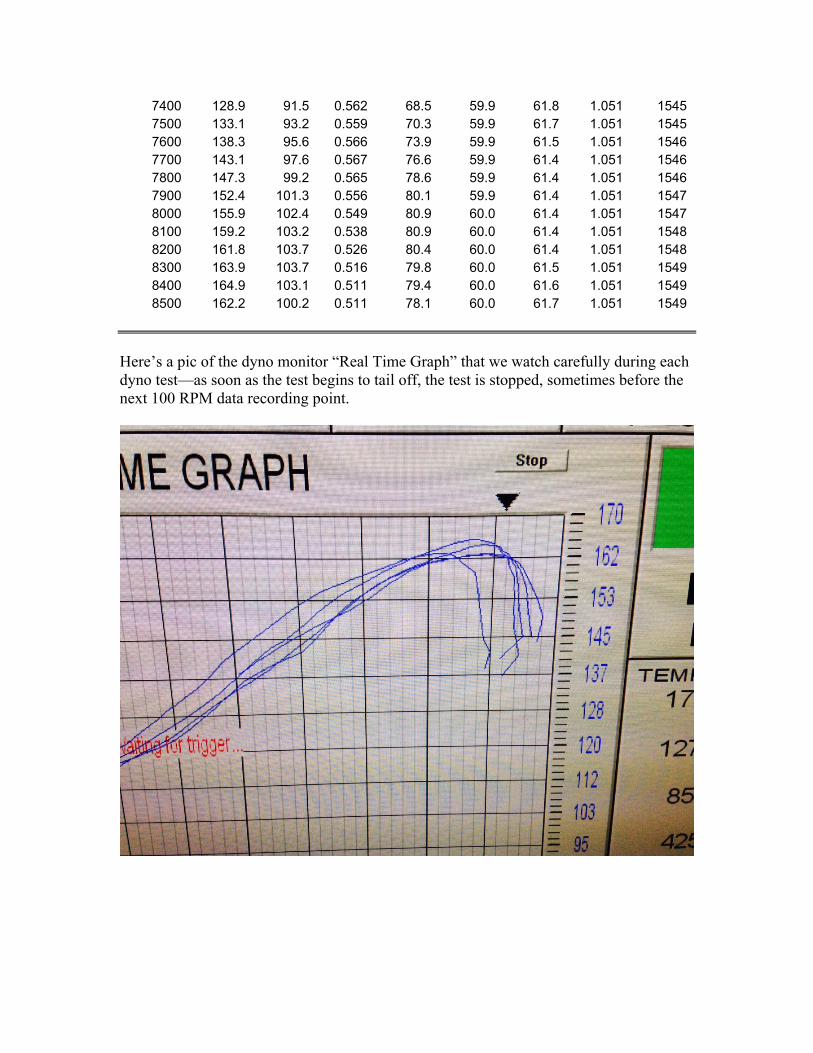
Note that with the hottest pipes, there is no tail-off shown in the HP curves. This is because the HP drops past the last data point, and the test has been stopped before reaching the next 100 RPM point. The dyno operator (me) keeps an eye on the real-time graph that appears on the dyno monitor as the run progresses, and when HP drops, the test is concluded—sometimes 10 or 20 RPM too soon to show the downward slope. This graph also shows how it’s best to have clutches shift initially at 77-7800 at warm pipe HP peak, then tuned to slide up to higher RPM as the speed of sound increases with pipe CS temp, causing the peak HP RPM to increase accordingly—all the way to 83-8400 RPM if
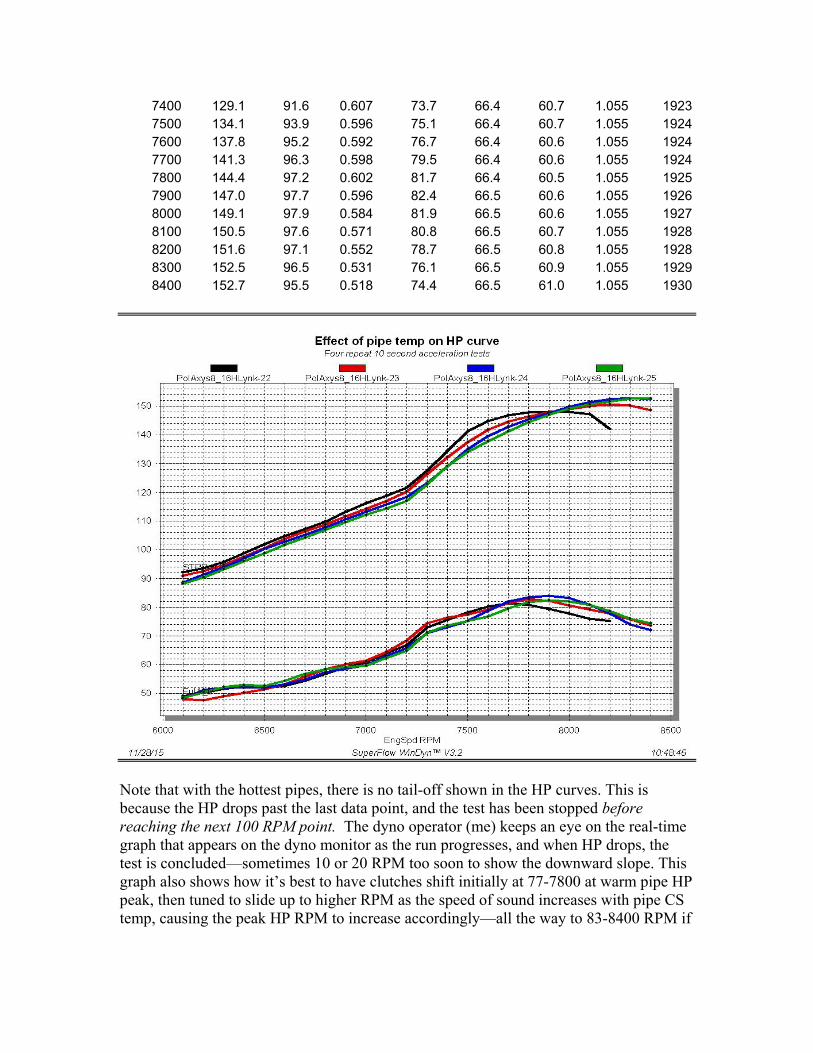
held at WOT long enough! Remember—we’re trying to get clutches to shift at a continually increasing peak HP RPM as pipe temp climbs. Next Heath installed the ECU from his broken in 2015 Axys, and there appeared to be very little change in fuel flow—meaning the broken in 2015 ECU fuel flow is very similar to the 2016 pre-breakin mode. Now Heath installed the stock pipe from his 2015 Axys, modified by SSI for $250 (a custom internal stinger and a CS spacer welded in). Heath had painstakingly reinstalled the factory insulating heat shield, and we picked up nearly 10 HP. While we weren’t measuring airflow, our past experience has shown these pipe mods to increase airflow—meaning with fixed fuel flow our effective A/F ratio would be leaned out—maybe even a bit too much for max HP. We theorize that the newly installed internal “pipe mod” stinger cuts a clean “cookie cutter” hole in the sound wave—returning more sound energy back to the exhaust port which reduces sound out the muffler and instead packs more A/F mixture back into the cylinder—not only increasing airflow but also increasing effective compression ratio. This leaner mixture/ increased exhaust gas flow through the pipe created even higher pipe CS temps, causing fuel flow to rise at some high temp (1200F+?). This is seen in the comparison graphs as a high RPM rise in fuel flow lb/hr. Here are tests 1,2,3 with stock pipe versus tests 1,2,3 with SSI modified stock pipe. Compare three tests stock pipe to three tests SSI pipe mod:

Now Heath installed the BMP ceramic coated single pipe with the stock muffler, and it, too, picked up about 10 HP! Once again, here are three back to back tests of the BMP compared to the stock pipe. Compare three tests stock pipe to three tests BMP ceramic coated pipe:
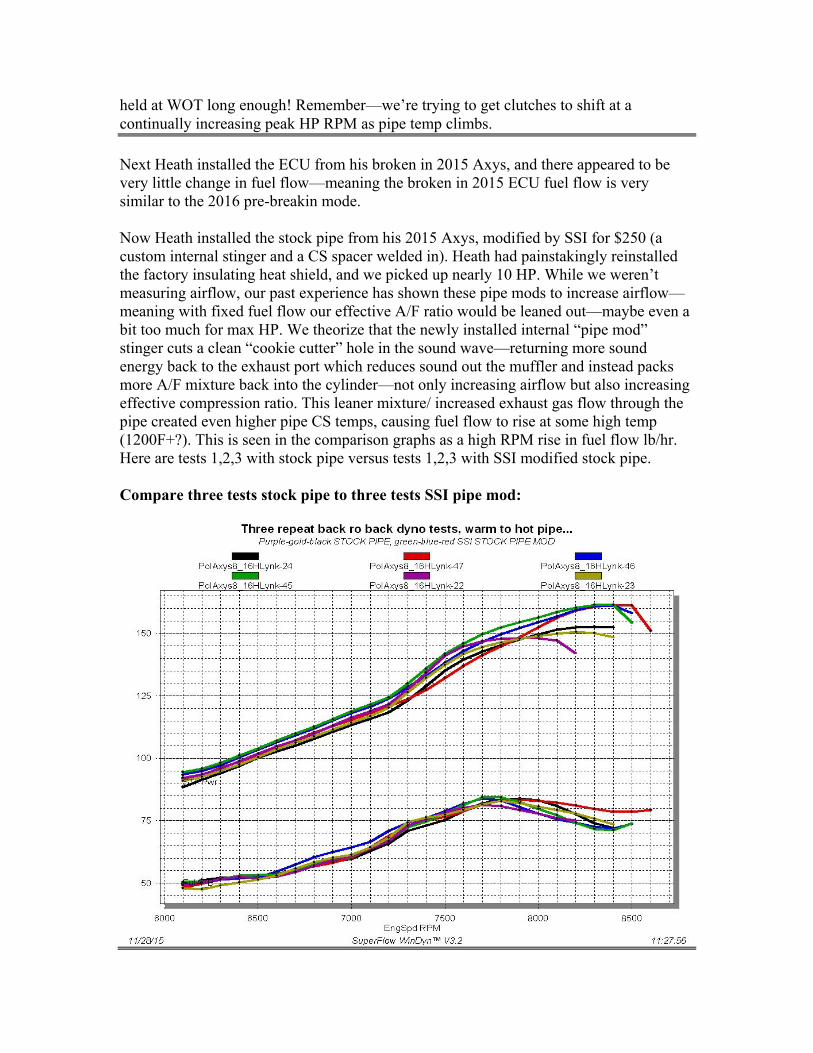
Since Heath would be using this SSI modded stock pipe on his new STS, he reinstalled it and the DynoJet PCV with timing control. We came up with a fuel map that leaned out the 100% throttle midrange and added some at high revs, along with a few degrees of timing. Now we have safer top end fuel flow, lower peak CS temps (preventing overenrichment), and more HP. Here’s three tests with SSI pipe mod with and without the PCV tune.
============================================================= Here’s the test data from the second hot run of the SSI pipe mod/ PCV tune. Note that Heath will probably need to add 3% to the WOT fuel numbers in the PCV map to compensate for the 2016 ECU fuel flow dropping 3% on breakin. It’s likely that we will get similar results on the BMP single pipe when we install that and tune it for the pipe’s new owner in a few weeks. EngSpd STPPwr STPTrq BSFA_B FulA_B AirInT FulPrA STPCor DenAlt RPM CHp Clb-ft lb/hph lbs/hr degF psig Factor Feet
6000 91.7 80.3 0.623 54.0 59.9 62.2 1.051 15406100 92.7 79.8 0.605 53.0 59.9 62.2 1.051 15406200 94.2 79.8 0.588 52.3 59.9 62.2 1.051 15406300 96.7 80.6 0.575 52.6 59.9 62.2 1.051 15406400 99.2 81.4 0.570 53.4 59.9 62.2 1.051 15416500 101.6 82.1 0.564 54.2 59.9 62.2 1.051 15416600 104.4 83.1 0.555 54.7 59.9 62.2 1.051 15416700 107.6 84.4 0.547 55.6 59.9 62.2 1.051 15426800 110.4 85.3 0.549 57.3 59.9 62.2 1.051 15426900 113.1 86.1 0.553 59.0 59.9 62.1 1.051 15437000 115.7 86.8 0.559 61.1 59.9 62.1 1.051 15437100 118.3 87.5 0.573 64.0 59.9 62.0 1.051 15437200 121.4 88.5 0.582 66.7 59.9 61.8 1.051 15447300 124.9 89.9 0.575 67.8 59.9 61.8 1.051 1544
7400 128.9 91.5 0.562 68.5 59.9 61.8 1.051 15457500 133.1 93.2 0.559 70.3 59.9 61.7 1.051 15457600 138.3 95.6 0.566 73.9 59.9 61.5 1.051 15467700 143.1 97.6 0.567 76.6 59.9 61.4 1.051 15467800 147.3 99.2 0.565 78.6 59.9 61.4 1.051 15467900 152.4 101.3 0.556 80.1 59.9 61.4 1.051 15478000 155.9 102.4 0.549 80.9 60.0 61.4 1.051 15478100 159.2 103.2 0.538 80.9 60.0 61.4 1.051 15488200 161.8 103.7 0.526 80.4 60.0 61.4 1.051 15488300 163.9 103.7 0.516 79.8 60.0 61.5 1.051 15498400 164.9 103.1 0.511 79.4 60.0 61.6 1.051 15498500 162.2 100.2 0.511 78.1 60.0 61.7 1.051 1549
Here’s a pic of the dyno monitor “Real Time Graph” that we watch carefully during each dyno test—as soon as the test begins to tail off, the test is stopped, sometimes before the next 100 RPM data recording point.

