2016 Participant Plan Transfers and Account Consolidation ...
26
1 AUTO PORTABILITY RESEARCH & SIMULATION.1 AUTO PORTABILITY RESEARCH & SIMULATION AUTOMATING PLAN-TO-PLAN TRANSFERS FOR SMALL ACCOUNTS “if we take the friction out, more people will stay in” CONSOLIDATED TESTIMONY Retirement Clearinghouse, LLC Employee Benefit Research Institute Contributor: Boston Research Technologies ERISA Advisory Council June 8, 2016
Transcript of 2016 Participant Plan Transfers and Account Consolidation ...

1
AUTO PORTABILITY RESEARCH & SIMULATION.1
AUTO PORTABILITY RESEARCH & SIMULATION
AUTOMATING PLAN-TO-PLAN TRANSFERS FOR SMALL ACCOUNTS
“if we take the friction out, more people will stay in”
CONSOLIDATED TESTIMONY Retirement Clearinghouse, LLC
Employee Benefit Research Institute
Contributor: Boston Research Technologies
ERISA Advisory Council
June 8, 2016

2
AUTO PORTABILITY RESEARCH & SIMULATION
I. Executive Summary
Key Findings from the Auto Portability Research & Simulation
America’s workforce is highly mobile, numbering in the millions of job changers each year.
Participants receive little or no help with transferring accounts between employer-sponsored
plans; the lack of assistance is even more acute for small accountholders.
Participants express a strong preference for their active employer-sponsored plan but are
challenged by the ‘upside-down’ cost-benefit of DIY portability.
The lack of a systematic process for plan-to-plan transfers is driving high rates of cash out
leakage, which is irreparably damaging the retirement prospects of tens of millions of savers.
Cash out leakage occurs most frequently within one year of a job change (fast leakage), and
continues in successive years (slow leakage), resulting in an estimated 89% of accounts with
<$5,000 cashing out.
Utilizing technology and executing a uniform/standardized process via negative consent would
yield dramatic increases in retained savings, particularly among small balance job changers.
The Auto Portability Simulation demonstrates that on a cumulative basis over the 40-year time
horizon of the simulation, cash outs decline from $320 billion to $164 billion, while Roll-Ins
increase from $15 billion to nearly $130 billion, helping more than 75 million participants
preserve their retirement savings in their active employer-sponsored plan.
Talking Points
As a means of visually illustrating the dynamic impact of Auto Portability over a 40-year time horizon, the
Auto Portability Simulation output data was utilized to create an animation. The animation shows the
flow of mobile workforce participants out of their inactive plan (Employer Plan 1) to cash outs, IRAs, and
active employer plans (Employer Plan 2) as they change jobs, as well as the cumulative results for both
Scenario 1 (top graphic) and Scenario 2 (bottom graphic).
FIGURE 1

3
AUTO PORTABILITY RESEARCH & SIMULATION
II. What is Auto Portability? [abbreviated FAQ]
Auto Portability proposes to alter current manual plan-to-plan transfer practices via the introduction of technology to create a new, automatic default that relieves small balance participants of the undue time consumption inherent in in today’s DIY environment for portability.
What is Auto Portability?
Auto Portability is the routine, standardized and automatic movement of an inactive participant’s small balance retirement account (less than $5,000) from a former employer’s retirement plan to an active account at a new employer’s retirement plan, when a participant changes jobs.
Auto Portability fits neatly into the framework of the many ‘auto’ innovations – such as Auto Enrollment,
and Auto Investment Allocation (target date funds) – that have proven successful in enhancing the
retirement savings prospects of millions of Americans.
Auto Portability employs two primary mechanisms to alter the current state and participant behaviors,
leading to improved participant outcomes:
Electronic records matching across a network of financial institutions to locate, match & move
an account between employer-sponsored plans.
Negative consent to authorize and automate the process.
Why is Auto Portability needed?
As shown on the prior page, 5 million participants with small accounts change jobs annually and, are subject to a mandatory distribution from their former retirement plan into a Safe Harbor IRA. These participants in particular are making decisions – or in many cases doing nothing at all - that create adverse consequences for their retirement savings. These consequences include:
1) Leakage / Cash outs: Participants with account balances less than $5,000 are prematurely cashing out their savings at rates approaching 60%, incurring taxes and penalties and badly damaging their prospects for a secure retirement.
2) Taking No Action: Participants that don’t respond to the notice are forced out of their retirement plan and into a Safe Harbor IRA, where by statute they are invested in money market funds that yield little or no interest.
3) Lost / Missing Accounts: Over time, participants change residence but neglect to update their address of record or lose track of their old accounts.
Why is Auto Portability targeted at accounts with less than $5,000?
Accounts with less than $5,000 have the highest cash out rates of any segment of the mobile workforce. Auto Portability addresses the issues where there is the greatest need.
Accounts with less than $5,000 are subject to the mandatory distribution provision of EGTRRA, and can be forced out of their employer plan into a Safe Harbor IRA without participant consent, while all other accounts have the option of remaining in their former employer plan, or moving to another qualified account as decided by the participant. A change to the $5,000 limit would require new legislation.
What evidence do we have that portability solutions reduce leakage?
Beginning in 2007 and through the present day, portability services have been provided to the new hires, active & separated participants in a large employer plan (>250,000 employees) in the hospital services industry. In 2013, Boston Research Group documented the results of the program, the most significant of which was a greater than 50%, across-the-board reduction in leakage when compared to industry reports.

4
AUTO PORTABILITY RESEARCH & SIMULATION
III. Introduction
The Auto Portability Research & Simulation project was undertaken to pull together the body of research
and practical experience in order to definitively illustrate and quantify the linkage between Cash Out
Leakage and the need for improved portability solutions for the small balance segments of America’s
mobile workforce.
This linkage was first identified through hands-on experience with a large employer plan, and
subsequently quantified in a 2013 research report published by Boston Research Group: “Eliminating
Friction & Leaks in America’s DC System”.
The linkage between Cash Out Leakage and portability has been further validated by ongoing experience
and research. In 2015 Boston Research Technologies published new findings in a research paper titled
“Manual Portability and the Mobile Workforce”, which revealed that many participants cash out simply
because it is the easiest transaction to effect, yet those same participants later expressed regret over the
decision. Furthermore, the research identified a strong participant preference for their employer-
sponsored plan as their primary retirement savings account.
Much of the related research from financial institutions, industry associations, think tanks and advocacy
groups has focused on the destructive effects of Cash Out Leakage that is particularly predominant in the
younger age and lower income segments of the retirement population. Very little of the research has
suggested concrete proposals for improvement, with good reason; the small balance segments of the
mobile workforce present a distinct set of challenges that include a high cost of service relative to the
account balance, and high transaction volumes, driven by the high levels of job-changing observed in the
small balance segments of the population.
Perhaps the simplest way to summarize this body of experience and research is the premise underlying
Auto Portability:
“if we take the friction out, more people will stay in”
Auto Portability follows a familiar path to addressing the challenge, a path that mimics the successful
increase in participation rates driven by Automatic Enrollment. Auto Portability creates a new default path
to remedy the destructive behaviors associated with premature Cash Out Leakage, and goes a step further
by introducing new technologies that create a scalable, cost effective infrastructure.
In its simplest form, the new default proposed by Auto Portability is comprised of three processes:
1. The use of negative consent to automate the process and give participants a new default option.
2. Employment of electronic records matching technology across the retirement system to match
participants’ accounts as they move from one employer-sponsored plan to the next.
3. Introduction of new norms to standardize the movement of small balances into employer-
sponsored plans.
By design, the new default – Auto Portability – will, over time, replace current practices and produce the
results forecast in the APS: decreased Cash Out Leakages and increased Assets Rolled In to participants’
new employer plans and retained for long-term retirement income.
However, the ‘easy’ comparison to Automatic Enrollment falls short when it comes to illustrating both the
short and long term benefits of Auto Portability, simply because these benefits arise from changing
behaviors that are spread across, literally, millions of individual decisions each year.

5
AUTO PORTABILITY RESEARCH & SIMULATION
Auto Portability also requires financial institutions to adopt a new, enlightened self-interest approach with
cooperation to serve the needs of the mobile workforce replacing competition.
The heart of Auto Portability’s technology innovation - electronic records matching – sets off a positive
network effect that produces the most benefits when the greatest number of institutions and their plan
sponsor clients are participating.
The following documentation of the Auto Portability Research & Simulation clearly answers the question:
“Why does this matter?” By synthesizing the measurement, quantification, and aggregation of the
network effect – simulating millions of annual transactions in a comprehensive, experience and research-
based dynamic model - we come to an understanding that serving the needs of the small balance segment
of the mobile workforce creates a significant ‘win’ for public policy, participants, plan sponsors and the
retirement industry that serves them.
About the Simulation
The Auto Portability Simulation (“APS”) models what we know to be the actual decision-making (discrete
events) for a key segment of the mobile workforce - participants that change jobs and have an account
balance of <$5,000 at the time of their job change, over a 40-year time horizon.
Discrete events include:
Participants leaving their job that:
o Cash out.
o Voluntarily move their account to a new 401(k).
o Voluntarily move their account to an IRA.
o Involuntarily have their account moved to a Safe Harbor IRA.
o Move to an employer that doesn’t have a 401(k) plan.
o Retire.
Participants making decisions at various points in time in the automatic rollover process
How Auto Portability changes those decisions.
Random delays in participant decision-making.
The APS models how the retirement market changes over time, how the 26 different record-keepers in the simulation interact with their participants, and how Auto Portability will work to change participant behavior over time.
Key statistics are collected for primary states, events and operations for:
the Market as a whole.
each Record-keeper.
all Safe Harbor IRA repositories.

6
AUTO PORTABILITY RESEARCH & SIMULATION
IV. Plan-to-Plan Transfers Today: a “Do-it-Yourself” (“DIY”) Proposition
In order to execute a Roll-In (plan-to-plan transfer) to their new employer plan, a participant has to
complete each step in the processes illustrated below.
Key Findings
The process is both complex and time consuming; an average Roll-In takes 55 minutes for a qualified
representative to complete; it is almost impossible to imagine that participants will undertake the
same effort, for a median account balance of $1,679.10.
Missing a step will invalidate the Roll-In; the correction process essentially entails re-doing one or
more steps.
FIGURE 2
7
AUTO PORTABILITY RESEARCH & SIMULATION
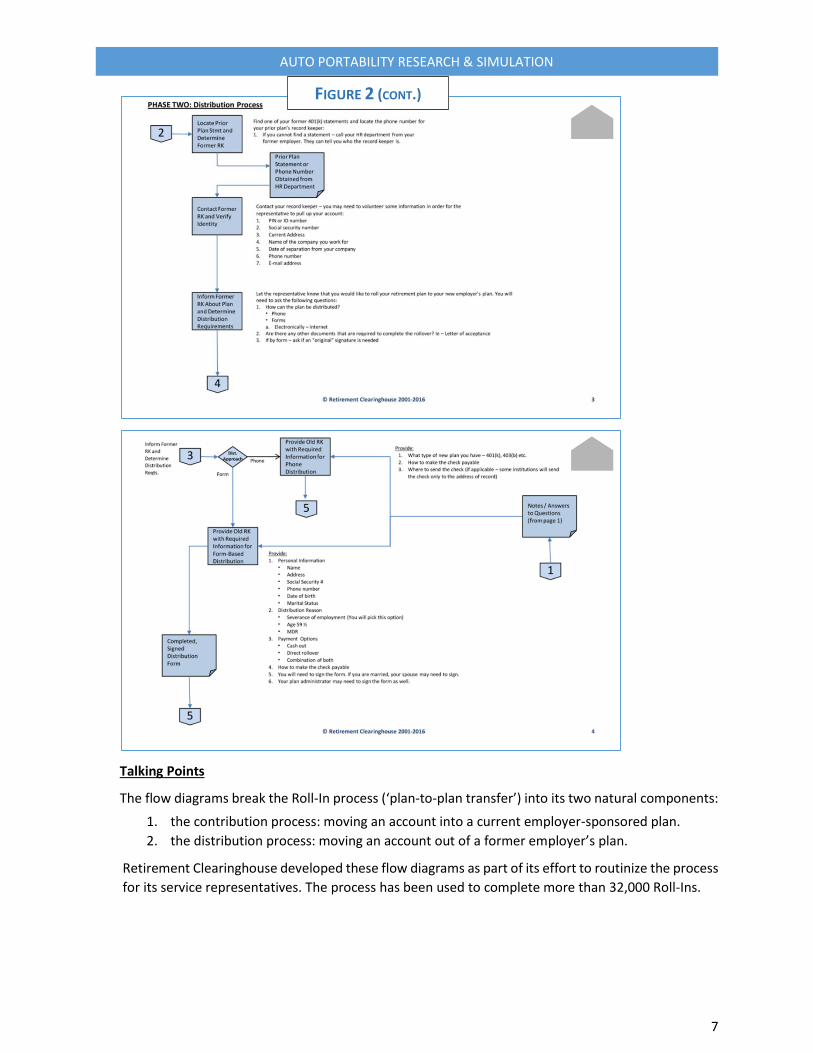
Talking Points
The flow diagrams break the Roll-In process (‘plan-to-plan transfer’) into its two natural components:
1. the contribution process: moving an account into a current employer-sponsored plan.
2. the distribution process: moving an account out of a former employer’s plan.
Retirement Clearinghouse developed these flow diagrams as part of its effort to routinize the process
for its service representatives. The process has been used to complete more than 32,000 Roll-Ins.
FIGURE 2 (CONT.)

8
AUTO PORTABILITY RESEARCH & SIMULATION
V. Barriers & Obstacles to Roll-In: Report from the Front Lines
Over a period of 5 years Retirement Clearinghouse’s service team has gathered a collection of insights
into some of the most common barriers and obstacles encountered in the execution of a Roll-In. These
roadblocks serve to elongate or forestall the process and it is not hard to imagine that many DIY
participants abandon the process altogether.
Key Finding
Plan provisions and practices vary widely and are subject to interpretation by administrators and service
providers, creating a labyrinthine process that by itself discourages plan-to-plan transfers.
Contribution Process – Getting the new plan to accept a previous 401(k) account
1. Accepting plan sponsor requires plan administrator to sign off on forms before accepting the
rollover funds.
o Plan provisions may require the plan administrator to sign either a contribution form or other
document. Tracking down the plan administrator for a signature can be challenging as many of them
are juggling multiple tasks.
2. Accepting Institution’s service staff not sure of the requirements for accepting a rollover.
o Because many documents and requirements are plan-specific, the accepting institution’s staff may
not be fully aware of documents or other items needed to complete a rollover, causing stress for the
participant once the funds arrive and are rejected.
3. Accepting institution’s service staff not sure how to interpret documents.
o The accepting institution’s processing team will simply not know what certain documents mean
Example: receiving institution may be looking for a distribution document showing no taxes
were withheld from the funds, but does not understand that a 1099R provides that information.
4. Accepting Institution may discourage the rollover, and attempt to solicit an IRA or Annuity.
o Moving into an IRA retains the assets.
Distribution Process - Getting the money from an inactive account to consolidate into an active plan
5. Distributing institutions may require a personalized letter of acceptance from the receiving
institution (vs a generic letter of acceptance).
o This often leaves the participant having to reach out to various people to have a “custom” letter put
together on their behalf.
o Personalized letters increase the workload and the probability of the participant abandoning the
process.
Example: one particular institution routinely asks for a personalized letter of acceptance
complete with a medallion signature guarantee from the accepting plan sponsor.

9
AUTO PORTABILITY RESEARCH & SIMULATION
6. Finding a plan administrator who will sign off on distribution paperwork, or getting a plan
administrator to take action.
o Distribution paperwork requires the signature of the participant’s prior plan administrator.
Identifying the plan administrator can be challenging, particularly for a former employee. Getting a
plan administrator to sign paperwork can also be challenging as many of them are juggling many
tasks and priorities.
Example: an extreme version of this obstacle requires the plan administrator to have their
acceptance letter include a Medallion Signature Guarantee, and a corporate resolution proving
that person is authorized to sign on behalf of accepting firm.
7. Distributing institution will only mail distribution paperwork to a participant vs e-mail, fax or web.
o Rolling over a 401(k) plan is not always at the top of the participant’s list, this requirement can result
in abandonment of the process.
8. Distributing institution will ask for Transfer of Asset paperwork.
o Most participants have no idea what this document is and plan sponsors often do not supply such
documents; abandonment or a 60-day rollover frequently results.
9. Overly complicated distribution paperwork.
o Distribution paperwork can be up to 10 pages and can appear complex. Participants get intimidated
and simply give up.
10. Distributing institutions may discourage the rollover or attempt to solicit an IRA or Annuity.
o Moving into an IRA retains the assets.
When things go wrong
o Even when paperwork is filled out correctly and sent to the location specified by the receiving
institution things can still go wrong and bad advice is plentiful. Here are a few examples:
Participant was mistakenly cashed out of 2 401(k) plans and taxes withheld.
o Distributing institution did not want to correct the mistake.
o Participant was told to treat both distributions as 60-day rollovers instead. Per IRS
guidelines, a participant is only allowed 1 60-day rollover per year.
Participant was told that they must move their 401(k) into a traditional IRA first and then move
it directly to a 401(k) plan.
Participant was told that they could not move a Roth 401(k) to another Roth 401(k), and was
encouraged to move it to a Roth IRA and then to a Roth 401(k). Per IRS guidelines, following this
advice would have resulted in the participant not being able to roll the funds to a Roth 401(k).
10
AUTO PORTABILITY RESEARCH & SIMULATION
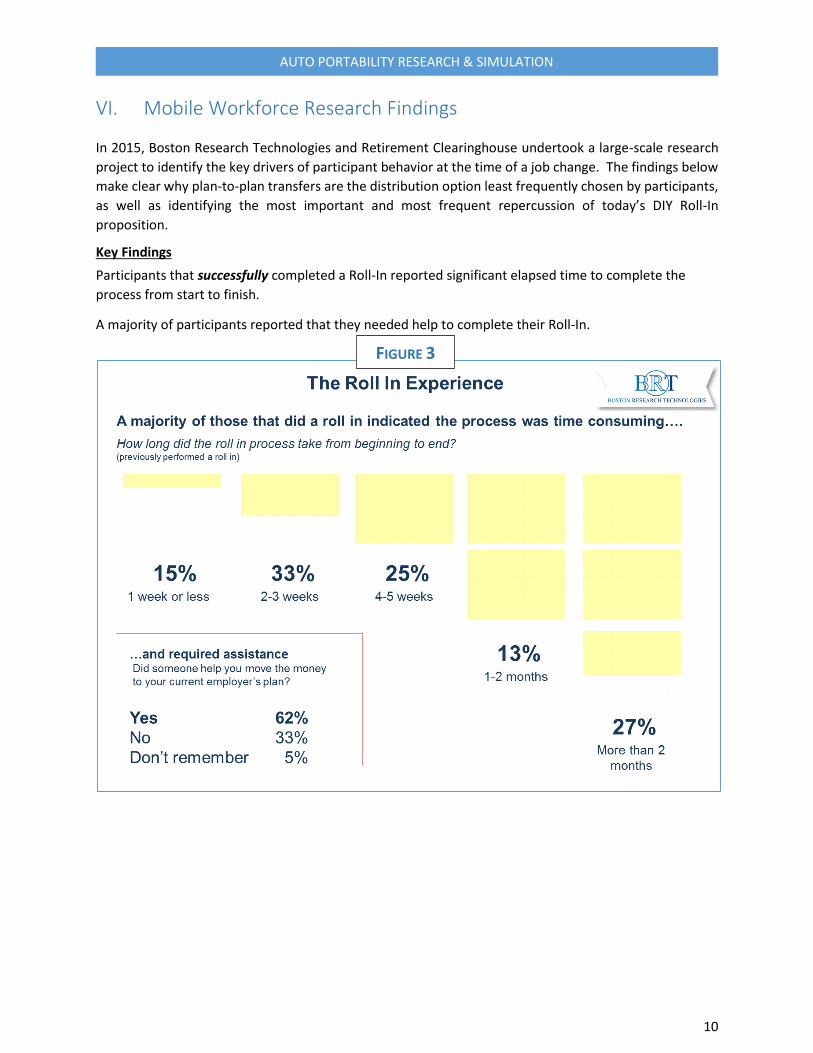
VI. Mobile Workforce Research Findings
In 2015, Boston Research Technologies and Retirement Clearinghouse undertook a large-scale research
project to identify the key drivers of participant behavior at the time of a job change. The findings below
make clear why plan-to-plan transfers are the distribution option least frequently chosen by participants,
as well as identifying the most important and most frequent repercussion of today’s DIY Roll-In
proposition.
Key Findings
Participants that successfully completed a Roll-In reported significant elapsed time to complete the
process from start to finish.
A majority of participants reported that they needed help to complete their Roll-In.
FIGURE 3

11
AUTO PORTABILITY RESEARCH & SIMULATION
Participants were shown the flow diagrams above and asked to estimate the amount and value of the
time they would need to complete the Roll-In process.
Key Findings
Participants estimated that the average time spent completing a Roll-Into their new employer plan
would require 9.8 hours of their time, almost ten times the amount of time that a trained service
representative would expend.
A majority of participants estimated that the value of the time they expended completing a Roll-In
would be more than $100.
FIGURE 4

12
AUTO PORTABILITY RESEARCH & SIMULATION
Key Findings
On a weighted average basis, 37% of participants reported using the proceeds from their cash out for
emergency purposes, meaning that 63% of participants did not ‘need’ the money.
Cash outs would be significantly reduced – and savings retained in the qualified plan system for long-
term retirement needs - if participants received guidance and assistance with an account transfer at the
time of their job change.
The research suggests that Millennials are creating a transactional definition of retirement savings, an
implication that is contrary to their long-term retirement savings needs.
FIGURE 5

13
AUTO PORTABILITY RESEARCH & SIMULATION
In 2013, Boston Research Technologies (known as Boston Research Group at the time) examined the
results of 6 years of portability solutions delivered to a mega-plan sponsor in the hospital services industry,
covering more than 190,000 participants at the time of their job change. These results were subsequently
published in a paper titled “Eliminating Friction and Leaks in America’s Defined Contribution System”.
Key Findings
When participants were offered guidance and assistance – a personalized n engagement at the time of
their job change - cash outs were reduced by an average of 50% when compared to industry-reported
averages.
Intervention and engagement with participants by qualified service representatives were critical success
factors in reducing cash outs.
Based on this information, EBRI subsequently calculated that Cash Out Leakage could be reduced by $1.3
trillion dollars over a ten-year period, across all account balance segments.
Talking Points
In 2012, EBRI-CRI estimated the additional retirement savings that would result if cash out leakage
was reduced uniformly across all balance segments and reported that the difference between current
projections and a 50% reduction in cash out leakage would yield an additional $1.3 trillion in savings.
A subsequent analysis indicated that 10% of cash out leakage was attributable to the <$5,000
segment.
FIGURE 6

14
AUTO PORTABILITY RESEARCH & SIMULATION
VII. Characteristics of the Mobile Workforce
The following charts and tables document the key data underpinnings of the Auto Portability
Simulations. The source for each data element is noted by the logo embedded in the chart or table.
Talking Points
The growth rate in 401(k) participants is taken from the EBRI Retirement Security Projection Model® o The numbers are based on projected demographics from Census as well as current coverage
and participation rates and job turnover statistics. o The baseline numbers assume coverage rates remain constant (as a function of age) and the
current balance of automatic enrollment vs. voluntary enrollment plans (weighted by participants) remains constant.
o For the alternative scenario, we assume that automatic adoptions increase at a 5 percent rate (over five years) and that coverage rates (combined voluntary enrollment and automatic enrollment) increase at a 1 percent rate (over five years).
FIGURE 7
15
AUTO PORTABILITY RESEARCH & SIMULATION
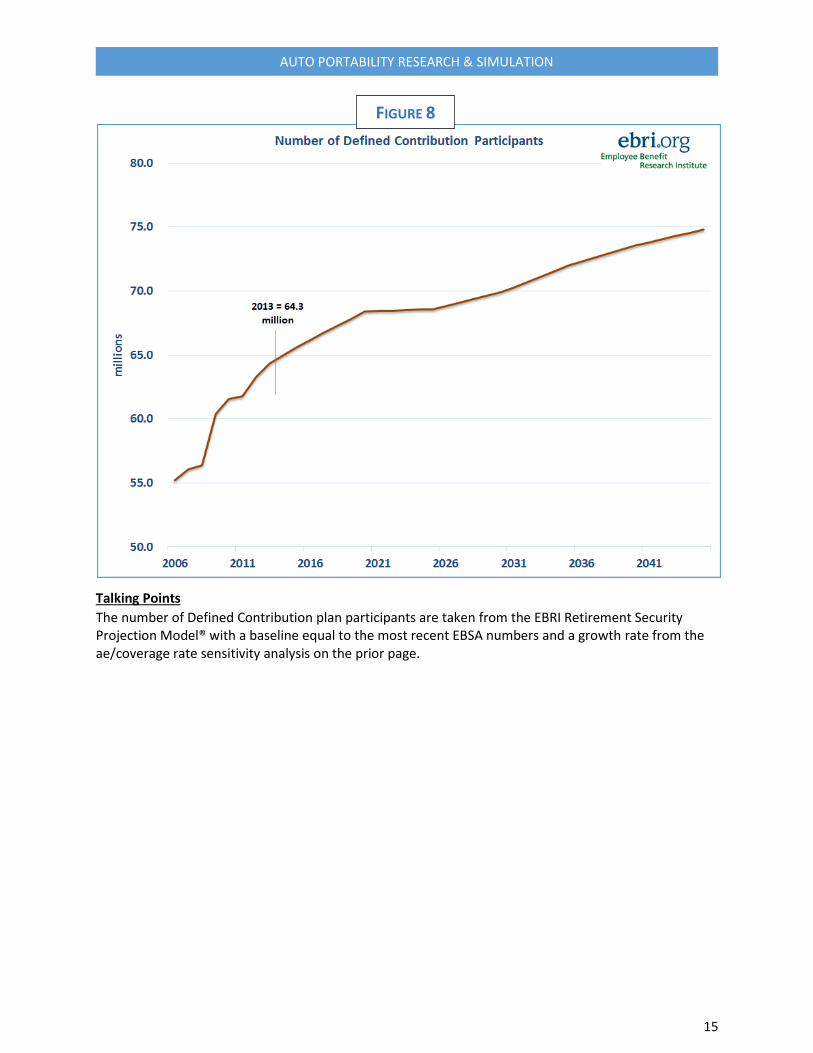
Talking Points
The number of Defined Contribution plan participants are taken from the EBRI Retirement Security Projection Model® with a baseline equal to the most recent EBSA numbers and a growth rate from the ae/coverage rate sensitivity analysis on the prior page.
FIGURE 8

16
AUTO PORTABILITY RESEARCH & SIMULATION
Key Findings (based on 2013 data)
An estimated 18 million participants are subject to a Mandatory Distribution from their plan when they
elect to change jobs.
An estimated 33 million participants are in the ‘danger zone’ [red and yellow segments]; current
experience predicts that more than one out of three will cash out their small account when they next
change jobs.
Small, potentially unconsolidated balances, make up the majority of accounts in the Defined
Contribution system.
Talking Points
Analysis is based on the EBRI/ICI Participant-Directed Retirement Plan Data Collection Project. This source is the largest, most representative repository of information about individual 401(k) plan participant accounts. As of December 31, 2013, the EBRI/ICI database included statistical information about:
o 26.4 million 401(k) plan participants, in o 72,676 employer-sponsored 401(k) plans, holding o $1.912 trillion in assets.
The 2013 EBRI/ICI database covers about half of the universe of 401(k) plan participants, nearly 15 percent of plans, and 46 percent of 401(k) plan assets. The EBRI/ICI project is unique because it includes data provided by a wide variety of plan record-keepers and, therefore, represents the activity of participants in 401(k) plans of varying sizes—from very large corporations to small businesses—with a variety of investment options.
FIGURE 9

17
AUTO PORTABILITY RESEARCH & SIMULATION
Key Finding
Turnover is highest in the smallest balance segment of the mobile workforce; participants with <$5,000
in their account. These participants change jobs every 3.6 years.
Talking Points
This analysis is the product of a two-year longitudinal analysis of the EBRI/ICI data (2012-2013) to determine the percentage of 401(k) participants who left the database as a function of account balance.
It focuses on those who were in the data in 2012 but were not there in 2013 subject to the following proviso:
o In some cases, an entire plan may change record-keepers and no longer be part of the database. o To control for that outcome, we put in two filters (55 and 97 percent) to determine whether the
plan left the database en masse. o We could not use 100 percent since there is a high likelihood that some participants from that
specific plan would end up in the next year’s data with another sponsor who is in the database. o If the plan was determined to have left the database, then all of the plan’s participants in 2012
were excluded from the analysis.
FIGURE 10

18
AUTO PORTABILITY RESEARCH & SIMULATION
Key Finding
The size of the annual mobile workforce numbers in the millions of participants and is projected to
increase over the time horizon modeled in the Auto Portability Simulation.
Talking Points
To determine the number of annual job changes by account balance category in 2016, we:
o Took the percentage of 2013 account balances less than $5k (28 percent) and multiplied by the number of 401(k) participants for that year (2016/2045) from Figure 8 (Pg 15).
o We then multiplied by the number from Figure 10 (Pg 17) for those with less than a $5k balance (using the .55 filter) for a value of 5.3 million expected job changers with a 401(k) account balance greater than zero but less than $5k.
o Similar techniques were used for the other two categories.
FIGURE 11

19
AUTO PORTABILITY RESEARCH & SIMULATION
Key Findings
Leakage is not a one-time event and occurs at different rates over time:
“Fast Leakage” is the largest source of cash outs and occurs within a one-year period from the
time of job change.
“Slow Leakage” occurs at steady rate over an extended time horizon.
Timing is critical; pro-active intervention needs to be provided immediately – and often - in the 12
months following a job change to prevent cash outs and preserve retirement savings.
Taken together, fast and slow leakage indicate that nearly 89% of small balance accounts will cash out
over a 20-year timeframe.
Talking Points
Year 1 results were compiled from various industry ‘leakage’ reports [see Pg 26 for data sources].
Years 2-7 results were compiled from six years of data that tracked the disposition over time of more than
50,000 participants that were distributed from their plan via the automatic rollover process and, for those
that did not respond, into a safe harbor IRA.
FIGURE 12

20
AUTO PORTABILITY RESEARCH & SIMULATION
VIII. About the Auto Portability Simulation (“APS”)
The Auto Portability Simulation employs two scenarios to illustrate the impact on the small balance
segment of the mobile workforce ‘before & after’ the implementation of Auto Portability. Each of these
Scenarios is further described below, along with the key findings produced by the simulation.
The simulation uses a 10-year market adoption period – shown below in the period 2016-2025 - reflecting
the historically slow rate of adoption of innovations in the retirement industry.
Scenario 1: Current State
Models all the discrete distribution events that occur for participants with <$5,000 in their account and
subject to a mandatory distribution from their plan at the time of job change. The simulation utilizes the
data / results of the research described in the earlier sections of this report.
Scenario 2: with Auto Portability
Models all the discrete distribution events that occur for participants with <$5,000 in their account and
subject to a mandatory distribution from their plan at the time of job change.

21
AUTO PORTABILITY RESEARCH & SIMULATION
IX. Auto Portability Simulation
Auto Portability proposes to utilize electronic records matching technology to move an inactive
participant’s account from their former employer plan through a safe harbor IRA and into their new
employer plan, utilizing negative consent to automate the transfer.
Key Findings
The Locate & Match Ratio is dependent on market adoption, i.e. as the market adopts Auto Portability,
an increasing percentage of small balance accounts will be consolidated from an inactive employer plan
or safe harbor IRA into an active employer plan.
As coverage increases through auto enrollment, increased adoption by small employers and through
state-based initiatives, the Locate & Match Ratio will begin to approach 100%.
Talking Points
An important Auto Portability success metric is the ‘Locate & Match’ ratio, which is highly dependent on
market adoption rates, i.e. the higher the overall market adoption rate, the greater the probability of
locating and matching a participant’s inactive and active plans.
The Locate & Match ratio is calculated using a 12-month trailing average of new participants entering the
network, divided by the number of participants located in the same 12-month period.
Retirees and Participants that change jobs to an employer that does not sponsor a qualified plan are the
primary categories of participants that are not successfully located and matched.
FIGURE 13

22
AUTO PORTABILITY RESEARCH & SIMULATION
Key Findings: Simulation
Scenario 1
Annual cash outs are currently estimated to be slightly more than $7 billion per year, illustrating the
aggregate impact of 3.9 million small balance participants cashing out on an annual basis.
Scenario 2
Cash outs begin to decline and roll-ins (plan-to-plan transfers) begin to increase in 2016, primarily as a
function of market adoption, which drives the Locate & Match rate.
Annual cash outs are estimated to decline from an annual rate of more than $7 billion in 2016 to less than
$2.5 billion in 2045, a reduction of more than 60%. Subsequent to the adoption period, cash outs gradually
decline over time to their ‘natural floor’ (37%).
Annual Roll-Ins are estimated to grow to an annual rate of more than $5 billion, reflecting a change in
behavior driven by the new default – Auto Portability – utilized by more than 3 million participants per
year.
FIGURE 14

23
AUTO PORTABILITY RESEARCH & SIMULATION
X. Additional Findings
Key Finding
Participants expressed a willingness to utilize a Roll-In service provided by their plan sponsor to
consolidate their savings in their active plan.
Talking Point
Price points from $0 - $5,000 were tested.
FIGURE 15

24
AUTO PORTABILITY RESEARCH & SIMULATION
Key Finding
Participants would consider using their plan as their primary savings vehicle, if it were as easy to use as
their IRA.
FIGURE 16

25
AUTO PORTABILITY RESEARCH & SIMULATION
Key Findings
Auto Portability carries an additional benefit, a decrease in small accounts over time. As participant accounts are consolidated in their new employer plan, accounts incubate and grow, reducing the risk of cash out. A reduction in the number of accounts will result in reduced administrative costs as the number of mailings, statements, etc. declines along with aggregate record-keeping expenses.
Talking Points
To determine the percent reduction in the number of 401(k) accounts with less than $5k over the next ten years (assuming these accounts are rolled-in), we needed to use EBRI’s Retirement Security Projection Model® to simulate the impact of rolling in the small accounts and giving them the opportunity for further growth (to a level greater than $5k). We took two polar opposites in terms of immediate roll-in behavior: 10 percent vs. 90 percent The graph on Figure 17 (Pg 25) shows that the difference between these two scenarios grows quite rapidly for the first five years and then reaches what appears to be an equilibrium point of approximately 22 percent.
FIGURE 17

26
AUTO PORTABILITY RESEARCH & SIMULATION
XI. Principal Research & Data Sources
1. Employee Benefit Research Institute (many)
2. Boston Research Technologies
a. ‘Manual Portability and the Mobile Workforce’, April/May 2015
b. ‘Eliminating Friction & Leaks in America’s Defined Contribution System’, April 2013
3. GAO: ‘Policy Changes Could Reduce the Long-term Effects of Leakage on Workers' Retirement Savings’, Aug 2009
4. Industry Research Reports, 2011-2015
a. Fidelity: ‘Plugging the leaks in the DC system: Bridging the gap to a more secure retirement’, Q2 2010; ‘Cashing Out Can Derail Retirement’, February 2014; (+ many)
b. Vanguard: ‘How America Saves’, 2011-2014
c. Aon Hewitt: ‘Leakage of Participants’ DC Assets: How Loans, Withdrawals, and Cashouts Are Eroding Retirement Income’; ‘Retirement Plan Leakage-Cause For Concern - And Action’, April 2013; (+ many)
d. Retirement Clearinghouse: ‘Annual Report to Clients of Participant Decisions’, 2011-2015


![January 10, 2012 [Participant Name] [Participant Street ......January 10, 2012 [Participant Name] [Participant Street Address] [Participant City, State Zip code] Dear [Participant](https://static.fdocuments.in/doc/165x107/5f8ad691c7ddf87a4309ec05/january-10-2012-participant-name-participant-street-january-10-2012.jpg)