2016 Packers and Stockyards Program Annual Report - USDA · P&SP operates under the authority of...
41
U.S. DEPARTMENT OF AGRICULTURE Grain Inspection, Packers and Stockyards Administration 2016 Annual Report PACKERS AND STOCKYARDS PROGRAM Mission: To protect fair trade practices, financial integrity, and competitive markets for livestock, meat, and poultry.
Transcript of 2016 Packers and Stockyards Program Annual Report - USDA · P&SP operates under the authority of...
U.S. DEPARTMENT OF AGRICULTURE
Grain Inspection, Packers and Stockyards Administration
2016 Annual Report PACKERS AND
STOCKYARDS
PROGRAM
Mission: To protect fair trade practices, financial
integrity, and competitive markets for livestock, meat,
and poultry.

OVERVIEW OF P&SP...........................................................................................................................................3
AUTHORITIES OF P&SP AND RESPONSIBILITIES OF P&SP...............................................................................4
P&SP HIGHLIGHTS..............................................................................................................................................5
ECONOMIC STATE OF THE LIVESTOCK AND POULTRY INDUSTRIES.......................................7
CHANGING BUSINESS PRACTICES IN THE LIVESTOCK AND POULTRY INDUSTRIES.....12
PROCUREMENT AND PRICING METHODS...............................................................................12
CHANGES IN OPERATION AND ORGANIZATION..................................................................................16
INDUSTRY CONDITIONS AND EVENTS.................................................................................................20
CONCERNS IN THE LIVESTOCK AND POULTRY INDUSTRIES.......................................................22
P&SP REGIONAL OFFICE ACTIVITIES......................................................................................................24
ENFORCING BUSINESS-PRACTICE PROVISIONS................................................................................................26
Competition........................................................................................................................................26
Trade Practices..................................................................................................................................28
ENFORCING FINANCIAL PROVISIONS...............................................................................................................31
P&SP PROGRAM PERFORMANCE AND EFFICIENCY.........................................................................36
PERFORMANCE MEASUREMENT.......................................................................................................................36
EFFICIENCY MANAGEMENT.............................................................................................................................37
CONTACTING P&SP............................................................................................................................................39
APPENDIX A-B............................................................................................................................... ...........41
2016 P&SP Annual Report
Page 2
TABLE OF CONTENTS

P&SP operates under the authority of the Packers and Stockyards Act of 1921 (P&S Act) (7 U.S.C. § 181
et seq.), which makes it unlawful for packers, live poultry dealers, market agencies selling or buying on
commission, dealers, and swine contractors to engage in or use any unfair, unjustly discriminatory, or
deceptive practice or device. The P&SP Deputy Administrator, who reports to the Administrator of the
U.S. Department of Agriculture’s (USDA) Grain Inspection, Packers and Stockyards Administration
(GIPSA), manages P&SP (Appendix A). In fiscal year (FY) 2016, P&SP’s allocated portion of the GIPSA
appropriation was $23.0 million, the same as 2015, but an
increase from $22.3 million in 2014. At the close of FY
2016, P&SP had 139 full-time staff and 7 vacancies for a
total of 146 full-time positions.
P&SP’s Deputy Administrator provides strategic leadership
to the directors of three regional offices and the director of a
headquarters division, shown below
Eastern Regional Office (ERO) in Atlanta, Georgia
Midwestern Regional Office (MRO) in Des Moines,
Iowa
Western Regional Office (WRO) in Aurora, Colorado
Litigation and Economic Analysis Division (LEAD) in
Washington, D.C.
Each regional director manages their geographic area and
leads a team of unit supervisors. Together, they supervise a
staff of auditors, marketing specialists, resident agents,
economists, attorneys, and administrative support staff who
work from the regional office or various field locations
throughout the region.
Staff members supervised in the regional offices conduct
investigations and regulatory activities. These include
business audits, weighing verifications, and day-to-day
industry monitoring. Their work often takes them to the
business locations of the regulated entities. A Central
Reporting Unit located in the WRO processes annual reports
filed by entities subject to the P&S Act.
LEAD provides litigation support through reviewing investigations and preparing sanction and stipulation
recommendations. It also assists the Office of General the Counsel (OGC) or the Department of Justice
(DOJ) in preparing for hearings and negotiating settlements. Staff members testify at hearings. LEAD also
processes and summarizes industry data, develops P&SP policy, and prepares information materials, press
releases, and notices and regulations under the P&S Act.
2016 P&SP Annual Report
Page 3
OVERVIEW OF P&SP

OVERVIEW OF P&SP AUTHORITIES AND RESPONSIBILITIES OF P&SP
Under the P&S Act, the Secretary of Agriculture (Secretary) regulates specified activities of businesses
engaged in the marketing of livestock, meat, and poultry. The Secretary, through the Under Secretary for
Marketing and Regulatory Programs, delegated this authority to the GIPSA Administrator. GIPSA’s
P&SP fulfills these responsibilities under the P&S Act. Regulated business entities include:
• Livestock market agencies (both livestock auctions selling on commission and commissioned
buyers)
• Livestock dealers
• Stockyards
• Packers
• Swine contractors
• Live poultry dealers (those who obtain poultry for slaughter either by purchase or under poultry
growing arrangements).
P&SP does not have jurisdiction over livestock
producers, feedlots, poultry growers or most retailers. In
addition to describing unlawful behavior, the P&S Act
and associated regulations mandate certain business
practices by regulated entities. For example, market
agencies and dealers must register with P&SP.
Market agencies, packers whose annual livestock
purchases exceed $500,000, and dealers must secure
bonds or bond equivalents to protect livestock sellers.
Market agencies selling livestock on commission are
required to establish and maintain a separate bank
account designated as “custodial account for shippers
proceeds” and deposit into that account the proceeds from
the sale of livestock. Regulated buyers must pay
promptly for livestock.
P&SP uses its authority to investigate alleged violations
of the P&S Act and regulations. USDA’s OGC represents
the Secretary in enforcements under the P&S Act and
regulations. OGC takes administrative action against
violations alleged in P&SP investigations. OGC may also
refer matters to the DOJ for prosecution, when
warranted.
2016 P&SP Annual Report
Page 4
OVERVIEW OF P&SP
2016 P&SP Annual Report
Page 5
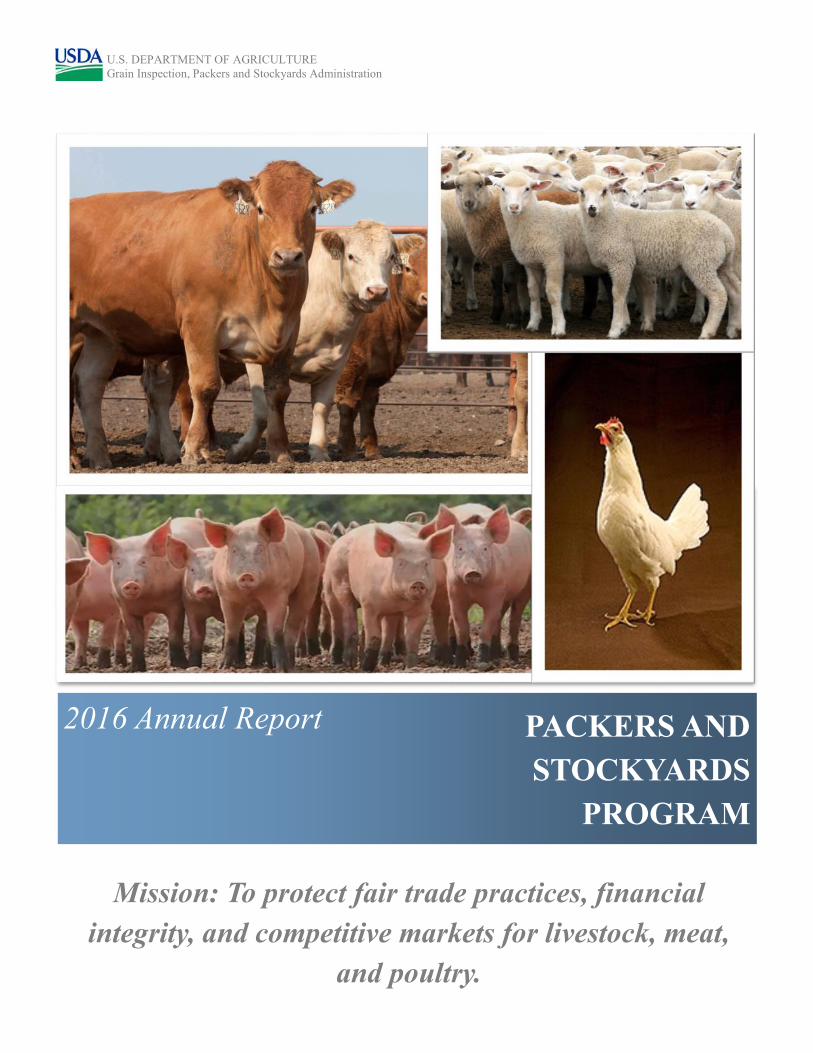
P&SP HIGHLIGHTS
P&SP benefits America’s agriculture and consumers by enforcing provisions for fair
trade, prompt payment, and open competition in the marketing of livestock, meat, and
poultry. The circular graphic below provides a snapshot of the agency and its 2016
accomplishments in promoting industry compliance with the P&S Act .
IN BRIEF...

2016 P&SP Annual Report
Page 6
P&SP HIGHLIGHTS
NUMBER AND TYPE OF
REGULATED ENTITIES 2016

This section contains an assessment of the cattle and hog industries as required by Section 415 of the P&S
Act. (7 U.S.C. § 228d). The first part of this section assesses the general economic state of the industries
that are regulated by P&SP. This includes trends in the number of entities, financial conditions, and market
share of the four largest packers by type of livestock (market concentration). The second part examines
changing business practices of entities in the regulated industries. This includes pricing and procurement
methods, and the volume marketed through market agencies via commissions versus direct purchases.
Finally, this section outlines specific concerns about the events and conditions in the industries regulated
under the P&S Act and P&SP’s actions to address those concerns.
In this section, P&SP generally uses data from regulated entities’ annual reports for the most recent 10
years. The annual reports for the 2016 calendar-reporting year are not due until April 15, 2017. As a result,
most data series in this section end with entities’ 2015 reporting year. There are exceptions. These include
statistics on entities currently bonded and/or registered as recorded in P&SP databases, USDA Agricultural
Census statistics on swine contractors, statistics on types of procurement methods compiled from data
reported to USDA’s Agricultural Marketing Service (AMS) under the provisions of the Livestock
Mandatory Reporting Act (LMR) (7 U.S.C. § 1635 et seq.). LMR is also referred to as livestock mandatory
price reporting (LMPR) and mandatory price reporting (MPR).
The following entities are subject to the P&S Act:
• All packers operating in interstate commerce are subject to the unfair and deceptive practices
restrictions and prompt payment provisions of the P&S Act. Entities that purchase $500,000 or more
of livestock for slaughter annually are required to be bonded and file annual reports. Bonded
slaughter entities include entities operating Federally-inspected plants as well as some entities
operating state-inspected plants. Some packers that purchase less than $500,000 of livestock
voluntarily obtain bonds.
• Live poultry dealers include persons who purchase poultry for slaughter and poultry integrators
who contract with producers for grower services to raise chicks or poults to slaughter weight.
• Livestock dealers purchase livestock for resale on their own accounts, or they may purchase or
sell as the agent or representative of another entity.
• Market agencies are entities engaged in the business of buying or selling livestock in commerce
on a commission basis. They usually own and operate auction markets, but some only furnish
stockyard services, or, in rare cases, provide State brand inspection services.
• Posted stockyards are physical facilities and are not necessarily separate businesses. Auction
market agencies are usually located at posted stockyards, but may or may not be the same entities
that own and operate the stockyards.
• Swine contractors are entities that contract with swine production contract growers to care for
and raise the contractors’ swine for slaughter.
2016 P&SP Annual Report
Page 7
ECONOMIC STATE OF THE LIVESTOCK AND POULTRY INDUSTRIES

The number of entities subject to the P&S Act varies somewhat from year to year. The number of bonded
slaughter entities, bonded market agencies and live poultry dealers declined slightly in 2016 from the prior
year. The number of bonded livestock dealers, and posted stockyards increased (Table 1).
At the end of fiscal year 2016, there were 294 bonded livestock slaughter entities, 132 live poultry dealers,
4,660 registered livestock dealers, and 1,221 market agencies that were subject to the P&S Act. There were
also 1,261 posted stockyards and, as of 2012, just over 500 swine contractors (Table 2). From 2007 to 2012,
the total number of hog farms declined from
74,789 to 55,882 (Table 2). This represented a
decline of 18,907 farms or 25.3 percent.
The number of contractors and contract
growers also declined from 2007 to 2012.
However, contractors as a percentage of total
farms remained the same at 1 percent. As a
percentage of total farms, contract growers increased 2 percent from 12 percent to 14 percent. The use of
contract growing arrangements in the hog industry has remained relatively stable over the last two Census
of Agriculture years of 2007 and 2012 with the percentage of hogs grown under contract at 43 and 44
percent, respectively. When slaughter hogs are grown under contract, swine contractors typically own the
hogs and sell the finished hogs to pork packers. The swine contractors typically provide feed and medication
to the contract growers who own the growing facilities and provide growing services. P&SP regulates the
business practices of swine contractors.
2016 P&SP Annual Report
Page 8
ECONOMIC STATE OF THE LIVESTOCK AND POULTRY INDUSTRIES
Table 2. Number of Farms by Swine Grower/Producer Type2
Table 1. Number of Bonded Slaughterers, Live Poultry Dealers, Bonded Dealers and
Market Agencies, and Posted Stockyards - Entities Reporting to PSP
2 Note swine contractors do not file an annual report with the Packers and Stockyards Program, data from Census of Agriculture.
Year
Bonded
Slaughter
Entities
Live Poultry
Dealers
Bonded
Dealers
Bonded Market
Agencies
Posted
Stockyards
2007 296 NA 3,883 1,410 1,413
2008 281 126 4,685 1,326 1,392
2009 284 125 4,529 1,225 1,170
2010 233 117 4,468 1,205 1,209
2011 258 136 4,572 1,220 1,218
2012 295 133 4,619 1,234 1,238
2013 297 136 4,639 1,216 1,241
2014 295 137 4,650 1,202 1,247
2015 305 133 4,607 1,224 1,256
2016 294 132 4,660 1,221 1,261
Year
Grower/Producer Type 2007 2012
Independent Grower 65,067 47,336
Contractor or Integrator 737 515
Contract (contract grower) 8,995 8,031
Total 74,789 55,882

Packers’ livestock purchases decreased to $72.5 billion in 2015 from $79.0 billion in the previous year. The
dollar volume for entities selling on commission and for entities operating as dealers or purchasing on a
commission basis also declined, following increases in the prior 3 years (see below, Figure 1).
P&SP requires packers with livestock purchases that equal or exceed $500,000 per year to report the
number of head slaughtered annually. The number of cattle slaughtered by packers reporting to P&SP
declined over the past 4 years from 33.8 million head in 2011 to just over 28 million head in 2015 (Table 3).
Total cattle includes steers and heifers (often collectively called “fed cattle”), cows, and bulls, but excludes
calves. In most, but not all cases, individual plants operated by entities that report to P&SP tend to slaughter
either fed cattle or cows and bulls.
The number of hogs slaughtered as reported by packers to P&SP increased each year from 2006 to 2009,
then declined by around 3 percent or 3.1 million head in 2010 and another 2 percent or 1.2 million head in
2011. Hog slaughter reached the highest level in the past decade in 2014, at over 122 million head, but fell
to less than 114 million in 2015 (Table 3).
Sheep and lamb slaughter reached the highest level in the past decade in 2013, increasing 30 percent from
the prior year to 3.2 million head. In 2015, the number of sheep and lambs slaughtered by packers reporting
to P&SP increased to 2.9 million head from 2.7 million in the prior year.
Poultry processors reporting to P&SP slaughtered an estimated 52.2 billion pounds of chicken and 8.1
billion pounds of turkey in 2015. These are the highest levels reported in the past decade.
Changes in slaughter plant numbers for cattle and hogs reflect the increasing size of slaughter plants, as
economic conditions, mergers and acquisitions, and efforts to improve efficiencies resulted in a significant
decline in the number of plants while total slaughter remained stable or even increased.
2016 P&SP Annual Report
Page 9
ECONOMIC STATE OF THE LIVESTOCK AND POULTRY INDUSTRIES
Figure 1. Dollar Value of Packers, Dealers, and Market Agencies Selling and Buying
on Commission Subject to P&S Act, 2006 - 2015

Table 3. Purchases of Livestock and Poultry for Slaughter - Entities Reporting to P&SP
The apparent reversal in this trend in 2015 for hog and lamb plants may be due to higher livestock prices
causing more packers to reach the $500,000 reporting threshold. Also, while the number of plants
slaughtering sheep and lambs has increased significantly since 2008, many of these are small multispecies
plants that slaughter only a few sheep and lambs (Table 4). Poultry plant counts are available only for the
most recent years.
Table 4. Number of Slaughter Plants Operated by Entities Reporting to P&SP
2016 P&SP Annual Report
Page 10
ECONOMIC STATE OF THE LIVESTOCK AND POULTRY INDUSTRIES
* Includes Broilers, Turkeys and Ducks
Year Cattle Hogs Sheep and
Lambs Poultry*
2006 168 159 55 NA
2007 165 165 56 NA
2008 135 126 52 NA
2009 133 134 54 NA
2010 135 129 59 NA
2011 147 136 70 NA
2012 168 157 81 NA
2013 166 143 79 NA
2014 163 125 72 230
2015 161 138 81 240
Year Cattle Hogs
Sheep
and
Lambs
Broilers Turkeys
(Million Head) (Billion lbs.)
2006 32.1 104.5 2.0 NA NA
2007 33.0 108.6 2.5 45.6 6.6
2008 32.0 109.0 1.8 46.2 7.4
2009 32.1 113.2 2.0 46.4 6.9
2010 33.0 110.1 1.9 48.4 7.2
2011 33.8 108.9 1.8 49.0 7.1
2012 33.5 110.1 2.1 49.4 7.5
2013 31.8 113.3 3.2 52.1 7.4
2014 30.0 122.3 2.7 50.1 7.2
2015 28.1 113.7 2.9 52.2 8.1

The four largest slaughter entities’ share of livestock slaughter has ranged from 66 to 71 percent for the past
decade (Table 5). The four largest entities that slaughter steers and heifers accounted for 85 percent of total
steer and heifer slaughter in 2015, a slight increase from the previous year. Prior to 2009, concentration in
steer and heifer purchases had remained around 80 percent. Cow and bull slaughter has consistently been
less concentrated than fed cattle slaughter. The share increased to its highest level of 60 percent in 2013,
but declined to 57 percent in 2014 and 2015. The four-firm concentration ratio for hog slaughterers has
remained in the low- to mid-60’s range for the last 10 years.
Due to the small total slaughter volume for sheep and lambs, moderate volume adjustments by any of the
largest four entities can result in relatively large changes in the percent of total slaughter accounted for by
those entities. The combined market share of the four largest sheep and lamb slaughter entities stayed near
70 percent from 2005 through 2009. The share then decreased by five percentage points in 2010 and six in
2011, reversed direction in 2012 but fell to 57 percent in 2015. Throughout these years, changes in market
shares represented only a few thousand head of slaughter lambs. The market shares and other concentration
measurements likely overstate concentration in the lamb market because non-traditional markets account
for as much as one-third of the lambs slaughtered in the United States and are not included in the totals.
Concentration in broiler slaughter has been at 51 percent for the past two years, a sharp decline from the 57
percent level seen in 2007. The share of production accounted for by the four largest turkey slaughter firms
in 2014 and 2015 was higher than it had been in some previous years.
2016 P&SP Annual Report
Page 11
ECONOMIC STATE OF THE LIVESTOCK AND POULTRY INDUSTRIES
* Concentration statistics for Total Value Purchases are livestock purchases from packer annual reports.
Statistics for Broiler and Turkey Slaughter are computed from P&SP poultry annual reports.
Table 5. Four-Firm Concentration in Livestock Slaughter by Type of
Livestock and Poultry - Federally-Inspected Plants *
Year
Total Value
Purchases
(%)
Steers &
Heifers
(%)
Cows &
Bulls
(%)
Hogs
(%)
Sheep &
Lambs
(%)
Broilers
(%)
Turkeys
(%)
2005 67 80 48 64 70 NA NA
2006 66 81 54 61 68 NA NA
2007 66 80 55 65 70 57 52
2008 68 79 55 65 70 57 51
2009 71 86 54 63 70 53 58
2010 67 85 53 65 65 51 56
2011 67 85 53 64 59 52 55
2012 68 85 56 64 62 51 53
2013 67 85 60 64 59 54 53
2014 67 83 57 62 58 51 58
2015 68 85 57 66 57 51 57

Procurement and Pricing Methods
The pricing method that sellers and purchasers agree to use for a transaction is a fundamental characteristic
of any market transaction. For livestock, pricing methods are most often divided into two categories: live-
weight and carcass pricing methods.
In live-weight purchasing of livestock, the final payment is determined based on the weight of the live
animal. Transactions that use some variation of live-weight purchasing are usually on an “as-is” basis with a
single price per pound for all animals in the entire transaction. The price may be fixed by negotiation in
advance, or established by formula from prices reported by AMS or a market price reporting service when
the animals are delivered or slaughtered. In some instances, provisions may be made for paying different
prices for animals that differ significantly from other animals in the transaction (e.g., animals that are much
smaller than the average for the transaction may receive a lower price).
In a carcass-based purchase, the final payment is determined based on each animal’s hot carcass weight,
which is the weight of the carcass after the animal has been slaughtered and eviscerated. Carcass-based
purchase methods often involve schedules of premiums or discounts based on the quality of the carcasses.
The price of carcasses can also be determined by other features, such as time of delivery and number of
animals in the transaction. The price before premiums or discounts is referred to as the base price. Carcass-
based pricing may reward sellers with livestock that exceeds certain thresholds of carcass quality. Livestock
carcasses graded below the thresholds may result in the seller receiving discounts. One benefit of carcass-
based pricing is the ability to convey consumer preferences to livestock producers through premiums and
discounts.
The proportion of cattle purchased on a carcass basis has varied over the last ten years with no obvious
trend, ranging from around 53 percent to 64 percent of total purchases. The proportion of calves
purchased on a carcass-weight basis is considerably less than the percentage of cattle, but has also exhibited
a mixed pattern with a large decline in 2015 to 19.5 percent (Table 6).
Carcass-based purchases have become the predominant procurement method used for hogs purchased for
slaughter and has been between 76 and 88 percent over the last decade (Table 6). The industry also refers to
these as “carcass-merit” purchases. Carcass-based purchases include a base price that applies to all carcasses
in the transaction. Carcass-based pricing methods typically include premiums or discounts for individual
carcasses based on quality or other carcass attributes such as lean percent
or percentage of lean meat in the carcass. The industry calculates lean
percent using the carcass back-fat and loin-eye measurements using
electronic evaluation equipment along with mechanical measurements.
The proportion of sheep and lambs purchased on a carcass basis fell to
about 31 percent of the total in 2009, followed by an increase of nearly 10
percentage points in 2011, and was just over 29 percent in 2015.
2016 P&SP Annual Report
Page 12
CHANGING BUSINESS PRACTICES IN THE LIVESTOCK & POULTRY INDUSTRIES

P&SP monitors two major transaction locations in
livestock marketing. In one, producers deliver livestock
to an auction market that accepts the livestock for sale on
a commission basis. The livestock may also be offered for
sale through a video or internet auction. Buyers may
procure the animals for slaughter or for feeding or other
purposes. The second transaction point is direct exchange
between the livestock seller and a livestock dealer,
commission buyer, or packer.
The number of cattle handled by livestock auction markets
declined from 35.7 million head in 2006 to 31.7 million
head in 2015 (Table 7). However, these commission
entities continue to play an important role in the cattle
industry. Stockers (heifers and/or steers that are being
raised on pasture or other forage for sale later as feedlot replacements) and feeders (weaned calves that
have been raised to a certain weight and then sent to feedlots to be fattened) make up the majority of cattle
sold. Livestock auction markets also sell a significant number of cull cows (beef or dairy cows that are no
longer needed for breeding or milk production).
The volume of hogs marketed by entities selling hogs on commission from 2006 to 2012 has been between
7 and 9 million head in most years. The highest level of 9 million head occurred in 2009 but since then
volume declined most years to 7.5 million head in 2015 (Table 7). Hogs sold on commission are typically
older sows and boars or hogs of lower quality.
The volume of sheep and lambs sold through
commission entities has varied slightly over the past
10 years, but remained close to 3 million head in most
years (Table 7).
Packers use multiple direct exchange procurement methods
to obtain livestock for slaughter. The methods commonly
fall into two categories: (1) cash or “spot” sales for
immediate delivery or delivery within 14 days, and (2)
“committed procurement” arrangements that commit the
livestock to a particular packer more than 14 days prior to
delivery.
Committed procurement usually uses some form of
formula pricing. In cash sales, the prices generally are
negotiated, although the transaction may include grids to
establish premiums and discounts after the transfer.
2016 P&SP Annual Report
Page 13
CHANGING BUSINESS PRACTICES IN THE LIVESTOCK & POULTRY INDUSTRIES
Table 6. Percentage of Livestock Purchased on a
Carcass-Weight Basis - Entities Reporting to PSP
Table 7. Volume of Livestock Marketed Through
Auction Markets - Entities Reporting to PSP
(Thousands of Head)
Year Cattle
%
Calves
%
Hogs
%
Lambs
%
2006 53.3 33.7 76.6 48.1
2007 57.2 38.9 78.6 46.6
2008 62.3 46.1 87.8 55.2
2009 61.8 27.5 76.5 30.6
2010 59.1 36.2 77.5 31.6
2011 59.2 44.0 76.0 40.8
2012 60.6 28.9 76.4 36.2
2013 63.9 35.7 83.1 27.5
2014 62.9 38.7 76.9 26.5
2015 63.1 19.5 82.1 29.2
Year Cattle Hogs Sheep and
Lambs
2006 35,696 7,846 3,144
2007 35,263 8,395 2,772
2008 32,792 7,553 2,872
2009 33,214 9,047 2,883
2010 35,623 8,471 2,974
2011 34,956 8,919 3,046
2012 33,683 8,119 2,857
2013 33,690 7,319 3,162
2014 33,426 7,185 3,079
2015 31,650 7,453 3,015

Important components of committed procurement are “packer fed” livestock, “forward contracts” and
“marketing agreements.” P&SP defines “packer fed” livestock as all livestock obtained for slaughter that
a packer, a subsidiary of the packer, the packer’s parent firm, or a subsidiary of the packer’s parent firm
owns, in whole or part, for more than 14 days before the packer slaughters the livestock.
P&SP considers “forward contracts” to be agreements between packers and sellers for deliveries more than
14 days in the future of specific lots or quantities of livestock. The price of the livestock in a forward
contract can be set at the time of the contract or determined upon delivery based upon an agreed pricing
arrangement.
The term “marketing agreements” includes a variety of arrangements that establish an ongoing relationship
for trading multiple lots of livestock rather than negotiating single lots. In these arrangements, the seller
agrees to deliver livestock to the packer at a future date, with the price generally determined by some type
of formula pricing mechanism. The price is often based on the reported cash market or meat price at the
time of delivery, with premiums or discounts determined by evaluation of carcass characteristics.
AMS publishes prices and volumes of livestock purchased under alternative pricing methods as reported
under the provisions of the Mandatory Price Reporting Act (https://mpr.datamart.ams.usda.gov/).
Individual packers use a variety of procurement methods, ranging from packers that are fully integrated to
packers that rely primarily on the open market. Most hog packers use some combination of packer-fed
hogs, marketing agreements, forward contracts, and negotiated spot market procurement. These
combinations typically vary by plant for multi-plant packers.
The use of formula pricing methods and forward contracting for fed cattle has increased as a share of total
procurement over the past decade as the use of negotiated pricing declined.
In 2016, formula pricing represented 58 percent of total fed cattle procurement compared to 33 percent in
2007. Forward contracting accounted for
12 percent, this has increased from 8
percent in 2007. Negotiated pricing,
including negotiated grid and cash or spot
market transactions, made up 30 percent
of total fed cattle procured (not including
packer-owned cattle) in 2016, down from
almost 60 percent in 2007.
2016 P&SP Annual Report
Page 14
CHANGING BUSINESS PRACTICES IN THE LIVESTOCK & POULTRY INDUSTRIES
Figure 2.

For all hog slaughter entities reporting to AMS in 2016, about 50 percent of procurement was based on some
type of formula pricing (Figure 3). Hog packers obtained about 2 percent of hogs on the negotiated spot
market in 2016, compared to about 9 percent in 2007. Marketing agreements based on a formula accounted
for 48 percent of hog slaughter reported to AMS. These agreements are generally multi-year contracts. In
these contracts, the producer agrees to deliver a set number of hogs per year to a packer. They base the
contract price on a formula that includes a publicly reported hog or pork price.
With the decline in the volume of negotiated spot market hogs, both production and slaughter sectors
increasingly question whether the negotiated live price fully reflects the value of fed hogs sold for slaughter.
Consequently, the industry began migrating from formulas based on negotiated live or carcass prices to other
publicly reported prices. A popular replacement price is the pork carcass cutout price reported by AMS.
2016 P&SP Annual Report
Page 15
CHANGING BUSINESS PRACTICES IN THE LIVESTOCK & POULTRY INDUSTRIES
Figure 3.

In some respects the market for slaughter lambs is similar to markets for cattle and hogs, but in others it is
considerably different. Lambs tend to be marketed in one of two channels. In the traditional market for
slaughter lambs, the lambs are fed in feedlots and marketed to packers. It is this traditional market that
supplies most of the lamb to supermarkets and traditional stores.
Lamb packers use similar methods to purchase lambs as beef and pork packers. The methods include spot
markets, marketing agreements, forward contracts, and packer feeding. In the traditional lamb market,
packers purchased approximately 23 percent of their lambs under negotiated price. They purchased about 41
percent with marketing agreements, and packers fed about 36 percent of the lambs for slaughter (Figure 4).
The non-traditional market is much different. It is characterized by small butchers and meat shops that
process lambs and sell directly to consumers. Consumers can often choose the lamb before slaughter, and
consumers may have the choice of purchasing the lamb and processing it themselves.
One aspect of the non-traditional market is lambs are not typically processed in federally inspected slaughter
facilities. The packers that process the lambs are far too small to meet any of the mandatory price reporting
requirements. Consequently, there are very limited data available on the number of lambs in the non-
traditional market. There are also limited data on the prices paid for the lambs or the amount of meat
produced. Some estimates suggest that the non-traditional market for lambs may account for as much as one
third of the lambs produced in the United
States.
There are also small butchers and meat
shops that process cattle and hogs to sell
directly to end consumers, and there are
consumers that purchase cattle or hogs
and have them butchered. However, these
buyers purchase a relatively small portion
of the cattle and hogs produced in the
United States.
Changes in Operation and Organization
P&SP uses information about business practices at the packing plant level to identify industry trends. One
significant measure may be the intensity of operations (e.g., one or two shifts per day). The number of
plants in business at any given time might be another. The ownership of those plants may also be
significant. Plant closures or re-openings can affect competition by shifting supply and demand patterns.
The Federal Trade Commission and the Antitrust Division of DOJ review industry mergers and acquisitions
under the Hart-Scott-Rodino Antitrust Improvements Act of 1976 (Public Law 94-435).
2016 P&SP Annual Report
Page 16
CHANGING BUSINESS PRACTICES IN THE LIVESTOCK & POULTRY INDUSTRIES
Figure 4.

However, P&SP monitors packers’ mergers and acquisitions to determine whether a change in business
practices might reduce competition. Other changes in operations and industry conditions may also affect
competition as entities attempt to adjust to changing conditions. P&SP monitors these industry events for
any competitive effects.
Cattle, Sheep, and Hogs
In September 2015, PM Beef Holdings, LLC suspended operations at its beef slaughter and processing
facility in Windom, Minnesota. Its last day of production was September 25, 2015. The company President
cited years of deteriorating industry conditions, including rising cattle prices and limited cattle supply. The
plant had been operating for 67 years. In February, 2016, the company announced that it would sell the
plant to a partnership that plans to convert it to a pork processing facility and operate under the name
Prime Pork. The new company said the conver ted plant would slaughter more than 4,000 hogs per
day at full production.
In October 2015, the former Northern Beef Packers plant in Aberdeen, South Dakota reopened under the
name New Angus, LLC. The plant had closed in July 2013 after seven months of operations. White Oak
Global Advisors, a San Francisco-based investment firm bought the business out of bankruptcy. The
plant was ramping up production but processed less than its capacity of 1,600 head of cattle per day as of
the middle of 2016. New Angus said it would sell its beef under the DemKota Ranch Beef brand and
would have source verification programs in place.
In November 2015, Mountain States Lamb Cooperative entered into an agreement with JBS USA to
acquire the JBS Greeley Lamb plant and all related assets. Mountain States Lamb Cooperative, based in
Douglas, Wyoming, is a multi-state producer-owned marketing cooperative. It also owns Mountain States
Rosen, LLC, a meat marketing company with fabr ication, distr ibution and marketing assets in
Greeley, Colorado and Bronx, New York. The acquisition gave Mountain States its own slaughter
capabilities. It had a prior arrangement with JBS whereby JBS custom slaughtered Mountain States’ lambs.
JBS retained its Australian lamb operations. The acquisition placed Mountain States as the second largest
lamb processor in the United States, behind Superior Farms. The acquisition was completed in early
January 2016.
In March 2016 Central Beef Industries, LLC in Center Hill, Florida ceased operations and filed for
bankruptcy. It had been Florida’s largest beef processor. It was reported that the company was looking for
a buyer.
In April 2016, SuKarne, Mexico’s largest beef company opened a beef processing plant in Durango,
Mexico. The plant is now the largest beef plant in Mexico, and the company said it expects to process
600,000 fed cattle and 200,000 cows per year. The plant will be supplied mainly by feedlots adjacent to the
plant, but may also purchase cattle from U.S. feedlots.
2016 P&SP Annual Report
Page 17
CHANGING BUSINESS PRACTICES IN THE LIVESTOCK & POULTRY INDUSTRIES

In July 2016, Cargill Meat Solutions Corporation announced it had
reached an agreement to sell its cattle feed yards in Bovina and Dalhart
Texas to Friona Industries, LP based in Amarillo, Texas. The feed
yards had a combined one-time capacity of approximately 140,000
head. Cargill will keep its cattle feed yards in Yuma, Colorado and
Leoti, Kansas. Prior to this acquisition, Friona Industries operated four
feedlots with an approximate combined one-time capacity of 300,000
head.
In May 2016, the Fed Cattle Exchange, an online trading platform for
slaughter cattle, began operating on a weekly basis, with sales scheduled for every Wednesday. The Fed
Cattle Exchange provides a web-based interface where feedlots can offer pens of market ready cattle for
sale, and packers can bid on those offerings in a timed format, similar to an online auction. The exchange
held sales for three weeks, and then suspended operations for about 3 months. It resumed weekly sales in
mid-September. On September 29, 2016, AMS announced that it would report the Exchange’s sales in its
Livestock Mandatory Reporting cattle reports as negotiated purchases beginning October 5, 2016. While
the Exchange reported a weekly average of just under 1,700 head sold per week during September, its
weekly sales volume increased to approximately 7,500 head per week in October and November 2016. The
Fed Cattle Exchange is owned by Fed Cattle Exchange, LLC, a wholly owned subsidiary of Superior
Livestock Auction, LLC.
Existing pork processing facilities were pressed to handle the glut of hogs in the fall of 2016 with Saturday
slaughter often exceeding 300,000 head. With the closure of one slaughter facility and the opening of
another, slaughter capacity was largely unchanged. Greenwood Pack (3,000 head capacity) in Greenwood,
South Carolina ceased slaughtering hogs in May. Moon Ridge Foods in Pleasant Hope, Missouri with a
daily capacity of 2,500 head, however, began operation in August. In 2016 plant construction was under
way or in the planning stages for four new facilities with a combined daily slaughter capacity of 36
thousand head, but are not expected to come on line until 2017 and 2019 (Prime Pork in Windom
Minnesota, Triumph Foods in Sioux City, Iowa, Hatfield Foods in Coldwater, Michigan, and Prestage
Foods in Wright County, Iowa).
2016 P&SP Annual Report
Page 18
CHANGING BUSINESS PRACTICES IN THE LIVESTOCK & POULTRY INDUSTRIES

Poultry
While there were some broiler plant closures in 2016, processing capacity was not reduced. Rather,
production was centralized or consolidated at larger locations. Also several poultry firms expanded
production capacity during the year or announced plans to do so in the next year.
In February, Pilgrim’s Pride announced plans to invest almost $200 million in capital improvements that
target its feed production, fresh chicken and prepared foods operations in various locations including
Moorefield, Virginia and Mayfield, Kentucky. Later in the year, Pilgrim’s Pride announced it would
purchase Gold’n Plump Co., the St. Cloud, Minnesota-based producer of Gold’n Plump chickens. It is
expected that the sale will close during the first quarter of 2017.
In March, Allen Harim, LLC announced the closure of a plant in Cordova, Maryland to centralize broiler
operations in Harbeson, Delaware. In April, Ozark Mountain closed its processing plant in Warren,
Arkansas to consolidate its operations in Batesville, Arkansas. Twin Rivers Foods closed its Neosho,
Missouri plant early in June and moved those broiler operations to its plant in Fort Smith, Arkansas.
In April, Tyson announced plans to build a new broiler processing plant close to its existing facility in Green
Forest, Arkansas. The new plant increases capacity by 200,000 square feet and is expected to be complete
late in 2017.
In May, Mountaire Farms announced plans to acquire a former Townsends broiler processing plant in Siler
City, North Carolina and renovate it to expand capacity. Holly Poultry revealed in August its plans to build a
new 37,500 square foot processing plant in Baltimore, Maryland that it anticipates will be operating early in
2017. Wayne Farms r e-opened a facility in Dothan, Alabama mid-year that had been closed in 2014 with
broiler processing capacity increased to 120,000 square feet and employing over 600. In November, Simply
Essentials began production in a plant in Charles City, Iowa that it had purchased ear lier in the year .
In September, Butterball announced plans to expand its turkey production in the River Valley region of
Arkansas by adding about 30 turkey farms and also increase employment at its processing plant in Ozark,
Arkansas.
2016 P&SP Annual Report
Page 19
CHANGING BUSINESS PRACTICES IN THE LIVESTOCK & POULTRY INDUSTRIES

Industry Conditions and Events
Cattle and Hogs
In December 2015, the mandatory country of origin labeling (COOL) requirements for muscle cuts of beef
and pork, and ground beef and pork were repealed. The law had been in place since 2009. COOL
requirements remained in place for poultry and lamb.
On August 1, 2016, USDA announced that it had reached an agreement with Brazil for the United States to
reopen its market to fresh Brazilian beef, and that United States beef and beef products would have access
to the Brazilian market for the first time since 2003. The United States had remained closed to imports of
fresh Brazilian beef until this announcement due to concerns surrounding foot and mouth disease in
Brazilian cattle herds. The trade had little impact in 2016 as it was not until the end of September that Brazil
shipped its first container of fresh beef to the United States.
With continued large corn and soybean supplies lowering hog production costs, the increasing number of
pigs per litter, solid consumer demand, the absence of significant outbreaks of diseases, and the expectation
of significant additional slaughter capacity in 2017 and 2019, U.S. hog inventories set record highs in
September 2016 at 70.9 million head, two percent above that of 2015.
The number of U.S. hogs slaughtered in 2016 largely followed that of 2015 until July when it began to
significantly exceed the prior year level. In August, weekly slaughter had already hit 2.3 million head,
compared to 2015 when that number was reached in October. In October 2016, slaughter exceeded 2.5
million in several weeks, pushing capacity to its limit. Not surprisingly, 2016 carcass prices began to fall
below 2015 levels beginning in July. While carcass prices had exceeded $80/cwt. in June, they drifted
steadily lower and by late October were in the low $50s compared to carcass prices around $70/cwt. in
October, 2015.
The top 35 hog producers added 122,850 sows in 2016 and now own about two-thirds of all U.S. sows. This
increase in sows was largely driven by the hog producers who will supply the new plants. Seaboard Foods,
a partner with Triumph Foods in the new Sioux City, Iowa plant, acquired an additional 73,000 hogs from
Christensen Farms (a Tr iumph Foods owner) and Texas Farm. Triumph Foods and Seaboard Foods
are now the two largest hog producers after Smithfield Foods. Several top 35 hog producers, located near
the new Hatfield plant have moderately increased their number of sows. These include Sietsema Farms of
Allendale, Michigan; Cooper Farms of Oakwood, Ohio; Fine Swine of Hilliard, Ohio, Hord Livestock Co.
of Bucyrus, Ohio; and Kalmbach Feeds of Upper Sandusky, Ohio.
Hog diseases that can impair production continued to be a source of concern to U.S. producers in 2016. The
Porcine Epidemic Diarrhea or PEDv, which struck in the winter of 2013 and spring of 2014 reminded U.S.
producers of the vulnerability to disease. That episode resulted in a mortality rate of up to 10 percent for
newborn pigs. Prices rose to $115/cwt. as packers competed for dwindling hog supplies. While producers
braced themselves for another outbreak in 2015, only a few producers were affected. A virulent strain of
2016 P&SP Annual Report
Page 20
CHANGING BUSINESS PRACTICES IN THE LIVESTOCK & POULTRY INDUSTRIES

porcine reproductive and respiratory
syndrome (PRRS) had a major adverse
impact on hog production facilities located in
the Southeast. In the upper Midwest there
were outbreaks of Seneca virus A (Seneca
Valley virus or SVV) in breeding herds. The
virus causes snout and hoof lesions on sows
and boars, as well as increased mortality in
piglets less than seven days old. While
producers remained watchful for PEDv,
PRRS and SVV, there were no significant outbreaks nor impacts on slaughter numbers and prices in 2016.
Export sales for pork in 2016 continued the relatively flat trend that began in 2012, running about one percent
above 2015 levels. The major growth markets were China and Hong Kong, with sales increasing 112 percent
and 63 percent respectively. Declines in exports to Taiwan, Japan, Mexico, and South Korea offset this
growth. China surpassed Canada as the third largest market for U.S. pork. Mexico and Japan remain the
largest markets for US pork. Pork imports in 2016 remained unchanged from 2015. Feeder pig imports from
Canada have continued to recover, running about 8 percent above 2015. However, pig imports are still
running 33 percent below the high watermark set in 2008.
Poultry
The U.S. broiler industry is growing more diverse in the type of producers and their products and business
strategies. Earlier this year, Perdue announced an expansion of its antibiotic-free poultry production. More
than two-thirds of its chicken and over half of its turkey are raised with no
antibiotics ever (NAE). According to a company statement its entire line of value-
added frozen, refrigerated and fresh products are free of antibiotics.
Pilgrim’s Pride is also increasing its output of antibiotic-free chicken which it
anticipates will account for about 20 percent of total production by the end of 2018.
This company announced it will convert one of its existing chicken complexes to
USDA-certified organic and expects to capture more than 20 percent of that market
once the change is complete in 2017.
Premium traditional turkey company Kelly Turkeys achieved a breakthrough by
receiving an official go-ahead from USDA to market their dry-processed
KellyBronze turkeys in the United States. Kelly Turkeys has been testing the U.S. Thanksgiving
market in Virginia over the last six years and built a pilot processing plant on a small farm near the Blue
Ridge Mountains. The facility was designed to establish whether United Kingdom-based Kelly Turkeys
could develop a niche market for a top-quality traditional turkey in a market dominated by frozen product.
KellyBronze turkeys are produced like turkeys used to be in America—in the style of “New York
dressed” turkeys. The birds are dry plucked and hung for 10 to 14 days before evisceration as they were in
2016 P&SP Annual Report
Page 21
CHANGING BUSINESS PRACTICES IN THE LIVESTOCK & POULTRY INDUSTRIES

Cattle and Hogs
An issue of concern for cattle and beef markets in 2016 and
for several previous years has been thinning of the cash
markets for fed cattle. Many of the formula price agreements
in the fed cattle market rely upon reported cash prices as a
starting point, and the proportion of the fed cattle purchased
with cash prices has significantly declined in recent years to
a low of just above 21 percent in 2015. While the percentage
of cash transactions increased by a few points in 2016, it
continues to be only about 25 percent. Consequently, a
relatively small proportion of cattle traded on a cash basis
determine the price for millions of head of fed cattle every
year.
Thin markets do not necessarily imply a violation of the Packers and Stockyards Act, but thin markets can
create problems. If the market gets “too thin,” stakeholders can lose confidence that reported cash market
prices are representative of the fed cattle market as a whole. Any time that a reported average is based on a
smaller number of reported prices, the average will be more sensitive to the price of each individual
transaction. The implications are that prices may be more volatile and more susceptible to manipulation.
Fed cattle prices hit record highs at just over $171 per cwt. (live basis) in late November 2014, but declined
toward the end of September 2015, with the national weighted average live weight negotiated price for beef
type steers and heifers at $128.10 per cwt. Fed cattle prices mostly remained in the $130s per cwt. (live
basis) for the rest of 2015 and the first few months of 2016 before declining steeply again during the last
four months of fiscal year 2016 to hit the year’s low of $105.83 per cwt. by the end of September 2016.
Not only did cattle prices in all market segments decrease substantially in 2016, but day-to-day changes in
market prices, particularly in stocker and feeder prices, have been severe. Market volatility is essentially
price risk, and widely fluctuating prices leave producers uncertain of the price they will receive depending
on the day of the week that they bring cattle to the market.
The traditional remedy for price risk has been hedging on futures markets, but prices of live cattle and
feeder cattle futures contracts have been just as volatile. A volatile futures market increases the difficulty of
hedging to reduce risk.
The primary concern in the hog industry for 2016 is slaughter capacity and its subsequent impact on market
prices. Since recovering from the 2014 PEDv outbreak, market hog inventory numbers set an all-time high
in the September 2016 Quarterly Hogs and Pigs Report. Consequently slaughter numbers set all-time highs
as well. Hog prices dropped to the lowest levels since 2002, hovering near $40 per cwt. on a carcass
basis. In spite of relatively inexpensive feed costs, Iowa State University producer profitability estimates
show losses through the last quarter of the year.
2016 P&SP Annual Report
Page 22
CONCERNS IN THE LIVESTOCK AND POULTRY INDUSTRIES
Poultry
In November 2016, the Georgia Department of Agriculture required major poultry companies to submit
documents verifying the accuracy of the price information they submit for the Whole Bird Dock Price
reporting system known as the “Georgia Dock”. Then in December, the Georgia Department of Agriculture
announced that it was suspending indefinitely the “Georgia Dock” weekly chicken price index.
2016 P&SP Annual Report
Page 23
CONCERNS IN THE LIVESTOCK AND POULTRY INDUSTRIES
The Packers and Stockyards Program conducts two
broad types of activities at the regional office level—
investigations and regulatory activities. P&SP
generally categorizes regulatory and investigative
activities as addressing areas of competition, trade
practice, or financial concerns.
Investigations and regulatory activities are conducted
by agents stationed in a regional office or by resident
agents. P&SP resident agents located in the field are
the agency’s frontline staff who work daily with
regulated entities as well as livestock producers and
poultry growers. They are typically the first responders for complaints and, because of their daily contact
with the industry, primary sources of market intelligence. The locations of P&SP offices and resident agents
are shown in Figure 9 in Appendix A.
P&SP initiates an investigation when it has information that a violation of the P&S Act is occurring or has
occurred. For example, P&SP may initiate an investigation in response to:
• a complaint from an industry participant,
• finding of possible violations during a routine regulatory activity,
• self-reported violations on annual and special reports filed with P&SP,
• possible violations found through other monitoring activities, and
• a need for follow-up on previously identified violations of the P&S Act.
Regulatory activities are compliance reviews carried out to determine if a regulated entity is complying
with the P&S Act and regulations. Regional offices initiate regulatory activities based on annual business
volume of the regulated entity, time elapsed since the last review, information obtained from an annual
report submission, or from the P&SP Strategic Business Plan that is used to determine the annual industry
compliance rate. Examples of regulatory activities include:
• Registering market agencies, dealers, and packer buyers who operate subject to the P&S Act,
• Conducting orientations for new dealers, auction markets, and packers,
• Checking the accuracy and repeatability of weighing livestock, carcasses, and live poultry,
• Auditing custodial accounts and payment practices,
• Reviewing marketing practices and determining the adequacy of bond amounts,
• Assisting producers with filing bond and trust claims, and
• Analyzing bond and trust claims.
2016 P&SP Annual Report
Page 24
P&SP REGIONAL OFFICE ACTIVITIES

Regulatory activities also include market-level price monitoring. P&SP employees monitor industry
markets using publicly available data. For example, every week P&SP monitors fed cattle and hog prices
as reported by AMS. P&SP also analyzes structural changes in the livestock, meat, and poultry industries.
These monitoring activities have led to firm-level investigations.
P&SP sees a range of outcomes from its investigative and regulatory activities. P&SP agents frequently
find minor violations or none at all. The regional offices often attempt to achieve informal compliance of
minor violations by asking regulated entities to take immediate corrective action.
When agents uncover violations that are more serious, the regional office typically issues a Notice of
Violation (NOV) as a first step. If the regulated entity fails to correct the identified violations, the
regional office generally refers a formal investigative case file to LEAD with a recommendation for more
formal enforcement. LEAD may stipulate3 the violation(s) with the entity to resolve the violations. It may
pursue administrative enforcement4 through USDA’s OGC before a USDA Administrative Law Judge, or
through DOJ in Federal court.
Administrative enforcements may result in a civil penalty against the regulated entity, suspension of the
entity’s P&S registration, both a fine and suspension, or an order to cease and desist from repeating the
violation(s). In FY 2016, 55 entities stipulated to penalties totaling $155,425. Administrative Law Judges
levied $128,900 in penalties, and Federal courts awarded $74,468 for a total of $203,368 in civil penalties
(Table 8). Total civil penalties in 2016 are lower than in the previous 4 years.
Table 8. Penalties Levied for P&S Act Violations, FY 2012-2016
3 A stipulation is a legal agreement citing violation(s) found, the civil penalty amount P&SP will accept in settlement of the alleged
violation(s) without pursuing a formal action, and a statement for signature by the alleged violator, agreeing to pay the civil penalty and
waive the right to a hearing.
4 Administrative enforcement is legal action taken within USDA. A complaint, alleging specific violations, is filed against a firm or
individual. The accused party has a right to a hearing before an administrative law judge. The judge’s decision may be appealed to the USDA
Judicial Officer. The accused party may appeal the Judicial Officer’s ruling to a U.S. Appeals Court, and further to the Supreme Court of the
United States.
2016 P&SP Annual Report
Page 25
P&SP REGIONAL OFFICE ACTIVITIES
Type Judgment 2012 2013 2014 2015 2016
Stipulations $305,390 $167,387 $118,025 $158,950 $155,425
Administrative Penalties $1,473,093 $2,998,614 $1,230,150 $499,300 $128,900
DOJ Civil Penalties $425,540 $84,900 $12,400 $299,360 $74,468
Total Penalties $2,204,023 $3,250,901 $1,360,575 $957,610 $358,793
Suspensions 24 34 11 6 7

ENFORCING BUSINESS-PRACTICE PROVISIONS
The regional offices are responsible for conducting regulatory reviews and
investigations of competition and trade practice provisions of the P&S Act, collectively
referred to as business practice provisions. The regional offices investigate alleged anti-
competitive practices and unfair and deceptive trade practices by market agencies,
livestock dealers and commission order buyers, slaughtering packers, live poultry
dealers, and meat dealers and brokers. Resident agents and resident auditors conduct
investigations and regulatory activities from field locations throughout the region.
Economists, legal specialists, and investigative attorneys conduct the more complex
competition investigations and regulatory activities. For example, an economist might monitor market and
firm prices for indications of anti-competitive behavior. Marketing specialists conduct trade practice
investigations and regulatory actions related to inaccurate scales or carcass evaluation instruments, improper
weighing practices, and compliance with contracts.
Competition
P&SP investigates complaints alleging anti-competitive behavior such as collusion, price fixing, failure to
compete, buyers acting in concert to purchase livestock, apportionment of territory, price discrimination,
price manipulation, and predatory pricing. P&SP’s economists, legal specialists, and investigative attorneys
collaborate with USDA’s OGC on competition investigations. When the results of an investigation, the
evidence, and circumstances support legal action, P&SP formally refers the case file to OGC for
enforcement. OGC further refers some cases to DOJ.
P&SP monitors changes in industry behavior in order to understand the nature of and reasons for changes,
and to anticipate potential competition issues that may result from those changes. Details of specific,
ongoing individual monitoring efforts are described in the next three sections. P&SP also conducts
economic analysis of significant industry events, including mergers, acquisitions, and plant closings. P&SP
interacts with DOJ and the Commodity Futures Trading Commission (CFTC) on competition investigations
and when analyzing mergers and acquisitions.
Fed Cattle and Hog Market Price Monitoring
P&SP’s fed cattle and hog market price monitoring program includes a weekly internal reporting protocol
based on statistical models, one for the fed cattle markets and the other for hog markets. The statistical
models rely on USDA’s Agricultural Marketing Service (AMS) publicly reported price data to assess
regional price differences.
If a statistically significant regional price difference, referred to as a price outlier, is detected, a LEAD
economist reviews the price anomaly to determine whether the price difference is caused by an undue or
unreasonable preference or disadvantage in violation of section 202(b) of the Act or by uncontrollable
external market factors, such as weather or other external market conditions.
2016 P&SP Annual Report
Page 26
P&SP REGIONAL OFFICE ACTIVITIES

The LEAD economist prepares a recommendation report, which is reviewed by an economist in the WRO
for cattle and the MRO for hogs. Based on the report and reviewer comments, the supervisor in the regional
office either closes the review as being explained by external market factors or opens an investigation and
requests individual firm transactions data from AMS.
Committed Procurement Review and Audit
P&SP monitors the use of “committed procurement” arrangements, which commit cattle and hogs to a
packer more than 14 days prior to delivery. Each year, P&SP economists obtain fed-cattle and hog
procurement data for the previous calendar year from the largest beef packers and largest hog packers. If the
packers change their procurement arrangements with suppliers from previous years, P&SP also collects any
new or modified written marketing agreements or contracts. P&SP reviews the contracts and, if necessary,
discusses them with the packers to determine how the terms of the agreements relate to the committed
procurement categories of interest. Economists then classify, review, and tabulate the individual transactions
data and calculate the reliance of the top packers on committed procurement methods. Finally, P&SP
economists reconcile the calculations based on the detailed transactions data on committed procurement as
reported by the packers in their Packer Annual Reports.
If there are significant differences between the transactions data and the Packer Annual Report submissions
on committed procurement, the economists contact the packers to identify the cause of the discrepancy. If
necessary, P&SP meets with the packers in person to discuss the packers’ procurement methods and explain
how they should be reported on the Packer Annual Report. These meetings foster a mutual understanding of
the reporting requirements for committed procurement and more reliable reporting and calculation of the
packers’ reliance on committed procurement methods.
Relying on written contracts and other information collected
during the committed procurement reviews, P&SP
economists analyze the various procurement and pricing
methods used by hog and fed-cattle packers. Agents obtain
and review contracts and agreements as necessary to
determine if there have been any potential competition
violations of the Act. The contracts are also used in
procurement reviews of the packers to help determine if
proper payment practices are being followed. If potential
violations are identified, P&SP conducts a separate and
thorough investigation into the potential violations.
2016 P&SP Annual Report
Page 27
P&SP REGIONAL OFFICE ACTIVITIES

Poultry Contract Compliance Review Process
Poultry is almost exclusively grown under production contracts. Under a production contract, the live
poultry dealer provides the poultry grower with many inputs including the live chicks, feed, and
medications. The poultry grower will in turn provide the housing, equipment, labor, and fuel to grow the
birds to a target weight established in the production contract. Once the birds meet the target slaughter
weight, the live poultry dealer picks up the birds for slaughter. The payment to the poultry grower for their
growing services is often determined by a poultry grower ranking system (commonly referred to as a
tournament) outlined in the production contract.
P&SP agents follow standard operating procedures when conducting poultry contract reviews. In general,
the agent will collect relevant background information on the live poultry dealer (integrator) that is being
reviewed prior to conducting a site visit. Once on site, the agent will interview managers and employees and
obtain copies of all grower contracts used by
the integrator at the plant location and three
months of weekly ranking sheets for the
plant.
The agent reviews these documents for
consistency and compliance with the P&S
Act and regulations. The agent selects one
week of payment data from the settlement
sheets for a detailed review for accuracy and
completeness. The agent compares the
results to the integrator’s ranking sheets,
settlement sheets, and payments to ensure
adherence to the contract.
If the agent uncovers discrepancies, he or she opens an investigation. If the agent does not find evidence of
violation, he or she advises the integrator’s management of this in an exit interview and the review is closed
with a finding that the entity is in compliance.
Trade Practices
P&SP reviews the activities of regulated entities to ensure that packers, market agencies, dealers, and live
poultry dealers are not engaging in unfair or deceptive practices in the procurement and marketing of
livestock, meat, and live poultry.
March 2016 P&SP Annual Report
Page 28
P&SP REGIONAL OFFICE ACTIVITIES

Regulated entities who own or use a scale
for the purchase, sale, or payment for
livestock or poultry are required to file scale
test reports as evidence of accuracy of
scales, but P&SP agents also examine scales
and weighing practices. P&SP also evaluates
the accuracy and use of electronic carcass
evaluation devices when the equipment is
used to determine payment for livestock.
P&SP investigates complaints against packers, market agencies, and dealers alleging violations of the P&S
Act and, when appropriate refers matters to OGC for formal resolution of the complaints.
Entities that furnish stockyard services in commerce, i.e., services at a stockyard in connection with the
receiving, buying, selling, marketing, feeding, watering, holding, delivery, shipment, weighing, or handling
livestock, are required to post a notice that informs the public that the stockyard meets the definition of a
stockyard under the P&S Act. Once posted, the stockyard remains posted until P&SP de-posts it through
public notice.
Today, most stockyards are associated with brick-and-mortar livestock auction markets. Internet and video
auctions who hold sales of livestock over the internet or through a video platform are still subject to the
P&S Act and regulations, even if they do not operate at a posted stockyard. An amendment to the P&S Act
in 2016 made clear that farmers and ranchers selling through
online and video auctions are offered the same protections as
those selling at traditional markets.
P&SP meets with new auction market owners and managers,
ideally before the market begins operations, to ensure that
market operators understand their responsibilities under the
P&S Act and regulations. Visits in the early stages of a
market’s operation also serve to protect livestock producers
who rely on the market to provide a nondiscriminatory and
competitive marketplace.
P&SP reviews procurement practices of packers to determine if they have engaged in unfair or deceptive
trade activities or have provided undue or unreasonable advantages in procuring livestock or poultry. The
reviews assess procurement and pricing methods, payment practices, weighing of livestock and carcasses,
carcass grades used for payment, and settlement sheets issued to sellers.
2016 P&SP Annual Report
Page 29
P&SP REGIONAL OFFICE ACTIVITIES
A transaction made on false or inaccurate weights, including instances in which a market, dealer, or packer
modifies the actual weight of the livestock or fails to pass on a shrink allowance, is an unfair and deceptive
practice. The P&S Act and regulations require markets, dealers, and packers to test scales used for the
purposes of determining payment two times per year, with one test in the first six months and one test in the
second six months and to file scale-test reports as evidence of scale maintenance and accuracy. State or
local government entities and private companies test scales.
In addition, P&SP conducts several types of regulatory and investigative inspections to ensure scale
operators and entities subject to the P&S Act are properly using their scales and properly recording weights
in the purchase and sale of livestock and for payments to hog and poultry contract growers.
These inspections include check weighing to assure repeatability of weight plus all other activities
conducted by P&SP to ensure accurate weights of livestock, poultry, and feed when feed is a factor in
compensation to contract growers.
P&SP inspects the scales used by auction markets, dealers, and packers for weighing live animals, truck
scales used for weighing poultry, hopper scales for weighing poultry feed, and static and dynamic monorail
scales used to weigh livestock carcasses in slaughter plants. P&SP also conducts feed weighing inspections
on truck scales and scales at feed mills.
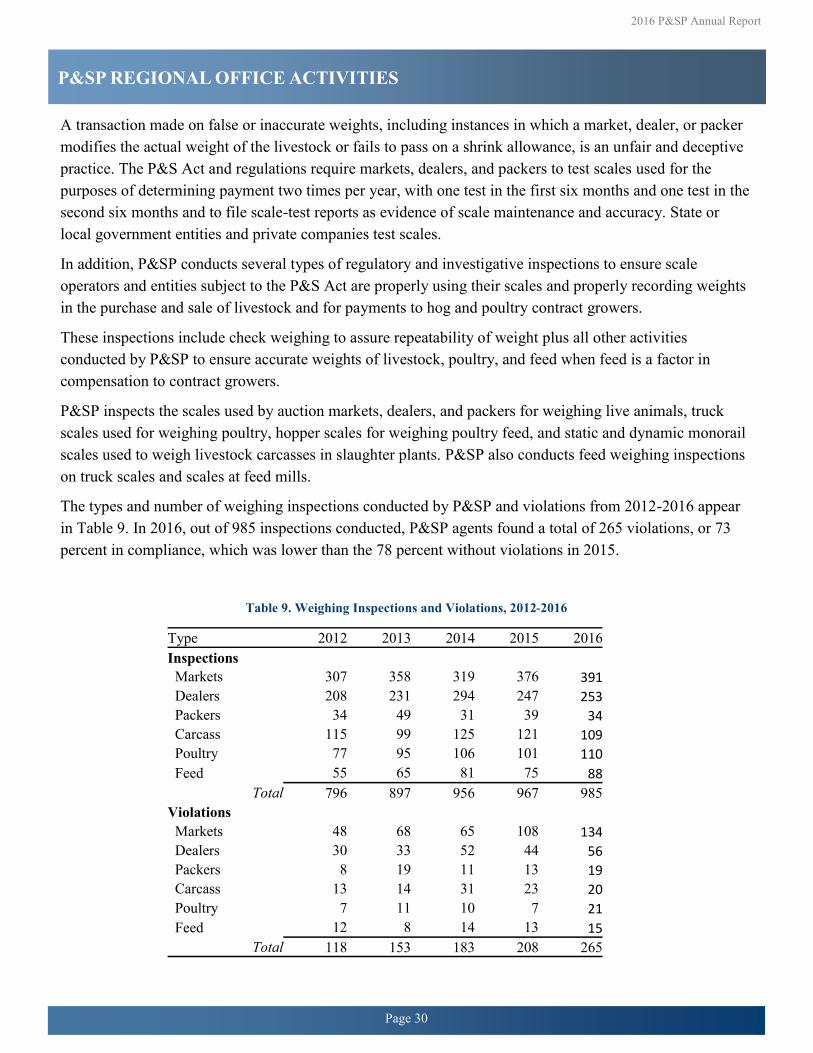
The types and number of weighing inspections conducted by P&SP and violations from 2012-2016 appear
in Table 9. In 2016, out of 985 inspections conducted, P&SP agents found a total of 265 violations, or 73
percent in compliance, which was lower than the 78 percent without violations in 2015.
Table 9. Weighing Inspections and Violations, 2012-2016
2016 P&SP Annual Report
Page 30
P&SP REGIONAL OFFICE ACTIVITIES
Type 2012 2013 2014 2015 2016
Inspections
Markets 307 358 319 376 391
Dealers 208 231 294 247 253
Packers 34 49 31 39 34
Carcass 115 99 125 121 109
Poultry 77 95 106 101 110
Feed 55 65 81 75 88
Total 796 897 956 967 985
Violations
Markets 48 68 65 108 134
Dealers 30 33 52 44 56
Packers 8 19 11 13 19
Carcass 13 14 31 23 20
Poultry 7 11 10 7 21
Feed 12 8 14 13 15
Total 118 153 183 208 265

2016 P&SP Annual Report
Page 31
P&SP REGIONAL OFFICE ACTIVITIES
ENFORCING FINANCIAL PROVISIONS
The financial provisions of the P&S Act and regulations support the financial integrity of regulated entities
and foster liquidity in markets for livestock, meat, and poultry. P&SP enforces these provisions through
several activities that include on-site financial compliance reviews and investigations and reviewing annual
and special reports submitted by regulated entities. Financial compliance reviews and investigations address
five issues. These issues include maintenance of custodial accounts, solvency, payment to livestock sellers
and poultry growers, bond claims, and trust claims.
Under the P&S Act, most regulated entities are required to be solvent, i.e., current assets must exceed current
liabilities. P&SP monitors solvency by conducting on-site financial compliance reviews and investigations.
P&SP also monitors solvency by reviewing financial data in annual and special reports filed by regulated
entities. P&SP requires special reports from entities whose annual reports disclose insolvencies. If P&SP
determines that an entity is insolvent, it notifies the entity that it must correct the insolvency immediately. In
addition, P&SP conducts on-site financial investigations. These investigations confirm whether entities
correct reported insolvencies. The investigations also confirm whether entities resolved other financial
issues. P&SP initiates formal disciplinary action, including NOVs and formal case files when appropriate.
Market agencies selling livestock on commission (brick-and-mortar auction markets, video and internet
auctions, and other commission selling firms) are required by the P&S Act and regulations to establish and
maintain a bank account designated as “custodial account for shippers’ proceeds.”
This trust account holds proceeds from the sale of
consigned livestock for the benefit of livestock sellers.
The market agency selling on commission acts as a
fiduciary depositor to the account. P&SP monitors
custodial accounts in several ways. It reviews annual and
special custodial account reports from market agencies
and conducts on-site custodial account audits. When the
reviews reveal custodial account shortages, P&SP acts to
have the auction market bring the account into balance by
issuing an NOV or preparing a formal case file. The
nearby table shows the annual number of custodial
reviews conducted by P&SP agents, the number of violations found, and the amount of shortages corrected
by market agencies because of the intervention of P&SP.
The data show that P&SP conducted more custodial reviews in 2016 than in 2015 and found more violations.
The total custodial shortages corrected in 2016 was greater than in 2015 and demonstrates the value of P&SP
custodial audits to livestock sellers.
Table 10. Number of Custodial Account Reviews,
Violations Found, and Shortages Corrected
Year Reviews Account
Violations
Shortage
Corrections
($)
2012 331 105 $5,960,677
2013 423 158 $3,364,543
2014 342 98 $3,846,844
2015 400 180 $2,978,657
2016 453 204 $3,317,866

Statutory Trust Protections for Unpaid Cash Sellers of Livestock and Poultry and Poultry Growers
The P&S Act establishes a statutory trust on certain assets of packers and live poultry dealers. In either trust,
valid trust claims take precedence over secured creditor claims in bankruptcy.
Packer trust assets include all livestock purchased in cash
sales, inventories of meat, meat food products, and
livestock products derived from the purchase of livestock
in cash sales, or the receivables or proceeds from the sale
of those items. This livestock trust benefits unpaid cash
sellers of livestock. The packer trust applies to packers
whose annual purchases of livestock exceed $500,000.
Under the P&S Act, the packer serves as the designated
trustee of the trust assets. P&SP does not have authority to
appoint an impartial trustee. P&SP monitors the packer’s
payments from the trust to ensure the trust is properly
preserved and paid out to unpaid cash livestock sellers. If
the packer enters bankruptcy, the bankruptcy trustee
assumes responsibility for the packer trust assets.
Poultry trust assets include all poultry obtained by live
poultry dealers in cash poultry purchases or by poultry
growing arrangements, inventories, receivables, or
proceeds from such poultry or poultry products. This
poultry trust benefits unpaid cash sellers or contract
growers of poultry grown for slaughter.
Unpaid poultry growers and sellers must give written
notice to the live poultry dealer and file the notice with
P&SP within the same time limits as apply to the packer
trust (see box). P&SP analyzes the claims and provides the
analysis to the live poultry dealer and the claimants. The
live poultry dealer serves as the designated trustee of the
trust assets.
2016 P&SP Annual Report
Page 32
P&SP REGIONAL OFFICE ACTIVITIES

Bond Protections for Unpaid Livestock Sellers
All market agencies, all livestock dealers, and packers purchasing over $500,000 of livestock annually must
file and maintain bonds or bond equivalents for the protection of livestock sellers. The bonds are for the
benefit of unpaid livestock sellers should a regulated entity fail to pay for livestock. Those required to meet
the bonding requirement may choose from three options to comply.
They may obtain a surety bond or in lieu of a surety bond, they may pledge one or more savings accounts or
certificates of deposit under a Trust Fund Agreement. Alternatively, they may obtain one or more
irrevocable, transferable, standby letter(s) of credit, issued by a federally insured bank or institution, and
pledge the letter(s) of credit to a Trust Agreement. They may use a combination of these options to meet the
total bond requirement.
To be eligible to receive payment under the bond, a
livestock seller (cash or credit) who does not receive
payment for a transaction must file a bond claim within 60
days of the transaction. The seller may obtain claim forms
from P&SP regional offices or at www.gipsa.usda.gov.
The seller must file a completed claim form, accompanied
by supporting documents, with P&SP, or the surety
company.
P&SP analyzes each claim to determine whether the
claimant filed it timely and whether the claimant provided
adequate documentation to support the claim. P&SP
provides its analysis to the principal and to the bond surety or trustee on a bond equivalent. The surety or
the trustee decides whether claims are valid and timely filed and how much will be paid.
Bonding amounts often do not cover the entire loss sustained when a firm fails to make full payment5. In
that case, the claimant(s) receives a pro-rata share of the bond based on the value of the bond and the total
amount of valid, timely claims.
The dollar amount of total claims against dealer bonds often varies significantly from the dollar amount of
valid claims. This is because sellers frequently file claims beyond the 60 days after the transaction took
place and in this circumstance the surety may deny the claim. Over the past 8 years, the share of valid
claims recovered has varied from 11 percent to 100 percent. The lowest rate of recovery was in 2016, but
some dealer bond claims were still open at the end of the fiscal year so this is not final and will improve as
more claims are closed (Table 11).
5In many cases, claimants withdraw claims if the purchasers voluntarily pay sellers before the claims are processed. Such instances are not
included in the tables in this section.
2016 P&SP Annual Report
Page 33
P&SP REGIONAL OFFICE ACTIVITIES

Table 11. Dealer Bond Claims and Recoveries, 2009-2016
Claims against auction markets also vary widely each year but the recovery rate for claims that have been
filed in a timely manner has been quite robust in recent years, except for 2016 when the dollar value of
valid claims was not nearly as high as other years (Table 12). The financial strength of auction markets is
also enhanced by the regulatory and investigative activities of P&SP that monitor compliance and attempt
to correct violations when discovered.
Table 12. Market Bond Claims and Recoveries, 2009-2016
2016 P&SP Annual Report
Page 34
P&SP REGIONAL OFFICE ACTIVITIES
Recovery as of 9/30/2016 Year Total
Claims Valid
Claims Bond Other Total
Recovered % Valid
Claims
Recovered
2009 $3,134,145 $3,134,145 $348,018 $411,133 $759,151 24
2010 $213,332 $101,512 $51,781 $4,479 $56,260 55
2011 $20,337,231 $20,337,231 $437,105 $1,556,807 $1,993,912 10
2012 $993,855 $993,855 $95,000 $612,544 $707,544 71
2013 $2,999,521 $2,949,508 $248,810 $1,645,071 $1,893,881 64
2014 $243,307 $241,307 $90,315 $118,250 $208,565 86
2015 $838,700 $20,926 $4,510 $16,416 $20,926 100
2016 $11,466,498 $11,331,648 $1,258,569 $26,328 $1,284,897 11
Recovery as of 9/30/2016 Year Total Claims Valid Claims Bond Other Total
Recovered % Valid
Claims
Recovered
2009 $981,189 $981,189 $261,498 $1,365 $262,863 27
2010 $20,901 $4,547 $4,547 $0 $4,547 100
2011 $75,119 $23,518 $22,162 $1,357 $23,519 100
2012 $877,861 $201,657 $82,953 $0 $82,953 41
2013 $763,422 $0 $0 $0 $0 NA
2014 $12,181 $706 $706 $0 $706 100
2015 $69,307 $66,307 $60,000 $0 $60,000 90
2016 $397,946 $11,162 $0 $0 $0 0
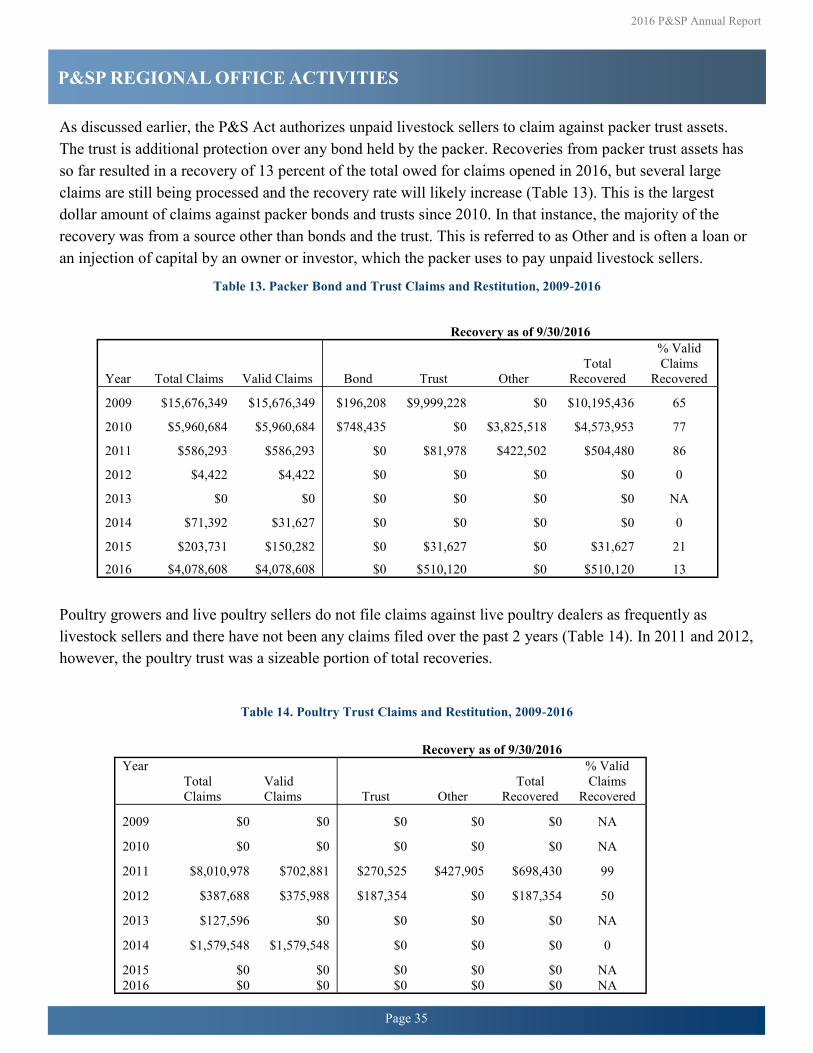
As discussed earlier, the P&S Act authorizes unpaid livestock sellers to claim against packer trust assets.
The trust is additional protection over any bond held by the packer. Recoveries from packer trust assets has
so far resulted in a recovery of 13 percent of the total owed for claims opened in 2016, but several large
claims are still being processed and the recovery rate will likely increase (Table 13). This is the largest
dollar amount of claims against packer bonds and trusts since 2010. In that instance, the majority of the
recovery was from a source other than bonds and the trust. This is referred to as Other and is often a loan or
an injection of capital by an owner or investor, which the packer uses to pay unpaid livestock sellers.
Table 13. Packer Bond and Trust Claims and Restitution, 2009-2016
Poultry growers and live poultry sellers do not file claims against live poultry dealers as frequently as
livestock sellers and there have not been any claims filed over the past 2 years (Table 14). In 2011 and 2012,
however, the poultry trust was a sizeable portion of total recoveries.
Table 14. Poultry Trust Claims and Restitution, 2009-2016
2016 P&SP Annual Report
Page 35
P&SP REGIONAL OFFICE ACTIVITIES
Recovery as of 9/30/2016
Year Total Claims Valid Claims Bond Trust Other Total
Recovered
% Valid
Claims
Recovered
2009 $15,676,349 $15,676,349 $196,208 $9,999,228 $0 $10,195,436 65
2010 $5,960,684 $5,960,684 $748,435 $0 $3,825,518 $4,573,953 77
2011 $586,293 $586,293 $0 $81,978 $422,502 $504,480 86
2012 $4,422 $4,422 $0 $0 $0 $0 0
2013 $0 $0 $0 $0 $0 $0 NA
2014 $71,392 $31,627 $0 $0 $0 $0 0
2015 $203,731 $150,282 $0 $31,627 $0 $31,627 21
2016 $4,078,608 $4,078,608 $0 $510,120 $0 $510,120 13
Recovery as of 9/30/2016 Year
Total
Claims Valid
Claims Trust Other Total
Recovered
% Valid
Claims
Recovered
2009 $0 $0 $0 $0 $0 NA
2010 $0 $0 $0 $0 $0 NA
2011 $8,010,978 $702,881 $270,525 $427,905 $698,430 99
2012 $387,688 $375,988 $187,354 $0 $187,354 50
2013 $127,596 $0 $0 $0 $0 NA
2014 $1,579,548 $1,579,548 $0 $0 $0 0
2015 $0 $0 $0 $0 $0 NA 2016 $0 $0 $0 $0 $0 NA

P&SP delivers its mission by identifying broad, strategic, multi-year goals. It also sets shorter-term tactical
annual objectives and activities as set forth in its annual Strategic Business Plan. The next section addresses
how P&SP strives to improve its performance and efficiency, and the demonstrated results.
PERFORMANCE MEASUREMENT
P&SP assesses its overall performance annually by measuring industry compliance with the P&S Act and
regulations. P&SP begins by scientifically selecting random samples from the population of subject entities.
P&SP designs the samples to estimate compliance for the whole population of regulated entities with a 90
percent confidence level. This approach estimates compliance among all subject entities industry-wide.
P&SP agents inspect and audit the selected entities for compliance in the following five areas:
1) Prompt payment of auction markets, dealers, and packers,
2) Financial reviews of auction market custodial accounts,
3) Scales and weighing practices at auction markets, dealers, and live poultry dealers,
4) Static and dynamic monorail scales, carcass evaluation devices, and related practices at livestock packing
plants purchasing more than 1,000 head per year, and
5) Contract compliance of live poultry dealers with contract poultry growers.
P&SP analyzes compliance data and general economic conditions. It uses this information to deploy its
resources effectively to meet changing industry conditions. Compared to FY 2015, the FY 2016 results of
most of the individual component inspections and audits that comprise the aggregate index did not change
significantly. Poultry contract compliance was the only component that changed substantially, increasing
from 59 percent in 2015 to 68 percent in 2016. (Figure 5).
2016 P&SP Annual Report
Page 36
P&SP PROGRAM PERFORMANCE AND EFFICIENCY
Figure 5. Industry Compliance by Component and Average Industry Compliance, 2012-2016

P&SP puts emphasis on educational and outreach activities that improve industry compliance. During each
regulatory review or investigation, P&SP agents discuss how to achieve compliance with regulated entities.
However, economic conditions within the industry affect compliance rates. Weak economic conditions or
highly volatile livestock prices may contribute to lower rates of compliance. These are examples of factors
beyond P&SP’s control. P&SP routinely analyzes compliance data and general economic conditions. It uses
this information to deploy its resources effectively to meet changing industry conditions.
EFFICIENCY MEASUREMENT
P&SP measures its efficiency at conducting regulatory reviews and investigations by comparing the total
days between when it opens and closes each type of activity. The following figure shows the total number
of regulatory reviews conducted by P&SP and the average number of days to complete a regulatory review
(Figure 6).
.
The average number of days to complete a regulatory activity increased from 15 days in 2013 to 21 days in
2015, but declined to 19 days in 2016. The number of regulatory reviews has also increased however, from
2,161 in 2013 to 2,192 in 2016.
2016 P&SP Annual Report
Page 37
P&SP PROGRAM PERFORMANCE AND EFFICIENCY
Figure 6. Number of Regulatory Reviews and Average Days to Complete a Review,

The total number of investigations completed by P&SP and the average number of days to complete an
investigation appear in Figure 7. P&SP considers an investigation complete when it is closed by P&SP at
the regional office level, closed by LEAD, or when the formal enforcement action related to the
investigation has been completed for cases referred to OGC or DOJ.
For investigations closed in FY
2016, the average number of days
to complete and close an
investigation increased slightly to
106, from 105 days in 2015.
However, the number of
investigations completed also
increased from 2,031 to 2,295.
P&SP completed these
investigations in several ways. For
some, P&SP found no violations
or reached an informal agreement
to correct minor violations. P&SP
resolved and closed other investigations
by issuing formal NOVs.
In the remainder of the investigations, the Regional Offices submit formal case files to LEAD with a
recommendation for stipulation or enforcement by OGC or DOJ. Under stipulation agreements, the
regulated entity waives the right to a hearing, admits the violation (s), and voluntarily agrees to pay a
penalty. P&SP then closes the investigation. Cases referred to OGC or DOJ remain open until OGC or DOJ
completes the enforcement action. It takes much longer to resolve and close investigations referred to OGC
or DOJ for prosecution through a hearing before an Administrative Law Judge or a Federal Court.
Additional details on the number of investigations completed in 2016, types of investigations completed,
and the number of cases closed by OGC and DOJ appear in Table 15 in Appendix B.
2016 P&SP Annual Report
Page 38
P&SP PROGRAM PERFORMANCE AND EFFICIENCY
Figure 7. Number of Investigations and Average Days to
Complete an Investigation, 2012 – 2016

To file a complaint, e-mail [email protected], call GIPSA’s hotline at (800) 998-3447, or contact
the relevant regional office location:
Eastern Regional Office
75 Ted Turner Drive SW, Suite 230
Atlanta, GA 30303
Telephone 404-562-5840
FAX 404-562-5848
E-mail: [email protected]
States Covered:
AL, AR, CT, DC, DE, FL, GA, LA, ME, MA, MD, MS, NH, NJ, NY, NC, PA, RI, SC, TN, VT, VA, WV,
and the Territories of the U.S., including Puerto Rico
Midwestern Regional Office
Room 317
Federal Building
210 Walnut Street
Des Moines, IA 50309
Telephone 515-323-2579
FAX 515-323-2590
E-mail: [email protected]
States Covered:
IA, IL, IN, KY, MI, MN, MO, ND, NE, SD, OH, WI
Western Regional Office
One Gateway Centre
3950 North Lewiston, Suite 200
Aurora, CO 80011
Telephone 303-375-4240
FAX 303-371-4609
E-mail: [email protected]
States Covered:
AK, AZ, CA, CO, HI, ID, KS, MT, NV, NM, OK, OR, TX, UT, WA, WY
Headquarters Office
Stop 3601
1400 Independence Ave., SW
Washington, D.C. 20250-3601
Telephone: (202) 720-0219
FAX: (202) 205-9237
2016 P&SP Annual Report
Page 39
CONTACTING P&SP

Please direct comments or questions about this publication to:
United States Department of Agriculture
Grain Inspection, Packers and Stockyards Administration
Packers and Stockyards Program
1400 Independence Avenue, S.W.
Washington DC 20250-3601
www.gipsa.usda.gov
GIPSA Toll-Free HOTLINE 1-800-998-3447
2016 P&SP Annual Report
Page 40
CONTACTING P&SP

2016 P&SP Annual Report
Page 41
APPENDIX A
Figure 9. P&SP Regional Offices and Resident Agent, Resident Auditor and Market Inspector Locations.
Figure 8. GIPSA—P&SP Organizational Structure
APPENDIX B