2016 Near East and North Africa Regional Overview of...
40
2016
Transcript of 2016 Near East and North Africa Regional Overview of...

2016


2016
Near East and North AfricaRegional Overview of Food Insecurity
Sustainable Agriculture Water Management is Key to Ending
Hunger and to Climate Change Adaptation
FOOD AND AGRICULTURE ORGANIZATION OF THE UNITED NATIONS
CAIRO, 2017

Required citation:
FAO. 2017. Near East and North Africa Regional Overview of Food Insecurity 2016. Cairo, pp. 35.
The designations employed and the presentation of material in this informationproduct do not imply the expression of any opinion whatsoever on the part of theFood and Agriculture Organization of the United Nations (FAO) concerning the legalor development status of any country, territory, city or area or of its authorities, orconcerning the delimitation of its frontiers or boundaries. The mention of specificcompanies or products of manufacturers, whether or not these have been patented,does not imply that these have been endorsed or recommended by FAO in preferenceto others of a similar nature that are not mentioned.
ISBN 978-92-5-109648-2
FAO encourages the use, reproduction and dissemination of material in this informationproduct. Except where otherwise indicated, material may be copied, downloaded andprinted for private study, research and teaching purposes, or for use in non-commercialproducts or services, provided that appropriate acknowledgement of FAO as the sourceand copyright holder is given and that FAO’s endorsement of users’ views, products orservices is not implied in any way.
All requests for translation and adaptation rights, and for resale and other commercialuse rights should be made via www.fao.org/contact-us/licence-request or addressed [email protected].
FAO information products are available on the FAO website (www.fao.org/publications)and can be purchased through [email protected].
© FAO, 2017

iv Foreword v Acknowledgements vi Abbreviations and Acronyms vii List of Figures, Tables and Boxesviii Country and Territory Abbreviations
1 Part I Food Insecurity: Prevalence and Trends
4 Part II The Four Pillars of Food Security and Nutrition
14 Part III Policy Commitments and Experiences to End Hunger, Achieve Food Security and Improved Nutrition and Promote Sustainable Agriculture (SDG 2): A Focus on Water and Climate Change
26 Bibliography
C O N T E N T S

iv
The first edition of the Regional Overview of Food Insecurity, Near East and North Africa, launched in 2015, took stock of the progress made in the region towards the achievement of the Millennium Development Goals (MDGs). This second edition of the Regional Overview coincides with the adoption of the sustainable development agenda and the 17 Sustainable
Development Goals (SDGs) and the agreement on climate change reached at the 21st Session of the Conference of the Parties (COP21) in Paris.
The report therefore takes into account this context and gives particular attention to the situation of food insecurity from the sustainability perspective, in particular SDG 2, which aims to end hunger, achieve food security and improved nutrition and promote sustainable agriculture. In analysing the food insecurity situation in the Near East and North Africa (NENA) region, the report uses both the prevalence of undernourishment and Food Insecurity Experience Scale (FIES) which are agreed upon indicators for the tracking of Target 2.1 of SDG 2.
Most countries in the NENA region enjoyed a steady improvement in their food security and nutrition situation up to the beginning of the decade. Food production was rising and the prevalence of undernourishment and poverty was receding as well as the prevalence of stunting and anaemia. The food security and nutrition situation has, however, sharply deteriorated since 2012. Not only the prevalence of undernourishment, but even the numbers of undernourished have increased. The first assessment made by the Food and Agriculture Organization of the United Nations (FAO) using FIES data reveals that the region has a very high proportion of people experiencing problems of access to food at moderate or severe levels, second only to sub-Saharan Africa.
The deterioration of the food security situation is largely driven by the spreading and intensity of conflicts and protracted crises. The Syria crisis in particular has deepened during the period 2015-2016, leaving more than half of the population in need of food assistance and 4.8 million refugees, mostly in neighbouring countries. The numbers of food insecure and the internally displaced are also rising in Iraq and Yemen.
Beyond conflicts and crises, the report argues that water scarcity and climate change are the most fundamental challenges to the achievement of SDG 2. Water scarcity is the binding factor to agricultural production in the NENA region and the driver of the region’s dependency on food imports. Building on the evidence accumulated in the framework of FAO’s Water Scarcity Regional Initiative for NENA, the report shows that climate change is expected to affect the four dimensions of food security: availability, access, stability and utilization. Most of the impacts of climate change will be channelled through the water sector.
The Regional Overview underlines the urgency to develop and implement strategies for sustainable management of water resources and to adapt to the climate change impact on water and agriculture. The report documents several positive experiences in sustainable management of water resources and climate change adaptation in the region. It highlights the importance of accelerating investments aimed at improving water efficiency and water productivity as well as the need for a shift in cropping patterns towards less water-consuming crops.
The report explores other major options for the adaptation to climate change impacts on water and agriculture, including the need for designing and implementing social protection measures for building resilience of farmers to extreme events, cutting food losses and improving trade policies. The report stresses on the importance of building a strong evidence base for assessing the impact of climate change on food security and for the formulation of sound and flexible water adaptation measures and agricultural policies. It calls for strengthened regional collaboration to face the massive challenge of water scarcity and climate change, building on the strong political will expressed by the leaders of the region and building on the positive experiences in many countries.
FAO is already supporting countries in the region to improve the management of their water resources in the context of the Water Scarcity Regional Initiative, adopted by the League of Arab States. Now is the time to promote and implement an integrated policy framework to achieve SDG 2 and adapt to climate change.
Abdessalam Ould AhmedAssistant Director-General/Regional Representative Regional Office for the Near East and North Africa
F o r e w o r d

v
The Near East and North Africa Regional Overview of Food Insecurity is a publication prepared by the Regional Office for Near East and North Africa (RNE) of the Food and Agriculture Organization of the United Nations (FAO), led by its Regional Representative Abdessalam Ould Ahmed. This edition benefitted from substantial advice and inputs
from Mohamed Aw-Dahir, Food Systems Economist, and Pirro-Tomaso Perri, Programme and Planning Officer. Quality assurance was provided by Mohamed Barre, Statistician. The research, analysis and writing were a team effort led by Sherry Ajemian, FAO consultant, with key technical content contributions from Isin Tellioglu, Economist, and Fatima Hachem, Nutrition Officer, along with support from Dalia Abulfotuh, JPO-Rural Development, and Jennifer Smolak, Agro-industries and Infrastructure Officer. Mr Aziz Elbehri, Senior Trade and Food Security Officer, provided substantial inputs to Part III of the report.
Various staff members from FAO RNE in Cairo and FAO headquarters in Rome provided technical inputs, comments and advice. They are from the Economic and Social Development Department (ES) at headquarters, led by Assistant Director-General Kostas Stamoulis, with special support from Carlo Cafiero and Piero Conforti from the Statistics Division (ESS), Mulat Demeke and Areej Jafari from the Food and Agriculture Policy Decision Analysis (FAPDA) team, and Rob Vos, Director, Agricultural Economics Division (ESA), in addition to the valuable review and support from Raschad Al-Khafaji from the Office of the Director-General, and Mario Lubetkin, Directeur-de-Cabinet. RNE technical officers include Paula Anton, Daniel Dale, Dost Muhammad, Fawzi Karajeh, Flavia Lorenzon, Alfredo Impiglia, Malika Martini, Ana Pizarro, Biljana Radojevic, Markos Tibbo and Chakib Zouaghi.
Magdi Latif, Knowledge Management Officer, RNE, assisted by Issam Azouri, Mariam Hassanien and Ashraf Said, coordinated the publishing of the document, with valuable support from Patricia Pascau from the Office for Corporate Communication. Editing and proofreading of the report were provided by Tom Hunt and Hala Hafez.
A c k n o w l e d g e m e n t s

vi
Abbreviations and Acronyms
ACSAD Arab Center for the Study of Arid Zones and Dry LandsAfDB African Development BankCIS Commonwealth of Independent StatesCOP21 21st Session of the Conference of the Parties (UN Climate Change Conference)DALY Disability-Adjusted Life YearsDER Dietary Energy RequirementDES Dietary Energy SupplyDESA Dietary Energy Supply AdequacyEWP Economic Water ProductivityFAO Food and Agriculture Organization of the United NationsFAO RNE FAO Regional Office for the Near East and North AfricaFIES Food Insecurity Experience ScaleFLW Food Losses and WasteFUR Follow up and Review MechanismGAFTA Greater Arab Free Trade AreaGCC Gulf Cooperation CouncilGDP Gross Domestic ProductGNI Gross National IncomeGWP Gallup World PollIBRD International Bank for Reconstruction and DevelopmentICCAT International Commission for the Conservation of Atlantic TunasINDC Intended Nationally Determined ContributionIOTC Indian Ocean Tuna CommissionLAC Latin America and the CaribbeanLDC Least Developed CountryMDG Millennium Development GoalMercosur Southern Common Market MoE Margin of ErrorNCD Non Communicable DiseaseNENA Near East and North AfricaNERC Regional Conference for the Near EastR&D Research and DevelopmentRECOFI Regional Commission on FisheriesRFMO Regional Fisheries Management OrganizationSADC Southern African Development Community organizationSDG Sustainable Development GoalSSA Sub-Saharan AfricaSUDNAIP Sudan’s National Agricultural Investment PlanUNEP United Nations Environment ProgrammeUNESCWA United Nations Economic and Social Commission for Western AsiaUNFCC United Nations Framework for Climate ChangeUNICEF United Nations Children’s FundVoH Voices of the Hungry ProjectWASH Water, Sanitation and HygieneWDI World Development IndicatorsWFS World Food SummitWHO World Health Organization
A b b r e v i a t i o n s a n d A c r o n y m s

vii
List of Figures
Figure 1: Prevalence of undernourishment, 1990-2016 1Figure 2: Number of undernourished people, 1990-2016 1Figure 3: FIES severe prevalence, selected regions and NENA, 2014-2015 2Figure 4: Average Dietary Energy Supply Adequacy in NENA and its subregions and the world, 2008-2010 to 2014-2016 4Figure 5: Average value of food production in subregions of NENA, and world, 2006-2008 to 2011-2013 4Figure 6: Cereal production and apparent consumption trends in NENA region, 1996-2014 5Figure 7: Average protein supply in the NENA region, 1989-1991 and 2009-2011 5Figure 8: Average protein supply, 1990-1992 to 2009-2011 6Figure 9: Share of dietary energy supply derived from cereals, roots and tubers, 1990-1992 to 2009-2011 6Figure 10: Average supply of protein of animal origin, 1990-1992 to 2009-2011 6Figure 11: Depth of food deficit in selected NENA countries, 2004-2006 to 2014- 2016 6Figure 12: Stunting rates among children aged less than five years, 1990-1999 and 2005-2015 9Figure 13: Wasting among children aged less than five, 1990-1999 and 2005-2015 9Figure 14: Prevalence of overweight children aged less than five in the NENA region 10Figure 15: Share of agricultural import bills in total export earnings, 2014 12Figure 16: Domestic food price volatility, 2000-2014 12Figure 17: NENA agricultural exports by destination, 2015 13Figure 18: NENA agricultural imports by origin, 2015 13Figure 19: Intraregional agricultural trade as a share of total merchandise trade, NENA and selected trade blocks, 2015 13Figure 20: Current account balance (as percent of GDP) in selected NENA countries, 2008-2021 14Figure 21: Economic water productivity (USD/cm3) and green and blue crop water consumption (million cm3/year) of main crops in Egypt, 2007-2011 18
List of Tables
Table 1: Prevalence of moderate and severe food insecurity (FI) in selected regions and NENA, 2014-2015 3Table 2: Progress towards poverty eradication has been diverse in NENA countries 7Table 3: Climate change impacts on farming systems of the NENA region 15
List of Boxes
Box 1: Conclusions of the MDGs/World Food Summit (WFS) observation period at subregional level 1Box 2: A strong political will to address food security expressed through several initiatives at national and regional levels 14Box 3: Has the drought in Syria contributed to triggering the conflict? 16Box 4: Agricultural water and climate change adaptation: A perspective from the Intended Nationally Determined Contributions (INDCs) 16Box 5: Morocco experience with groundwater resources 17Box 6: Egypt Public-Private Partnership initiative 24
L i s t o f F i g u r e s , T a b l e s a n d B o x e s

viii
C o u n t r y A b b r e v i a t i o n s
Country and Territory Abbreviations
Following is a list of countries and Territory with names that are abbreviated in the text
Algeria People’s Democratic Republic of AlgeriaBahrain Kingdom of BahrainEgypt Arab Republic of EgyptIran (Islamic Republic of) Islamic Republic of IranIraq Republic of IraqJordan Hashemite Kingdom of JordanKuwait State of KuwaitLebanon Lebanese RepublicLibya State of LibyaMauritania Islamic Republic of Mauritania Morocco Kingdom of MoroccoOman Sultanate of OmanQatar State of QatarSaudi Arabia Kingdom of Saudi ArabiaSudan Republic of SudanSyria Syrian Arab RepublicTunisia Republic of TunisiaUAE United Arab EmiratesYemen Republic of YemenPalestine Palestine
The Mashreq subregion includes Egypt, Iran (Islamic Republic of), Iraq, Jordan, Lebanon, Sudan, Syria as well as Palestine.
The Maghreb subregion includes Algeria, Libya, Mauritania, Morocco and Tunisia.
The third subregion is the Gulf Cooperation Council (GCC) countries (which include Bahrain, Kuwait, Oman, Qatar, Saudi Arabia, and UAE) and Yemen.

1
Progress and Setbacks in The Fight Against Hunger in NENA: The MDG Experience
The Near East and North Africa (NENA) region has traditionally given high priority to food security. This is because it has always been aware of the fragility of its natural resources and the possible destabilizing effect of an excessive dependency on food imports. Countries in the region have invested in developing their water resources and food production, and have heavily subsidized basic foodstuffs to ensure that food is both available and accessible.
As a result, until recently, the NENA region had managed to maintain the prevalence of undernourishment at levels comparable to those observed in developed countries (except for Sudan and Yemen as the Least Developed Countries [LDCs] in the region). Overall, 12 countries1 (out of 19 in total); namely, Algeria, Egypt, Iran (Islamic Republic of), Jordan, Kuwait, Lebanon, Mauritania, Morocco, Oman, Saudi Arabia, Tunisia and the United Arab Emirates (UAE) met the Millennium Development Goal (MDG) hunger target in 2015. Kuwait and Oman met the more stringent World Food Summit (WFS) target of halving the number of food insecure people (Box 1).
While the overall prevalence of undernourishment in the region remains well below the world average, there are sharp differences between subregions and between individual countries, i.e. between oil-rich countries – in particular the Gulf Cooperation Council (GCC) countries – and countries without oil reserves. These vast differences also reflect the impacts of the conflicts and crises on specific countries. The food security situation in Syria remains of particular concern, as does that of its neighbours that have had to absorb more than 2 million refugees. Iraq, Libya, and Yemen are at risk in terms of food security, including Palestine.
The region as a whole did not achieve the international goals for hunger reduction, as a result of conflicts and crises. In fact, NENA was the only Food and Agriculture Organization of the United Nations (FAO) region to witness an increase in the prevalence of undernourishment from 1990 to 2015 2016 (Figure 1). The indicator is calculated in three-year averages to reduce the impact of possible errors in estimated Dietary Energy Supply due to difficulties in properly accounting for stock variations in major food.
Figure 1: Prevalence of undernourishment, 1990-2016
Source: FAOSTAT, 2016
1 Bahrain and Qatar have not been monitoring although the indications from indirect assessment are that they have met the MDG Target 1.c; Libya data has not been reported
Apart from Africa, NENA was the only other FAO region to witness an increase in the number of undernourished people, which doubled between 1990 to 2015, from 16.5 million in 1990 to 33 million in 2015 (Figure 2).
Figure 2: Number of undernourished people, 1990-2016
Source: FAOSTAT, 2016
Box 1: Conclusions of the MDGs/World Food Summit (WFS) observation period at the Mashreq subregional level2
Within the NENA region, levels and trends of undernourishment differ widely from one country to another. There are also considerable differences across its subregions. The subregion of the GCC countries and Yemen shows a mild decrease in the prevalence of undernourishment, although the number of hungry people has increased, mainly due to the precarious food security situation in Yemen.
The Mashreq, the most populous subregion in NENA, has witnessed a dramatic increase in the prevalence of undernourishment, from a level of 5 percent in 1990-1992 to more than 8 percent today. It also has the highest number of undernourished people – about 23 million – accounting for 70 percent of undernourished people in the region.
Both the prevalence of undernourishment and the number of undernourished people have significantly declined in the Maghreb subregion. The Maghreb is also the only subregion that has met the MDG hunger target.
From MDG1 to SDG 2: The Food Insecurity Experience Scale (FIES)
Definition
The sustainable development agenda is a universal, comprehensive and integrated agenda that vows to leave no one behind. The Sustainable Development Goal 2 (SDG 2): “End hunger, achieve food security and improved nutrition and promote sustainable agriculture”, adopts a comprehensive approach to food security and to the fight against hunger, which takes into account all the four dimensions of food security: availability, access, stability and utilization.
For two decades, FAO has been using the prevalence of undernourishment to track the MDG and WFS targets related
2 FAO, 2015. Regional Overview of Food Insecurity, Near East and North Africa. Available at: http://www.fao.org/3/a-i4644e.pdf.
Part I: Food Insecurity: Prevalence and Trends

2
to hunger. The prevalence of undernourishment is a measure of the proportion of a population with likely inadequate dietary energy, derived from national-level information on food availability, food consumption and demographic structure. It is an estimate of the proportion of the population facing serious food deprivation. However, people could find themselves in a situation of food insecurity, yet still be able to meet their dietary energy needs, for example by consuming less expensive, low quality, energy-dense foods, or by cutting back on other basic needs, with potentially negative consequences on their health and general well-being.
Hence, there is a need to broaden the set of indicators that track SDG 2, to capture the different facets of the food security situation. The prevalence of moderate and severe food insecurity based on FIES has been introduced for this purpose. It is an internationally agreed upon indicator for the tracking of the SDG. FIES is an eight-question based scale intended to measure the individual or household ability to access food. The food insecurity prevalence rate is the proportion of individuals or households experiencing difficulties to access food. Data are collected through direct interviews conducted in the context of FAO Voices of the Hungry project. FIES is particularly relevant for the tracking of Target 2.1 of SDG 2: by 2030 end hunger and ensure access by all people, in particular the poor and people in vulnerable situations, including infants, to safe, nutritious and sufficient food all year round.
Prevalence rates of food insecurity based on FIES can be computed for different levels of food insecurity, moderate and severe or severe only, implying distinctively different consequences in terms of welfare of the affected population. The prevalence rates can be compared across countries and cultures. The full potential of FIES is realized when the tool is applied in large national population surveys that enable detailed analyses according to income, gender, age, race, ethnicity, migratory status, disability and geographic location, thus providing hard evidence to facilitate identification of vulnerable groups of the population and to guide policy decisions and interventions3.
FIES complements the information provided by the prevalence of undernourishment. While the prevalence of undernourishment and the estimated prevalence of food insecurity based on FIES (particularly at severe levels) would be expected to show similar trends, the number of people having experienced any form of food insecurity is expected to be greater, and possibly much greater, than the number of undernourished.
FIES provides a proper universal reference standard for the measurement of food insecurity. Two different thresholds are used for classification: one that identifies levels described as “moderate or more” food insecurity, and one that identifies levels of “severe” food insecurity4.
3 FAO, 2016. FAOSTAT data. Available at: http://www.fao.org/fostat/. Note: FAO collects data annually for nearly 150 countries and is actively promoting the adoption of the FIES by national governmental institutions.
4 FAO. 2013. Technical paper for reference on the Food Insecurity Experience Scale (FIES) survey, development of a global standard for monitoring hunger worldwide. 2013. Available at http://www.fao.org/fileadmin/templates/ess/voh/FIES_Technical_ Paper_ v1.1.pdf.
The food insecurity experience in the NENA region
According to the FIES indicator, the prevalence of severe food insecurity in the NENA adult population was close to 9.5 percent in 2014-2015, representing approximately 30.1 million people (Figure 3).
Figure 3: FIES severe prevalence in adults (15 years and older), selected regions and NENA, 2014-2015
Source: FAO, Voices of the Hungry project, 2016.
The lowest prevalence of severe food insecurity in NENA was estimated for the Maghreb at 4.6 percent, while the Mashreq reported a prevalence of 11.7 percent, accounting for 22.3 million individuals in the reference age group (adults, 15 years and over). The severely food insecure adult population of the Mashreq accounts for 74 percent of the total severely food insecure adult population of the region. This suggests that pervasive protracted conflicts have had a significant impact on the food insecurity experience5.
The average prevalence of severe food insecurity in NENA (9.2 percent) is above the world average, but below the average for all developing countries, reflecting the mix of relatively food secure countries in the Maghreb (4.6 percent) and the more severe food insecurity in the countries of the Mashreq (11.7 percent) affected by protracted conflict.
The FIES figures on moderate and severe food insecurity show a similar pattern, though the figures themselves are higher, reflecting their wider definition of food insecurity (Table 1). An estimated 31.4 percent of the population of the NENA region as a whole suffered from severe or moderate food insecurity, with the countries of the Mashreq subregion experiencing the highest food insecurity (37.6 percent) and the populations in the Maghreb the least (17.3 percent).
Food insecurity at moderate or severe levels in NENA, measured using FIES, is slightly higher than that of developing regions as a whole. The Maghreb subregion fares better than developing regions overall, although data at country level indicates some countries experience a higher rate of food insecurity (Libya, Mauritania and Morocco) than others (Algeria and Tunisia). The Mashreq subregion has the highest food insecurity rate in the region, and countries such as Iraq, Sudan, Syria and Yemen have rates that are among the
5 Ibid.

3
highest in the world, reflecting the devastating impacts of the ongoing conflicts on their food security and nutrition situation6. Data on the GCC and Yemen is incomplete as two countries (Oman and Qatar) were not surveyed and the protracted conflict in Yemen skews the average for the subregion upwards.
Like for the other regions, the food insecurity at moderate and severe levels is considerably higher in the NENA region than the prevalence of undernourishment, which was estimated at 8.6 percent in 2015 (FAO 2015), suggesting that moderate levels of food insecurity are major problem for a significant part of the population.
Table 1: Prevalence of moderate and severe food insecurity (FI) in selected regions and NENA, 2014-2015
WORLD Prevalence of FI moderate and severe
World 19.9
Developed regions 8.3
Developing regions 29.5
NENA region 31.4
Maghreb 17.3
Mashreq 37.6
GCC + Yemen 27.1
Africa 49.0
Eastern Africa 58.7
Western Africa 51.8
Northern Africa 24.0
Southern Africa 42.5
Middle Africa 66.4
Sub-Saharan Africa 55.6
Latin America 20.3
Latin America 20.3
Asia 23.3
Southern Asia 26.5
Southern Asia excluding India 37.4
South-eastern Asia 19.8
Western Asia 29.7
Source: FAO, Voices of the Hungry estimates, 2016
6 FAO. 2013. Technical paper for reference on the Food Insecurity Experience Scale (FIES) survey, development of a global standard for monitoring hunger worldwide. 2013. Available at: http://www.fao.org/fileadmin/templates/ess/voh/FIES Technical Paper v1.1.pdf.

4
This section reviews the evolution of the food security and nutrition situation along the four dimensions of food security: availability, access, utilization and stability.
Food availability
The adequacy of food at the aggregate level on a consistent basis, is a basic pre-condition to achieving food security and improved nutrition. The average Dietary Energy Supply Adequacy (DESA) expresses the Dietary Energy Supply (DES) as a percentage of the average Dietary Energy Requirement (DER) for an active and healthy life. Each country’s or region’s average supply of calories for food consumption is normalized by the average DER estimated for its population to provide an index of adequacy of the food supply in terms of calories.
Food supply at the aggregate level
Supply adequacy: NENA has enough caloric supply but less comes from domestic sources
The picture looks positive for the NENA region as the average DESA exceeds 100 percent of the average DER for all NENA countries (Figure 4)7, suggesting adequate food supplies at aggregate level. Furthermore, all subregions show figures well above the world average. These figures do not include Sudan and Syria and therefore need qualification.
Figure 4: Average Dietary Energy Supply Adequacy in NENA and its subregions and the world, 2008-2010 to 2014-2016
Source: FAOSTAT, 20167. Values with “*” are estimated as projections
From 2008-2010 to 2014-2016, the supply adequacy increased in all subregions, albeit at a lower rate in the Maghreb and GCC than in the Mashreq. In fact, according to partial data7, on average the Maghreb subregion historically has had higher average DESA than the GCC countries and the Mashreq. At national level, Iraq and Yemen lagged behind mainly due to the impact of conflict on the economy and the agriculture sector.
While caloric supply in the NENA region remains above
7 FAO, 2016. FAOSTAT data. Available at: http://www.fao.org/faostat/. Note: Data are not available for Bahrain, Qatar, Libya, Palestine, Syria and Sudan
world averages, the portion of DES from domestic production is lower than the world average, for NENA and all of its subregions (Figure 5).
Figure 5: Value of food production per capita in subregions of NENA, and the world, 2006-2008 to 2011-2013
Source: FAOSTAT, 20168
Food production has increased but less than the demand
The value of food production in NENA has kept pace with population growth over the last decade (Figure 5), such that per capita production has remained quite constant. However, as per capita incomes have increased in the region, the growth of domestic food production has consistently lagged behind the growth of food demand, creating a widening gap between domestic production and demand which is filled by imports. Scarce water resources limit the ability of domestic producers to meet a growing demand for animal products and processed foods. The domestic production-consumption gap is particularly marked for cereals (Figure 6), which provide the bulk of the calories in the region, but also for vegetable oils, sugar and meat.
Changing food consumption habits are largely linked to the demographic profile of the region, characterized by rapid urbanization and a young population. With relatively high population growth rates, albeit slowing over the last two decades, NENA is experiencing a “youth bulge”, with 58 percent of the population below the age of 299.
8 FAO, 2016. FAOSTAT data Available at: http://faostat.fao.org/site/731/default.aspx#ancor. Note: The indicator is calculated in three-year averages, from 1990-1992 to 2014-1916, to reduce the impact of possible errors in estimated DES, due to the difficulties in accounting of stock variations. It thus provides structural food supply adequacy.
9 United Nations, Department of Economic and Social Affairs, Population Division. 2015. World population prospects: The 2015 Revision, DVD Edition.
Part II: The Four Pillars of Food Security and Nutrition

5
Figure 6: Cereal production and apparent consumption trends in NENA region, 1996-2014
Source: World Bank, WDI, 2016 and UN Comtrade, 2016
Water scarcity and land degradation are major constraints to food production
NENA is the most arid region in the world and the availability of per capita renewable freshwater is less than 10 percent of the world average. Water scarcity is expected to worsen as a result of the population growth and the impact of climate change. The per capita availability of arable land is also the lowest in the world and as a result the pressure on land is the highest. Major land degradation problems of the region include soil and water salinity, loss of fertile lands to urban encroachment, drought, desert expansion and soil erosion. Except for very few countries in the region, the expansion of agricultural production will essentially come from the development of integrated value chains and from increases in agricultural productivity. Ensuring the availability of food will largely depend on the sustainability of the food systems in the region from production to consumption and on the trade policy and access to food imports.
Supply in terms of dietary intake: Beyond cereals, healthy and balanced food
Protein supply in the near east and north africa has r e g i s t e r e d i n c r e a s e s o v e r t h e l a s t d e c a d e The NENA region has witnessed a 12 percent increase in the average protein supply from 76.3 g per capita per day in 1989-1991 to 85.7 g per capita per day in 2009-2011. This regional average conceals significant differences between countries (Figure 7). In 2009-2011 the protein supply ranged from 108.3 g per capita per day in Kuwait to 58.3 g per capita per day in Yemen (i.e. about half Kuwait’s level).
Figure 7: Average protein supply in the NENA region, 1989-1991 and 2009-2011
Source: FAOSTAT, 2016
The largest increase in protein supply between 1989-91 and 2009-11 occurred in Kuwait (59.6 percent) followed by Oman (36.6 percent), Sudan (22.3 percent), Egypt (22.0 percent) and Algeria (18.3 percent). Morocco, Iran (Islamic Republic of), Jordan and Tunisia hovered around the regional average increase of 12.3 percent. On the other extreme, Iraq, the UAE and Lebanon registered negative values of -20.8, -2.3, and -1.1 percent, respectively. Yemen and Mauritania registered very small increases of 1.5 and 4. 9 percent, while Saudi Arabia witnessed a modest increase of 6.5 percent.
NENA consistently scores the highest average protein supply among developing regions (Figure 8). The scores of the GCC states were well above other subregions in the 1990s and continued to be so during the 2000s, despite progress made in the other regions. From a nutritional point of view, the protein requirements are calculated based on 0.8 g per kg body weight per day. For a sedentary man of 70 kg, this corresponds to 56 g per day. The regional average protein supply in NENA (85.7 g per capita per day) exceeds this notional average protein requirements of 56 g per day. Yet, protein supplies are not equally accessible by all segments of the population and this manifests itself in malnutrition (Figure 8), especially for countries where the calculated average protein supplies are barely above the minimum requirements (e.g. Yemen).
Like in all regions except sub-Saharan Africa, cereals, roots and tubers decreased in importance as a source of energy in NENA over the years. This is mirrored by the increase in the average supply of protein of animal origin (Figures 9 and 10). Notably, at subregional level, GCC and Yemen virtually maintained their share of dietary energy supply derived from cereals, roots and tubers. It can thus be concluded that while in the Maghreb and Mashreq, proteins of animal origin have been substituting the energy supply from cereals, roots and tubers, in the diets of GCC countries there has been a net addition of protein to diets both from animal and plant sources.

6
Figure 8: Average protein supply, 1990-1992 to 2009-2011
Source: FAOSTAT, 2016
Figure 9: Share of dietary energy supply derived from cereals, roots and tubers, 1990-1992 to 2009-2011
Source: FAOSTAT, 2016
Figure 10: Average supply of protein of animal origin, 1990-1992 to 2009-2011
Source: FAOSTAT, 2016
Access to and Affordability of Food
Access to food - the capacity to have physical and economic resources to obtain sufficient and appropriate foods for a nutritious diet - is a major dimension of food security. Economic growth, income poverty and inequality are major determinants of access to food. Equally good infrastructure (roads, storage capacities) and well-functioning markets are essential to secure physical access to food.
Access to food in NENA has generally improved but remains a problem in conflict areas
A proxy to the physical and economic access to food is the estimated depth of food deficit in each country, which indicates how many calories would be necessary to lift the undernourished from their status, everything else being equal, suggesting the volume of food missing in the national economy. During the period from 2004-2006 to 2014-2016, most countries experienced a contraction in their depth of food deficit, which indicates improvements in food security (Figure 11). The depth of food deficit in Iraq and Yemen is among the worst in the world. In 2014-2016, it was estimated at 185 kcal per capita per day in Iraq and 182 kcal per capita day in Yemen, which is well above the average of the low-income food-deficit countries (138 kcal per capita per day) and of sub-Saharan Africa (176 kcal pr capita per day). The analysis of the food deficit suggests alarming food security situations in conflict-stricken countries, where needs are huge and humanitarian work is hampered10.
Figure 11: Depth of food deficit in selected NENA countries, 2004-2006 to 2014-2016
Source: FAOSTAT, 2016. Values with “*” are estimated as projections
Poverty, economic growth and inequality
Income poverty is a major determinant of access to food. The NENA region has experienced a decrease in poverty rates and headcounts over the period 1995-2008, thanks to a steady increase in per capita Gross Domestic Product (GDP) growth over the same period which was higher than most developing countries11. This has translated into lower poverty rates, although there are considerable variations among countries. Poverty in rural areas remains particularly high, reflecting generally lower levels of access to education, health and infrastructure and lower income opportunities (Table 2)12. Agriculture is almost the only income source in the rural areas of NENA, and increased agricultural productivity is globally correlated with a decline in poverty. Policies aimed 10 World Bank.2016. World development indicators. Highlights Featuring
SDG Booklet. Available at: http://databank.worldbank.org/data/download/site-content/wdi-2016-highlights-featuring-sdgs-booklet.pdf.
11 Mthuli Ncube, John Anyanwu and Kjell Hausken: Inequality, Economic Growth and Poverty in the Middle East and North Africa (MENA). AfDB. Working Papers series N0 195. December 2013.
12 World Bank. WDI. 2015.

7
at increasing agricultural productivity in NENA will help decrease poverty rates in rural areas13.
The multiple shocks that hit the region since 2008, including the food price hikes and the economic downturn since 2011, as well as instability and conflicts, have greatly affected the overall economic and social situation. Poverty and food insecurity are again on the rise in many countries. In conflict-affected countries, there have been an outright reversal in poverty reduction gains. For instance, in Syria, estimates suggest that 80 percent of the population lives under poverty14.
Social protection is key to food security in NENA but needs improvement
Social protection systems in the NENA region exist in almost all countries. The systems are comprised of labour markets, social insurances and social assistance programmes. Most of the programmes are state-provided and led, and often take the form of universal social assistance, such as food and fuel subsidies15.
Untargeted consumer subsidies on food, electricity and fuel in NENA are both regressive and have proven to be significant burden on state budgets. These subsidies were expanded across the region as a response to the global crisis of 2007/08. They have been used mostly to shield the general population from price shocks and reduce poverty in oil-importing countries, while for oil-exporting countries; they have served as a signal to support certain sectors of the economy and the private sector as well as for redistribution of wealth. Spending on social safety nets in the region before the global economic crisis, estimated at 10.1 percent of total expenditure, increased to 11.9 percent during
13 Alienation and violence impact of the Syria Crisis. 2014. Available at: http://www.unrwa.org/sites/default/files/alienation_and_violence_impact_of_the_syria_crisis_in_2014_eng.pdf.
14 World Bank. 2016. MENA economic monitor – April 2016: Syria: reconstruction for peace.
15 Jawad, R. 2015. Social protection and social policy systems in the MENA region: emerging trends. UNDESA. US.
the crisis, and up to 12.5 percent after the crisis. The institutionalization of these subsidies and the fact that,
by virtue of their scale, they have had at least some impact on poverty, make them politically difficult to eliminate. Any reforms in subsidies must take general social and demographic pressures into account, as well as perceptions of government efficiency, transparency and accountability in the region. Some countries like Egypt, Jordan, Lebanon, Morocco, Sudan and Palestine are changing towards better targeted social protection systems and investing in cash transfer programmes, thus moving away from universal subsidies and replacing them with appropriate instruments that are well designed and substantially more efficient as an anti-poverty tool16.
Social protection in humanitarian context
The need to address poverty in the NENA region and vulnerability to climate change as well as NENA’s high cereal dependency ratio calls for a strategic consolidation and improvements in social security systems and social protection schemes that go beyond subsidy reforms. Currently some countries are scaling back on subsidies and improving efficiency, targeting, coverage and benefits. Egypt’s Vision 2030 and Medium-Term Investment Framework 2014/15−2018/19, for example, signal the intent of the government to reduce energy subsidies within 3 to 5 years while increasing the social security pension, switching from paper ration cards to smart cards, increasing the commodity choice of ration cardholders from oil-sugar-rice to 30 other commodities, extending medical insurance to farmers and agricultural workers who do not have access to public health insurance, and launching
a social protection targeting programme such as Conditional Cash Transfer (CCT) programmes targeting vulnerable populations
16 IMF. Subsidy Reform in the Middle East and North Africa, 2014.
Table 2: Progress towards poverty eradication has been diverse in selected NENA countries
Population below national poverty line
. Reference year
Rural Urban National Reference year
Rural Urban National
percent percent
Egypt 2008 28.9 11.0 21.6 2010 32.3 15.3 25.2
Iraq 2006 39.0 15.7 22.4 2012 30.6 14.8 18.9
Jordan 13.3 2010 16.8 13.9 14.4
Lebanon 2012 27.0
Mauritania 2004 59.0 28.9 46.7 2008 59.4 20.8 42.0
Morocco 2000 25.1 7.6 15.3 2007 14.4 4.8 8.9
Sudan 2009 57.6 26.5 46.5
Tunisia 2005 23.3 2010 15.5
Yemen 1998 42.5 32.3 40.1 2005 40.1 20.7 34.8
Palestine 2010 21.9 25.8 25.7 2011 19.4 26.1 25.8
Source: World Bank. WDI. 2015

8
which are unable to work. There are also efforts to improve the targeting of income transfer programmes in Jordan, Lebanon, Sudan and Yemen, in addition to Palestine.
Rarely is social protection targeted specifically to reach agricultural and informal workers or refugees. Less than 50 percent of the population of the region is actually covered by social assistance and a little over 40 percent of the poorest and second quintiles of the rural populations are covered17. Food security and nutrition are not necessarily key components of current schemes except for those serving internally displaced persons (IDPs) and refugees in the humanitarian context (through emergency food aid, provision of food vouchers, in-kind assistance) and school feeding programmes. Iran (Islamic Republic of), Iraq, Jordan and Lebanon have hosted Syrian refugees and face economic and social challenges as a result. Despite plans to address the influx of refugees, such as Jordan’s National Resilience Plan and Response Plan and Lebanon’s Roadmap of Priority Interventions for Stabilization from the Syrian Conflict, in general national social protection strategies lack food security as a core component in their design and results frameworks.
Where agriculture is significant in the economic structure of a country such as Sudan, Syria and Yemen, there needs to be recognition of the synergies between agriculture and social protection, and integration of social protection in development, not only as a poverty reduction tool or humanitarian relief mechanism, but as an investment in human capital and as a tool to build resilience and promote local economies. Programmes must take into account women’s role in household food security and women’s burdens, particularly in post-conflict regions where they contribute significantly to rural agriculture. There is also room for adaptive social protection in anticipation of climate change-related crises which can play a role in promoting stability in times of drought. Given the fact that 22 percent of damages caused by natural hazards and disasters affect agriculture, it is also imperative that social protection systems be designed to be shock-responsive and informed by the potential risks via linkages to early warning systems. NENA currently needs a regional strategy on social protection geared towards addressing shocks and crises with alternatives for contingency planning and funding that can eventually sustain programmes and link them to rural development.
Food Utilization: The Triple Burden of Malnutrition
Over the past 40 years, NENA countries have made significant progress in improving the health situation of children. Infant and child mortality rates have dropped. However, despite the overall improvement in these rates, the nutritional status of children under the age of five in some NENA countries has not seen a positive development. Seven out of 19 countries in NENA still register levels of chronic malnutrition above 20 percent. The majority of NENA countries have been reporting on the prevalence 17 FAO, SOFA 2015. The State of Food and Agriculture 2015: Social
protection and agriculture: breaking the cycle of rural poverty. Available at: http://www.fao.org/3/a-i4910e.pdf. Note: See Figures 10 and 11 from SOFA 2015.
of chronic and acute malnutrition, measured as stunting and wasting, respectively, since the mid- to late eighties, with varying frequency of updates. Currently, the prevalence of stunting varies widely, with Sudan and Yemen registering the high rates, while the proportion of children that are stunted across NENA has increased. Even where nutrition policies exist to tackle malnourishment, the region lacks an overall clear strategic path for policy and budgetary commitments to support nutrition programmes to monitor and advocate for better nutrition. Many middle income countries in NENA are experiencing a nutrition transition18. In light of this, a triple burden of malnutrition: undernutrition, micronutrient deficiency and overnutrition are challenges for NENA.
Undernutrition: Prevalence among children under five years of age
Child undernutrition manifests itself in several ways, the most common indicators being those based on a child’s weight and height for a given age. Three most commonly used indicators are stunting (low height for age), wasting (low weight for height) and underweight (low weight for age). The latter was used by the MDG while the SDG includes targets on stunting and wasting.
A comparison between stunting prevalence rates in the 1990s (with the exception of Sudan, the UAE and Palestine) and most recent updates over the period 2005-2015 reveals that three countries ( Iran (Islamic Republic of), Jordan and Saudi Arabia) have succeeded in reducing stunting rates from above 20 percent to less than 10 percent; one country (Morocco) has done so from 30 percent to 15 percent; while seven countries still have rates above 20 percent; namely, Egypt, Iraq, Libya, Mauritania and Syria, with Sudan and Yemen remaining with high prevalence of stunting at 38.2 percent and 46.8 percent, respectively (Figure 12)19.
Data on wasting, on the other hand, shows that over the period 2005-2015, six NENA countries have reported acute malnutrition rates at less than 5 percent, which places them on par with the World Health Assembly Target for wasting in 202520 (Figure 13).
18 The nutrition transition to 2030 why developing countries are likely to bear the major burden. FAO. 2005. Available at: http:// www.fao.org/fileadmin/templates/esa/Global_persepctives/Long_term_papers/JSPStransition.pdf. Note: Nutrition transition refers to malnutrition not from lack of food but from lack of high quality nourishment, meaning, foods rich in vitamins, minerals and micronutrients are substituted by processed foods heavy in added sugar, saturated fat and sodium.
19 FAO, 2016. FAOSTAT data. Available at: (http://www.fao.org/faostat/en/#data/FS). Note: Regional statistics shift downwards as a result of the fact that countries with over 20 percent prevalence rates in stunting also happen to have a large percentage of children in their overall population counts as for example Iraq, Egypt, Sudan and Yemen. Sudan in comparison has the highest number (2.24 million) of stunted children in the NENA.
20 World Vision International. 2012. Article of world health assembly. Available at: http://www.wvi.org/nutrition/article/world-health-assembly.

9
Figure 12: Stunting rates among children aged less than five years, 1990-1999 and 2005-2015
Source: FAO, SOFI, 201421 (for 1990–1999 Data) and World Health
Statistics, 201622
Figure 13: Wasting among children aged less than five, 1990-1999 and 2005-2015
Source: FAO, SOFI, 2014 and World Health Statistics, 2016
Four countries have reported rates of acute malnutrition between 5 and 10 percent (considered medium-level wasting), while three countries have reported rates between 10 and 15 percent (considered high-level wasting). Finally, two countries stand at a high rate of above 15 percent.
Among the three Least Developed Countries (LDCs) (Mauritania, Sudan and Yemen) in the region, Mauritania has achieved remarkable success in reducing stunting rates from 54.8 to 22 percent and wasting rates from 17.4 to 11.6 percent.
Micronutrient deficiency: Prevalence in women and children
Available data suggests that the lack of several micronutrients including iron, vitamin A and D and iodine are a concern for the population of the region. Iron deficiency and anaemia remain by far the most serious micronutrient-related public health problem in all NENA countries. Both are widespread among women,
21 FAO, SOFI, 2014. Available at: http://www.fao.org/publications/sofi/2014/en/.
22 World Health Statistics, 2016. Available at: http://www.who.int/gho/publications/world_health_statistics/2016/en/.
especially women of child-bearing age, and among children. In pregnant women, severe iron deficiency-linked anaemia has been directly associated with premature births and low birth weight babies, whereas in infants and children severe anaemia leads to delayed growth and development and is associated with increased susceptibility to infections.
The prevalence rates of anaemia were found to range from 7.4 to 80.4 percent among children in NENA below five years of age, 10.4 to 57.5 percent among school-aged children, 16 to 58.4 percent among pregnant women and 21.3 to 63 percent among women of childbearing age. The highest rates of anaemia are reported in Sudan for children under five years of age (80.4 percent) and pregnant women (58.4 percent), and in Jordan for school-aged children (57.5 percent).
Vitamin D deficiency – especially among children and women – is reported more frequently than in previous years. Rates of deficiency among children under five years of age were found to range between 9.5 percent (Qatar) and 90.3 percent (Bahrain, among newborns). As for school-aged children, the highest prevalence rate of vitamin D deficiency in NENA was reported in Iran (Islamic Republic of) at 76.3 percent. High prevalence rates were also reported among Qatari children aged 11 to 16 years (61.6 percent) and among Saudi girls aged 12 to 15 years (81 percent). In the adult population, the prevalence of vitamin D deficiency among pregnant women is estimated at 88.8 percent in Bahrain and 60.3 percent in Jordan. The highest rates among women of childbearing age are reported in Saudi Arabia at 80 to 85 percent.
In addition to vitamin D deficiency, vitamin A deficiency is prevalent in NENA. This is considered a public health problem, albeit only in a few countries of the region. It is observed among preschoolers, school-aged children and women of childbearing age, and found to range between 0.5 and 62.4 percent among children, with the highest rate documented in Yemen among children under five years of age.
Finally, although the World Health Organization (WHO) recognizes iodine deficiency as a problem of public health significance in the region requiring urgent attention in the last decade, there is limited data available on it for the region. However, Egypt has reported that its highest iodine deficiency prevalence rates are registered among school-aged children (91.9 percent).
Overweight and obesity: Prevalence among children and adults
An alarming picture is emerging in the region with respect to the increasing prevalence of overweight children aged less than five (Figure 14). Five countries in the region have registered obesity prevalence rates at a range between 10 and 14 percent, three countries between 15 and 20 percent, and one over 20 percent. The data provided reflects pre-crisis rates in countries such as Libya and Syria.

10
Figure 14: Prevalence of overweight children aged less than five in the NENA region
Source: UNICEF/WHO/World Bank, accessed June 2016
The same trend can be seen among adolescents, with the incidence of overweight and obese young adults on the rise. The prevalence of overweight among adolescent males ranges between 17.4 percent in Tunisia to 30 percent in Kuwait; for adolescent females it ranges from 13.4 percent in Lebanon to 31.8 percent in Kuwait. Data on obesity from Iran (Islamic Republic of), Kuwait, Lebanon and Qatar shows that obesity prevalence among adolescent males ranges between 9 and 15 percent and among adolescent females it stands between 2 and 13 percent.
There is substantial global evidence linking childhood and adolescent obesity to increased risk of obesity and morbidity in adulthood and subsequent complications, such as diabetes, coronary artery disease, hypertension and osteoarthritis. Aside from Mauritania, Sudan and Yemen, most NENA countries are in fact facing public health concerns of non-communicable diseases stemming from overweight and obesity-related issues as regards to their adult populations, irrespective of socio-economic groupings. The rates in NENA are exceptionally high; indeed, they are higher than those of countries with comparable per capita income levels. This trend has increased sharply over the last three decades and is more pronounced among the adult females. Based on data compiled by WHO (WHO Global InfoBase) for adults aged 15 years and above, the highest rates in the region in terms of levels of overweight are found in Kuwait, Egypt, UAE, Saudi Arabia, Jordan and Bahrain, where the incidence of overweight and obesity ranges between 74 to 86 percent in women and 69 to 77 percent in men. Overweight and obesity prevalence is found to increase with age, mainly due to the decline in energy expenditure rates and lack of physical activity.
The public health implications of such high rates are seen in the increased incidence of Non Communicable Diseases (NCDs) in the region, such as cardiovascular disease, diabetes and cancer23. It is estimated that 47 percent of the region’s burden of disease is attributed to NCDs, and this number is expected to rise to 60 percent by 2020. This may be a call for an examination of dietary patterns marked by the high consumption of animal products,
23 WHO. 2015. Fact sheets on Non-communicable diseases (NCDs). Available at: http://www.who.int/mediacentre/factsheets/fs355/en/.
fat, sugar and salt and low physical activity levels, reinforced by nutrition education.
In view of the adverse shifts in dietary patterns, rising incidence of overweight and obesity and increased rates of NCDs in NENA, there have been some increases in investment in the region in the public health sector (2 to 3 percent of GDP, on average). Per capita public health expenditure has increased in all countries; and with the exception of Mauritania, Syria and Yemen, it has more than doubled between 1995 and 2012. Access to public health will need to be further expanded in order to respond to shifting food safety-related health concerns, dietary patterns and complex challenges of malnutrition in NENA.
Food Safety
The region has made significant progress in terms of access to water and sanitation facilities, essential to ensure proper conditions for the utilization of food. As a whole, the NENA region has reached its MDG targets for both the use of improved water sources and sanitation facilities.
Despite limited freshwater supply, 92.5 percent of the NENA population has access to and use of improved drinking water sources, and an estimated 40 percent of people have gained access during the MDG period since 1990. While the greatest improvements are seen in the GCC countries – in line with their rapid economic development over this period – the majority of NENA countries now have usage rates of improved water sources well above 90 percent due to public and private infrastructure investments. Outliers, such as Iraq, Mauritania and Syria have seen limited progress. Mauritania and Palestine lag the farthest behind, with 58 percent using improved drinking water sources. Access to proper sanitation in NENA countries is also high. Nearly all countries report use of hygienic sanitation facilities above 90 percent. In the LDC group of the region, Mauritania lags behind at 40 percent, while data is unavailable for Sudan and Yemen.
Conflict in NENA countries complicates access to water and sanitation. The trend of recent years has seen the bulk of global emergency Water, Sanitation and Hygiene (WASH) expenditures on the NENA region (in 2015, over USD 220 million through the United Nations Children’s Fund [UNICEF]) with Iraq, Jordan, Lebanon, Syria and Yemen on the top 10 list of recipients24.
The incidence of foodborne disease25 throughout the region is a reflection of the safety of water used for the cleaning and processing of food, as well as more broadly of the poor food-production processes and food handling (including inappropriate use of agricultural chemicals), lack of adequate food storage infrastructure and lack of or poorly enforced regulatory standards. In turn, poor food safety and quality are often a barrier to enabling market access to value-added markets. WHO (2015) estimates that the burden of foodborne diseases
24 UNICEF. 2016. Annual Results Report 2015: Water, Sanitation and Hygiene. Geneva.
25 WHO, 2015. Four categories defined in WHO (2015): diarrheal disease agents, invasive infectious disease agents, helminthes, and chemicals and toxins.

11
ranges from 360 to 570 Disability-Adjusted Life Years (DALYs)26 per 100 000 population in the Eastern Mediterranean countries,27 on average, for which diarrhoeal disease agents were the leading cause. These figures compare favourably to the Asia and African sub regions, but lag behind developed sub regions where the figures are closer to zero.
Food Stability
Food stability remains the most important challenge to food security and nutrition in the NENA region. Conflicts, heavy dependence on food imports and international market and price volatility are the main causes of food instability in the region.
Conflicts and protracted crises are the most important causes of food instability in NENA
Conflicts and political instability in several parts of the region (Iraq, Libya, Syria and Yemen) are major causes of disruption in food availability and accessibility and are behind the surge in undernourishment among children. In Iraq, Syria and Yemen, 8.2, 13.5 and 21.1 million people, respectively, are in need of humanitarian assistance28.
In the case of Syria and Yemen, humanitarian assistance has played a crucial role in saving lives, although such interventions are sometimes curtailed due to security and political constraints29. In Syria, the conflict has resulted in severely limited food production, marketing and imports, reducing the availability of food and causing prices to soar. Since 2011, livestock numbers for poultry, cattle, and sheep have fallen by 50, 30 and 40 percent, respectively30. Security concerns have limited the access to pastures, while the cost of animal feed has increased by 168 percent in 201531. Households have been forced to adopt negative coping strategies, such as selling productive assets, reducing the number of meals and choosing cheaper and less nutritious foods. The violence has also led to localized shortages in food and water and deteriorating health services with losses of
26 WHO, Health statistics and information systems. 2016. Disability-Adjusted Life Years (DALY). Available at: http://www.who.int/ healthinfo/global_burden_disease/metrics_daly/en/.
27 WHO. 2015. EMR B and EMR D cover a broader definition of Arab and South-Eastern Mediterranean countries. Available at: http://www.who.int/choice/cost-effectiveness/results/emr_B/en/ and http://www.who.int/choice/cost-effectiveness/results/ emr_D/en/.
28 World Bank. 2016. The cost of war and peace in the Middle East. Note: According to the World Bank, in both Syria and Iraq, per capita income is 23 percent and 28 percent less respectively compared to what it may have been if there was no conflict. Available at: http://www.worldbank.org/en/news/feature/2016/02/03/by-the-numbers-the-cost-of-war-and-peace-in-mena.
29 FAO. 2015. Available at: http://www.fao.org/news/story/en/item/382181/icode/. Note: In 2015, FAO reached nearly 1.5 million people inside Syria with agricultural assistance but of the USD 86.5 million needed under the Humanitarian Response Plan only is 6 percent. The funding gap in Yemen is 20.05 Million.
30 FAO. 2016. Syria situation report. Available at: http://www.fao.org/fileadmin/user_upload/emergencies/docs/SyriacrisisSitReport_ Apr2016.pdf.
31 Ibid.
lives, among children in particular. In Yemen, recent FAO assessments report that more than
half of the population is food insecure: 26 percent live in areas under emergency levels of food insecurity and 27 percent in areas under crisis level32. The volume of food required in Yemen is much more than humanitarian organizations can provide, and lack of foreign reserves has reduced availability of essential food commodities.
In Iraq, damage to the agriculture sector and rural infrastructure has been significant. A needs assessment of three governorates (formerly providing half of the Iraq’s cereal production) has shown reduced yields due to the unavailability of seeds and fertilizers, damage to irrigation infrastructure, destruction of storage facilities and damage to agricultural tools and machinery33. Eighty percent of sheep and goats and up to 50 percent of cows have been reported lost, while 90 percent of poultry has died. Only 10 to 20 percent of livestock shelters remain intact. Similar losses are seen in fisheries and aquaculture, with damage to fish ponds, boats and hatcheries.
The impact of conflicts and crises is long lasting. They affect not only the production capacity and economic growth but also the resilience capacity of individuals, households, communities and states.
Climate change poses a threat to food security and has already been shown to contribute to conflict
Climate change threatens to increase food insecurity and exacerbate water scarcity issues in the NENA region which is one of the world’s driest regions. Some areas are affected by more frequent droughts and in other areas there are rising sea levels. The region will see a rise in temperature from 1 to 5oC relative to its reported temperatures between 1986 and 2005 depending on various climate change scenarios34. The region expected to be the most impacted is North Africa, particularly Mauritania and Morocco35. Changes in precipitation will most likely impact the water supply from the Atlas Mountain area, the Upper Nile, and the Euphrates and Tigris river catchments. The impact of climate change on the Arabian Peninsula and North Africa will impact livestock and agriculture-dependent communities and reduce water supply, adding strain on the energy sector for cooling as summers will increase.
Despite the fact that the region’s forest and forestry ecosystems are playing a significant role in adaptation to and mitigation of climate change, efforts for forest expansion are scarce36.
32 FAO. 2016. Yemen situation report. Available at: http://www.fao.org/fileadmin/user_upload/emergencies/docs/FAO%20Yemen%20_%20Situation%20Report%20-%20September%202016%20CLEARED.pdf.
33 FAO. 2016. Iraq agriculture and livelihoods needs assessment. Available at: http://www.fao.org/fileadmin/user_upload/FAO-countries/ Iraq/ToR/FAO_Assessment1.pdf.
34 RICCAR 2015 data cited in UNESCWA. 2015. Arab Sustainable Development Report – First Edition. Beirut.
35 Ibid.36 FAO. 2015. State of forest in the NENA. Cairo.
12
At country level, there is a relatively high rate of conversion of ‘Other Wooded Land’ areas to agriculture or urbanization, particularly in Iran (Islamic Republic of) and Sudan, although in Tunisia conversion has actually led to the expansion of the forest cover through afforestation37.
Climate change and the resulting weather-related shocks also aggravate regional instability, and add to the multitude of risk factors contributing to conflict. For example, the Syrian civil war emerged after severe droughts between 2006 and 2010 that paralysed agriculture, destroying livelihoods of 50 percent of the farmers. This, coupled with the resulting food price increase; increasing poverty; and social, political and economic strife; ultimately contributed to worsening instability38.
High cereal import dependency and world market volatility are significant risks to food stability
The growing dependency of the region on food imports and the resulting exposure to international price volatility and to food supply restrictions in NENA are major challenges to food availability and stability.
Cereals import dependency has dramatically increased over the period 2000-2014, such that the gap between cereals availability (i.e. proxy for consumption) and cereal production has increased by around 75 percent over the same period (Figure 6). In terms of stability this means any shortage of supply in the international markets will have an immediate negative impact in NENA.
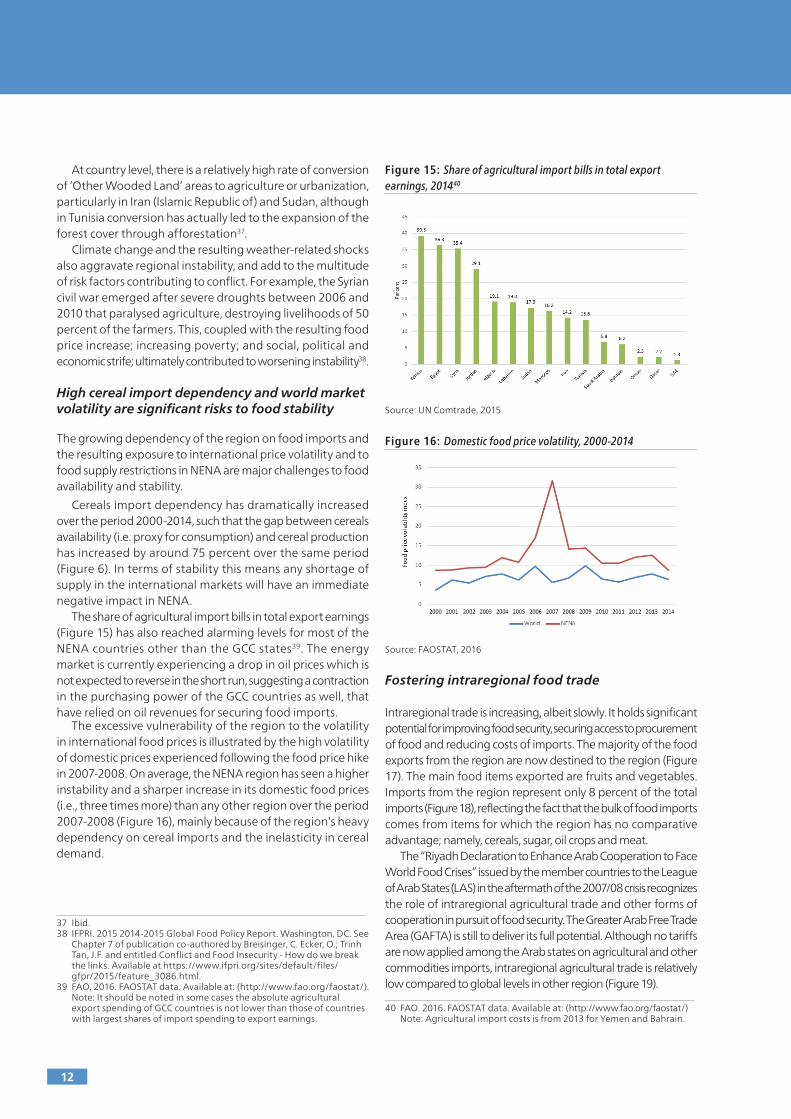
The share of agricultural import bills in total export earnings (Figure 15) has also reached alarming levels for most of the NENA countries other than the GCC states39. The energy market is currently experiencing a drop in oil prices which is not expected to reverse in the short run, suggesting a contraction in the purchasing power of the GCC countries as well, that have relied on oil revenues for securing food imports.
The excessive vulnerability of the region to the volatility in international food prices is illustrated by the high volatility of domestic prices experienced following the food price hike in 2007-2008. On average, the NENA region has seen a higher instability and a sharper increase in its domestic food prices (i.e., three times more) than any other region over the period 2007-2008 (Figure 16), mainly because of the region’s heavy dependency on cereal imports and the inelasticity in cereal demand.
37 Ibid.38 IFPRI. 2015 2014-2015 Global Food Policy Report. Washington, DC. See
Chapter 7 of publication co-authored by Breisinger, C. Ecker, O.; Trinh Tan, J.F. and entitled Conflict and Food Insecurity - How do we break the links. Available at https://www.ifpri.org/sites/default/files/gfpr/2015/feature_3086.html.
39 FAO, 2016. FAOSTAT data. Available at: (http://www.fao.org/faostat/). Note: It should be noted in some cases the absolute agricultural export spending of GCC countries is not lower than those of countries with largest shares of import spending to export earnings.
Figure 15: Share of agricultural import bills in total export earnings, 201440
Source: UN Comtrade, 2015
Figure 16: Domestic food price volatility, 2000-2014
Source: FAOSTAT, 2016
Fostering intraregional food trade
Intraregional trade is increasing, albeit slowly. It holds significant potential for improving food security, securing access to procurement of food and reducing costs of imports. The majority of the food exports from the region are now destined to the region (Figure 17). The main food items exported are fruits and vegetables. Imports from the region represent only 8 percent of the total imports (Figure 18), reflecting the fact that the bulk of food imports comes from items for which the region has no comparative advantage; namely, cereals, sugar, oil crops and meat.
The “Riyadh Declaration to Enhance Arab Cooperation to Face World Food Crises” issued by the member countries to the League of Arab States (LAS) in the aftermath of the 2007/08 crisis recognizes the role of intraregional agricultural trade and other forms of cooperation in pursuit of food security. The Greater Arab Free Trade Area (GAFTA) is still to deliver its full potential. Although no tariffs are now applied among the Arab states on agricultural and other commodities imports, intraregional agricultural trade is relatively low compared to global levels in other region (Figure 19).
40 FAO. 2016. FAOSTAT data. Available at: (http://www.fao.org/faostat/) Note: Agricultural import costs is from 2013 for Yemen and Bahrain.

13
Figure 17: NENA agricultural exports by destination, 2015
Source: UN Comtrade, 2015. Available in http://comtrade.un.org/
Figure 18: NENA agricultural imports by origin, 2015
Source: UN Comtrade, 2015. Available in http://comtrade.un.org/
Figure 19: Intraregional agricultural trade as a share of total merchandise trade, NENA and selected trade blocks, 2015
Source: UN Comtrade, 2015. Available in http://comtrade.un.org/
Constraints other than border tariffs explain the low interregional agricultural trade in NENA. For example, trade costs for agricultural goods among North African countries are three times higher than those experienced among their
European counterparts in the northern Mediterranean(France, Italy and Spain). Trade costs within the Maghreb subregion or between the Levant countries of the eastern Mediterranean even exceed those incurred with Europe41.
Intraregional trade offers an opportunity to reduce the costs of food imports through lower trade costs and lower non-tariff barriers. Pooling agricultural production and imports, especially through cross-border trade, holds enormous opportunities to stabilize markets; thus, to contribute to food security in the region (OECD-FAO, 2016)42. In this respect, operationalization of GAFTA, in terms of abolishing non-tariff barriers, could bring significant benefits to the whole region. Simulations show that reduction in the use of non-tariff measures in the region would favour the sectors that are the most traded, especially food products.
In this regard, the potential of Sudan as a possible breadbasket for food products for which it has a comparative advantage could benefit the region, as a whole. Arable land in Sudan is estimated to cover 84.3 million hectares, of which only 20 percent is cultivated. Sudan has a clear comparative advantage for the sustainable production of some cereals, oil crops, sugarcane, pulses, vegetables and fruits. In addition, the country’s water resources may not be affected by climate change which offers the prospect of stable production. While the country encourages foreign direct investments and partnerships in the agriculture sector, the need for investments in infrastructure is substantial and the investment environment needs significant improvements.
Reducing trade costs through investment in infrastructure, transport and processing
Trade policy should also aim at reducing the import bill. In addition to the reduction of implicit trade costs in the form of non-tariff measures, there is scope for reducing direct costs of trade. The case of wheat highlights the challenges and potential for infrastructure investments and simplified administrative procedures. Logistical costs along the wheat supply chain in Arab countries exceed global norms (on average USD 40 per tonne compared to USD 11 in the Netherlands and USD 17 in South Korea). Likewise, transit times are slower, reaching 78 days in NENA countries compared to 18 days in the Netherlands and 47 days in South Korea43. In Egypt’s case, complexities in the import tender system are estimated to cost over USD 30 million annually, and another USD 43 million could be saved through modernizing wheat storage systems44.
41 Peter Talks. 2015. FAO and EBRD. Agricultural policies and institutions specialist. Agri-food Trade and Food Security in the Southern and Eastern Mediterranean Countries. Available at: http://www.medagri.org/docs/group19/Regional%20Trade%20Integration.pdf.
42 http://www.oecd.org. 2016. See also FAO and EBRD, 2015. Egypt, Jordan, Morocco and Tunisia Key trends in the agrifood sector.Available at: http://www.fao.org/3/a-i4897e.pdf.
43 World Bank and FAO. 2012. The grain chain: Food security and managing wheat imports in Arab countries. Washington.
44 FAO and EBRD. 2016. Egypt: Wheat sector review, by J. McGill, D. Prikhodko, B. Sterk, and P. Talks. FAO Investment Centre Country Highlights. Rome.
Africa2%
Asia and the Pacific31%
Europe and Central Asia41%
Near East and North Africa
8%
Latin America and the Caribbean
18%
Africa5%
Asia and the Pacific16%
Europe and Central Asia39%
Near East and North Africa40%

14
Water Scarcity and Climate Change Pose Massive Challenges to Eradicating Hunger and Achieving Improved Food Security and Nutrition and Promoting Sustainable Agriculture in the NENA Region
The NENA region faces considerable challenges in advancing the 2030 sustainable development agenda and in particular in achieving the SDG 2 of eradicating hunger and malnutrition, eliminating rural poverty and promoting sustainable agricultural development. The most immediate challenge stems from the impacts of conflicts and protracted crises. The region is home to 7.3 million refugees and 15.5 million displaced people, almost 60 percent of the total humanitarian caseload worldwide. The Syria crisis is the most severe humanitarian crisis since World War II.
The cumulative costs of the Humanitarian Appeals for the crises in the region (Iraq, Libya, Syria, Yemen and Palestine) for the period of 2012-2016 have reached the record figure of US 37.5 billion45, more than USD 14 billion of which is for food security. The impacts of the conflict on the economic infrastructures, the natural resources and the environment for Syria alone have exceeded its GDP. The spill-over effects of the multiple crises in the region (Iraq, Libya, Syria and Yemen) are resulting in significant economic losses for the neighbouring countries and the region at large, as tourism, foreign direct investments, intraregional trade and labour remittances recede in most countries.
At the same time countries in the region are likely to face a sluggish economic growth in the short and medium term. Growth in the GCC countries is expected to decline further to 1.8 percent in 2016 from 3.3 percent in 2015, stabilizing at around 2 percent in the medium term, because of lower oil prices. The reduction in oil revenues may also translate into lower public aid and transfers from the GCC to the non-oil rich countries in the region.
Most countries will need to adjust their current account over the coming years (Figure 20) and will have therefore limited fiscal space in the short and medium term to sustain large public expenditure programmes to mitigate the socio-economic impacts of the conflicts.
Figure 20: Current account balance (as percent of GDP) in selected NENA countries, 2008-2021
Source: IMF, Balance of Payments Data, 2016. Values are projections
45 OCHA, 2016. Available at: https://fts.unocha.org.
Throughout the NENA region where food security is closely linked to the fiscal capacity to pay for food imports and for safety nets to ensure access of the poor and vulnerable to food, countries will be confronted with difficult trade-offs in their endeavours to advance SDG 2 that are likely to test the strong political will to improve food security and end hunger (Box 2).
Box 2: A strong political will to address food security expressed through several initiatives at national and regional levels
Arab leaders are acutely aware of the challenge of food security and nutrition. The theme of food security has featured high at the League of Arab States summits, and several initiatives have been launched to promote food security and agriculture development.
King Abdullah Bin Abdul-Aziz’s 2009 Initiative has increased the contribution of Saudi Arabia to the capital of the Sudan’s Arab Food Security Project. This project is working to bridge the Arab food gap, estimated at about USD 45 billion annually, through the doubling of irrigated areas from 4 to 8 million acres, as well as increasing the cultivated area under rainfed crops by 4 million acres.
The Kuwait Declaration of the Arab Economic Summit, held in Kuwait in 2009, underlines Arab leaders’ recognition of the importance of prioritizing an emergency food security programme as a key strategy in raising living standards. On water security, the Council of Arab Water Ministers was tasked with preparing a strategy for water security in the Arab region to address challenges and requirements for sustainable development. To tackle poverty, the declaration called for poverty reduction programmes to be implemented while urging Arab finance institutions to play a more active role in increasing funding and investments in the agriculture sector.
The Algiers Summit in 2005 has adopted the “Arab Strategy for Sustainable Agricultural Development”.
Sudan’s President, Mr Al Mushir Omar Al-Bashir’s 2013 initiative on “Arab Agricultural Investment” in Sudan, is another example of national initiatives that are being developed to contribute to achieving Arab food security, an initiative launched in Riyadh at the Arab Social and Economic Development Summit in 2013.
There are also a number of national initiatives to boost food security and agricultural development, including the Egyptian President Mr Abdel Fattah Al-Sisi’s “Reef Initiative“ announced in 2015, also known as the “One and a half million acres initiative”. This initiative seeks to expand Egypt’s total agricultural land by approximately 20 percent.
Countries in the region are also strongly committed to the 2030 Sustainable Development Agenda. Most countries have taken part in the regional forums organized in the lead up to the sustainable development summit in 2015. Several countries are looking at streamlining the SDGs in their national development strategies, including Egypt, Jordan, Mauritania, Morocco and Tunisia. Other countries, such as Oman, Saudi Arabia and the UAE, are charting visions and sustainable agricultural development strategies that are fully aligned with the 2030 Sustainable Development agenda. Egypt and Morocco have volunteered to be amongst the first countries to report on the implementation of the SDGs to the United Nations Economic and Social Council (ECOSOC).
While pathways to achieving SDG 2 are country specific and are likely to depend on complex national prioritization processes that may be heavily prone to specific political economy considerations, it is possible to identify a few major issues that will be central to any strategy to end hunger, improve nutrition and promote sustainable agricultural development.
Water scarcity and climate change are among such issues because of the massive impact they have on food security,
Part III: Policy Commitments and Experiences to End Hunger, Achieve
Food Security and Improved Nutrition and Promote Sustainable
Agriculture (SDG 2): A Focus on Water and Climate Change

15
sustainable agriculture, the environment and beyond on the broader economy and society. Water is already the binding factor to agricultural development in the region and indirectly to food security. Climate change impacts on food security will principally be channeled through the water sector, in terms of reduced water availability, increased crop demand for water, increased aridity and loss of biodiversity. Climate change effects combined with the continuous population growth in NENA will exacerbate water scarcity and may compound some of the structural vulnerabilities in relation to food security, including the dependency on food imports, the pressure on land, rural poverty and migration.
The ability of the NENA region to achieve significant progress towards the achievement of SDG 2 will hinge in large parts on policies and strategy that can deliver sustainably the management of agricultural water and on adaptation of the agricultural and food sector to climate change impacts. Countries in the region are conscious of this imperative and they have generally in place policies and interventions that pursue this aim.
The following sections analyse the impact of climate change impact on water and agriculture in NENA and review country experiences and options to improve the management of agricultural water resources, along six critical dimensions: (i) adaptation to climate change in the water and agriculture sector; (ii) providing social protection for building resilience to climate change; (iii) reducing food losses and waste; (iv) promoting sustainable patterns of consumption; (v) defining and promoting the role of trade in the adaptation to climate change ; and (vi) strengthening regional collaboration and collective action.
Climate Change Impact on Water and Agriculture in NENA: Lessons from Recent Evidence Base
The agriculture sector represents 14 percent of the GDP and employs 38 percent of the labour force in NENA. It also plays a vital economic and social role, contributing to economic growth, household food security, poverty reduction, rural development and export earnings. Overall, most countries of the region have witnessed a steady increase in their agricultural production in recent decades. This is largely attributable to the intensification in irrigation and other productivity initiatives supported by large public interventions, including through incentives and disincentives. Often, such interventions have ultimately encouraged the overuse of water, in particular groundwater resources46, and called into question the sustainability of the food systems in the NENA region.
Most countries in the region have agricultural traditions going back millennia and have accumulated the skills, knowledge and capabilities to produce more food, but water is the binding factor for agricultural production. Fifteen countries out of the 19 composing the NENA region are considered water-scarce countries.
In addition, climate change is expected to have a serious impact on agricultural production and food security and its effects will be channelled essentially through the water sector. Recent
46 FAO. 2015. “Towards a Regional Collaborative Strategy on Sustainable Agriculture Water Management and Food Security in the Near East and North Africa Region”. Second Edition.
evidence47 from the Regional Initiative for the Assessment of the Impact of Climate Change on Water Resources and Socio-economic Vulnerability in the Arab Region (RICCAR framework), points out to consistent warming trends throughout the region with increased minimum and maximum temperatures, coupled with reduced precipitation, reduced runoff and increased evapotranspiration (ET) in most of the region in varying degrees. The climate models also show a general increase in the frequency of warm days and longer dry spells across the region. These increases in ET are coupled with similar declines in runoffs by more than 50 mm/year in the most-affected areas and resulting in increased intensity of water scarcity.
The vulnerability analysis carried out in the same framework confirmed that climate change will result in reduced crop yields, shortened cropping seasons, reduction in cropping intensity and salinization. Livestock, in particular local species, seems to be less vulnerable. All the farming systems will be affected by increased aridity and decline in water availability, with dryland and pastoral systems being the most affected (Table 3).
Table 3: Climate change impacts on farming systems of the NENA region48
Farmingsystem
Exposure:What climate change-related events will occur
Sensitivity:Likely impacts on farming systems
Irrigated Increased temperaturesReduced supply of surface irrigation waterDwindling groundwater recharge
More water stressIncreased demand for irrigation and water transferReduced yields when temperatures are too highSalinization due to reduced leachingReduction in cropping intensity
Highland mixed
Increase in aridityGreater risk of droughtPossible lengthening of the growing periodReduced supply of irrigation water
Reduction in yieldsReduction in cropping intensityIncreased demand for irrigation
Rainfed mixed
Increase in aridityGreater risk of droughtReduced supply of irrigation water
Reduction in yieldsReduction in cropping intensityIncreased demand for irrigation
Dryland mixed
Increase in aridityGreater risk of droughtReduced supply of irrigation water
A system very vulnerable to declining rainfallSome lands may revert to rangelandIncreased demand for irrigation
Pastoral Increase in aridityGreater risk of droughtReduced water for livestock and fodder
A very vulnerable system, where desertificationmay reduce carrying capacity significantlyNonfarm activities, exit from farming, migration
Source: World Bank, 2013. Adaptation to a changing climate change in the
Arab countries. World Bank, Washington DC
The impact of climate change on water will affect all the four dimensions of food security: the availability of food through decrease in production; access to food through reduced incomes; stability through extreme intensity and frequency of extreme
47 Aziz Behri and Ahmad Sadiddin. “Climate adaptation to water scarcity by the green sectors in Egypt, Jordan and Lebanon”.FAO. 2015. FAO-GIZ Project.
48 World Bank 2013. Adaptation to a changing climate change in the Arab countries. World Bank, Washington DC.

16
events, in particular droughts and floods; and utilization through the deterioration of water quality.
Climate change will also exacerbate the risks associated with long terms trends resulting from mismanagement of water resources, including risks of conflicts, impoverishment and migration (Box 3).
Box3: Has the drought in Syria contributed to triggering the conflict?
The consequences of the Syria crisis that started in 2011 are clear, but the causes that triggered it could be multifaceted.
There has been a debate on the role that the 2007−2010 drought has played in the crisis. It was the worst drought in the instrumental record, causing widespread crop failure, which left a million small farmers unemployed and caused mass migration of farming families to urban centres. Century-long observed trends in precipitation, temperature and sea-level pressure, supported by climate model results, strongly suggest that anthropogenic forcing has increased the probability of severe and persistent droughts in this region, and made the occurrence of a 3-year drought, as severe as that of 2007−2010, two to three times more likely than by natural variability alone.
Kelley et al. (2015)49 conclude that human influences on the climate system are implicated in the current Syrian conflict, and show how the drought in Syria has exacerbated the pre-existing social vulnerabilities, as the water crisis, caused by decreasing winter rainfall and increasing temperatures, has been probably worsened by human-driven climate change.
Besides political causes, the drought, added to all the other stressors, helped kick things over the threshold into open conflict. In fact, along with climate change, the water shortage in Syria could be attributed to the unsustainable management of aquifers, which were excessively exploited, reaching the depletion of irrigation wells.
Serra (2015)50 argues that the desertification of the ecologically fragile Syrian steppe, a process that began in 1958 when the former Bedouin commons were opened up to unrestricted grazing, has led to a wider ecological, hydrological and agricultural collapse, and then to impoverishment of farmers and nomads, no longer able to support themselves. De Chatel (2014)51 frames the drought that struck north-eastern Syria in the context of rapid economic liberalization and long-standing resource mismanagement, and shows that the humanitarian crisis of the late 2000s largely predated the drought period as it has its roots in the absence of a strategy to tackle the rampant steppe’s ecological crisis, steadily unfolding over the course of 50 years of sustained mismanagement and that caused the system to lose its resilience before harsh climatic events. Indeed, fundamental political and economic motives rest behind the Syria crisis. Nevertheless, Oakley (2013) 52 notices that the catastrophic loss of crops, livestock, and rural livelihoods in the state in the years of drought leading up to the civil war created a large population of displaced and impoverished farmers.
Overall, the agriculture sector, which already consumes more than 80 percent of the available freshwater resources, will face considerable pressures to adjust to the new water constraints and to increased competition from higher-value use of water,
49 Kelley, Colin P.; Mohtadi, Shahrzad; Cane, Mark A.; Seager, Richard; and Kushnir, Yochanan. 2015. Climate change in the Fertile Crescent and implications of the recent Syrian drought. Proceedings of the National Academy of Sciences of the United States of America, vol. 112 n. 11.
50 Serra G. 2015. Over-grazing and desertification in the Syrian steppe are the root causes of war. The Ecologist.
51 De Chatel, Francesca. 2014. Research article: The role of drought and climate change in the Syrian uprising: Untangling the Triggers of the Revolution. Journal of Middle Eastern Studies, Volume 50, Issue 4.
52 Oakley E. 2013. Climate change and Syria Crisis. ICE case studies number 293, December, 2013. Available at: http://www1. american.edu/ted/ICE/syria-jordan.html.
including potable water for an ever-increasing population, and may have, in some circumstances, to release part of its water allocation.
The ultimate outcome of the impact of climate change on agriculture and food security in NENA will depend on the way countries manage their natural resources and prepare for the adaptation of water and the agriculture sector to climate change.
Adaptation to Climate Change in the Water and Agriculture Sector: Evidence Base and Country Experiences
Addressing climate change impacts on the water and agriculture sector in NENA will require the implementation of a set of integrated interventions on the supply and demand side and on the incentive framework governing agriculture water management, as well as measures to support local adaptation in the agriculture sector and to boost investment to improve productivity and smallholders’ income (Box 4).
Box 4: Agricultural water and climate change adaptation: A perspective from the Intended Nationally Determined Contributions (INDCs)
The countries in the region are well aware of the intricate relations between food security, water and climate change. The majority of NENA countries consider climate change to be a major threat to their food security and the agriculture sector. Their foremost priority is adaptation to climate change, according to the analysis of pledges made by countries at the COP22 agreement. Most countries have included water in their intended nationally determined contributions and highlighted extreme events like drought as their central adaptation challenge. Several countries, such as Algeria, Jordan, Mauritania, Morocco, Sudan, Syria and Tunisia, all highlight the threat of climate change to their water security.
The adaptation measures pledged in the INDCs include a mix of interventions to improve water efficiency, water productivity and institutional reforms:
(i) modernization of the irrigation systems through massive conversion of old schemes;
(ii) changing cropping patterns and farm irrigation systems, including conversion of grain crops to fruits and vegetables;
(iii) developing new water resources through rainwater harvesting, desalination and treated wastewater recycling;
(iv) tapping deep groundwater reservoirs;
(v) introducing new varieties of crops that use less water and are salt-tolerant;
(vi) reforming institutions and water pricing;
(vii) artificial refilling of aquifers; and
(viii) expansion in renewable energy as a source to supply water systems.

17
Acting on the supply side of water management
Improving agricultural water efficiency Modernization of irrigation schemes and strengthening of the related institutions in the NENA region have significantly increased agricultural water efficiency and productivity over the last decades. Water efficiency in Egypt, Jordan, Lebanon, Morocco and Tunisia is particularly high when compared to other regions and is improving as countries shift to more sophisticated irrigation systems. Egypt, Iran (Islamic Republic of), Morocco and Saudi Arabia have the largest superficies under pressurized irrigation. In Tunisia, irrigation efficiency (water arriving at the field divided by abstraction) reaches 90 percent in the modern pressurized system compared to 60 percent in the old gravitation system53. Both physical crop water productivity (kg/m3) and economic crop water productivity are also relatively high compared to other regions. Economic crop water productivity across all systems in NENA is five times the world average and two times the world average for pressurized irrigation.
Despite these good performances, there is still a significant scope for improving irrigation efficiency and productivity throughout the region through large-scale adoption of modern irrigation techniques. In Egypt’s Nile Delta region, for example, the scope for improvement is large given that now only 35 percent of the irrigated areas are equipped with drip and sprinkler schemes, and these areas are mostly located on new converted lands. Morocco is envisaging a massive conversion of the old schemes to sprinklers and drip irrigation. There is also scope for improving physical water productivity through improved soil and water management, change cropping patterns and further intensification.
Sustainable groundwater managementGroundwater accounts for more than 50 percent of the irrigation sources in Algeria, Iran (Islamic Republic of), Libya, Morocco and Yemen and is almost the only source of irrigation in the GCC countries54. The groundwater revolution experienced with the introduction of the tube well and the individual motorized pump technology led to a boom in private irrigated agriculture. The groundwater revolution was behind the large increases in agricultural production and exports in many countries, including Morocco, Saudi Arabia, Syria and Tunisia. The expansion of groundwater irrigation has been supported by favourable government policies and intervention, including through energy subsidies, tax free imports and the total absence of regulations. These policies have resulted in the depletion of groundwater resources throughout the region and in sharp
53 FAO. 2015. Towards a Regional Collaborative Strategy on Sustainable Agriculture Water Management and Food Security in the Near East and North Africa Region. Second Edition.
54 World Bank. 2007. Making the most of scarcity: Accountability for better water management results in the Middle East and North Africa. MENA development report. Washington, DC, World Bank. Available at: http://documents.worldbank.org/curated/en/353971468280764676/Making-the-most-of-scarcity-Accountability-for-better-water-management-results-in-the-Middle-East-and-North-Africa.
inequalities in the access to water, as the wealthier with the means to invest in more sophisticated equipment are more likely to win “the race to the bottom”. Countries have experimented with different approaches for regaining control of groundwater resources. Morocco, for example, has experimented with an innovative contractual approach for the management of its aquifers (Box 5).
Box 5: Morocco experience with groundwater resources
Overextraction of groundwater by half has led to progressive lowering of the water tables and to unsustainable patterns of groundwater use. Estimates by the Ministry of Water indicate that 833 million m3 of water is extracted from Morocco’s aquifers every year without being replenished. In extreme cases, overextraction reaches 250 percent of the sustainable level of extraction.
The current status of management and use of groundwater is not only unsustainable, it also raises important equity issues with regard to the access to water. It is necessary to address problems of governance, and through the active involvement of all stakeholders, particularly water users, in order to find solutions to the most pressing issues and identify priority response measures. Different strategies are being discussed at national and local level, with emphasis on a contractual approach with farmers – the ‘contrat de nappe’. The 1995 Water Act is currently under review. Among the main objectives of the review is the strengthening of the institutional framework and participatory groundwater management via such aquifer management contracts.
FAO works actively with Morocco to design a possible governance mechanism that could lead to inclusive and sustainable water management in the area of Berrechid, one of the most intensely exploited aquifers. During 2015, the river basin authority facilitated a series of consultations that led to a draft aquifer contract. The proposed action plan is structured around four areas: (i) development of the supply of water resources through the mobilization of surface water; (ii) demand management through improving the quantitative and qualitative management of water resources in a water savings target and mitigate pollution factors; (iii) improving the monitoring of the web network; and (iv) development of training and communication among stakeholders.
The development and implementation of the agreement and its action plan will require a wide range of measures and instruments of different kinds, including those likely to address governance issues that contribute to overexploitation of the aquifer. The only use of technical instruments may not bear fruit if the dynamics and relationships between the different actors, both governmental and nongovernmental, whose interests and activities may overlap, are not considered. The design of these instruments and their implementation requires the involvement and participation of all relevant stakeholders (river basin agencies, agriculture, energy, environment, earth and, most importantly, processors, farmers, landowners and their tenants).
Climate change is likely to compound the existing situation through reduced recharges and runoffs if the current trends in the management of groundwater resources are not reversed with significant risks for food security and farmers’ incomes, in particular for smallholders who are likely to be impacted the most. The experience in the region – in particular in Jordan and Morocco – and best international practices point to the importance of key governance reforms for successful management of groundwater resources: (i) water right-based regulation system involving all the stakeholders in a transparently regulated

18
process; (ii) decentralization of groundwater management to the local level; (iii) incentive systems to favour the protection of the groundwater resources; and (iv) a strong water monitoring and information-sharing mechanism.
Water supply-augmenting optionsWater supply-augmenting options, including the reuse of wastewater, desalination of seawater and the purification of brackish groundwater, present significant potential for further increasing water supply. Worldwide, 40 percent of water withdrawn returns to the hydrological cycle in the form of used water. Treated wastewater can provide a valuable source for agricultural production. Currently, wastewater accounts for only 2 percent of all water withdrawals. Expanding the use of treated wastewater would require important investments as well as overcoming the institutional and cultural obstacles to its use in the agriculture sector.
Desalination of sea water could provide a stable source of water for agricultural production and is probably a solution for the future. The cost of desalinization has been going down, thanks to innovations in the desalinization process and to the expansion in the use of renewable energy. In the region, Morocco is the most advanced country in the use of desalinization for agricultural production. However, Morocco’s experience is too fresh to allow for a significant assessment.
The country is investing in the development of desalination plants to increase water resources in coastal areas. The largest desalination plant in Morocco is the Laayoune Desalination Plant, whereas the national policy regulating the sector is the National Water Strategy (Object 2030) which has been implemented from 2009. The above-mentioned policy is structured around the following six pillars:1. Water demand management and valorisation of water resources2. Management and development of water offer3. Preservation and protection of water resources, natural habitats
and fragile areas4. Reduction of the vulnerability to natural water risk and adaptation
to climate change5. Continuation of the legislative and institutional reforms6. Upgrading information systems and capacity building and skills
Brackish water also has potential for certain animal feeds. Mixed with freshwater, it can be used for certain crops.
Solar energy provides an affordable technological solution for water harvesting in areas where there is significant rainfall, such as in Jordan, where rainwater is dispersed over a wide area and, if properly collected, could provide a significant addition to the water reserves of the country.
Adaptation in the water demand management
Improving agricultural Economic Water Productivity (EWP)Measures to improve agricultural water efficiency will not translate into more sustainable management of water without
bold interventions to curb the demand for agricultural water and improve EWP (the economic return per drop of water). Throughout the NENA region, however, there is a disconnection between the reality of water scarcity and the demand for agricultural water. Despite progress in transferring to farmers the costs of irrigation, the full economic, social and environmental cost of water is not yet internalized at farm level and farmers have almost an unrestricted access to water for crop production. In Egypt’s Nile Delta, for example, farmers may be restricted in their production because of small land plots, but water is relatively abundant enabling farmers to grow two to three crops a year. In Jordan’s highlands (Karak Governorate), four crops with the lowest calculated EWP (wheat, olives, barley and tomatoes) consume 95 percent of all the blue water in the region.Figure 21 shows the almost inverse relation between EWP and crop water consumption.
Figure 21: Economic Water Productivity (USD/cm3) and green and blue crop water consumption (million cm3/year) of main crops in Egypt, 2007-2011
Source: Elbehri and Sadiddin 2015
The five crops that consumed the most water in the period 2007-2011 are those with the lowest EWP. The disconnection between the existing water policy and the increasing problem of water scarcity is unsustainable and called for urgent long-term corrective policy, in the context of climate change.
The concept of EWP could be a powerful guide for agriculture investment and sustainable agriculture policy. Improving water productivity (EWP), may require a shift in the crop patterns away from water-thirsty crops, the diversification of the agricultural production and the integration of agriculture and livestock and agriculture and aquaculture.
Farmers will not, however, embraces rapidly new cropping systems without proper incentives and an adequate institutional framework. The introduction of partial or integral water-pricing systems coupled with water quota measures can lead to significant improvements in EWP by

19
inducing farmers to switch to crops with high return value per unit of water and even to reduced consumption of water.
Jordan’s experience with water pricing illustrates these potential benefits. Jordan implemented water pricing policies 55and managed to reduce agricultural groundwater abstraction in the highlands to a rate close to the annual recharge. Water pricing alone is insufficient. Jordan’s experience includes also other measures to improve water management at farm level such as conservation agriculture and supervised wastewater irrigation. Jordan has also put other instruments into place such as an early warning system for drought and insurance schemes.
The full implementation of the pricing system will also require investments to remove barriers to adoption of modern efficient water technologies and to compensate farmers for possible income losses.
Governance and institutionsUltimately, farmers’ behaviors and decisions will make the difference in terms of speed of adaptation to climate change and to policy reforms. Governance and institutions play a critical role in enforcing polices, shaping behaviors and in resources allocations. Best practices show that in addition to the appropriate incentives systems, improvement in agriculture water governance system will pass by the decentralization of water management and by enhancing the role and institutional capacity of water users’ associations and producers’ organizations56. It also requires, on one hand, building a strong evidence base on water availability, water uses, water efficiency and productivity and on the impacts of climate change and, on the other hand , building the appropriate institutions and mechanisms that enable farmers and private sector participation in the policy formulation, decisions and target setting at local and national levels. While there are a number of positive experiences in improvement of governance in the region, in particular through decentralization, a comprehensive agenda to reform the governance of the agriculture water, taking into account the imperatives of sustainability, efficiency and equity is needed to adapt to climate change.
Climate change and local adaptation in agriculture
Developing effective adap production tation responses to climate and hydrological impacts in the NENA region requires integrated actions encompassing various scales, from the plot, farm, and landscape, up to national and supranational levels57. Adaptation measures to optimize water use and improve farming resilience at farm level can be grouped into three categories: (i) intensification of agricultural production, i.e. increasing crop and livestock
55 Water pricing through bylaw no. 85, 2002. Irrigation in the Jordan valley: Are water pricing policies overly optimistic?. Francois Molle, Jean-Philippe Venot, and Youssef Hassan. Agricultural Water Management Journal, 95 (2008) 427–438. Available at journal homepage: www.elsevier.com/locate/agwat.
56 FAO. 2015. Towards a Regional Collaborative Strategy on Sustainable Agriculture Water Management and Food Security in the Near East and North Africa Region. Second Edition.
57 Howden, S., J. Soussana, F. Tubiello, N. Chhetri, M. Dunlop and H. Meinke. 2007. Adapting agriculture to climate change. PNAS, 104 (50): 19691–19696.
productivity; (ii) diversification of farming activities, including crop-livestock/fishery integration; and (iii) adoption of improved farm and water management techniques.
For example, Jordan adopted the National Climate Change Policy and Sector Strategic Guidance Framework (2013-2020), whose objective is to build the adaptive capacity of communities and institutions in Jordan, with consideration for gender and addressing the needs of vulnerable groups, to increase the resilience of natural ecosystems and water as well as agricultural resources to climate change, and to optimize mitigation opportunities. The national priorities and the pillars of the Climate Change Policy are adaptation to climate change and mitigation of greenhouse emissions, with emphasis on adaptation as the imperative track58.
Optimal cropping and livestock management under increased water scarcity and climate variability include possible shifts from water-intensive cropping to adapted dryland crops, supported when appropriate with supplemental irrigation. Cropping decisions within a particular area will have to consider not only water availability but also true economic water costs and economically optimal water allocation. For location suitable crops, climate-adapted crop management includes cultivar choice (assuming an active crop research programme), appropriate planting dates in line with prevailing rotations and economically efficient irrigation possibilities. In other cases, the shift away from crops and into mixed grazing livestock may be more appropriate. Still in other cases (like the Nile Delta) aquaculture can play an important role as part of an income diversification strategy, while integrating fish farming with rice production has been attracting the interest of many rice farmers.
Adaptation options for livestock include pastoral restoration and diversification of grassland species, e.g. agroforestry with fodder trees and legume shrubs to provide alternate feed resources. Animals with higher adaptability, such as camels and sheep (e.g. Awassi race), should be promoted. Building resilient livestock systems in dry and semi-dry areas requires the promotion of best practices, including adjusting animal movement cycles, modifying feed compositions and implementing adaptive health interventions. Chicken farming, which is less vulnerable to climate change, is an important diversification option and critical for food security and household incomes.
Boosting smallholders’ and productivity incomes: The role of agricultural investment, research and extension
Climate change impacts and the escalation of water scarcity will unavoidably be accompanied by the reconfiguration of parts of the rural and urban economy, leading to local disruptions, some of which may prove irreversible. Smallholders, who provide the bulk of the agricultural production in NENA and are one of the most important groups of poor, are particularly vulnerable to the impact of climate change because of their limited adaptation
58 Ministry of Environment of Jordan. The national climate change policy of the Hashemite Kingdom of Jordan 2013-2020. Amman.

20
capacity, stemming from the small size of their holdings and the limited alternative solutions offered by their environment. Women who constitute more than 40 percent of the agriculture labour force in the region are the most at risks of losing their incomes as a result of changes in climate patterns.
The adaptation measures described in the previous section can help mitigate the impact of climate change on farmers’ incomes and agricultural production, but smoothing the transformation and the transition of water and the agriculture sector, under climate change conditions and in the context of NENA’s increasing population and youth unemployment, will require a boost in investments at farm, national and regional levels.
The modernization of the irrigation system, a shift to new farming systems, the adoption of new agricultural practices and the development of new markets will require the implementation of appropriate incentive systems to accelerate the pace at which farmers adopt innovations. It will also require from farmers the acquisition of new skills, including soft skills to get the best from the new technology. Investment decisions to enhance agricultural productivity and build resilience to climate change will vary from country to country and subregion to subregion. For countries with large agricultural potential, significant amounts of investments in agricultural diversification (towards adapted crops and animal systems), promotion of sustainable technologies and efficient water-management technologies and secure market infrastructures are critical. For countries with limited agricultural potential, the emphasis will be on diversifying rural economies and preparing farmers for alternative livelihood options. Still some countries see the benefit of investing abroad to secure food production and imports.
Public policy and investments should focus on long-term options such as breeding feed crops and forages that have higher water-use efficiency and are more resistant to salinity, but also more tolerant to drought and higher temperatures. Besides “hard” investments in water supply technologies and physical infrastructure (i.e. flood water-harvesting infrastructure), investments can also be “soft”, requiring adaptation planning, more reliable information, market developments and institutional reforms59.
While farmers will devise their own solutions based on their accumulated experience, part of the solution to increase agriculture and water productivity will come from research. Investment in Research and Development (R&D) and in extension will play an important role in promoting and upscaling solutions tailored to the various farming systems as more evidence becomes available.
Investments in the modernization, adaptation and incentives may not be enough for farmers to fully absorb the wave of shocks likely to be unleashed by the impact of climate change.
Social protection interventions will need to be scaled up to support the transition towards a more productive and water-efficient agriculture sector in NENA.
59 De Fraiture, C.; D. Wichelns. 2010. Scenarios for meeting future water challenges in food production. Agricultural Water Management 97(4): 502–511.
Making Social Protection Work for Building Resilience to Climate Change and Water Scarcity
The impact of climate change on water resources will reverberate throughout the economy and may translate into huge economic and social costs for the region60. Even with sound adaptation strategies, plans and investments, not all the farmers will be able to absorb the shocks stemming from increased aridity and droughts and higher food prices. Policies and investments aimed at modernizing water irrigation schemes and improving water management and agricultural productivity will need to be complemented by social protection measures to build resilience of farmers and other vulnerable rural populations.
The region has long experience in social protection. Originally designed as part of a wider system of state interventions in agricultural production and food security, the predominant modality of the social protection scheme has been universal fuel and food subsidies, the latter being aimed at providing basic food commodities at fixed and affordable prices. However, it is estimated that 47 percent of the population of the region is not covered by any social protection or labor benefit scheme 61 and only a little over 40 percent of the rural populations are covered62 under the existing schemes. Moreover, social protection rarely reaches agricultural and informal workers and refugees.
In addition to being fiscally unsustainable, the existing social protection mechanisms are also regressive, benefitting the rich more than the poor. Recently, most countries have embarked on reforms of their social protection policies taking advantage of the fall in oil prices.
Reform of the social protection system in NENA needs to take into account the specific risks faced by the rural population and in particular the risks arising from the mismanagement of natural resources and climate-induced risks, especially droughts and floods, as well as the needs associated with the adaptation of the agriculture sector to climate change and water scarcity. Some countries in the region are already implementing weather-based crop insurance, which is aimed at protecting household assets and strengthening farmers’ resilience and adaptive capacity.
Morocco, for example, introduced a climate multiple-risk insurance scheme, which is dedicated to cereal crops and pulses. The scheme is part of a wide range of insurance products that aim to ensure stable incomes for farmers confronted with shocks. It covers the entire Moroccan territory against major climatic-induced risks, including droughts, floods and sandstorms. The climate multi-risk insurance is part of a strategy to protect farmers against major climate hazards for nearly 80 percent of the total cultivated area. A drought early warning system has been developed as part of the strategy which also includes a safeguard programme for livestock facing rainfall shortage.
The need to address the vulnerability of the rural sector to 60 World Bank. 2015. Impact of climate change on water.61 World Bank Aspire indicators – Dashboard for Middle East and Africa.
Available at http://datatopics.worldbank.org/aspire/region/middle- east-and-north-africa.
62 FAO, SOFA 2015. The State of Food and Agriculture 2015: Social protection and agriculture: breaking the cycle of rural poverty. Available at: http://www.fao.org/3/a-i4910e.pdf.

21
climate change and to make the agriculture sector more responsive go beyond the food subsidy and climate risks insurance. It encompasses the need to extend the social security and pensions system to family farming, which is carried out by ageing populations to allow a smooth transition between the old and the new generations of farmers, with possible positive impacts on productivity and employment and reduction in migration flows. It also encompasses a social protection scheme to support an exit strategy from the agriculture sector, when farming is no longer sustainable. Social protection should be an integral part of the agricultural and rural development plans and should not be seen merely as a poverty alleviation tool or humanitarian relief mechanism. Programmes must take into account women’s role in household food security and women’s burdens particularly in post-conflict regions where women contribute significantly to rural agriculture.
Cutting Food Losses and Waste
A substantial reduction in Food Losses and Waste (FLW) is a pressing imperative in NENA more than in any other region in the world, not only to reduce costs and waste of food but because of the scarcity of water and the dependency of the region on outside food supply. Cutting FLW could also provide a quick win-win adaptation measure to climate change impacts.
FLW in NENA are estimated at up to 250 kg of food per person per year, or about one-third of food available throughout the supply chain, totaling USD 60 billion annually63. Estimates of water losses resulting from FLW are more severe for NENA than for any other region. The annual blue water footprint of FLW in North Africa and West and Central Asia is estimated at 42 km3(64), more than 17 percent of the global blue water footprint. The per capita blue water footprint of 90 m3 in NENA far exceeds the water loss of any other region, and represents the double of the closest region. For certain countries, the water losses embedded in FLW exceed available resources; namely, Kuwait (595 percent of the national renewable water resources), Saudi Arabia (115 percent) and UAE (222 percent)65. These figures point to non-sustainable use of water in the food supply chain from production to consumption.
Although the bulk of water use in agriculture occurs during production, significant amounts of water are used and potentially lost during washing, cooling, processing, etc. Studies on water use (withdrawals) for a selection of food industry processes found that fruit canning uses 2.5-4 m3/tonne, vegetable canning 3.5-6 m3/tonne, milk processing 1.5 m3/tonne, meat processing 45-65 m3/tonne and bread making 1.8-4 m3/tonne66. Better washing techniques, water management, 63 FAO. 2011. Global food losses and food waste – Extent, causes and
prevention. Rome (also available at: http://www.fao.org/docrep/014/ mb060e/mb060e.pdf).
64 FAO. 2013. Food Wastage Footprint: Impacts on Natural Resources. Technical Report available at: http://www.fao.org/nr/sustainability/ food-loss-and-waste/en/.
65 Kummu, M., de Moel,H., Porkka, M., Siebert, S., Varis, O., and Ward, P.J. 2012. Lost food, wasted resources: Global food supply chain losses and their impacts on freshwater, cropland, and fertilizer use. Science of the Total Environment, 438, 477-489.
66 FAO. 2013. Food Wastage Footprint. Available at: http://www.fao.org/nr/sustainability/food-loss-and-waste/en/.
recycling and purification of water are needed to reduce water wastage, alongside preventing loss and waste of food itself.
Wastage of food at consumer level in the region is also among the highest in the world. Complex economic, cultural and social factors play a role in wastage of food.
In a context of scarcity and rising costs of water, water productivity in NENA is an important consideration for agribusinesses or value chain actors in making informed decisions about investing in expanding value addition in a sustainable and profitable manner.
Investment and R&D in agriculture have traditionally favoured production, but NENA countries are increasingly focusing on post-harvest and FLW in the context of value chain development and promoting sector competitiveness. A major limitation for programming and policy has been the lack of data on FLW, however. More and better data on the magnitude and causes of FLW throughout the food supply chain must remain a priority for designing tailored solutions and shielding NENA from variability in supply due to FLW.
The causes of FLW in NENA relate, in particular, to traditional distribution systems, lack of technology or improper usage, lack of coordination among value chain actors and low integration of small-scale producers in value chains. Weakness and lack of infrastructure is a major contributor to FLW in NENA, and a barrier to achieving the food quality and safety standards demanded by markets. Wholesale and retail markets are often small, overcrowded, unsanitary and lacking cooling equipment and adequate facilities for loading, unloading, ripening, packaging and temporary storage67. Sufficient and reliable cold chain infrastructure is lacking, especially given increasing consumption of perishable horticulture, dairy and meat products; for example, the cold storage capacity of 0.122 m3
per capita in Tunisia, 0.053 m3 in Morocco and 0.066 m3 in Algeria fall far behind the 0.262 or 0.344 m3 per capita found in Germany and the United States, respectively68. Traditional dry storage systems are widely used in many countries, exposing cereals to heat, pests, moisture or spillage.
FLW reduction is rising on the agenda of the NENA countries and is considered a feasible way of strengthening food systems and food security. FLW is particularly important for import-dependent, affluent countries such as the GCC. Awareness and advocacy for FLW reduction in NENA countries are driving efforts towards action. For example, Oman’s Sustainable Agricultural and Rural Development Strategy integrates crop and livestock FLW reduction as an intermediate step to enhancing sector competitiveness, with baselines to be set for targets to 2040. The Saudi Arabia Food and Nutrition Security Strategy currently being developed is giving focus to losses in local and import food supply chain as well as waste at the consumer level.
Momentum is building further as SDG 2 on sustainable
67 FAO. 2012. Role of Agro-industry in Reducing Food Losses in the Middle East and North Africa Region, by A. Kader, L. Kitinoja, A. M. Hussein, O. Abdin, A. Jaberin, and A. E. Sidahmed. FAO/RNE, Cairo, Egypt.
68 FAO. 2014. Policy Brief on Developing the Cold Chain for Agriculture in the Near East and North Africa (NENA) for reducing food loss and waste in the Near East and North Africa. Available at: http://www.fao. org/3/a-ax746e.pdf.

22
production and consumption sets a target for halving the per capita global food waste at the retail and consumer level by 2030 and reducing food losses along production and supply chains, including post-harvest losses. In this context, the 32rd session of the Near East and North Africa Regional Conference (NERC-32) adopted a Regional Strategic Framework for Food Losses and Waste Reduction in the Near East and North Africa Region (NENA Strategic Framework). The Framework can serve to guide action and support for FLW reduction in line with achieving the SDGs. Since its adoption, a growing number of initiatives at country level have been launched and several initiatives are underway with FAO support to build the evidence base for FLW reduction and design action plans in line with national agriculture sector strategies.
Building on the existing momentum, the way forward is developing coherent, evidence-based plans for FLW reduction, aligned with national strategies and agriculture sector development and climate change adaptation plans in consultation with all concerned stakeholders from production to consumption, and across disciplines (nutrition, education, health, industry, etc.). FLW is a consequence of how food systems function technically, economically and culturally, therefore solutions go hand-in-hand with value chain development and increased value addition, leading in turn to positive outcomes for some of the greatest challenges in the NENA region; employment creation especially for youth and women, income generation for family farmers and small-scale agribusiness, better and higher quality food products to meet growing demand in urban areas, more sustainable use of natural resources and more safe and good quality food available for rapidly growing populations.
The way forward encompasses stronger awareness-raising campaigns to reduce food wastes at consumption level and the other major source of food losses, a measure which has been elevated as a priority by many countries.
With over 30 percent of all FLW in the region estimated at the consumption stage alone, initiatives from the UAE show efforts to raise awareness against a backdrop of cultural and social habits of consumers. The “I’MPERFECT campaign”, launched in 2015 by the Ministry of Climate Change and Environment with the support of FAO, aims at using fruits and vegetables of imperfect shapes or sizes, though of no compromise in nutritional value to reduce food waste and increase food surplus. The campaign also aimed to highlight the importance of food safety, irrespective of imperfectly-shaped produce, and the sustainability of local production, as well as the hierarchy of waste management, from waste reduction, to reuse, segregation and recycling.
“Food Forward UAE”, another national initiative, aims at channeling food in excess/surplus from households and social events to delivery mechanisms that reach those in need.
Civil society bodies, like the General Women’s Union in UAE, promote sustainable consumption, including through nutrition education in schools, while the Dubai municipality Food Safety Department is promoting the “Grow your Food Campaign” to promote a culture of freshness and healthy living by encouraging the residents to grow their own vegetables and herbs.
Additionally, and within the strong hospitality sector in the country, roundtable discussions among hotels and caterers were launched on the occasion of World Food Day 2014, highlighting such best practices and citing awareness raising in schools and over the long-term as necessary to change consumer habits and reduce waste.
Promoting Sustainable Consumption Patterns
Consumption patterns in NENA are shifting as a result of increases in income, rapid urbanization and large youth populations prone to adopting more ‘Westernized and universally available diets”. More than any other region, NENA needs to pay serious attention to its pattern of consumption and to find a balance that can have positive implications for the use of natural resources and help reduce the import bill, while at the same ensuring the available, affordable and nutritious food for the population, in particular the poor.
Recent studies found that the intake of protective food, fruits and vegetables, for which the region consumes less water, is well below the recommended levels, while consumption of cereals, for example, is among the highest in the world, on average over 50 percent of daily per capita energy intake with greatest levels in Egypt and Morocco at 62 and 58 percent, respectively, compared to just 28 percent in the European Union69. Yet, bread waste at the consumer level alone reaches up to 20 percent in selected NENA countries (Algeria, Egypt, Lebanon, Morocco and Tunisia)70 and is estimated at 30 percent overall, signaling a consumption imbalance with fiscal, environmental and nutritional impacts71. Wheat in particular highlights the complexity of the issue of promoting sustainable consumption patterns, as it relates to cultural norms, traditional diets, socio-economic status, social protection, especially food subsidies, and policy to achieve self-sufficiency in wheat production despite the water constraints.
Promoting sustainable consumption patterns require a set of integrated measures and intervention which should include nutrition education, incentives and disincentive policies, as well as a nutrition perspective on agricultural production strategies and investment. The experience of Egypt’s smart card system is a good example of an integrated approach, since by incentivizing consumers to acquire only the bread they need, actors along the chain respond with better management of the supply chain thus meeting simultaneous objectives of social protection, sustainable consumption and reducing food waste. Egypt’s delivery of
69 FAO and EBRD, 2015. Egypt, Jordan, Morocco and Tunisia key trends in the agrifood sector by Nuno Santos, Economist, Investment Centre Division, FAO and Iride Ceccacci, Food Security Economist, EBRD. Available at: http://www.fao.org/3/a-i4897e.pdf.
70 Roberto Capone, Hamid El Bilali, Francesco Bottalico. 2016. Assessing the Sustainability of Typical Agro-Food Products: Insights from Apulia Region, Italy. Available at: https://dialnet.unirioja.es/servlet/articulo?codigo=5428199.
71 FAO. 2011. Global food losses and food waste – Extent, causes and prevention. Available at: http://www.fao.org/docrep/014/mb060e/mb060e.pdf).

23
social programmes is using smart-cards technology72. The e-Family Card for Tamween distribution (food stamps) was launched as a new subsidized bread distribution system across the country in July 2014. The system uses point of sale terminals at all bread distribution points across Egypt and bread is distributed through a smart family card. The system insures that bread is distributed to its rightful beneficiary through the use of the family card and using the beneficiary’s personal identification number (PIN). Bakers now pay the full price of the flour from the warehouses and they receive their daily cash subsidy after reporting the amount of bread sold. Currently, 10 million families receive their subsidized bread through smart-card automated process in 28 governorates. There is a discussion underway to extend the same infrastructure for other subsidies such as subsidized fuel.
Promoting traditional diets and indigenous foods is another approach, such as with the Mediterranean diet, that supports sustainability through local and seasonal foods and more balanced diets, and counters the effects of ‘Westernization’ of diets in terms of health and human nutrition.
The Role of Trade Policy in Climate Change Adaptation in NENA
Given the high dependency of the region on food imports, trade and trade policy should be part of any coherent adaptation strategy that insures both food and water security. The trade and imports are already important components in national and regional food security, but the role of trade is likely to increase in terms of importance, complexity and risk. The NENA region will need to review both its exports and imports strategies in a way to alleviate its water scarcity and improve its food security.
Trade can play a crucial balancing role between regions with contrasting water-use efficiency. The production of 1 kg of grain requires about 1 000 litres of water in some areas and 5 000 litres in others. Trade can help smooth out these water-use efficiency differences and can help alleviate water scarcity. For the NENA region, a water-smart trade policy should prioritize food imports for highly water-intensive food sourced from water-abundant regions. However, increased dependence on imports to meet food needs will also increase risks of exposure to higher market and price volatility which is expected to result from climate change73.
Climate-adapted trade policies also may dictate optimal export choices in the context of water-scarcity management. Trade-oriented supply chains that rely on intensive use of irrigated water cannot be considered sustainable in the long run. Countries of the NENA region have developed export markets that consume huge amounts of scare water which
72 World Bank 2014. South-South Learning Forum, Social Protection and Labour, Payments and Transactions session. Available at: http://www.worldbank.org/content/dam/Worldbank/Event/social-protection/Payments_and_Transactions_Session_Packet.pdf.
73 Elbehri, A, Elliott, J. and Wheeler, T. 2015. Climate change, food security and trade: an overview of global assessments and policy insights. In A. Elbehri, ed. Climate change and food systems: global assessments and implications for food security and trade. Rome, FAO.
may not be sustained in the long run. For example, in Egypt current export mixes do not price-in the cost of scarce water resources. Consequently, rice and sugarcane consume a disproportionate amount of water given their share of export value-added. Rice represents 35 percent of water consumed, but contributes only 14 percent to the export value, while horticulture products that consume only 16 percent of agricultural water contribute 43 percent to the export value. The question of how to significantly adjust production chains and transition away from particular value chains or markets that consume scarce water will not be easily tackled in the short run and will require a slow transition into alternative land uses without seriously, and abruptly, disrupting too much commerce and revenues.
Irrigation availability is expected to drop in several major agricultural production river basins in the world by between 30 to 60 percent by 2030. This may result in a drop in agricultural production in parts of China, South Asia and the Near East74. Import diversification from countries with abundant water sources and high export potential is one such consideration.
From food self-sufficiency to self-reliance in NENA countries
For many years the priority given to self-sufficiency has overshadowed the importance of trade for food security in the NENA region. With the exacerbation of water scarcity and the increased dependency of NENA on food imports, countries of the region have been exploring a variety of solutions to strengthen their food security. The trade policies are gaining more importance in this context. Self-reliance, understood as the ability to pay for one’s own food bill, could be a better guide for food security in NENA. It emphasizes a country’s comparative advantage in the international market by producing and exporting products that are more in line with its resource endowment and importing those that are less so. Recent years have seen significant improvements in food export revenues in several NENA countries, mostly driven by an increase in exports of high-value crops. Indeed, fresh fruits and vegetable exports have boomed especially in North Africa countries and in Egypt. For instance, in 2015, Morocco and Tunisia were the world leaders in the export of dates and beans, supplying 20 and 18 percent of the global import demand for these products, respectively. In the same year, Egypt and Morocco were the fourth largest exporters of tomatoes and oranges, respectively.
Different Egyptian governmental agencies support exports and put forward policies for export promotion, which can have a positive impact on export growth. In 2000, the Egyptian Ministry of Trade and Industry developed the Export Development Strategy and identified export promotion as its priority. Under this strategy, new laws were established to promote export competitiveness and improve the coordination among ministries. Also, several entities were established to tackle specific barriers in trade, promote industrial transformation, and increase exports, such as the Export 74 Lenzen, M., D. Moran, A. Bhaduri, K. Kanemoto, M. Bekchanov, A.
Geschke and B. Foran. 2013. International trade in scarce water. Ecological Economics, 94:78–85.

24
Promotion Agency, the Egyptian Export Promotion Center (EEPC), Export Councils and the Egyptian Bank for Exports Development, among others. This Bank was established in 1983 to provide trade finance to exporters, including short- and medium-term loans and guarantees. It currently offers six financing programmes. For instance, its Agriculture Sector Development Programme provides export loans of up to EGP 5 million to agricultural companies. However, its current functions are more like other commercial banks75.
There is a similar scene in Morocco. The Maroc Export Centre was created in 1976, which supports Small and Medium Enterprises (SMEs) in the food products among others by providing business information and organizing promotional activities. The main objective of Maroc Export is to enhance the position of Moroccan products in international markets. It provides subsidies for exporters’ participation and grants of up to 85 percent of the cost of participation in international fairs and exhibitions. Maroc Export works closely with the national Foreign Trade Council (CNCE), the Moroccan Company of Credit Export Insurance (SMAEX), and the Moroccan Association of Exporters (ASMEX)76.
Tunisia launched an export development project (EDP1) in 1999 with support from the World Bank. The programme aimed at raising the level of the country’s exports and smoothing trade logistics. The programme was extended for a second phase in 2004. The programme provides support to all exporters, with a special focus on resident firms that export a part of their production. This programme was implemented by the Centre for Export Promotion (CEPEX). These kinds of export development programmes have increased Tunisian exports by more than USD 400 million from 2005 to 200977.
However, this evolution did not significantly change the overall trade balance of the region. In addition, it did not translate into significant savings of water as the additional farmland put to use to grow the new crops was not compensated by reduction in other land uses.
The notion of self-reliance and the corollary focus on comparative advantage should be considered in the light of the economic water productivity along the value chain. The promotion of a self-reliance strategy based on the economic water productivity supports a strategic shift towards more water-efficient and high-value crops. Assessing the comparative advantage of each country based on economic water productivity requires detailed analysis and evidence base. Recent FAO studies highlighted Jordan’s potential in vegetables and broiler meat for exports, and recommended the establishment of an agribusiness hub in the Jordan Valley with supportive policies and investment78. 75 African Development Bank. 2012. Comparative study on export
policies in Egypt, Morocco, Tunisia and South Korea. Available at http://www.afdb.org/fileadmin/uploads/afdb/Documents/Project-and-Operations/Comparative%20Study%20on%20Export%20Policies%20in%20Egypt%20Morocco%20Tunisia%20and%20South%20Korea.pdf.
76 Ibid.77 African Development Bank. 2012. Comparative study on export
policies in Egypt, Morocco, Tunisia and South Korea. Available at http://www.afdb.org/fileadmin/uploads/afdb/Documents/Project-and-Operations/Comparative%20Study%20on%20Export%20Policies%20in%20Egypt%20Morocco%20Tunisia%20and%20South%20Korea.pdf..
78 FAO. 2015. Jordan: Water along the food chain, an analytical brief of selected food chains from a water perspective. Rome.
Public and private partnership with adequate support policies can lead to dramatic increases in exports of agrofood products that are relatively water efficient and that can contribute to reducing the food deficit while adapting to climate change (Box 6). Expansion of NENA high-value products into global markets requires strong public-private partnership to overcome stagnant productivity, quality and food safety issues, limited access of the small- and medium-sized enterprises to credit, technology and extension, as well as addressing the insufficient infrastructure for transport and storage.
Box 6: Egypt Public-Private Partnership initiative
In 2006, the Government of Egypt adopted a new policy of promoting partnerships with the private sector to increase infrastructure investments, following the Ministry of Finance’s initiative to introduce a Public–Private Partnership (PPP) programme through the establishment of the PPP Central Unit within the Ministry79. In 2010, the Government adopted a law for regulating Partnership with the Private Sector in Infrastructure Projects, Services and Public Utilities . In the beginning of 2016 the head of the PPP announced that 12 government projects would be presented for international bidding as PPP ventures worth a total of up to LE 18 billion (USD 2.3 billion). The projects under discussion span several sectors including water desalination, sanitation, and recycling.
Regional Collaboration and Collective Action to Promote Sustainable Water Management and Adapt to Climate Change
Building regional capacity for climate modelling, early warning and assessments of climate impacts and vulnerability
Despite the accumulated evidence on the impacts of climate change, there are still large uncertainties on the ultimate manifestation of climate change, at regional, national and local levels. The adaptation plan and strategies will need to be continuously, monitored and improved in the light of the observations on the ground and new knowledge. Continued capacity development in the region for more refined impact assessments and policy analyses is critical to this process. Existing analyses and assessments require further testing and validation at the local or subnational level to generate sufficient details to make specific investment or policy choices. For example, strategic choices will have to be made as to which crops or livestock systems to promote and which to move away from. Appropriate adaptation options must be based on quantified assessments of risks and vulnerabilities carried out on the appropriate scale (including subnational or local).
For the water sector, vulnerability assessments require extreme climate risks, such as droughts and floods, to be taken into account. A clear communication to policy makers on these extreme events is required when they occur to avoid overstretching
79 Ismail, M.A.M. 2016. Globalization and new international public works agreements in developing countries.

25
existing and/or planned coping measures if they are not incorporated properly in the planning process. Efforts to produce more reliable predictions and the exchange of data and information related to regional and transnational assessments are highly desirable. A communication strategy to raise public awareness on water issues is equally important for policy implementation. Some NENA countries have the internal human capacity to carry out these assessments but others will need support.
The climate risk nexus initiative
In November 2015, the Council of Arab Ministers responsible for the environment, the Arab Water Council, and the economic and social council of the League of Arab States launched the Climate Risk Nexus (CRN) initiative. This is a regional initiative addressing food security, water scarcity and social vulnerability. It aims at building resilience and achieving the SDGs by address the challenges of climate-related risk and impacts on food security, water scarcity, social vulnerability and disaster risk in the Arab region. CRN will also help develop capacities of regional and local partners to address gaps that exist in achieving more risk-informed development and help to strengthen the resilience of vulnerable communities.
The Arab strategy for water security
The Arab strategy for water security was developed by the Arab Ministerial Water Council in 2009, in response to new variables in the levels of food and to climate change development and their impacts on the region. This is a long-term programme (2010-2030) aiming at achieving sustainable development that responds to future requirements, with key objectives related to: (i) economic and developmental aspect concerning water services for drinking, agriculture and sanitation; technology transfer; water management; and non-conventional water resources; (ii) political aspect regarding the protection of Arab rights to water in the occupied territories or waters shared with regional neighbours, promoting cooperation among Arab states for the management of shared water resources, and the implementation of the commitments of Arab states under the MDGs; and (iii) institutional development aspect linked to human and technical capacity development, promotion of social and individual awareness of water issues in the region, scientific research and the promotion of civil society participation in decision-making regarding environmental impacts, and other measures80.
The importance of regional coordination
Managing water scarcity in the NENA region and adapting to climate change to achieve the sustainable development agenda, and in particular SDG 2, requires the implementation of a comprehensive and inclusive national transformational agenda that aligns the agriculture, water, energy and trade policies and that promotes evidence-based policies, participation and good governance. It requires a great deal of regional cooperation, 80 ACCWAM. 2012. Arab Strategy for Water Security in the Arab Region to
meet the challenges and future needs for sustainable development 2010-2030. Available at http://www.accwam.org/Files/Arab_Strategy_for_Water_Security_in_the_Arab_Region_to_meet_the_Challenges_and_Future_Needs_for_Sustainable_Development_-_2010-2030.pdf.
including through sharing of data, analyses, knowledge and experience in order to identify more accurately best practices, policies and approaches that effectively improve water management, enhance food security and nutrition and promote sustainable agriculture. It will also require the development of regional programme to address common issues, such as droughts, as well as the establishment of mechanisms for regional or transborder management of shared water resources. This means that multi-sector policy coordination across strategies, scales and even regions is required. The Water Scarcity Platform promoted by FAO and the League of Arab States with other partners can provide an effective forum for exchange of knowledge, experience, South-South cooperation and even for laying the ground for more ambitious collective action.
Conclusion
Food security is a growing challenge for the NENA region. While the region has made strides in developing its agricultural production and in improving access to food, conflicts and protracted crises are threatening to reverse the gains made in its fight against poverty and hunger. Water scarcity and climate change are, however, potentially a more serious threat to food security and to the achievement of SDG 2 to eradicate hunger, improve nutrition and promote sustainable agriculture.
Countries in the region need to build on the vast experience they have accumulated to accelerate the adoption in the implementation of integrated approaches towards improving sustainably the management of water resources, and developing strategies to prepare for and adapt to climate change. Such strategies will inevitably include a mix of short- and medium-term tangible immediate effects and more structural interventions to support the long-term transition to a more efficient and sustainable water use and agriculture sector.
The elements of a framework for sustainable management of agriculture water resources and adaptation to climate changes include interventions to: i) increase agriculture water efficiency and productivity, reforming groundwater governance framework, ii) support investments in research and development and in the rural sector to boost agriculture productivity, iii) enhance and adapt social protection system to mitigate climate risks ,and iv) cutting food losses and wastes. It also includes medium and long term interventions to augment water supply including through desalinization, to promote more sustainable consumption patterns and to align the agriculture and the food trade policy with the principle of Economic Water Productivity.
Several countries already have sound water management and climate change adaptation approaches and interventions in place. In such a complex field, building the evidence base and sharing the knowledge among all stakeholders is key for successful reforms and plans. The region as a whole can greatly benefit from sharing knowledge, strategies and best practices in sustainable agriculture water management and climate change adaptation in agriculture. FAO and its partners can play an important role towards this endeavour.

26
1. ACCWAM. 2012. Arab Strategy for Water Security in the Arab Region to meet the challenges and future needs for sustainable development
2010-2030. Available at: http://www.accwam.org/Files/Arab_Strategy_for_Water_Security_in_the_Arab_Region_to_meet_the_Challenges_
and_Future_Needs_for_Sustainable_Development_-_2010-2030.pdf.
2. AfDB (African Development Bank). 2012. Comparative study on export policies in Egypt, Morocco, Tunisia and South Korea. Available at http://
www.afdb.org/fileadmin/uploads/afdb/Documents/Project-and-Operations/Comparative%20Study%20on%20Export%20Policies%20in%20
Egypt%20Morocco%20Tunisia%20and%20South%20Korea.pdf.
3. Capone, Robertom; Hamid El Bilali and Francesco Bottalico. 2016. Assessing the Sustainability of Typical Agro-Food Products: Insights from Apulia
Region, Italy. Available at: https://dialnet.unirioja.es/servlet/articulo?codigo=5428199.
4. De Chatel, Francesca. 2014. Research article: The role of drought and climate change in the Syrian uprising: Untangling the Triggers of the Revolution.
Journal of Middle Eastern Studies, Volume 50, Issue 4.
5. De Fraiture, C.; D. Wichelns. 2010. Scenarios for meeting future water challenges in food production. Agricultural Water Management 97(4):
502–511.
6. Elbehri, A, Elliott, J. and Wheeler, T. 2015. Climate change, food security and trade: an overview of global assessments and policy insights. In A.
Elbehri, ed. Climate change and food systems: global assessments and implications for food security and trade. Rome, FAO.
7. Elbehri, Aziz and Ahmad Sadiddin. 2015. Climate adaptation to water scarcity by the green sectors in Egypt, Jordan and Lebanon. FAO. 2015.
FAO-GIZ Project.
8. FAO. 2005. The nutrition transition to 2030 why developing countries are likely to bear the major burden. Available at: http:// www.fao.org/
fileadmin/templates/esa/Global_persepctives/Long_term_papers/JSPStransition.pdf.
9. FAO. 2011. Global food losses and food waste – Extent, causes and prevention. Rome (also available at: http://www.fao.org/docrep/014/ mb060e/
mb060e.pdf).
10. FAO. 2012. Role of Agro-industry in Reducing Food Losses in the Middle East and North Africa Region, by A. Kader, L. Kitinoja, A. M. Hussein, O.
Abdin, A. Jaberin, and A. E. Sidahmed. FAO/RNE, Cairo, Egypt.
11. FAO. 2013. Food Wastage Footprint: Impacts on Natural Resources. Technical Report available at: http://www.fao.org/nr/sustainability/ food-
loss-and-waste/en/.
12. FAO. 2013. Technical paper for reference on the Food Insecurity Experience Scale (FIES) survey, development of a global standard for monitoring
hunger worldwide. 2013. Available at: http://www.fao.org/fileadmin/templates/ess/voh/FIES_Technical_ Paper_ v1.1.pdf.
13. FAO. 2013. Food Wastage Footprint. Available at: http://www.fao.org/nr/sustainability/food-loss-and-waste/en/.
14. FAO. 2014. Policy Brief on Developing the Cold Chain for Agriculture in the Near East and North Africa (NENA) for reducing food loss and waste
in the Near East and North Africa. Available at: http://www.fao. org/3/a-ax746e.pdf.
15. FAO, SOFI, 2014. Available at: http://www.fao.org/publications/sofi/2014/en/.
16. FAO. 2015. Regional overview of food insecurity, Near East and North Africa. Available at: http://www.fao.org/3/a-i4644e.pdf.
17. FAO, SOFA. 2015. The State of Food and Agriculture 2015: Social protection and agriculture: breaking the cycle of rural poverty. Available at: http://
www.fao.org/3/a-i4910e.pdf.
18. FAO. 2015. Towards a Regional Collaborative Strategy on Sustainable Agriculture Water Management and Food Security in the Near East and
North Africa Region. Second Edition.
19. FAO. 2015. Available at: http://www.fao.org/news/story/en/item/382181/icode/.
20. FAO. 2015. State of forests in NENA. Cairo.
21. FAO. 2015. Jordan: Water along the food chain, an analytical brief of selected food chains from a water perspective. Rome.
22. FAO. 2016. FAOSTAT data. Available at: (http://www.fao.org/faostat/).
23. FAO. 2016. Syria situation report. Available at: http://www.fao.org/fileadmin/user_upload/emergencies/docs/SyriacrisisSitReport_ Apr2016.pdf.
24. FAO. 2016. Yemen situation report. Available at: http://www.fao.org/fileadmin/user_upload/emergencies/docs/FAO%20Yemen%20_%20
Situation%20Report%20-%20September%202016%20CLEARED.pdf.
25. FAO. 2016. Iraq agriculture and livelihoods needs assessment. Available at: http://www.fao.org/fileadmin/user_upload/FAO-countries/ Iraq/
ToR/FAO_Assessment1.pdf.
26. FAO and EBRD, 2015. Egypt, Jordan, Morocco and Tunisia key trends in the agrifood sector by Nuno Santos, Economist, Investment Centre Division,
FAO and Iride Ceccacci, Food Security Economist, EBRD. Available at: http://www.fao.org/3/a-i4897e.pdf.
27. FAO and EBRD. 2016. Egypt: Wheat sector review, by J. McGill, D. Prikhodko, B. Sterk, and P. Talks. FAO Investment Centre Country Highlights.
Rome.
28. Howden, S., J. Soussana, F. Tubiello, N. Chhetri, M. Dunlop and H. Meinke. 2007. Adapting agriculture to climate change. PNAS, 104 (50): 19691–19696.
29. IFPRI. 2014-2015. Global Food Policy Report. Washington, DC. See Chapter 7 of publication co-authored by Breisinger, C. Ecker, O.; Trinh Tan, J.F.
and entitled Conflict and Food Insecurity - How do we break the links. Available at https://www.ifpri.org/sites/default/files/gfpr/2015/feature_3086.
html.
30. IMF. 2014. Subsidy Reform in the Middle East and North Africa, 2014.
B i b l i o g r a p h y

27
31. Ismail, M.A.M. 2016. Globalization and new international public works agreements in developing countries.
32. Jawad, R. 2015. Social protection and social policy systems in the MENA region: emerging trends. UNDESA. US.
33. Kelley et al. 2015. Climate change in the Fertile Crescent and implications of the recent Syrian drought. Proceedings of the National Academy of
Sciences of the United States of America, vol. 112 n. 11.
34. Kummu, M., de Moel,H., Porkka, M., Siebert, S., Varis, O., and Ward, P.J. 2012. Lost food, wasted resources: Global food supply chain losses and their
impacts on freshwater, cropland, and fertilizer use. Science of the Total Environment, 438, 477-489.
35. Lenzen, M., D. Moran, A. Bhaduri, K. Kanemoto, M. Bekchanov, A. Geschke and B. Foran. 2013. International trade in scarce water. Ecological
Economics, 94:78–85.
36. Ministry of Environment of Jordan. The national climate change policy of the Hashemite Kingdom of Jordan 2013-2020. Amman.
37. Molle, Francois; Venot, Jean-Philippe; and Youssef Hassan. 2008. Irrigation in the Jordan valley: Are water pricing policies overly optimistic?
Agricultural Water Management Journal, 95 (2008) 427–438. Available at: http://econ2.econ.iastate.edu/classes/tsc220/hallam/MolleIrrigationJordan.
pdf.
38. Ncube, Mthuli; John Anyanwu and Kjell Hausken. 2013. Inequality, Economic Growth and Poverty in the Middle East and North Africa (MENA).
AfDB. Working Papers series N0 195. December 2013.
39. Oakley, E. 2013. Climate change and Syria Crisis. ICE case studies number 293, December, 2013. Available at: http://www1. american.edu/ted/ICE/
syria-jordan.html.
40. OCHA, 2016. Available at: https://fts.unocha.org.
41. OECD. 2016. http://www.oecd.org. 2016. See also FAO and EBRD, 2015. Egypt, Jordan, Morocco and Tunisia Key trends in the agrifood sector.
Available at: http://www.fao.org/3/a-i4897e.pdf.
42. RICCAR. 2015. Data cited in UNESCWA. 2015. Arab Sustainable Development Report – First Edition. Beirut.
43. Serra, G. 2015. Over-grazing and desertification in the Syrian steppe are the root causes of war. The Ecologist.
44. Talks, Peter. 2015. FAO and EBRD. Agricultural policies and institutions specialist. Agri-food Trade and Food Security in the Southern and Eastern
Mediterranean Countries. Available at: http://www.medagri.org/docs/group19/Regional%20Trade%20Integration.pdf.
45. UN Comtrade, 2015 and 2016. Available at: http://comtrade.un.org/.
46. UNICEF. 2016. Annual Results Report 2015: Water, Sanitation and Hygiene. Geneva.
47. United Nations, Department of Economic and Social Affairs, Population Division. 2015. World population prospects: The 2015 Revision, DVD
Edition.
48. UNRWA. 2014. Alienation and violence impact of the Syria Crisis. Available at: http://www.unrwa.org/sites/default/files/alienation_and_violence_
impact_of_the_syria_crisis_in_2014_eng.pdf.
49. WHO. 2015. EMR B and EMR D cover a broader definition of Arab and South-Eastern Mediterranean countries. Available at: http://www.who.
int/choice/cost-effectiveness/results/emr_B/en/ and http://www.who.int/choice/cost-effectiveness/results/ emr_D/en/.
50. WHO. 2015. Fact sheets on Non-communicable diseases (NCDs). Available at: http://www.who.int/mediacentre/factsheets/fs355/en/.
51. WHO. 2016. World Health Statistics. Available at: http://www.who.int/gho/publications/world_health_statistics/2016/en/.
52. WHO. 2016. Health statistics and information systems. Disability-Adjusted Life Years (DALY). Available at: http://www.who.int/healthinfo/
global_burden_disease/metrics_daly/en/.
53. World Bank Aspire indicators – Dashboard for Middle East and Africa. Available at: http://datatopics.worldbank.org/aspire/region/middle-east-
and-north-africa.
54. World Bank. 2007. Making the most of scarcity: Accountability for better water management results in the Middle East and North Africa. MENA
development report. Washington, DC,World Bank. Available at: http://documents.worldbank.org/curated/en/353971468280764676/Making-
the-most-of-scarcity-Accountability-for-better-water-management-results-in-the-Middle-East-and-North-Africa.
55. World Bank and FAO. 2012. The grain chain: Food security and managing wheat imports in Arab countries. Washington.
56. World Bank. 2013. Adaptation to a changing climate change in the Arab countries. World Bank, Washington DC.
57. World Bank. 2014. South-South Learning Forum, Social Protection and Labour, Payments and Transactions session. Available at: http://www.
worldbank.org/content/dam/Worldbank/Event/social-protection/Payments_and_Transactions_Session_Packet.pdf.
58. World Bank. 2015. Impact of climate change on water.
59. World Bank. 2016. MENA economic monitor – April 2016: Syria: reconstruction for peace.
60. World Bank. 2016. The cost of war and peace in the Middle East. Available at: http://www.worldbank.org/en/news/feature/2016/02/03/by-the-
numbers-the-cost-of-war-and-peace-in-mena.
61. World Bank. 2016. World development indicators. Highlights Featuring SDG Booklet. Available at: http://databank.worldbank.org/data/download/
site-content/wdi-2016-highlights-featuring-sdgs-booklet.pdf.
62. WVI (World Vision International). 2012. Article of world health assembly. Available at: http://www.wvi.org/nutrition/article/world-health-assembly.


I6860EN/1/02.17
ISBN 978-92-5-109648-2
9 7 8 9 2 5 1 0 9 6 4 8 2