2016 - Leek United
72
2016 Annual Report & Accounts
Transcript of 2016 - Leek United
2016Annual Report & Accounts

Contents
35
2927
67
06 080403
34
05
Notes to the Accounts
Income Statements
Country By Country Reporting
Chief Executive’s Business Review
Strategic Report
Directors and Officers
Key Financial Highlights
18 19 25 26Directors’ Report
Corporate Governance Report
Directors’ Remuneration Report
Statement of Directors’ Responsibilities
30 31 32Statements of Comprehensive Income
Statements of Financial Position
Statements of Changes in Members Interests
68 69Country By Country Audit Report
Annual Business Statement
16Directors’ Profiles
Chair’s Statement
Independent Auditors’ Report
Statements of Cashflows
Member of the Building Societies Association
Authorised by the Prudential Regulation Authority and regulated by the Financial Conduct Authority and Prudential Regulation Authority
Established 1863
Registered Principal Office:
50 St. Edward Street, Leek, Staffs. ST13 5DL
Telephone: 01538 384151
Fax: 01538 399179
E-mail: [email protected]
Internet: www.leekunited.co.uk
Registered Number 323B

3
Key Financial Highlights
2016£000’s
2015£000’s
2014£000’s
2013£000’s
2012£000’s
Net interest income 11 ,884 12 ,168 11,142 10,257 8,466
Other income 791 832 1,060 1,435 1,467
Administrative expenses (8,484) (7,948) (7,212) (6,699) (6,260)
Other expenses and charges (234) (187) (143) (621) (490)
Provisions & other items* (198) (440) (648) (108) (42)
Profit before tax pre hedging 3,759 4,425 4,199 4,264 3,141
Impact of hedging (264) 91 (923) - -
Profit Before Tax 3,495 4,516 3,276 4,264 3,141
Liquid assets 180,328 17 1 ,800 226,773 175,318 184,876
Loans and advances 742,844 715,182 676,543 674,266 620,026
Other assets 4,720 3,665 3,925 3,784 3,473
Total assets 927,892 890,647 907,241 853,368 808,375
Shares and deposits 858,359 825,475 844,858 796,265 751,242
Other liabilities 11 ,506 6,462 6,924 2,403 3,441
Reserves 58,027 58,710 55,459 54,700 53,692
Total liabilities 927,892 890,647 907,241 853,368 808,375
* This includes FSCS levy charges, impairment losses and pension scheme finance credits.2014 – 2016 are prepared under FRS 102 and IAS 39. 2012 to 2013 metrics above are shown as historically presented and are not restated.
Five Year Highlights
• Profit before tax £3.5m (2015: £4.5m)
• Profit before hedging and tax £3.8m (2015: £4.4m)
• Net interest margin 1.31% (2015: 1.35%)
• Gross mortgage advances of £152m (2015: £156m)
• Mortgage balance growth of c5% to £743m (2015: £707m c6% growth)
• Liquidity ratio 21.0% of share and deposit liabilities (2015: 20.8%)
• Mortgages in arrears by more than 2.5% of the outstanding balance 0.17% (2015: 0.09%)
• Core tier 1 capital ratio 17.9% (2015: 18.7%)
An explanation of some of the terms used here can be found on pages 8 to 11

4
Directors & Officers
Directors Keith Abercromby BSc, FIA
Rachel Court JP, BA
Richard Goddard MA, FCA
Jane Kimberlin BA, FIoD
Colin Kersley
John Leveson MBA, FCIB
Kevin Wilson
Paul Wilson BSc, ACA
Chair Rachel Court JP, BA
Chief Executive Kevin Wilson
Finance Director Paul Wilson BSc, ACA
Internal Auditor Deloitte LLP Four Brindleyplace Birmingham B1 2HZ
Independent Auditors PricewaterhouseCoopers LLP Chartered Accountants and Statutory Auditors 101 Barbirolli Square Lower Mosley Street Manchester M2 3PW

5
Chair’s Statement
Rachel Court Chair
“the Society has a clear strategic plan and a position of financial strength which has been built up over many generations and we remain committed as ever to the traditional values of a mutual organisation”In my first annual statement to you as Chair, I am pleased to report another year of strong performance and financial results for Leek United Building Society. Solid growth in both mortgages and savings have been delivered generating healthy levels of profit whilst maintaining our robust capital position.
Economic and Market ConditionsIt is particularly pleasing to be able to report these results at a time when the economic picture remains so uncertain. The fallout from the EU referendum makes future economic conditions harder to predict than ever. Having been at a record low since 2009, interest rates in the UK were cut further in August 2016 to 0.25% and it remains unclear when they will begin to rise. Increasing inflation, resulting from the fall in the value of the pound, will put pressure on household finances and as Article 50 is triggered it may increase the strain if inflation is pushed up further. Increasing inflation may start to impact on interest rate decisions later this year.
The StrategyWe remain absolutely committed to our branch network but the Society has recognised for some time the changing way some of our customers want to engage with us. Therefore, the Society has invested in an online application system for mortgage intermediaries which it plans to develop to further enhance the member experience. These technological improvements are supplementary services for our members and sit alongside our branch based model. The Society has also entered into an agreement with a nationwide financial advice provider, Wren Sterling, to help our members plan for the future at their local branch. Members can now consult with Wren Sterling’s independent advisers on all aspects of financial planning across the whole of the market.
Managing regulatory change is an ongoing requirement for all financial services organisations and 2016 has seen further regulatory requirements particularly in respect of savings. The Society continues to meet the demands of the regulator and is well placed to continue to do so in the future.
The BoardIn November 2016 Tony Hubbard, the Society’s Operations Director, sadly passed away after a brave battle with leukaemia. Tony’s hard work and contribution was immense and he will be sadly missed by his friends and colleagues across the Society.
2016 has seen changes in the Board’s Non Executive Directors with Peter Kerns and Jim Washington retiring in April and Kerry Spooner stepping down in June. I am pleased to report three new Non Executive appointments to maintain the strength of the Board. Keith Abercromby joined the Board in March 2016, Jane Kimberlin and Colin Kersley joined the Board in November and December 2016 respectively. They bring a wealth of experience and considerable knowledge of the financial services sector.
The Future We remain cautious, as the UK prepares to leave the European Union and with continuing global uncertainty there will undoubtedly be further challenges going forward. However, the Society has a clear strategic plan and a position of financial strength which has been built up over many generations and we remain committed as ever to the traditional values of a mutual organisation and the building society model. With these strong foundations in place, we are well placed to deal with the circumstances that may arise.
ThanksI would like to thank my fellow Board members and colleagues across the Society for their continued commitment and dedication. Finally and most importantly, I also extend my sincere thanks to you, our members, for your loyalty and support of the Society. I hope that you will be members for a long time to come and I look forward to seeing many of you at our AGM on 26 April.
Rachel Court
22 February 2017

6
Chief Executive’s Business Review
Kevin Wilson, Chief Executive
OverviewI am pleased to be able to report that 2016 saw another strong performance by the Society and we end the financial year in a robust position.
This has been a year of solid growth in both the mortgage book and savings book. The Society has also maintained its strong liquidity position. Further investment has been made in the Society during 2016, particularly in technological advances to place us well for the future.
The Society seeks to generate sufficient levels of profit to support future growth, allow investment for the future and to maintain a robust capital position. Our wide range of competitive products combined with excellent levels of customer service has delivered a profit (before tax and hedging) of £3.8m compared to £4.4m in 2015, this slightly lower level of profitability reflects both challenges to our net interest margin as we have maintained savings interest rates above competitor levels as well as increased people costs in 2016 to position the Society better for the future. The 2016 capital position has been impacted by the year end pension valuation which is affected by market conditions. As a result, the reserves have reduced to £58.0m and the core tier 1 ratio has reduced to 17.9% but the capital position remains strong. This robust position ensures the Society has a solid foundation for future growth and success.
Our other key financial ratios complete a strong financial performance, further details are included within the strategic report on page 8.
MortgagesThe Society achieved mortgage balance growth of c£36m during 2016, representing an increase in balances of c5%. Gross lending of £152m was achieved, broadly in line with 2015’s solid performance.
This level of growth year on year is a great success against the backdrop of a market where competition has intensified, particularly from the main high street banks. The Society’s lending proposition continues its core focus on residential lending providing a range of fixed and discount mortgages primarily for owner occupiers but also for buy to let (BTL) landlords.
BTL lending experienced a surge in activity in the first quarter of 2016, as anticipated in the lead up to the second property stamp duty change. Further fiscal measures which will affect BTL landlords come into effect during 2017 but as a Society, we continue to offer a range of products to support BTL lending.
Our mortgage book remains of high quality which continues to be evidenced by the low level arrears (0.17% arrears greater than 2.5% of the outstanding balance).
All our mortgage lending is individually underwritten and reviewed for suitability by an experienced team. Responsible lending is the key to the quality of our mortgage book and we are committed as always to managing arrears in a proactive manner with only one property being taken into possession during the year (2015: one property).
In late 2016, the Society launched a new online intermediary mortgage application platform with further enhancements planned this year.
2016 2015Group profit before tax £3.5m £4.5m
Group profit before tax and hedging adjustments
£3.8m £4.4m
Group reserves £58.0m £58.7m
Group assets £927.9m £890.6m
Mortgage assets £742.8m £707.2m
Core tier 1 ratio 17.9% 18.7%
Management Expense Ratio 0.96% 0.90%

7
SavingsThe Society’s savings balances increased by c4% during the year. I recognise the challenges facing our savings members in such a low interest rate environment and whilst we cannot isolate ourselves from the current economic climate, we have sought to provide rates that are both fair and sustainable. As a Society, we continue to offer preferential loyalty products for existing members and limit interest rate reductions as much as possible. Unfortunately, during 2016 we had to take the difficult decision to reduce the rates on a selection of our savings accounts, especially in light of the cut in the Bank of England base rate. This decision was not taken lightly and was given careful consideration. I would like to extend my gratitude to our members for their continued loyalty and support to the Society.
Our affinity accounts with the County Air Ambulance and Stoke City Football Club allow our members to support their local communities through their savings which pay a percentage of the savings balances to the charity or local club.
Financial Investment AdviceDuring 2016, the Society changed the way it provides financial advice. Members can now consult with Wren Sterling’s independent advisers on all aspects of financial planning – including savings, protection, investments, retirement and inheritance tax planning. The service offering we now provide to our members is primarily branch based with some phone support and includes a whole-of-market review for the best product to meet individual members’ needs.
We also continue to offer buildings and contents home insurance for our members via our relationship with RSA.
Our Staff and MembersSadly after a brave battle with leukaemia, Tony Hubbard, the Society’s Operations Director, passed away in November 2016. Tony’s enthusiasm and passion for the Society will leave a lasting impact on the business.
During the second half of 2016, the Society appointed Deloitte LLP to be the outsourced provider of Internal Audit services. Following this decision the Society’s Internal Auditor, Ian Boston, left his position after 10 years’ service. On behalf of the Society, I would like to thank Ian for his excellent contribution and wish him the very best for the future.
I recognise it is our people and the service they offer which makes the difference for our members and we have launched initiatives to develop talent and identify potential succession for future management roles. These initiatives include a Trainee Manager Programme, Trainee Branch Manager Programme and a Mortgage Adviser Academy where participants have undergone a structured in-house programme to support their career development.
In 2016, the Society also launched an Apprenticeship Programme and recruited four local young people to work in our branch network and IT department whilst also attending college to study for a relevant qualification to support them achieving their career aspirations and potential.
Each of these programmes have been a great success and we will be aiming to provide similar opportunities going forward.
I am pleased to welcome John Kelly to our executive team as Operations Director. John brings wide ranging experience and knowledge across financial services.
At Leek United Building Society, the customer really is at the heart of everything we do. The Society closely monitors all feedback and whilst we are by no means complacent, customer service has once again been a resounding success during 2016 with 98.7% of customers satisfied or very satisfied.
CommunityAs a mutual, we remain committed to supporting our local communities in which our branch network operates. We have continued to give something back to the community through a wide range of sponsorship and community activities. We are proud to be the main sponsor of the Leek Show, the premier agricultural event in our Staffordshire Moorlands heartland which brings thousands of families and local businesses together each year. We are delighted to have extended our support for the show until 2022, further strengthening our long running links with the event and guaranteeing its future into the next decade.
During 2016, colleagues across the Society took part in a wide variety of charity events including a wing walk, 150 mile coast to coast bike ride, ‘Pretty Muddy’ Race for Life and SCFC ‘Big Sleepover’. Staff have also raised over £5,000 during 2016 for Bloodwise, a charity which funds research and offers information and support to anyone affected by blood cancer, and will continue to support this cause in 2017.
The Society continues to develop links with local schools. During the year, staff regularly visited schools to teach youngsters the benefits of developing good savings habits from an early age. Staff also attended careers events to highlight opportunities for young people in the years to come as well as providing regular work experience placements for students.
OutlookThe Society is well positioned to achieve future success and to meet further regulatory demands. Our financial strength will enable us to respond to the uncertain economic and political environment. The Society looks forward to 2017 and to serving the interests of our customers and members for many years to come.
Kevin Wilson
22 February 2017
Our biggest single charitable donation, presented to the County Air Ambulance Trust as a result of members investing in our Air Ambulance Account.

Strategic Report
Vision StatementWe aim to be the local Society of choice for new and existing members, respected, trusted and renowned for our exceptional customer service.
Mission StatementTo excel in meeting the financial needs of our members by providing high quality, competitive products, outstanding customer service and fair outcomes for customers.
Our ValuesThe Society believes that a clear and succinct statement of beliefs and values is a vital part of defining the corporate culture of our organisation. This cultural message is seen as the foundation upon which policy, staff attitude, management approach, and most importantly, good customer outcomes rest.
Values• We are honest, straightforward and trustworthy
• We are easy to deal with
• We treat customers as people not numbers
Key Strategic ObjectivesThe Society’s primary objectives are the provision of mortgage finance for the purchase and improvement of residential property alongside the funding of this through the Society’s range of personal savings accounts.
In addition, through a number of business partners, the Society provides an extensive range of services such as general insurance, life insurance and long term investments.
These activities are undertaken via twelve branches across four counties, together with two agencies.
As a Building Society and a mutual, Leek United does not seek to maximise profits at the expense of members, but rather deliver a level of profitability sufficient to balance member value with the need to protect our capital position and so ensure that member confidence remains high.
Key Performance IndicatorsThe Society has delivered a strong financial performance in 2016 and ends the year in a robust financial position. The Society uses key performance indicators to monitor its progress; a number of key indicators are included within the review of the business as follows:
Values
Mission
Vision
Key Strategic Objectives
8
The Strategy for the Society is outlined below:

£m
2012 2013 2014 2015 2016
550
600
650
700
750
800
0.00%
0.05%
0.10%
0.15%
0.20%
2012 2013 2014 2015 2016
%
700
750
800
850
900
950
£m
2012 2013 2014 2015 2016
£m
650
700
750
800
850
900
2012 2013 2014 2015 2016
Total Assets (£m)
Total assets: The value of all assets in the Group balance sheet.
Total assets have increased by 4.2% from £891m at the end of 2015, up to £928m at the end of 2016. This was achieved by solid growth in mortgage balances funded through increased levels of customer deposits.
Mortgage balances (£m)
Mortgage balances: The total amount owed to the Society for mortgages by customers.
Mortgage balances have increased by c£36m in the year to £743m (2015: £707m) with gross lending (the total value of all new mortgage advances) in 2016 at just over £152m (2015: £156m). Redemptions in the year were £82m (2015: £87m).
Shares and deposits (£m)
Shares and deposits: The total amount owed by the Society to shareholding members and depositors in respect of their account balances.
Despite the continuing difficult environment for savers in the low interest rate environment, there has been a significant increase of savings balances, 4% up from £825m in 2015 to £858m at the end of 2016.
Mortgage arrears > 2.5% of balances
Mortgage arrears: The number of mortgage accounts on which there is an amount of arrears which exceeds 2.5% of the mortgage balance. This number is expressed as a percentage of total mortgage accounts.
The Society remains committed as always to responsible lending and continues to take a cautious approach to lending and our mortgage book remains of high quality as evidenced by the low level of arrears. The arrears greater than 2.5% of the outstanding balance as at 31 December 2016 was 0.17% (2015: 0.09%). The total number of accounts in arrears by one month or more at the end of 2016 was 73 (2015: 83). As at 31 December 2016, there were 13 mortgage accounts in arrears by three months or more, three of which relate to one customer (2015: 21 accounts). The total amount of these arrears, by three months or more, was £30,326 (2015: £39,119). Where appropriate a provision has been raised, cases that do not have a specific provision are included within the collective provision.
9
Cheque presentation of money raised from 2016 AGM voting and completed questionnaires to Douglas Macmillan Hospice.

50
52
54
56
58
60
2012 2013 2014 2015 2016
£m
0.50%
0.70%
0.90%
1.10%
1.30%
1.50%
2012 2013 2014 2015 2016
%
10
Profit before tax – pre hedging (£m)
Profit before tax: The surplus before tax, achieved from trading activity during the financial year.
Leek United does not seek to maximise profits at the expense of members but rather deliver a level of profitability sufficient to balance member value whilst maintaining our capital resilience. Pre tax profits (before hedging) for 2016 of £3.8m compared to £4.4m in 2015. A small reduction in net interest income as well as increased people and technology costs, to meet the increasing resource needs of regulatory requirements, have impacted the profit position.
Net interest margin percentage
Net interest margin: The net interest receivable by the Society as a percentage of the average total assets in the year.
The net interest margin percentage (%) was 1.31% in 2016 (2015: 1.35%). Following the EU referendum, bank base rate was cut to 0.25% in August 2016. As a consequence, the Society’s net interest margin has come under increased pressure and has fallen slightly year on year, particularly in respect of earnings on its core liquidity.
Management expense ratio (%)
Management expense ratio: The aggregate of administrative expenses and depreciation as a percentage of the average total assets in the year.
As in recent years, there continues to be significant investment in the Society both in terms of people and technology. The Board is committed to ensuring cost efficiency to ensure a level of profitability to protect members’ interests, however this must be balanced with long term investment for the Society’s future as well as meeting the increasing resource needs of regulatory requirements.
Gross capital (£m)
Gross capital: The total value of the reserves as shown in the balance sheet.
Consistent levels of appropriate profit generated again in 2016 ensures that the capital position remains strong with reserves as at 31 December 2016 of £58.0m (2015: £58.7m). The 2016 capital position has been impacted by £3.7m as our year end pension accounting deficit increased to c£6m. This has been caused by increases in expected long term inflation and reductions in long term investment returns.
The ratio of gross capital as a percentage of total shares and borrowings was 6.8% at 31 December 2016 (2015: 7.1%) and the ratio of free capital as a percentage of total shares and borrowings was 6.5% at 31 December 2016 (2015: 6.9%). Free capital is the total reserves and collective loss provision less fixed assets. The core tier 1 ratio stood at 17.9% (2015: 18.7%) and the leverage ratio (unaudited) stood at 6.1% (2015: 6.6%).
2.0
2.5
3.0
3.5
4.0
4.5
5.0
2012 2013 2014 2015 2016
£m
Strategic Report(continued)
0.70%
0.75% 0.80%
0.85%
0.90%
0.95%
1.00%
2012 2013 2014 2015 2016
%

11
Capital ManagementThe Society’s policy is to maintain a strong capital base to maintain member, creditor and market confidence and to sustain the future development of the business. The Board manages the Society’s capital and risk exposure to maintain capital in line with regulatory requirements. This is subject to regular stress tests to ensure the Society maintains sufficient capital for future possible events.
The capital resources of the Society are monitored by and calculated in accordance with the requirements of the Prudential Regulation Authority, consisting of:
• General Reserves, accumulated profit, Revaluation Reserves and Available for Sale Reserves, representing Tier 1 Capital
• Collective Mortgage Provision representing Tier 2 Capital
The Society’s capital position has been significantly above the regulatory limits at all times.
The Society also assessed its capital requirements in line with the Capital Requirements Directive (CRD). This framework governs the amount of capital required to be held to provide security for members and depositors. The Society seeks to ensure that it protects members’ savings by holding sufficient capital at all times. The minimum amount of capital the Society is required to hold is set by European and national regulators. The capital requirement is set with reference to the amount of risk weighted assets the Society holds for credit risk, market risk and operational risk.
Liquid assets (£m)
Liquid Assets: The total cash in hand, loans and advances to credit institutions and debt securities.
The liquidity position remains robust. Liquid assets totalled £180m as at 31 December 2016 (2015: £172m). The amount of liquidity repayable on demand is £110m (2015: £57m).
Proudly securing our position as Leek Show’s main sponsor until 2022.
Capital disclosures to comply with FRS 102 (audited) 2016 2015
Total Reserves £58.0m £58.7m
Intangible Assets (£0.2m) -
Tier 1 Capital £57.8m £58.7m
Tier 2 Capital - collective provision £0.3m £0.4m
Capital Resources £58.1 m £59.1m
Risk Weighted Assets (unaudited) £322.6m £314.0m
Core Tier 1 Ratio 17.9% 1 8.7%Assets for leverage purposes (unaudited) £942.7m £900.3m
Leverage Ratio (unaudited) 6 . 1% 6.6%
100
150
200
250
300
2012 2013 2014 2015 2016
£m

12
Strategic Report(continued)
Trends and factors likely to affect future development, performance and positionInterest rates in the UK reduced even lower following the referendum result and continue to remain at historically low levels. Whilst the economy continues to grow slowly, the Bank of England is not expected to respond imminently to increasing inflation following the devaluation of the pound. The UK recovery is reliant on consumer spending and this may be affected as the household budget comes under pressure from higher inflation. The UK recovery also remains exposed to global risks related to possible problems in China and some other large emerging economies leading to further volatility and weakness in international financial markets.
The competition for mortgages has increased significantly, particularly as existing banks and building societies compete for low loan to value (LTV) business. New start up banks have also contributed to the market forces which have seen mortgage rates hit historically low levels.
Due to the introduction of the 3% second property stamp duty surcharge earlier in 2016, there was naturally an upsurge in BTL mortgage lending in the first quarter of the year. Further changes to BTL lending, by both the government and regulatory intervention, will be introduced during 2017 and whilst it is uncertain what the impact will be on this area of the market, the Society will continue to offer a range of individually underwritten products to support BTL lending. The Society has reviewed its approach as a result of the external factors and has slightly tightened its underwriting criteria.
Savings rates across the market have remained subdued during 2016 and have in fact reduced especially for instant access products. The changes in the tax treatment of savings, combined with the introduction of the Term Funding Scheme (TFS) to replace the Funding for Lending Scheme (FLS) have also contributed to a reduction in ISA rates but these reductions have not been in line with mortgage interest rates, therefore putting pressure on net interest margin.
Costs of doing business continue to increase for all financial services companies, especially with the need to strengthen the risk and control framework in 1st, 2nd and 3rd line (as set out on page 13), as well as further significant investment in technology and resources.
The Society is not immune to the trends affecting financial services distribution in the economy as a whole and so will need to continue to adapt and evolve our branch proposition whilst retaining the culture, feel and high quality service that our members experience every time they go into one of our branches. We must also recognise the changing lifestyles and behaviours of members and the impact of these and how they want to interact with us, particularly the move towards online and mobile banking.
We continue to monitor these trends to ensure that we respond to the needs of our members. We have started this process in 2016 with the implementation of an online mortgage application capability for intermediaries and will be expanding and extending our online capability in 2017.
The Society is very mindful that each of these issues can cause risk and uncertainty which, in extreme circumstances, can damage the financial strength of the Society. These risks are monitored as part of the Society’s Risk Management Framework. Additionally, the Society performs regular stress testing as part of its Internal Capital Adequacy Assessment Process (ICAAP) and Individual Liquidity Adequacy Assessment Process (ILAAP) regulatory assessments and also its forward looking five year corporate plan. Through these processes, the Society performs a wide range of severe stresses across each of the Society’s principal risks, including stresses to house prices, credit quality, net interest margin compression, cost pressures, regulatory pressures, liquidity and operational events. The Society’s currently robust level of capital and liquidity are sufficiently resilient to withstand the impacts of these stresses which have been assessed as part of the Long Term Viability statement (page 15).
Risk Management ReportThe purpose of this report is to:
• Explain the Society’s Risk Management Framework;
• Highlight the risk governance arrangements; and
• Set out the principal risks and uncertainties facing the Society.
Risk Management FrameworkThe Society’s activities are governed by its constitution, principles and values. The directors have also agreed a set of statements which describe the Board’s risk appetite in terms of the principal risk categories: credit, strategic, market, liquidity, conduct, regulatory & legal, pension and operational (the Society’s Risk Appetite Statements).
These Risk Appetite Statements enable the Board to formally communicate to the organisation the level of risk they are willing to accept to achieve Society objectives, both in terms of qualitative and quantitative measures. The Board’s Risk Appetite Statement is as follows:
‘As a mutual, Leek United Building Society operates so that the Board and Management are custodians of the interests of our members. Therefore we seek a prudent position for our risk appetite acknowledging that the lower levels of risk will lead to lower levels of return. The suite of Risk Appetite Metrics quantifies this prudent approach with the aim to deliver sustainable member value for the Society.’
The final element of the framework is the formal structure for managing risk across the Group. This is based on the ‘three lines of defence’ model which is illustrated opposite.

13
Principal Risks and Uncertainties The Board is committed to the traditional values of a mutual organisation. Central to these values are requirements to deliver the right outcomes for customers based on their needs. These core values also determine the Society’s prudent approach to its business and its markets.
The principal business of the Society is the production and distribution of financial products and in particular, mortgages and deposit-based savings accounts. Regulated investment products are supplied by a third party, Wren Sterling. The Group uses wholesale financial instruments in the management of its balance sheet, investing funds held as liquidity and is able to raise wholesale funding if necessary. We also use derivative financial instruments to manage and mitigate our interest rate risk. The derivatives are used solely for this purpose and are not used for trading activity or speculative purposes.
The Risk Management Framework has been established to ensure the Society has a strong, robust risk management
methodology and culture as part of our strategy to proactively manage our risks in accordance with our prudent approach to risk.
The eight principal risks, their controls and the Board’s appetite statements are set out as follows. In addition to these, the Society is also at risk from economic uncertainty including consequences of Brexit which may impact the markets in which we operate. Reductions in the Bank of England base rate have and will continue to have implications for the level of interest income the Society earns and, similarly, in the future, competition or regulatory intervention in the mortgage market can impact on market pricing and customer demand. Increasing interest rates or inflation could have a detrimental impact on the affordability of our customers to repay their mortgages. Both of these repercussions are considered as part of the Society’s planning.
First Line of Defence
Second Line of Defence
Second Line of Defence
Third Line of Defence
RISK GOVERNANCE
RISK CULTURE
GOVERNANCE STRUCTURE
BUSINESSRISK
MANAGEMENTCOMPLIANCE INTERNAL AUDIT
Overall Accountability and Ownership
Design Risk Management Framework
Design Compliance
Framework and Approach
Independent review of the design and
implementation of frameworkImplementation
of Framework
Develop processes for
implementation of framework
Develop processes for
implementation of framework
Establish strong risk management
culture
Promote strong risk management
culture
Promote strong compliance
culture
Promote strong risk management
culture
Challenge and Oversight
Challenge and Oversight
Set Risk Appetite
14
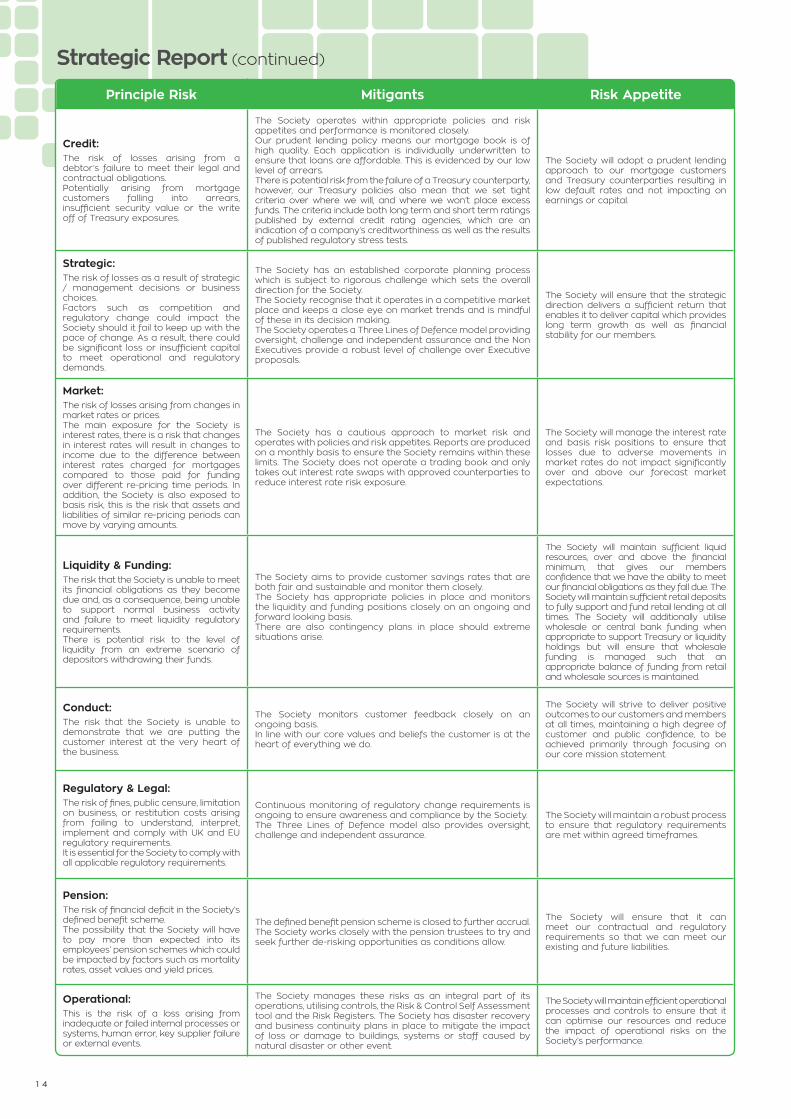
Principle Risk Mitigants Risk Appetite
Credit: The risk of losses arising from a debtor’s failure to meet their legal and contractual obligations.Potentially arising from mortgage customers falling into arrears, insufficient security value or the write off of Treasury exposures.
The Society operates within appropriate policies and risk appetites and performance is monitored closely.Our prudent lending policy means our mortgage book is of high quality. Each application is individually underwritten to ensure that loans are affordable. This is evidenced by our low level of arrears.There is potential risk from the failure of a Treasury counterparty, however, our Treasury policies also mean that we set tight criteria over where we will, and where we won’t place excess funds. The criteria include both long term and short term ratings published by external credit rating agencies, which are an indication of a company’s creditworthiness as well as the results of published regulatory stress tests.
The Society will adopt a prudent lending approach to our mortgage customers and Treasury counterparties resulting in low default rates and not impacting on earnings or capital.
Strategic: The risk of losses as a result of strategic / management decisions or business choices.Factors such as competition and regulatory change could impact the Society should it fail to keep up with the pace of change. As a result, there could be significant loss or insufficient capital to meet operational and regulatory demands.
The Society has an established corporate planning process which is subject to rigorous challenge which sets the overall direction for the Society.The Society recognise that it operates in a competitive market place and keeps a close eye on market trends and is mindful of these in its decision making.The Society operates a Three Lines of Defence model providing oversight, challenge and independent assurance and the Non Executives provide a robust level of challenge over Executive proposals.
The Society will ensure that the strategic direction delivers a sufficient return that enables it to deliver capital which provides long term growth as well as financial stability for our members.
Market: The risk of losses arising from changes in market rates or prices.The main exposure for the Society is interest rates, there is a risk that changes in interest rates will result in changes to income due to the difference between interest rates charged for mortgages compared to those paid for funding over different re-pricing time periods. In addition, the Society is also exposed to basis risk, this is the risk that assets and liabilities of similar re-pricing periods can move by varying amounts.
The Society has a cautious approach to market risk and operates with policies and risk appetites. Reports are produced on a monthly basis to ensure the Society remains within these limits. The Society does not operate a trading book and only takes out interest rate swaps with approved counterparties to reduce interest rate risk exposure.
The Society will manage the interest rate and basis risk positions to ensure that losses due to adverse movements in market rates do not impact significantly over and above our forecast market expectations.
Liquidity & Funding: The risk that the Society is unable to meet its financial obligations as they become due and, as a consequence, being unable to support normal business activity and failure to meet liquidity regulatory requirements.There is potential risk to the level of liquidity from an extreme scenario of depositors withdrawing their funds.
The Society aims to provide customer savings rates that are both fair and sustainable and monitor them closely.The Society has appropriate policies in place and monitors the liquidity and funding positions closely on an ongoing and forward looking basis.There are also contingency plans in place should extreme situations arise.
The Society will maintain sufficient liquid resources, over and above the financial minimum, that gives our members confidence that we have the ability to meet our financial obligations as they fall due. The Society will maintain sufficient retail deposits to fully support and fund retail lending at all times. The Society will additionally utilise wholesale or central bank funding when appropriate to support Treasury or liquidity holdings but will ensure that wholesale funding is managed such that an appropriate balance of funding from retail and wholesale sources is maintained.
Conduct: The risk that the Society is unable to demonstrate that we are putting the customer interest at the very heart of the business.
The Society monitors customer feedback closely on an ongoing basis.In line with our core values and beliefs the customer is at the heart of everything we do.
The Society will strive to deliver positive outcomes to our customers and members at all times, maintaining a high degree of customer and public confidence, to be achieved primarily through focusing on our core mission statement.
Regulatory & Legal: The risk of fines, public censure, limitation on business, or restitution costs arising from failing to understand, interpret, implement and comply with UK and EU regulatory requirements.It is essential for the Society to comply with all applicable regulatory requirements.
Continuous monitoring of regulatory change requirements is ongoing to ensure awareness and compliance by the Society.The Three Lines of Defence model also provides oversight, challenge and independent assurance.
The Society will maintain a robust process to ensure that regulatory requirements are met within agreed timeframes.
Pension: The risk of financial deficit in the Society’s defined benefit scheme.The possibility that the Society will have to pay more than expected into its employees’ pension schemes which could be impacted by factors such as mortality rates, asset values and yield prices.
The defined benefit pension scheme is closed to further accrual.The Society works closely with the pension trustees to try and seek further de-risking opportunities as conditions allow.
The Society will ensure that it can meet our contractual and regulatory requirements so that we can meet our existing and future liabilities.
Operational: This is the risk of a loss arising from inadequate or failed internal processes or systems, human error, key supplier failure or external events.
The Society manages these risks as an integral part of its operations, utilising controls, the Risk & Control Self Assessment tool and the Risk Registers. The Society has disaster recovery and business continuity plans in place to mitigate the impact of loss or damage to buildings, systems or staff caused by natural disaster or other event.
The Society will maintain efficient operational processes and controls to ensure that it can optimise our resources and reduce the impact of operational risks on the Society’s performance.
Strategic Report (continued)

15
The Board continues to review the activities of the Society on an ongoing basis to ensure they are in accordance with our risk appetite.
Long Term Viability The directors confirm that their assessment of the principal risks facing the company was robust.
Based on the Board’s robust assessment of the principal risks (all of which are described on page 14 of the Strategic Report), and their stress testing of these principal risks, the directors have a reasonable expectation that the company will be able to continue in operation and meet its liabilities as they fall due over the period to December 2021 subject to unforeseeable external stresses including, but not limited to, the macro economic climate, competitive pressures, reputational damage and regulatory change.
The directors have no reason to believe the Society will not be viable over a longer period, however, given the inherent uncertainty, the directors have selected this period based on the Society’s Board approved five year corporate planning and stress testing. The directors have also considered it appropriate to prepare the financial statements on the going concern basis, as explained in the Basis of Preparation in note 1 to the accounts.
Rachel Court
Chair
22 February 2017
Pictures that tell stories of bravery, hope and love - produced by local children who have complex, life-limiting or life-threatening conditions and their families during art therapy sessions at The Donna Louise Hospice -
were on display at Leek Derby St branch for three months.

Directors’ Profiles
01 02
0403
Non Executive Directors 01 Rachel Court, Chair, JP, BA (age 50)Rachel worked as a Senior Executive of Yorkshire Building Society for almost 23 years. During her career at the Yorkshire, she fulfilled a broad range of roles, including responsibility at various times for intermediary mortgage sales, mortgage product development, HR, operations and customer service. Rachel acquired substantial Board level experience and worked closely with the Remuneration Committee as well as serving as a member of the Board Risk Committee, also chairing the Board of Yorkshire Guernsey Limited.
Rachel is the independent Chair of the NHS Pension Board and a Non Executive Director on the Boards of Invesco Perpetual Life Limited, Invesco UK Ltd and South West Yorkshire Partnership NHS Foundation Trust. She is also Chair of a Charity, PRISM, which offers alternative educational provision to young people excluded from mainstream education as well as being a Governor of Calderdale College. Rachel also serves as a Magistrate.
Rachel was co-opted onto the Board in November 2014 and during April 2016, she was elected to be the Chair of the Board following the retirement of the former Chairman. During 2016, Rachel has served as a member of the Board Risk Committee, Remuneration Committee and Chair of the Nominations Committee.
02 Keith Abercromby, Non Executive Director, BSc, FIA (age 52)
Keith has had a 30 year executive career in retail banking and insurance including the Halifax, Clerical Medical, Aviva and Liverpool Victoria – spending the last five years as one of the founding directors of the innovative mortgage lender, Castle Trust. During his career at the Halifax, Keith was employed at board level in a wide range of roles including Chief Executive of its life insurance and investment businesses and the executive responsible for risk and products in retail. At Aviva, Keith was the Finance Director of its UK life insurance companies – Norwich Union, General Accident and Commercial Union – before being appointed Group Finance Director by Liverpool Victoria.
Keith was co-opted onto the Board in March 2016 and serves as a member of the Board Risk Committee, Nominations Committee and Audit Committee.
03 Richard Goddard, Non Executive Director, MA, FCA (age 59)Richard is a Chartered Accountant with more than 30 years experience in financial services. Richard worked at KPMG as a senior audit manager. In 1993, he joined the Co-operative Bank where he developed robust, effective financial controls and led the finance team through two significant mergers. During his career at the Co-operative Bank, Richard was an Executive Director and also served as a Non Executive Director at its joint venture, Unity Trust Bank. Richard also provides finance and risk advice to small and medium sized financial organisations outside the building society sector through his company RCG Business Consultancy Ltd.
Richard was co-opted onto the Board during 2011. During 2016, he has served as Chair of the Board Risk Committee, Chair of the Audit Committee and on the Nominations Committee as well as the Pension Trustees Committee.
04 Colin Kersley, Non Executive Director (age 60)Colin has extensive experience in the financial services sector, holding senior roles across several areas, with his most recent position being as Chief Executive of M&S Bank. During his career, he spent 39 years at Midland Bank / HSBC Bank and held Senior Executive roles including Regional Head of Corporate, Regional Director and Head of Premier Wealth for the UK.
Colin was co-opted onto the Board in December 2016.
16

08
05 Jane Kimberlin, Non Executive Director BA, FIoD (age 57)Jane is a Fellow of the Institute of Directors as well as a Member of Information Technologists (Livery) Company with over 25 years of international experience in Board Chief Information Officer / Information Technology Director roles. Jane’s most recent role was with LaSer UK (part of BNP Paribas). Jane has also, via her own company, Creaton Consultants, provided consultancy expertise to other organisations.
Jane was co-opted onto the Board in November 2016 and serves as a member of the Board Risk Committee and Remuneration Committee.
06 John Leveson, Non Executive Director, MBA, FCIB (age 57)John is a Fellow of the Chartered Institute of Bankers and worked in the Building Society sector for over 36 years, the last 17 years as an Executive Director and latterly as Deputy Chief Executive of a regional building society. During his career, he was responsible at various times for marketing, sales, product development, HR, IT, mortgage underwriting, customer services, legal services and internal audit. In addition to serving on a building society group board he has also served on and chaired the boards of subsidiary companies involved in estate agency, financial planning and car finance. John is also a governor of Queen Elizabeth School, a coeducational selective grammar school in Penrith, and is manager of the GB and NI Transplant Cycling Team.
John was co-opted onto the Board in May 2015 and is a member of the Audit Committee, Board Risk Committee and Chair of the Remuneration Committee.
Executive Directors07 Kevin Wilson, Chief Executive (age 58)Kevin has significant experience in the financial services sector. After a successful career in sales management in the banking and financial services sector, he joined Leek United Building Society in 1994. His initial responsibilities at Leek United included the development of the highly successful financial advice service before joining the Board, in 1998, as Sales Director with responsibility for the financial advice service, marketing, general insurance as well as our branch network.
Kevin was appointed to the role of Chief Executive in 2005 and has led the Society through a period of unprecedented change in the financial services industry. During 2016, he has served as a member of the Nominations Committee, Management Risk Committee and Asset and Liability Committee and also attends the Board Risk Committee, Audit Committee and Remuneration Committee.
08 Paul Wilson, Finance Director, BSc, ACA (age 45)Paul qualified as a Chartered Accountant in 1996. After initially working within accountancy practices, including KPMG, he moved into Financial Services in 1998 with the Co-operative Bank. His financial services experience has been wide-ranging, including balance sheet management (including interest rate risk), financial control, statutory and regulatory reporting. Paul also led the finance elements of significant strategic acquisition and capital restructuring programmes.
Paul joined the Board as Finance Director in July 2014. He is Chair of the Asset and Liability Committee as well as a member of the Management Risk Committee and Product Governance Committee. He also regularly attends the Board Risk Committee, Audit Committee and Remuneration Committee as well as the Nominations Committee when appropriate.
17
07
05 06

18
Directors’ Report
The directors have pleasure in presenting the Annual Report and Accounts for the year ended 31 December 2016.
Business ReviewA full review of business performance can be found included within the Chief Executive’s Business Review and the Strategic Report.
DirectorsKeith Abercromby Non Executive Director (Appointed 23 March 2016)
Rachel Court Non Executive Director
Richard Goddard Non Executive Director
Tony Hubbard Operations Director (Deceased 30 November 2016)
Peter Kerns Non Executive Director (Retired 27 April 2016)
Jane Kimberlin Non Executive Director (Appointed 23 November 2016)
Colin Kersley Non Executive Director (Appointed 21 December 2016)
John Leveson Non Executive Director
Kerry Spooner Non Executive Director (Resigned 15 June 2016)
Jim Washington Non Executive Director (Retired 27 April 2016)
Kevin Wilson Chief Executive
Paul Wilson Finance Director
No director had any beneficial interest in the shares or debentures of any of the subsidiary undertakings.
The directors would like to express their sincere thanks to all staff for their role in delivering continued success during 2016. Their passion and dedication to achieving our objective of exceptional customer service will support the continued success of the Society in the years ahead and protect the interests of our members. Information is provided to employees through meetings, team briefings, circulars, newsletters and the Society’s intranet to ensure employees are aware of the Society’s performance and objectives and the business environment in which it operates.
The Society has a commitment to provide access to training, career development and promotion opportunities equally to all employees regardless of their age, ethnic origin, creed, gender, marital status, disability, sexual orientation, religion or belief. Should employees become disabled, it is the Society’s policy to continue their employment where possible with appropriate training and, if appropriate, redeployment.
We also wish to thank the Society’s agents and many other business associates for their continued support.
Interest RatesThe Society’s standard variable mortgage rate was 5.19% throughout the year.
Treating Customers FairlyThe Society has always had a core focus on ensuring the fair treatment of its customers in every way and, as part of its continuing commitment to that principle, has completed an extensive exercise in promoting and developing a cultural model which will continue to support that aim. This involves continually reviewing procedures, measuring performance and listening to customers concerns and complaints, and then taking action to put things right quickly if we fall below our high standards.
Provision of Information to AuditorsEach person who is a director at the date of approval of this report confirms that:
• So far as the director is aware, there is no relevant audit information of which the Society’s auditors are unaware; and
• Each director has taken all the steps that they ought to have taken as a director to make themselves aware of any relevant audit information and to establish that the Society’s auditors are aware of that information.
Independent AuditorsDuring 2016, the Board invited applicants to tender for the Society’s audit. As a result, the Board recommended that KPMG LLP be appointed as the Society’s auditors from the 2017 financial statements. PricewaterhouseCoopers LLP remain as the Society’s auditors until the Annual General Meeting when a resolution will be proposed to appoint KPMG LLP as auditors to the Society.
Post Balance Sheet EventsThe directors consider that there have been no events since the year end that have an important effect on the position of the Society.
Rachel Court
Chair
22 February 2017
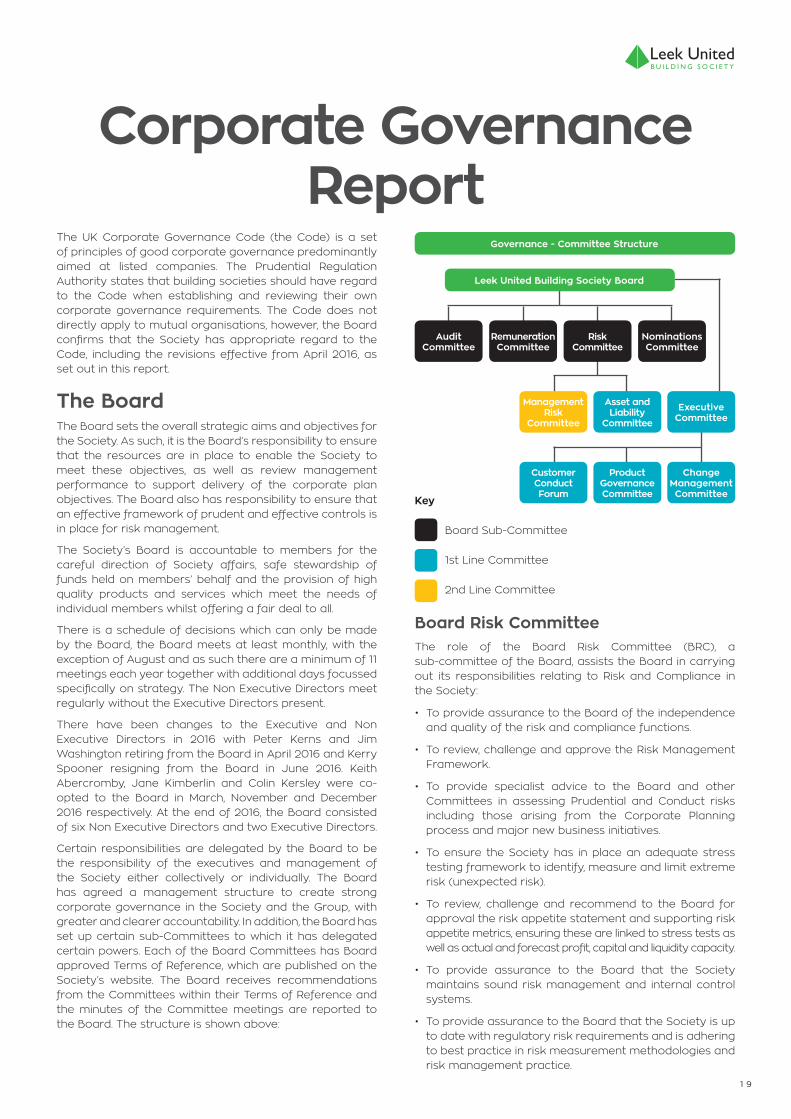
The UK Corporate Governance Code (the Code) is a set of principles of good corporate governance predominantly aimed at listed companies. The Prudential Regulation Authority states that building societies should have regard to the Code when establishing and reviewing their own corporate governance requirements. The Code does not directly apply to mutual organisations, however, the Board confirms that the Society has appropriate regard to the Code, including the revisions effective from April 2016, as set out in this report.
The BoardThe Board sets the overall strategic aims and objectives for the Society. As such, it is the Board’s responsibility to ensure that the resources are in place to enable the Society to meet these objectives, as well as review management performance to support delivery of the corporate plan objectives. The Board also has responsibility to ensure that an effective framework of prudent and effective controls is in place for risk management.
The Society’s Board is accountable to members for the careful direction of Society affairs, safe stewardship of funds held on members’ behalf and the provision of high quality products and services which meet the needs of individual members whilst offering a fair deal to all.
There is a schedule of decisions which can only be made by the Board, the Board meets at least monthly, with the exception of August and as such there are a minimum of 11 meetings each year together with additional days focussed specifically on strategy. The Non Executive Directors meet regularly without the Executive Directors present.
There have been changes to the Executive and Non Executive Directors in 2016 with Peter Kerns and Jim Washington retiring from the Board in April 2016 and Kerry Spooner resigning from the Board in June 2016. Keith Abercromby, Jane Kimberlin and Colin Kersley were co-opted to the Board in March, November and December 2016 respectively. At the end of 2016, the Board consisted of six Non Executive Directors and two Executive Directors.
Certain responsibilities are delegated by the Board to be the responsibility of the executives and management of the Society either collectively or individually. The Board has agreed a management structure to create strong corporate governance in the Society and the Group, with greater and clearer accountability. In addition, the Board has set up certain sub-Committees to which it has delegated certain powers. Each of the Board Committees has Board approved Terms of Reference, which are published on the Society’s website. The Board receives recommendations from the Committees within their Terms of Reference and the minutes of the Committee meetings are reported to the Board. The structure is shown above:
Key
Board Sub-Committee
1st Line Committee
2nd Line Committee
Board Risk CommitteeThe role of the Board Risk Committee (BRC), a sub-committee of the Board, assists the Board in carrying out its responsibilities relating to Risk and Compliance in the Society:
• To provide assurance to the Board of the independence and quality of the risk and compliance functions.
• To review, challenge and approve the Risk Management Framework.
• To provide specialist advice to the Board and other Committees in assessing Prudential and Conduct risks including those arising from the Corporate Planning process and major new business initiatives.
• To ensure the Society has in place an adequate stress testing framework to identify, measure and limit extreme risk (unexpected risk).
• To review, challenge and recommend to the Board for approval the risk appetite statement and supporting risk appetite metrics, ensuring these are linked to stress tests as well as actual and forecast profit, capital and liquidity capacity.
• To provide assurance to the Board that the Society maintains sound risk management and internal control systems.
• To provide assurance to the Board that the Society is up to date with regulatory risk requirements and is adhering to best practice in risk measurement methodologies and risk management practice.
19
Corporate Governance Report
Governance - Committee Structure
Nominations Committee
Risk Committee
Remuneration Committee
Audit Committee
Executive Committee
Asset and Liability
Committee
Management Risk
Committee
Product Governance Committee
Customer Conduct Forum
Change Management Committee
Leek United Building Society Board
20
Corporate Governance Report
(continued)
• To review, challenge and recommend to the Board for approval the Internal Capital Adequacy Assessment Process (ICAAP) document.
• To review and approve the terms of reference of the Management Risk Committee (MRC) and the Asset and Liability Committee (ALCO).
• To receive a report summarising any fraudulent activity identified against the Society and on accounts of customers of the Society, ensuring any fraud investigations are performed effectively.
At 31 December 2016, the BRC comprised Richard Goddard (Chair), Keith Abercromby, Rachel Court, Jane Kimberlin and John Leveson.
The BRC is supported by the Management Risk Committee (MRC) and the Asset and Liability Committee (ALCO).
The MRC’s main responsibility is to assess the management of operational, credit and conduct risk together with legal and regulatory risk across the Group. Responsibilities of the MRC also include ensuring the detailed application of the Risk Management Framework and the development of key risk policies and indicators.
The ALCO supervises the Group’s Treasury and financial risk management activities and advises and supports the Finance Director in carrying out his responsibilities, including the identification, management and control of the balance sheet risks and the overview and monitoring of relevant risk control frameworks. Management of market, liquidity and strategic risk has been delegated to the ALCO.
Board Audit CommitteeThe Board Audit Committee (BAC), a sub-committee of the Board, assists the Board in carrying out its responsibilities as follows:
• To review the effectiveness of the Society’s first and second lines of defence, internal controls and risk management systems established by management, to identify, assess, manage and monitor financial and non-financial risks, for ensuring compliance with the regulatory environment in which the Society operates.
• To review management’s and the internal auditor’s reports on the effectiveness of systems for internal financial control, financial reporting and risk management, including all aspects of the first and second lines of defence.
• To review the adequacy and security of the Society’s arrangements for its employees and contractors to raise concerns in confidence about possible wrong doing in financial reporting or other matters.
• To approve the appointment or removal of the Society’s Internal Auditor and monitoring the effectiveness of the
Internal Audit function in its operation of the third line of defence.
• To monitor the integrity of the financial statements of the Society, reviewing any significant financial judgements contained therein.
• To review the Pillar 3 disclosure and recommend to the Board for approval.
• To oversee the appointment, reappointment and removal process of the external auditor; reviewing their performance, objectivity and independence.
At 31 December 2016, the Committee comprised Richard Goddard (Chair), Keith Abercromby, Colin Kersley and John Leveson.
Remuneration CommitteeThe Board has established the Remuneration Committee to which it has delegated the following responsibilities:
• To review the overall remuneration policy for the Society.
• To approve appropriate levels of remuneration and conditions for Executive Directors and the Head of Risk and Compliance.
• To set the level of fees payable to the Chair of the Board.
• To approve any incentive schemes (excluding those that relate to Executive Directors which are referred to the Board).
• To establish the parameters within which the Executive Directors are to conduct negotiations with employee representatives recognised by the Society for the purpose of setting the general level of remuneration and conditions of employment for all other employees.
The Committee makes an annual report to members which can be found on page 25. The Committee is composed entirely of Non Executive Directors and as at 31 December 2016, comprised John Leveson (Chair), Rachel Court and Jane Kimberlin.
Nominations CommitteeThe Board has established the Nominations Committee to which it has delegated the following responsibilities:
• To ensure that appropriate arrangements are in place for the recruitment and selection of suitably qualified persons to act as Directors (both Non Executive and Executive) of the Society.
• To ensure that a ‘Board Succession Plan’ is in place in order to facilitate that recruitment and that the Board remains ‘fit for purpose’ in terms of skills, knowledge, expertise and experience required at any given time.

21
• To periodically review the structure, size and composition of the Board including a review of the skills, knowledge and experience mix of the members of the Board in order to ensure that such mix remains relevant to the business of the Society at any given time.
• To identify any role other than that of Director for which the Committee deems it appropriate to assume responsibility for the recruitment and selection of a suitable candidate for any and all such roles.
At 31 December 2016, the Committee comprised Rachel Court (Chair), Richard Goddard, Colin Kersley and Kevin Wilson.
Division of ResponsibilitiesThe offices of Chair and Chief Executive are held by different people, with a clear division of responsibilities which are set out in writing and agreed by the Board. The Chief Executive has responsibility for managing the Society in line with strategies, policies and delegated authorities as agreed by the Board.
The ChairThe Chair is responsible for leadership of the Board and ensuring the Board’s effectiveness in all aspects of its role. In addition, the Chair sets the direction and culture of the Board, promoting a culture of openness and fairness by facilitating effective debate and contribution and maintaining constructive relationships between the Executive and Non Executive Directors. The Chair also ensures that Directors receive accurate, timely and clear information.
The Society’s current Chair, Rachel Court, was appointed as a Non Executive Director in November 2014. During April 2016, she was elected to be the Chair of the Board following the retirement of the former Chairman. Rachel Court has never been chief executive or an employee of Leek United Building Society.
Non Executive DirectorsOver the course of the year, the Non Executive Directors participate in regular discussions about matters of strategic importance. They also attend a Board Strategy day on an annual basis with the Executive Directors to identify, debate and assess the strategic options available to the Society. Using the options identified, a five year Corporate Plan is prepared by the Society’s management and Executives which is subject to rigorous challenge by the Non Executive Directors.
The Senior Independent Director of the Society provides a sounding board for the Chair and serves as an intermediary for the other directors where necessary. The Senior Independent Director also has responsibility for leading Non Executive Directors in the performance appraisal of the Chair and to act as a contact for any member who may feel that contact with the Chair or Chief Executive would not be appropriate.
The Senior Independent Director for the Society is Richard Goddard who is pleased to act as an alternative contact point for members.
The Composition of the BoardAt the end of 2016, the Board consisted of six Non Executive Directors and two Executive Directors.
The composition of the Board is reviewed at regular intervals (at least annually on a formal basis) and changes progressively over time in a planned manner and in line with the good practices specified in the Code. The Board is responsible for ensuring that any subsidiary Board has the appropriate range of skills, expertise and experience, particularly where a non-core activity is carried out in a subsidiary.
Responsibility for issues relating to Board composition and succession planning is delegated to the Nominations Committee.
The Board considers that all Non Executive Directors are independent and carry out their duties with complete objectivity. The Board has no Non Executive Directors whose service exceeds six years. All directors are required to submit themselves for re-election at least once every three years.
Appointments to the BoardThe Nominations Committee has responsibility for ensuring that appropriate arrangements are in place for the recruitment and selection of suitably qualified persons to act as directors (both Non Executive and Executive) of the Society. The Committee maintains a ‘Board Succession Plan’ in order to facilitate that recruitment and that the Board remains ‘fit for purpose’ in terms of the skills, knowledge, expertise and experience required at any given time.
The Society uses independent executive search and selection agencies, to support the recruitment of Non Executive Directors. In 2016, the Society used Warren Partners and Miles Partnership for the recruitment of Non Executive Directors; the Society’s only connection with Warren Partners and Miles Partnership is for recruitment and selection. Careful consideration is given to the combined skills, experience and diversity of existing Board members in making new appointments to the Board. As relevant to their individual role, all directors conform to the requirements of the Senior Managers Regime governed by the Financial Conduct Authority and Prudential Regulation Authority and pass the ‘fit and proper’ test specified. All directors are also subject to election by members at the AGM following their appointment.
The Society believes that diversity amongst Board members is of value and this is considered alongside the key requirements of relevant knowledge, skill and expertise to perform effectively as a member of the Board. It is the Society’s policy to make appointments to the Board without regard to age, ethnic origin, creed, marital status, disability, sexual orientation and religion or belief.
22
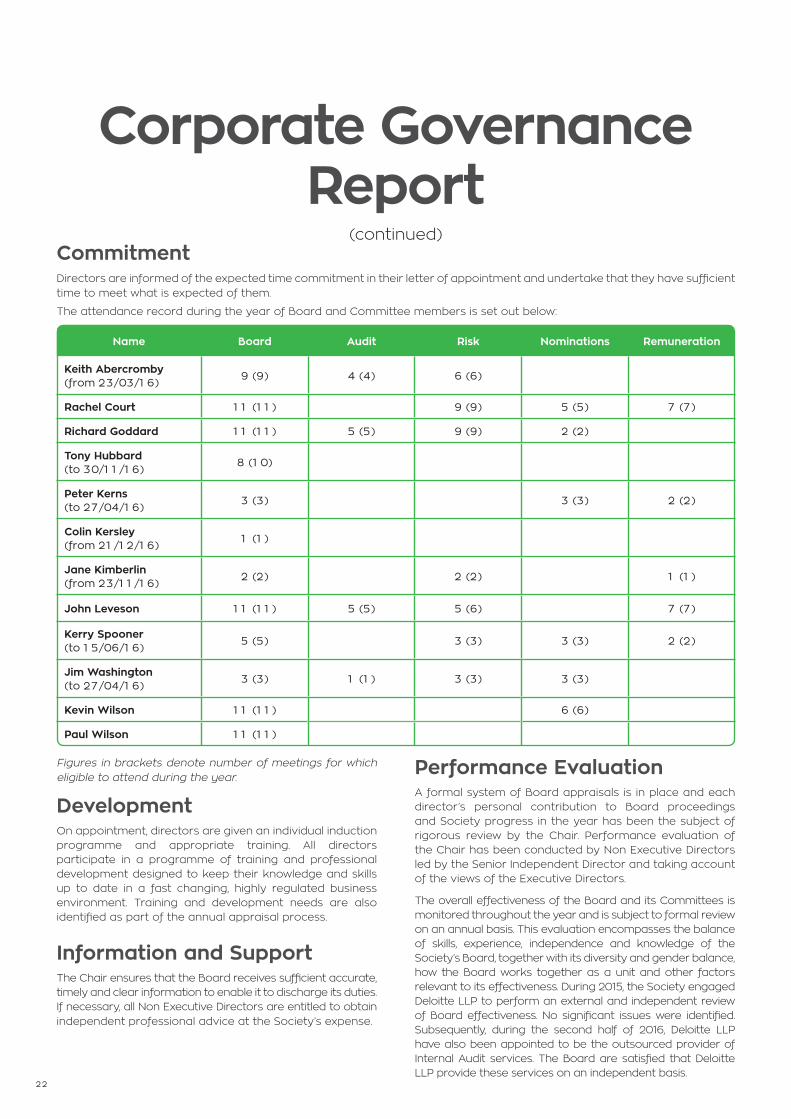
CommitmentDirectors are informed of the expected time commitment in their letter of appointment and undertake that they have sufficient time to meet what is expected of them.
The attendance record during the year of Board and Committee members is set out below:
Figures in brackets denote number of meetings for which eligible to attend during the year.
DevelopmentOn appointment, directors are given an individual induction programme and appropriate training. All directors participate in a programme of training and professional development designed to keep their knowledge and skills up to date in a fast changing, highly regulated business environment. Training and development needs are also identified as part of the annual appraisal process.
Information and SupportThe Chair ensures that the Board receives sufficient accurate, timely and clear information to enable it to discharge its duties. If necessary, all Non Executive Directors are entitled to obtain independent professional advice at the Society’s expense.
Performance EvaluationA formal system of Board appraisals is in place and each director’s personal contribution to Board proceedings and Society progress in the year has been the subject of rigorous review by the Chair. Performance evaluation of the Chair has been conducted by Non Executive Directors led by the Senior Independent Director and taking account of the views of the Executive Directors.
The overall effectiveness of the Board and its Committees is monitored throughout the year and is subject to formal review on an annual basis. This evaluation encompasses the balance of skills, experience, independence and knowledge of the Society’s Board, together with its diversity and gender balance, how the Board works together as a unit and other factors relevant to its effectiveness. During 2015, the Society engaged Deloitte LLP to perform an external and independent review of Board effectiveness. No significant issues were identified. Subsequently, during the second half of 2016, Deloitte LLP have also been appointed to be the outsourced provider of Internal Audit services. The Board are satisfied that Deloitte LLP provide these services on an independent basis.
Corporate Governance Report
(continued)
Name Board Audit Risk Nominations Remuneration
Keith Abercromby (from 23/03/16) 9 (9) 4 (4) 6 (6)
Rachel Court 11 (11) 9 (9) 5 (5) 7 (7)
Richard Goddard 11 (11) 5 (5) 9 (9) 2 (2)
Tony Hubbard (to 30/11/16)
8 (10)
Peter Kerns (to 27/04/16)
3 (3) 3 (3) 2 (2)
Colin Kersley (from 21/12/16)
1 (1)
Jane Kimberlin (from 23/11/16)
2 (2) 2 (2) 1 (1)
John Leveson 11 (11) 5 (5) 5 (6) 7 (7)
Kerry Spooner (to 15/06/16)
5 (5) 3 (3) 3 (3) 2 (2)
Jim Washington (to 27/04/16)
3 (3) 1 (1) 3 (3) 3 (3)
Kevin Wilson 11 (11) 6 (6)
Paul Wilson 11 (11)

23
Re-electionNon Executive Directors with over nine years’ service are required to offer themselves for re-election on an annual basis. All directors are required to submit themselves for re-election at least once every three years.
Financial and Business ReportingThe Board and Audit Committee believes that the Annual Report and Accounts, taken as a whole, is fair, balanced and understandable and provides the necessary information for Members to assess performance, strategy and the business model of the Society. The Statement of Directors’ Responsibilities on page 26 sets out the Board’s responsibilities in relation to the preparation of the Annual Report and Accounts. Business performance is reviewed in the Chair’s Statement, Chief Executive’s Business Review and the Strategic Report. The accounts have been prepared under the going concern principle.
The Audit Committee has considered the Annual Report and Accounts and considered the key judgemental items in relation to the financial statements for 2016 including:
• The provision required for both individual and collective mortgage provisions. This is assessed on the level of arrears and forbearance on customer accounts. The key judgements are the level of loans that will actually default as well as expected levels of loan exposure compared to expected levels of security including mortgage indemnity insurance where relevant.
• The provision relating to the Financial Services Compensation Scheme (FSCS) levy. This estimate is based on publically available information at the time, in respect of the levy for 2016 and future years. It is affected by the Society’s market share of protected deposits and the interest requirements of the FSCS.
• The assumptions utilised in the valuation of the defined benefit pension scheme. This is particularly sensitive to asset valuations as well as expectations of long term corporate bond yields, inflation and mortality. Management appointed a third party specialist for the valuation of the defined benefit pension scheme which included advice on the assumptions to use and the sensitivities of those assumptions. The Committee were satisfied that the pension assumptions were within an appropriate range by reviewing the sensitivities and benchmarking with external data and with other organisations.
• The assumptions, basis and sensitivities for fair values of derivatives and financial assets, hedge accounting and effective interest rate adjustments.
Further detail regarding the sensitivities of these assumptions is included on pages 38-39 within the Notes to the Accounts.
The Committee reviewed and challenged the assumptions, estimates, risks and sensitivities for each accounting estimate and was satisfied that the provisions were towards the prudent end of the range of sensitivities and that they were appropriately dealt with in the accounts.
Risk Management and Internal ControlThe Society uses the Risk Management Framework as part of our strategy to manage risk proactively in accordance with our prudent risk appetite stance.
During 2016, the Society’s Principal Risks were managed through the following Committees:
The Board own and approve the risk appetite, as set out on page 14, for the Society including the Risk Management Framework. The Risk Management Framework identifies the process, ownership, responsibilities and the risk oversight required to support effective implementation across the Society.
The Society operates a ‘three lines of defence’ governance model, as shown on page 13, to ensure appropriate responsibility is allocated to the management, reporting and escalation of risks. Supervision and direction is facilitated by the operation of a number of Board Committees, which meet regularly to consider issues specific to key business areas.
The Board has identified a number of principal risks and uncertainties that could threaten its business model, future performance, solvency or liquidity. These risks together with the way in which they are mitigated, are included within the ‘Principal Risks and Uncertainties’ Section of the Strategic Report.
Board
Board Risk Committee
Management Risk
Committee
Asset & Liability
Committee
Pension Risk Operational Risk Market Risk
Conduct RiskLiquidity &
Funding Risk
Legal & Regulatory Risk
Strategic Risk
Credit Risk
A team of ladies from Leek United took part in the ‘Pretty Muddy’ Race for Life event at Central Forest Park in Hanley in 2016.

24
Audit Committee and AuditorsThe role of the Audit Committee is set out on page 20. The Committee comprises four members, all of whom are Non Executive Directors, and meets at least four times a year, and where appropriate, this coincides with key dates in the Society’s financial reporting cycle. At least annually, the Committee meets with the external and internal auditors without the Executive Directors present. The Society has an Audit Committee approved policy on the provision of non-audit service by the auditor. The policy reflects the requirements of the UK Corporate Governance Code and legislation on EU Audit Reform. This sets out both qualitative and quantitative criteria on the relevant services and governance procedures.
The Committee assesses the effectiveness of the external audit process through a combination of feedback from Committee members and Society management, completion of standard questionnaires and other external independent information where available. The external auditor, PricewaterhouseCoopers LLP, has been engaged by the Society since the audit of the 1998 financial statements. The Committee, therefore, undertook an external tender process during 2016 to review the Society’s external auditor engagement and with effect from the 2017 financial statements KPMG LLP will be appointed subject to member approval at the AGM.
During 2016, the Audit Committee invited applicants to tender for the Society’s internal audit. The Audit Committee performed a rigorous and robust assessment of relevant parties and as a result, the Audit Committee appointed Deloitte LLP as the Society’s internal auditors. Deloitte LLP provides independent and objective assurance regarding the design and performance of risk management systems and controls.
RemunerationThe Directors’ Remuneration Report is set out on page 25.
Dialogue with ShareholdersAs a mutual organisation, the Society has members rather than shareholders. The views of new and existing members are sought by individual questionnaires during the year. Member Forums are held each year when the Chief Executive supported by the Chair and other Executive Directors gives a presentation on the main business developments. The members present at the forum are given the opportunity to raise questions to the directors and senior management. The Society also has a Senior Independent Director providing a further means by which members can communicate with the Society.
Constructive use of the Annual General Meeting (AGM)The Society sends details of the AGM to all members who are eligible to vote. Members are encouraged to vote or appoint a proxy vote if they cannot, or chose not to, attend the AGM. For wider customer choice, the Society has provided access to members to be able to vote on-line. A donation to charity is made for each vote cast.
All members of the Board are present at the AGM (unless their absence is unavoidable). The Chair of each of the Committees is, therefore, available to answer questions raised by members.
On behalf of the Board of Directors
Rachel Court
Chair
22 February 2017
Corporate Governance Report
(continued)
Supporting Stoke City Football Club Community Trust’s ‘Big Sleep Out’ to highlight the plight of the homeless.
25
Directors’ Remuneration Report
The Society’s Remuneration Committee is composed solely of Non Executive Directors. The Committee’s principal responsibilities are to review and recommend to the Board the overarching remuneration policy for the Society as a whole, determine the overall increase that is appropriate in respect of the annual review of salaries, approve the specific level of remuneration for Executive Directors and the Head of Risk and Compliance, a Senior Manager, set the level of fees payable to the Chair of the Board and approve any incentive schemes (excluding those that relate to Executive Directors which are referred to the Board). In determining remuneration, the Committee considers the guidance in the UK Corporate Governance Code April 2016 (the Code) and applies the FCA Remuneration Code.
The Level and Components of RemunerationExecutive DirectorsThe main elements of each Executive Director’s remuneration package are - basic salary, pension benefits, private medical insurance and the provision of a company car or car allowance. A performance related pay scheme is in operation for all staff in the Society, and the Executive Directors participate in this scheme. The scheme has robust performance measures based on the Society’s performance, and results in a maximum payment of £1,000 per annum regardless of salary. The full payment of £1,000 has been awarded to all qualifying staff for 2016, payable in March 2017. The Chief Executive is a member of the Leek United Building Society Pension and Assurance Scheme, which closed for future accrual on 24 April 2013. Both the Chief Executive and Finance Director are members, and the Operations Director was a member, of the defined contribution stakeholder pension scheme. With effect from June 2015, the Chief Executive elected to receive the equivalent contribution to that provided in the defined contribution scheme in the form of a cash allowance.
The Corporate Governance Code recommends that an Executive Director’s service contract period should be set at 12 months or less and the contractual notice period for all Executive Directors conforms to this limit.
Non Executive DirectorsNon Executive Directors receive fees for the provision of their services, including additional fees for Chairmanship of Committees as well as reimbursement of relevant expenses. They do not have service contracts and do not receive any other benefits, bonus or pension entitlement.
They are subject to tri-annual re-election by the members at an Annual General Meeting and those who continue beyond a third three year term are subject to annual re-election thereafter.
The Procedure for Determining RemunerationThe remuneration of the Executive Directors is determined by the Remuneration Committee which comprises of a minimum of three Non Executive Directors (at 31 December 2016: three Non Executive Directors) and in addition the Chief Executive and Finance Director attend by invitation but take no part in the discussion of their own salary. The Committee meets a minimum of four times a year.
In determining the remuneration of Non Executive and Executive Directors, both the Board and the Remuneration Committee take account of fees and salaries payable and other benefits provided to Non Executive Directors, Executive Directors and Chairmen of building societies that are similar in size and complexity to Leek United Building Society.
Directors’ RemunerationThe table in note 7 to the Annual Report and Accounts summarises directors’ pay and benefits for the year ended 31 December 2016.
Member ConsultationThe Directors’ Remuneration Report will be the subject of an advisory vote at this year’s AGM.
John Leveson
Chair of the Remuneration Committee
22 February 2017

26
Statement of Directors’ Responsibilities
Directors’ Responsibilities for Preparing the Annual Report and AccountsThe following statement, which should be read in conjunction with Independent Auditors’ Report on page 27, is made by the directors to explain their responsibilities in relation to the preparation of the Annual Report and Accounts, Annual Business Statement, Strategic Report and Directors’ Report.
Under the Building Societies Act 1986, the directors are required to prepare, for each financial year, annual accounts which give a true and fair view:
• Of the state of the affairs of the Society and of the Group as at the end of the financial year;
• Of the income and expenditure of the Society and of the Group for the financial year.
In preparing these accounts, the directors are required to:
• Select suitable accounting policies and then apply them consistently;
• Make judgements and estimates that are reasonable and prudent;
• State whether applicable UK accounting standards have been followed, subject to any material departures disclosed and explained in the financial statements;
• Prepare the accounts on the going concern basis, unless it is inappropriate to presume that the Society and Group will continue in business.
In addition to the accounts, the Building Societies Act requires the directors to prepare, for each financial year, an annual business statement and a directors’ report, containing prescribed information relating to the business of the Group, if not already contained within the strategic report.
The directors are responsible for the maintenance and integrity of the corporate and financial information included on the Society’s website. Legislation in the UK, governing the preparation and dissemination of financial statements, may differ from legislation in other jurisdictions.
Directors’ Responsibilities for Accounting Records and Internal ControlThe directors are responsible for ensuring that the Society and its connected undertakings:
• Keep accounting records which disclose with reasonable accuracy the financial position of the Society and the Group and which enable them to ensure that the Annual Report and Accounts comply with the Building Societies Act 1986, and
• Establish and maintain systems and controls as are appropriate to its business in accordance with the rules made by the Financial Conduct Authority and the Prudential Regulation Authority under the Financial Services and Markets Act 2000.
The directors have general responsibility for safeguarding the assets of the Society and Group and for taking reasonable steps for the prevention and detection of fraud and other irregularities.
The directors are satisfied that the Annual Report and Accounts, taken as a whole, are fair, balanced and understandable and provide the information necessary for members to assess the Society’s performance, business model and strategy.
Rachel Court
Chair
22 February 2017

27
Independent Auditors’ Report to the Members of Leek United Building Society
Report on the annual accountsOur OpinionIn our opinion, Leek United Building Society’s group annual accounts and society annual accounts (the “annual accounts”):
• give a true and fair view of the state of the group’s and of the society’s affairs as at 31 December 2016 and of the group’s and the society’s income and expenditure and cash flows for the year then ended;
• have been properly prepared in accordance with United Kingdom Generally Accepted Accounting Practice; and
• have been prepared in accordance with the requirements of the Building Societies Act 1986.
What we have auditedLeek United Building Society’s annual accounts comprise:
• the group and society statements of financial position as at 31 December 2016;
• the group and society income statements for the year then ended;
• the group and society statements of comprehensive income for the year then ended;
• the group and society statements of cash flows for the year then ended;
• the group and society statements of changes in members’ interests for the year then ended; and
• the notes to the annual accounts, which include a summary of significant accounting policies and other explanatory information.
Certain required disclosures have been presented elsewhere in the annual report & accounts (the “Annual report”), rather than in the notes to the annual accounts. These are cross-referenced from the annual accounts and are identified as audited.
The financial reporting framework that has been applied in the preparation of the annual accounts is United Kingdom Accounting Standards, comprising FRS 102 "The Financial Reporting Standard applicable in the UK and Republic of Ireland" and applicable law (United Kingdom Generally Accepted Accounting Practice).
In applying the financial reporting framework the directors have made a number of subjective judgements, for example in respect of significant accounting estimates. In making such estimates, they have made assumptions and considered future events.
Opinion on other matters prescribed by the Building Societies Act 1986In our opinion:
• the Annual Business Statement and the Directors’ Report have been prepared in accordance with the requirements of the Building Societies Act 1986;
• the information given in the Directors’ Report for the financial year for which the annual accounts are prepared is consistent with the accounting records and the annual accounts; and
• the information given in the Annual Business Statement (other than the information upon which we are not required to report) gives a true representation of the matters in respect of which it is given.
Other matters on which we are required to report by exceptionPropriety of accounting records and information and explanations received
Under the Building Societies Act 1986 we are required to report to you if, in our opinion:
• proper accounting records have not been kept by the society; or
• the society annual accounts are not in agreement with the accounting records; or
• we have not received all the information and explanations and access to documents we require for our audit.
We have no exceptions to report arising from this responsibility.
Working with junior schools to promote the importance of saving.
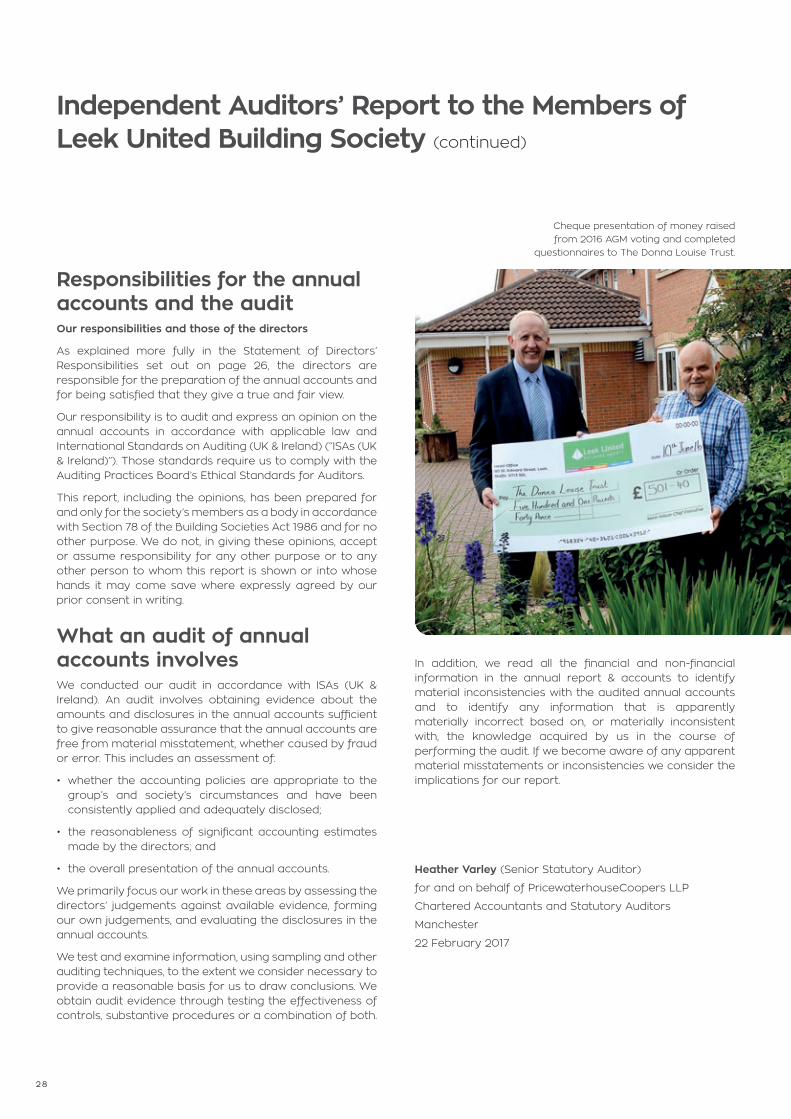
28
Responsibilities for the annual accounts and the auditOur responsibilities and those of the directors
As explained more fully in the Statement of Directors’ Responsibilities set out on page 26, the directors are responsible for the preparation of the annual accounts and for being satisfied that they give a true and fair view.
Our responsibility is to audit and express an opinion on the annual accounts in accordance with applicable law and International Standards on Auditing (UK & Ireland) (“ISAs (UK & Ireland)”). Those standards require us to comply with the Auditing Practices Board’s Ethical Standards for Auditors.
This report, including the opinions, has been prepared for and only for the society’s members as a body in accordance with Section 78 of the Building Societies Act 1986 and for no other purpose. We do not, in giving these opinions, accept or assume responsibility for any other purpose or to any other person to whom this report is shown or into whose hands it may come save where expressly agreed by our prior consent in writing.
What an audit of annual accounts involvesWe conducted our audit in accordance with ISAs (UK & Ireland). An audit involves obtaining evidence about the amounts and disclosures in the annual accounts sufficient to give reasonable assurance that the annual accounts are free from material misstatement, whether caused by fraud or error. This includes an assessment of:
• whether the accounting policies are appropriate to the group’s and society’s circumstances and have been consistently applied and adequately disclosed;
• the reasonableness of significant accounting estimates made by the directors; and
• the overall presentation of the annual accounts.
We primarily focus our work in these areas by assessing the directors’ judgements against available evidence, forming our own judgements, and evaluating the disclosures in the annual accounts.
We test and examine information, using sampling and other auditing techniques, to the extent we consider necessary to provide a reasonable basis for us to draw conclusions. We obtain audit evidence through testing the effectiveness of controls, substantive procedures or a combination of both.
In addition, we read all the financial and non-financial information in the annual report & accounts to identify material inconsistencies with the audited annual accounts and to identify any information that is apparently materially incorrect based on, or materially inconsistent with, the knowledge acquired by us in the course of performing the audit. If we become aware of any apparent material misstatements or inconsistencies we consider the implications for our report.
Heather Varley (Senior Statutory Auditor)
for and on behalf of PricewaterhouseCoopers LLP
Chartered Accountants and Statutory Auditors
Manchester
22 February 2017
Independent Auditors’ Report to the Members of Leek United Building Society (continued)
Cheque presentation of money raised from 2016 AGM voting and completed
questionnaires to The Donna Louise Trust.

Income Statements for the year ended 31 December 2016
Notes
Group2016
£000’s
Group2015
£000’s
Society2016
£000’s
Society2015
£000’s
Interest receivable and similar income 2 20,665 22,986 20,659 22,979
Interest payable and similar charges 3 (8,781) (10,818) (8,781) (10,819)
Net interest income 1 1 ,884 12,168 11 ,878 12,160
Income from investments 4 - - 300 -
Fees and commissions receivable 5 972 1 ,003 762 710
Fees and commissions payable (181) ( 17 1) (1 8 1 ) (171)
Net (losses)/gain from derivative financial instruments 6 (264) 91 (264) 91
Total net income 1 2 , 4 1 1 13,091 12,495 12,790
Administrative expenses 7 (8,484) (7,948) (8,274) (7,762)
Depreciation 16 (234) (187) (228) (178)
3,693 4,956 3,993 4,850
Net finance credit on pension scheme 26 (82) (87) (82) (87)
Net impairment gains/(losses) on loans and advances 8 7 (203) 7 (203)
Provisions for contingent liabilities and Commitments - FSCS Levy 24 (123) (150) (123) (150)
Profit on ordinary activities before tax 3,495 4,516 3,795 4,410
Tax on profit on ordinary activities 9 (714) (916) (712) (895)
Profit for the financial year 28 2 ,781 3,600 3,083 3,515
The notes on pages 35 to 66 form part of these accounts.
The above results are all derived from continuing operations. There is no material difference in the current or previous year between the results above and the results which would have been reported on an unmodified historical basis.
29

Notes
Group2016
£000’s
Group2015
£000’s
Society2016
£000’s
Society2015
£000’s
Profit for the financial year 2 ,781 3,600 3 ,083 3 ,515
Items that will not be reclassified to the Income Statement
Actuarial loss recognised in pension scheme 26 (4,338) (201) (4,338) (201)Taxation on items that will not be reclassified to the income statement 17 680 14 680 14
Items that may subsequently be reclassified to the Income Statement
Available for Sale reserve 30 148 (220) 148 (220)Tax on items that may subsequently be reclassified to the income statement 30 6 46 6 46
Tax on revaluation reserve 29 40 12 40 12
Other Comprehensive Expense for the year net of income tax (3,464) (349) (3,464) (349)
Total Comprehensive (Expense)/Income for the financial year (683) 3,251 (381) 3,166
Statements of Comprehensive Income for the year ended 31 December 2016
30

31
Statements of Financial Position as at 31 December 2016
Notes
Group2016
£000’s
Group2015
£000’s
Society2016
£000’s
Society2015
£000’sASSETSLiquid assets:
Cash in hand and balances with the Bank of England 10 101,263 47,009 101,263 47,009
Loans and advances to credit institutions 11 12,577 11,544 12,443 11,460
Debt securities 12 66,488 113,247 66,488 113,247
180,328 171,800 180,194 171,716
Derivative financial instruments 13 498 84 498 84
Loans and advances to customers 14 742,844 715,182 742,761 715,037
Investments in subsidiary undertakings 15 - - 24 24
Fixed assets 16 2,446 2,360 2,446 2,338
Other assets 17 1,220 752 1,288 752
Prepayments and accrued income 18 556 469 556 469
Total assets 927,892 890,647 927,767 890,420
LIABILITIESShares 19 836,578 805,115 836,578 805,115
Amounts owed to other customers 20 21,781 20,360 21,781 20,360
Derivative financial instruments 13 3,387 1,501 3,387 1,501
Other liabilities 21 656 646 654 844
Accruals and deferred income 22 887 811 869 793
Provisions for liabilities and charges 23 582 659 582 659
Retirement benefit obligations 26 5,994 2,845 5,994 2,845
Total liabilities 869,865 831,937 869,845 832,117
Reserves
General reserve 28 56,894 57,771 56,789 57,364
Revaluation reserve 29 1,007 967 1,007 967
Available for Sale reserve 30 126 (28) 126 (28)
Total reserves attributable to members of the Society 58,027 58,710 57,922 58,303
Total reserves and liabilities 927,892 890,647 927,767 890,420
These accounts were approved by the board of directors on 22 February 2017 and were signed on its behalf by:
Rachel Court Chair
Kevin Wilson Chief Executive
Paul Wilson Finance Director
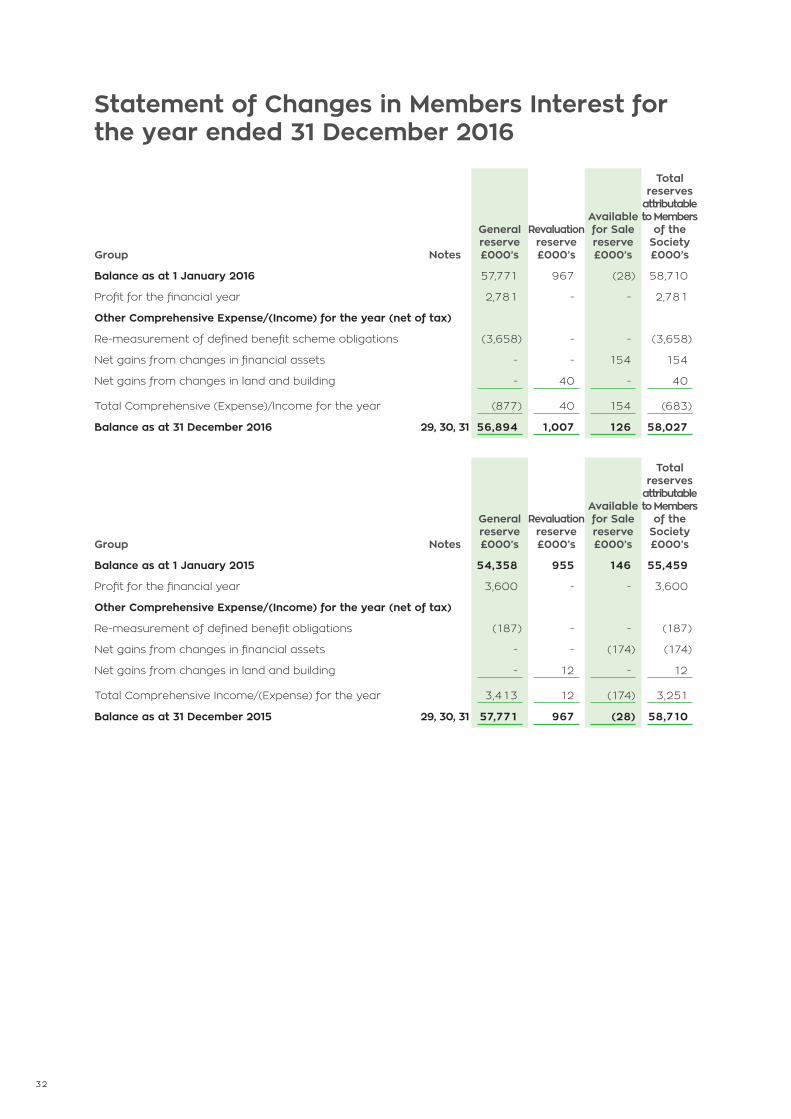
32
Statement of Changes in Members Interest for the year ended 31 December 2016
Group Notes
Generalreserve£000’s
Revaluationreserve£000’s
Availablefor Salereserve£000’s
Total reserves
attributable to Members
of the Society£000’s
Balance as at 1 January 2016 57,771 967 (28) 58,710
Profit for the financial year 2,781 - - 2,781
Other Comprehensive Expense/(Income) for the year (net of tax)
Re-measurement of defined benefit scheme obligations (3,658) - - (3,658)
Net gains from changes in financial assets - - 154 154
Net gains from changes in land and building - 40 - 40
Total Comprehensive (Expense)/Income for the year (877) 40 154 (683)
Balance as at 31 December 2016 29, 30, 31 56,894 1,007 126 58,027
Group Notes
Generalreserve£000’s
Revaluationreserve£000’s
Availablefor Salereserve£000’s
Total reserves
attributable to Members
of the Society£000’s
Balance as at 1 January 2015 54,358 955 146 55,459
Profit for the financial year 3,600 - - 3,600
Other Comprehensive Expense/(Income) for the year (net of tax)
Re-measurement of defined benefit obligations (187) - - (187)
Net gains from changes in financial assets - - (174) (174)
Net gains from changes in land and building - 12 - 12
Total Comprehensive Income/(Expense) for the year 3,413 12 (174) 3,251
Balance as at 31 December 2015 29, 30, 31 57,771 967 (28) 58,710

33
Statement of Changes in Members Interest as at 31 December 2016 (continued)
Society Notes
Generalreserve£000’s
Revaluationreserve£000’s
Availablefor Salereserve£000’s
Total reserves
attributable to Members
of the Society£000’s
Balance as at 1 January 2016 57,364 967 (28) 58,303
Profit for the financial year 3,083 - - 3,083
Other Comprehensive Expense/(Income) for the year (net of tax)
Re-measurement of defined benefit obligations (3,658) - - (3,658)
Net gains from changes in financial assets - - 154 154
Net gains from changes in land and building - 40 - 40
Total Comprehensive (Expense)/Income for the year (575) 40 154 (381)
Balance as at 31 December 2016 29, 30, 31 56,789 1,007 126 57,922
Society Notes
Generalreserve£000’s
Revaluationreserve£000’s
Availablefor Salereserve£000’s
Total reserves
attributable to Members
of the Society£000’s
Balance at 1 January 2015 54,036 955 146 55,137
Profit for the financial year 3,515 - - 3,515
Other Comprehensive Expense/(Income) for the year (net of tax)
Re-measurement of defined benefit obligations (187) - - (187)
Net gains from changes in financial assets - - (174) (174)
Net gains from changes in land and building - 12 - 12
Total Comprehensive Income/(Expense) for the year 3,328 12 (174) 3,166
Balance as at 31 December 2015 29, 30, 31 57,364 967 (28) 58,303

34
Statement of Cash Flows For the year ended 31 December 2016
Notes
2016£000’sGroup
2015£000’s Group
2016£000’s Society
2015£000’s Society
Cash flows from operating activitiesProfit on ordinary activities before tax 3,495 4,516 3,795 4,410
Depreciation 234 187 228 178
Decrease/(increase) in fair value of derivative financial instruments and hedged items 264 (91) 264 (91)
Decrease/(increase) in effective interest rate adjustment 89 (328) 89 (328)
(Decrease)/increase in impairment on loans and advances (7) 203 (7) 203
Amounts recovered in respect of loans previously written off 5 5 5 5
Net gains on disposal and amortisation of debt securities (27) (121) (27) (121)
Loss/(profit) on sale of tangible fixed assets 9 (12) 6 (7)
Total cash flow from operating activities 4,062 4,359 4,353 4,249
Changes in operating assets and liabilitiesIncrease in loans and advances to customers (26,541) (38,806) (26,603) (38,813)
Increase in accruals and deferred income 76 161 76 175
Increase in prepayments and accrued income (295) (531) (295) (530)
Increase/(decrease) in amounts owed to other customers 1,421 (4,006) 1,421 (4,006)
(Increase)/decrease in loans and advances to credit institutions (1,931) 750 (1,931) 750
Decrease in other assets - 2 (68) 2
Decrease in other liabilities (107) (23) (317) 56
Increase/(decrease) in shares 31,463 (15,377) 31,463 (15,377)
Decrease in liabilities and charges (77) (396) (77) (396)
Pension contributions (1,325) (52) (1,325) (52)
Non cash pension losses 136 148 136 148
Taxation paid (339) (657) (327) (624)
Net cash generated from operating activities 6,543 (54,428) 6,506 (54,418)
Cash flows from investing activitiesProceeds from sale of fixed assets 8 15 3 8
Purchase of fixed assets (337) (140) (345) (140)
Purchase of investment securities (112,776) (119,225) (112,776) (119,225)
Maturities and disposal of investment securities 159,918 109,788 159,918 109,788
Net cash used in investing activities 46,813 (9,562) 46,800 (9,569)
Net increase/(decrease) in cash and cash equivalents 53,356 (63,990) 53,306 (63,987)
Cash and cash equivalents at 1 January 56,803 120,793 56,719 120,706
Cash and cash equivalents at 31 December 27 110,159 56,803 110,025 56,719
Net cash generated from operating activities 53,356 (63,990) 53,306 (63,987)

35
Principal accounting policies
Basis of preparationThe accounts have been prepared in accordance with applicable accounting standards in the United Kingdom and with the Building Societies (Accounts and Related Provisions) Regulations 1998.
Basis of accounting The Group and Society financial statements have been prepared in compliance with UK Accounting Standards, including Financial Reporting Standard 102, the Financial Reporting Standard applicable in the United Kingdom and the Republic of Ireland (“FRS 102”) and the Building Societies Act 1986.
The accounts have been prepared on a going concern basis under the historical cost convention with the exception of the following:
• Land and buildings are included at valuation under the transitional rules of FRS 15 and FRS 102, consequently land and buildings have been included at their 1999 revalued amount
• Available for sale assets are held at fair value
• Derivatives and underlying hedged items are held at fair value
The accounts are presented in Sterling (£), there are no foreign currency transactions.
Basis of consolidationThe Group accounts include the results, cash flows and balance sheets of the Society and its subsidiaries.
The Group accounts consolidate the accounts of Leek United Building Society and all its subsidiary undertakings drawn up to 31 December each year. The Group accounts consolidate the assets, liabilities and results of the Society, and all of its subsidiaries, eliminating intercompany balances and transactions. All entities have accounting periods ending 31 December.
ExemptionsThe Group has taken exemption as provided in Section 33.1A of FRS 102 and does not disclose transactions with members of the same group that are wholly owned. See note 7 for disclosure of the directors’ remuneration and key management compensation.
Investments in subsidiary undertakingsInvestments in subsidiary undertakings are stated at cost less any provision for impairment.
Interest income and expenseInterest income and expense in respect of all Financial Assets is credited to the income and expenditure account as it becomes receivable with the exception of certain fees and cost that are recognised on an effective interest rate basis. These include cashback, application fees, valuation fees, broker fees and free Mortgage Indemnity Guarantee (MIG). The effect of the policy is to spread the impact of relevant costs and fees directly attributable and incremental to setting up the loan, over the effective life of the mortgage, which broadly equates to the incentive period of the mortgage.
Interest payable on shares and amounts owed to credit institutions and other customers is accrued on a daily interest basis.
Fees and commissionsFees payable and receivable other than relating to mortgage loans, including sales commission, are recognised when the relevant service is provided.
Financial assetsThe Group and Society have chosen to adopt the recognition and measurement provisions of IAS 39 - Financial Instruments: Recognition and Measurement, and disclosure requirements of section 11 and 12 of FRS 102 in respect of Financial Instruments.
a) Loans and receivables Loans and receivables are predominantly mortgage loans to customers and money market advances held for liquidity purposes. They are recorded at amortised cost, including any effective interest rate adjustment, less any impairment losses other than where an adjustment is made as part of a fair value hedging arrangement.
1
Notes to the Accounts for the year ended 31 December 2016

36
Principal accounting policies (continued)
b) Financial asset at fair value through profit and lossThe Group uses derivatives only for interest rate risk management purposes. It does not use derivatives for trading purposes. A fair value hedge is used to hedge exposures to variability in the fair value of financial assets and liabilities, such as fixed rate mortgages.
Derivatives are initially recognised at fair value on the date on which a derivative contract is entered into, and are subsequently re-measured at their fair value. Fair values of derivative financial instruments are calculated by discounted cash flow models using yield curves that are based on observable market data. All derivatives are carried as assets when their fair value is positive and as liabilities when their fair value is negative. Changes in the fair value of derivatives are recognised immediately in the income statement together with changes in the fair value of the hedged item that are attributable to the hedged risk within net gain/(losses) from Derivative Financial Instruments.
All derivatives entered into by the Group are for the purposes of providing an economic hedge. Hedge accounting is an optional treatment but the specific rules and conditions in IAS 39 have to be complied with before it can be applied. When transactions meet the criteria specified in IAS 39, the Group applies fair value hedge accounting so that changes in the fair value of the underlying asset or liability that are attributable to the hedged risk are recorded in the income statement to offset the fair value movement of the related derivative. The Group has classified all of its derivatives as fair value hedges. To qualify for hedge accounting at inception, the hedge relationship must be clearly documented. At inception the derivative must be expected to be highly effective in offsetting the hedged risk, and effectiveness must be tested throughout the life of the hedge relationship.
If the hedging derivative expires or is sold, terminated, or exercised, or the hedge no longer meets the criteria for fair value hedge accounting, or the hedge designation is revoked, hedge accounting is discontinued prospectively. If the underlying instrument is sold or repaid, the unamortised fair value adjustment is immediately recognised in the income statement and, therefore, as a consequence within the statement of changes in members interests. A summary of the effects of hedging and the associated fair value adjustments can be found in notes 13 and 25.
c) Available for Sale assets – debt securitiesAvailable for sale assets are non-derivative assets that are intended to be held for an indefinite period of time. They may be sold in response to needs for changes in liquidity or changes in interest rates. The Group’s debt securities are classified as available-for-sale assets. The Group measures debt securities at fair value, with subsequent changes in fair value being recognised through the Statement of Comprehensive Income, except for impairment losses which are recognised in profit or loss.
Further information regarding how fair values are determined can be found in note 25 to the accounts. Upon sale or maturity of the asset, the cumulative gains and losses recognised in other comprehensive income are removed from available-for-sale reserves and recycled to the Income Statement.
d) OffsettingFinancial assets and liabilities are offset and the net amounts presented in the accounts when there is a legally enforceable right to set off the recognised amounts and there is an intention to settle on a net basis or to realise the asset and settle the liability simultaneously. There are no financial assets or liabilities offset on the balance sheet.
Impairment of loans and advance to customersIndividual assessments are made of all mortgage loans that are three months or greater in arrears, in possession, or where there is specific concern about the realisation of the underlying collateral, for example due to structural issues with the property, and where there is objective evidence that all cash flows will not be received. Based upon these assessments, an individual impairment reduction of these assets is made. In addition, a collective impairment reduction is made against those loans and advances to customers where objective evidence, including forbearance measures, indicates that it is likely that losses may ultimately be realised and thus a loss event has occurred. The impairment value is calculated by applying various factors to each loan. These factors take into account the Group’s expectation of default and delinquency rate, loss emergence periods, regional house price movements and adjustments to allow for forced sale discounts, selling costs and any potential recovery of MIG. Impairment provisions are made to reduce the value of impaired loans and advances to the amount that is considered to be ultimately received based upon objective evidence.
Any increases or decreases in projected impairment losses are recognised through the Income Statement. If a loan is ultimately uncollectable, then any loss incurred by the Group on extinguishing the debt is written off against the provision for loan impairment. Any subsequent recoveries of amounts previously written off are recognised through the Income Statement.
1
Notes to the Accounts for the year ended 31 December 2016
37
Principal accounting policies (continued)
Forbearance strategyA range of forbearance options are available to support customers who are in financial difficulty, the purpose of which is to support customers who have temporary difficulties to get back on their feet. The main options offered are:
• Reduced monthly payment including interest only concession
• An arrangement to clear outstanding arrears
• Payment holiday
• Capitalisation of arrears
• Extension of mortgage term
• Transfer to a new product which could help to reduce monthly payments
Customers requesting a forbearance option will need to provide information to support the request which is likely to include the completion of an Income and Expenditure Questionnaire, bank statements, payslips etc. in order that the request can be properly assessed. If the forbearance request is granted, the account is monitored in accordance with our policy and procedures.
At the appropriate time, the forbearance option that has been implemented is cancelled, with the exception of capitalisation of arrears, and the customer’s normal contractual payment is recalculated. Loans that are subject to restructuring may only be classified as restructured and up-to-date once a specified number and/or amount of qualifying payments have been received.
These qualifying payments are set at a level appropriate to the nature of the loan and the customer’s ability to make the repayment going forward. Typically, the receipt of six months qualifying payments is required. Different percentages of probability of default values are applied to these customer accounts reflecting the potentially higher risk of default to the Group.
Impairment losses on debt securitiesAt each statement of financial position date, the Group assesses whether or not there is objective evidence that individual debt instruments are impaired. In determining whether there is any objective evidence of impairment, the Group takes into account a number of factors including:
• Significant financial difficulties of the issuer or obligor
• Any breach of contract or covenants
• The granting of any concession or rearrangement of terms
• The disappearance of an active market
• Any significant downgrade of ratings of the issuer or obligor
• Any significant reduction in market value of the instrument
In some cases, a significant adverse change in one of the above factors will cause the Group to determine that there is objective evidence of impairment. In other cases, it may not be possible to identify a single event that identifies impairment. The Group may additionally determine that there is impairment where there are a number of factors contributing to that view.
Where the Group determines that there is objective evidence of impairment or that trigger events exist at the statement of financial position date, then, in the case of available for sale instruments, the cumulative loss that had been recognised directly in reserves is removed from reserves and recognised in the Income Statement. In the case of held to maturity instruments an appropriate charge is made to the Income Statement.
If, in a subsequent period, the fair value of a debt instrument classified as available for sale increases and the increase can be related to an event occurring after the impairment loss was recognised through the Income Statement, the impairment loss is reversed, with the amount of the reversal recognised through the Income Statement.
Pension costsThe Society operates two pension schemes, a defined contribution and a defined benefit scheme. A defined contribution scheme is one into which the Group and the employee pay fixed contributions, without any obligations to pay future contributions. Payments into the defined contribution scheme are charged to the income statement as they become payable in accordance with the rules of the scheme. A defined benefit scheme is one that defines the benefit the employee will receive on retirement, depending on such factors as age and length of service.
On 24 April 2013, the Society closed an externally funded final salary (defined benefit) scheme administered by Jardine Lloyd Thompson to further accrual. Contributions payable to the scheme are determined by a qualified actuary on the basis of a triennial valuation using the projected unit method, and are charged to the income and expenditure account over the periods benefiting from the employees’ services. The charge to the income and expenditure account over the financial year in relation to the defined benefit scheme is shown in Note 26.
1
Notes to the Accounts for the year ended 31 December 2016

38
Principal accounting policies (continued)
The pension scheme deficit on the closed scheme at 31 December 2016 has been recognised as a liability on the balance sheet.
The defined benefit obligation is calculated annually by independent actuaries using the projected unit credit method. The present value of the defined benefit obligation is determined by discounting the estimated future cash outflows using interest rates of high quality sterling bonds of comparable term to the related pension liability.
Actuarial gains and losses arising from experience adjustments and changes in actuarial assumptions are charged or credited each year to the Statement of Other Comprehensive Income. Past and current service costs are recognised immediately in administrative expenses.
Cash and cash equivalentsFor the purposes of the cash flow statement, cash and cash equivalents comprise balances with less than three months’ maturity from the date of acquisition, including cash and other eligible bills and loans and advances to credit institutions.
TaxationCurrent tax is the amount of income tax payable in respect of the taxable profit for the year or prior years. Tax is calculated on the basis of tax rates and laws that have been enacted or substantively enacted by the period end.
Management periodically evaluates positions taken in tax returns with respect to situations in which applicable tax regulation is subject to interpretation. It establishes provisions where appropriate on the basis of amounts expected to be paid to the tax authorities.
Deferred tax is recognised providing for temporary differences between the carrying amount of certain assets and liabilities for accounting purposes and for taxation purposes. Deferred tax is provided using tax rates enacted or substantively enacted at the statement of financial position date, depending on the date at which they are expected to reverse.
Deferred tax has been recognised in respect of all timing differences at the reporting date.
Deferred tax is provided using tax rates enacted or substantively enacted by the reporting date that are expected to apply to the reversal of the timing differences. FRS 102 prohibits discounting of deferred tax.
Fixed assets and depreciationTangible fixed assets are stated at historic purchase cost less accumulated depreciation with the exception of freehold land and buildings which are stated at their previously revalued amount. Freehold buildings are depreciated on a straight-line basis over 50 years. Freehold land is not depreciated. Equipment, fixtures and fittings are depreciated on a straight-line basis over their estimated useful lives of between three and fifteen years.
SharesShares are stated at the amount repayable including accrued interest and any other relevant bonuses.
Provisions for liabilities and chargesA provision is recognised in the balance sheet if the Society has a legal or constructive obligation as a result of a past event and it is probable that an outflow of economic benefits will be required to settle the obligation.
Some asset and liability amounts reported in the accounts are based on management estimates, judgements and assumptions. Estimates and assumptions are continually evaluated and are based on historical experience and other factors, including expectations of future events that are believed to be reasonable under the circumstances. These are described below.
Critical accounting estimates and judgements a) Impairment losses and advances The Group reviews its mortgage portfolio to assess impairment on a regular basis, in determining whether an impairment loss should be recorded in the Income Statement. In undertaking this review, the Group makes judgements as to whether there is any observable data indicating that there is a measurable decrease in the estimated future cash flows from a portfolio of loans before such decrease in an individual loan can be identified. This evidence may include observable data indicating that there has been an adverse change in the payments
1
Notes to the Accounts for the year ended 31 December 2016
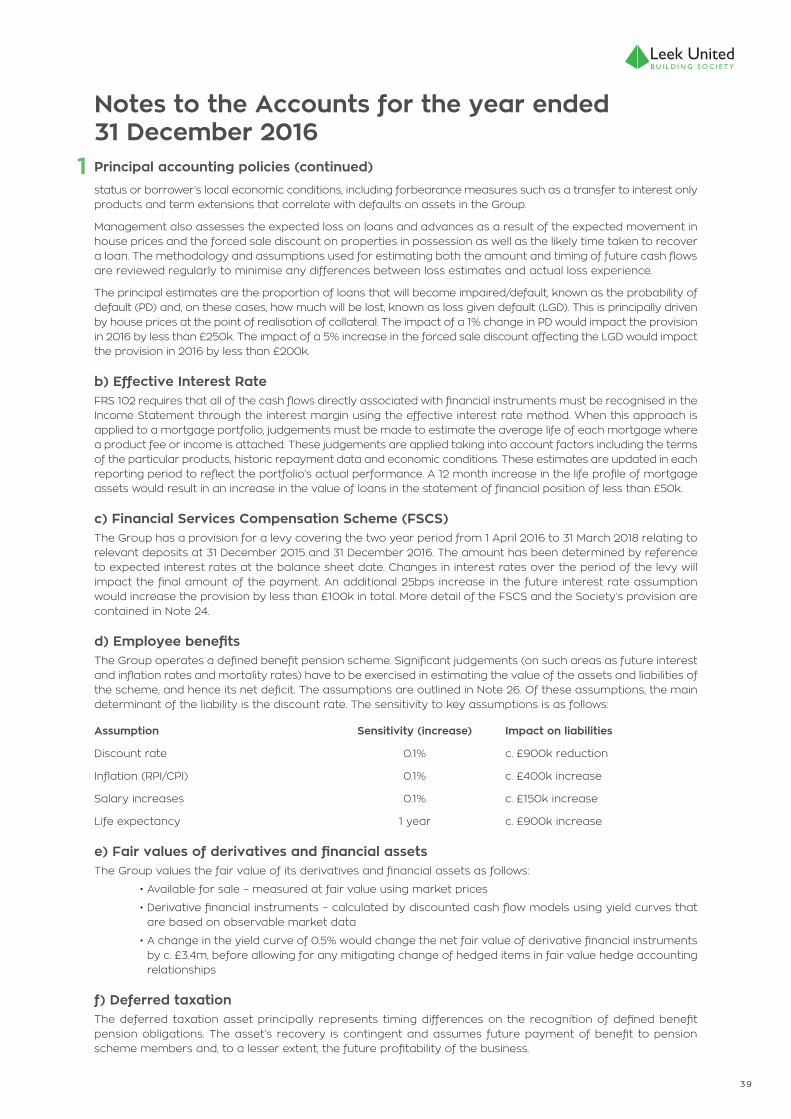
39
Principal accounting policies (continued)
status or borrower’s local economic conditions, including forbearance measures such as a transfer to interest only products and term extensions that correlate with defaults on assets in the Group.
Management also assesses the expected loss on loans and advances as a result of the expected movement in house prices and the forced sale discount on properties in possession as well as the likely time taken to recover a loan. The methodology and assumptions used for estimating both the amount and timing of future cash flows are reviewed regularly to minimise any differences between loss estimates and actual loss experience.
The principal estimates are the proportion of loans that will become impaired/default, known as the probability of default (PD) and, on these cases, how much will be lost, known as loss given default (LGD). This is principally driven by house prices at the point of realisation of collateral. The impact of a 1% change in PD would impact the provision in 2016 by less than £250k. The impact of a 5% increase in the forced sale discount affecting the LGD would impact the provision in 2016 by less than £200k.
b) Effective Interest RateFRS 102 requires that all of the cash flows directly associated with financial instruments must be recognised in the Income Statement through the interest margin using the effective interest rate method. When this approach is applied to a mortgage portfolio, judgements must be made to estimate the average life of each mortgage where a product fee or income is attached. These judgements are applied taking into account factors including the terms of the particular products, historic repayment data and economic conditions. These estimates are updated in each reporting period to reflect the portfolio’s actual performance. A 12 month increase in the life profile of mortgage assets would result in an increase in the value of loans in the statement of financial position of less than £50k.
c) Financial Services Compensation Scheme (FSCS)The Group has a provision for a levy covering the two year period from 1 April 2016 to 31 March 2018 relating to relevant deposits at 31 December 2015 and 31 December 2016. The amount has been determined by reference to expected interest rates at the balance sheet date. Changes in interest rates over the period of the levy will impact the final amount of the payment. An additional 25bps increase in the future interest rate assumption would increase the provision by less than £100k in total. More detail of the FSCS and the Society’s provision are contained in Note 24.
d) Employee benefitsThe Group operates a defined benefit pension scheme. Significant judgements (on such areas as future interest and inflation rates and mortality rates) have to be exercised in estimating the value of the assets and liabilities of the scheme, and hence its net deficit. The assumptions are outlined in Note 26. Of these assumptions, the main determinant of the liability is the discount rate. The sensitivity to key assumptions is as follows:
Assumption Sensitivity (increase) Impact on liabilities
Discount rate 0.1% c. £900k reduction
Inflation (RPI/CPI) 0.1% c. £400k increase
Salary increases 0.1% c. £150k increase
Life expectancy 1 year c. £900k increase
e) Fair values of derivatives and financial assetsThe Group values the fair value of its derivatives and financial assets as follows:
• Available for sale – measured at fair value using market prices
• Derivative financial instruments – calculated by discounted cash flow models using yield curves that are based on observable market data
• A change in the yield curve of 0.5% would change the net fair value of derivative financial instruments by c. £3.4m, before allowing for any mitigating change of hedged items in fair value hedge accounting relationships
f) Deferred taxationThe deferred taxation asset principally represents timing differences on the recognition of defined benefit pension obligations. The asset’s recovery is contingent and assumes future payment of benefit to pension scheme members and, to a lesser extent, the future profitability of the business.
1
Notes to the Accounts for the year ended 31 December 2016
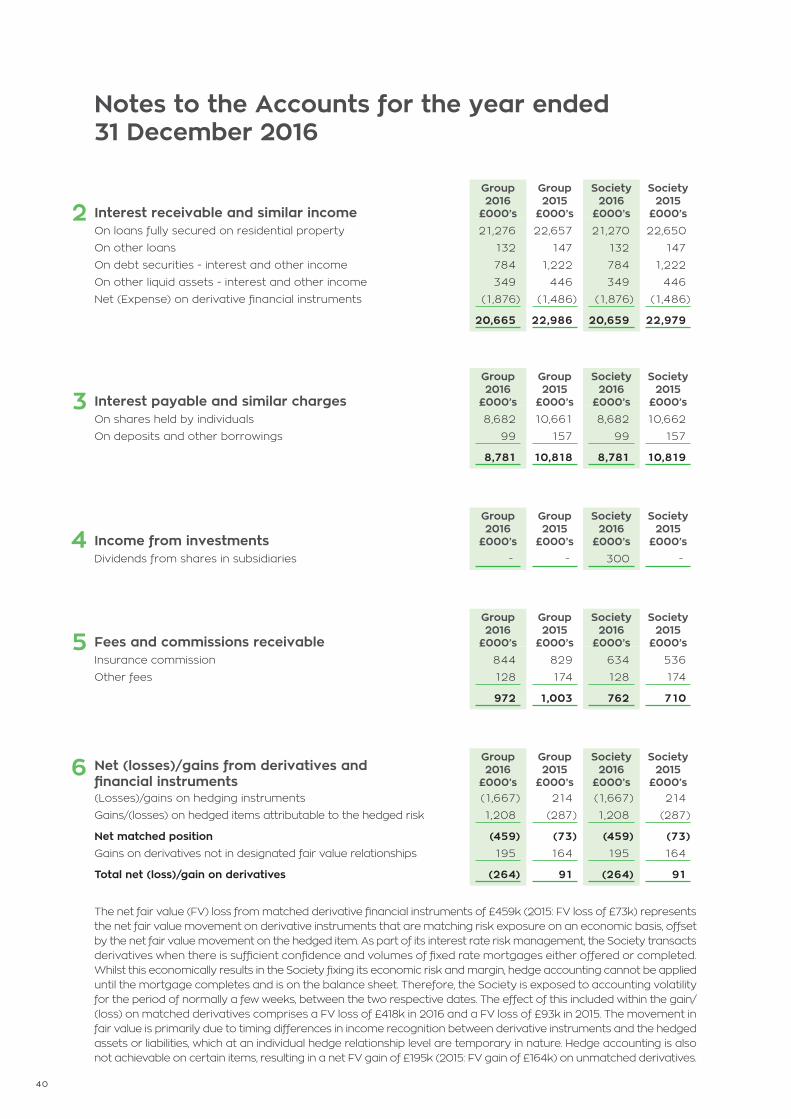
40
Interest receivable and similar income
Group2016
£000’s
Group2015
£000’s
Society2016
£000’s
Society2015
£000’sOn loans fully secured on residential property 21,276 22,657 21,270 22,650
On other loans 132 147 132 147
On debt securities - interest and other income 784 1,222 784 1,222
On other liquid assets - interest and other income 349 446 349 446
Net (Expense) on derivative financial instruments (1,876) (1,486) (1,876) (1,486)
20,665 22,986 20,659 22,979
Interest payable and similar charges
Group2016
£000’s
Group2015
£000’s
Society2016
£000’s
Society2015
£000’sOn shares held by individuals 8,682 10,661 8,682 10,662
On deposits and other borrowings 99 157 99 157
8,781 10,818 8,781 10,819
Income from investments
Group2016
£000’s
Group2015
£000’s
Society2016
£000’s
Society2015
£000’sDividends from shares in subsidiaries - - 300 -
2
3
4
Fees and commissions receivable
Group2016
£000’s
Group2015
£000’s
Society2016
£000’s
Society2015
£000’sInsurance commission 844 829 634 536
Other fees 128 174 128 174
972 1,003 762 710
Net (losses)/gains from derivatives and financial instruments
Group2016
£000’s
Group2015
£000’s
Society2016
£000’s
Society2015
£000’s(Losses)/gains on hedging instruments (1,667) 214 (1,667) 214
Gains/(losses) on hedged items attributable to the hedged risk 1,208 (287) 1,208 (287)
Net matched position (459) (73) (459) (73)Gains on derivatives not in designated fair value relationships 195 164 195 164
Total net (loss)/gain on derivatives (264) 91 (264) 91
The net fair value (FV) loss from matched derivative financial instruments of £459k (2015: FV loss of £73k) represents the net fair value movement on derivative instruments that are matching risk exposure on an economic basis, offset by the net fair value movement on the hedged item. As part of its interest rate risk management, the Society transacts derivatives when there is sufficient confidence and volumes of fixed rate mortgages either offered or completed. Whilst this economically results in the Society fixing its economic risk and margin, hedge accounting cannot be applied until the mortgage completes and is on the balance sheet. Therefore, the Society is exposed to accounting volatility for the period of normally a few weeks, between the two respective dates. The effect of this included within the gain/(loss) on matched derivatives comprises a FV loss of £418k in 2016 and a FV loss of £93k in 2015. The movement in fair value is primarily due to timing differences in income recognition between derivative instruments and the hedged assets or liabilities, which at an individual hedge relationship level are temporary in nature. Hedge accounting is also not achievable on certain items, resulting in a net FV gain of £195k (2015: FV gain of £164k) on unmatched derivatives.
5
6
Notes to the Accounts for the year ended 31 December 2016

41
Administrative expenses
Group2016
£000’s
Group2015
£000’s
Society2016
£000’s
Society2015
£000’sStaff costs (including Executive Directors):
Wages and salaries 4,378 4,062 4,211 3,912
Social security costs 418 396 403 381
Other pension costs 289 295 282 288
5,085 4,753 4,896 4,581
Other expenses:Remuneration of auditors Audit of Group & Society accounts 89 121 89 121
Audit of subsidiaries 11 11 - -
Other services 39 4 39 4
Total auditor remuneration 139 135 128 125
Other administrative expenses 3,260 3,059 3,250 3,056
Total administrative expenses 8,484 7,948 8,274 7,762
The 2015 audit of the Society and Group includes £35k of non-recurring costs relating to FRS 102 and IAS 39 transition.
In addition to the auditor remuneration as shown above, the Society also paid audit fees in relation to the defined benefit pension scheme of £13k (2015: £10k).
Other pension costs include both defined contribution costs as well as current service costs for the defined benefit scheme as set out in Note 26.
7
The average number of persons (including Executive Directors) employed during the year was:
Group2016
Group2015
Society2016
Society2015
(i) At principal office:
Full-time staff 82 76 78 71
Part-time staff 18 17 18 17
(ii) At branch offices:
Full-time staff 44 44 44 44
Part-time staff 28 27 28 27
Total staff 172 164 168 159
(iii) Total full-time equivalents 160 152 156 147
Notes to the Accounts for the year ended 31 December 2016

42
Notes to the Accounts for the year ended 31 December 2016
Responsibility2016
£000’s2015
£000’s
Chair 39 34
Senior Independent Director 29 28
Chair of Audit 28 25
Chair of Risk 28 25
Chair of Remuneration 26 23
‘Notified’ NED 23 23
7
2016 2015
Salary/ Fees
£000’s
Benefits /Other
(iii)£000’s
Sub Total
£000’sPensions£000’s
Total£000’s
Salary/ Fees
£000’s
Benefits /Other
(iii)£000’s
Sub Total
£000’sPensions£000’s
Total£000’s
Non Executive Directors (NEDs) (iv)Peter Kerns (to 27/04/16) 13 - 13 - 13 34 - 34 - 34
Rachel Court (i) 35 - 35 - 35 23 - 23 - 23
Richard Goddard 35 - 35 - 35 28 - 28 - 28
Derek Lyons (to 22/04/15) - - - - - 9 2 11 - 11
Jim Washington (to 27/04/16) 9 - 9 - 9 28 - 28 - 28
John Leveson (from 19/05/15) 25 1 26 - 26 14 1 15 - 15Kerry Spooner (from 19/05/15 to 15/06/16) 13
- 13 - 13 14 1 15 - 15
Keith Abercromby (from 23/03/16) 18 1 19 - 19 - - - - -
Jane Kimberlin (from 23/11/16) 3 - 3 - 3 - - - - -
Colin Kersley (from 21/12/16) 1 - 1 - 1 - - - - -
Executive DirectorsKevin Wilson (ii) (iii) 205 46 251 - 251 197 30 227 12 239
Tony Hubbard (to 30/11/16) 88 7 95 13 108 93 8 101 14 115
Paul Wilson (iii) 130 11 141 20 161 125 11 136 19 155
575 66 641 33 674 565 53 618 45 663
Administrative expenses (continued)Directors’ loans and transactions
A register of loans and transactions with directors and connected persons is maintained, and is available for inspection by members at the Society’s principal office up to and including 26 April 2017 and at the Annual General Meeting. The total loans outstanding at 31 December 2016, in respect of 1 (2015: 2) people amounted to £24,300 (2015: £40,321). There is no disclosure in respect of directors’ investment accounts because of the overriding duty of confidentiality with regard to customers’ affairs. Analysis of directors’ remuneration:
(i) Appointed as Chair from 27 April 2016. Full year Chair’s fee for 2016 was £39,000 (see iv below)(ii) With effect from June 2015, Kevin Wilson with agreement from the Society took his pension contribution as
cash allowance (iii) Includes £1,000 bonus for Executive Directors in post at 31 December 2016 and 31 December 2015 respectively;
further details are included on page 25.(iv) In addition to basic annual fees, NEDs receive increments for additional responsibilities. These are included
in the table above for the relevant period by individual. These can include situations were an individual performs multiple responsibilities concurrently. The annual amounts by role are set out in the table below:

43
Notes to the Accounts for the year ended 31 December 2016
Net impairment gains/(losses) on loans and advances
Loans fully secured on residential property
Group & SocietyIndividual Provision£000’s
Collective Provision£000’s
Total£000’s
At 1 January 2016 133 384 517Change in provision for loan impairment 89 (103) (14)
At 31 December 2016 222 281 503
Loans fully secured on residential property
Group & SocietyIndividual Provision£000’s
Collective Provision£000’s
Total£000’s
At 1 January 2015 22 303 325Change in provision for loan impairment 111 81 192
At 31 December 2015 133 384 517
8
Group & Society2016
£000’s2015
£000’sChange in provision for the year (14) 192
Amounts recovered in respect of loans previously written off (5) (5)
Amounts written off 12 16
Income and expenditure account (7) 203
The provisions as at 31 December 2016 and 2015 have been deducted from loans fully secured on residential property in the balance sheet.
Administrative expenses (continued)The table below sets out the aggregate remuneration for staff who are material risk takers, as per the relevant EBA regulatory technical standards, in relation to their services for the Group and Society for the year ended 31 December 2016.
Group2016
£000’s
Group2015
£000’sExecutive Directors 520 509
Non-Executive Directors 154 154
Senior Managers 718 620
Total key management compensation 1,392 1,283
Due to the absence, due to serious illness, of the Operations Director in late 2016, the Society appointed an Interim Operations Director from 17 October 2016. A professional consultancy company was paid £25k (including VAT) for the period to 30 November 2016, and a further £15k has been accrued as at 31 December 2016.
7
The credit/(debit) in the Income Statement is as follows:-

44
The tax assessed for the year is higher (2015: higher) than the standard rate of corporation tax in the UK of 20% (2015: 20.25%). The differences are explained below.
Group2016
£000’s
Group2015
£000’s
Society2016
£000’s
Society2015
£000’s(b) Factors affecting current tax charge in year:
Profit on ordinary activities before tax 3,495 4,516 3,795 4,410
Tax on profit at UK standard rate of 20% (2015: 20.25%) 699 914 759 893
Dividend from subsidiary - - (60) -
Expenses not deductible for tax purposes 1 1 1 1
Timing differences on fixed assets 2 - - -
Adjustment re: prior year 2 (18) 2 (18)
Impact of change in rate - deferred tax 7 19 7 19
Changes to treatment of debt securities 3 - 3 -
Total tax charge 714 916 712 895
Reductions in the UK Corporation tax rate from 21% to 20% (effective from 1 April 2015) were substantively enacted on 2 July 2013. A reduction to 19% (effective from 1 April 2017) was substantively enacted on 26 October 2015 and a further reduction to 17% (effective from 1 April 2020) was substantively enacted on 7 September 2016. Accordingly the Society’s profits have been taxed at an effective rate of 20% (2015: 20.25%). The deferred tax asset at 31 December 2016 has been calculated based on the rate of 17% (2015: 19%) substantively enacted at the balance sheet date.
Tax on profit on ordinary activities
Group2016
£000’s
Group2015
£000’s
Society2016
£000’s
Society2015
£000’s(a) UK corporation tax at 20% (2015: 20.25%):
Current tax 456 524 454 503
UK Deferred tax at 17% (2015: 19%):
Deferred tax - current year (see Note 17) 258 392 258 392
Total 714 916 712 895
Cash in hand and balances with Bank of England Notes
Group2016
£000’s
Group2015
£000’s
Society2016
£000’s
Society2015
£000’sCash in hand 798 778 798 778
Balances at Bank of England 100,465 46,231 100,465 46,231
Included in cash and cash equivalents 27 101,263 47,009 101,263 47,009
Loans and advances to credit institutions
Group2016
£000’s
Group2015
£000’s
Society2016
£000’s
Society2015
£000’sMaturity analysis:
Repayable on demand 8,896 9,794 8,762 9,710
In more than one year but not more than five years 3,681 1,750 3,681 1,750
12,577 11,544 12,443 11,460
Amounts outstanding in more than one year but not more than five years of £3,681k (2015: £1,750k) fully reflects amounts placed as collateral with counterparties in respect of derivative contracts.
9
10
11
Notes to the Accounts for the year ended 31 December 2016

45
Group and Society 2016£000’s
2015£000’s
At 1 January 113,247 103,480Additions 112,776 119,225
Maturities and disposals (159,891) (109,667)
Movement in premium and accrued interest 208 429
Gains/(loss) in fair value recognised in Other Comprehensive Income 148 (220)
At 31 December 66,488 113,247
Additions and disposals include premium and accrued interest on acquisition/sale, therefore the movement in premium and accrued interest in the table above reflects movements on assets held during the year.
12
Available for sale securities
Maturity analysis:
In not more than one year 58,671 105,265 58,671 105,265
In more than one year 7,817 7,982 7,817 7,982
66,488 113,247 66,488 113,247
The directors of the Society consider that the primary purpose of holding securities is prudential. The securities held as liquid assets are held with the intention of use on a continuing basis in the Society’s activities. Movements in debt securities during the year may be analysed as follows:
Issued by UK Government 9,997 39,964 9,997 39,964
Issued by other borrowers - listed 7,817 29,035 7,817 29,035
Issued by other borrowers - unlisted 48,674 44,248 48,674 44,248
66,488 113,247 66,488 113,247
Debt securities
Group2016
£000’s
Group2015
£000’s
Society2016
£000’s
Society2015
£000’sAvailable for sale securities
Derivatives financial instrumentsGroup & Society
Contract Notional Amount£000’s
Fair Value Assets£000’s
Fair Value
Liabilities£000’s
Fair Value
Net Asset (Liability)
£000’sAt 31 December 2016Unmatched derivatives – interest rate swaps 56,049 234 (171) 63
Derivatives designated as fair value hedges interest rate swaps 249,734 264 (3,216) (2,952)
Total recognised derivative assets/(liabilities) 305,783 498 (3,387) (2,889)
At 31 December 2015Unmatched derivatives – interest rate swaps 36,579 19 (151) (132)
Derivatives designated as fair value hedges interest rate swaps 180,520 65 (1,350) (1,285)
Total recognised derivative assets/(liabilities) 217,099 84 (1,501) (1,417)
Unmatched derivatives relates to swaps which have not been matched against mortgages for hedge accounting purposes as at the relevant balance sheet date.
13
Notes to the Accounts for the year ended 31 December 2016

46
Notes to the Accounts for the year ended 31 December 2016
Loans and advances to customers
Group2016
£000’s
Group2015
£000’s
Society2016
£000’s
Society2015
£000’sLoans and advances to customers comprise
Loans fully secured on residential property 740,661 706,173 740,578 706,028
Loans fully secured on land 221 251 221 251
Unsecured loan - 8,004 - 8,004
Fair value adjustment for hedged risk 1,962 754 1,962 754
742,844 715,182 742,761 715,037
Loans and advances to customers are held at amortised cost (with the exception of loans in a hedged relationship described below), with interest and associated costs being recognised in the interest receivable and similar income line of the Income Statement on an effective interest rate basis. The unsecured loan represented a single exposure as part of a syndicated loan provided as part of a registered social landlord arrangement and was repaid during 2016.
Fair value hedging adjustments of £1,962k (2015 - £754k) have been made to certain fixed rate mortgages that are in fair value hedging relationships.
The profile based on contractual repayments of loans fully secured on residential property, loans fully secured on land and unsecured loans from the balance sheet date is as follows:
Group2016
£000’s
Group2015
£000’s
Society2016
£000’s
Society2015
£000’sRepayable on demand 1,378 669 1,376 668
In not more than three months 7,507 6,272 7,506 6,247
In more than three months but not more than one year 20,028 20,209 20,026 20,174
In more than one year but not more than five years 115,987 122,174 115,956 122,155
In more than five years 596,402 565,449 596,355 565,384
741,302 714,773 741,219 714,628Provisions for bad and doubtful debts (503) (517) (503) (517)
Fair value adjustment for hedged risk 1,962 754 1,962 754
Effective Interest Rate adjustment 83 172 83 172
742,844 715,182 742,761 715,037
It should be noted that the above maturity analysis may not reflect actual experience of repayments since many mortgage loans are repaid early.
14
15 Investments in subsidiary undertakings Society
2016£000’s
Society2015
£000’sShares 2 2
Loans 22 22
24 24
Leek United Home Loans Limited is a wholly owned direct subsidiary undertaking of the Society. The Society holds £100 of shares in the subsidiary. The company is registered in England and Wales. All shares are £1 ordinary shares. The principal activity of the subsidiary is the purchase and administration of mortgage portfolios. No director had a beneficial interest in any shares or debentures of the subsidiary undertaking.
Leek United Financial Services Limited is a wholly owned direct subsidiary undertaking of the Society. The Society holds £1,000 shares in the subsidiary. The company is registered in England and Wales. All shares are £1 ordinary shares. The principal activity of the subsidiary is the provision of financial services. No director had a beneficial interest in any shares or debentures of the subsidiary undertaking.
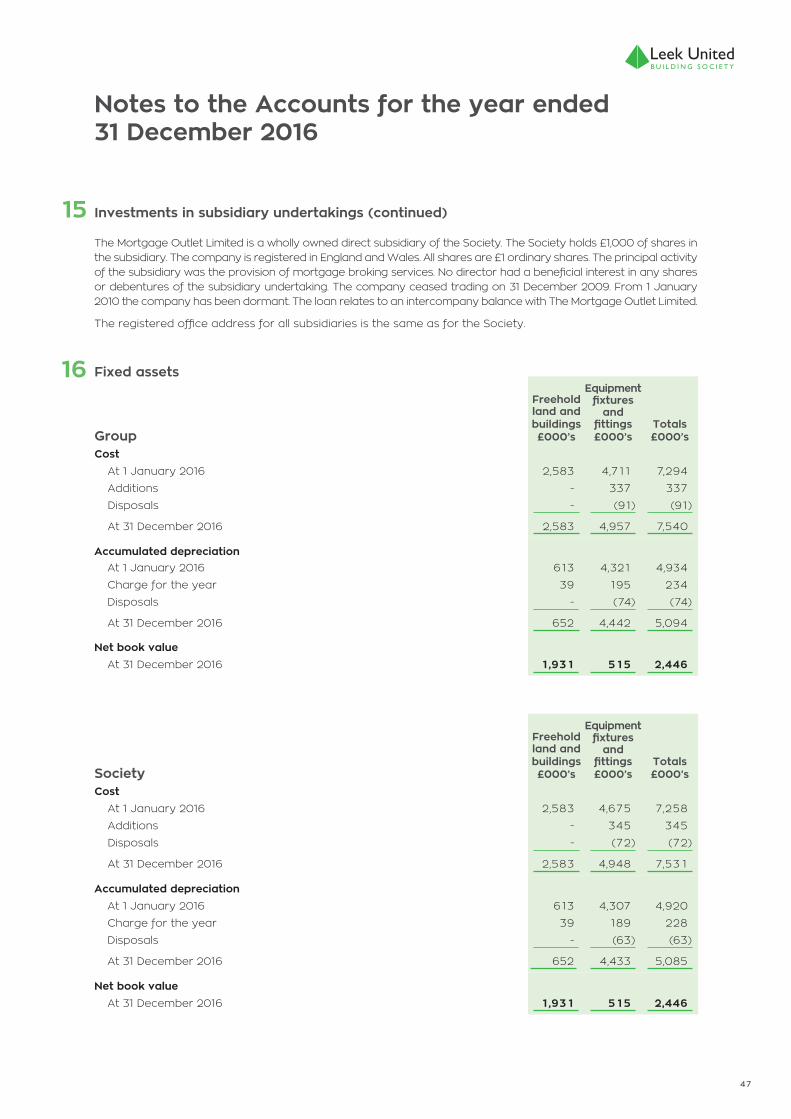
47
Notes to the Accounts for the year ended 31 December 2016
Fixed assets
Group
Freehold land andbuildings£000’s
Equipment fixtures
and fittings£000’s
Totals£000’s
Cost At 1 January 2016 2,583 4,711 7,294
Additions - 337 337
Disposals - (91) (91)
At 31 December 2016 2,583 4,957 7,540
Accumulated depreciation At 1 January 2016 613 4,321 4,934
Charge for the year 39 195 234
Disposals - (74) (74)
At 31 December 2016 652 4,442 5,094
Net book value At 31 December 2016 1,931 515 2,446
Society
Freehold land andbuildings£000’s
Equipment fixtures
and fittings£000’s
Totals£000’s
Cost At 1 January 2016 2,583 4,675 7,258
Additions - 345 345
Disposals - (72) (72)
At 31 December 2016 2,583 4,948 7,531
Accumulated depreciation At 1 January 2016 613 4,307 4,920
Charge for the year 39 189 228
Disposals - (63) (63)
At 31 December 2016 652 4,433 5,085
Net book value At 31 December 2016 1,931 515 2,446
15
16
Investments in subsidiary undertakings (continued)
The Mortgage Outlet Limited is a wholly owned direct subsidiary of the Society. The Society holds £1,000 of shares in the subsidiary. The company is registered in England and Wales. All shares are £1 ordinary shares. The principal activity of the subsidiary was the provision of mortgage broking services. No director had a beneficial interest in any shares or debentures of the subsidiary undertaking. The company ceased trading on 31 December 2009. From 1 January 2010 the company has been dormant. The loan relates to an intercompany balance with The Mortgage Outlet Limited.
The registered office address for all subsidiaries is the same as for the Society.

48
16 Fixed assets (continued)
Group
Freehold land andbuildings£000’s
Equipment fixtures
and fittings£000’s
Totals£000’s
Cost At 1 January 2015 2,583 4,850 7,433
Additions - 140 140
Disposals - (279) (279)
At 31 December 2015 2,583 4,711 7,294
Accumulated depreciation At 1 January 2015 575 4,448 5,023
Charge for the year 38 149 187
Disposals - (276) (276)
At 31 December 2015 613 4,321 4,934
Net book value At 31 December 2015 1,970 390 2,360
Society
Freehold land andbuildings£000’s
Equipment fixtures
and fittings£000’s
Totals£000’s
Cost At 1 January 2015 2,583 4,798 7,381
Additions - 140 140
Disposals - (263) (263)
At 31 December 2015 2,583 4,675 7,258
Accumulated depreciation At 1 January 2015 575 4,429 5,004
Charge for the year 38 140 178
Disposals - (262) (262)
At 31 December 2015 613 4,307 4,920
Net book value At 31 December 2015 1,970 368 2,338
Equipment, fixtures and fittings include intangible assets with a net book value of £183k (2015: £16k).
The net book value of land and buildings occupied by the Society for its own activities is £1,931,000 (2015: £1,970,000).
From 31 December 2000, the Society adopted the transitional arrangements under FRS15 to maintain the book value of fixed assets at their previously revalued amounts. Under FRS 102 the Society and Group have elected to use this previous revaluation as deemed cost at the date of the original valuation.
Notes to the Accounts for the year ended 31 December 2016

49
Deferred Taxation at 1 January 748 1,109 748 1,109Deferred tax charge (258) (392) (258) (392)
Items in relation to the Statement of Comprehensive IncomeMovements in relation to pension scheme 680 14 680 14
Movements in relation to debt securities 6 5 6 5
Movements in relation to revalued land and buildings 40 12 40 12
At 31 December 1,216 748 1,216 748
Fixed assets (continued)If land and buildings had not been revalued they would have been included at the following amount:
2016£000’s
2015£000’s
Cost 1,470 1,470
Aggregate depreciation based on cost (371) (349)
1,099 1,121
Other assets
Group2016
£000’s
Group2015
£000’s
Society2016
£000’s
Society2015
£000’sDeferred tax asset 1,216 748 1,216 748
Amounts due from subsidiary undertakings - - 68 -
Other 4 4 4 4
1,220 752 1,288 752
The elements of deferred taxation are as follows:
Group2016
£000’s
Group2015
£000’s
Society2016
£000’s
Society2015
£000’sDifference between accumulated depreciation and capital allowances 9 17 9 17
Capital gains on revalued land and building (106) (146) (106) (146)
Other timing differences 1,313 877 1,313 877
1,216 748 1,216 748
Prepayments and accrued income
Group2016
£000’s
Group2015
£000’s
Society2016
£000’s
Society2015
£000’s
Prepayments 511 430 511 430
Accrued Income 45 39 45 39
556 469 556 469
16
17
18
19 Shares
Group2016
£000’s
Group2015
£000’s
Society2016
£000’s
Society2015
£000’sHeld by individuals 836,578 805,115 836,578 805,115
Group2016
£000’s
Group2015
£000’s
Society2016
£000’s
Society2015
£000’s Repayable on demand 660,370 612,807 660,370 612,807
In not more than three months 33,705 40,542 33,705 40,542
In more than three months but not more than one year 88,934 91,652 88,934 91,652
In more than one year but no more than five years 53,569 60,114 53,569 60,114
836,578 805,115 836,578 805,115
Notes to the Accounts for the year ended 31 December 2016
In the ordinary course of business, shares are repayable from the balance sheet date as follows:

50
Notes to the Accounts for the year ended 31 December 2016
Group2016
£000’s
Group2015
£000’s
Society2016
£000’s
Society2015
£000’sRepayable on demand 21,781 20,360 21,781 20,360
20
21
22
23
Accruals and deferred income
Group2016
£000’s
Group2015
£000’s
Society2016
£000’s
Society2015
£000’sAccrued interest on derivatives 220 186 220 186
Accruals 667 604 649 586
Deferred income - 21 - 21
887 811 869 793
Other liabilities
Group2016
£000’s
Group2015
£000’s
Society2016
£000’s
Society2015
£000’sAmounts falling due within one year:
Income tax - 70 - 70
Corporation tax 300 183 298 171
Other taxation and social security costs 118 117 118 117
Amount due to subsidiary undertakings - - - 225
Other creditors 238 276 238 261
656 646 654 844
Provisions for liabilities and chargesGroup and Society
Mortgage Arrears Redress£000’s
Regulated Business£000’s
FSCS Levy
£000’sTotal
£000’s1 January 2016 - 31 628 659
Amount charged during the year 50 3 123 176
Amount utilised during the year - (3) (250) (253)
31 December 2016 50 31 501 582
The mortgage arrears redress is to provide for potential claims against the Group in respect of historical arrears which have been capitalised and interest charged thereon. The regulated business provision is to provide for potential claims against the Group in respect of past sales. The Financial Services Compensation Scheme Levy is explained in Note 24.
Financial Services Compensation Scheme Levy The Society has a liability and a contingent liability in respect of contributions to the Financial Services Compensation Scheme.
In common with all regulated UK deposit takers, the Society pays levies to the Financial Services Compensation Scheme (FSCS) based on its share of protected deposits, to enable the FSCS to meet claims against it. The FSCS levy consists of two parts – a management expenses levy and a compensation levy.
The management expenses levy covers the costs of running the scheme and the compensation levy covers the amount of compensation the scheme pays, net of any recoveries it makes using the rights that have been assigned to it.
In 2008, a claim was triggered against the FSCS by the transfer of Bradford & Bingley Plc’s retail deposit business to Abbey National Plc and similar issues with various Icelandic Banks, London Scottish Bank Plc and the transfer of core parts of Dunfermline Building Society to Nationwide Building Society in the first half of 2009. The FSCS has met, or will meet, the claims by way of loans received from HM Treasury with the interest on these loans being recovered through levies on UK deposit takers.
24
Amounts owed to other customersIn the ordinary course of business, amounts owed to other customers are repayable from the balance sheet date as follows:

51
Notes to the Accounts for the year ended 31 December 2016
Financial Services Compensation Scheme Levy (continued)The loans (except Bradford & Bingley Plc which is repayable on 29 February 2024) have been fully repaid. The FSCS confirmed it expects to receive full repayment of the debt of £1.6bn owed to it by Bradford & Bingley Plc by the repayment date. The non-Bradford & Bingley Plc loans were repaid by a levy on deposit takers in three roughly equal instalments in 2013, 2014 and 2015.
As a result of notifications it has received from the Financial Services Compensation Scheme, the Society has recognised in this year’s accounts a provision for a levy of £123,000 (2015: £150,000) which gives a total levy provision, as at 31 December 2016, of £501,000 (2015: £628,000). This provision is in respect of the scheme year 2016/17 and the scheme year 2017/18, both years have been estimated based on the protected deposits held at 31 December 2015 and 31 December 2016. The levy amounts have been calculated with reference to the level of the Society’s protected deposits and expected compensation levies.
The FSCS may have a further liability if there are insufficient funds available from the realisation of the assets of Bradford and Bingley to fully repay the respective HM Treasury loan.
24
25
Activity Risk Type of hedge
Fixed rate savings products Sensitivity to falls in interest rates Receive fixed interest rate swaps
Fixed rate mortgage products Sensitivity to increases in interest rates Pay fixed interest rate swaps
Financial instrumentsA financial instrument is a contract which gives rise to a financial asset of one entity and a financial liability of another entity. The Group is a retailer of financial instruments in the form of mortgage and savings products and also uses wholesale financial instruments to invest liquid asset balances, raise wholesale funding and manage the risks arising from its operations.
The Group has a formal structure for managing risk, including established risk limits, reporting lines, mandates and other control procedures. This structure is reviewed regularly by the Board, which is charged with the responsibility for managing and controlling the balance sheet exposures and the use of financial instruments for risk management purposes. The Board Risk Committee (BRC) is supported by the Management Risk Committee (MRC) and the Asset and Liability Committee (ALCO).
MRC’s main responsibility is to assess the management of operational, credit and conduct risk together with legal and regulatory risk across the Group. Responsibilities of the MRC also include ensuring the detailed application of the risk management framework and the development of key risk policies and indicators.
ALCO supervises the Group’s treasury and financial risk management activities and advises and supports the Finance Director in carrying out his responsibilities, including the identification, management and control of the balance sheet risks and the overview and monitoring of relevant risk control frameworks. Management of market, liquidity, funding and strategic risk has been delegated to the ALCO.
Instruments used for risk management purposes include derivative financial instruments ‘derivatives’, which are contracts or agreements whose value is derived from one or more underlying price, rate or index inherent in the contract or agreement, such as interest rates. Derivatives are only used by the Group in accordance with the Building Societies Act 1986 (as amended by the Building Societies Acts 1997 and 2005), to reduce the risk of loss arising from changes in interest rates or other factors specified in the legislation. The Group does not trade in derivatives or use them for speculative purposes.
Type of derivativesThe principal derivatives used in balance sheet risk management are interest rate swaps which are used to hedge Group balance sheet exposures arising from fixed rate mortgage lending and savings products. An interest rate swap is a contract to exchange one set of interest rate cash flows for another. Such swaps result in the economic exchange of interest rates. No exchange of principal takes place. Instead interest payments are based on notional principal amounts agreed at inception of the swap. The duration of the interest rate swap is generally short to medium term and their maturity profile reflects the nature of the exposures arising from the underlying business activities.
The following table describes the significant activities undertaken by the Group, the related risks associated with such activities and the types of derivatives which are typically used in managing such risks. The Group applies fair value hedging techniques to these. The fair value of these hedges as at 31 December 2016 is shown in Note 13.

52
Carrying values as at 31 December 2016 Loans and
receivables£000’s
Financial assets and liabilities at amortised
Cost£000’s
Available for Sale reserve£000’s
Derivatives designated
as fair value
hedges£000’s
Unmatched derivatives at fair value
£000’sTotal
£000’sFinancial assets Cash in hand and balances with the Bank of England - 101,263 - - - 101,263Loans and advances to credit institutions 12,577 - - - - 12,577
Debt securities - - 66,488 - - 66,488
Derivative financial instruments - - - 264 234 498
Loans and advances to customers 742,844 - - - - 742,844
Total financial assets 755,421 101,263 66,488 264 234 923,670
Total non-financial assets 4,222
Total Group assets 927,892
Financial liabilities
Shares - 836,578 - - - 836,578
Amounts owed to other customers - 21,781 - - - 21,781
Derivative financial instruments - - - 3,216 171 3,387
Total financial liabilities - 858,359 - 3,216 171 861,746
Total non-financial liabilities 8,119
General and other reserves 58,027
Total Group reserves and liabilities 927,892
25 Financial instruments (continued)The following table sets out a summary of terms and conditions and accounting policies of financial instruments.
Financial assets and liabilities are measured on an ongoing basis either at fair value or amortised cost. Note 1 describes how the classes of financial instruments are measured, and how income and expenses, including fair values and gains and losses, are recognised. The tables below analyse the Group’s assets and liabilities by financial classification. There are no material differences between Group and Society.
Financial Instrument Terms and Conditions Accounting Policy
Loans and advances to credit institutions
Variable interest ratesShort to medium term maturity
Loans and receivables at amortised costAccounted for at settlement date
Debt securitiesFixed or LIBOR linked interest ratesFixed termShort to medium term maturity
Available for sale at fair valueAccounted for at settlement date
Loans and advances to customers
Secured on residential property or land (with the exception of one loan - see note 14)Standard contractual term of 25 yearsFixed or variable interest rate
Loans and receivables at amortised cost if not in a hedged relationshipLoans and advances held at fair value where in a hedged relationshipAccounted for at settlement date
SharesFixed or variable termFixed or variable interest ratesShort to medium term maturity
Financial liabilities at amortised costAccounted for at settlement date
Amounts owed to other customersVariable interest ratesShort to medium term maturity
Financial liabilities at amortised costAccounted for at settlement date
Derivative financial instrumentsFixed interest paid converted to variable interest receivedBased on notional value of derivative
Fair value through profit and lossAccounted for at trade date
Notes to the Accounts for the year ended 31 December 2016
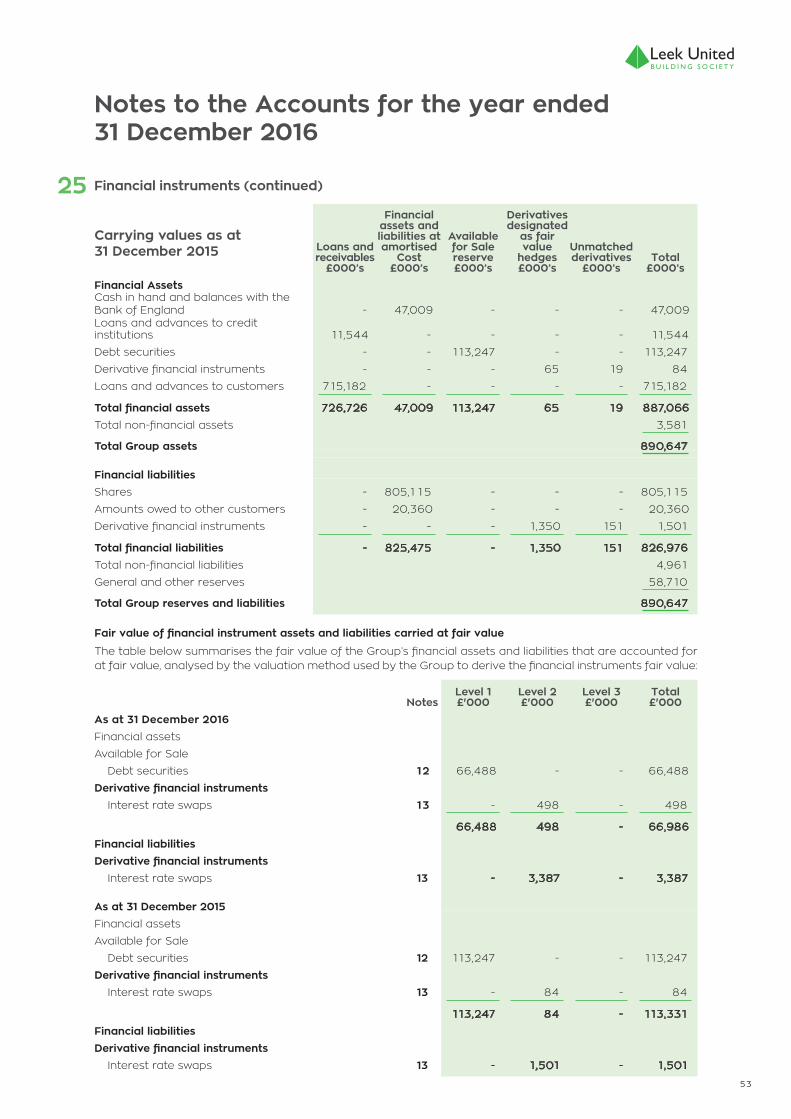
53
As at 31 December 2015
Financial assets
Available for Sale
Debt securities 12 113,247 - - 113,247
Derivative financial instruments Interest rate swaps 13 - 84 - 84
113,247 84 - 113,331
Financial liabilitiesDerivative financial instruments Interest rate swaps 13 - 1,501 - 1,501
Fair value of financial instrument assets and liabilities carried at fair value
The table below summarises the fair value of the Group’s financial assets and liabilities that are accounted for at fair value, analysed by the valuation method used by the Group to derive the financial instruments fair value:
25
Financial liabilities
Shares - 805,115 - - - 805,115
Amounts owed to other customers - 20,360 - - - 20,360
Derivative financial instruments - - - 1,350 151 1,501
Total financial liabilities - 825,475 - 1,350 151 826,976
Total non-financial liabilities 4,961
General and other reserves 58,710
Total Group reserves and liabilities 890,647
Carrying values as at 31 December 2015 Loans and
receivables£000’s
Financial assets and liabilities at amortised
Cost£000’s
Available for Sale reserve£000’s
Derivatives designated
as fair value
hedges£000’s
Unmatched derivatives
£000’sTotal
£000’sFinancial Assets Cash in hand and balances with the Bank of England - 47,009 - - - 47,009Loans and advances to credit institutions 11,544 - - - - 11,544
Debt securities - - 113,247 - - 113,247
Derivative financial instruments - - - 65 19 84
Loans and advances to customers 715,182 - - - - 715,182
Total financial assets 726,726 47,009 113,247 65 19 887,066
Total non-financial assets 3,581
Total Group assets 890,647
NotesLevel 1£'000
Level 2 £'000
Level 3 £'000
Total £'000
As at 31 December 2016
Financial assets
Available for Sale
Debt securities 12 66,488 - - 66,488
Derivative financial instruments Interest rate swaps 13 - 498 - 498
66,488 498 - 66,986
Financial liabilitiesDerivative financial instruments Interest rate swaps 13 - 3,387 - 3,387
Financial instruments (continued)
Notes to the Accounts for the year ended 31 December 2016

54
Notes to the Accounts for the year ended 31 December 2016
25 Financial instruments (continued)Valuation techniquesThe following is a description of the determination of fair value for financial instruments which are accounted for at fair value using valuation techniques.
Level 1 - Quoted Prices (unadjusted) based on independent third party valuations in active markets for identical assets or liabilities.
Level 2 - Inputs other than quoted prices included within Level 1 that are observable for the asset or liability either directly or indirectly.
Level 3 - Inputs for the asset or liability that are not based on observable market data.
The main valuation techniques employed by the Group to determine fair value of the financial instruments disclosed above are set out below:
Debt securitiesLevel 1 – Market prices have been used to determine the fair value of the listed debt securities.
Level 2 - Interest rate swaps – the valuation of interest rate swaps is based on the net present value method. The expected interest cash flows are discounted using the three month forecast LIBOR curves. The LIBOR curves are generally observable market data which is derived from quoted interest rates in similar time bandings which match the timings of the interest cash flows and maturities of the instruments.
Credit riskCredit risk is the risk that the Group incurs a financial loss arising from the failure of a customer or counterparty. The Group structures the level of credit risk it undertakes, by maintaining a credit governance framework involving delegated approval authority levels and credit procedures, the objective of which is to build and maintain risk asset portfolios of high quality. Credit risk in relation to retail customers is governed by limits contained in our board approved responsible lending policy. Our Treasury policies mean that we set tight criteria over where we will, and where we won’t place excess funds. The criteria include both long term and short term ratings published by external credit rating agencies, which are an indication of a company’s creditworthiness as well as the results of published regulatory stress tests.
The Group and Society’s maximum credit risk exposure is detailed in the table below:
Group2016
£000’s
Group2015
£000’s
Society2016
£000’s
Society2015
£000’sCash in hand and balances with the Bank of England 101,263 47,009 101,263 47,009
Loans and advances to credit institutions 12,577 11,544 12,443 11,460
Debt securities 66,488 113,247 66,488 113,247
Derivative financial instruments 498 84 498 84
Loans and advances to customers 742,844 715,182 742,761 715,037
Total statement of financial exposure (1) 923,670 887,066 923,453 886,837
Off balance sheet exposure - mortgage commitment (2) 25,990 16,720 25,990 16,720
Total 949,660 903,786 949,443 903,557
(1) All values are stated at balance sheet amounts(2) This reflects business that has been formally offered but has not yet completed.
a) Loans and advances to credit institutions, debt securities and derivative financial instruments
The BRC is responsible for approving treasury counterparties for both derivatives and investment purposes. Limits are placed on the amount of risk accepted in relation to one counterparty, or group of counterparties, and to industry sectors. This is monitored daily and reviewed monthly by the MRC and quarterly by the BRC.
The Group’s policy only permits lending to central government (which includes the Bank of England), UK Local authorities, banks with a high credit rating and building societies. The Group performs regular analysis of counterparty credit risk and monitoring of publicly available information to highlight possible indirect exposures.
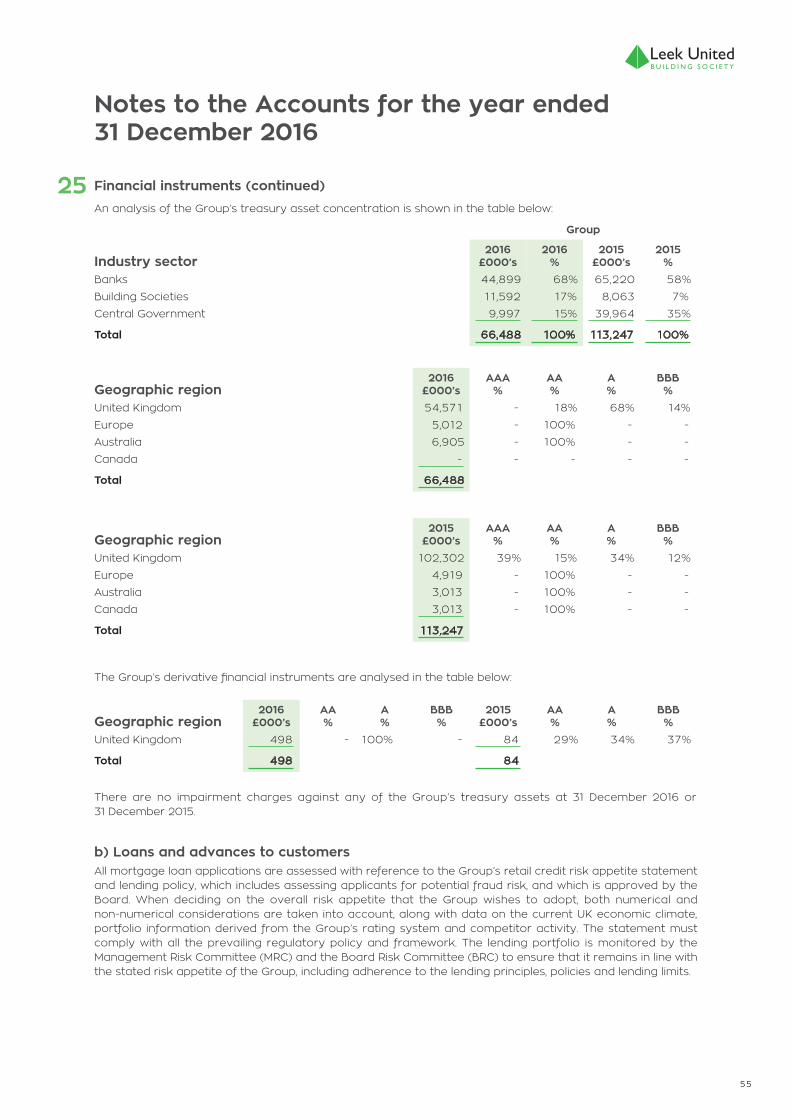
55
Notes to the Accounts for the year ended 31 December 2016
25 Financial instruments (continued)An analysis of the Group’s treasury asset concentration is shown in the table below:
Industry sector2016
£000’s2016
%2015
£000’s2015
%Banks 44,899 68% 65,220 58%
Building Societies 11,592 17% 8,063 7%
Central Government 9,997 15% 39,964 35%
Total 66,488 100% 113,247 100%
Geographic region2016
£000’sAAA
%AA%
A%
BBB%
United Kingdom 54,571 - 18% 68% 14%
Europe 5,012 - 100% - -
Australia 6,905 - 100% - -
Canada - - - - -
Total 66,488
The Group’s derivative financial instruments are analysed in the table below:
Geographic region2016
£000’sAA%
A%
BBB%
2015£000’s
AA%
A%
BBB%
United Kingdom 498 - 100% - 84 29% 34% 37%
Total 498 84
There are no impairment charges against any of the Group’s treasury assets at 31 December 2016 or 31 December 2015.
b) Loans and advances to customersAll mortgage loan applications are assessed with reference to the Group’s retail credit risk appetite statement and lending policy, which includes assessing applicants for potential fraud risk, and which is approved by the Board. When deciding on the overall risk appetite that the Group wishes to adopt, both numerical and non-numerical considerations are taken into account, along with data on the current UK economic climate, portfolio information derived from the Group’s rating system and competitor activity. The statement must comply with all the prevailing regulatory policy and framework. The lending portfolio is monitored by the Management Risk Committee (MRC) and the Board Risk Committee (BRC) to ensure that it remains in line with the stated risk appetite of the Group, including adherence to the lending principles, policies and lending limits.
Geographic region2015
£000’sAAA
%AA%
A%
BBB%
United Kingdom 102,302 39% 15% 34% 12%
Europe 4,919 - 100% - -
Australia 3,013 - 100% - -
Canada 3,013 - 100% - -
Total 113,247
Group

56
25 Financial instruments (continued)The Society adopts a prudent lending approach to our mortgage customers which will ensure that our default rates are low. For new customers, the Society relies upon adherence to its Responsible Lending Policy to determine the credit quality of potential customers. Prior to making loan offers, all applications are stress tested using the Society’s affordability model. This approach, combined with the use of credit checks is used to confirm the credit quality of all new applicants. For existing customers who subsequently apply for additional lending, the same process is adopted. All mortgage applications are overseen by the Mortgage Underwriting team who ensure that all information submitted within the application is validated and loans are approved in line with appropriate mandate levels.
For existing customers who already have mortgages with the Society, ongoing creditworthiness of customers is determined through close monitoring of mortgage accounts, based upon their ability to fully meet their mortgage obligations. In addition, monitoring takes place to ensure the Society adheres to a range of operational lending limits, designed to meet the Society’s Risk Appetite as set by the Board.
Credit risk management information is comprehensive and is circulated to the MRC on a monthly basis to ensure that the portfolio remains within the Group’s risk appetite. It is the Group’s policy to ensure good customer outcomes and lend responsibly by ensuring at the outset that the customer can meet the mortgage repayments. This is achieved by obtaining specific information from the customer concerning income and expenditure but also external credit reference agency data. The Group does not have any exposure to the sub-prime market. The maximum credit risk exposure is disclosed in the table on page 54. Loans and advances to customers are predominantly made up of retail loans fully secured against UK property of £741m (2015: £707m) split between residential and buy to let loans. The Group operates through England and Wales with the portfolio well spread throughout the geographic regions. An analysis of the Group’s geographical concentration, gross of provisions, is shown in the table below:
Geographic region Notes2016
£000’s2016
%2015
£000’s2015
%West Midlands 186,892 25% 190,017 27%
North 129,498 17% 125,186 18%
East Midlands 90,882 12% 87,168 12%
London 94,415 13% 86,965 12%
Outer South East 70,180 9% 61,163 9%
South West 66,045 9% 57,857 8%
Yorkshire & Humberside 49,035 7% 46,896 7%
Wales and Northern Ireland 26,224 4% 25,904 4%
East Anglia 27,910 4% 25,362 3%
Total 741,081 100% 706,518 100%
Other loans (see below) 221 8,255
14 741,302 714,773
Other loans represent commercial loans secured on land. In addition, the 2015 balance includes an unsecured loan provided as part of a social landlord arrangement which was repaid in 2016.
Retail loansLoans fully secured on residential property are split between residential and buy to let. The split of the loan book between buy to let and residential and interest only and repayments is shown below:
2016%
2015%
Repayment – Residential mortgage 59% 62%
Interest Only – Residential mortgage 10% 13%
Repayment – Buy to Let 5% 4%
Interest Only – Buy to Let 26% 21%
Notes to the Accounts for the year ended 31 December 2016
Group

57
LTV analysis2016
%2015
%Residential
0% - 30% 13% 13%
30% - 60% 35% 33%
60% - 80% 29% 30%
80% - 90% 21% 20%
90%-100% 2% 4%
>100% - -
Average loan to value of residential mortgage loans 42% 42%
Average loan to value of new business in the year 70% 76%
The average loan to value (LTV) is the weighted average LTV for the portfolio. Each individual LTV is calculated by comparing the value of the mortgage loan to the value of collateral held adjusted by a house price index.
The average LTV of residential mortgages is 42% (2015: 42%). All residential loans above 75% (2015: 75%) LTV are insured.
Further LTV information on the Group’s residential mortgage portfolio is shown below:
25 Financial instruments (continued)
LTV Analysis2016
%2015
%Buy to Let
0% - 30% 4% 4%
30% - 60% 38% 35%
60% - 80% 58% 61%
80% - 90% - -
90%-100% - -
>100% - -
Average loan to value of buy to let mortgage loans 54% 55%
Average loan to value of new business in the year 67% 68%
The quality of the Group’s retail mortgage book is reflected in the number and value of accounts in arrears, by value it is 0.9% (2015:0.9%), of which only 0.2% (2015: 0.2%) is greater than three months in arrears.
The main factor for loans moving into arrears tends to be the condition of the general economic environment.
The table below provides information on retail loans by payment due status.
Arrears analysis2016
£000’s2016
%2015
£000’s2015
%Not impaired Neither past due or impaired 734,770 99.0% 708,429 99.1%
Past due up to three months but not impaired 4,883 0.7% 5,003 0.7%
Impaired Not past due but impaired 382 0.1% - -
Past due 3 to 6 months 538 0.1% 1,097 0.2%
Past due 6 to 12 months 729 0.1% 244 0.0%
Past due over 12 months - - - -
Total 741,302 100% 714,773 100%
Notes to the Accounts for the year ended 31 December 2016
Group
Group
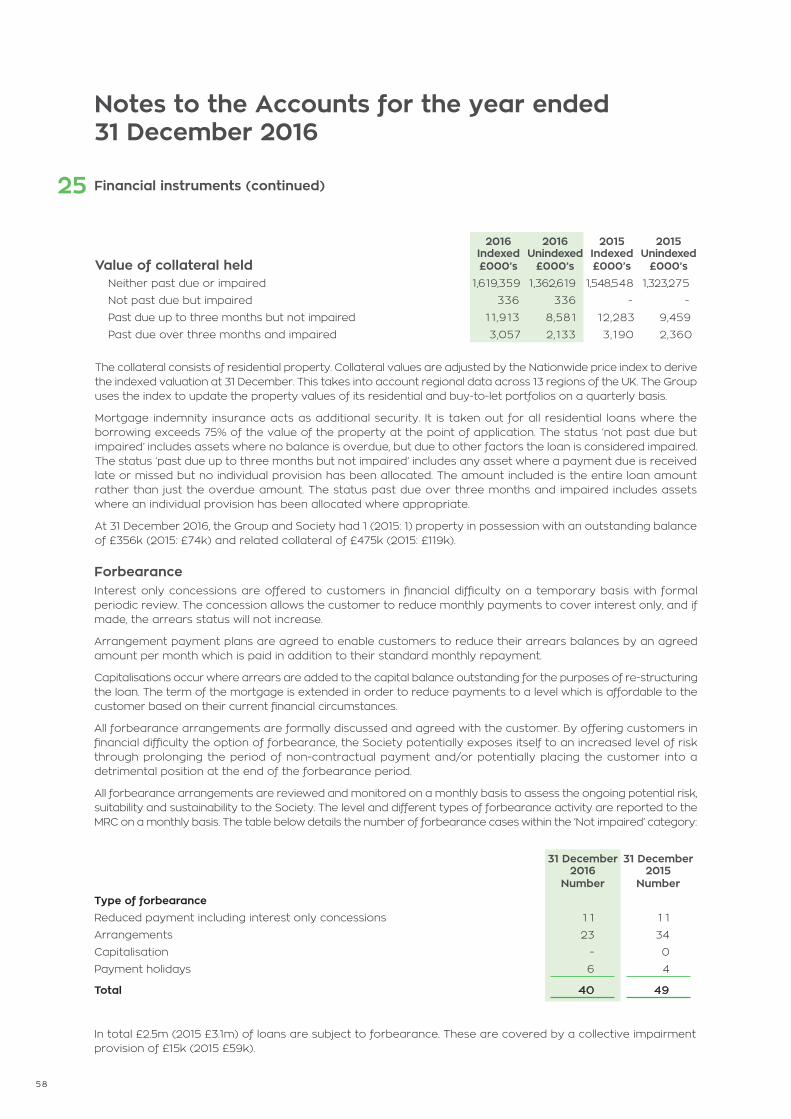
58
25 Financial instruments (continued)
31 December 2016
Number
31 December 2015
NumberType of forbearanceReduced payment including interest only concessions 1 1 1 1
Arrangements 23 34
Capitalisation - 0
Payment holidays 6 4
Total 40 49
In total £2.5m (2015 £3.1m) of loans are subject to forbearance. These are covered by a collective impairment provision of £15k (2015 £59k).
ForbearanceInterest only concessions are offered to customers in financial difficulty on a temporary basis with formal periodic review. The concession allows the customer to reduce monthly payments to cover interest only, and if made, the arrears status will not increase.
Arrangement payment plans are agreed to enable customers to reduce their arrears balances by an agreed amount per month which is paid in addition to their standard monthly repayment.
Capitalisations occur where arrears are added to the capital balance outstanding for the purposes of re-structuring the loan. The term of the mortgage is extended in order to reduce payments to a level which is affordable to the customer based on their current financial circumstances.
All forbearance arrangements are formally discussed and agreed with the customer. By offering customers in financial difficulty the option of forbearance, the Society potentially exposes itself to an increased level of risk through prolonging the period of non-contractual payment and/or potentially placing the customer into a detrimental position at the end of the forbearance period.
All forbearance arrangements are reviewed and monitored on a monthly basis to assess the ongoing potential risk, suitability and sustainability to the Society. The level and different types of forbearance activity are reported to the MRC on a monthly basis. The table below details the number of forbearance cases within the ‘Not impaired’ category:
Value of collateral held
2016 Indexed£000’s
2016 Unindexed
£000’s
2015 Indexed£000’s
2015 Unindexed
£000’s Neither past due or impaired 1,619,359 1,362,619 1,548,548 1,323,275
Not past due but impaired 336 336 - -
Past due up to three months but not impaired 11,913 8,581 12,283 9,459
Past due over three months and impaired 3,057 2,133 3,190 2,360
The collateral consists of residential property. Collateral values are adjusted by the Nationwide price index to derive the indexed valuation at 31 December. This takes into account regional data across 13 regions of the UK. The Group uses the index to update the property values of its residential and buy-to-let portfolios on a quarterly basis.
Mortgage indemnity insurance acts as additional security. It is taken out for all residential loans where the borrowing exceeds 75% of the value of the property at the point of application. The status ‘not past due but impaired’ includes assets where no balance is overdue, but due to other factors the loan is considered impaired. The status ‘past due up to three months but not impaired’ includes any asset where a payment due is received late or missed but no individual provision has been allocated. The amount included is the entire loan amount rather than just the overdue amount. The status past due over three months and impaired includes assets where an individual provision has been allocated where appropriate.
At 31 December 2016, the Group and Society had 1 (2015: 1) property in possession with an outstanding balance of £356k (2015: £74k) and related collateral of £475k (2015: £119k).
Notes to the Accounts for the year ended 31 December 2016
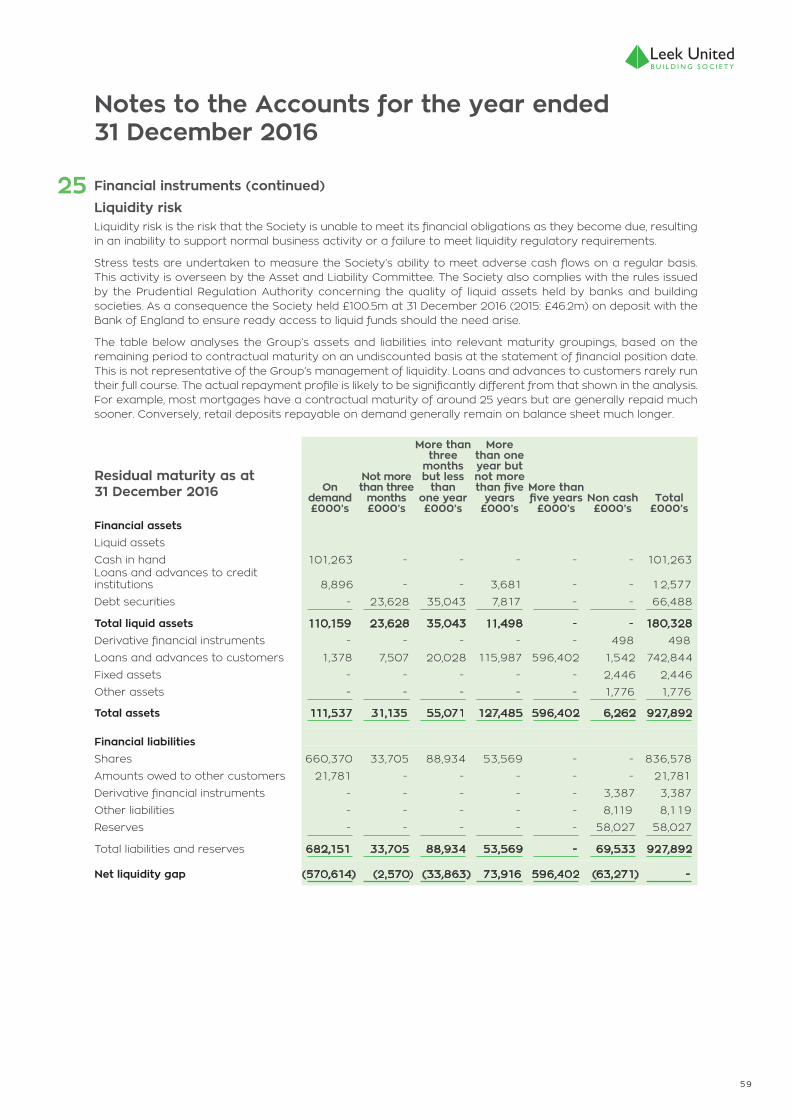
59
Residual maturity as at 31 December 2016 On
demand£000’s
Not more than three
months£000’s
More than three
months but less
than one year£000’s
More than one year but not more than five
years£000’s
More than five years
£000’sNon cash£000’s
Total £000’s
Financial assets
Liquid assets
Cash in hand 101,263 - - - - - 101,263Loans and advances to credit institutions 8,896 - - 3,681 - - 12,577
Debt securities - 23,628 35,043 7,817 - - 66,488
Total liquid assets 110,159 23,628 35,043 11,498 - - 180,328
Derivative financial instruments - - - - - 498 498
Loans and advances to customers 1,378 7,507 20,028 115,987 596,402 1,542 742,844
Fixed assets - - - - - 2,446 2,446
Other assets - - - - - 1,776 1,776
Total assets 111,537 31,135 55,071 127,485 596,402 6,262 927,892
Financial liabilities
Shares 660,370 33,705 88,934 53,569 - - 836,578
Amounts owed to other customers 21,781 - - - - - 21,781
Derivative financial instruments - - - - - 3,387 3,387
Other liabilities - - - - - 8,119 8,119
Reserves - - - - - 58,027 58,027
Total liabilities and reserves 682,151 33,705 88,934 53,569 - 69,533 927,892
Net liquidity gap (570,614) (2,570) (33,863) 73,916 596,402 (63,271) -
Financial instruments (continued)Liquidity riskLiquidity risk is the risk that the Society is unable to meet its financial obligations as they become due, resulting in an inability to support normal business activity or a failure to meet liquidity regulatory requirements.
Stress tests are undertaken to measure the Society’s ability to meet adverse cash flows on a regular basis. This activity is overseen by the Asset and Liability Committee. The Society also complies with the rules issued by the Prudential Regulation Authority concerning the quality of liquid assets held by banks and building societies. As a consequence the Society held £100.5m at 31 December 2016 (2015: £46.2m) on deposit with the Bank of England to ensure ready access to liquid funds should the need arise.
The table below analyses the Group’s assets and liabilities into relevant maturity groupings, based on the remaining period to contractual maturity on an undiscounted basis at the statement of financial position date. This is not representative of the Group’s management of liquidity. Loans and advances to customers rarely run their full course. The actual repayment profile is likely to be significantly different from that shown in the analysis. For example, most mortgages have a contractual maturity of around 25 years but are generally repaid much sooner. Conversely, retail deposits repayable on demand generally remain on balance sheet much longer.
25
Notes to the Accounts for the year ended 31 December 2016

60
25 Financial instruments (continued)
Residual maturity as at 31 December 2015 On
demand£000’s
Not more than three
months£000’s
More than three
months but less
than one year£000’s
More than one year but not more than five
years£000’s
More than five years
£000’sNon cash£000’s
Total £000’s
Financial assets
Liquid assets
Cash in hand 47,009 - - - - - 47,009Loans and advances to credit institutions 9,794 - - 1,750 - - 1 1,544
Debt securities - 57,213 48,052 7,982 - - 113,247
Total liquid assets 56,803 57,213 48,052 9,732 - - 171,800
Derivative financial instruments - - - - - 84 84
Loans and advances to customers 669 6,272 20,209 122,1 74 565,449 409 715,182
Fixed assets - - - - - 2,360 2,360
Other assets - - - - - 1,2 2 1 1,2 2 1
Total assets 57,472 63,485 68,261 131,906 565,449 4,074 890,647
Repayable on
demand£000’s
Not more than three
months£000’s
More than three
months but not more
than six months£000’s
More than six months but less than one
year£000’s
More than one year but not more than five
years£000’s
More than five years
£000’sTotal
£000’s31 December 2016
Shares 660,370 33,806 33,030 56,7 13 54,794 - 838,7 13
Amounts owed to other customers 21,78 1 - - - - - 21,781
Derivative financial instruments - 527 476 794 1,322 - 3, 1 1 9
Total liabilities 682,151 34,333 33,506 57,507 56,116 - 863,613
31 December 2015Shares 612,803 40,911 34,910 57,457 61,749 - 807,830
Amounts owed to other customers 20,360 - - - - - 20,360
Derivative financial instruments - 437 383 407 371 - 1,598
Total liabilities 633,163 41,348 35,293 57,864 62,120 - 829,788
Financial liabilities
Shares 612,807 40,542 91,652 60,1 14 - - 805,1 1 5
Amounts owed to other customers 20,360 - - - - - 20,360
Derivative financial instruments - - - - - 1,501 1,501
Other liabilities - - - - - 4,961 4,961
Reserves - - - - - 58,710 58,7 10
Total liabilities and reserves 633,167 40,542 91,652 60,114 - 65,172 890,647
Net liquidity gap (575,695) 22,943 (23,391) 71,792 565,449 (61,098) -
There are no material differences between the maturity profile for the Group and that for the Society:
The following is an analysis of gross contractual cash flows payable under financial liabilities
Notes to the Accounts for the year ended 31 December 2016

61
Financial instruments (continued)Market riskMarket risk is the risk of changes to the Society’s financial condition caused by market interest rates. The Society is exposed to market risk in the form of changes (or potential changes) in the general level of interest rates, changes in the relationship between short and long-term interest rates and divergence of interest rates for different balance sheet elements (basis risk).
The Society hedges interest rate risk by hedging its exposure to fixed mortgage lending tranches. Overall interest rate risk is managed through a statement of financial position gap analysis. The statement of financial position is subjected to a stress test of a 2% change in interest rates on a monthly basis and the results are measured against the risk appetite for market risk which is currently set at a maximum of 2.5% of capital. The Society’s exposure to a 2% change in interest rates was 0.8% of capital (£0.4m) at 31 December 2016 (2015: 0.8%, £0.4m). In addition, interest rate basis risk is controlled by Board approved risk appetite. Both are reported to the monthly ALCO meeting and to the Board.
The table below summarises the Society’s exposure to interest rate risk. Included in the table are Society assets and liabilities, including derivative financial instruments which are principally used to reduce exposure to interest rate risk, categorised by re-pricing date.
The interest rate sensitivity gap of the Society at 31 December 2016 by reference to the next interest reset date is shown below:
25
Not more than three
months£000’s
More than three
months but not more
than six months£000’s
More than six months but not more
than one year
£000’s
More than one year but not more than five
years £000’s
Non interest bearing £000’s
Total £000’s
Financial assets
Cash in hand 101,253 - - - 10 101,263Loans and advances to credit institutions 12,576 - - - 1 12,577
Debt securities 23,488 10,000 24,900 7,022 1,078 66,488
Total liquid assets 137,317 10,000 24,900 7,022 1,089 180,328
Derivative financial instruments - - - - 498 498Loans fully secured on residential property and other loans 373,212 28,825 82,067 257,1 98 1,542 742,844
Fixed assets - - - - 2,446 2,446
Other assets - - - - 1,776 1,776
Total assets 510,529 38,825 106,967 264,220 7,351 927,892
Liabilities
Shares 688,647 32,485 55,923 53,252 6,271 836,578Amounts owed to credit institutions and other customers 21,714 - - - 67 21,78 1
Derivative financial instruments - - - - 3,387 3,387
Other liabilities - - - - 8,1 19 8,1 19
Reserves - - - - 58,027 58,027
Total liabilities 710,361 32,485 55,923 53,252 75,871 927,892
Off balance sheet Items 290,602 (8,609) (59,286) (222,707) - -
Net interest rate gap 90,770 (2,269) (8,242) (11,739) (68,520) -
There are no material differences between the maturity profile for the Group and that for the Society.
Notes to the Accounts for the year ended 31 December 2016
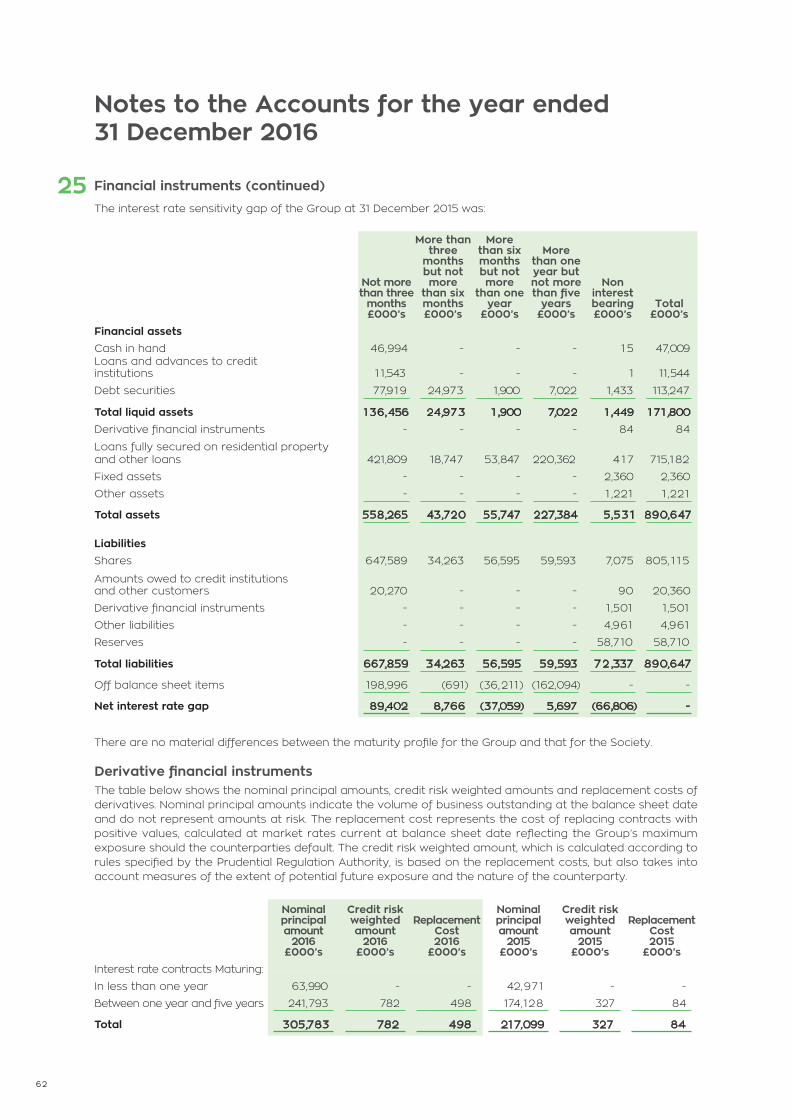
62
25
Not more than three
months£000’s
More than three
months but not more
than six months£000’s
More than six months but not more
than one year
£000’s
More than one year but not more than five
years £000’s
Non interest bearing £000’s
Total £000’s
Financial assets
Cash in hand 46,994 - - - 1 5 47,009Loans and advances to credit institutions 1 1,543 - - - 1 11,544
Debt securities 77,919 24,973 1,900 7,022 1,433 113,247
Total liquid assets 136,456 24,973 1,900 7,022 1,449 171,800
Derivative financial instruments - - - - 84 84
Loans fully secured on residential property and other loans 421,809 18,747 53,847 220,362 4 1 7 715,182
Fixed assets - - - - 2,360 2,360
Other assets - - - - 1 ,221 1 ,221
Total assets 558,265 43,720 55,747 227,384 5,531 890,647
Nominal principal amount
2016£000’s
Credit risk weighted amount
2016£000’s
Replacement Cost 2016
£000’s
Nominal principal amount
2015£000’s
Credit risk weighted amount
2015£000’s
Replacement Cost 2015
£000’sInterest rate contracts Maturing:
In less than one year 63,990 - - 42,971 - -
Between one year and five years 241,793 782 498 174,128 327 84
Total 305,783 782 498 217,099 327 84
Financial instruments (continued)The interest rate sensitivity gap of the Group at 31 December 2015 was:
Liabilities
Shares 647,589 34,263 56,595 59,593 7,075 805, 1 1 5
Amounts owed to credit institutions and other customers 20,270 - - - 90 20,360
Derivative financial instruments - - - - 1 ,501 1 ,501
Other liabilities - - - - 4,961 4,961
Reserves - - - - 58,7 10 58,710
Total liabilities 667,859 34,263 56,595 59,593 72,337 890,647
Off balance sheet items 198,996 (691) (36,211) (162,094) - -
Net interest rate gap 89,402 8,766 (37,059) 5,697 (66,806) -
There are no material differences between the maturity profile for the Group and that for the Society.
Derivative financial instrumentsThe table below shows the nominal principal amounts, credit risk weighted amounts and replacement costs of derivatives. Nominal principal amounts indicate the volume of business outstanding at the balance sheet date and do not represent amounts at risk. The replacement cost represents the cost of replacing contracts with positive values, calculated at market rates current at balance sheet date reflecting the Group’s maximum exposure should the counterparties default. The credit risk weighted amount, which is calculated according to rules specified by the Prudential Regulation Authority, is based on the replacement costs, but also takes into account measures of the extent of potential future exposure and the nature of the counterparty.
Notes to the Accounts for the year ended 31 December 2016

63
26 Retirement benefit obligationsThe Society operates a defined benefit scheme in the UK. This is a separate trustee administered fund holding the pension scheme asset to meet long term pension liabilities. A full actuarial valuation was carried out at 24 April 2015 and updated to 31 December 2016 by a qualified actuary, independent of the scheme’s sponsoring employer. The major assumptions used by the actuary as shown below.
This most recent actuarial valuation showed a deficit of £3,814,000. The Society agreed with the trustees that it will aim to eliminate the deficit over a period of five years from 24 April 2015 by the payment of £765,000 before 31 March 2016 and thereafter annual contributions of £765,000 to be paid for four years until March 2020 in respect of the deficit. In addition, and in accordance with the actuarial valuation, the Society has agreed with the trustees that it will meet expenses of the scheme and levies to the Pension Protection Fund. The Scheme closed to accrual whilst retaining salary linkage for post service benefits from 24 April 2013.
There remains a contingent liability in respect of future pension scheme deficits.
Present values of defined benefit obligation, fair value of assets and defined asset (liability)
2016£000’s
2015£000’s
2014£000’s
Fair value of scheme assets 38,721 32,976 32,669
Present value of scheme liabilities (44,715) (35,821) (35,217)
Deficit in scheme (5,944) (2,845) (2,548)
The increase in deficit of the scheme has been caused by increases in expected long term inflation and reductions in long term investment returns.
Reconciliation of opening and closing balances of the defined benefit obligation
2016£000’s
2015£000’s
Defined benefit obligation at start of year 35,821 35,217
Current service cost 54 61
Interest expense 1,309 1,185
Actuarial losses 8,461 165
Benefits paid (930) (807)
Defined benefit obligation at end of year 44,715 35,821
Reconciliation of opening and closing balances of the fair values of scheme assets
2016£000’s
2015£000’s
Fair value of scheme assets at start of year 32,976 32,669
Interest income 1,227 1,098
Actuarial gains/(losses) 4,123 (36)
Contributions by Society 1,325 52
Benefits paid (930) (807)
Scheme assets at end of year 38,721 32,976
The actual return on the plan assets over the year ended 31 December 2016 was £5,350,000 (2015: £1,062,000).
Notes to the Accounts for the year ended 31 December 2016

64
26
2016£000’s
2015£000’s
Current service cost 54 61
Net interest cost 82 87
Defined benefit cost recognised in profit and loss account 136 148
2016£000’s
2015£000’s
Return on plan assets (excluding amounts included in net interest cost) – gain/(loss) 4,123 (36)
Experience gains and losses arising on the plan liabilities - gain/(loss) 15 (1,538)
Effects of changes in the demographic and financial assumptions underlying the present value of the plan liabilities: (loss)/gain (8,476) 1,373
Total amount recognised in Other Comprehensive Income – loss (4,338) (201)
Retirement benefit obligations (continued)Total defined benefit costs recognised in the Income Statement
Defined benefit costs recognised in Other Comprehensive Income
Assets2016
£000’s2015
£000’s2014
£000’s
UK equities - 4,1 76 4,1 5 3
Overseas equities - 4,377 4,368
Corporate bonds - 521 620
Diversified growth funds 12,047 1 1,342 11,098
Liability driven investment funds 2,055 - -
Equity linked bond funds 10,286 - -
Insured pensioners 14,269 12,558 12,379
Other 64 2 51
Total 38,721 32,976 32,669
None of the fair values of the assets shown above include any direct investment in the Society’s own financial instruments or any property occupied by, or other assets used by, the Society.
Notes to the Accounts for the year ended 31 December 2016
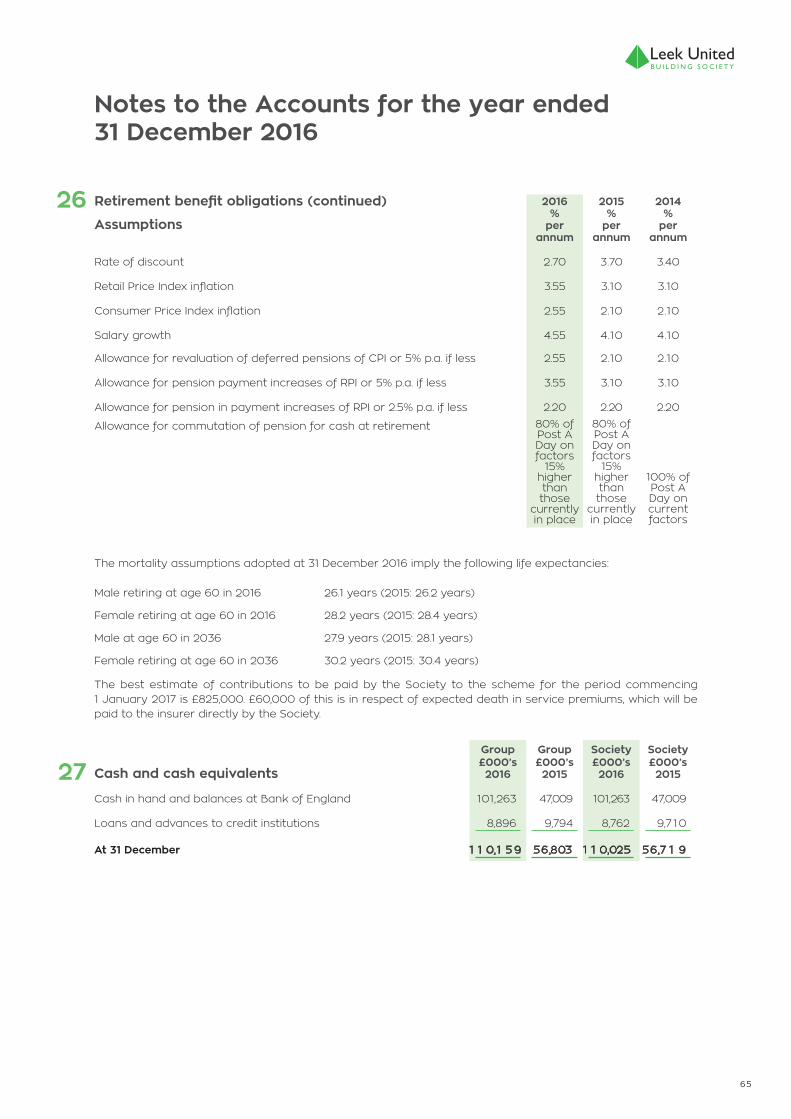
65
26
27 Cash and cash equivalents
Group£000’s 2016
Group£000’s 2015
Society£000’s 2016
Society£000’s 2015
Cash in hand and balances at Bank of England 101,263 47,009 101,263 47,009
Loans and advances to credit institutions 8,896 9,794 8,762 9,7 10
At 31 December 110,159 56,803 110,025 56,719
Retirement benefit obligations (continued)
Assumptions
2016%
per annum
2015%
per annum
2014%
per annum
Rate of discount 2.70 3.70 3.40
Retail Price Index inflation 3.55 3.10 3.10
Consumer Price Index inflation 2.55 2.10 2.10
Salary growth 4.55 4.10 4.10
Allowance for revaluation of deferred pensions of CPI or 5% p.a. if less 2.55 2.10 2.10
Allowance for pension payment increases of RPI or 5% p.a. if less 3.55 3.10 3.10
Allowance for pension in payment increases of RPI or 2.5% p.a. if less 2.20 2.20 2.20
Allowance for commutation of pension for cash at retirement 80% of Post A Day on factors
15% higher than those
currently in place
80% of Post A Day on factors
15% higher than those
currently in place
100% of Post A Day on current factors
Male retiring at age 60 in 2016 26.1 years (2015: 26.2 years)
Female retiring at age 60 in 2016 28.2 years (2015: 28.4 years)
Male at age 60 in 2036 27.9 years (2015: 28.1 years)
Female retiring at age 60 in 2036 30.2 years (2015: 30.4 years)
The mortality assumptions adopted at 31 December 2016 imply the following life expectancies:
The best estimate of contributions to be paid by the Society to the scheme for the period commencing 1 January 2017 is £825,000. £60,000 of this is in respect of expected death in service premiums, which will be paid to the insurer directly by the Society.
Notes to the Accounts for the year ended 31 December 2016

66
28
29
30
General reserve
2016Group£000’s
2015Group£000’s
2016Society£000’s
2015Society£000’s
At 1 January 57,771 54,358 57,364 54,036
Profit for the financial year 2,781 3,600 3,083 3,515
Net loss recognised directly in other comprehensive income (3,658) (187) (3,658) (187)
At 31 December 56,894 57,771 56,789 57,364
Available for Sale reserve
2016Group£000’s
2015Group£000’s
2016Society£000’s
2015Society£000’s
At 1 January (28) 146 (28) 146
Net gains/(losses) from changes in fair value 148 (220) 1 48 (220)
Corporation tax on Available for Sale reserve - 41 - 41
Deferred tax on Available for Sale reserve 6 5 6 5
At 31 December 126 (28) 126 (28)
As set out on page 11, the general reserves along with the revaluation reserve and available for sale reserve constitute the Society’s Tier 1 Capital for regulatory purposes.
The revaluation reserve arises because until 31 December 1999, the Society revalued properties annually. From 31 December 2000, the Society adopted the transitional arrangements under FRS15 to maintain the book value of fixed assets at their previously revalued amounts. The resultant potential gain results in a capital gain for deferred tax purposes which is recognised under FRS 102.
Revaluation reserve
2016Group£000’s
2015Group£000’s
2016Society£000’s
2015Society£000’s
At 1 January 967 955 967 955
Tax on revaluation reserve 40 12 40 12
At 31 December 1,007 967 1,007 967
Notes to the Accounts for the year ended 31 December 2016

67
The Capital Requirements (Country-by-Country Reporting) Regulations 2013 introduce reporting obligations for institutions within the scope of the European Union’s Capital Requirements Directive (CRD IV). The requirements aim to give increased transparency regarding the activities of institutions.
The information below has been audited in accordance with the standards required by Directive 2006/43/EC.
Nature of the Society’s activitiesLeek United Building Society’s principal activity is the provision of mortgage and savings products and general insurance and financial services broking services. A list of all entities consolidated as part of the Society’s results and their principal activities are set out below. All business is conducted within the United Kingdom.
Total turnover, profit before tax and average number of employees Total turnover for the year ended 31 December 2016 was £12,675k (2015: £13,000k). Total turnover is defined as net interest income plus fees and commissions receivable (net of fees and commissions payable).
Profit before tax for the year ended 31 December 2016 was £3,495k (2015: £4,516k). Corporation tax paid during the year ended 31 December 2016 was £339k (2015: £657k).
All turnover, profits and tax resulted from business conducted in the United Kingdom.
The average monthly number of employees on a full-time equivalent basis during the year ended 31 December 2016 was 160 (2015: 152).
Public subsidies receivedThe Society received no public subsidies in the year ended 31 December 2016 (2015: nil).
Country by Country Reporting
Group member Activity
Leek United Building Society Provision of mortgage and savings products, and general insurance and financial services broking services
Leek United Home Loans Ltd(Wholly owned subsidiary of Leek United Building Society)
Purchase and administration of mortgage portfolios. No purchases of portfolios have taken place in the last ten years and none are planned
Leek United Financial Services Ltd(Wholly owned subsidiary of Leek United Building Society)
Provision of financial services up until 30 September 2016
The Mortgage Outlet Ltd(Wholly owned subsidiary of Leek United Building Society)
Ceased trading on 31 December 2009

68
We have audited the accompanying schedule of Leek United Building Society for the year ended 31 December 2016 (“the schedule”). The schedule has been prepared by the directors based on the requirements of the Capital Requirements (Country-by-Country Reporting) Regulations 2013.
Directors’ responsibility for the scheduleThe directors are responsible for the preparation of the schedule, in accordance with the Capital Requirements (Country-by-Country Reporting) Regulations 2013, for the appropriateness of the basis of preparation and the interpretation of the Regulations as they affect the preparation of the schedule, and for such internal control as the directors determine is necessary to enable the preparation of the schedule that is free from material misstatement, whether due to fraud or error.
Auditors’ responsibilityOur responsibility is to express an opinion on the schedule based on our audit. We conducted our audit in accordance with International Standards on Auditing. Those standards require that we comply with ethical requirements and plan and perform the audit to obtain reasonable assurance about whether the schedule is free from material misstatement.
An audit involves performing procedures to obtain audit evidence about the amounts and disclosures in the schedule. The procedures selected depend on the auditors’ judgement, including the assessment of the risks of material misstatement of the schedule, whether due to fraud or error. In making those risk assessments, the auditor considers internal control relevant to the entity's preparation of the schedule in order to design audit procedures that are appropriate in the circumstances, but not for the purpose of expressing an opinion on the effectiveness of the entity's internal control. An audit also includes evaluating the appropriateness of accounting policies used and the reasonableness of accounting estimates made by management, as well as evaluating the overall presentation of the schedule.
We believe that the audit evidence we have obtained is sufficient and appropriate to provide a basis for our audit opinion.
OpinionIn our opinion, the country-by-country information in the schedule at 31 December 2016 is prepared, in all material respects, in accordance with the requirements of the Capital Requirements (Country-by-Country Reporting) Regulations 2013.
Basis of preparation and restriction on distributionWithout modifying our opinion, we draw attention to the schedule, which describes the basis of preparation. The schedule is prepared to assist the directors to meet the requirements of the Capital Requirements (Country-by-Country Reporting) Regulations 2013. As a result, the schedule may not be suitable for another purpose.
Our report is intended solely for the benefit of the directors of the Leek United Building Society. We do not accept or assume any responsibility or liability to any other party save where terms are agreed between us in writing.
PricewaterhouseCoopers LLP
Chartered Accountants
Manchester
22 February 2017
Independent auditors’ report to the directors of Leek United Building Society
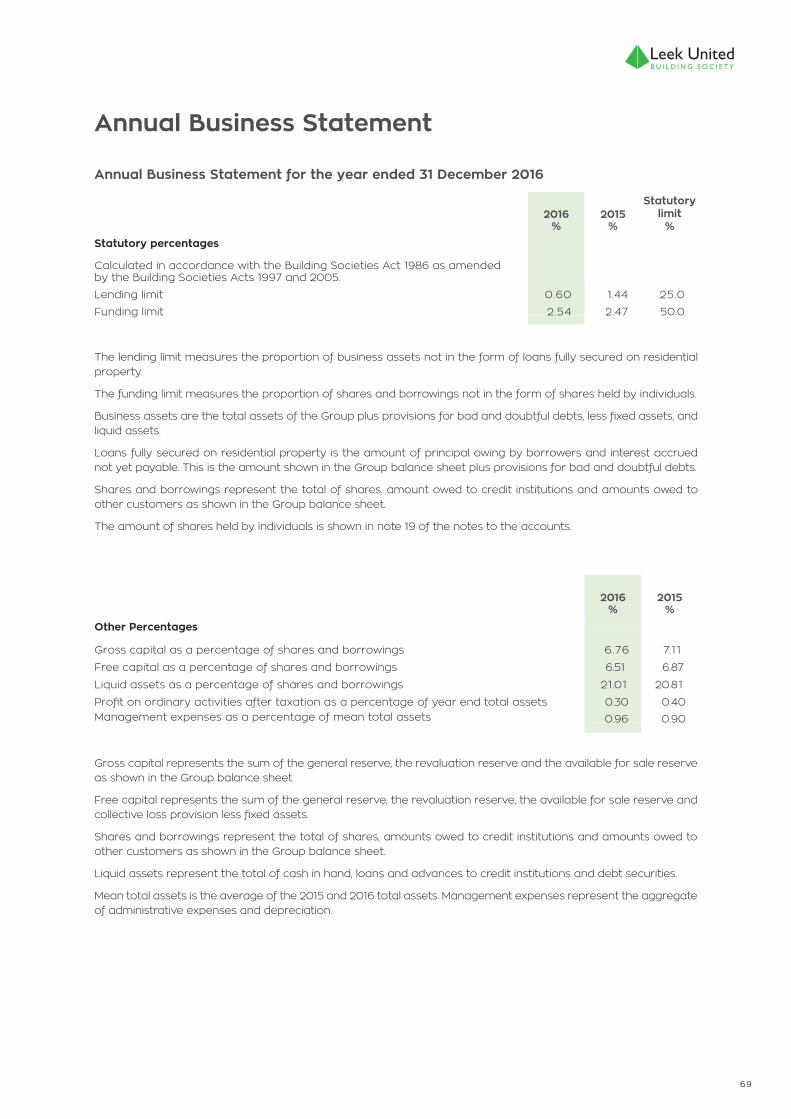
69
Annual Business Statement
2016 %
2015 %
Statutorylimit
%Statutory percentages
Calculated in accordance with the Building Societies Act 1986 as amended by the Building Societies Acts 1997 and 2005.
Lending limit 0.60 1.44 25.0
Funding limit 2.54 2.47 50.0
The lending limit measures the proportion of business assets not in the form of loans fully secured on residential property.
The funding limit measures the proportion of shares and borrowings not in the form of shares held by individuals.
Business assets are the total assets of the Group plus provisions for bad and doubtful debts, less fixed assets, and liquid assets.
Loans fully secured on residential property is the amount of principal owing by borrowers and interest accrued not yet payable. This is the amount shown in the Group balance sheet plus provisions for bad and doubtful debts.
Shares and borrowings represent the total of shares, amount owed to credit institutions and amounts owed to other customers as shown in the Group balance sheet.
The amount of shares held by individuals is shown in note 19 of the notes to the accounts.
2016 %
2015 %
Other Percentages
Gross capital as a percentage of shares and borrowings 6.76 7.11
Free capital as a percentage of shares and borrowings 6.51 6.87
Liquid assets as a percentage of shares and borrowings 21.01 20.81
Profit on ordinary activities after taxation as a percentage of year end total assets 0.30 0.40Management expenses as a percentage of mean total assets 0.96 0.90
Gross capital represents the sum of the general reserve, the revaluation reserve and the available for sale reserve as shown in the Group balance sheet.
Free capital represents the sum of the general reserve, the revaluation reserve, the available for sale reserve and collective loss provision less fixed assets.
Shares and borrowings represent the total of shares, amounts owed to credit institutions and amounts owed to other customers as shown in the Group balance sheet.
Liquid assets represent the total of cash in hand, loans and advances to credit institutions and debt securities.
Mean total assets is the average of the 2015 and 2016 total assets. Management expenses represent the aggregate of administrative expenses and depreciation.
Annual Business Statement for the year ended 31 December 2016
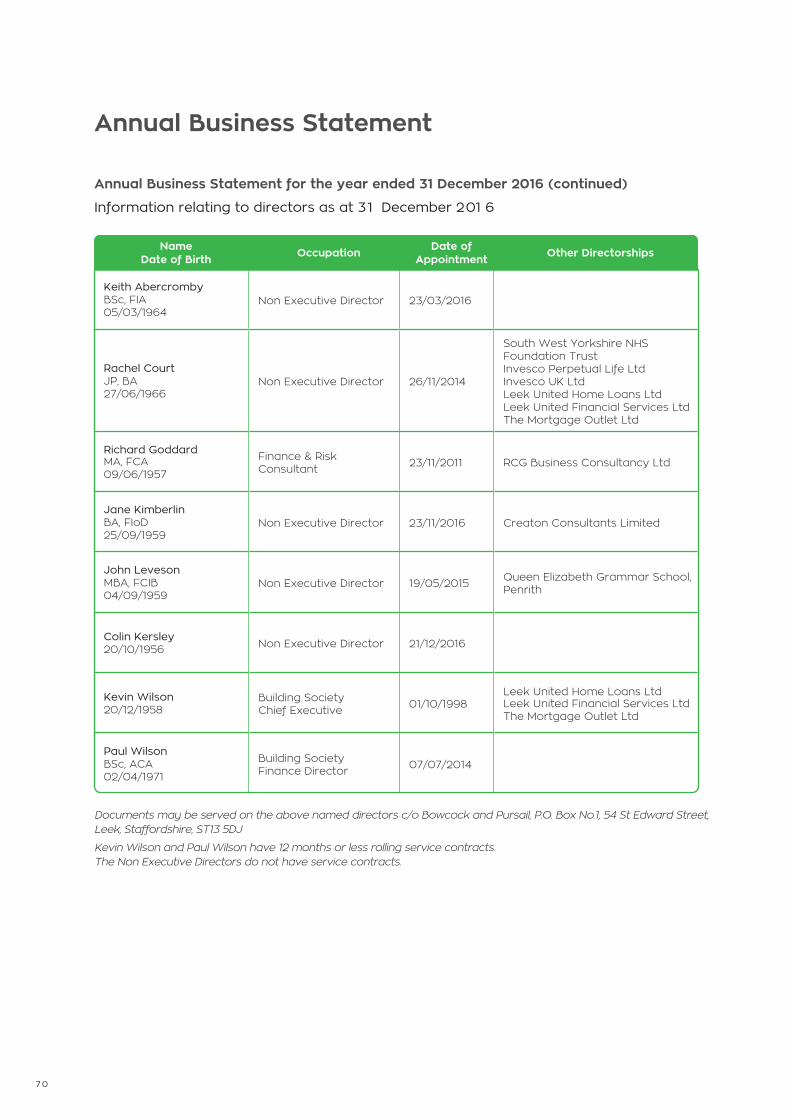
70
Annual Business Statement for the year ended 31 December 2016 (continued)
Information relating to directors as at 31 December 2016
Name Date of Birth Occupation Date of
Appointment Other Directorships
Keith AbercrombyBSc, FIA05/03/1964
Non Executive Director 23/03/2016
Rachel Court JP, BA27/06/1966
Non Executive Director 26/11/2014
South West Yorkshire NHS Foundation TrustInvesco Perpetual Life LtdInvesco UK LtdLeek United Home Loans LtdLeek United Financial Services LtdThe Mortgage Outlet Ltd
Richard Goddard MA, FCA09/06/1957
Finance & Risk Consultant 23/11/2011 RCG Business Consultancy Ltd
Jane KimberlinBA, FIoD25/09/1959
Non Executive Director 23/11/2016 Creaton Consultants Limited
John Leveson MBA, FCIB04/09/1959
Non Executive Director 19/05/2015 Queen Elizabeth Grammar School, Penrith
Colin Kersley20/10/1956 Non Executive Director 21/12/2016
Kevin Wilson 20/12/1958
Building Society Chief Executive 01/10/1998
Leek United Home Loans LtdLeek United Financial Services LtdThe Mortgage Outlet Ltd
Paul Wilson BSc, ACA02/04/1971
Building Society Finance Director 07/07/2014
Annual Business Statement
Documents may be served on the above named directors c/o Bowcock and Pursail, P.O. Box No.1, 54 St Edward Street, Leek, Staffordshire, ST13 5DJ
Kevin Wilson and Paul Wilson have 12 months or less rolling service contracts. The Non Executive Directors do not have service contracts.


50 St Edward Street, Leek Staffordshire, ST13 5DL
t: 01538 384151* f: 01538 399179DX: 16354 LEEK
[email protected] www.leekunited.co.uk
*Calls may be monitored and recorded for training purposes.
The pulp used in the manufacture of this paper is from renewable timber produced from sustainable forests and is elemental chlorine free.