2016 Jordan Valley Water Conservancy District Annual Report
24
-
Upload
conservation-garden-park -
Category
Government & Nonprofit
-
view
207 -
download
0
Transcript of 2016 Jordan Valley Water Conservancy District Annual Report

Contents
Acronyms used in this publication:
AF: Acre-feet
AMI: Advanced Metering Infrastructure
CT: Contact Time
JVWTP: Jordan Valley Water Treatment Plant
MGD: million gallons per day
SCADA: Supervisory Control and
Data Acquisition
3 4
7
6
8 12
13 15 16
18 20 21
General Managers’ Message
Wholesale MemberAgencies
Service Area
Board of Trustees Capital Projects Deliveries
Sources Financial Stewardship
Water Deliveriesand Population
Executive Staff OutstandingEmployees
On the coverA major project in 2016 was
the construction of a new
12.5 million-gallon reservoir at
Jordan Valley Water Treatment
Plant. This reservoir will not
only provide an additional
hour of emergency storage
and buffer fluctuating demand
on the water delivery system,
it will also provide disinfection
contact time to reduce by-
products. The photo is of the
finished water outflow channel
and was taken by Steve Blake.
In this year’s report, we focus
on some of the ways we meet
our member agencies’ needs,
through whom we provide
quality water and services to
more than 680,000 people in
the Salt Lake Valley.
Repair & Replacement

01
Jordan Valley Water Treatment Plant
Photo by Tweet Johnson.
General ManagersRichard P. BayGeneral Manager
02
Barton A. ForsythAssistant General Manager
Alan E. PackardAssistant General Manager

03
J ordan Valley Water provides water service for more than 680,000 residents in Salt Lake County. This is a challenging undertaking,
involving tremendous amounts of water infrastructure. As Jordan Valley Water provides water service to its customers, it addresses water
infrastructure in two important approaches: managing and maintaining existing infrastructure, and expanding new infrastructure to provide
service for a rapidly growing population. The extensive scope of this water infrastructure can easily go unnoticed, and unappreciated by the
public, because most is out of sight and underground.
Jordan Valley Water recently conducted tours for elected officials by walking inside the Jordan Aqueduct Terminal Reservoir. This huge
underground concrete cavern stores 100 million gallons of treated water and provides service to Jordan Valley Water’s member cities.
Despite its tremendous capacity, the elected officials were surprised to learn that its capacity is only equal to about 13 hours of summer water
demands!
The Terminal Reservoir provides a good visual example of the two approaches to water infrastructure by Jordan Valley Water. Managing this
tremendous infrastructure requires ongoing maintenance, regular repair, and replacement of aging components. At the same time, its 13 hours
of peak demand capacity reminds visitors of the need to continually expand and enlarge water infrastructure to meet the needs of Jordan
Valley Water’s rapidly growing member cities.
In this year’s annual report, we will focus on work and efforts by Jordan Valley Water to maintain and improve water service to our member
agencies, including fast-growing cities, water improvement districts, state government departments, and corporations.
How can Jordan Valley Water best support its fast-growing cities and improvement districts, as well as those that are more stable and nearly
built out? Each agency requires stable, consistent, reliable, and high-quality water, 24 hours of every day of the year. Jordan Valley Water’s
capital plan includes aggressive repair and replacement projects to maintain aging infrastructure and to provide water delivery redundancies,
as well as aggressive expansion of water infrastructure in areas of new growth. This approach provides substantial benefits to nearly built-out
cities and districts as well as rapidly growing ones, by providing the ability to nimbly meet water needs of changing demographics and rapid
population growth.
In short, the capital projects plan of Jordan Valley Water provides resources to manage existing water infrastructure and to build new
infrastructure to provide more reliable, high-quality water service for all of our member cities, districts, and corporations. These efforts mean
reliable, high-quality water deliveries to individual water customers throughout Salt Lake Valley.

City of BluffdaleMark Reid, City ManagerTrustee Representative: Wm. Brent Johnson
Draper CityDavid Dobbins, City ManagerTrustee Representative: Ronald E. Sperry
Granger-Hunter Improvement DistrictClint Jensen, General ManagerTrustee Representatives: Corey L. Rushton & Karen D. Lang
Herriman CityBrett Wood, City ManagerTrustee Representative: Wm. Brent Johnson
Hexcel CorporationBrian Wheeler, Environmental EngineerTrustee Representative: Gregory R. Christensen
Kearns Improvement DistrictPam Gill, General ManagerTrustee Representative: Gregory R. Christensen
Magna Water DistrictTerry Pollock, General ManagerTrustee Representative: Gregory R. Christensen
Midvale CityKane Loader, City ManagerTrustee Representative: Ronald E. Sperry
Riverton CityLance Blackwood, City ManagerTrustee Representative: Wm. Brent Johnson
City of South JordanGary Whatcott, City ManagerTrustee Representative: Scott L. Osborne
City of South Salt LakeDennis Pay, Public Works DirectorTrustee Representative: Stephen W. Owens
Taylorsville-Bennion Improvement DistrictKeith Lord, General ManagerTrustee Representative: Gary C. Swensen
Utah Department of CorrectionsGreg Peay, Director of FacilitiesTrustee Representative: Ronald E. Sperry
WaterPro, Inc.Darrin Jensen-Peterson, General ManagerTrustee Representative: Ronald E. Sperry
City of West JordanMark Palesh, City ManagerTrustee Representative: Chad G. Nichols
White City Water Improvement DistrictPaul Ashton, General ManagerTrustee Representative: Stephen W. Owens
Willow Creek Country ClubAlex Nicolaidis, General ManagerTrustee Representative: Stephen W. Owens
04
Wholesale Member Agencies
05
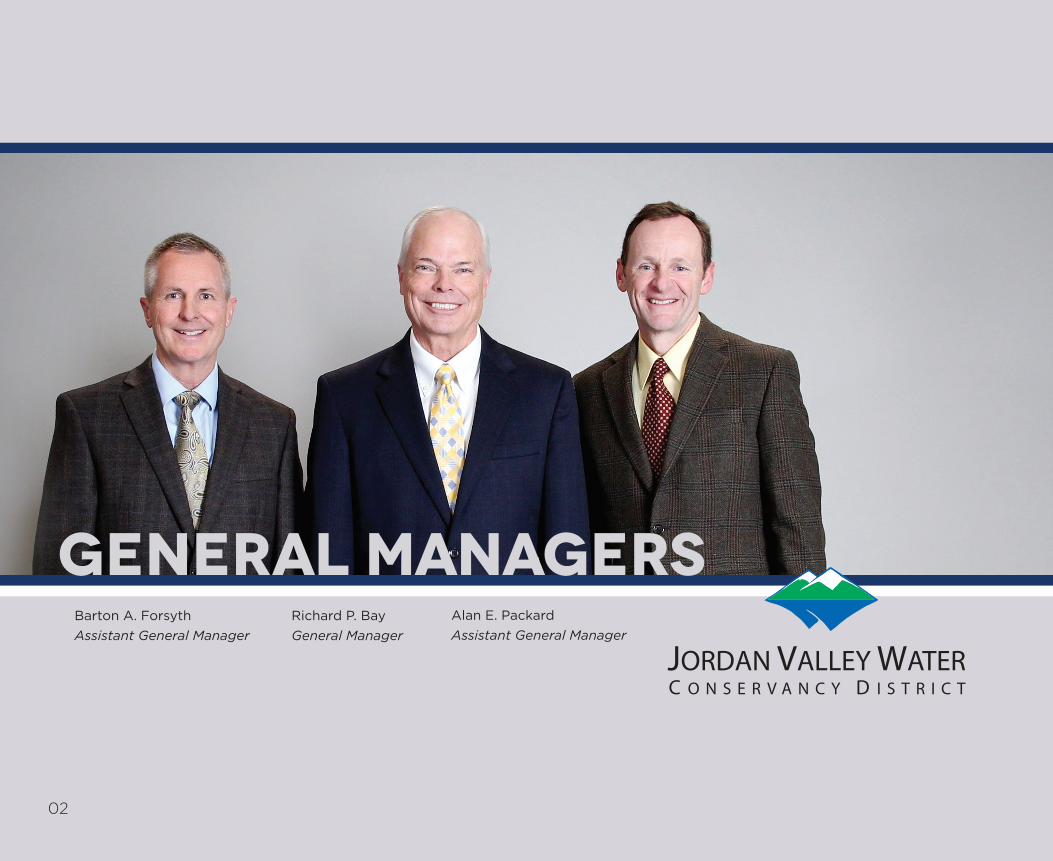
Replacing a 24-inch valve at Southwest Groundwater Treatment Plant. This treatment plant purifies mining-contaminated groundwater that would otherwise be unusable by our member agencies.
Photo by Brady Young.

Jordan Aqueduct
Jord
an A
que
duc
t
Jord
an R
iver
Provo River
Salt Lake Aqueduct
Provo River Aqueduct
JordanelleReservoir
Deer CreekReservoir
Great Salt Lake
Utah Lake
Jordan Valley Water’s service area encompasses much of the Salt
Lake Valley, including the most rapidly-growing areas in the state.
Sources of water include the Provo, Weber and Duchesne rivers,
groundwater, and local mountain streams. More information about
our sources can be found on page 13.
Jordan Valley Water’sService Area
06

Left to right:, back row
Karen D. Lang
Stephen W. OwensConservation Committee Chair
W. Brent Johnson
Gregory R. Christensen
Chad G. Nichols
Left to right:, front row
Corey L. RushtonChair
Gary C. Swensen
Scott L. OsborneVice Chair
Ronald E. SperryFinance Committee Chair
Trustees
07
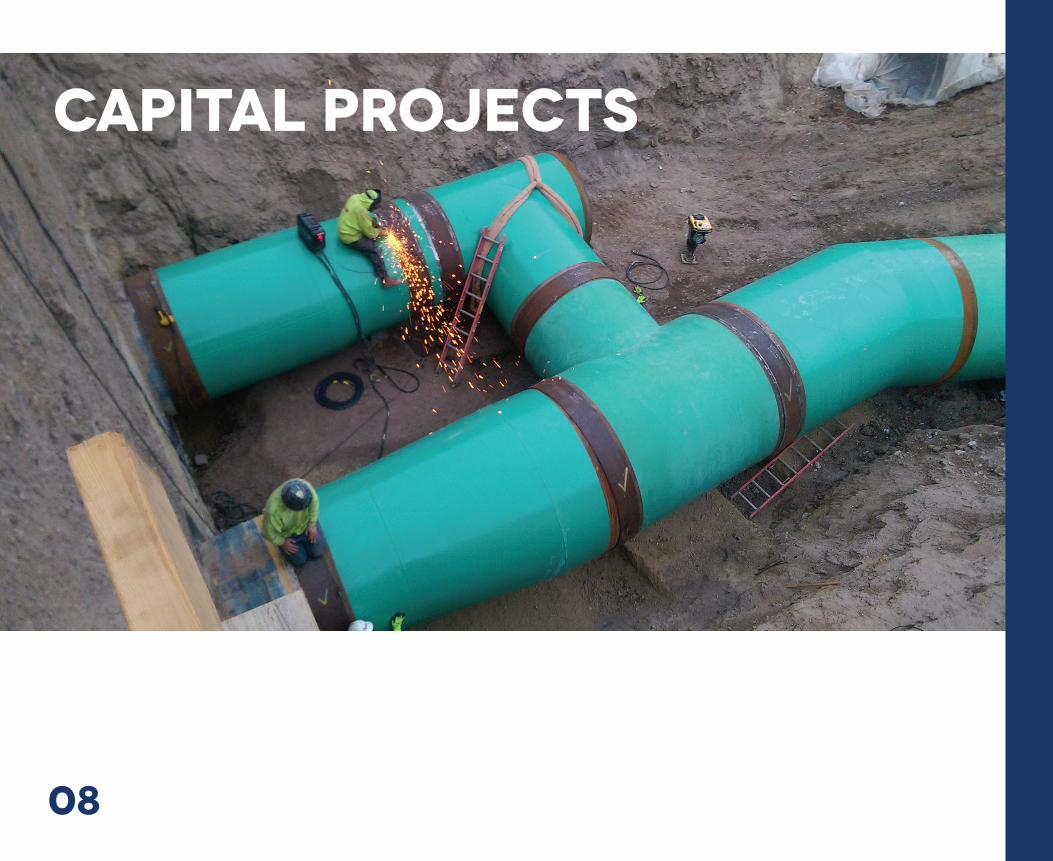
Capital Projects
capital projects v POPULATION
08

Jordan Valley Water’s capital projects allow us to better
serve more than 680,000 population through our
member agencies. In 2016, major capital projects included
the replacement of our SCADA system, construction of a
new 12.5 million-gallon finished water storage reservoir at
Jordan Valley Water Treatment Plant, and implementation
of an advanced metering infrastructure (AMI) for our retail
customers. In addition, we implemented a special water
conservation intiative called Localscapes and worked on
many other operation and maintenance projects.
09
Opposite page: 78-inch finished water connection from new 12.5 MG reservoir at JVWTP. Photo by David McLean.
Above: Pouring a new reservoir outflow channel for the same new 12.5 MG reservoir. This additional stored finished water will buffer fluctuating demand, reduce disinfection by-products, and provide about three hours of emergency storage. Photo by Tweet Johnson.
Cap
ital
Pro
ject
Bud
get
(m
illio
ns)
Po
pul
atio
n (m
illio
ns)
capital projects v POPULATION
capital projectsand populationAfter water conservation efforts, capital projects are the
cornerstone of serving our current and growing population.
Not only are capital projects how we repair and replace
aging infrastructure, they are also how we pave the way
for the future. They include big-ticket items such as canal
enclosures, pipeline relocations, new water development,
and expansion of treatment plants or other existing
infrastructure.
Below is a graph that shows anticipated population growth
climbing over our projected expenditures in capital projects.
Careful planning is the only way we can stay ahead of the
needs of coming generations.
Capital Projects and Population Growth

delivering qualityevery dayWith a planning horizon of 50 years, delivering
our quality water takes dedication and tenacity.
Our sources of drinking water have to come
from farther and farther away, meaning our
capital projects take more planning and effort
than ever.
Our capital projects are just one example of
how we serve our member agencies and take
care of business: planning ahead to build for
now and into the future.
SCADA System Replacement SCADA, or Supervisory Control and Data Acquisition, is
how Jordan Valley Water monitors and controls its water
delivery system. This has been a major project over the
past few years and will improve our ability to monitor our
system and increase accuracy of our data.
12.5-MG Storage reservoir Jordan Valley Water Treatment Plant is the largest
treatment plant in Utah, and serves water to a million
people. This additional reservoir is being built to buffer
the fluctuating demand for finished water, provide
end-of-process contact time to reduce disinfection by-
products, and provide about three hours of additional
emergency storage.
advanced metering infrastructure AMI is the latest technology in measuring water use that
provides water use data in near real time. Homeowners
will receive new, enhanced bills, and be able to use an
online “portal” to see exactly when they used the most
water, adjust accordingly, and become more informed
and conscientious consumers. Semi-annual reporting
will remind them how they used water for the year and
reinforce water-efficiency messaging.10

Installing a 72-inch butterfly isolation valve on reach 2 of the Southwest Aqueduct. This interconnect vault for the Jordan Aqueduct and Southwest Aqueduct is part of the 12.5 MG reservoir project at
Jordan Valley Water Treatment Plant.Photo by Steve Blake

DeliveriesMunicipal & Industrial (M&I) Water Deliveries 2016
(AF)
2015
(AF)
City of Bluffdale 2,496 2,135
Copperton Improvement District 0 3
Draper City 3,963 3,686
Granger-Hunter Improvement District 19,517 18,960
Herriman City 3,303 2,736
Hexcel Corporation 679 677
Kearns Improvement District 8,425 7,568
Magna Water District 823 807
Midvale City 131 182
Riverton City 4,812 3,168
City of South Jordan 15,089 14,003
City of South Salt Lake 747 1,320
Taylorsville-Bennion Improvement District 4,700 4,700
Utah Department of Corrections 555 550
WaterPro, Inc. (treated)WaterPro, Inc. (raw)
1,05985
990422
City of West Jordan 20,329 19,505
White City Water Improvement District 0 0
Willow Creek Country Club 352 288
Subtotal for member agency deliveries 87,065 81,700
JVWCD retail service areas (Holladay, Murray, Sandy, South Salt Lake and unincorporated county) 8,721 8,201
JVWCD system non-revenue water (use & loss) 1,634 3,114
Subtotal for deliveries, use and loss 97,420 93,015
Irrigation and raw water 2016 2015
Utah Dept. of Public Safety 14 7
Welby Jacob Water Users Co.a 25,079 29,715
Subtotal for irrigation & raw water 25,093 29,722
Total delivered water 122,513 122,737
M&I Water treated or transported for other agencies 2016 2015
Metropolitan Water District of SL & Sandy 9,287 9,360
Subtotal for treated or transported water 9,287 9,360
Total water delivered, treated or transported 131,800 132,097
a) Sources from Utah Lake, Provo River, Weber River and Duchesne River, used to accomplish the water sources exchange agreement known as the Welby Jacob Exchange.
12

We work hard for water so you don’t have to
13
Municipal & Industrial Water Sources 2016 (AF) 2015 (AF)
Jordanelle Reservoir (Central Utah Project)a 39,058 45,309
Deer Creek Reservoir (Provo River Project)b 6,349 12,216
Upper Provo River reservoirsc 3,457 0
Echo Reservoir 3,311 3,371
Provo River (unstored flows) 20,755 14,752
Weber River (unstored flows) 0 839
Central Water Project 7,443 1,670
Salt Lake County mountain streams 2,229 1,981
Salt Lake County groundwater (wells) 13,302 5,951
Southwest Groundwater Treatment Plant 1,472 3,443
Bingham Canyon Water Treatment Plantd 44 3,483
Subtotal for Municipal & Industrial sources 97,420 93,015
Irrigation Water Sources
Jordanelle Reservoir (Central Utah Project)a 0 0
Deer Creek Reservoir (Provo River Project)b 0 0
Upper Provo River reservoirsc 0 0
Echo Reservoir 0 0
Provo River (unstored flows) 5,340 4,005
Weber River (unstored flows) 0 0
Utah Lake 19,753 25,717
Subtotal for irrigation sources 25,093 29,722
TOTAL ALL SOURCES 122,513 122,737Total water treated or transported for other agencies 9,287 9,360
Total all water sources & transport 131,800 132,097
a) Provo River sources c) Stored in Jordanelle Reservoir
b) Weber, Duchesne, and Provo River sources d) Treats southwest Salt Lake County groundwater
Sources
Photos, previous page, top to bottom:
Cleaning up after a mainline break includes spraying down the roadway where repairs were made. Photo by Frank Smith.
Meter key lids in black and white. Photo by Chad Steadman.
Maintenance staff keeps our well houses in pristine condition. Photo by Steve Schmidt.
Photo, left: Middle Fork stream above Wasatch Blvd. Photo by Heidi Nilsson.

The 66-inch Jordan Aqueduct at 5400 South Bangerter Highway was recently relocated to accommodate a highway overpass. Photo by Danny Ernest.14

Repair & replacementAging infrastructure is one topic every water agency knows something about. Some of the working
infrastructure in this valley was installed when the pioneers arrived, but most of it falls into the 50 years
or younger category.
With estimates for statewide repairs as high as $18 billion by 2060, water agencies and the state will
need to work together to ensure infrastructure stays viable and able to deliver our quality product.
Repair and replacement projects in 2016 included the following:
• Main Street and West Temple pipeline replacements
• Jordan Valley Water Treatment Plant high-rise building roof replacement
• Reservoir painting and repairs
• Well pump station chemical feed system replacements
A significant maintenance project in 2016 was the relocation of a section of the 66-inch Jordan
Aqueduct to accommodate a new overpass on Bangerter Highway.
Photos: Installing a 12-inch meter and strainer at Willow Creek. Photo by Calin Perry.Val Cossey and Andy Adams repair a meter leak through a juniper hedge. Photo by Ron Kidd.
15

Debt Service Coverage Ratio
Long-term Debt to Equity
Balance Sheet Summary as of June 30th:
2016 2015 2014 2013 2012
Assets: Current Restricted Capital Other
$44,819,06615,032,770
448,122,21416,903,556
$51,431,10928,903,249
424,407,00316,295,945
$47,651,91819,310,145
394,264,18217,783,520
$44,892,16724,451,273
394,514,90519,932,077
$37,538,62135,305,544388,976,18723,997,605
Total Assets $524,877,606 $521,037,306 $479,009,765 $483,790,422 $485,817,957
Liabilities: Current Long-term
$14,175,112249,625,637
$16,718,015257,251,372
$11,676,949221,024,301
$14,322,006228,223,829
$16,020,505235,669,859
Total Liabilities 263,800,749 273,969,387 232,701,250 242,545,835 251,690,364
Total Fund Net Assets 261,076,857 247,067,919 246,308,515 241,244,587 234,127,593
Total Liabilities & Fund Net Assets $524,877,606 $521,037,306 $479,009,765 $483,790,422 $485,817,957
Income Statement Summary for fiscal years ended June 30th:
2016 2015 2014 2013 2012
Revenues: Operating (water sales) Property taxes Interest Intergovernmental Non-operating
$47,830,26914,915,457
370,002584,285
72,265
$40,674,45513,831,898
564,33188,996137,774
$42,081,69013,622,517
562,29226,1416,761
$40,702,66413,607,576
666,589531,870174,690
$40,097,41813,327,419
590,5491,929,610
25,281
Total Revenues 63,772,278 55,297,454 56,299,401 55,683,389 55,970,277
Expenses: Operating Interest
45,332,2497,787,165
42,378,3948,346,776
42,789,0616,956,471
40,570,4326,498,385
38,750,1886,468,018
Total Expenses 53,119,414 50,725,170 49,745,532 47,068,817 45,218,206
Approximate Contribution to Capital Expensesa $10,652,864 $4,572,284 $6,553,869 $8,614,572 $10,752,071
Other Cash Flow Information for fiscal years ended June 30th:
2016 2015 2014 2013 2012
Capital Improvements $31,801,417 $35,310,360 $8,878,526 $14,702,913 $43,378,111
Debt Service Payments $15,291,092 $15,621,788 $15,982,634 $15,659,633 $13,444,220
a) Also includes capital projects fund, development fee fund, general equipment needs, emergency reserves, and self-insurance fund.
Taken from the audited financial statements.
Financial Stewardship
Net
Rev
enue
s ÷
Ag
gre
gat
e D
ebt
Svc
LT D
ebt
÷ To
tal F
und
Net
Ass
ets
0.0
0.5
1.0
1.5
2.0
2.5
2016201520142013201220112010200920082007
0.0
0.5
1.0
1.5
2.0
2.5
2016201520142013201220112010200920082007
16

Balance Sheet Summary as of June 30th:
2016 2015 2014 2013 2012
Assets: Current Restricted Capital Other
$44,819,06615,032,770
448,122,21416,903,556
$51,431,10928,903,249
424,407,00316,295,945
$47,651,91819,310,145
394,264,18217,783,520
$44,892,16724,451,273
394,514,90519,932,077
$37,538,62135,305,544388,976,18723,997,605
Total Assets $524,877,606 $521,037,306 $479,009,765 $483,790,422 $485,817,957
Liabilities: Current Long-term
$14,175,112249,625,637
$16,718,015257,251,372
$11,676,949221,024,301
$14,322,006228,223,829
$16,020,505235,669,859
Total Liabilities 263,800,749 273,969,387 232,701,250 242,545,835 251,690,364
Total Fund Net Assets 261,076,857 247,067,919 246,308,515 241,244,587 234,127,593
Total Liabilities & Fund Net Assets $524,877,606 $521,037,306 $479,009,765 $483,790,422 $485,817,957
Income Statement Summary for fiscal years ended June 30th:
2016 2015 2014 2013 2012
Revenues: Operating (water sales) Property taxes Interest Intergovernmental Non-operating
$47,830,26914,915,457
370,002584,285
72,265
$40,674,45513,831,898
564,33188,996137,774
$42,081,69013,622,517
562,29226,1416,761
$40,702,66413,607,576
666,589531,870174,690
$40,097,41813,327,419
590,5491,929,610
25,281
Total Revenues 63,772,278 55,297,454 56,299,401 55,683,389 55,970,277
Expenses: Operating Interest
45,332,2497,787,165
42,378,3948,346,776
42,789,0616,956,471
40,570,4326,498,385
38,750,1886,468,018
Total Expenses 53,119,414 50,725,170 49,745,532 47,068,817 45,218,206
Approximate Contribution to Capital Expensesa $10,652,864 $4,572,284 $6,553,869 $8,614,572 $10,752,071
Other Cash Flow Information for fiscal years ended June 30th:
2016 2015 2014 2013 2012
Capital Improvements $31,801,417 $35,310,360 $8,878,526 $14,702,913 $43,378,111
Debt Service Payments $15,291,092 $15,621,788 $15,982,634 $15,659,633 $13,444,220
a) Also includes capital projects fund, development fee fund, general equipment needs, emergency reserves, and self-insurance fund.
Taken from the audited financial statements.
Inspecting Jordan Aqueduct Reach 3. Photo by Gordon Batt.
17

His
tori
cal W
ater
Del
iver
ies
(Tho
usan
d A
cre-
Fee
t)
Historical & projected JVWCD Water Deliveries
0
50
100
150
200
206020502040203020202010200019901980197019601950
water deliveries and population
18
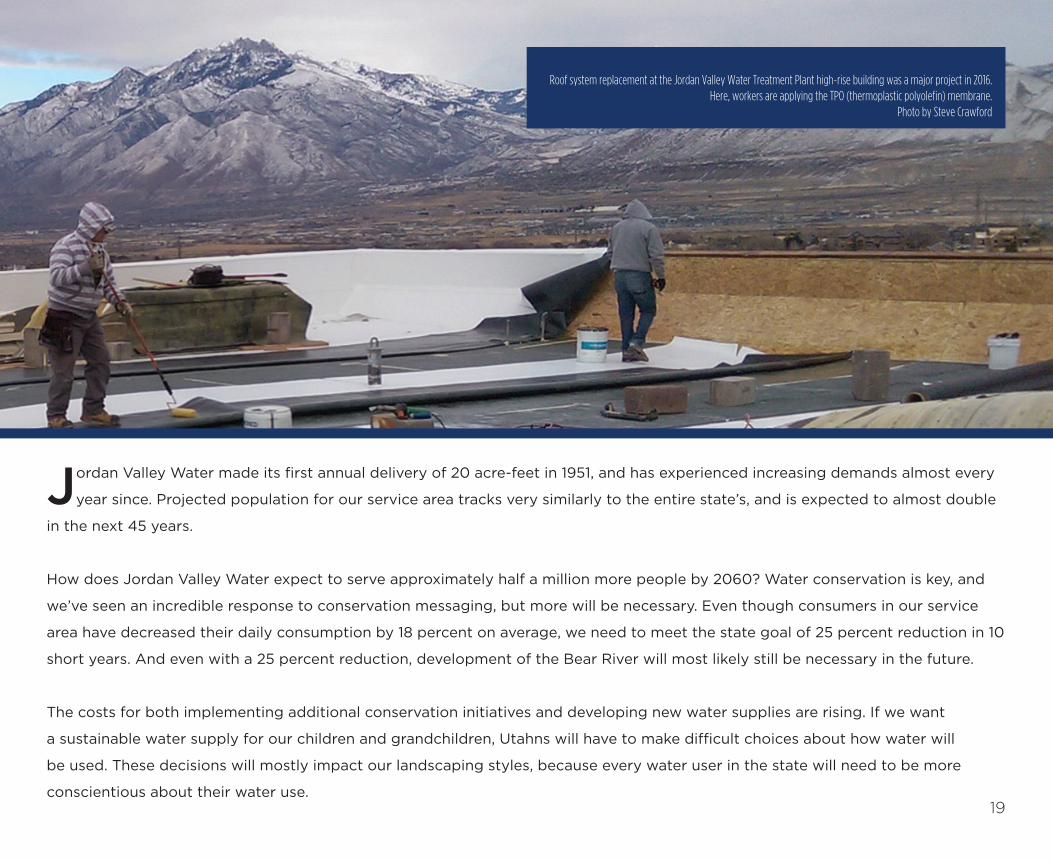
Jordan Valley Water made its first annual delivery of 20 acre-feet in 1951, and has experienced increasing demands almost every
year since. Projected population for our service area tracks very similarly to the entire state’s, and is expected to almost double
in the next 45 years.
How does Jordan Valley Water expect to serve approximately half a million more people by 2060? Water conservation is key, and
we’ve seen an incredible response to conservation messaging, but more will be necessary. Even though consumers in our service
area have decreased their daily consumption by 18 percent on average, we need to meet the state goal of 25 percent reduction in 10
short years. And even with a 25 percent reduction, development of the Bear River will most likely still be necessary in the future.
The costs for both implementing additional conservation initiatives and developing new water supplies are rising. If we want
a sustainable water supply for our children and grandchildren, Utahns will have to make difficult choices about how water will
be used. These decisions will mostly impact our landscaping styles, because every water user in the state will need to be more
conscientious about their water use.
Roof system replacement at the Jordan Valley Water Treatment Plant high-rise building was a major project in 2016. Here, workers are applying the TPO (thermoplastic polyolefin) membrane.
Photo by Steve Crawford
19
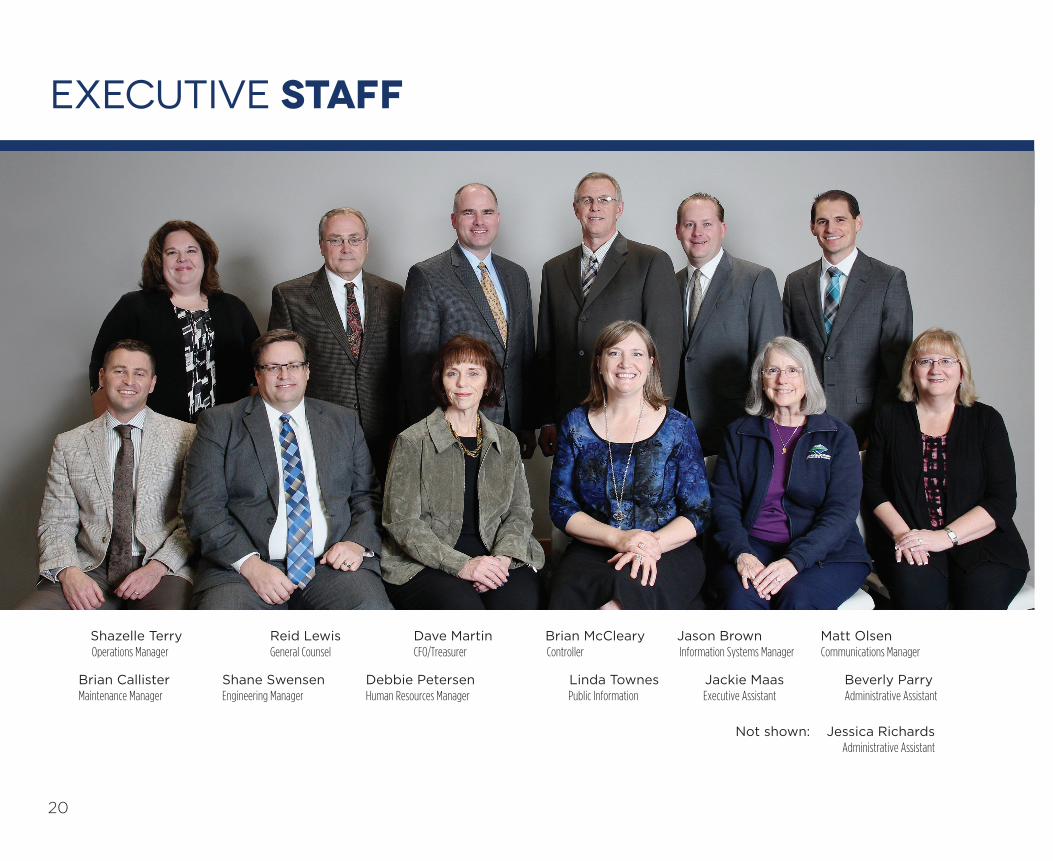
Shazelle Terry Reid Lewis Dave Martin Brian McCleary Jason Brown Matt Olsen Operations Manager General Counsel CFO/Treasurer Controller Information Systems Manager Communications Manager
Brian Callister Shane Swensen Debbie Petersen Linda Townes Jackie Maas Beverly ParryMaintenance Manager Engineering Manager Human Resources Manager Public Information Executive Assistant Administrative Assistant
20
Executive Staff
Not shown: Jessica Richards Administrative Assistant
Adrian ParraAlan Thackeray
Alex MitchellAllen Curtis
Amanda StrackAndy AdamsAnn Mecham
Blake MousleyBlake Woolsey
Brad BorenBrad MabeyBrad Perez
Brady YoungBryan Smith
Calin PerryCary Shaw
Casey CannonCasey Mascaro
Chad SteadmanClifton Smith
Clint ThurgoodCory Collins
Courtney BrownCraig FahrniCynthia Bee
Dan ClaypoolDanny ErnestDanny WhiteDave Beratto
Dave HydeDave Mecham
Dave SpackmanDavid Garcia
David McLeanDebbie Gates
Denise GoodwinDon Olsen
Duff TurnerDustin Brusch
Eddie OjedaEduardo Cracchiolo
Ellen BolligerEllisa DemetskyEmilie Bashore
Eppie TrujilloEric Poulsen
Frank MontoyaFrank Roberts
Frank SmithGlen McIntyre
Gordon BattGreg MarkHak Tatafu
Hayley BettonHeidi NilssonJackie Buhler
Jared BraceJared Vigil
Jason NewrenJay Frandsen
Jeanette PerryJeff BettonJeff Bryant
Jeff KingJeff Small
Jim Bogenschutz
Jon HilbertJosh Ashcroft
Josh ShrewsburyJoshua McDougall
JT CracroftJustin Spainhower
Karen KarrikerKen Butterfield
Kevin CraneKevin Rubow
Kirk OmanKody Evans
Kolby ParmanKyle Kennedy
Leonard MascherLisa Kasteler
Lorena PurissimoLorrie Cowles
Marcelo AngladeMarcelo Del Rio
Margaret Dea
Martin FeilMatt HinckleyMegan Hatch
Mike AxelgardMike Gonzales
Mike LorencMike Rasmussen
Mindy ObertNathan Talbot
Nick McDonaldPaul MattinsonQuintin Rubio
Ray StokesRobert Squire
Ron BownRyan Forsyth
Savidtri ThanasilpScott Olsen
Sharon SmithShaun Moser
Shaun Proctor
Stan GrundySteve BeckSteve Blake
Steve CrawfordSteve Hansen
Steve MinchSteve Schmidt
Teresa AtkinsonTim Rainbolt
Todd PetersonTodd Schultz
Travis ChristensenTroy Tucker
Tweet JohnsonTwila Brantley
Uriel LuceroVal CosseyWade Tuft
Wayne Sims, II Yvette
Amparo-Espinoza
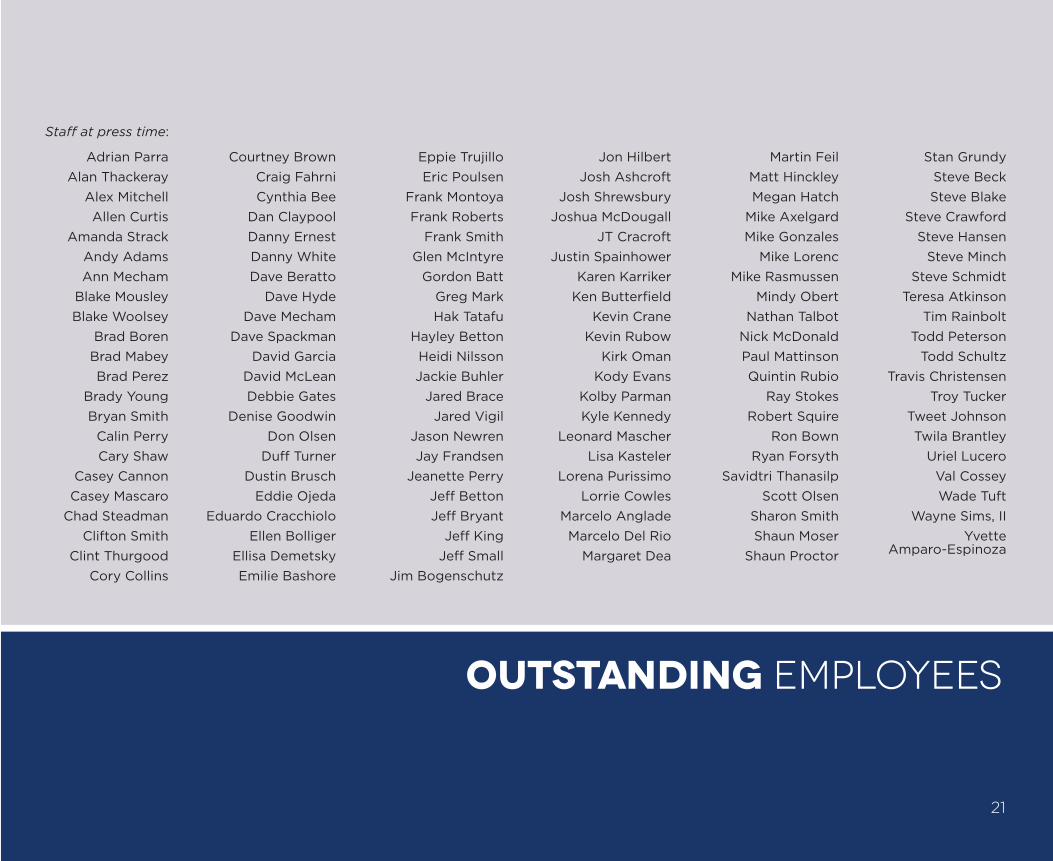
Staff at press time:
Outstanding Employees
21

Delivering Quality Every Day
Construction of 12.5 MG reservoir at JVWTP. Photo by Tweet Johnson.
www.jvwcd.org
8215 South 1300 WestWest Jordan, UT 84088