2016 Interim Report (pdf) - Avon Rubber Documents Library... · 3 . News Release. AVON RUBBER...
29
2016 Interim Report
Transcript of 2016 Interim Report (pdf) - Avon Rubber Documents Library... · 3 . News Release. AVON RUBBER...
2016
Inte
rim R
epor
t
CONTENTS
News Release............................................................................................................................................. 3
Interim Management Report .................................................................................................................... 6
Statement of Directors’ Responsibilities ................................................................................................. 12
Consolidated Statement of Comprehensive Income…………………………………………………………………….…….13
Consolidated Balance Sheet………………………………………………………………………………………………………….……15
Consolidated Cash Flow Statement……………………………………………………………………………………………….……16
Consolidated Statement of Changes in Equity………………………………………………………………………………….…17
Notes to the Interim Financial Statements ............................................................................................. 18
1. General information ........................................................................................................................ 18
2. Basis of preparation ........................................................................................................................ 18
3. Accounting policies .......................................................................................................................... 18
4. Segment information ...................................................................................................................... 20
5. Adjustments and discontinued operations ..................................................................................... 23
6. Finance income and costs ............................................................................................................... 24
7. Taxation ........................................................................................................................................... 24
8. Dividends ......................................................................................................................................... 25
9. Earnings per share ........................................................................................................................... 25
10. Provisions for liabilities and charges ............................................................................................. 25
11. Share capital .................................................................................................................................. 26
12. Cash generated from operations .................................................................................................. 26
13. Analysis of net debt ....................................................................................................................... 27
14. Exchange rates............................................................................................................................... 27
15. Acquisition ..................................................................................................................................... 28
16. Principal risks and uncertainties ……………………………………………………………………………………………….28
3
News Release
AVON RUBBER p.l.c.
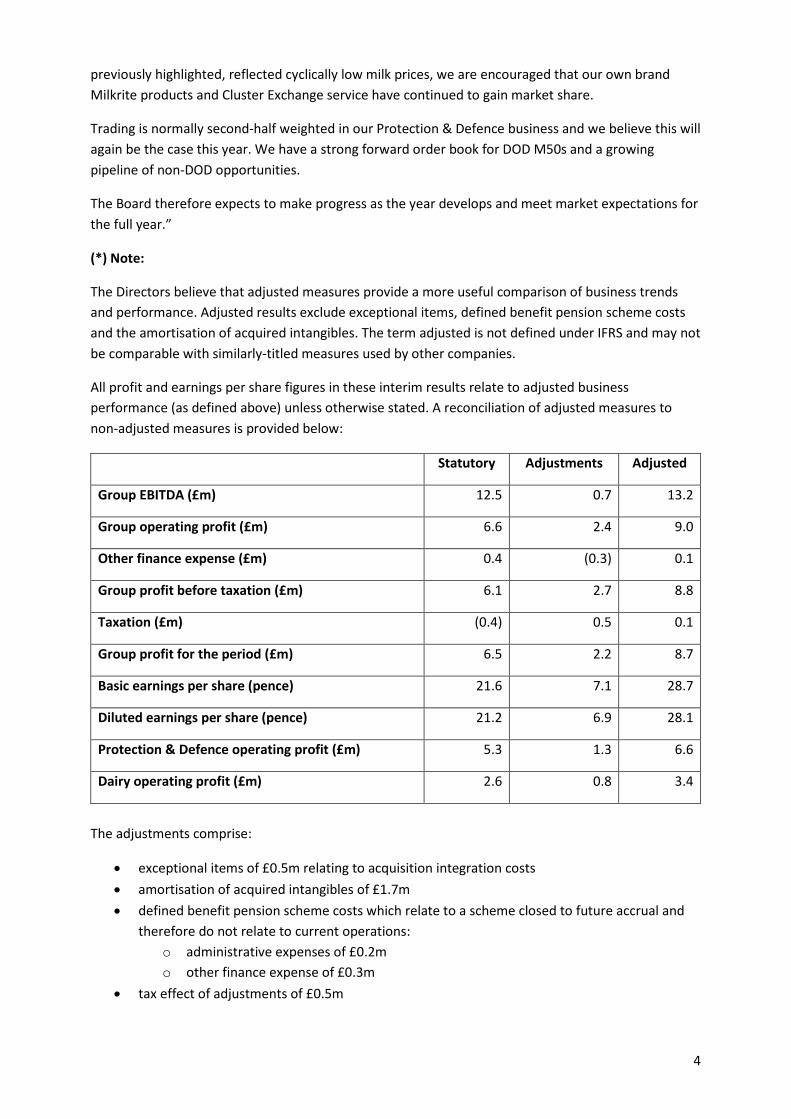
(“Avon”, the “Group” or the “Company”) Unaudited interim results for the six months ended 31 March 2016
31 March 2016 31 March 2015 Increase
£Millions £Millions
REVENUE 66.3 62.8 5%
ADJUSTED EBITDA (*) 13.2 12.2 9%
ADJUSTED OPERATING PROFIT (*) 9.0 8.5 6%
ADJUSTED PROFIT BEFORE TAX (*) 8.8 8.4 5%
NET (DEBT)/CASH (8.4) 7.3
EARNINGS PER SHARE:
Adjusted basic (*) 28.7p 22.3p 29%
Adjusted diluted (*) 28.1p 21.7p 29%
INTERIM DIVIDEND 3.16p 2.43p 30%
FINANCIAL HIGHLIGHTS • Operating profit growth of 6% • Diluted earnings per share increased 29% • Return on sales (EBITDA divided by revenue) improved 0.5% from 19.4% to 19.9% • Continuing healthy conversion of operating profit to operating cash at 163% • Net debt reduced by £4.8m during H1 to £8.4m, after the £3.5m cash acquisition of Argus • Dividend of 3.16p per share up 30%
OPERATIONAL HIGHLIGHTS • Acquisition of Argus in October 2015 broadened Protection & Defence product range • Successful integration of InterPuls and Argus into the organisation • Delivered 107,000 M50 mask systems under our long-term sole source DOD contract • Military order pipeline healthy, timing of receipt remains difficult to predict • Milkrite brand continues to grow in cyclically softer dairy market conditions • Cluster Exchange now servicing 446,000 cows on 1,411 farms Rob Rennie, Chief Executive commented:
“Avon has enjoyed another positive half year, successfully integrating our recent acquisitions which broaden our product range and routes to market. In Dairy, whilst market conditions have, as
4
previously highlighted, reflected cyclically low milk prices, we are encouraged that our own brand Milkrite products and Cluster Exchange service have continued to gain market share.
Trading is normally second-half weighted in our Protection & Defence business and we believe this will again be the case this year. We have a strong forward order book for DOD M50s and a growing pipeline of non-DOD opportunities.
The Board therefore expects to make progress as the year develops and meet market expectations for the full year.”
(*) Note:
The Directors believe that adjusted measures provide a more useful comparison of business trends and performance. Adjusted results exclude exceptional items, defined benefit pension scheme costs and the amortisation of acquired intangibles. The term adjusted is not defined under IFRS and may not be comparable with similarly-titled measures used by other companies.
All profit and earnings per share figures in these interim results relate to adjusted business performance (as defined above) unless otherwise stated. A reconciliation of adjusted measures to non-adjusted measures is provided below:
Statutory Adjustments Adjusted
Group EBITDA (£m) 12.5 0.7 13.2
Group operating profit (£m) 6.6 2.4 9.0
Other finance expense (£m) 0.4 (0.3) 0.1
Group profit before taxation (£m) 6.1 2.7 8.8
Taxation (£m) (0.4) 0.5 0.1
Group profit for the period (£m) 6.5 2.2 8.7
Basic earnings per share (pence) 21.6 7.1 28.7
Diluted earnings per share (pence) 21.2 6.9 28.1
Protection & Defence operating profit (£m) 5.3 1.3 6.6
Dairy operating profit (£m) 2.6 0.8 3.4
The adjustments comprise:
• exceptional items of £0.5m relating to acquisition integration costs • amortisation of acquired intangibles of £1.7m • defined benefit pension scheme costs which relate to a scheme closed to future accrual and
therefore do not relate to current operations: o administrative expenses of £0.2m o other finance expense of £0.3m
• tax effect of adjustments of £0.5m
5
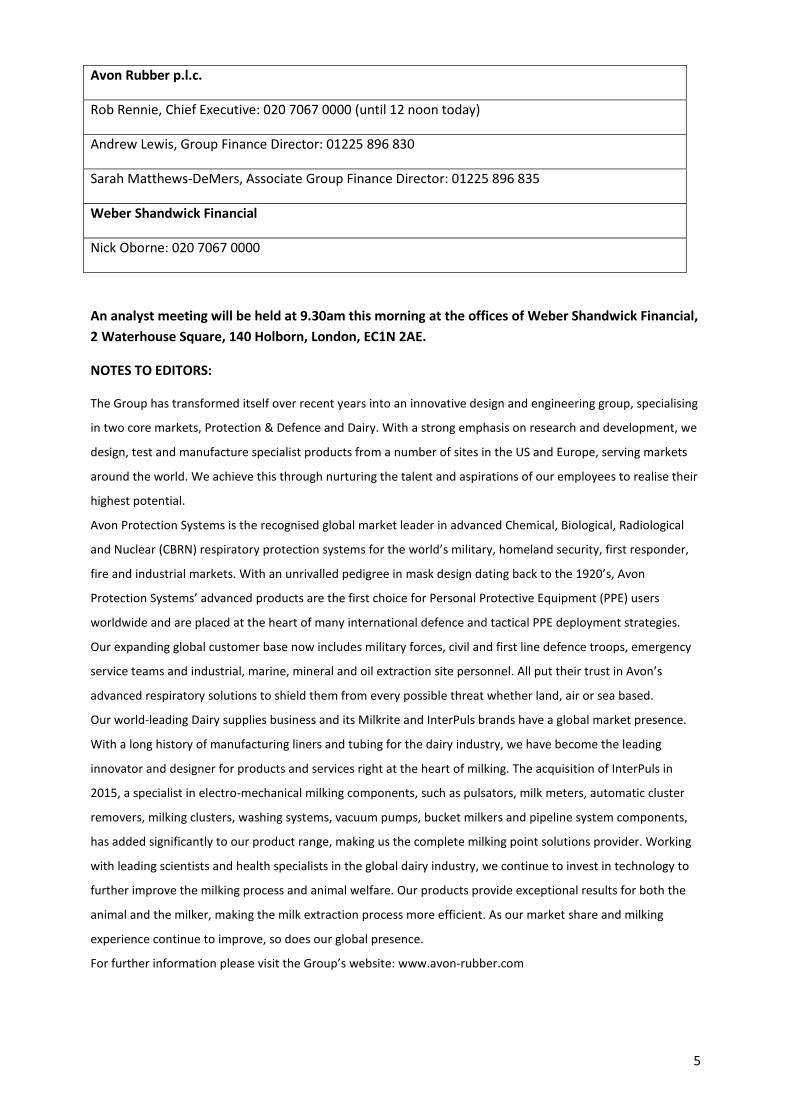
Avon Rubber p.l.c.
Rob Rennie, Chief Executive: 020 7067 0000 (until 12 noon today)
Andrew Lewis, Group Finance Director: 01225 896 830
Sarah Matthews-DeMers, Associate Group Finance Director: 01225 896 835
Weber Shandwick Financial
Nick Oborne: 020 7067 0000
An analyst meeting will be held at 9.30am this morning at the offices of Weber Shandwick Financial, 2 Waterhouse Square, 140 Holborn, London, EC1N 2AE.
NOTES TO EDITORS:
The Group has transformed itself over recent years into an innovative design and engineering group, specialising
in two core markets, Protection & Defence and Dairy. With a strong emphasis on research and development, we
design, test and manufacture specialist products from a number of sites in the US and Europe, serving markets
around the world. We achieve this through nurturing the talent and aspirations of our employees to realise their
highest potential.
Avon Protection Systems is the recognised global market leader in advanced Chemical, Biological, Radiological
and Nuclear (CBRN) respiratory protection systems for the world’s military, homeland security, first responder,
fire and industrial markets. With an unrivalled pedigree in mask design dating back to the 1920’s, Avon
Protection Systems’ advanced products are the first choice for Personal Protective Equipment (PPE) users
worldwide and are placed at the heart of many international defence and tactical PPE deployment strategies.
Our expanding global customer base now includes military forces, civil and first line defence troops, emergency
service teams and industrial, marine, mineral and oil extraction site personnel. All put their trust in Avon’s
advanced respiratory solutions to shield them from every possible threat whether land, air or sea based.
Our world-leading Dairy supplies business and its Milkrite and InterPuls brands have a global market presence.
With a long history of manufacturing liners and tubing for the dairy industry, we have become the leading
innovator and designer for products and services right at the heart of milking. The acquisition of InterPuls in
2015, a specialist in electro-mechanical milking components, such as pulsators, milk meters, automatic cluster
removers, milking clusters, washing systems, vacuum pumps, bucket milkers and pipeline system components,
has added significantly to our product range, making us the complete milking point solutions provider. Working
with leading scientists and health specialists in the global dairy industry, we continue to invest in technology to
further improve the milking process and animal welfare. Our products provide exceptional results for both the
animal and the milker, making the milk extraction process more efficient. As our market share and milking
experience continue to improve, so does our global presence.
For further information please visit the Group’s website: www.avon-rubber.com
6
Interim Management Report
Introduction Avon has enjoyed another positive half year, successfully integrating our recent acquisitions which broaden our product range and routes to market.
In Protection & Defence revenues for the half year were, as planned, weighted towards US Department of Defense (DOD) sales under our ten year sole source contract against which we received an additional order for 167,000 M50s, giving us a strong forward order book for DOD mask systems. We also have a growing pipeline of higher margin non-DOD opportunities in the Americas and the Middle East for which the timing of order receipt remains unpredictable, although we believe the time horizon for some of these opportunities is shortening.
In Dairy, whilst market conditions have, as previously highlighted, reflected cyclically low milk prices, we are encouraged that our own brand Milkrite products and Cluster Exchange service have continued to gain market share. Group Results Group revenue at £66.3m (2015: £62.8m) increased by 5% and operating profit of £9.0m (2015: £8.5m) increased by 6%. Earnings before interest, tax, depreciation and amortisation (‘EBITDA’) increased by 9% to £13.2m (2015: £12.2m) representing a return on sales (defined as EBITDA divided by revenue) of 19.9% (2015: 19.4%).
The impact of foreign exchange translation was a slight tailwind of £0.4m as the $/£ average rate of $1.46 was lower than the $1.54 prevailing in the same period last year. This translation benefit has, for the most part, been offset by transactional losses, where Euro and US dollar transactions, covered by forward contracts at rates higher than the period rate, have given rise to mark to market foreign exchange losses of £0.3m at the period end.
If the currently stronger US dollar were to prevail throughout the remainder of the financial year, it would create further translation tailwinds for the full year. Our sensitivity analysis on the full year 2015 results showed that a 5c movement in the $/£ exchange rate would result in a £0.7m impact on annual operating profit.
Profit before tax was £8.8m (2015: £8.4m) and after a tax charge of £0.1m (2015: £1.7m), an effective rate of 1% (2015: 20%), the Group recorded a profit for the period after tax of £8.7m (2015: £6.7m). The reduced tax rate reflects the anticipated geographic split of taxable profits for 2016, the finalisation of the 2015 tax returns and the positive outcome of certain tax enquiries. Basic earnings per share were up 29% at 28.7p (2015: 22.3p) and fully diluted earnings per share were up 29% at 28.1p (2015: 21.7p).
7
Net Debt and Cashflow Net debt at the half year was £8.4m, down from £13.2m at the 2015 year end and after the £3.5m cash payment to acquire Argus in October 2015. Operating cash conversion continues to be strong at 163% of operating profit. Turning profits into cash has enabled us to continue to invest in the future of the business with £3.8m of capital investment, while increasing dividends to shareholders by 30%. Our main bank facilities at 31 March 2016 totalled $40m. These facilities are committed until 30 November 2018. Protection & Defence Performance Revenue for the division was £45.7m (2015: £45.3m) and operating profit was £6.6m (2015: £6.4m). EBITDA was up 3% at £9.6m (2015: £9.4m) and return on sales, as defined above, was 21.1% (2015: 20.6%). The increase arose from the mix of product shipped, an improvement in DOD pricing and operational efficiencies. As we have always highlighted, while predicting the timing of non-DOD orders and sales is difficult, our long-term DOD contract and manufacturing excellence affords us the flexibility to fulfil non-DOD orders as and when they arise and to meet the DOD’s demand in periods when non-DOD orders are lower. Markets M50 respirator sales to the DOD were 107,000 (2015: 112,000) mask systems. During the period we received a further order for 167,000 mask systems which means we exit the half year with mask order coverage well into 2017, providing good visibility of revenue under this sole source long-term contract. We delivered 36,000 M61 filter pairs during the period (2015: nil) and have secured an order for a further 85,000 pairs which we expect to deliver in the second half. In the long term, we believe the end user demand for this consumable product will grow as fielding of the mask continues but we continue to recognise that, in the current DOD procurement environment, obtaining short-term visibility of future filter spares orders remains challenging. Sales to foreign military, law enforcement and first responder customers increased year on year as the underlying portfolio continues to grow. In addition, we have been encouraged by the level of international enquiries for our respiratory protection products and, although the timing of converting some of the larger opportunities has not been in the first half of the year, we believe that the conversion timeline for some of these opportunities is shortening.
8
We saw growth in sales to the Fire market following the acquisition of Argus and the launch of the new Mi-TIC Storm thermal imaging camera which has now received NFPA and CE approval. Other DOD spares sales were higher than the same period last year, reflecting normal variability in the timing of orders and delivery schedules. AEF has experienced a softer first half, reflecting the variability in timing of certain DOD procurement programmes for hovercraft skirt and fuel and water storage tanks. Order intake for the first half totalled £55m (2015: £47m). Of the closing order book of £30m, £22m is for delivery in the second half of our financial year, giving good visibility for the remainder of the year. Opportunities Our funded development programme with the US Air Force to design and test the MM53 Joint Service Aircrew Mask (JSAM) has progressed well. This will provide respiratory protection to a wide range of operators on the DOD’s fleet of fixed-wing aircraft. The testing phase of this development contract is expected to conclude at the end of our 2016 financial year and should lead to a production contract commencing in 2017 which could be worth in excess of $70m. A number of other military opportunities exist in relation to both new and existing products that provide long-term growth potential. Dairy Performance
Revenue for the Dairy business was 18% higher at £20.6m (2015: £17.5m) following the acquisition of InterPuls which offset softer market conditions caused by low milk prices. An increasing proportion of higher margin Milkrite product and service sales contributed to an increased operating profit of £3.4m (2015: £3.3m). EBITDA grew 17% to £4.5m (2015: £3.9m) and return on sales, as defined above, was flat at 22.0% (2015: 22.1%). Markets Market conditions for dairy farmers, particulary in Europe, have been weak as milk prices have been low. This typically cyclical market dynamic has, as expected, reduced demand for our consumable products as farmers extend the life through over using our products. The capital nature of the InterPuls products makes the replacement cycle longer, meaning
9
InterPuls is more affected by the cyclical market dynamics than Milkrite consumable products. Our existing dairy business has become substantially less dependent on original equipment manufacturers (OEMs) in recent years as we continue to grow sales of our own higher margin Milkrite branded products and services. In difficult market conditions we are encouraged that our Milkrite market share continues to increase, meaning that we will exit this cyclical downturn with a more robust business. In Europe, where Avon-manufactured liners have a 61% market share, Milkrite’s market share has increased to 23% due to growth in traditional Milkrite products and the success of our Impulse Air mouthpiece vented liner, first launched in Europe late in 2013. This product continues to gain traction, with its market share increasing to 4.0% (31 March 2015: 3.0%, 30 September 2015: 3.5%). In the US, where Avon-manufactured liners have a 63% market share, the Milkrite Impulse Air mouthpiece vented liner continued to perform well, with its market share increasing to 28% (31 March 2015: 22%, 30 September 2015: 25%). The take up by farms of our innovative Cluster Exchange Service, launched in 2014, remains at encouraging levels in both North America and Europe. By the end of the period it was servicing 446,000 cows on 1,411 farms in the US and Europe, up from 342,000 cows and 1,100 farms at the same time last year. This added-value service enhances the value of each direct liner sale we make and should lead to a more robust and sustainable business model, with the potential to grow a significant recurring revenue stream in the years to come, as more farms continue to sign up. We are pleased with the integration of InterPuls, acquired in August 2015, into the wider Dairy business and are on track to realise the long-term strategic benefits that have been identified, in particular the sales synergies available in the North American market. Opportunities Plans for the rollout of InterPuls products to the US are underway, with dealers being trained, samples being issued through our extensive distributor network and products launched at the recent World Agricultural Expo in Tulare, California, positioning the business to start delivering additional revenue in our 2017 financial year. In emerging markets, including China, Brazil and India, the number of dairy cows being milked using automated milking processes is growing rapidly. This is adding to the market potential for the products we sell. The sales and distribution operations we have opened in China and Brazil are progressing to plan as we build our dealer and distributor networks in these regions.
10
Taxation The statutory tax credit totalled £0.4m (2015: charge of £1.7m) on a statutory profit before tax of £6.1m (2015: £8.4m). The effective tax rate for the period reflects the charge arising from the anticipated geographic split of taxable profits for 2016, offset by credits in relation to the positive outcome of certain tax enquiries and the finalisation of the 2015 tax returns in which we were able to take the benefit of certain deductions allowed by legislation enacted after our 2015 financial statements were approved. Retirement Benefit Obligations The IAS 19 valuation of the Group’s UK retirement benefit obligations has moved from a deficit of £16.6m at 30 September 2015 to a deficit of £18.7m at 31 March 2016. This arose from a strong asset performance from our return-seeking assets, offset by a fall in AA corporate bond rates, which increased liabilities.
During the period the Group made cash contributions in respect of deficit recovery payments and administration costs of £325,000 (2015: £275,000).
The last actuarial triennial valuation undertaken as at 31 March 2013 showed the scheme to be 98.0% funded. Dividends The final dividend for the 2015 financial year of 4.86p per ordinary share was paid to shareholders on 18 March 2016 and absorbed £1,473,000 of shareholders’ funds. For the current financial year the Board has declared an interim dividend of 3.16p per ordinary share, an increase of 30% on the 2015 interim dividend. This will be paid on 5 September 2016 to shareholders on the register on 5 August 2016. It is expected to absorb £958,000 of shareholders’ funds and there are no corporation tax consequences.
11
Outlook The Board remains confident that the Group will continue to make progress as the year develops and maintain our record of strong cash generation. Trading is normally second-half weighted in our Protection & Defence business and we believe this will again be the case this year. We continue to see a number of higher margin export opportunities and while, as always, the timing of order receipt remains unpredictable, the DOD order we received late in the first half affords us production flexibility to fulfil these as and when they are received. In Dairy, despite weak market conditions, the acquisition of InterPuls and the encouraging gains in Milkrite market share provide us with significant opportunity at the point milk prices start to improve. This, together with the sales and distribution platforms we have established in China and Brazil to service these rapidly growing emerging markets, means we have a Dairy business with excellent short and longer term growth prospects.
Rob Rennie Chief Executive 4 May 2016
Andrew Lewis Group Finance Director 4 May 2016
12
Statement of Directors’ Responsibilities The Directors confirm that this condensed consolidated interim financial information has been prepared in accordance with International Accounting Standard 34, ‘Interim Financial Reporting’ as adopted by the European Union, and that the interim management report herein includes a fair review of the information required by DTR 4.2.7 and DTR 4.2.8, namely: • an indication of important events that have occurred during the first six months and their
impact on the condensed consolidated interim financial information, and a description of the principal risks and uncertainties for the remaining six months of the financial year; and
• material related party transactions in the first six months and any material changes in the
related party transactions described in the last annual report.
The Directors are as listed on page 43 of the 2015 Annual Report, except that Richard Wood retired from the Board on 26 January 2016, Rob Rennie was appointed on 1 December 2015 and Chloe Ponsonby was appointed on 1 March 2016. Forward‐looking statements Certain statements in this half year report are forward-looking. Although the Group believes that the expectations reflected in these forward-looking statements are reasonable, we can give no assurance that these expectations will prove to have been correct. Because these statements involve risks and uncertainties, actual results may differ materially from those expressed or implied by these forward-looking statements. We undertake no obligation to update any forward-looking statements whether as a result of new information, future events or otherwise. Company website The interim statement is available on the Company’s website at www.avon-rubber.com. The maintenance and integrity of the website is the responsibility of the Directors. Legislation in the United Kingdom governing the preparation and dissemination of financial statements may differ from legislation in other jurisdictions.
Miles Ingrey-Counter Company Secretary 4 May 2016
13
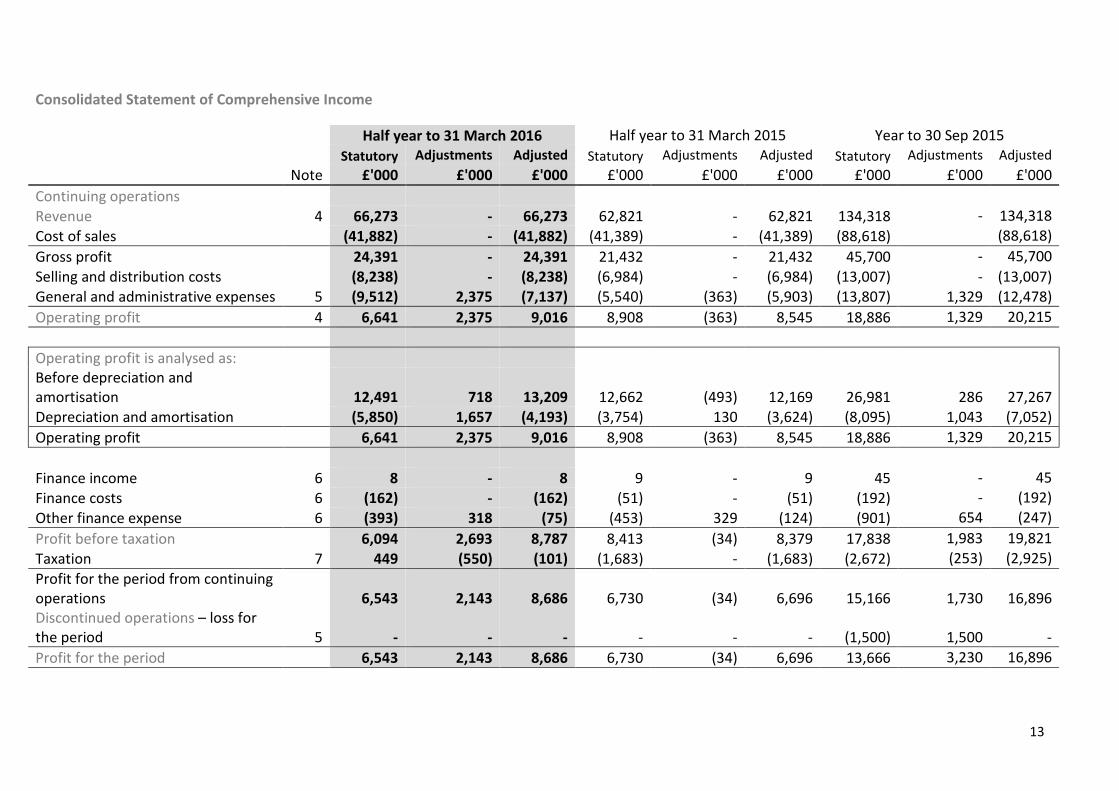
Consolidated Statement of Comprehensive Income
Half year to 31 March 2016 Half year to 31 March 2015 Year to 30 Sep 2015
Statutory Adjustments Adjusted Statutory Adjustments Adjusted Statutory Adjustments Adjusted
Note £'000 £'000 £'000 £'000 £'000 £'000 £'000 £'000 £'000 Continuing operations
Revenue 4 66,273 - 66,273 62,821 - 62,821 134,318 - 134,318 Cost of sales (41,882) - (41,882) (41,389) - (41,389) (88,618) (88,618) Gross profit
24,391 - 24,391 21,432 - 21,432 45,700 - 45,700
Selling and distribution costs
(8,238) - (8,238) (6,984) - (6,984) (13,007) - (13,007) General and administrative expenses 5 (9,512) 2,375 (7,137) (5,540) (363) (5,903) (13,807) 1,329 (12,478) Operating profit 4 6,641 2,375 9,016 8,908 (363) 8,545 18,886 1,329 20,215
Operating profit is analysed as: Before depreciation and amortisation
12,491 718 13,209 12,662 (493) 12,169 26,981 286 27,267
Depreciation and amortisation
(5,850) 1,657 (4,193) (3,754) 130 (3,624) (8,095) 1,043 (7,052) Operating profit 6,641 2,375 9,016 8,908 (363) 8,545 18,886 1,329 20,215
Finance income 6 8 - 8 9 - 9 45 - 45 Finance costs 6 (162) - (162) (51) - (51) (192) - (192) Other finance expense 6 (393) 318 (75) (453) 329 (124) (901) 654 (247) Profit before taxation
6,094 2,693 8,787 8,413 (34) 8,379 17,838 1,983 19,821
Taxation 7 449 (550) (101) (1,683) - (1,683) (2,672) (253) (2,925) Profit for the period from continuing operations Discontinued operations – loss for the period
5
6,543
-
2,143
-
8,686
-
6,730
-
(34)
-
6,696
-
15,166
(1,500)
1,730
1,500
16,896
-
Profit for the period 6,543 2,143 8,686 6,730 (34) 6,696 13,666 3,230 16,896
14
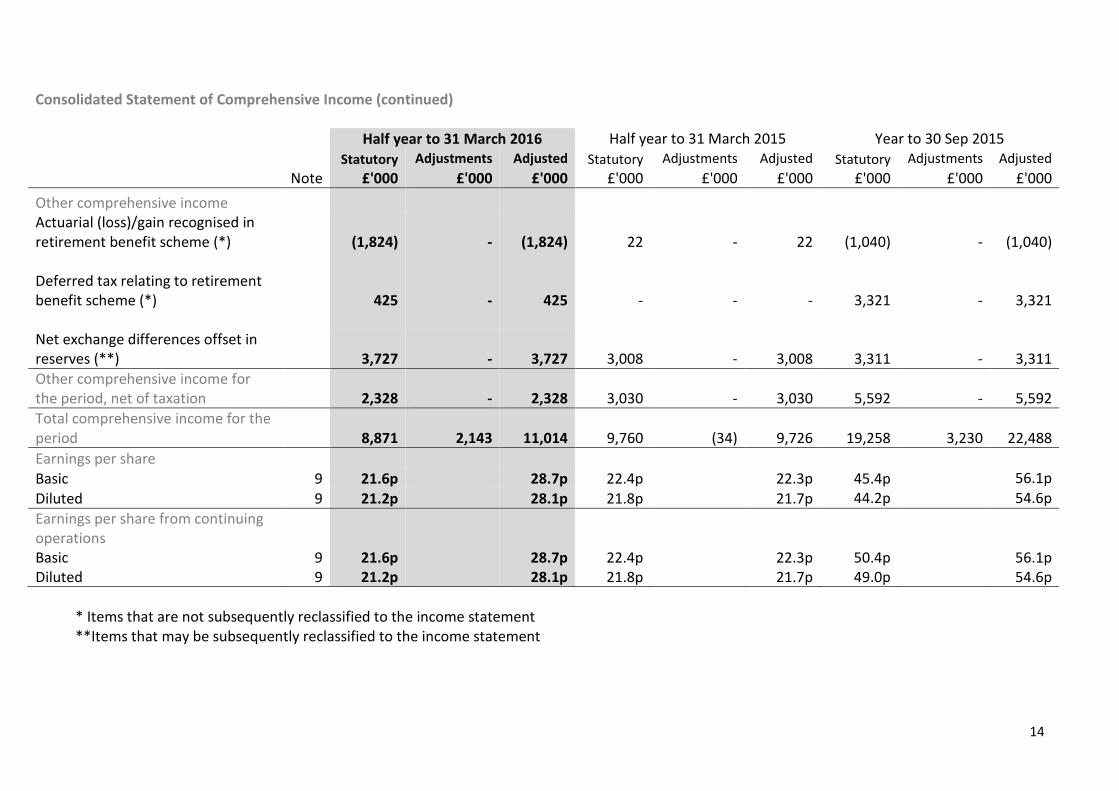
Consolidated Statement of Comprehensive Income (continued)
Half year to 31 March 2016 Half year to 31 March 2015 Year to 30 Sep 2015 Statutory Adjustments Adjusted Statutory Adjustments Adjusted Statutory Adjustments Adjusted Note £'000 £'000 £'000 £'000 £'000 £'000 £'000 £'000 £'000 Other comprehensive income
22
-
3,008
22
-
3,008
(1,040)
3,321
3,311
-
-
-
(1,040)
3,321
3,311
Actuarial (loss)/gain recognised in retirement benefit scheme (*) Deferred tax relating to retirement benefit scheme (*)
(1,824)
425
-
-
(1,824)
425
-
-
Net exchange differences offset in reserves (**)
3,727 - 3,727
-
Other comprehensive income for the period, net of taxation 2,328
- 2,328 3,030
- 3,030 5,592 - 5,592
Total comprehensive income for the period 8,871
2,143 11,014 9,760
(34) 9,726 19,258 3,230 22,488
Earnings per share
Basic 9 21.6p 28.7p 22.4p 22.3p 45.4p 56.1p Diluted 9 21.2p 28.1p 21.8p 21.7p 44.2p 54.6p Earnings per share from continuing operations Basic Diluted
9 9
21.6p 21.2p
28.7p 28.1p
22.4p 21.8p
22.3p 21.7p
50.4p 49.0p
56.1p 54.6p
* Items that are not subsequently reclassified to the income statement **Items that may be subsequently reclassified to the income statement
15
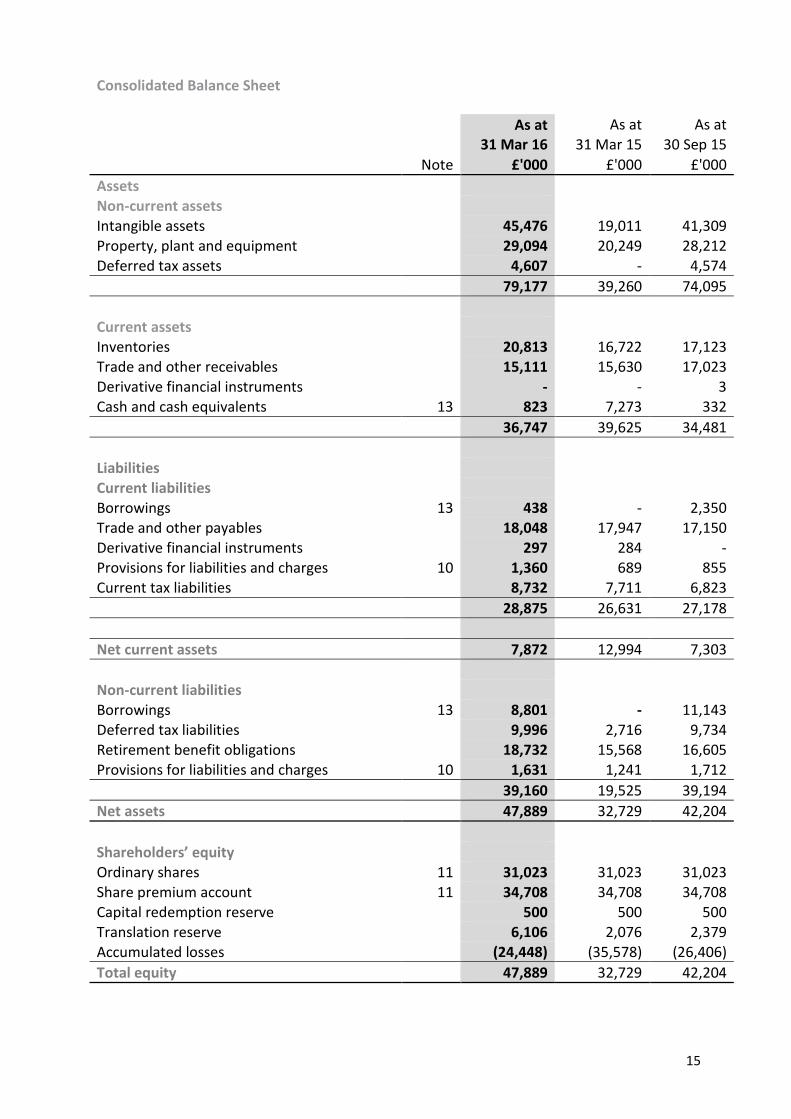
Consolidated Balance Sheet
As at As at As at
31 Mar 16 31 Mar 15 30 Sep 15 Note £'000 £'000 £'000 Assets
Non-current assets
Intangible assets
45,476 19,011 41,309
Property, plant and equipment
29,094 20,249 28,212 Deferred tax assets 4,607 - 4,574 79,177 39,260 74,095
Current assets
Inventories
20,813 16,722 17,123
Trade and other receivables
15,111 15,630 17,023 Derivative financial instruments
- - 3
Cash and cash equivalents 13 823 7,273 332 36,747 39,625 34,481
Liabilities
Current liabilities
Borrowings 13 438 - 2,350 Trade and other payables
18,048 17,947 17,150
Derivative financial instruments
297 284 - Provisions for liabilities and charges 10 1,360 689 855 Current tax liabilities 8,732 7,711 6,823 28,875 26,631 27,178
Net current assets 7,872 12,994 7,303
Non-current liabilities
Borrowings 13 8,801 - 11,143 Deferred tax liabilities
9,996 2,716 9,734
Retirement benefit obligations 18,732 15,568 16,605 Provisions for liabilities and charges 10 1,631 1,241 1,712
39,160 19,525 39,194
Net assets 47,889 32,729 42,204
Shareholders’ equity
Ordinary shares 11 31,023 31,023 31,023 Share premium account 11 34,708 34,708 34,708 Capital redemption reserve
500 500 500
Translation reserve
6,106 2,076 2,379 Accumulated losses (24,448) (35,578) (26,406) Total equity 47,889 32,729 42,204
16
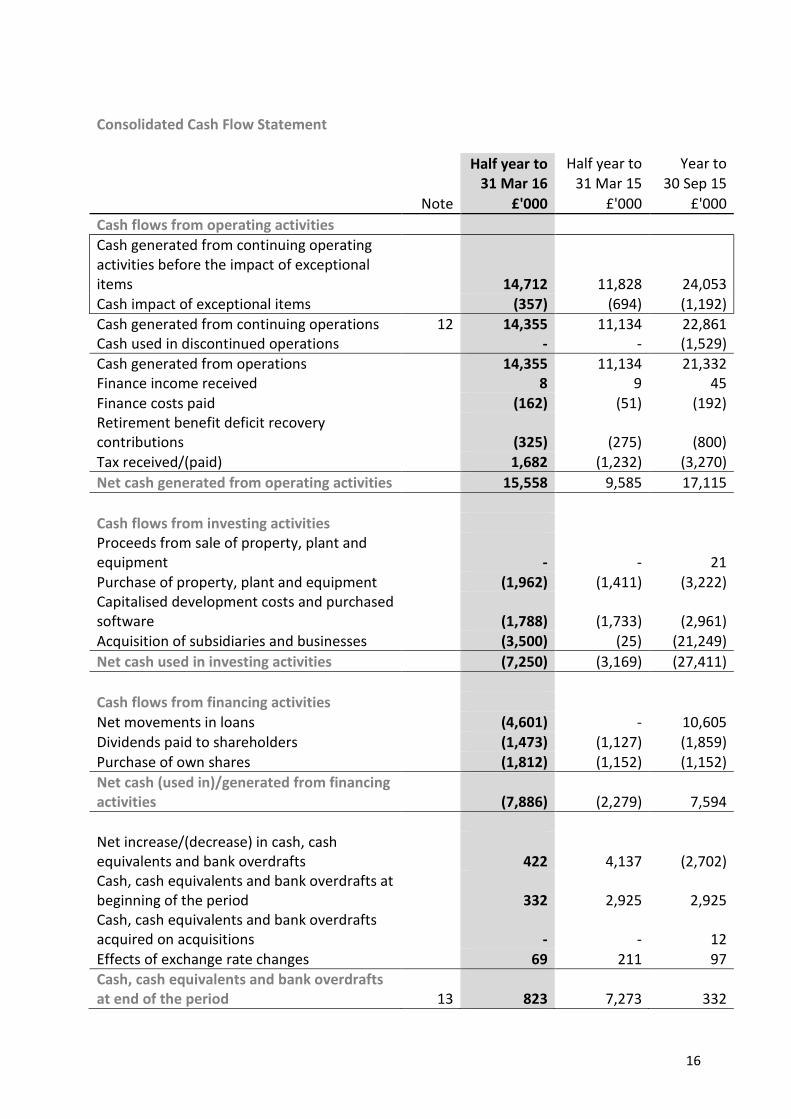
Consolidated Cash Flow Statement
Half year to Half year to Year to
31 Mar 16 31 Mar 15 30 Sep 15
Note £'000 £'000 £'000 Cash flows from operating activities Cash generated from continuing operating activities before the impact of exceptional items 14,712 11,828 24,053 Cash impact of exceptional items (357) (694) (1,192) Cash generated from continuing operations Cash used in discontinued operations
12 14,355 -
11,134 -
22,861 (1,529)
Cash generated from operations Finance income received
14,355 8
11,134 9
21,332 45
Finance costs paid
(162) (51) (192) Retirement benefit deficit recovery contributions
(325) (275) (800)
Tax received/(paid)
1,682 (1,232) (3,270) Net cash generated from operating activities 15,558 9,585 17,115
Cash flows from investing activities
Proceeds from sale of property, plant and equipment
- - 21
Purchase of property, plant and equipment
(1,962) (1,411) (3,222) Capitalised development costs and purchased software
(1,788) (1,733) (2,961)
Acquisition of subsidiaries and businesses (3,500) (25) (21,249) Net cash used in investing activities (7,250) (3,169) (27,411)
Cash flows from financing activities
Net movements in loans
(4,601) - 10,605
Dividends paid to shareholders
(1,473) (1,127) (1,859) Purchase of own shares
(1,812) (1,152) (1,152)
Net cash (used in)/generated from financing activities (7,886) (2,279) 7,594
Net increase/(decrease) in cash, cash equivalents and bank overdrafts
422 4,137 (2,702)
Cash, cash equivalents and bank overdrafts at beginning of the period Cash, cash equivalents and bank overdrafts acquired on acquisitions
332
-
2,925
-
2,925
12
Effects of exchange rate changes
69 211 97 Cash, cash equivalents and bank overdrafts at end of the period 13 823
7,273 332
17
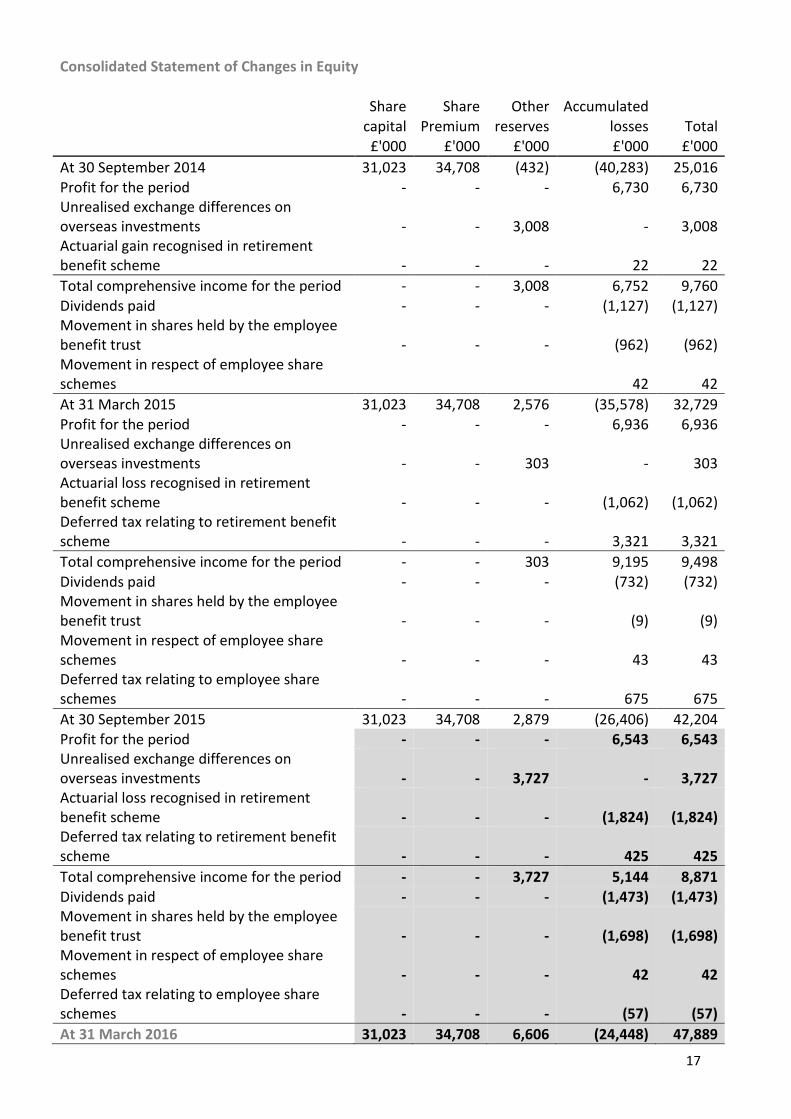
Consolidated Statement of Changes in Equity
Share Share Other Accumulated
capital Premium reserves losses Total £'000 £'000 £'000 £'000 £'000 At 30 September 2014 31,023 34,708 (432) (40,283) 25,016 Profit for the period - - - 6,730 6,730 Unrealised exchange differences on overseas investments - - 3,008 - 3,008 Actuarial gain recognised in retirement benefit scheme - - - 22 22 Total comprehensive income for the period - - 3,008 6,752 9,760 Dividends paid - - - (1,127) (1,127) Movement in shares held by the employee benefit trust - - - (962) (962) Movement in respect of employee share schemes 42 42 At 31 March 2015 31,023 34,708 2,576 (35,578) 32,729 Profit for the period - - - 6,936 6,936 Unrealised exchange differences on overseas investments - - 303 - 303 Actuarial loss recognised in retirement benefit scheme - - - (1,062) (1,062) Deferred tax relating to retirement benefit scheme - - - 3,321 3,321 Total comprehensive income for the period - - 303 9,195 9,498 Dividends paid - - - (732) (732) Movement in shares held by the employee benefit trust - - - (9) (9) Movement in respect of employee share schemes - - - 43 43 Deferred tax relating to employee share schemes - - - 675 675 At 30 September 2015 31,023 34,708 2,879 (26,406) 42,204 Profit for the period - - - 6,543 6,543 Unrealised exchange differences on overseas investments - - 3,727 - 3,727 Actuarial loss recognised in retirement benefit scheme - - - (1,824) (1,824) Deferred tax relating to retirement benefit scheme - - - 425 425 Total comprehensive income for the period - - 3,727 5,144 8,871 Dividends paid - - - (1,473) (1,473) Movement in shares held by the employee benefit trust - - - (1,698) (1,698) Movement in respect of employee share schemes - - - 42 42 Deferred tax relating to employee share schemes - - - (57) (57) At 31 March 2016 31,023 34,708 6,606 (24,448) 47,889
18
Notes to the Interim Financial Statements 1. General information The company is a limited liability company incorporated in England and domiciled in the UK. The address of its registered office is Hampton Park West, Semington Road, Melksham, Wiltshire, SN12 6NB. The company has its primary listing on the London Stock Exchange. This unaudited condensed consolidated interim financial information was approved for issue on 4 May 2016. These interim financial results do not comprise statutory accounts within the meaning of Section 434 of the Companies Act 2006. Statutory accounts for the year ended 30 September 2015 were approved by the Board of Directors on 17 November 2015 and delivered to the Registrar of Companies. The report of the auditors on those accounts was unqualified, did not contain an emphasis of matter paragraph and did not contain any statement under Section 498 of the Companies Act 2006. 2. Basis of preparation This condensed consolidated interim financial information for the half year ended 31 March 2016 has been prepared in accordance with the Disclosure and Transparency Rules of the Financial Services Authority and with IAS 34, ‘Interim financial reporting’ as adopted by the European Union. These interim financial results should be read in conjunction with the annual financial statements for the year ended 30 September 2015, which have been prepared in accordance with IFRSs as adopted by the European Union. Having considered the Group’s funding position, budgets for 2016 and three year plan, the Directors have formed a judgment that there is a reasonable expectation that the Group has adequate resources to continue in operational existence for the foreseeable future. For this reason the Directors continue to adopt the going concern basis in preparing the condensed consolidated interim financial information. 3. Accounting policies The accounting policies adopted are consistent with those of the annual financial statements for the year ended 30 September 2015, as described in those financial statements.
19
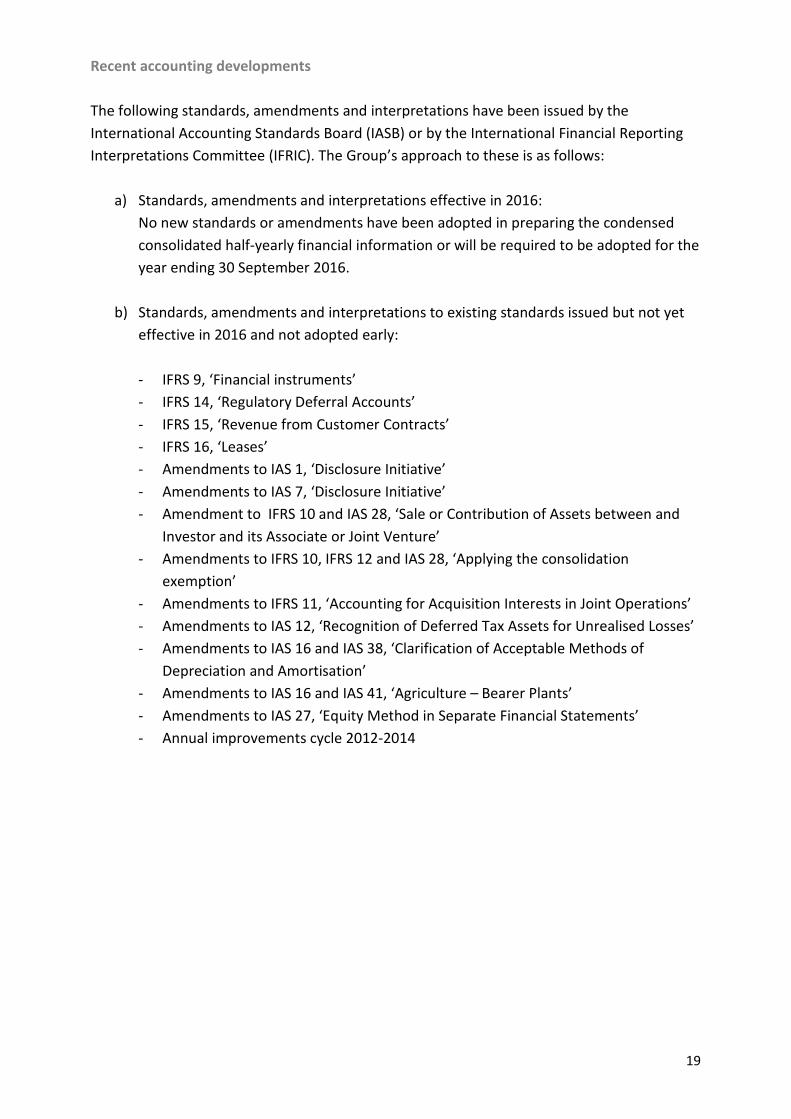
Recent accounting developments The following standards, amendments and interpretations have been issued by the International Accounting Standards Board (IASB) or by the International Financial Reporting Interpretations Committee (IFRIC). The Group’s approach to these is as follows:
a) Standards, amendments and interpretations effective in 2016: No new standards or amendments have been adopted in preparing the condensed consolidated half-yearly financial information or will be required to be adopted for the year ending 30 September 2016.
b) Standards, amendments and interpretations to existing standards issued but not yet effective in 2016 and not adopted early: - IFRS 9, ‘Financial instruments’ - IFRS 14, ‘Regulatory Deferral Accounts’ - IFRS 15, ‘Revenue from Customer Contracts’ - IFRS 16, ‘Leases’ - Amendments to IAS 1, ‘Disclosure Initiative’ - Amendments to IAS 7, ‘Disclosure Initiative’ - Amendment to IFRS 10 and IAS 28, ‘Sale or Contribution of Assets between and
Investor and its Associate or Joint Venture’ - Amendments to IFRS 10, IFRS 12 and IAS 28, ‘Applying the consolidation
exemption’ - Amendments to IFRS 11, ‘Accounting for Acquisition Interests in Joint Operations’ - Amendments to IAS 12, ‘Recognition of Deferred Tax Assets for Unrealised Losses’ - Amendments to IAS 16 and IAS 38, ‘Clarification of Acceptable Methods of
Depreciation and Amortisation’ - Amendments to IAS 16 and IAS 41, ‘Agriculture – Bearer Plants’ - Amendments to IAS 27, ‘Equity Method in Separate Financial Statements’ - Annual improvements cycle 2012-2014
20
4. Segment information
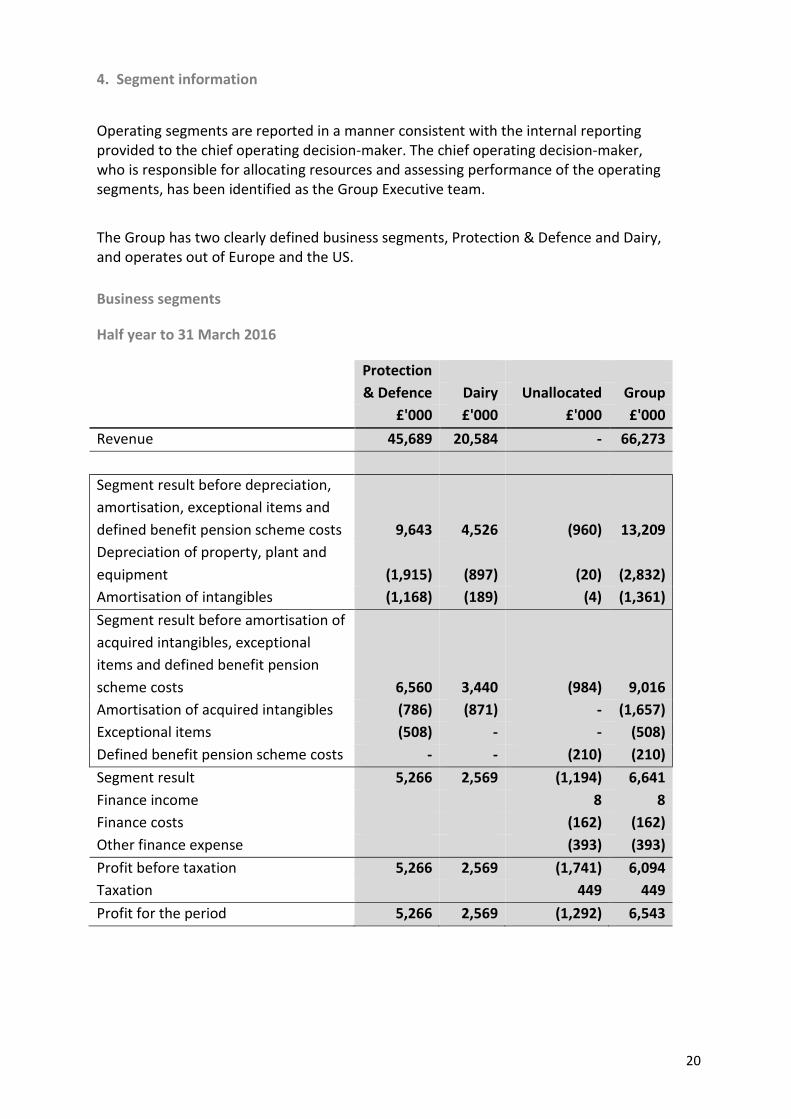
Operating segments are reported in a manner consistent with the internal reporting provided to the chief operating decision-maker. The chief operating decision-maker, who is responsible for allocating resources and assessing performance of the operating segments, has been identified as the Group Executive team.
The Group has two clearly defined business segments, Protection & Defence and Dairy, and operates out of Europe and the US. Business segments
Half year to 31 March 2016
Protection & Defence
Dairy Unallocated Group
£'000 £'000 £'000 £'000 Revenue 45,689 20,584 - 66,273
Segment result before depreciation, amortisation, exceptional items and defined benefit pension scheme costs 9,643 4,526 (960) 13,209 Depreciation of property, plant and equipment (1,915) (897) (20) (2,832) Amortisation of intangibles (1,168) (189) (4) (1,361) Segment result before amortisation of acquired intangibles, exceptional items and defined benefit pension scheme costs
6,560 3,440 (984) 9,016
Amortisation of acquired intangibles (786) (871) - (1,657) Exceptional items (508) - - (508) Defined benefit pension scheme costs - - (210) (210) Segment result 5,266 2,569 (1,194) 6,641 Finance income 8 8 Finance costs (162) (162) Other finance expense (393) (393) Profit before taxation 5,266 2,569 (1,741) 6,094 Taxation 449 449 Profit for the period 5,266 2,569 (1,292) 6,543
21
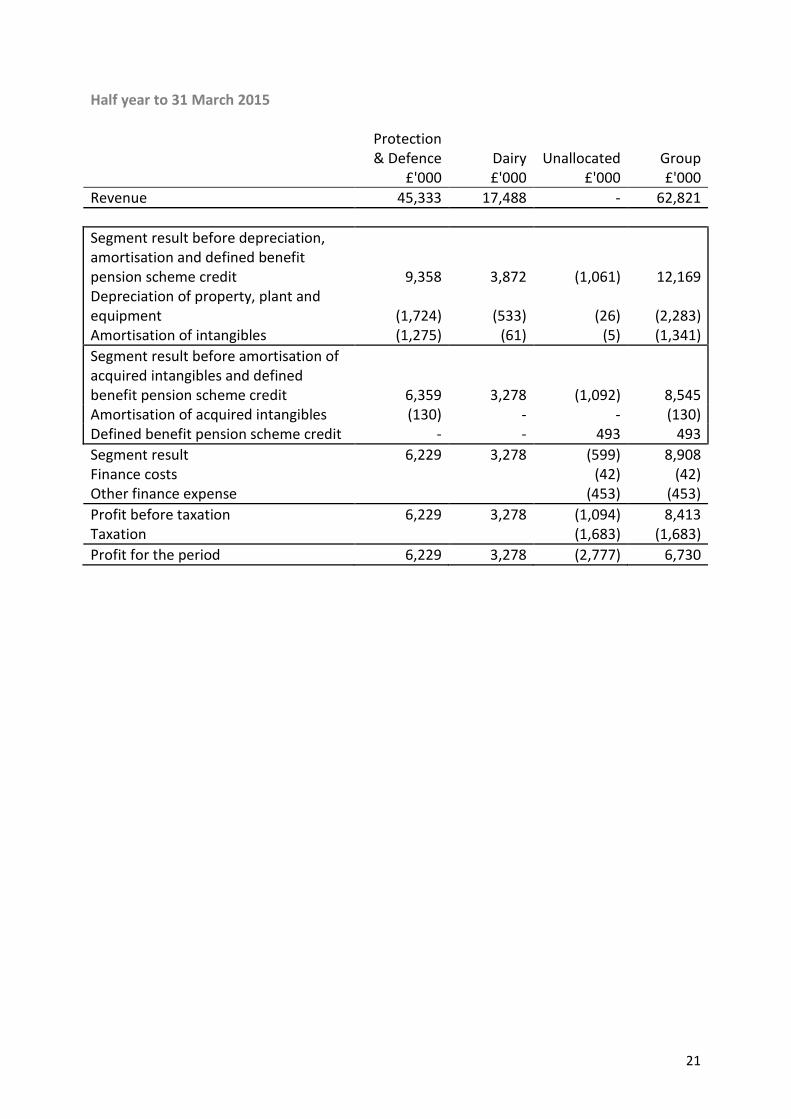
Half year to 31 March 2015
Protection & Defence Dairy Unallocated Group
£'000 £'000 £'000 £'000 Revenue 45,333 17,488 - 62,821 Segment result before depreciation, amortisation and defined benefit pension scheme credit 9,358 3,872 (1,061) 12,169 Depreciation of property, plant and equipment (1,724) (533) (26) (2,283) Amortisation of intangibles (1,275) (61) (5) (1,341) Segment result before amortisation of acquired intangibles and defined benefit pension scheme credit 6,359 3,278 (1,092) 8,545 Amortisation of acquired intangibles (130) - - (130) Defined benefit pension scheme credit - - 493 493 Segment result 6,229 3,278 (599) 8,908 Finance costs (42) (42) Other finance expense (453) (453) Profit before taxation 6,229 3,278 (1,094) 8,413 Taxation (1,683) (1,683) Profit for the period 6,229 3,278 (2,777) 6,730
22
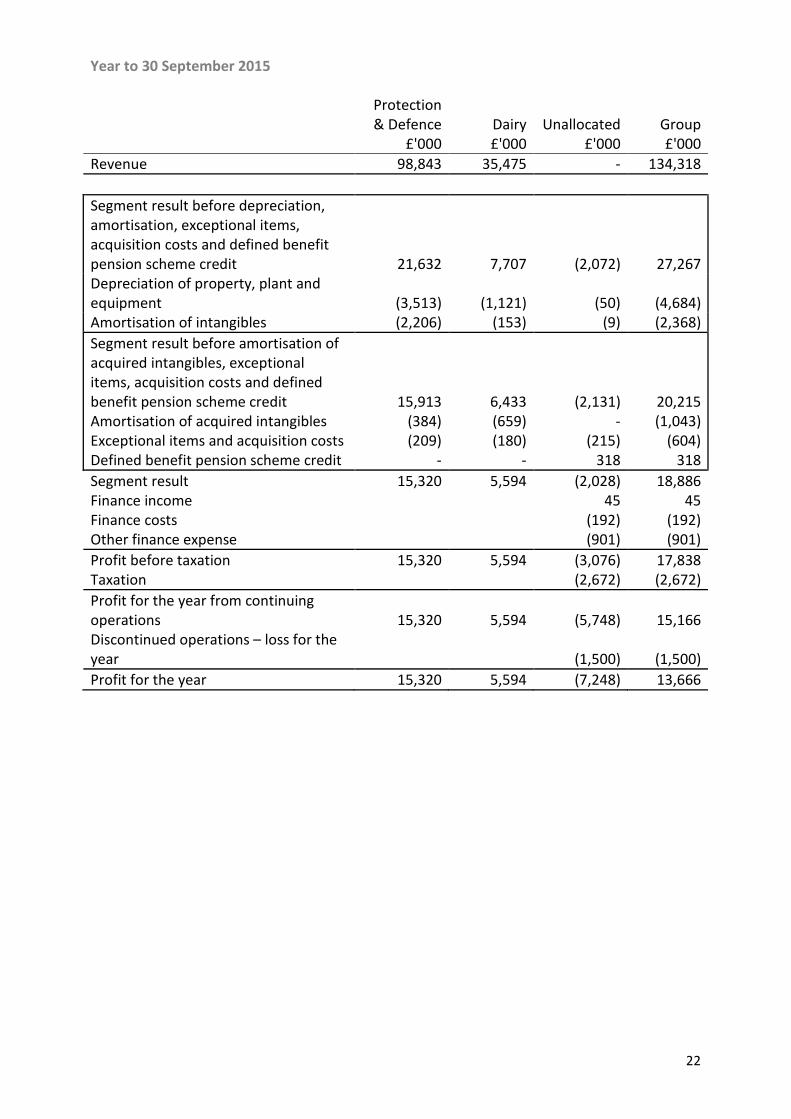
Year to 30 September 2015
Protection & Defence Dairy Unallocated Group
£'000 £'000 £'000 £'000 Revenue 98,843 35,475 - 134,318 Segment result before depreciation, amortisation, exceptional items, acquisition costs and defined benefit pension scheme credit 21,632 7,707 (2,072) 27,267 Depreciation of property, plant and equipment (3,513) (1,121) (50) (4,684) Amortisation of intangibles (2,206) (153) (9) (2,368) Segment result before amortisation of acquired intangibles, exceptional items, acquisition costs and defined benefit pension scheme credit 15,913 6,433 (2,131) 20,215 Amortisation of acquired intangibles Exceptional items and acquisition costs
(384) (209)
(659) (180)
- (215)
(1,043) (604)
Defined benefit pension scheme credit - - 318 318 Segment result 15,320 5,594 (2,028) 18,886 Finance income 45 45 Finance costs (192) (192) Other finance expense (901) (901) Profit before taxation 15,320 5,594 (3,076) 17,838 Taxation (2,672) (2,672) Profit for the year from continuing operations 15,320 5,594 (5,748) 15,166 Discontinued operations – loss for the year (1,500) (1,500) Profit for the year 15,320 5,594 (7,248) 13,666
23
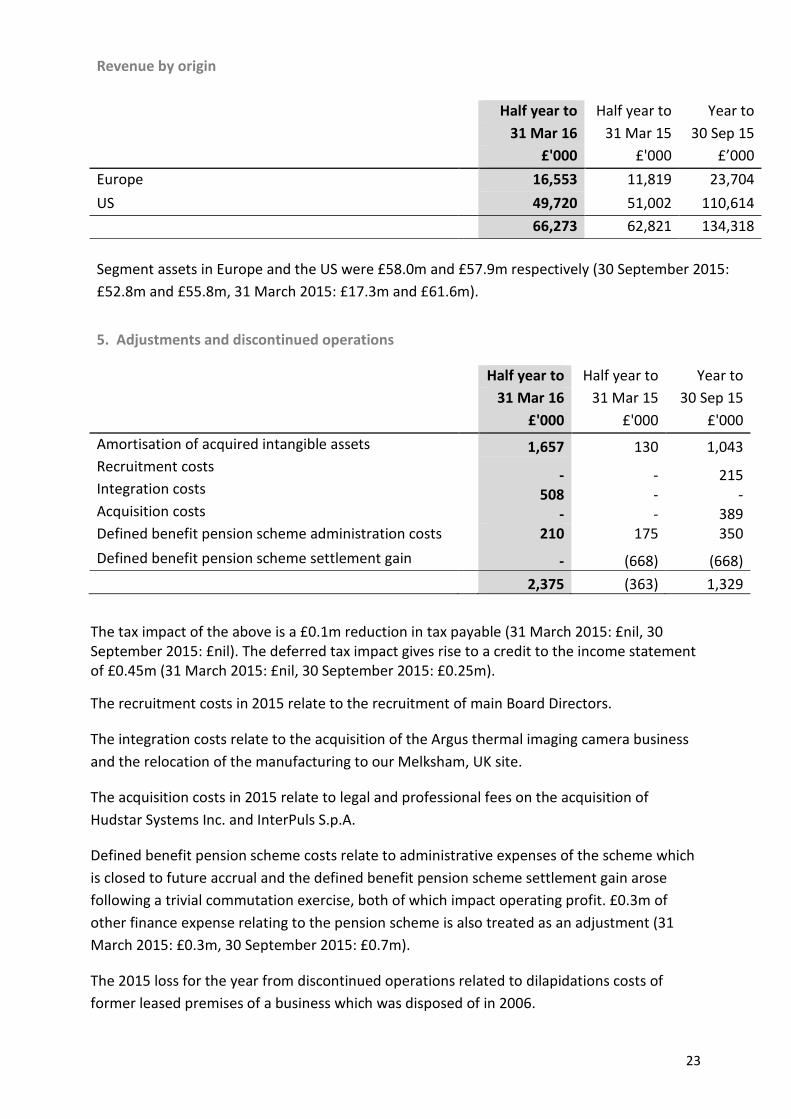
Revenue by origin
Half year to Half year to Year to
31 Mar 16 31 Mar 15 30 Sep 15
£'000 £'000 £’000 Europe
16,553 11,819 23,704
US
49,720 51,002 110,614 66,273 62,821 134,318
Segment assets in Europe and the US were £58.0m and £57.9m respectively (30 September 2015: £52.8m and £55.8m, 31 March 2015: £17.3m and £61.6m).
5. Adjustments and discontinued operations
Half year to Half year to Year to
31 Mar 16 31 Mar 15 30 Sep 15
£'000 £'000 £'000 Amortisation of acquired intangible assets
1,657 130 1,043
Recruitment costs Integration costs Acquisition costs
- 508
-
- - -
215 -
389 Defined benefit pension scheme administration costs 210 175 350 Defined benefit pension scheme settlement gain - (668) (668) 2,375 (363) 1,329
The tax impact of the above is a £0.1m reduction in tax payable (31 March 2015: £nil, 30 September 2015: £nil). The deferred tax impact gives rise to a credit to the income statement of £0.45m (31 March 2015: £nil, 30 September 2015: £0.25m).
The recruitment costs in 2015 relate to the recruitment of main Board Directors.
The integration costs relate to the acquisition of the Argus thermal imaging camera business and the relocation of the manufacturing to our Melksham, UK site.
The acquisition costs in 2015 relate to legal and professional fees on the acquisition of Hudstar Systems Inc. and InterPuls S.p.A.
Defined benefit pension scheme costs relate to administrative expenses of the scheme which is closed to future accrual and the defined benefit pension scheme settlement gain arose following a trivial commutation exercise, both of which impact operating profit. £0.3m of other finance expense relating to the pension scheme is also treated as an adjustment (31 March 2015: £0.3m, 30 September 2015: £0.7m).
The 2015 loss for the year from discontinued operations related to dilapidations costs of former leased premises of a business which was disposed of in 2006.
24
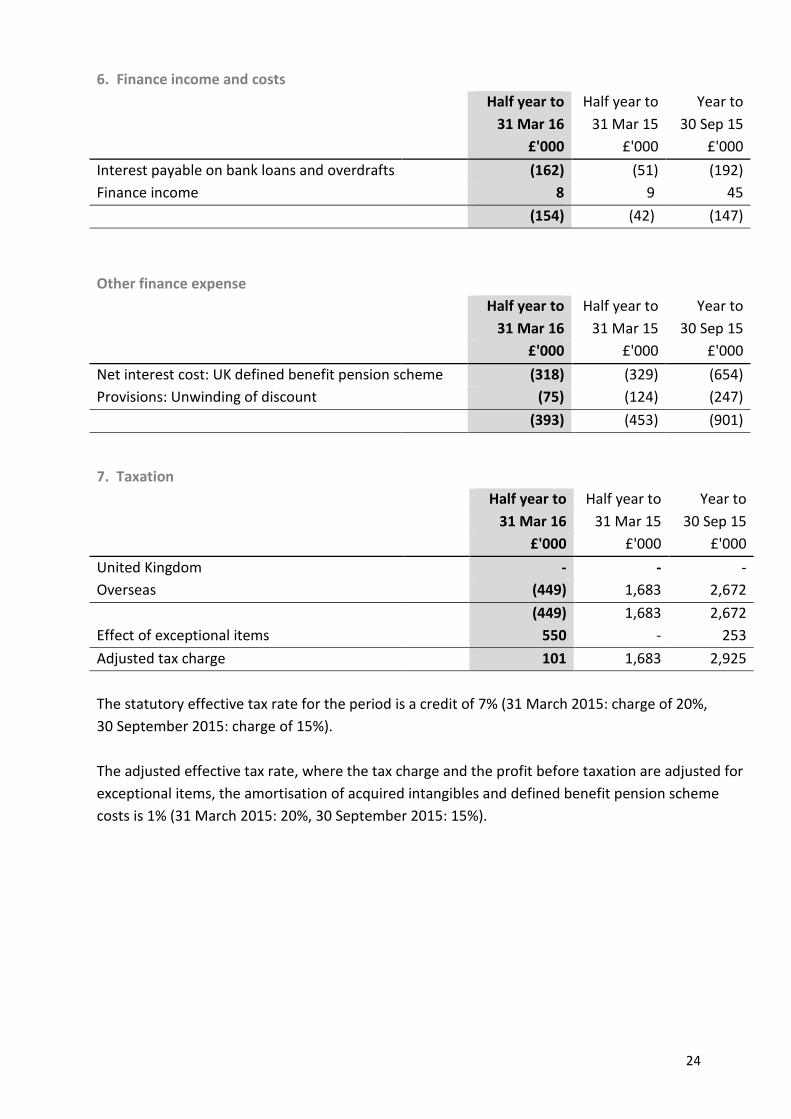
6. Finance income and costs
Half year to Half year to Year to
31 Mar 16 31 Mar 15 30 Sep 15
£'000 £'000 £'000 Interest payable on bank loans and overdrafts (162) (51) (192) Finance income
8 9 45
(154) (42) (147)
Other finance expense
Half year to Half year to Year to
31 Mar 16 31 Mar 15 30 Sep 15
£'000 £'000 £'000 Net interest cost: UK defined benefit pension scheme (318) (329) (654) Provisions: Unwinding of discount
(75) (124) (247)
(393) (453) (901)
7. Taxation
Half year to Half year to Year to
31 Mar 16 31 Mar 15 30 Sep 15
£'000 £'000 £'000 United Kingdom
- - -
Overseas
(449) 1,683 2,672 (449) 1,683 2,672 Effect of exceptional items 550 - 253 Adjusted tax charge 101 1,683 2,925 The statutory effective tax rate for the period is a credit of 7% (31 March 2015: charge of 20%, 30 September 2015: charge of 15%). The adjusted effective tax rate, where the tax charge and the profit before taxation are adjusted for exceptional items, the amortisation of acquired intangibles and defined benefit pension scheme costs is 1% (31 March 2015: 20%, 30 September 2015: 15%).
25
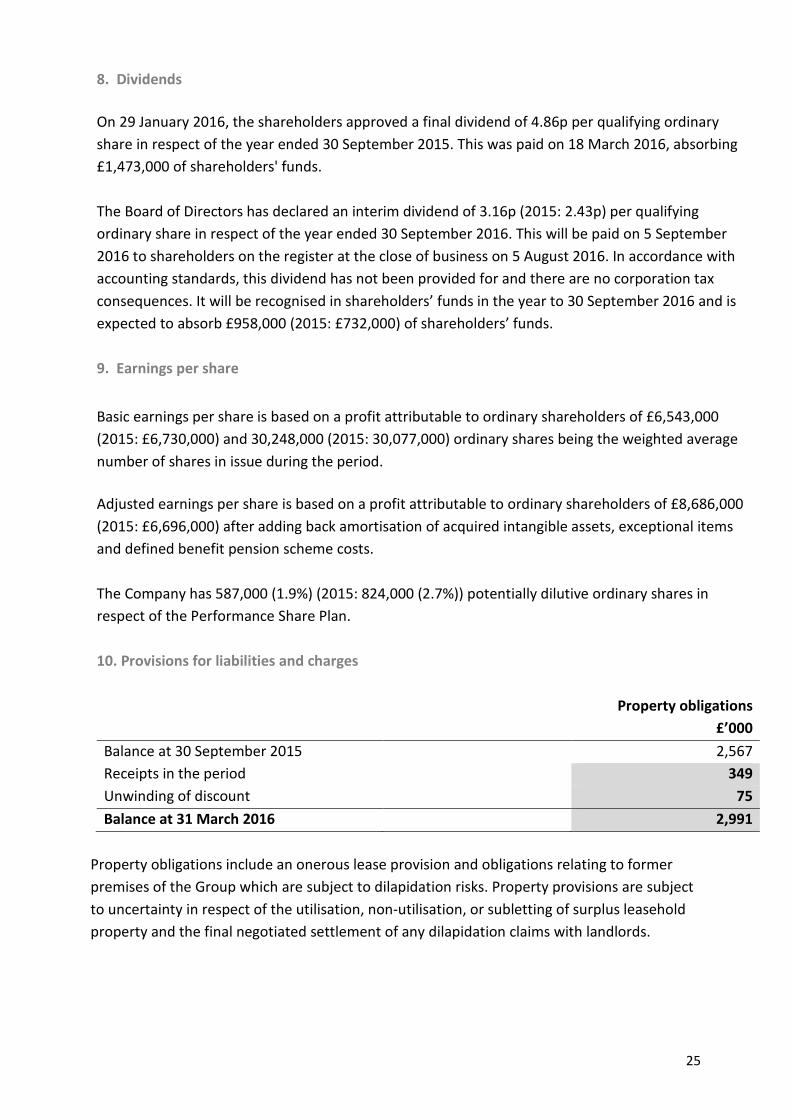
8. Dividends
On 29 January 2016, the shareholders approved a final dividend of 4.86p per qualifying ordinary share in respect of the year ended 30 September 2015. This was paid on 18 March 2016, absorbing £1,473,000 of shareholders' funds. The Board of Directors has declared an interim dividend of 3.16p (2015: 2.43p) per qualifying ordinary share in respect of the year ended 30 September 2016. This will be paid on 5 September 2016 to shareholders on the register at the close of business on 5 August 2016. In accordance with accounting standards, this dividend has not been provided for and there are no corporation tax consequences. It will be recognised in shareholders’ funds in the year to 30 September 2016 and is expected to absorb £958,000 (2015: £732,000) of shareholders’ funds. 9. Earnings per share
Basic earnings per share is based on a profit attributable to ordinary shareholders of £6,543,000 (2015: £6,730,000) and 30,248,000 (2015: 30,077,000) ordinary shares being the weighted average number of shares in issue during the period.
Adjusted earnings per share is based on a profit attributable to ordinary shareholders of £8,686,000 (2015: £6,696,000) after adding back amortisation of acquired intangible assets, exceptional items and defined benefit pension scheme costs. The Company has 587,000 (1.9%) (2015: 824,000 (2.7%)) potentially dilutive ordinary shares in respect of the Performance Share Plan. 10. Provisions for liabilities and charges Property obligations
£’000 Balance at 30 September 2015 2,567 Receipts in the period 349 Unwinding of discount 75 Balance at 31 March 2016 2,991
Property obligations include an onerous lease provision and obligations relating to former premises of the Group which are subject to dilapidation risks. Property provisions are subject to uncertainty in respect of the utilisation, non-utilisation, or subletting of surplus leasehold property and the final negotiated settlement of any dilapidation claims with landlords.
26
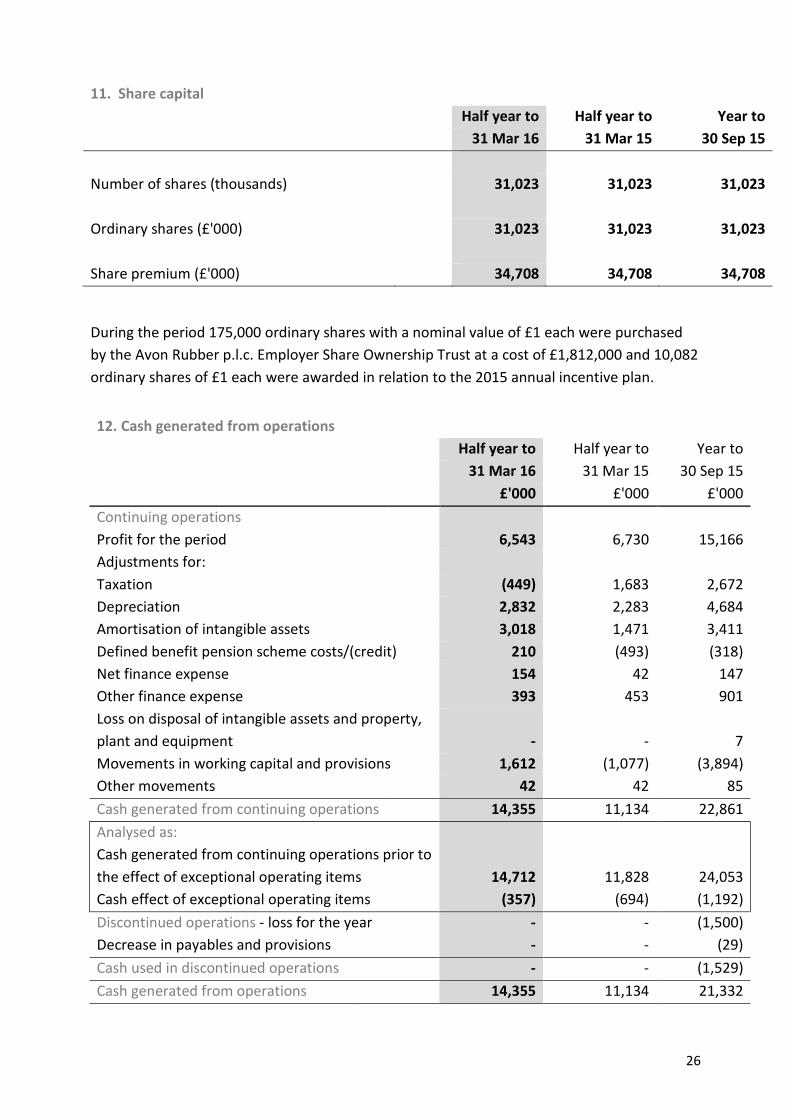
During the period 175,000 ordinary shares with a nominal value of £1 each were purchased by the Avon Rubber p.l.c. Employer Share Ownership Trust at a cost of £1,812,000 and 10,082 ordinary shares of £1 each were awarded in relation to the 2015 annual incentive plan.
12. Cash generated from operations
Half year to Half year to Year to
31 Mar 16 31 Mar 15 30 Sep 15
£'000 £'000 £'000 Continuing operations Profit for the period
6,543 6,730 15,166
Adjustments for:
Taxation
(449) 1,683 2,672
Depreciation
2,832 2,283 4,684 Amortisation of intangible assets
3,018 1,471 3,411
Defined benefit pension scheme costs/(credit) 210 (493) (318) Net finance expense
154 42 147
Other finance expense
393 453 901 Loss on disposal of intangible assets and property, plant and equipment - - 7 Movements in working capital and provisions 1,612 (1,077) (3,894) Other movements 42 42 85 Cash generated from continuing operations 14,355 11,134 22,861 Analysed as: Cash generated from continuing operations prior to the effect of exceptional operating items Cash effect of exceptional operating items
14,712 (357)
11,828 (694)
24,053 (1,192)
Discontinued operations - loss for the year Decrease in payables and provisions
- -
- -
(1,500) (29)
Cash used in discontinued operations - - (1,529) Cash generated from operations 14,355 11,134 21,332
11. Share capital
Half year to Half year to Year to
31 Mar 16 31 Mar 15 30 Sep 15
Number of shares (thousands)
31,023 31,023 31,023
Ordinary shares (£'000)
31,023 31,023 31,023
Share premium (£'000) 34,708 34,708 34,708
27
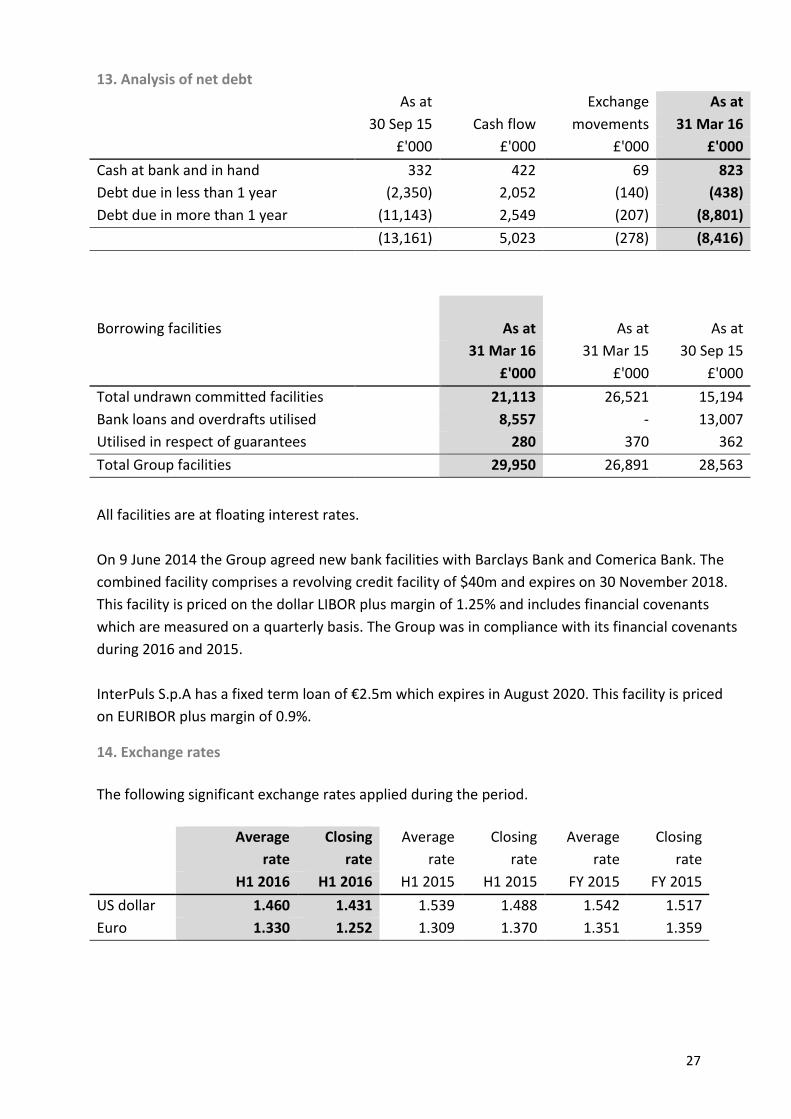
13. Analysis of net debt
As at
Exchange As at
30 Sep 15 Cash flow movements 31 Mar 16
£'000 £'000 £'000 £'000 Cash at bank and in hand 332 422 69 823 Debt due in less than 1 year (2,350) 2,052 (140) (438) Debt due in more than 1 year (11,143) 2,549 (207) (8,801) (13,161) 5,023 (278) (8,416)
Borrowing facilities
As at
As at
As at
31 Mar 16 31 Mar 15 30 Sep 15
£'000 £'000 £'000 Total undrawn committed facilities
21,113 26,521 15,194
Bank loans and overdrafts utilised 8,557 - 13,007 Utilised in respect of guarantees
280 370 362
Total Group facilities 29,950 26,891 28,563
All facilities are at floating interest rates. On 9 June 2014 the Group agreed new bank facilities with Barclays Bank and Comerica Bank. The combined facility comprises a revolving credit facility of $40m and expires on 30 November 2018. This facility is priced on the dollar LIBOR plus margin of 1.25% and includes financial covenants which are measured on a quarterly basis. The Group was in compliance with its financial covenants during 2016 and 2015. InterPuls S.p.A has a fixed term loan of €2.5m which expires in August 2020. This facility is priced on EURIBOR plus margin of 0.9%.
14. Exchange rates
The following significant exchange rates applied during the period.
Average rate
Closing rate
Average rate
Closing rate
Average rate
Closing rate
H1 2016 H1 2016 H1 2015 H1 2015 FY 2015 FY 2015 US dollar 1.460 1.431 1.539 1.488 1.542 1.517 Euro 1.330 1.252 1.309 1.370 1.351 1.359
28
Fair value of financial instruments The fair value of forward exchange contracts is determined by using valuation techniques using period end spot rates, adjusted for the forward points to the value date of the contract.
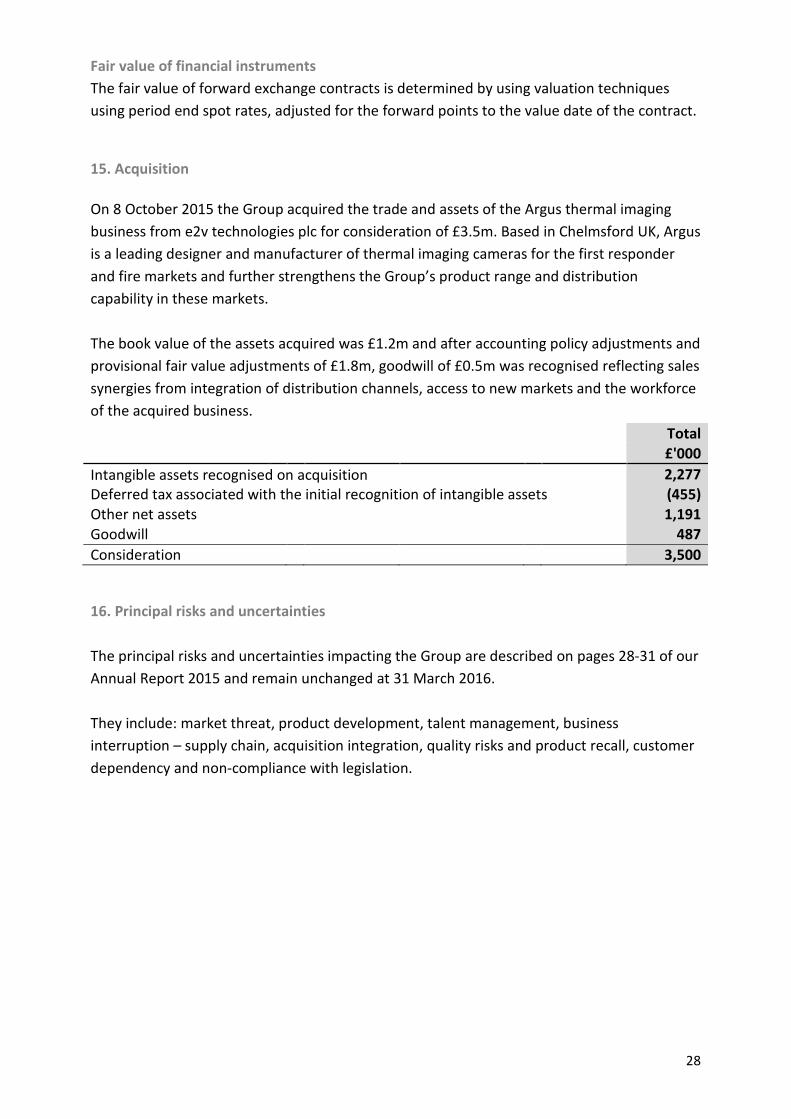
15. Acquisition On 8 October 2015 the Group acquired the trade and assets of the Argus thermal imaging business from e2v technologies plc for consideration of £3.5m. Based in Chelmsford UK, Argus is a leading designer and manufacturer of thermal imaging cameras for the first responder and fire markets and further strengthens the Group’s product range and distribution capability in these markets. The book value of the assets acquired was £1.2m and after accounting policy adjustments and provisional fair value adjustments of £1.8m, goodwill of £0.5m was recognised reflecting sales synergies from integration of distribution channels, access to new markets and the workforce of the acquired business.
Total
£'000 Intangible assets recognised on acquisition 2,277 Deferred tax associated with the initial recognition of intangible assets (455) Other net assets 1,191 Goodwill 487 Consideration 3,500
16. Principal risks and uncertainties The principal risks and uncertainties impacting the Group are described on pages 28-31 of our Annual Report 2015 and remain unchanged at 31 March 2016. They include: market threat, product development, talent management, business interruption – supply chain, acquisition integration, quality risks and product recall, customer dependency and non-compliance with legislation.
29
Hampton Park West Semington Road Melksham Wiltshire SN12 6NB England
Tel: +44 (0) 1225 896 800 Fax: +44 (0) 1225 896 898 e-mail: [email protected]
CORPORATE INFORMATION
REGISTERED OFFICE Corporate Headquarters Hampton Park West Semington Road Melksham Wiltshire SN12 6NB Registered in England and Wales No. 32965 V.A.T. No. GB 137 575 643
BOARD OF DIRECTORS David Evans (Chairman) Pim Vervaat (Non-Executive Director) Chloe Ponsonby (Non-Executive Director) Rob Rennie (Chief Executive) Andrew Lewis (Group Finance Director)
COMPANY SECRETARY Miles Ingrey-Counter
INDEPENDENT AUDITORS PricewaterhouseCoopers LLP
REGISTRARS & TRANSFER OFFICE Capita Asset Services The Registry 34 Beckenham Road Beckenham BR3 4TU Tel: 0871 664 0300 (calls cost 10p per minute plus network extras, lines are open 8.30am–5.30pm Mon-Fri)
BROKERS Arden Partners plc
SOLICITORS TLT LLP
PRINCIPAL BANKERS Barclays Bank PLC Comerica Inc.
CORPORATE FINANCIAL ADVISER Arden Partners plc
CORPORATE WEBSITE www.avon-rubber.com