2016 Health Care Cost and Utilization Report · 1/23/2018 · For the annual Health Care Cost and...
39
Analytic Methodology 2016V1.0 I 2016 Health Care Cost and Utilization Report Analytic Methodology 2016V1.0 January 23, 2018 Note: This analytic methodology is appropriate for the 2016 Health Care Cost and Utilization Report, as our methods are continually refined. Interested parties are encouraged to refer to the appropriate methodology and report. Copyright 2018 Health Care Cost Institute Inc. Unless explicitly noted, the content of this report is licensed under a Creative Commons Attribution Non-Commercial No Derivatives 4.0 License.
Transcript of 2016 Health Care Cost and Utilization Report · 1/23/2018 · For the annual Health Care Cost and...

Analytic Methodology 2016V1.0 I
2016 Health Care Cost and Utilization Report
Analytic Methodology
2016V1.0
January 23, 2018
Note: This analytic methodology is appropriate for the 2016 Health Care Cost and Utilization
Report, as our methods are continually refined. Interested parties are encouraged to refer to the
appropriate methodology and report.
Copyright 2018 Health Care Cost Institute Inc. Unless explicitly noted, the content of this report is
licensed under a Creative Commons Attribution Non-Commercial No Derivatives 4.0 License.

Analytic Methodology 2016V1.0 II
Table of Contents
1. Introduction ............................................................................................ 1
2. Methods ................................................................................................. 3
2.1 Data collection ..................................................................................................... 3
2.2 Claims categorization ........................................................................................ 4
2.2.1 Facility claims ................................................................................................................... 4 2.2.1.1 Inpatient facility claims .................................................................................................5 2.2.1.2 Outpatient facility claims ..............................................................................................6
2.2.2 Professional procedure and prescription claims ....................................................... 8 2.2.2.1 Professional procedure claims....................................................................................8 2.2.2.2 Prescription drug claims...............................................................................................9
2.3 Chronic conditions categorization ................................................................... 9
2.3.1 Diabetes ............................................................................................................................. 9 2.3.2 Hypertension ................................................................................................................... 10
2.4 Grouping and counting methodologies ........................................................ 10
2.4.1 Unit counting (utilization) methodology .................................................................... 10 2.4.2 Intensity weights methodology ................................................................................... 12
2.4.2.1 Acute inpatient facility: excluding SNF, hospice, and ungroupable ................... 12 2.4.2.2 Outpatient facility ........................................................................................................ 13 2.4.2.3 Professional procedures ........................................................................................... 13
2.4.3 Methodology for imputing missing weights ............................................................. 13
2.5 Adjustment methodologies ............................................................................ 14
2.5.1 Claims completion methodology ................................................................................ 14 2.5.2 Population weighting methodology ............................................................................ 15
3. Analysis ................................................................................................ 17
3.1 Population membership .................................................................................. 18
3.2 Annual expenditures per capita ...................................................................... 18
3.3 Decomposition of expenditures per capita .................................................. 18
3.4 Utilization per 1,000 insured ........................................................................... 19
3.5 Average price per service ................................................................................ 19
3.6 Decomposition of average prices .................................................................. 19
3.7 Length of stay .................................................................................................... 20

Analytic Methodology 2016V1.0 III
4. Appendix ............................................................................................... 21
4.1 Acute inpatient facility detailed service categories and corresponding
MS-DRG codes [V32.0] ..................................................................................... 21
4.2 Mapping to MS-DRG codes............................................................................. 22
4.3 Outpatient facility service categories mapping to CPT/HCPCS/revenue
codes/hierarchies ............................................................................................. 23
4.4 Professional procedures detailed service categories mapping to
CPT/HCPCS codes ........................................................................................... 25
4.5 Prescription detailed service categories matching to AHFS class .......... 28
4.6 Diabetes codes .................................................................................................. 29
4.7 Hypertension codes ......................................................................................... 30
4.8 Claims completion example ........................................................................... 31
4.9 Population weighting example ....................................................................... 32
4.10 Population weighting annual adjustment factors ....................................... 33
5. Notes ..................................................................................................... 34

Analytic Methodology 2016V1.0 1
1. Introduction
For the 2016 Health Care Cost and Utilization Report, the Health Care Cost Institute
(HCCI) presented national and subnational benchmarked statistics of health care
spending, utilization, prices, and service intensity for the population of individuals younger
than 65 and covered by employer-sponsored private health insurance (ESI). The data
behind these statistics came from a national, multipayer, commercial health care claims
database created by HCCI containing information provided by four major insurers. As of
July 2017, HCCI held approximately 1 billion commercial medical and pharmacy claims
per year, representing the health care activity of more than 50 million individuals per year
for the years 2007 through 2016. This document, the latest in a series of analytic
methodologies from HCCI, describes in detail the methods used to transform raw claims
into descriptive statistics.
For the annual Health Care Cost and Utilization reports and semi-annual Children’s Health
Spending reports, HCCI produced an analytic subset of its database, consisting of all non-
Medicare claims on behalf of beneficiaries younger than age 65, covered by ESI and
whose claims were filed with a contributing health plan between 2012 and 2016. Figure 1
shows the process HCCI used to clean the employer-sponsored health insurance claims
data. It categorized claims, flagged chronically ill populations, calculated utilization, and
determined resource intensity weights. HCCI made this data representative of the
national population younger than 65 and having ESI using population weights based on U.
S. Census Bureau data. For data from the years of 2015 and 2016, HCCI used a
completion method to estimate the components of claims that were incomplete at the
end of the reporting period. No adjustment was performed for inflation, so the estimated
dollars in these reports are nominal.

Analytic Methodology 2016V1.0 2
FIGURE 1: PROCESS FLOW
A note on premiums
HCCI does not report on premiums or their determinants. For more information on health
insurance premiums and the multiple factors that affect them (including health care
expenditures; insured, group, and market characteristics; benefit design; and the
regulatory environment), see Congressional Research Service, Private Health Insurance
Premiums and Rate Reviews, 2011; 1 American Academy of Actuaries, Critical Issues in
Health Reform: Premium Setting in the Individual Market, 2010;2 and Congressional
Budget Office, Key Issues in Analyzing Major Health Insurance Proposals, Chapter 3,
Factors Affecting Insurance Premiums, 2008.3
Changes in the methodology (August 2017)
Compared to earlier versions, HCCI’s updated analytic methodology (2016V1.0) had a
number of changes designed to respond to inquiries about methods and enhance
reporting.
▪ For the 2016 analytic dataset, 2012, 2013, and 2014 data were considered
complete, and no actuarial adjustment was performed. The 2015 and 2016
claims were actuarially completed using the new data.
▪ The average intensity weights were changed to reflect updates to DRGs, RVUs,
and APCs by CMS in 2016.
▪ The census data used to create the population weighting changed for this
analytic dataset as the previously used 3-year average population metrics were
discontinued in 2015. See Section 2.5.2 for more information.
Analytic Methodology 2016V1.0 3
2. Methods
2.1 Data collection
HCCI has access to health care claims data for approximately 50 million Americans in
every year between 2007 and 2016. This dataset was developed from de-identified claims
data that were compliant with the Health Insurance Portability and Accountability Act
(HIPAA) and included the allowed cost (actual prices paid) to providers for services. To
produce the findings in the 2016 Health Care Cost and Utilization Report, HCCI used an
analytic subset of its data consisting of all eligible claims for insureds younger than age
65 and covered by either fully-insured or self-insured employer-sponsored health
insurance (ESI). The final analytic subset consisted of just under 40 million covered lives
per year, for the years 2012 through 2016 (Table 1). The claims used in the 2015 report,
4.6 billion claim lines, represent the health care activity of about 26% of all individuals
younger than 65 and having ESI, making this one of the largest data collections on the
privately insured ever assembled.
TABLE 1: ANALYTIC SUBSET FOR 2016 REPORT – TOTAL COVERED LIVES BY CALENDAR YEAR
Year Covered Lives
2012 39,400,000
2013 39,800,000
2014 40,000,000
2015 39,500,000
2016 40,300,000
Source: HCCI, 2018. Notes: Data refer only to HCCI holdings of claims for beneficiaries covered by
employer-sponsored health insurance and younger than age 65. HCCI datasets include additional data on
the individually insured, Medicare Advantage, and other covered beneficiaries not used in these reports.
Data rounded to the nearest 100,000.
Between January 2017 and July 2017, each contributing insurer updated the 2015 claims
data they previously submitted to HCCI in addition to providing new data from 2016.
HCCI’s data manager confirmed the data integrity of each claims file (membership,
medical, and pharmacy) in each year with the appropriate data contributor.
From these base datasets, a single analytical dataset was constructed for analysis using

Analytic Methodology 2016V1.0 4
the process shown in Figure 1. Analysis of the analytic dataset is described in Section 3.
2.2 Claims categorization
At the highest level, claims data were grouped into four major service categories:
inpatient facility, outpatient facility, professional procedure, and prescription drugs and
devices. HCCI also divided claims into several subservice categories: acute inpatient,
which excludes skilled nursing facilities, hospice, and ungroupable claims; outpatient
facility visits; outpatient-other claims; brand prescriptions; and generic prescriptions.
Claims were further classified into detailed service categories (see Appendix Tables 4.1,
4.3, 4.4, and 4.5).
Inpatient facility claims were from hospitals, skilled nursing facilities (SNFs), and
hospices, where there was evidence that the insured stayed overnight (Figure 2). The
outpatient facility category contained claims that did not include an overnight stay but
included observation and emergency room claims (Figure 3). Both outpatient and
inpatient claims were for only the facility charges associated with such claims. HCCI
classified professional procedural services provided by physicians and nonphysicians
according to the industry’s commonly used procedure codes (Figure 4), and the claims
were grouped into primary care or specialist care. Prescription claims were coded into 30
therapeutic classes and grouped as either generic or brand name prescriptions (Figure 4).
2.2.1 Facility claims
HCCI categorized claims that were billed by place of service as “facility claims.” Medical
claims with a valid revenue code (i.e., a code assigned to a medical service or treatment
for receiving proper payment) were assumed to be facility claims. Failing that, claims
were assumed to be professional procedure claims. Once processed, facility claims were
grouped into two major service categories—inpatient and outpatient (Figure 2 and Figure
3).
Analytic Methodology 2016V1.0 5
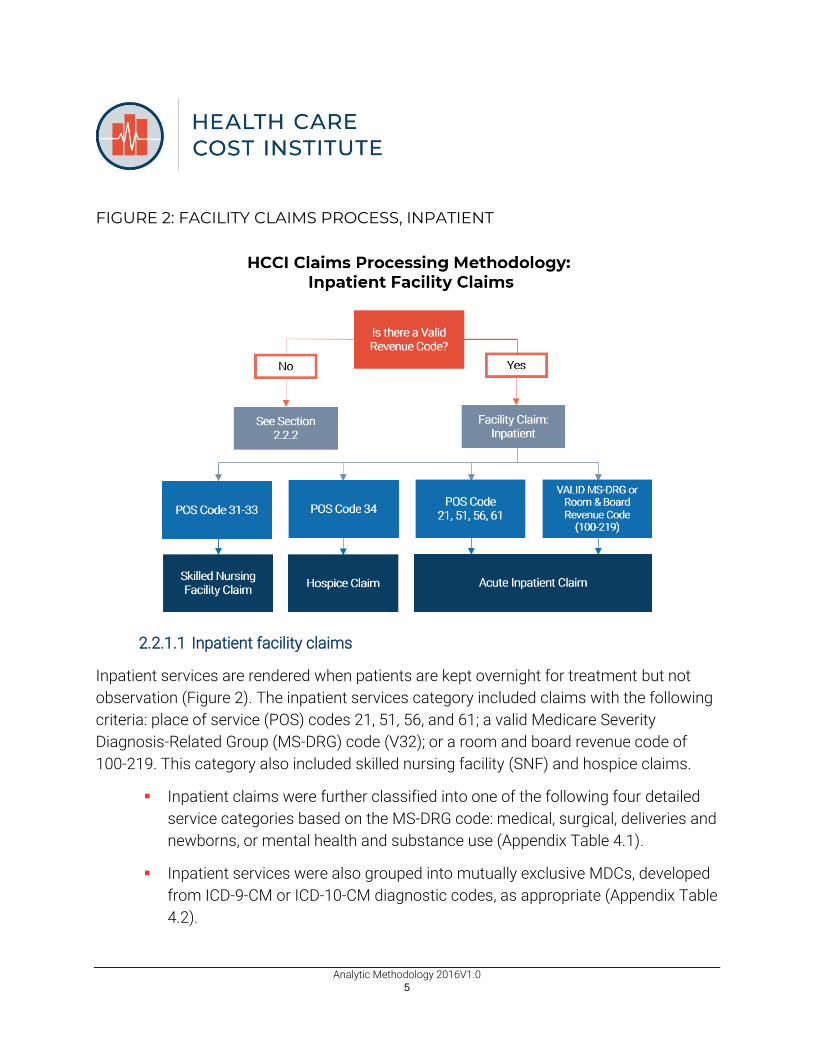
FIGURE 2: FACILITY CLAIMS PROCESS, INPATIENT
2.2.1.1 Inpatient facility claims
Inpatient services are rendered when patients are kept overnight for treatment but not
observation (Figure 2). The inpatient services category included claims with the following
criteria: place of service (POS) codes 21, 51, 56, and 61; a valid Medicare Severity
Diagnosis-Related Group (MS-DRG) code (V32); or a room and board revenue code of
100-219. This category also included skilled nursing facility (SNF) and hospice claims.
▪ Inpatient claims were further classified into one of the following four detailed
service categories based on the MS-DRG code: medical, surgical, deliveries and
newborns, or mental health and substance use (Appendix Table 4.1).
▪ Inpatient services were also grouped into mutually exclusive MDCs, developed
from ICD-9-CM or ICD-10-CM diagnostic codes, as appropriate (Appendix Table
4.2).

Analytic Methodology 2016V1.0 6
▪ SNF and hospice: SNFs provide nursing and rehabilitation services but with
less care intensity than would be received in a hospital. This category was used
when the POS code was 31-33.4 Hospice is special care provided by a program
or facility for the terminally ill. This category was used when the POS code was
34.
▪ Some inpatient facility claims could not be categorized as described above;
these claims were treated as ungroupable. Less than 0.1% of inpatient claims
were ungroupable.
▪ Inpatient claims excluding SNF, hospice, and ungroupable claims were
grouped in the subservice category acute inpatient claims.5
FIGURE 3: FACILITY CLAIMS PROCESS, OUTPATIENT
2.2.1.2 Outpatient facility claims
Outpatient services are rendered by the sections of a hospital that provides medical

Analytic Methodology 2016V1.0 7
services that do not require an overnight stay or hospitalization (e.g., emergency room
[ER], outpatient surgery, observation room). These services can also be provided at
freestanding outpatient facilities, including free-standing surgical centers, ambulatory
surgical centers (ASCs), and clinics with high-tech diagnostic testing (e.g., MRIs). These
outpatient facilities all file Health Care Financing Administration (HCFA) 1500 form with
insurers. The outpatient category was used for all facility claims not characterized as
inpatient (Figure 3).
▪ Outpatient claims were classified into subservice categories on the basis of
both revenue code and the Current Procedural Terminology/Healthcare
Common Procedure Coding System (CPT/HCPCS) code. Outpatient claims
may have multiple services billed on the same claim, so a hierarchy system
was used to determine which detail line to use for categorization (Appendix
Table 4.3).
▪ The categories with the highest ranking values were ER, outpatient surgery,
and observation. Claims with these services were categorized as the
subservice category “outpatient visits”, in which all the detailed records on the
claim were grouped together in a single visit and assigned to the detailed
service category with the highest hierarchy value (Appendix Table 4.3).
▪ Outpatient services not categorized as ER, outpatient surgery, or observation
were counted as “outpatient-other.” Therefore, each service on the claim was
categorized and counted separately.
▪ Outpatient exceptions: claims without the presence of a revenue code for
services with CPT/HCPCS codes for ambulance, home health, and durable
medical equipment/prosthetics/supplies were mapped to the outpatient
ancillary services category. Hospice procedures given as outpatient services
are categorized as outpatient-other claims.

Analytic Methodology 2016V1.0 8
2.2.2 Professional procedure and prescription claims
FIGURE 4: PROFESSIONAL PROCEDURE AND PRESCRIPTION CLAIMS PROCESSES
2.2.2.1 Professional procedure claims
Professional procedure claims are claims filed by a health care professional for medical
services provided (Figure 4). Claims with no valid revenue code were assumed to be a
professional procedure claim.
Claims were classified into HCCI’s professional procedure detailed categories based on
their CPT/HCPCS code (Appendix Table 4.4). Exceptions to the professional procedure
codes were all facility-administered drugs (CPT/HCPCS codes J0000–J9999) and were
mapped to the administered drugs detailed service category within professional
procedures, regardless of whether a revenue code was present on the claim. The
professional procedure category also includes facility claims for some independent
clinics, such as small private practices, and multi-specialty clinics (e.g., offering primary
care and x-rays). Clinics included in the professional procedure category did not file a

Analytic Methodology 2016V1.0 9
HCFA 1500 with insurers.
If information was available, the claim was then also categorized by the provider’s
specialty (Appendix Table 4.4). Physicians and other professionals were categorized as
primary care providers if they were coded as family practice, geriatric medicine, internal
medicine, pediatrics, or preventive medicine.
2.2.2.2 Prescription drug claims
As seen in Figure 4, prescription drug and device pharmacy claims were categorized as
either brand or generic on the basis of their National Drug Code (NDC). Any drug
unidentifiable as either brand or generic was grouped as “uncategorized”. These
uncategorizable drugs were included in the overall prescription drug trends, but not
included as a subservice category of prescriptions. Administered drugs and any devices
identified as professional procedures rather than scripts were categorized as
professional procedures (Appendix Table 4.4). Prescription claims were grouped into one
of the 31 American Hospital Formulary Service (AHFS) therapeutic classes based on the
claim’s NDC, using the June 2016 First Databank classification system. Prescriptions are
then mapped to HCCI’s detailed service categories (Appendix Table 4.5). AHFS
therapeutic classes are developed and maintained by the American Society of Health-
System Pharmacists.6 Prescriptions were further classified into sub-detailed classes,
based upon their six-digit AHFS class code.
2.3 Chronic conditions categorization
In 2017, HCCI added a new chronic condition flag to the dataset: asthma. The
methodologies for the chronic condition groupings are as follows.
2.3.1 Diabetes
HCCI identified individuals with diabetes using codes based on the 2004 Dictionary of
Disease Management Terminology (DDMT).7 On the advice of chronic condition experts,
HCCI relied on the DDMT for categorization rather than the 2013 Healthcare
Effectiveness Data and Information Set8 specification for comprehensive diabetes care or
the Clinical Classifications Software (CCS)9 categories for diabetes (Appendix Table 4.6).
Analytic Methodology 2016V1.0 10
HCCI added a diabetes flag to the insured data on the basis of the DDMT methodology.
For each year between 2012 and 2016, HCCI flagged insureds as having diabetes
mellitus. It there was a diagnosis for (1) two professional services during the year, (2) one
or more ER visits, or (3) one or more inpatient admissions was a DDMT diabetes
category, the insured was flagged as having diabetes for that year. Once an insured was
flagged as having diabetes, he or she was flagged in all subsequent years. HCCI excluded
radiology and laboratory claims from the diabetes methodology, as these can be used for
screening purposes. In 2016, HCCI updated the diabetes flagging methodology to include
the relevant ICD-10-CM codes based on the CMS publication of the code descriptions and
the General Equivalence Mappings (GEMs).
2.3.2 Hypertension
HCCI identified individuals with four types of hypertension: essential hypertension on
primary diagnosis, essential hypertension on other diagnosis, secondary hypertension on
primary diagnosis, and secondary hypertension on other diagnosis. These were identified
on the basis of CCS codes for the ICD-9-CM codes and the GEMs for the ICD-10-CM
codes (see Appendix Table 4.7). The hypertension flag was added to the HCCI analytic
dataset in July 2016. For each year between 2012 and 2016, HCCI reflagged insureds
each year as having one of the four identified types of hypertension or as not having
hypertension. If there was the presence of one of a relevant ICD-9-CM or ICD-10-CM
codes in any of the inpatient, outpatient, or physician settings then the insured was
flagged as having hypertension in that year. A hypertension flag for a particular insured
could change from year to year.10
2.4 Grouping and counting methodologies
2.4.1 Unit counting (utilization) methodology
To correctly calculate the utilization count, HCCI analyzed reimbursements for claims. In
the following rules, reimbursement refers to any monetary payment to a provider,
whether a professional procedure provider, facility, or pharmaceutical vendor.

Analytic Methodology 2016V1.0 11
▪ If the reimbursement dollars for an admission, visit, or professional procedure
were equal to 0, the utilization count was set at 0.
▪ If the reimbursement dollars for an admission, visit, or professional procedure
were less than 0, the utilization count was set at minus 1. Negative
reimbursement amounts occur from claim reversals, making it important to
reverse the utilization count as well.
▪ If the reimbursement dollars for an admission, visit, or professional procedure
were greater than 0, the utilization count was set at 1.
Service category-specific rules are as follows:
▪ Inpatient facility: acute, SNF, and hospice
▪ If multiple claims had the same patient identification, facility
categorization (inpatient, SNF, or hospice), and provider with
overlapping or contiguous admission or discharge dates, they were
grouped into one admission.
▪ The length of stay was determined as the discharge date less the
admission date, if that was equal to zero the length of stay is equal to
one day. If multiple claims were combined into one admission, the
discharge date used was the latest discharge date among all claims; the
admission date used was the earliest admission date among all the
claims.
▪ Outpatient facility
▪ For ER, outpatient surgery, and observation claims (outpatient visits):
▪ a visit was defined as all claims for the same patient, same
provider, and same beginning service date;
▪ if a claim had multiple beginning service dates among its various
detail claim lines, the earliest date was used as the beginning
service date for the entire claim.

Analytic Methodology 2016V1.0 12
▪ For all other outpatient claims, utilization counts were record counts
adjusted for the reimbursement dollars (as described above). These are
referred to as outpatient-other counts.11
▪ Professional procedures
For all professional procedure claims, utilization counts were record counts
adjusted for the reimbursement dollars and are referred to as professional
procedure counts.
▪ Prescriptions
Prescription drug claims were captured by a filled script. Each prescription was
considered a claim, as was every prescription refill; therefore, if a prescription was
filled once and then refilled three times, four claims were counted. For the 2015
Health Care Cost and Utilization Report HCCI calculated utilization through filled
days of a prescription, since differing classes of scripts may be for different
lengths of time, which could obscure changes in prescription utilization. For
example, one month of birth control is 28 filled days, while a round of antibiotics
might be 14 filled days.
2.4.2 Intensity weights methodology
In general, intensity reflects the complexity of the service provided or the level of
resources required for treatment. HCCI divided price per medical service into two
components—intensity-adjusted price and intensity per service. The following section
provides details on how intensity weights were assigned by service category. Our
methodology bears some resemblance to that employed in Dunn, Liebman, and
Shapiro.12 For the 2016 Health Care Cost and Utilization Report, HCCI did not implement
an intensity-weighting strategy for pharmacy claims.
2.4.2.1 Acute inpatient facility: excluding SNF, hospice, and ungroupable
To weight inpatient facility claims, HCCI excluded SNF, hospice, and ungroupable claims,
as these do not have intensity weights. This limited inpatient categorization is referred to
as the “acute inpatient”. Each acute inpatient admission was assigned an MS-DRG or

Analytic Methodology 2016V1.0 13
DRG code to which a weight was assigned. The CMS assigns every DRG a weight on the
basis of the average costs to Medicare of patients classified in that DRG. The weight
reflects the average level of resources expended for the average Medicare patient in that
DRG relative to the average level of resources for all Medicare patients. DRGs that are
more expensive to treat get a higher weight and vice versa. In this way, DRG weights
reflect intensity of treatment. For the 2016 Health Care Cost and Utilization Report the
weights were updated to use the 2016 CMS weights.
2.4.2.2 Outpatient facility
To weight outpatient facility claims, each claim line was mapped to a payment code in
the Ambulatory Payment Classification (APC) system based on the CPT/HCPCS code on
the claim line. The APC weights used were updated to the 2016 CMS weights.
For claims that could not be mapped to an appropriate APC, weights were assigned on
the basis of relative value units (RVUs) for facility procedure codes. RVUs, which are
based on the resources required to complete each service, are determined by the
American Medical Association and published by the CMS. RVU weights were adjusted as
were APC weights, based on the difference between calendar year 2016 RVU conversion
factor and calendar year 2016 APC base rate.
2.4.2.3 Professional procedures
Each professional procedure was mapped to a CPT/HCPCS code (Appendix Table 4.4)
and was assigned an RVU, either facility or non-facility, on the basis of the place of
service. Professional procedures are provided in various settings – hospitals, outpatient
facilities, or physician offices. The RVUs were updated to the 2016 weights, as published
by the CMS. Commercial adjustments were made to account for professional procedures
not commonly seen in Medicare claims and for certain professional procedures such as
anesthesia. The commercial modifiers are proprietary; therefore, HCCI cannot publish
them.
2.4.3 Methodology for imputing missing weights
For outpatient and professional procedure claim lines that were not assigned weights
using the methods described, an analysis was conducted to impute a weight. Weights

Analytic Methodology 2016V1.0 14
were not imputed for inpatient admissions. The imputation analysis followed these key
steps:
▪ Step 1: A detailed service category was determined for each procedure code or
revenue code requiring a gap fill (referred to as imputed codes).
▪ Step 2: The average price paid and average APC/RVU weight for each detailed
service category were calculated on the basis of the claims with assigned
weights.
▪ Step 3: Outpatient or professional procedure weight data (as described in
section 2.4.2) from the first half of the most recent year and second half of the
previous year are combined. This helps account for seasonal changes.
▪ Step 4: A universal gap fill weight table is created from the Step 1 data.
▪ Step 5: The gap-filled weights from the table are applied to all payers, for all
years.
2.5 Adjustment methodologies
2.5.1 Claims completion methodology
Claims data reflect health care services performed (i.e., claims incurred) in the year noted.
Claims generally require time for submission to the payer, processing, and payments to
the provider (sometimes called the claim payment lag time, or run-out period).
Completion is a standard actuarial practice designed to allow for the calculation of
utilization, prices, expenditures, and intensity of health care services when a full set of
claims is not available. Services that have outstanding claims may have a missing or
incomplete record. Completion allows for the estimation of the cost impact of the
outstanding claims to avoid undercounting or under-projecting trends.
Completion factors varied by type of measure (i.e., dollars, unit counts, and intensity
weights) and detailed service category (i.e., subgroups within the service categories).
Please see Appendix Tables 4.3, 4.4, and 4.5 for the detailed service category definitions.
The factors were based on historical claims payment patterns specific to the HCCI
dataset. They were developed using a standard actuarial model for incurred-but-not-paid
analysis, as described by Bluhm (Appendix Table 4.7).13

Analytic Methodology 2016V1.0 15
For the 2016 Health Care Cost and Utilization Report, claims incurred from January 1,
2015 through December 31, 2016 and paid through May 31, 2017 (for one payer) and
June 30, 2017 (for the other payers) were collected. An adjustment was needed to
account for the remaining 2015 and 2016 medical claims that would be paid after May 31
or June 30, 2017. Prescriptions were considered complete and were not adjusted with
completion factors. Claims from 2012-2015 were assumed to be fully adjudicated.
2.5.2 Population weighting methodology
For HCCI’s estimation process of the total ESI population, the American Community
Survey (ACS) was used to establish a distribution of the population covered by
commercial health insurance demographic and geographic characteristics (Appendix
Table 4.8).14
To develop demographic and geographic weights, the 5-year averages from the ACS non-
public health insurance population survey along with single year ESI population estimates
as annual adjustments were used.
Demographic and geographic divisions used were as follows:
▪ geographic divisions: Core-Based Statistical Area–Metropolitan Statistical Area
(CBSA-MSA) and state. Counties that did not map to a CBSA-MSA code –
namely, rural counties – were aggregated into a single area by state such that
each state had a single “rural area” of counties. Individuals in the dataset may
have had more than one state or CBSA listed. This could be due to and insured
moving during the year or overlap of CBSAs (e.g., Virginia, Maryland, and the
District of Columbia); this affected less than 1 percent of individuals in the
dataset;
▪ age divisions: younger than 6 years of age, 6–17, 18–24, 25–44, and 45–64
(Individuals older than age 64 were excluded); and
▪ gender divisions.
The distribution of the ESI population for these 4,130 distinct age, gender, and geographic
categories was developed and used for all years (Appendix Table 4.9).

Analytic Methodology 2016V1.0 16
age-gender-geo weight = (ACS population for the age-gender-geo category measured)
/ (ACS national population estimate)
The HCCI data were also aggregated by geographic division, age division, and gender.
This enabled the development of weights using the survey-based targets discussed
earlier. The weights were applied to insureds and claims, resulting in representative
estimates of the national ESI population younger than age 65.
The HCCI methodology also accounts for the possibility that some individuals will move
CBSAs or change age groups within a year. Individuals are grouped into an age-gender-
geo group for the proportion of time spent in that group. For example, if an individual lived
half of the year in CBSA1 and half of the year in CBSA2, they would be counted as 0.5 of a
covered life in each CBSA.
In order to account for yearly population fluctuations, the data were also adjusted using a
yearly ACS weighting factor (Appendix Table 4.10).

Analytic Methodology 2016V1.0 17
3. Analysis
The analytic dataset was composed of information on expenditures, prices paid,
utilization, and intensity for insureds younger than 65 and covered by ESI. The statistics
were weighted by geography-age-gender to be nationally representative. Analyses
consisted of summary statistics on spending and the components of spending.
Demographic flags were included for:
▪ four US census regions (West, Northeast, Midwest, and South);
▪ nine US census divisions (New England, Mid-Atlantic, East North
Central, West North Central, South Atlantic, East South Central,
West South Central, Mountain, Pacific);
▪ 50 states and the District of Columbia;
▪ five age subgroupings (ages 0–18, 19–25, 26–44, 45–54, and 55–64);
▪ four children age subgroupings (ages 0-3, 4-8, 9-13, 14-18); and
▪ gender.
HCCI divided claims into four service categories: inpatient facility, outpatient facility,
professional procedures, and prescriptions. Within those categories were subservice and
detailed services:
▪ five subservice categories (acute inpatient, without skilled nursing facility,
hospice, and ungroupable claims; outpatient visits; outpatient-other; generic
prescriptions; and brand name prescriptions);
▪ multiple detailed service categories (e.g., emergency room visits); and
▪ multiple subdetailed prescription categories based on AHFS prescription
classes.
In the 2016 Health Care Cost and Utilization Report Appendix, HCCI produced report

Analytic Methodology 2016V1.0 18
tables for the service subservice categories, consisting of: annual expenditures per
capita, annual out-of-pocket expenditures per capita, utilization per 1,000 insureds,
average prices, average intensity, and average intensity-adjusted prices, and expanded
these metrics to include gender, geographic, and age group–level statistics. Definitions of
terms used in the report can be found in the glossary on the HCCI Website.
3.1 Population membership
Membership in the ESI population is calculated as the total number of months individuals
are insured. From this insured-years are calculated by member months divided by 12, to
estimate 12 months of coverage or the cost for a year of health care.
3.2 Annual expenditures per capita
HCCI captured per capita health care spending on people with ESI by summing in each
year all the weighted dollars directly spent on health care services for filed claims and
dividing that amount by the number of insured-years. By this method, the per capita
health expenditures in the report estimates the cost per insured, even for insureds who
did not use health care services.15 This metric is a subset of overall national health care
spending and may not be comparable to other metrics of national spending because it
covers only persons having group ESI and younger than 65 years.
Similar methods were used to calculate expenditures per capita out-of-pocket (the dollars
paid by members for health services through copayments, co-insurance, and deductibles)
and expenditures per capita by payers.
3.3 Decomposition of expenditures per capita
In the annual Health Care Cost and Utilization Reports, estimated health care
expenditures were determined by the prices paid to providers for each service and the
amount of service (utilization). HCCI decomposed spending trends into a price trend and
a utilization trend to determine the major drivers of the health care cost curve.

Analytic Methodology 2016V1.0 19
3.4 Utilization per 1,000 insured
In the annual Health Care Cost and Utilization Reports, HCCI calculated utilization rates
per 1,000 insureds. The total service count was produced by summing for each service
category the admissions, professional procedures, visits, scripts, or filled prescription
days. The resulting amount was divided by the number of insured-years. This provided a
per-individual utilization count by service category, which was then multiplied by 1,000.
3.5 Average price per service
In the annual Health Care Cost and Utilization Reports, HCCI calculated average price per
service by dividing total expenditure by total utilization per service or subservice category.
By this method, the derived calculation includes the “prices” paid by the payer and the
insured out of pocket.
3.6 Decomposition of average prices
HCCI also decomposed prices per service into a complexity of services (intensity)
component and an intensity-adjusted price component to help isolate whether price per
service increases were driven by intensity of care or rising unit prices. Intensity-adjusted
price, or unit price, gives HCCI the average allowed cost per service, deflated by the sum
of the weights across all the services in the category, or average price per service weight.
Because weights are a measure of how much care is required to treat a patient in a given
service category, the sum of the weights is a measure of the total amount, or intensity of
care, delivered.
SNF, hospice, and ungroupable inpatient admissions have inconsistent DRG codes,
creating difficulty in calculating intensity and intensity-adjusted price for these service
categories. Therefore, inpatient facility intensity and intensity-adjusted price trends are
reported for the acute inpatient.
Outpatient and professional procedure claims were assigned weights using the relevant
APC or RVU codes, as discussed above (see sections 2.4.2 and 2.4.3). After weights were

Analytic Methodology 2016V1.0 20
assigned to outpatient services and professional procedures, HCCI calculated intensity
per service.
Using the DRG weights allowed HCCI to measure differences in how much service a
typical admission got on the basis of the DRGs in that admission category. Intensity-
adjusted prices were calculated for the inpatient, outpatient, and professional procedure
service categories. These were not calculated for prescriptions because they were not
assigned intensity weights.
3.7 Length of stay
Starting in the 2013 Health Care Cost and Utilization Report, HCCI added a metric for
measuring the length of inpatient admissions in days. The number of days stayed for an
admission is calculated as the date of discharge minus the date of admission, if these
dates are the same days are equal to one (see section 2.4.1). This method of calculating
the number of days is consistent with how health plan benefits are designed and
collected. Length of stay for admission categories is then calculated by dividing the total
number of days in an inpatient service, subservice, or detailed service category by the
utilization of that category. This results in the average length of stay in days for each
service, subservice, and detailed service inpatient category.

Analytic Methodology 2016V1.0 21
4. Appendix
4.1 Acute inpatient facility detailed service categories
and corresponding MS-DRG codes [V32.0]
Medical
Surgical and
Transplant
Labor &
Deliveries
Mental Health &
Substance Use Newborns
52–103 1–13 765–768 876 789–793
121–125 14-17 774 & 775 880 – 887 794 & 795
146–159 20–42 894 – 897
175–208 113–117
280–316 129–139
368–395 163–168
432–446 215–267
533–566 326–358
592–607 405–425
637–645 453–520
682–700 570–585
722–730 614–630
754–761 652–675
776–782 707–718
808–816 734–750
834–849 769 & 770
862–872 799–804
913–923 820–830
933–935 853–858
945–951 901–909
963–965 927–929
974–977 939–941
955–959
969 & 970
981–989
998

Analytic Methodology 2016V1.0 22
4.2 Mapping to MS-DRG codes
MDC Major Diagnostic Category Description MS-DRG
1 Nervous system 020–103
2 Eye 113–125
3 Ear, Nose, Mouth, & Throat 129–159
4 Respiratory System 163–208
5 Circulatory System 215–316
6 Digestive System 326–395
7 Hepatobiliary System & Pancreas 405–446
8 Musculoskeletal System & Connective Tissue 453–566
9 Skin, Subcutaneous Tissue, & Breast 570–607
10 Endocrine, Nutritional, & Metabolic System 614–645
11 Kidney & Urinary Tract 652–700
12 Male Reproductive System 707–730
13 Female Reproductive System 734–761
14 Pregnancy; Childbirth 765–782
15 Newborns & Neonates (Perinatal Period) 789–795
16 Blood, Blood-Forming Organs, & Immunological
Disorders 799–816
17 Myeloproliferative Diseases & Disorders 820–849
18 Infectious & Parasitic Disease & Disorders 853–872
19 Mental Diseases & Disorders 876–887
20 Alcohol/Drug Use or Induced Mental Disorders 894–897
21 Injuries, Poison, & Toxic Effects of Drugs 901–923
22 Burns 927–935
23 Factors influencing Health Status 939–951
24 Multiple Significant Trauma 955–965
25 Human Immunodeficiency Virus Infections 969 – 977
PR Transplants 001 – 017
AL Extensive Procedures Unrelated to Principal
Diagnosis
981-989, 998-
999

Analytic Methodology 2016V1.0 23
4.3 Outpatient facility service categories mapping
to CPT/HCPCS/revenue codes/hierarchies
HCCI Sub-
service Category
HCCI Detailed Service Category
Revenue Codes
Mapping (standard
UB92 codes only)
2014 CPT/HCPCS Codes Mapping (standard 2014
codes)
Hierarchy Ranking
Visits
Emergency Room 450-452; 456; 459
99281-99292; 99466-99476
1
Outpatient Surgery 360–362; 367; 369; 481; 490; 499; 790; 799
10021-36410; 36420-58999; 60000-69990; 92920-92944; 93501-93581; 0016T-0261T; 0392T-0393T
2
Observation 760-762; 769 99217–99220 3 Ancillary:
Other
Ambulance A0021–A0999 7 DME/Prosthetics/ Supplies
A4206-A4652; A5051-A9999; E0100-E8002; K0001-K0902; L0100-L9900
8
Home Health 99500–99602 9
Miscellaneous Outpatient Services
420-424; 429-434; 439-444; 449; 480; 482-483; 489; 720-724; 729-732; 739; 800-804; 809; 820-
59000-59899; 90832-90899; 90935-90999; 92626-92633; 92950-93352; 93451-93464; 93600-93799; 97001-98943; A4653-A4932; G0008-G0922;
4

Analytic Methodology 2016V1.0 24
HCCI Sub-
service Category
HCCI Detailed Service Category
Revenue Codes
Mapping (standard
UB92 codes only)
2014 CPT/HCPCS Codes Mapping (standard 2014
codes)
Hierarchy Ranking
825; 829-835; 839-845; 849-855; 859; 880-882; 889; 900-919; 944-945; 1000-1005
G8006-G9472; H0001-H2037
Other
Radiology Services 320-324; 329-333; 335, 339, 340-344; 349-352; 359, 400-404; 409, 610-619
70010-70332; 70336; 70350-70390; 70450-70498; 70540-70559; 71010-71130; 71250-71275; 71550-71555; 72010-72120; 72125-72133; 72141-72159; 72170-72190; 72191-72198; 72200-73140; 73200-73206; 73218-73225; 73500-73660; 73700-73706; 73718-73725; 74000-74022; 74150-74178; 74181-74185; 74190-74775; 75557-
5

Analytic Methodology 2016V1.0 25
HCCI Sub-
service Category
HCCI Detailed Service Category
Revenue Codes
Mapping (standard
UB92 codes only)
2014 CPT/HCPCS Codes Mapping (standard 2014
codes)
Hierarchy Ranking
75574; 75600-75630; 75635; 75650-76350; 76376-76380; 76390; 76496-76499; 76506-76999; 77001-77003; 77011-77014; 77021-77022; 77031-77063; 77071-77086; 77261-77799; 78000-79999; 96401-96571; R0070-R0076; G6001-G6017
Lab/Pathology 300–307; 309–312; 314; 319
36415; 36416; 80047-80440; 80500-80502; 81000-81408; 81410-87999; 88000-88399; 88720-88749; 89049-89240; 89250-89398; P2028-P9615; 0001M-0010M
6

Analytic Methodology 2016V1.0 26
4.4 Professional procedures detailed service categories mapping to CPT/HCPCS codes
HCCI Sub-Detailed Service
Category
HCCI Detailed
Service
Category CPT/HCPCS Code Range
Administered Drugs, including
Chemo Drugs
Administered
Drugs
B4164-B5200, C9113-C9257, C9275,
C9279, C9285-C9441, C9497, G0260,
G0293, G3001, G9017-G9036, J0000-
J3520, J3570-J9999; M0075-M0076,
M0300, Q0138-Q0181, Q0515, Q2004-
Q2028, Q2043, Q2049-Q2050, Q3025-
Q3028, Q4074-Q4082, S0012-S0194,
S0197, S4989-S5014, S5550-S5553,
S5565-S5571
Administration of Drugs Administration
of Drugs
90460-90461, 90471-90474, 96360-96440,
96446-96450, C8957, G0008-G0010,
G0259, G8006, G8009, G8012, G8152,
G8170, G8219, G8450, G8459, G8461,
G8463, G8468, G8473, G8482, G8506,
G8579, G8582, G8585, G8598, G8600,
G8629, G8630, G8633, G8696, G8702,
G8709-G8711, G8799, G8809, G8816,
G8859-G8860, G8864, G8868-G8870,
G8895, G8916, G8917, G8927, G8935,
G8967, G9141, G9189, G9201, G9205,
G9206, G9221-G9223, G9245, G9300-
G9302, G9315, J3530, J3535, Q0081-
Q0085, Q0510-Q0514, S2083, S4981,
S5035, S5036, S5497-S5523, S9061,
S9325-S9379, S9401, S9430, S9490-S9504,
S9537-S9810, T1502-T1503
Allergy Other 95004-95079, 95115-95199
Anesthesia Anesthesia 00100-01999, 99100-99140

Analytic Methodology 2016V1.0 27
HCCI Sub-Detailed Service
Category
HCCI Detailed
Service
Category CPT/HCPCS Code Range
Cardiovascular Other 92920-92944, 92950-92979; 92986-92998;
93000-93355, 93451-93583, 93600-93799,
93875-93998, G9157
Consultations Other 99241–99255
Emergency Room/Critical
Care
Other 99281–99292, 99466–99476
Immunizations Other 90281-90399, 90465-90470, 90476-90749,
G9142, Q2034-Q2039, S0195
Inpatient Visits Other 99217-99239, 99304-99340, 99477-99480
Office Visits Office Visits 99201–99215, 99341–99350
Ophthalmology Other 92002–92499, V2020–V2799
Pathology/Lab Pathology/Lab 80047-89398, P2028-P9615, 0001M-
0010M
Physical Medicine Other 97001-98943
Preventive Visits Preventive
Visits
99381–99397, 99460–99464
Psychiatry & Biofeedback Other 90785-90911; 0359T-0374T
Radiology Radiology 70010-79999, A9520, A9575, A9599,
R0070-R0076; 0347T-0354T
Surgery Surgery 10021-69990 excluding 36415-36416,
0016T-0261T, 0308T, 0375T-0377T,
0387T-0393T
Miscellaneous Professional
Services
Other Other codes not listed above
Analytic Methodology 2016V1.0 28
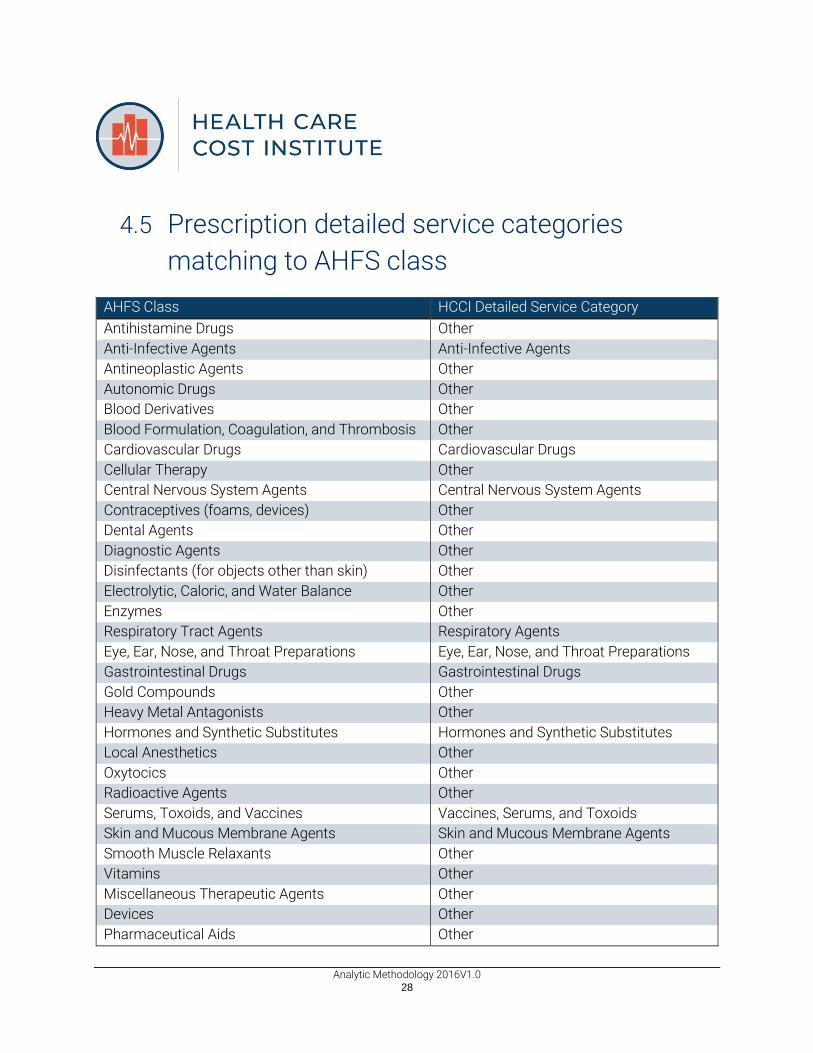
4.5 Prescription detailed service categories
matching to AHFS class
AHFS Class HCCI Detailed Service Category
Antihistamine Drugs Other
Anti-Infective Agents Anti-Infective Agents
Antineoplastic Agents Other
Autonomic Drugs Other
Blood Derivatives Other
Blood Formulation, Coagulation, and Thrombosis Other
Cardiovascular Drugs Cardiovascular Drugs
Cellular Therapy Other
Central Nervous System Agents Central Nervous System Agents
Contraceptives (foams, devices) Other
Dental Agents Other
Diagnostic Agents Other
Disinfectants (for objects other than skin) Other
Electrolytic, Caloric, and Water Balance Other
Enzymes Other
Respiratory Tract Agents Respiratory Agents
Eye, Ear, Nose, and Throat Preparations Eye, Ear, Nose, and Throat Preparations
Gastrointestinal Drugs Gastrointestinal Drugs
Gold Compounds Other
Heavy Metal Antagonists Other
Hormones and Synthetic Substitutes Hormones and Synthetic Substitutes
Local Anesthetics Other
Oxytocics Other
Radioactive Agents Other
Serums, Toxoids, and Vaccines Vaccines, Serums, and Toxoids
Skin and Mucous Membrane Agents Skin and Mucous Membrane Agents
Smooth Muscle Relaxants Other
Vitamins Other
Miscellaneous Therapeutic Agents Other
Devices Other
Pharmaceutical Aids Other

Analytic Methodology 2016V1.0 29
4.6 Diabetes codes
HCCI used the following codes to identify members with diabetes. The ICD-9-CM Codes
were identified according to guidelines set down in the Dictionary of Disease
Management Terminology (DDMT). The ICD-10-CM Codes were based on the CMS
publication of the code descriptions and the General Equivalence Mappings (GEMs).
Description ICD-9-CM Codes
Diabetes mellitus 250.xx
Polyneuropathy in diabetes 357.2
Diabetic retinopathy 362.0X
Diabetic cataract 366.41
Insulin pump status V45.85
Fitting/adjustment of insulin pump, insulin pump titration V53.91
Encounter for insulin pump training V65.46
Mechanical complications, due to insulin pump 996.57
Description ICD-10-CM Codes
Type 1 diabetes mellitus E10
Type 2 diabetes mellitus E11
Other specified diabetes mellitus E13
Presence of insulin pump (external) (internal) Z96.41
Encounter for fitting and adjustment of insulin pump Z46.81
Breakdown (mechanical) of insulin pump, initial encounter T85.614A
Displacement of insulin pump, initial encounter T85.624A
Leakage of insulin pump, initial encounter T85.633A
Other mechanical complication of insulin pump, initial
encounter T85.694A
Description CPT/HCPCS Codes
Diabetic outpatient self–management training services,
individual or group G0108–G0109
Insulin injection, per 5 units J1815
Destruction of extensive or progressive retinopathy, one or
more sessions, cryotherapy, diathermy, photocoagulation 67227–67228

Analytic Methodology 2016V1.0 30
4.7 Hypertension codes
HCCI used the following codes to identify members with hypertension. The ICD-9-CM
Codes were identified according to guidelines set down in the Clinical Classifications
Software (CCS). The ICD-10-CM Codes were based on the CMS publication of the code
descriptions and the General Equivalence Mappings (GEMs).
Description ICD-9-CM Codes
Essential hypertension 401.1; 401.9
Hypertension with complications and secondary hypertension 401.0; 402.xx; 403.xx;
404.xx; 405.xx; 437.2
Description ICD-10-CM Codes
Essential hypertension I10
Hypertension with complications and secondary hypertension I11; I12; I13; I15; I67.4;
N26.2

Analytic Methodology 2016V1.0 31
4.8 Claims completion example
The following is an example of the estimation of incurred but not paid claims. Please note
the numbers in this section are for illustration purposes only: They are not actual data.
Month Paid $ to Date [1] Completion Factor [2] Estimated Incurred
Jan-15 $ 21,675,364 0.998 $ 21,727,186
Feb-15 $ 17,339,406 0.996 $ 17,402,178
Mar-15 $ 18,271,837 0.999 $ 18,289,514
Apr-15 $ 20,286,106 0.997 $ 20,339,892
May-15 $ 19,356,580 0.996 $ 19,426,260
Jun-15 $ 17,751,856 0.989 $ 17,945,588
Jul-15 $ 18,256,838 0.995 $ 18,355,884
Aug-15 $ 17,732,384 0.981 $ 18,083,643
Sep-15 $ 17,489,161 0.946 $ 18,481,283
Oct-15 $ 16,893,933 0.932 $ 18,120,909
Nov-15 $ 15,981,513 0.855 $ 18,681,099
Dec-15 $ 11,217,486 0.622 $ 18,028,238
Total $ 212,252,463 0.944 $ 224,881,674
Notes: [1] $ incurred in the month, paid through 6/30/2016; [2] Completion factors will be
developed using a lag triangle method

Analytic Methodology 2016V1.0 32
4.9 Population weighting example
The following is an example of how population adjustment weights were calculated.
Please note the numbers in this section are for illustration purposes only: They are not
actual data.
[A] [B]
[C]=[A]/[B] ACS HCCI
CBSA–MSA State Gender Age Group ESI ESI Population
Adjustment Weight
Albany, GA Metro Area GA Male 1 1,779 508 3.50
Albany, GA Metro Area GA Male 2 4,809 1457 3.30
Albany, GA Metro Area GA Male 3 2,836 961 2.95
Albany, GA Metro Area GA Male 4 7,324 2233 3.28
Albany, GA Metro Area GA Male 5 10,134 3001 3.38
Albany, GA Metro Area GA Female 1 1,620 459 3.53
Albany, GA Metro Area GA Female 2 4,580 1387 3.30
Albany, GA Metro Area GA Female 3 3,074 939 3.27
Albany, GA Metro Area GA Female 4 9,517 3039 3.13
Albany, GA Metro Area GA Female 5 11,723 4048 2.90
Rural (Non-CBSA) AZ Male 1 5,514 2,097 2.63
Rural (Non-CBSA) AZ Male 2 14,838 4,619 3.21
Rural (Non-CBSA) AZ Male 3 6,030 2,593 2.33
Rural (Non-CBSA) AZ Male 4 17,573 6,237 2.82
Rural (Non-CBSA) AZ Male 5 26,491 7,125 3.72
Rural (Non–CBSA) AZ Female 1 5,604 1,919 2.92
Rural (Non–CBSA) AZ Female 2 14,473 4,384 3.30
Rural (Non-CBSA) AZ Female 3 5,621 2,442 2.30
Rural (Non-CBSA) AZ Female 4 20,293 5,808 3.49
Rural (Non-CBSA) AZ Female 5 29,819 7,369 4.05

Analytic Methodology 2016V1.0 33
4.10 Population weighting annual adjustment
factors
Year Annual ACS ESI
Population
Annual Population Adjustment Factor
2012 153,257,059 1.0016
2013 152,888,235 0.9992
2014 154,990,164 1.0130
2015 154,990,164 1.0130

Analytic Methodology 2016V1.0 34
5. Notes
1 Congressional Research Service. Private Health Insurance Premiums and Rate Reviews
[Internet]. Washington (DC): CRS; 2011 Jan [cited 2012 May 11]. Available from:
http://assets.opencrs.com/rpts/R41588_20110111.pdf.
2 American Academy of Actuaries. Critical Issues in Health Reform: Premium Setting in
the Individual Market [Internet]. Washington (DC): AAA; 2010 March [cited 2012 May 11].
Available from: http://www.actuary.org/pdf/health/premiums_mar10.pdf.
3 Congressional Budget Office. Key Issues in Analyzing Major Health Insurance
Proposals, Chapter 3, Factors Affecting Insurance Premiums [Internet]. Washington (DC):
CBO; 2008 December [cited 2012 May 11]. Available from:
http://www.cbo.gov/sites/default/files/ cbofiles/ftpdocs/99xx/doc9924/ 12-18-
keyissues.pdf. For additional information on insurers’ administrative costs and profits,
see Centers for Medicare & Medicaid Services. National Health Expenditure Accounts:
tables 2010 [Internet]. Baltimore (MD): CMS; 2012 Jan [cited 2012 May 11]. Available
from: http://www.cms.gov/Research-Statistics-Data-and-Systems/Statistics-Trends-and-
Reports/NationalHealthExpendData/Downloads/tables.pdf.
4 Centers for Medicare and Medicaid Services. Medicare Claims Processing Manual:
Chapter 26: Completing and Processing Form CMS-1500 Data Set [Internet]. Baltimore
(MD): CMS; 2011 Dec [cited 2012 May 18]. Available from:
https://www.cms.gov/Regulations-and-
Guidance/Guidance/Manuals/Downloads/clm104c26.pdf.

Analytic Methodology 2016V1.0 35
5 In the 2013 Health Care Cost and Utilization Report and 2014 Health Care Cost and
Utilization Report, this subservice category is called “acute inpatient”. In the 2012 Health
Care Cost and Utilization Report and the Children’s Health Spending Report: 2008–2012
this subservice category was called “inpatient subset”. In the Health Care Cost and
Utilization Report: 2011, this was labeled “inpatient without SNF”.
6 McEvoy, Gerald K., ed. AHFS Drug Information 2010. Bethesda, MD: American Society of
Health-System Pharmacists, 2010. Print.
7 Duncan, I.G., ed. Dictionary of Disease Management Terminology. Washington, DC:
Disease Management Association of America, 2004.
8 Health Plan Employer Data and Information Set (HEDIS), Washington, DC: National
Committee for Quality Assurance, 2013.
9 Clinical Classifications Software (ICD-9-CM) Summary and Download – Redirect.
Agency for Healthcare Research and Quality, Rockville, MD: 2012 Dec. Available from:
http://www.ahrq.gov/research/data/hcup/ccs.html.
10 The hypertension flag is new to the HCCI benchmarking effort of chronic conditions
categories. The efficacy of our methodology is still being explored. HCCI welcomes
feedback from area experts.
11 These are referred to as “outpatient other” counts in 2014 Health Care Cost and
Utilization Report, 2013 Health Care Cost and Utilization Report, 2012 Health Care Cost
and Utilization Report, Health Care Cost and Utilization Report: 2011 and as “outpatient
procedure” counts in Health Care Cost and Utilization Report: 2010.

Analytic Methodology 2016V1.0 36
12 Dunn, Abe, Eli Liebman, and Adam Hale Shapiro. "Developing a Framework for
Decomposing Medical-Care Expenditure Growth: Exploring Issues of
Representativeness." Measuring Economic Sustainability and Progress. 2012.
13 Bluhm, W. F., ed. Group Insurance. 4th ed. Winsted: ACTEX Publications, Inc; 2003. P.
811-27. The specific methodology is proprietary and not owned by HCCI.
14 U.S. Department of Commerce. U.S. Census Bureau. American Community Survey
Office. Data and Documentation [Internet]. Washington (DC): Census; 2010 March [cited
2012 May 11]. Available from:
http://www.census.gov/acs/www/data_documentation/data_main.
15 To calculate total prices paid for total expenditures per capita, the insured (co-
payments, coinsurance, and deductibles) and payer expenditures per capita are summed.
For facility and professional procedure claims, prices paid are calculated for all members
who have medical insurance. For prescription claims, prices paid are calculated for all
members with medical and prescription insurance.