
2016 Half Year Results - Nexans 2016_ ppt10.pdfNexans cables to connect Beatrice Offshore Windfarm...
35
2016 Half Year Results Photo Credits: David Beman, a Nexans employee July 28, 2016
-
Upload
nguyendang -
Category
Documents
-
view
215 -
download
0
Transcript of 2016 Half Year Results - Nexans 2016_ ppt10.pdfNexans cables to connect Beatrice Offshore Windfarm...
2016 Half Year Results
Photo Credits: David Beman, a Nexans employee
July 28, 2016

Safe Harbor ● Forward-looking statements in this presentation are subject to various risks and uncertainties that could affect the
Company's future performance. Actual results could therefore differ significantly from those currently expected or anticipated.
● Readers are also invited to log onto the Group's website where they can view and download the press release of the annual results and the 2015 financial statements, which include a description of the Group’s risk factors. Readers can also view and download the 2016 half-year financial statements, which include information on the investigations launched in 2009 on anti-competitive behavior in the submarine and underground high-voltage cable sector in various countries (see Note 15a, “Antitrust Investigation”).
● The main uncertainties related to the second half of 2016 primarily relate to : depressed demand in Oil & Gas related markets which could deteriorate further, potentially impacting several businesses in the Group,
and in particular the US based Amercable business which is also impacted by similar factors in the mining segment depressed demand in shipyards in China and Korea could impact order entry, and therefore revenues for subsequent periods impact of political instability and economic contraction in Brazil where demand levels may not stabilize and customer credit risks may
increase further. Brexit impacts which could include decreased growth in European economies generally, and in relation to the UK, notwithstanding the
absence of local cable production by the Group, (i) possible delays in financing of large infrastructure projects ongoing or planned in that country which could result in slow down of orders for the HV business, (ii) and possible exchange rate fluctuations which could penalize other exports to the UK.
economic developments in Greece and their impact on the Group's operations in that country; the economic and political environment in certain emerging markets where Nexans makes sales including in particular Lebanon, Libya
and Russia possible negative impact of recent or ongoing plant closures and reorganizations and streamlining of support functions increasing costs of pension obligations resulting from declining interest rates demand stagnation or decline which for certain factories could result in critical capacity underutilization.
INVESTOR RELATIONS: Michel GÉDÉON +33 1 73 23 85 31 [email protected] Julien CATEL +33 1 73 23 85 24 [email protected]
2 I 2016 Half Year results

● Net debt at 373 M€, reduced by 30% over the last 12 months ● Stronger balance sheet following 250 M€ bond issue ● Financial Flexibility reinforced
Limited Cash consumption
in line with expectations
● EBITDA up 22% at 203 M€ ● Operating margin at 135 M€, up to 5.9% of Sales at constant metal
price versus 4.0% in June 2015 ● 74 M€ contribution from Strategic Initiatives ● Group back to positive net result
Strategic Initiatives delivering
strong margin improvement
Key Take-aways
3 I
● Sales of 2,951 M€ ● 0.2% organic growth ● Subsea cables down -13% in line with expected projects phasing;
strong order intake in projects. Other activities up 2.3%
2016 Half Year results
Slight organic growth despite
unfavorable Project phasing

Half year 2016 highlights
Business review
Key Financials
Outlook
Appendix
Agenda
1
2
3
4
5

1 First half 2016 Highlights Arnaud POUPART-LAFARGE, CEO

37%
23%
28%
12%
Transmission, distribution & Operators Industry Distributors & Installers Others
Nexans, a global cable solution provider Well positioned on its four end-markets
6 I 2016 Half Year results
Sales by business segments
Energy and data infrastructures
Energy resources
Transport
Buildings
● Power transmission ● Power/data distribution ● Accessories
● Residential ● Commercial ● Data
● Mining ● O&G ● Renewables ● Power plants
● Aerospace ● Railways, city rail ● Automotive ● Shipbuilding
€3 bn Sales* in June 2016
1
End markets
HIGHLIGHTS
* Sales at actual metal prices

Nexans brings Energy to Life Energy transition and efficiency
7 I 2016 Half Year results
Reinforcing power grid and ensuring security of power supply
Two world records for Norway’s BKK grid connection: deepest and longest 420 kV XLPE submarine cable system
Reinforcing the grid in western Norway will allow to meet growing demand for electricity
1
HIGHLIGHTS

Nexans brings Energy to Life Energy transition and efficiency
8 I 2016 Half Year results
Connecting wind farms to the grid
Nexans cables to connect Beatrice Offshore Windfarm to the Scottish grid
Once fully operational, Beatrice may cover the energy needs of more than 450,000 British households
1
HIGHLIGHTS
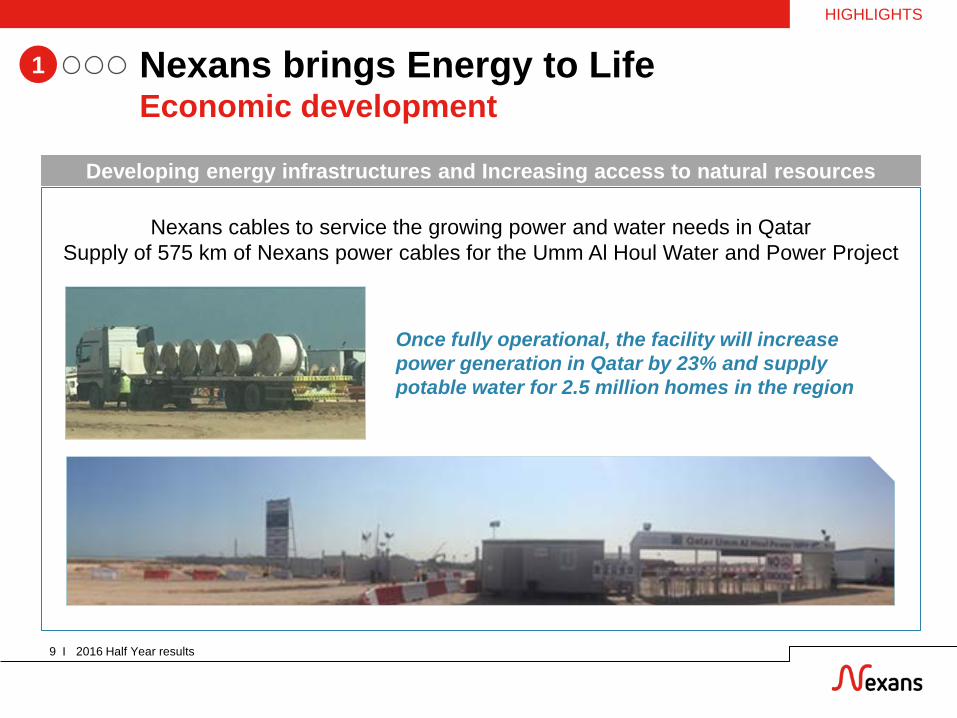
Nexans brings Energy to Life Economic development
9 I 2016 Half Year results
Developing energy infrastructures and Increasing access to natural resources
Nexans cables to service the growing power and water needs in Qatar Supply of 575 km of Nexans power cables for the Umm Al Houl Water and Power Project
1
HIGHLIGHTS
Once fully operational, the facility will increase power generation in Qatar by 23% and supply potable water for 2.5 million homes in the region
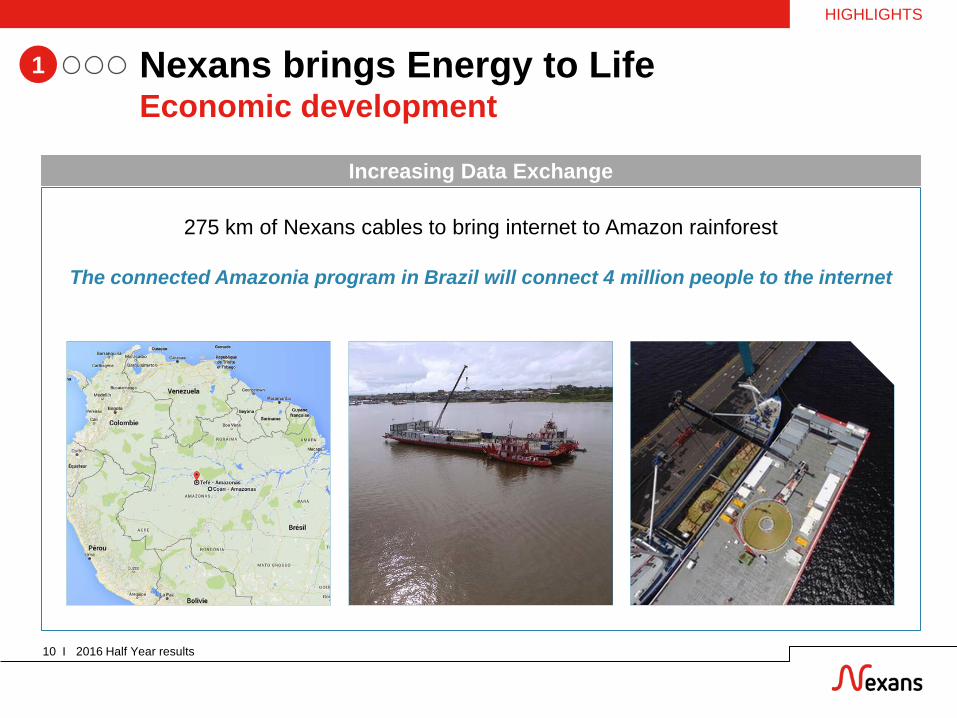
Nexans brings Energy to Life Economic development
10 I 2016 Half Year results
Increasing Data Exchange
275 km of Nexans cables to bring internet to Amazon rainforest
The connected Amazonia program in Brazil will connect 4 million people to the internet
1
HIGHLIGHTS

Nexans brings Energy to Life Economic development
11 I 2016 Half Year results
Supplying umbilicals for offshore Oil fields
Nexans umbilicals achieve global reach with new project in Australia
Nexans umbilical and accessories to develop the Greater Enfield project, offshore oil field located 60 km off the coast of Exmouth, Western Australia
1
HIGHLIGHTS
© Woodside

Nexans brings Energy to Life Innovation
12 I 2016 Half Year results
At the forefront of technology to meet customer needs
1
● Nexans drives the transition to higher voltage wind farm networks with its new range of 72.5 kV cable and power accessories
● Nexans continues to deploy EASYCALC™ cable sizing dematerialized tool
LANmark-OF ENSPACE ● Nexans new fibre system specifically designed for ultra high density
data centre applications
WINDLINK® ● Nexans new low voltage aluminum torsion-resistant loop cable solution for wind turbines
HIGHLIGHTS

2 Business Review Arnaud POUPART-LAFARGE, CEO
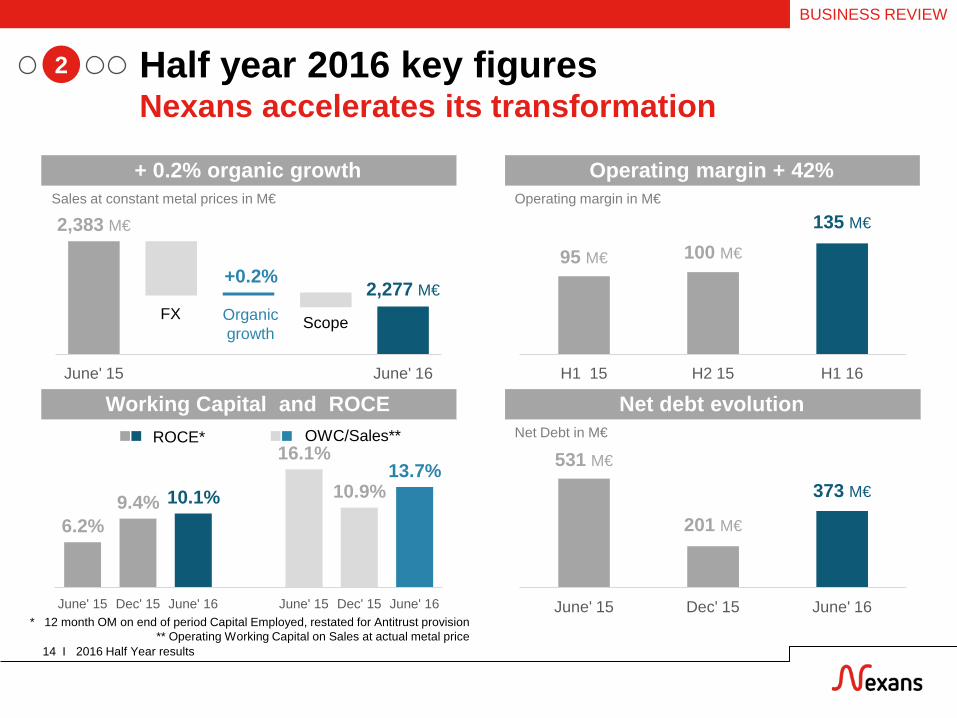
531 M€
201 M€
373 M€
June' 15 Dec' 15 June' 16
Sales at constant metal prices in M€
2,383 M€
2,277 M€
June' 15 June' 16
Net debt evolution
Half year 2016 key figures Nexans accelerates its transformation
2016 Half Year results 14 I
Working Capital and ROCE
+ 0.2% organic growth Operating margin + 42%
+0.2%
Organic growth
FX Scope
95 M€ 100 M€
135 M€
H1 15 H2 15 H1 16
Net Debt in M€
2
6.2% 9.4% 10.1%
16.1%
10.9% 13.7%
June' 15 Dec' 15 June' 16 June' 15 Dec' 15 June' 16 * 12 month OM on end of period Capital Employed, restated for Antitrust provision
** Operating Working Capital on Sales at actual metal price
Operating margin in M€
BUSINESS REVIEW
ROCE* OWC/Sales**

10%
18%
31%
13%
12%
9%
6%
Harnesses
High Voltage
Europe
NAM
APAC
MERA
SAM
Sales by geographies A contrasted business environment
2016 Half Year results 15 I
% of Standard Sales H1 2016 Organic Growth
3.8%
-6.1%
0.8%
2.3%
-10.7%
15.6%
12.5%
Harnesses
High Voltage
Europe
NAM
APAC
MERA
SAM
2
BUSINESS REVIEW

Distributors & Installers Margin improvement in all areas
2016 Half Year results 16 I
Business Update
Operating Margin : 52 M€
Margins
● Operating margin rate continues to progress as strategic initiatives and business mix contribute positively
BUILDING: Sales up 0.4% organically ● Positive momentum confirmed in MERA and SAM ● Signs of recovery in NAM and APAC ● Conditions remain difficult in Europe
LAN and CABLING SYSTEMS: +15.8% organic growth ● Strong momentum, in particular in the US and in China
577 559
580
H1' 15 H2' 15 H1' 16
-4.8% -0.5% +3.9%
Sales at constant metal: 580 M€
Sales
Organic growth
22 41 52
3.8%
7.4% 9.0%
H1' 15 H2' 15 H1' 16
Operating margin
OM Rate
37 27
14 14 9
-5.1 %
8.9% 9.5% 13.5% 4.8%
Europe NAM APAC MERA SAM
2
BUSINESS REVIEW
Organic growth % of Sales at constant metal
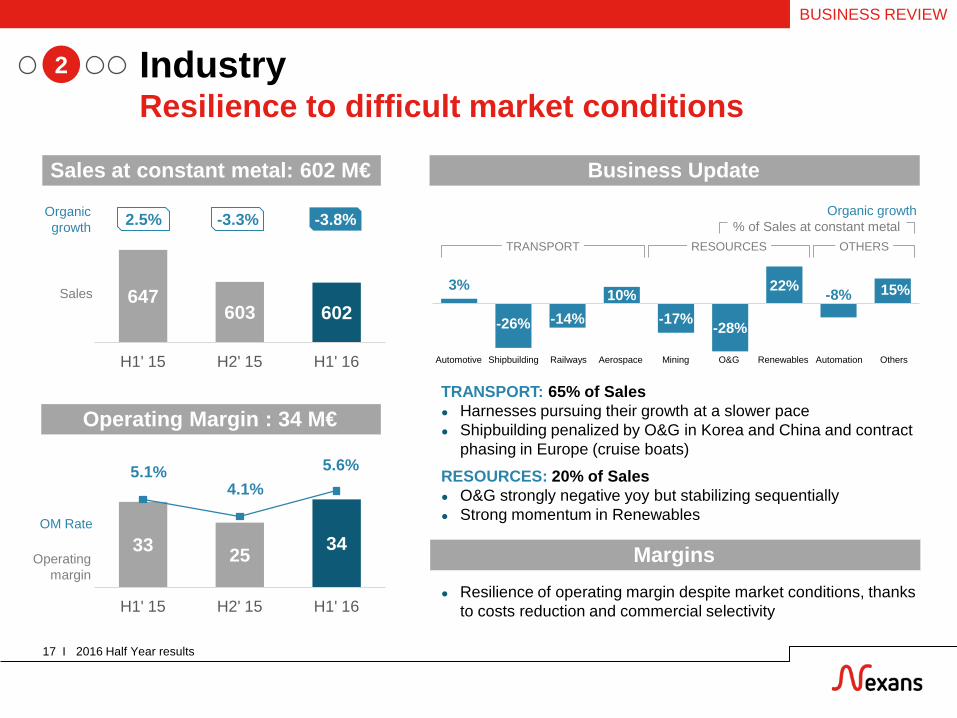
3%
-26% -14% 10%
-17% -28%
22% -8% 15%
Industry Resilience to difficult market conditions
2016 Half Year results 17 I
Business Update
Operating Margin : 34 M€ TRANSPORT: 65% of Sales ● Harnesses pursuing their growth at a slower pace ● Shipbuilding penalized by O&G in Korea and China and contract
phasing in Europe (cruise boats)
RESOURCES: 20% of Sales ● O&G strongly negative yoy but stabilizing sequentially ● Strong momentum in Renewables
647 603 602
H1' 15 H2' 15 H1' 16
Sales at constant metal: 602 M€
Sales
33 25 34
5.1% 4.1%
5.6%
H1' 15 H2' 15 H1' 16
Operating margin
OM Rate
Organic growth % of Sales at constant metal
Margins ● Resilience of operating margin despite market conditions, thanks
to costs reduction and commercial selectivity
Automotive Shipbuilding Railways Aerospace Mining O&G Renewables Automation Others
TRANSPORT RESOURCES OTHERS
2
2.5% -3.3% -3.8% Organic growth
BUSINESS REVIEW

2000 2015
Transmission Distribution & Operators Positive momentum masked by Project phasing
2016 Half Year results 18 I
Market Drivers
Operating Margin : 63 M€
● Extension of the Transmission network to cope with Need for an interconnected European grid Development of Renewable Energy Sources
● Upgrade of Distribution networks Replacement of aging grid Development of Power consumption
1,012 923 945
H1' 15 H2' 15 H1' 16
+1% -3.5% -0.7%
Sales at constant metal: 945 M€
Sales
Organic growth
54 54 63
5.4% 5.8% 6.7%
H1' 15 H2' 15 H1' 16
Operating margin
OM Rate
POWER DEMAND WIND POWER
2
0
100
200
300
1990 2000 2010 2020 2030
Historical Projected
Power sector CO2 emissions
Electricity demand
433 GW
17
Source IEA/ WEO 2015 Cumulative global Wind Power Capacity Source GWEC
BUSINESS REVIEW

TD&O / Transmission Increasing order backlog
2016 Half Year results 19 I
Land High Voltage Order backlog
● Solid activity growth thanks to the order intake of 2015 ● As expected, Operating margin impacted negatively by
sub-optimal utilization of the US plant
Submarine Hybrid cables
Land
-6% -24% 17%
Organic Growth : -6.5%
Organic growth
Sub-sea
● Activity in Submarine High Voltage back to normal in Q2 2016 after low first quarter due to project phasing
● Hybrid Cables suffering from upstream O&G trough ● Operating margin negatively impacted by 1st quarter
maintenance and business mix year over year ● Order backlog keeps growing ; strong order intake in
umbilicals
2
June' 15 Dec' 15 June' 16 Submarine Hybrid Land
BUSINESS REVIEW
Years of activity
1.9x 2.1x 2.3x
Sales
Order Backlog

TD&O / Utilities and Operators Stronger Utility call-offs in first half
2016 Half Year results 20 I
UTILITIES: +4.2% organic growth ● Recovery in Europe ● Strong momentum confirmed in MERA .
SAM up 21% thanks to OHL projects in Brazil in particular
OPERATORS: down -2.4% organically ● Good level of activity in Europe after a slow start in Q1 ● Difficult market conditions in all other areas
Margins
● Operating margin rate doubled thanks to the recovery of volumes and the success of industrial and commercial efficiency programs
Operating Margin
H1' 15 H2' 15 H1' 16
-4.2% -2.9% +3.2%
Organic growth : +3.2%
Sales
Organic growth
H1' 15 H2' 15 H1' 16
Operating margin
OM Rate
58
13 12 12 6 1.6 %
22.8%
-12.7%
18.2%
-4.2%
Europe MERA APAC SAM NAM
Business Update
Organic growth % of Sales at constant metal
2
BUSINESS REVIEW

Strategic initiatives delivered as expected to overcome volume & price pressure effects
2016 Half Year results 21 I
2
95
135
(5)
74
(29)
June' 2015 June' 2016
FX & scope STRATEGIC INITIATIVES
PRICE COST SQUEEZE
Operating reserves & others*
Operating margin evolution in M€
BUSINESS REVIEW
(*) Note: Including +2 M€ impact from 2015 Impairments

Strategic Initiatives progressing as planned
2016 Half Year results 22 I
2
Fixed Cost Reduction
11 M€
● 2015 European plan starting to be implemented
● OPEX and other plan progressing as planned
Variable Cost
Reduction
25 M€
● Purchasing savings continue to deliver as planned
● Industrial saving plans back on track after 2015 difficulties related to negative volumes have been overcome
Market Leadership
38 M€
● LAN/Cabling Systems and Utilities
● Extended selective portfolio approach
BUSINESS REVIEW
Profitable Growth
Product Customer Optimization,
Service development
2013 European plan
2015 European plan
OPEX and other plans
Purchasing Saving
Industrial Efficiency

3 Key financials Nicolas BADRÉ, CFO
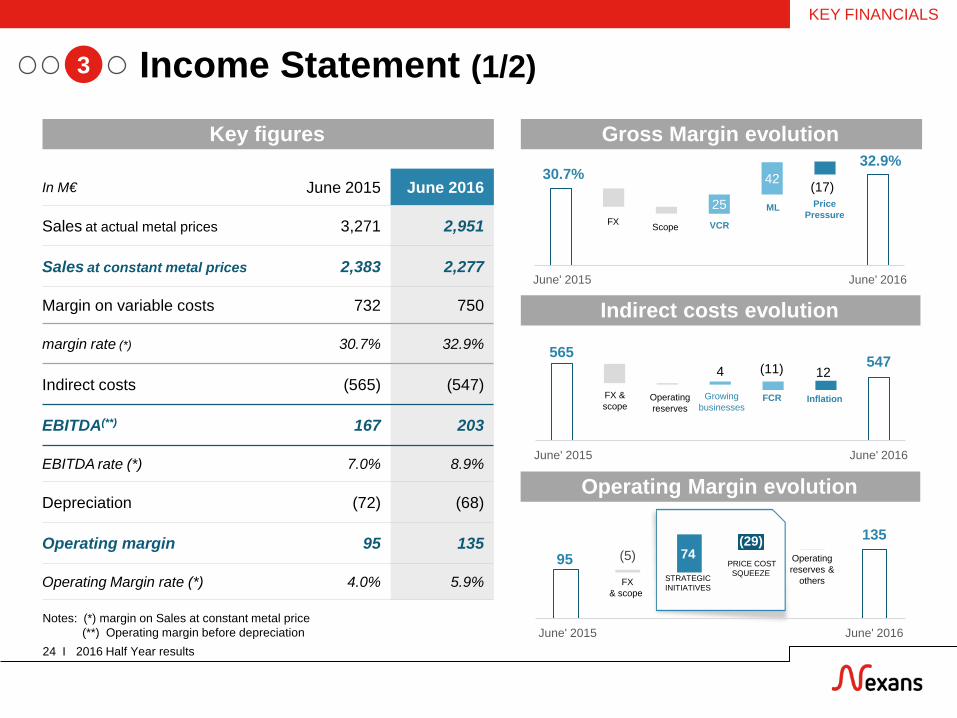
Income Statement (1/2)
2016 Half Year results 24 I
In M€ June 2015 June 2016
Sales at actual metal prices 3,271 2,951
Sales at constant metal prices 2,383 2,277
Margin on variable costs 732 750
margin rate (*) 30.7% 32.9%
Indirect costs (565) (547)
EBITDA(**) 167 203
EBITDA rate (*) 7.0% 8.9%
Depreciation (72) (68)
Operating margin 95 135
Operating Margin rate (*) 4.0% 5.9%
Indirect costs evolution
Operating Margin evolution
3
Key figures Gross Margin evolution
Notes: (*) margin on Sales at constant metal price (**) Operating margin before depreciation
95 135
(5) 74 (29)
June' 2015 June' 2016
FX & scope
STRATEGIC INITIATIVES
PRICE COST SQUEEZE
Operating reserves &
others
565 547 4 (11) 12
June' 2015 June' 2016
30.7% 32.9%
25
42 (17)
June' 2015 June' 2016
FX Scope
ML
VCR
Price Pressure
FX & scope
Operating reserves
FCR Growing businesses
Inflation
KEY FINANCIALS

Income Statement (2/2)
2016 Half Year results 25 I
From Operating Margin to Operating Income
In M€ June 2015 June 2016
Operating margin 95 135
Restructuring (98) (13)
Others (1) (32)
Operating income (4) 90
Financial charge (45) (44)
Income before tax (49) 46
Income tax (10) (17)
Net income from operations (59) 29
Net income Group share (58) 30
In M€ June’15 June’16
Cost of debt (38) (30)
Net foreign exchange gain loss 1 (6)
Interest on Pension (5) (5)
Others (3) (3)
Financial charge (45) (44)
In M€ June’15 June’16
Core exposure Impact (1) (25)
Restructuring (98) (13)
Net asset Impairment - -
Provision for Anti-trust investigation 1 (6)
Change in fair value of metal derivatives - (2)
Others (1) 1
Adjustments to operating margin (99) (45)
3
Key figures
Financial charge
KEY FINANCIALS

201
373
(123)
60 40
230 (16) (19)
Dec' 2015
June' 2016
531
373
(235) 161
93 (141)
(48) 12
June'15 June' 2016
Focus on cash management
2016 Half Year results 26 I
OWC 6 month evolution – cash impact
OCF
FX & Other
Non Operating
WC
3
Net Debt last 6 month evolution in M€
OWC on Sales - excluding Projects
KEY FINANCIALS
Net Debt last 12 month evolution in M€
OCF
Restructuring cash-out
FX & Other Non
Operating WC
CAPEX
Operating Working Capital
CAPEX
CAPEX
Operating Working Capital
20% 18% 15%
June'14 June'15 June'16
Operating Working
Capital
OWC/Sales
Restructuring cash-out
Evolution of Operating Working Capital excluding Project activities
Submarine HV Projects
Land HV
Down-payments
Cables activities

Balance Sheet strength
2016 Half Year results 27 I
3
Net debt and gearing ratios
Leverage ratios
Balance Sheet Interest Charge over EBITDA 28% 27% 24%
15%
Dec'13 Dec'14 Dec'15 June'16
21% 32%
16% 29%
Dec'13 Dec'14 Dec'15 June'16
Net Debt over Equity < 30%
1.1x 1.6x
0.6x
1.0x
Dec'13 Dec'14 Dec'15 June'16
Net Debt over LTM EBITDA = 1 year
Interest/ EBITDA
Interest charge
Net debt
Gearing
Net debt
Leverage
KEY FINANCIALS
In M€ Dec’ 2015
June 2016
Long term fixed assets
Of which goodwill 1,643
250 1,614
247
Deferred Tax 192 189
Non-current Assets 1,835 1,803
Working Capital 405 675
Total to finance 2,240 2,478
Net financial debt 201 373
Reserves Of which: - restructuring - pension & jubilee
690 128 453
700 105 481
Deferred tax liabilities 84 87
Derivative liability non current 38 17
Shareholders’ equity and minority interests 1,227 1,301
Total financing 2,240 2,478
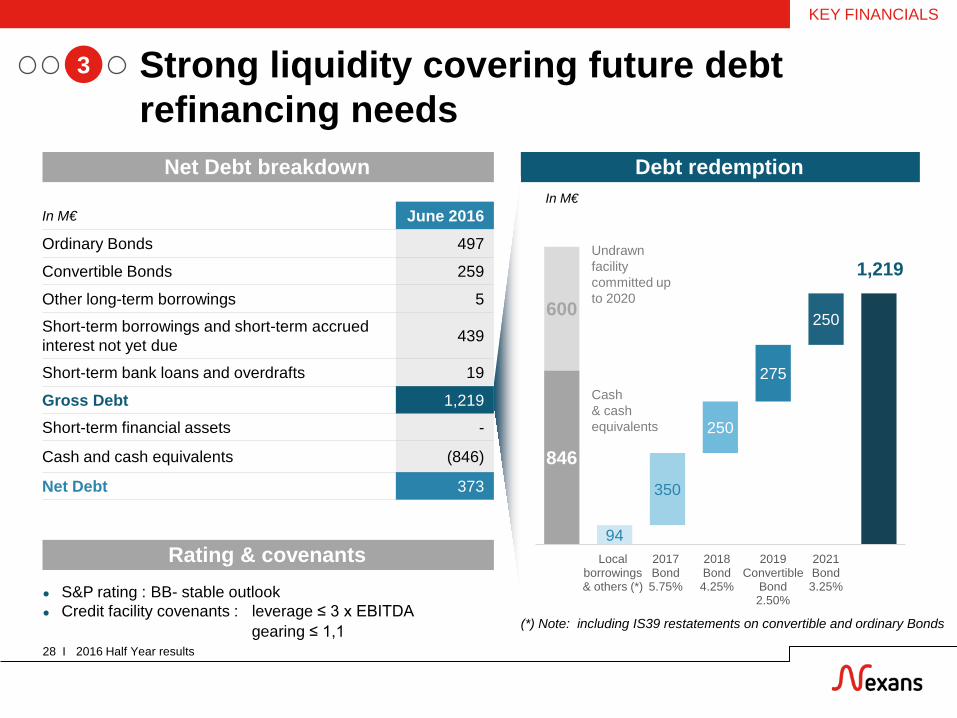
In M€ June 2016 Ordinary Bonds 497
Convertible Bonds 259
Other long-term borrowings 5
Short-term borrowings and short-term accrued interest not yet due 439
Short-term bank loans and overdrafts 19
Gross Debt 1,219
Short-term financial assets -
Cash and cash equivalents (846)
Net Debt 373
Net Debt breakdown Debt redemption
846
94
1,219
600
350
250
275
250
Local borrowings & others (*)
2017 Bond 5.75%
2018 Bond 4.25%
2019 Convertible
Bond 2.50%
2021 Bond 3.25%
Strong liquidity covering future debt refinancing needs
2016 Half Year results 28 I
● S&P rating : BB- stable outlook ● Credit facility covenants : leverage ≤ 3 x EBITDA
gearing ≤ 1,1
3
Rating & covenants
(*) Note: including IS39 restatements on convertible and ordinary Bonds
Cash & cash equivalents
Undrawn facility committed up to 2020
KEY FINANCIALS
In M€

4 Outlook Arnaud Poupart-Lafarge, CEO
Priorities ahead
● Keep momentum on strategic initiatives, in uncertain environment
● Capture profitable growth through continued Product Customer Optimization
● Maintain focus on cash control
● Explore available options for underperforming businesses
30 I 2016 Half Year results
4
OUTLOOK
Confidence in delivering in due time the full potential from strategic initiatives

Appendices

Sales and profitability by segment
2016 Half Year results 32 I
June 2015 June 2016
In M€ Sales OM OM % Sales OM OM %
Transmission, Distribution & Operators 1,012 54 5.4% 945 63 6.7%
Industry 647 33 5.1% 602 34 5.6%
Distributors & Installers 577 22 3.8% 580 52 9.0%
Other 147 (14) n/a 150 (14) n/a
TOTAL GROUP 2,383 95 4.0% 2,277 135 5.9%
APPENDICES

Impact of foreign exchange and consolidation scope
2016 Half Year results 33 I
Sales at constant metal prices, in M€ June 2015 FX Organic
growth Scope June 2016
Transmission, Distribution & Operators 1,012 (47) (7) (14) 945
Industry 647 (12) (24) (8) 602
Distributors & Installers 577 (23) 22 4 580
Other 147 (6) 15 (6) 150
TOTAL GROUP 2,383 (88) 6 (24) 2,277
APPENDICES
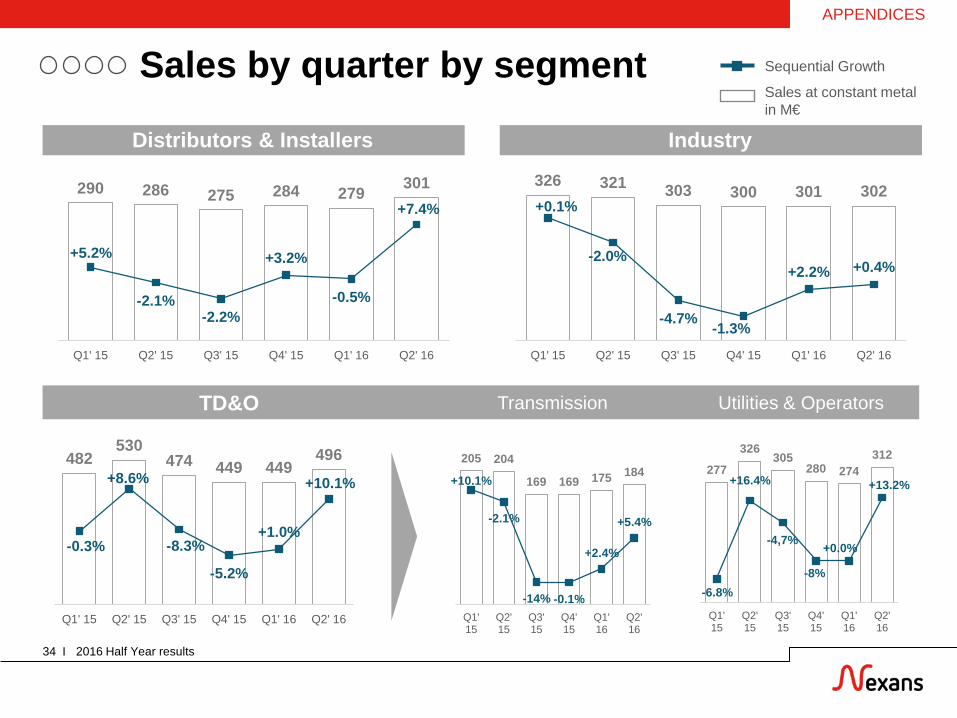
Distributors & Installers Industry
Sales by quarter by segment
TD&O Utilities & Operators Transmission
2016 Half Year results 34 I
Sales at constant metal in M€
Sequential Growth
290 286 275 284 279 301
+5.2%
-2.1% -2.2%
+3.2%
-0.5%
+7.4%
Q1' 15 Q2' 15 Q3' 15 Q4' 15 Q1' 16 Q2' 16
205 204
169 169 175 184 +10.1%
-2.1%
-14% -0.1%
+2.4%
+5.4%
Q1' 15
Q2' 15
Q3' 15
Q4' 15
Q1' 16
Q2' 16
326 321 303 300 301 302 +0.1%
-2.0%
-4.7% -1.3%
+2.2% +0.4%
Q1' 15 Q2' 15 Q3' 15 Q4' 15 Q1' 16 Q2' 16
482 530
474 449 449 496
-0.3%
+8.6%
-8.3%
-5.2%
+1.0%
+10.1%
Q1' 15 Q2' 15 Q3' 15 Q4' 15 Q1' 16 Q2' 16
277
326 305
280 274 312
-6.8%
+16.4%
-4,7%
-8%
+0.0%
+13.2%
Q1' 15
Q2' 15
Q3' 15
Q4' 15
Q1' 16
Q2' 16
APPENDICES
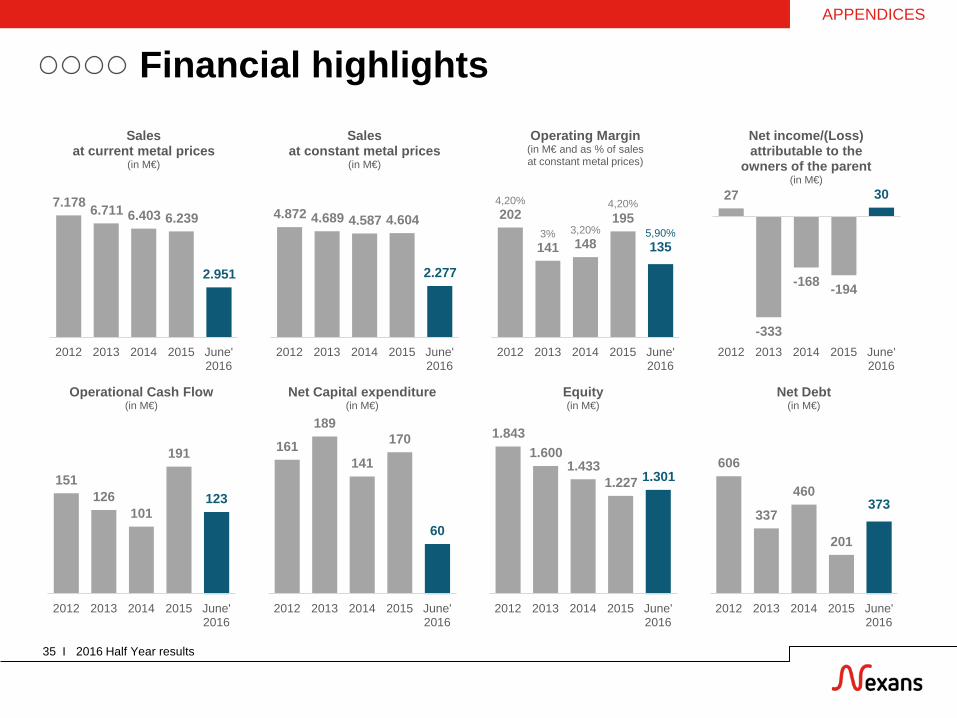
Financial highlights
2016 Half Year results 35 I
7.178 6.711 6.403 6.239
2.951
2012 2013 2014 2015 June' 2016
Sales at current metal prices
(in M€)
4.872 4.689 4.587 4.604
2.277
2012 2013 2014 2015 June' 2016
Sales at constant metal prices
(in M€)
4,20%202
3% 141
3,20% 148
4,20% 195
5,90%135
2012 2013 2014 2015 June' 2016
Operating Margin (in M€ and as % of sales at constant metal prices)
27
-333
-168 -194
30
2012 2013 2014 2015 June' 2016
Net income/(Loss) attributable to the
owners of the parent (in M€)
151 126
101
191
123
2012 2013 2014 2015 June' 2016
Operational Cash Flow (in M€)
161
189
141
170
60
2012 2013 2014 2015 June' 2016
Net Capital expenditure (in M€)
1.843 1.600
1.433 1.227 1.301
2012 2013 2014 2015 June' 2016
Equity (in M€)
606
337
460
201
373
2012 2013 2014 2015 June' 2016
Net Debt (in M€)
APPENDICES