2016 Georgia K-12 Teacher and Leader Workforce Report Teacher an… · 2016 Georgia K-12 Teacher...
28
1 2016 Georgia K-12 Teacher and Leader Workforce Report January 30, 2017
Transcript of 2016 Georgia K-12 Teacher and Leader Workforce Report Teacher an… · 2016 Georgia K-12 Teacher...

1
2016 Georgia K-12
Teacher and Leader
Workforce Report
January 30, 2017
Summary of AEAH Working Group
2
January 2016
In January 2016, the Alliance of Education Agency Heads
(AEAH), which is made up of each state education agency’s
leader, called a working group of staff from each agency to gain
a complete understanding of Georgia teacher and leader
production, retention, and effectiveness.
May 2016
The group submitted its proposed plan to the AEAH.
• A key piece of the plan was for GOSA to create an
annual report on the status of the Georgia teacher and
leader workforce, which this report fulfills.
K-12 Educator Workforce Overview
Released: January 30, 2017

Key Areas of the Report
3
• Workforce Status
• Demographics, Certificate Levels, and Years of Experience
• Production
• Mobility
• Retention
• Retirement
Report provides a one-year snapshot in 2015-2016, not a
longitudinal history of trends.
Data Sources: GaPSC, GaDOE, and Teachers Retirement
System of Georgia
K-12 Educator Workforce Overview
Released: January 30, 2017

2015-2016 Educator Workforce Status
4
189,468valid certificate
holders
110,059teachers
employed
8,449leaders
employed
• Many certificate holders work in other education roles.
• 13% of all current certificate holders were not working in
public education as of October 2015.
5,908new teachers
employed
2,316rehired teachers*
*Rehired teachers are those who returned after at least one year of absence.
K-12 Educator Workforce Overview
Released: January 30, 2017

2015-2016 Certificate Holder Statistics
5
• Across all races/ethnicities, about 60% of valid certificate
holders were employed as a teacher or leader.
79%of educators with renewable
certificates were employed as a
teacher or leader
52%of educators with non-
renewable certificates were
employed as a teacher or leader
K-12 Educator Workforce Overview
Released: January 30, 2017
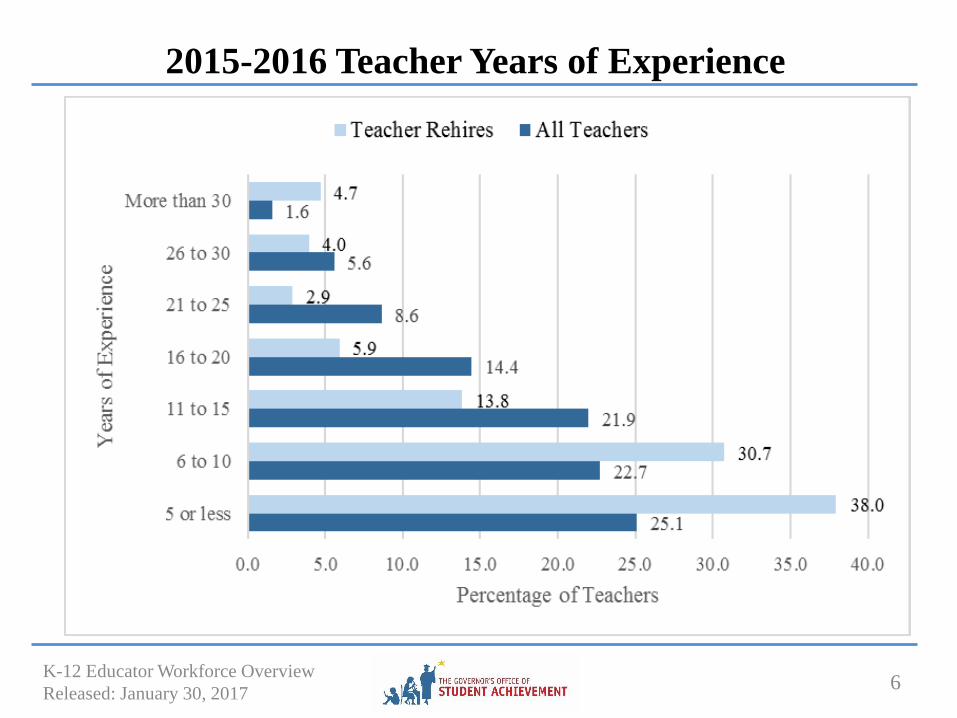
2015-2016 Teacher Years of Experience
6K-12 Educator Workforce Overview
Released: January 30, 2017
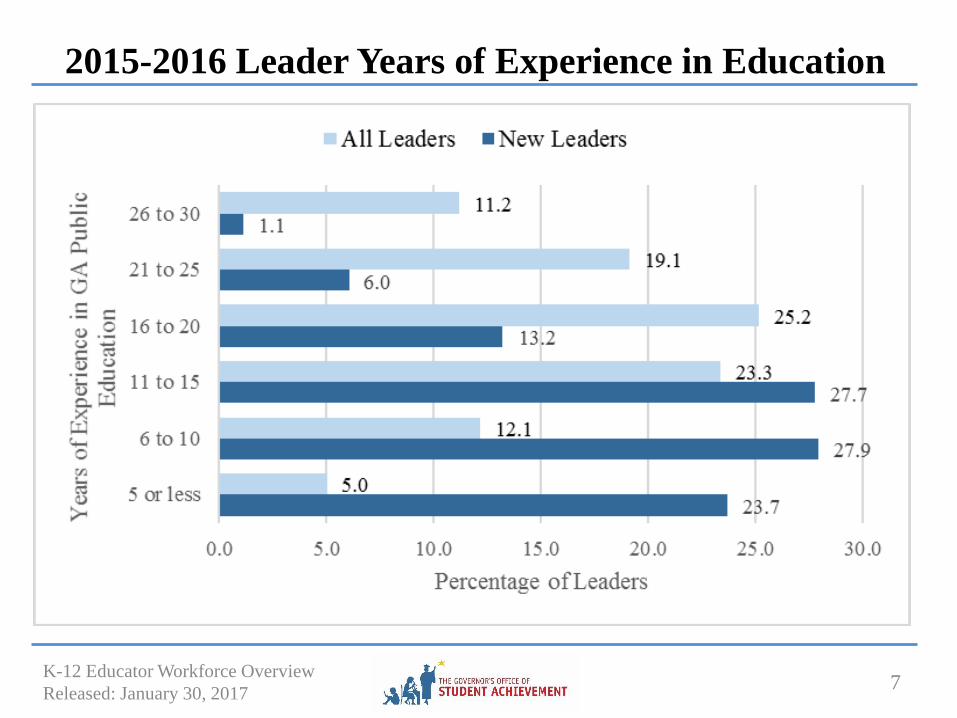
2015-2016 Leader Years of Experience in Education
7K-12 Educator Workforce Overview
Released: January 30, 2017
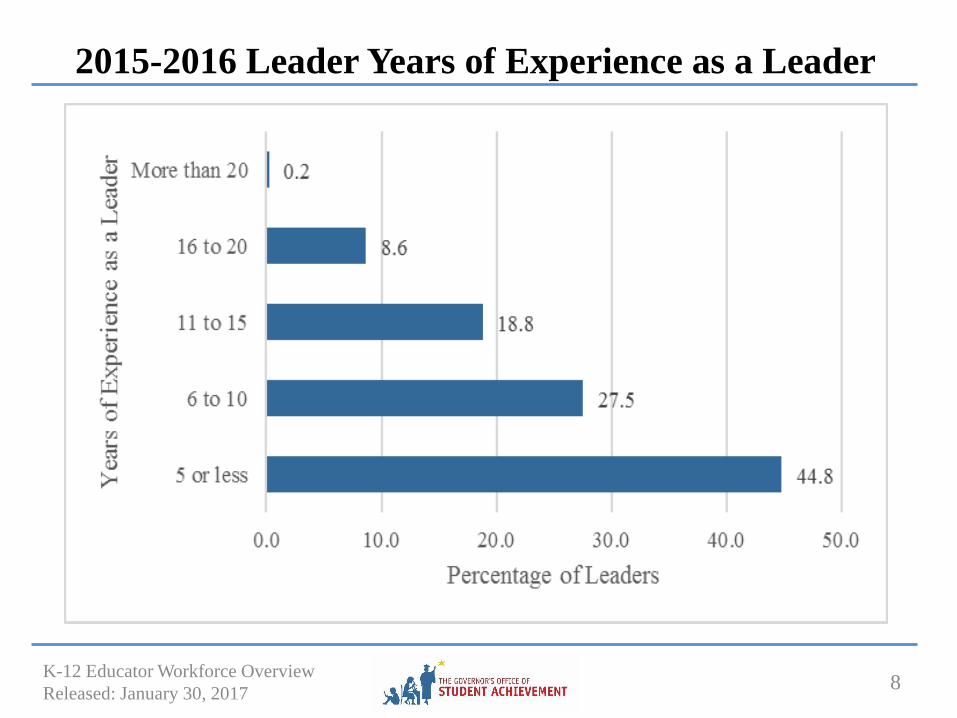
2015-2016 Leader Years of Experience as a Leader
8K-12 Educator Workforce Overview
Released: January 30, 2017

Comparisons between High and Low Poverty Schools
9
Relative to low poverty schools, high poverty schools had:
• A greater percentage of female teachers and leaders,
• Significantly larger percentages of black teachers and leaders,
• A greater percentage of teachers with less than five years of
experience or more than 25 years of experience,
• Less than half as many teachers with gifted certification, and
• Fewer teachers and leaders prepared out of state.
*GOSA defined high poverty and low poverty schools by identifying the top and bottom quartile
of schools using free lunch direct certification percentages.
K-12 Educator Workforce Overview
Released: January 30, 2017

Teacher and Leader Production
10
Public
In-State
75%
Private
In-State
15%
Alternative
Preparation
10%
19,428Teacher and leader
candidates in
Georgia programs
In 2015-2016, 32% of new teachers and 36% of new leaders were prepared out of
state. The state does not have out-of-state preparation program enrollment data.
K-12 Educator Workforce Overview
Released: January 30, 2017

2015-2016 Teacher/Leader Candidate Enrollment by Program Area
11
44
290
370
608
621
701
726
1,321
1,576
1,847
2,773
5,197
ESOL
Foreign Language
CTAE
Secondary Math
Secondary Science
Secondary Social Studies
Secondary ELA
PK-12 Fields
Leadership
Middle Grades
Special Education
Early Childhood
*Educators are counted in all
areas for which they are enrolled,
so counts do not add up to the
total number from previous slide.
PK-12 fields include fine arts,
physical education, health, and
other electives.
K-12 Educator Workforce Overview
Released: January 30, 2017
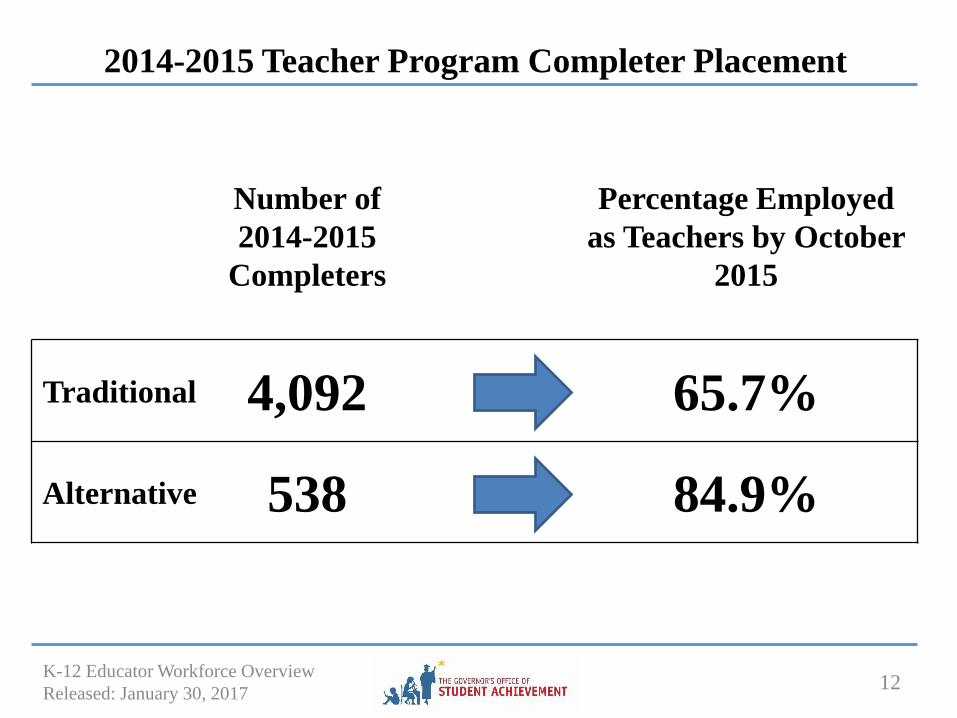
2014-2015 Teacher Program Completer Placement
12
Number of
2014-2015
Completers
Percentage Employed
as Teachers by October
2015
Traditional 4,092 65.7%
Alternative 538 84.9%
K-12 Educator Workforce Overview
Released: January 30, 2017

2014-2015 Leader Program Completer Placement
13
Number of
2014-2015
Completers
Percentage Employed
as Leaders by October
2015
Traditional 201 42.3%
K-12 Educator Workforce Overview
Released: January 30, 2017

2015-2016 Teacher Mobility
14
9.2%of teachers moved schools
from the prior year*
• Half moved within district, and half moved between districts.
• Teachers with less experience are more likely to move.
• 70% of teachers who moved between districts had 10 or fewer years of
experience. 59% of within district moves had 10 or fewer year of
experience.
• High poverty schools had more than double the mobility rate of
low poverty schools (14.3% to 6.3%)
*Measured between March 2015 and October 2015 CPI counts.
K-12 Educator Workforce Overview
Released: January 30, 2017

2015-2016 Leader Mobility
15
10.0%of leaders moved schools
from the prior year*
*Measured between March 2015 and October 2015 CPI counts.
• Most moved between schools within district rather than
between districts.
• Leaders with less experience were more likely to move.
• High poverty schools had nearly twice the mobility rate as low
poverty schools (14.1% to 8.3%).
K-12 Educator Workforce Overview
Released: January 30, 2017

2015-2016 Teacher Retention
16
90.8%stayed in teaching from
spring 2015 to fall 2015
• Retention did not vary significantly by race/ethnicity, gender,
or certificate field.
• Retention of teachers with 5 or fewer years of experience was
only slightly lower (88.6%).
• Northwest and southeast Georgia tended to have higher
retention than other areas of the state (maps available in report).
• High poverty schools retained fewer teachers than low poverty
schools (74.5% to 84.6%)
K-12 Educator Workforce Overview
Released: January 30, 2017

2015-2016 Leader Retention
17
86.2%stayed in leadership from
spring 2015 to fall 2015
• 83.1% of leaders with 5 or fewer years of experience were
retained.
• Retention was lower in high poverty schools than low poverty
schools (71.4% to 80.4%)
K-12 Educator Workforce Overview
Released: January 30, 2017
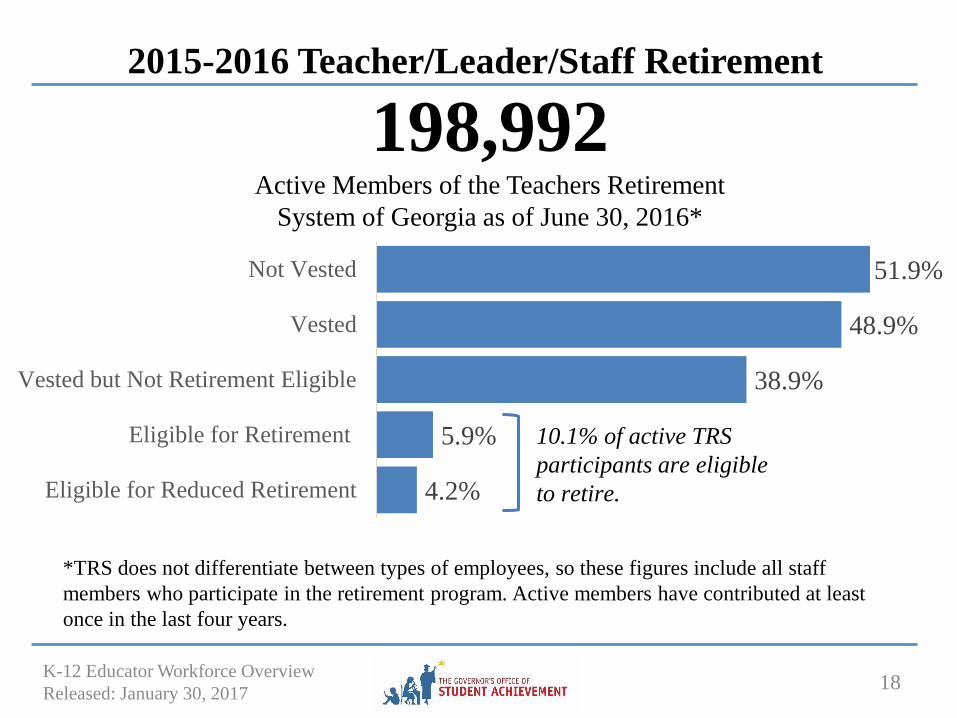
2015-2016 Teacher/Leader/Staff Retirement
18
198,992Active Members of the Teachers Retirement
System of Georgia as of June 30, 2016*
*TRS does not differentiate between types of employees, so these figures include all staff
members who participate in the retirement program. Active members have contributed at least
once in the last four years.
4.2%
5.9%
38.9%
48.9%
51.9%
Eligible for Reduced Retirement
Eligible for Retirement
Vested but Not Retirement Eligible
Vested
Not Vested
10.1% of active TRS
participants are eligible
to retire.
K-12 Educator Workforce Overview
Released: January 30, 2017

Questions?
19
The full report, along with school- and
district-level downloadable data files, is
available on GOSA’s Research Page:
http://gosa.georgia.gov/research
K-12 Educator Workforce Overview
Released: January 30, 2017
20
Supplementary Charts/Information
on Teacher/Leader Characteristics
K-12 Educator Workforce Overview
Released: January 30, 2017

2015-2016 Teacher Demographics
21
*Other includes American Indian, Asian, Pacific Islander, and Two or More Races.
61%
51%
42%
20% 21%26%
9%
18%14%
2% 3% 2%8% 7%
15%
All New Rehired
White Black Hispanic Other Unknown
K-12 Educator Workforce Overview
Released: January 30, 2017

2015-2016 Teacher Demographics
22
Female
78%
Female
77%
Female
80%
Male
23%
Male
23%
Male
20%
Rehired
New
All Teachers
K-12 Educator Workforce Overview
Released: January 30, 2017

2015-2016 Teacher Certificate Areas
23
*Teachers are counted in all areas of certification, so counts do not add up to the total number of
teachers and percentages do not add up to 100. PK-12 fields include fine arts, physical
education, health, and other electives.
K-12 Educator Workforce Overview
Released: January 30, 2017

2015-2016 Teacher Certification Degree Levels
24
32%
64%
36%
44%
31%
44%
21%
2%
12%
3% 1%3%
1% 2%5%
All New Rehired
Bachelor's Master's Education Specialist PhD/EdD Unknown
K-12 Educator Workforce Overview
Released: January 30, 2017

2015-2016 Leader Demographics
25
*Other includes American Indian, Asian, Pacific Islander, and Two or More Races. There were too
few leader rehires to meaningfully report race/ethnicities.
57%
48%
34% 33%
4%8%
2% 3%3%8%
All New
White Black Hispanic Other Unknown
K-12 Educator Workforce Overview
Released: January 30, 2017

2015-2016 Leader Demographics
26
*Other includes American Indian, Asian, Pacific Islander, and Two or More Races.
Female
62%
Female
75%
Female
68%
Male
38%
Male
25%
Male
32%
Rehired
New
All
Leaders
K-12 Educator Workforce Overview
Released: January 30, 2017
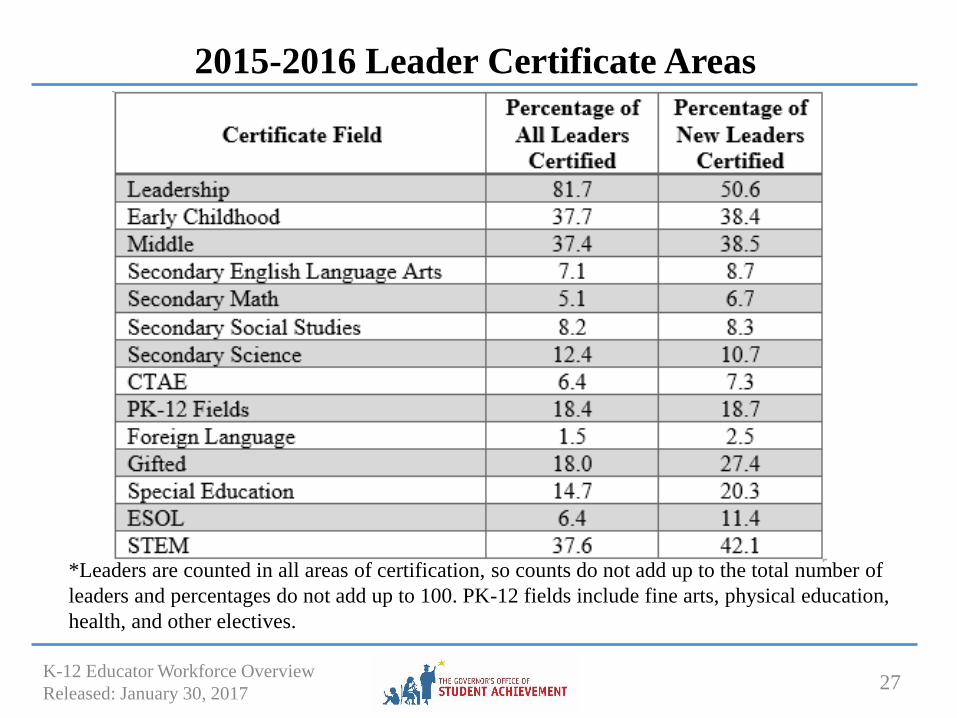
2015-2016 Leader Certificate Areas
27
*Leaders are counted in all areas of certification, so counts do not add up to the total number of
leaders and percentages do not add up to 100. PK-12 fields include fine arts, physical education,
health, and other electives.
K-12 Educator Workforce Overview
Released: January 30, 2017

2015-2016 Leader Degree Levels
28
4%
14%
24%
38%
53%
40%
18%
9%
1% 0%
All New
Bachelor's Master's Education Specialist PhD/EdD Unknown
*There were too few leader rehires to degree levels.
K-12 Educator Workforce Overview
Released: January 30, 2017