2016 General Population Survey Report - Draft General Population Survey Results, 2016 6 1 Public...
27
Northwestern Health Unit General Population Survey Report 2016
Transcript of 2016 General Population Survey Report - Draft General Population Survey Results, 2016 6 1 Public...

Northwestern Health UnitGeneral Population Survey Report
2016

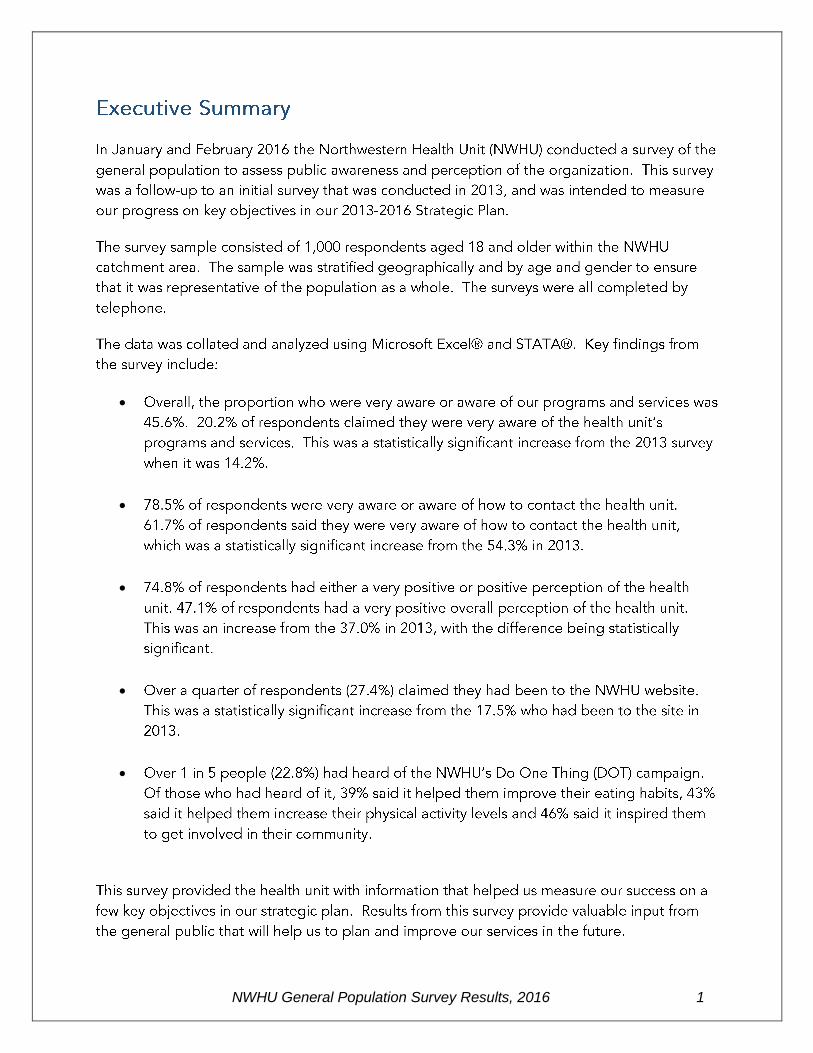
NWHU General Population Survey Results, 2016 1

NWHU General Population Survey Results, 2016 2
o
o
o
o
o
o
o
o

NWHU General Population Survey Results, 2016 3

NWHU General Population Survey Results, 2016 4

NWHU General Population Survey Results, 2016 5

NWHU General Population Survey Results, 2016 6
1 Public Works and Government Services Canada. (2013). Retrieved from: http://www.tpsgc-pwgsc.gc.ca/rop-por/rapports-reports/telephone/introduction-eng.html

NWHU General Population Survey Results, 2016 7
0%
5%
10%
15%
20%
25%
30%
not at all aware not aware neither aware norunaware
aware very aware
2013 2016

NWHU General Population Survey Results, 2016 8
0%
10%
20%
30%
40%
50%
60%
70%
Under $35,000 $35,000-$49,999 $50,000-$74,999 $75,000-$99,999 Over $100,000
% a
war
e o
r ve
ry a
war
e
Household income
2013
2016

NWHU General Population Survey Results, 2016 9
0%
10%
20%
30%
40%
50%
60%
70%
not at all aware not aware neither aware norunaware
aware very aware
2013 2016
0%
10%
20%
30%
40%
50%
60%
70%
80%
90%
100%
18-29 30-39 40-49 50-59 60-69 70+
% a
war
e o
r ve
ry a
war
e
Age group
2013
2016

NWHU General Population Survey Results, 2016 10
0%
5%
10%
15%
20%
25%
30%
35%
40%
45%
50%
very negative negative neither positivenor negative
positive very positive don't know
2013 2016

NWHU General Population Survey Results, 2016 11
0%
10%
20%
30%
40%
50%
60%
70%
80%
18-29 30-39 40-49 50-59 60-69 70+
% v
ery
po
siti
ve
Age group
2013
2016
0%
10%
20%
30%
40%
50%
60%
70%
80%
90%
Yes No
% w
ho
had
bee
n t
o t
he
web
site
2013 2016

NWHU General Population Survey Results, 2016 12
0%
5%
10%
15%
20%
25%
30%
35%
40%
45%
18-29 30-39 40-49 50-59 60-69 70+
% w
ho
had
bee
n t
o t
he
web
site
Age group
2013
2016

NWHU General Population Survey Results, 2016 13
0%
5%
10%
15%
20%
25%
30%
35%
Under $35,000 $35,000-$49,999 $50,000-$74,999 $75,000-$99,999 Over $100,000
% w
ho
had
bee
n t
o t
he
web
site
Household income
2013
2016

NWHU General Population Survey Results, 2016 14
0%
10%
20%
30%
40%
50%
60%
70%
80%
Strongly Disagree Disagree Neither Disagree norAgree
Agree Strongly Agree
2013 2016

NWHU General Population Survey Results, 2016 15
0%
5%
10%
15%
20%
25%
30%
35%
40%
Strongly Disagree Disagree Neither Disagreenor Agree
Agree Strongly Agree Don't Know
2013 2016

NWHU General Population Survey Results, 2016 16
0%
5%
10%
15%
20%
25%
30%
35%
Not able to Never Sometimes Often Always
2013 2016
0%
5%
10%
15%
20%
25%
30%
35%
40%
Strongly Disagree Disagree Neither Disagree norAgree
Agree Strongly Agree
2013 2016

NWHU General Population Survey Results, 2016 17
0%
5%
10%
15%
20%
25%
30%
35%
Entire region SiouxLookout
Red Lake Dryden Atikokan Fort Frances Kenora KenoraUnorganized
% w
ho
had
hea
rd o
f D
OT

NWHU General Population Survey Results, 2016 18
0%
5%
10%
15%
20%
25%
30%
35%
18-29 30-39 40-49 50-59 60-69 70+
% w
ho
had
hea
rd o
f D
OT
Age group
0%
5%
10%
15%
20%
25%
NWHUstaff
Radio Newspaper Socialmedia
Word ofmouth
Communityevent
Mail,flyers,
brochures
NWHUwebsite
TV Road sign
% w
ho
hea
rd o
f it
th
rou
gh t
his
med
ium

NWHU General Population Survey Results, 2016 19

NWHU General Population Survey Results, 2016 20

NWHU General Population Survey Results, 2016 21

NWHU General Population Survey Results, 2016 22
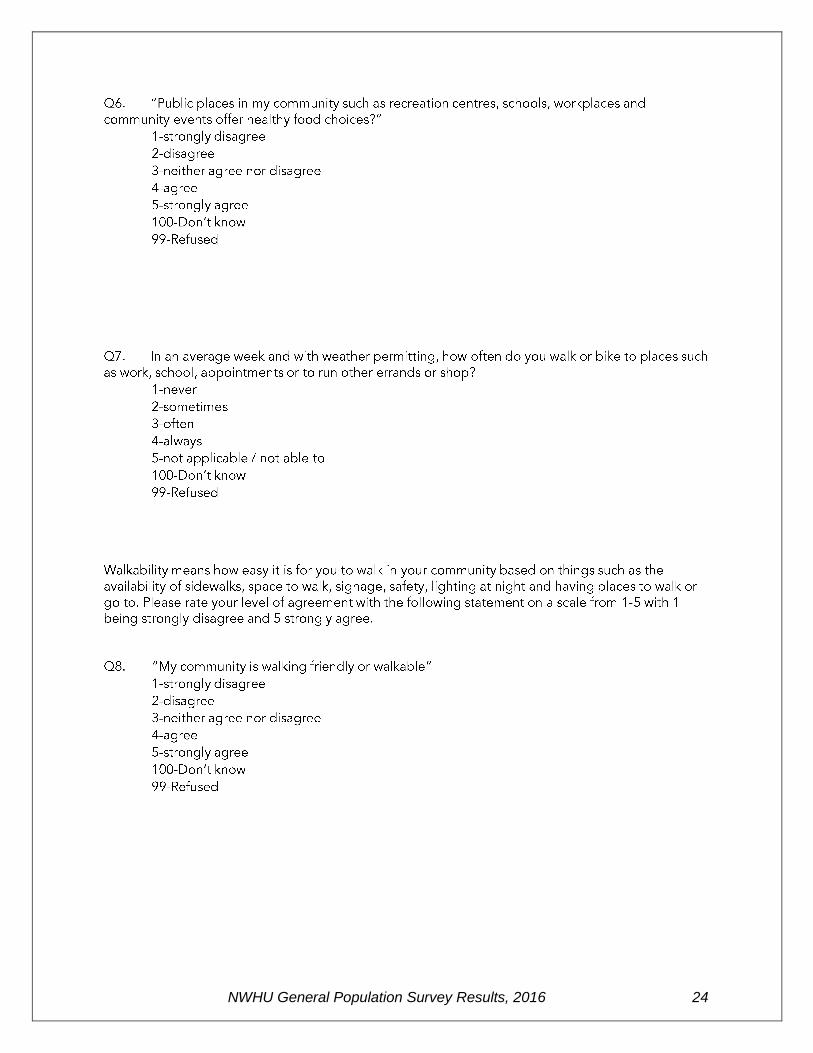
NWHU General Population Survey Results, 2016 24

NWHU General Population Survey Results, 2016 25