2016 EU-wide Transparency Exercise · LEI Code 529900HNOAA1KXQJUQ27 Country Code DE De 2016 EU-wide...
15
ound_3 5 TRA Bank Name Deutsche Zentral-Genossenschaftsbank AG LEI Code 529900HNOAA1KXQJUQ27 Country Code DE De 2016 EU-wide Transparency Exercise
-
Upload
vuongthien -
Category
Documents
-
view
222 -
download
0
Transcript of 2016 EU-wide Transparency Exercise · LEI Code 529900HNOAA1KXQJUQ27 Country Code DE De 2016 EU-wide...

Round_3
Master_version_2015 TRA Templates 26102015Bank Name Deutsche Zentral-Genossenschaftsbank AG
LEI Code 529900HNOAA1KXQJUQ27
Country Code DE
De
2016 EU-wide Transparency Exercise

201512 201606
(mln EUR, %)As of 31/12/2015 As of 30/06/2016 COREP CODE REGULATION
A OWN FUNDS 18,429 17,791 C 01.00 (r010,c010) Articles 4(118) and 72 of CRR
A.1COMMON EQUITY TIER 1 CAPITAL (net of deductions and after applying
transitional adjustments)13,554 13,101 C 01.00 (r020,c010) Article 50 of CRR
A.1.1Capital instruments eligible as CET1 Capital (including share premium and net own capital
instruments)5,748 5,748 C 01.00 (r030,c010) Articles 26(1) points (a) and (b), 27 to 29, 36(1) point (f) and 42 of CRR
A.1.2 Retained earnings 6,323 6,112 C 01.00 (r130,c010) Articles 26(1) point (c), 26(2) and 36 (1) points (a) and (l) of CRR
A.1.3 Accumulated other comprehensive income 841 494 C 01.00 (r180,c010) Articles 4(100), 26(1) point (d) and 36 (1) point (l) of CRR
A.1.4 Other Reserves 400 611 C 01.00 (r200,c010) Articles 4(117) and 26(1) point (e) of CRR
A.1.5 Funds for general banking risk 0 0 C 01.00 (r210,c010) Articles 4(112), 26(1) point (f) and 36 (1) point (l) of CRR
A.1.6 Minority interest given recognition in CET1 capital 378 400 C 01.00 (r230,c010) Article 84 of CRR
A.1.7 Adjustments to CET1 due to prudential filters -273 -308 C 01.00 (r250,c010) Articles 32 to 35 of and 36 (1) point (l) of CRR
A.1.8 (-) Intangible assets (including Goodwill) -597 -597 C 01.00 (r300,c010) + C 01.00 (r340,c010) Articles 4(113), 36(1) point (b) and 37 of CRR. Articles 4(115), 36(1) point (b) and 37 point (a) of
CCR
A.1.9(-) DTAs that rely on future profitability and do not arise from temporary differences net of
associated DTLs -10 -10 C 01.00 (r370,c010) Articles 36(1) point (c) and 38 of CRR
A.1.10 (-) IRB shortfall of credit risk adjustments to expected losses -38 -5 C 01.00 (r380,c010) Articles 36(1) point (d), 40 and 159 of CRR
A.1.11 (-) Defined benefit pension fund assets 0 0 C 01.00 (r390,c010) Articles 4(109), 36(1) point (e) and 41 of CRR
A.1.12 (-) Reciprocal cross holdings in CET1 Capital -3 -3 C 01.00 (r430,c010) Articles 4(122), 36(1) point (g) and 44 of CRR
A.1.13 (-) Excess deduction from AT1 items over AT1 Capital 0 0 C 01.00 (r440,c010) Article 36(1) point (j) of CRR
A.1.14 (-) Deductions related to assets which can alternatively be subject to a 1.250% risk weight 0 0C 01.00 (r450,c010) + C 01.00 (r460,c010) +
C 01.00 (r470,c010) + C 01.00 (r471,c010)+
C 01.00 (r472,c010)
Articles 4(36), 36(1) point (k) (i) and 89 to 91 of CRR; Articles 36(1) point (k) (ii), 243(1) point (b),
244(1) point (b) and 258 of CRR; Articles 36(1) point k) (iii) and 379(3) of CRR; Articles 36(1)
point k) (iv) and 153(8) of CRR and Articles 36(1) point k) (v) and 155(4) of CRR.
A.1.14.1 Of which: from securitisation positions (-) 0 0 C 01.00 (r460,c010) Articles 36(1) point (k) (ii), 243(1) point (b), 244(1) point (b) and 258 of CRR
A.1.15(-) Holdings of CET1 capital instruments of financial sector entities where the institiution does
not have a significant investment0 0 C 01.00 (r480,c010) Articles 4(27), 36(1) point (h); 43 to 46, 49 (2) and (3) and 79 of CRR
A.1.16 (-) Deductible DTAs that rely on future profitability and arise from temporary differences 0 0 C 01.00 (r490,c010) Articles 36(1) point (c) and 38; Articles 48(1) point (a) and 48(2) of CRR
A.1.17(-) Holdings of CET1 capital instruments of financial sector entities where the institiution has a
significant investment0 0 C 01.00 (r500,c010) Articles 4(27); 36(1) point (i); 43, 45; 47; 48(1) point (b); 49(1) to (3) and 79 of CRR
A.1.18 (-) Amount exceding the 17.65% threshold 0 0 C 01.00 (r510,c010) Article 48 of CRR
A.1.19 (-) Additional deductions of CET1 Capital due to Article 3 CRR 0 0 C 01.00 (r524,c010) Article 3 CRR
A.1.20 CET1 capital elements or deductions - other 0 -12 C 01.00 (r529,c010) -
A.1.21 Transitional adjustments 786 672 CA1 {1.1.1.6 + 1.1.1.8 + 1.1.1.26} -
A.1.21.1 Transitional adjustments due to grandfathered CET1 Capital instruments (+/-) 0 0 C 01.00 (r220,c010) Articles 483(1) to (3), and 484 to 487 of CRR
A.1.21.2 Transitional adjustments due to additional minority interests (+/-) 873 608 C 01.00 (r240,c010) Articles 479 and 480 of CRR
A.1.21.3 Other transitional adjustments to CET1 Capital (+/-) -87 64 C 01.00 (r520,c010) Articles 469 to 472, 478 and 481 of CRR
A.2 ADDITIONAL TIER 1 CAPITAL (net of deductions and after transitional adjustments) 1,748 1,890 C 01.00 (r530,c010) Article 61 of CRR
A.2.1 Additional Tier 1 Capital instruments 740 741 C 01.00 (r540,c010) + C 01.00 (r670,c010)
A.2.2 (-) Excess deduction from T2 items over T2 capital 0 0 C 01.00 (r720,c010)
A.2.3 Other Additional Tier 1 Capital components and deductions 0 0C 01.00 (r690,c010) + C 01.00 (r700,c010) +
C 01.00 (r710,c010) + C 01.00 (r740,c010) +
C 01.00 (r744,c010) + C 01.00 (r748,c010)
A.2.4 Additional Tier 1 transitional adjustments 1,008 1,148C 01.00 (r660,c010) + C 01.00 (r680,c010) +
C 01.00 (r730,c010)
A.3 TIER 1 CAPITAL (net of deductions and after transitional adjustments) 15,302 14,991 C 01.00 (r015,c010) Article 25 of CRR
A.4 TIER 2 CAPITAL (net of deductions and after transitional adjustments) 3,127 2,800 C 01.00 (r750,c010) Article 71 of CRR
A.4.1 Tier 2 Capital instruments 2,720 2,514 C 01.00 (r760,c010) + C 01.00 (r890,c010)
A.4.2 Other Tier 2 Capital components and deductions 302 259
C 01.00 (r910,c010) + C 01.00 (r920,c010) +
C 01.00 (r930,c010) + C 01.00 (r940,c010) +
C 01.00 (r950,c010) + C 01.00 (r970,c010) +
C 01.00 (r974,c010) + C 01.00 (r978,c010)
A.4.3 Tier 2 transitional adjustments 106 26C 01.00 (r880,c010) + C 01.00 (r900,c010) +
C 01.00 (r960,c010)
B TOTAL RISK EXPOSURE AMOUNT 97,856 98,829 C 02.00 (r010,c010) Articles 92(3), 95, 96 and 98 of CRR
B.1 Of which: Transitional adjustments included 6 0 C 05.01 (r010;c040)
C.1 COMMON EQUITY TIER 1 CAPITAL RATIO (transitional period) 13.85% 13.26% CA3 {1} -
C.2 TIER 1 CAPITAL RATIO (transitional period) 15.64% 15.17% CA3 {3} -
C.3 TOTAL CAPITAL RATIO (transitional period) 18.83% 18.00% CA3 {5} -
CET1 Capital
Fully loadedD COMMON EQUITY TIER 1 CAPITAL (fully loaded) 12,768 12,429
[A.1-A.1.13-A.1.21+MIN(A.2+A.1.13-
A.2.2-A.2.4+MIN(A.4+A.2.2-A.4.3,0),0)]-
CET1 RATIO (%)
Fully loaded1 E COMMON EQUITY TIER 1 CAPITAL RATIO (fully loaded) 13.05% 12.58% [D.1]/[B-B.1] -
(1) Fully loaded CET1 capital ratio estimation based on the formulae stated in column “COREP CODE”
CAPITAL RATIOS (%)
Transitional period
2016 EU-wide Transparency Exercise
Capital
Deutsche Zentral-Genossenschaftsbank AG
OWN FUNDS
Transitional period
OWN FUNDS
REQUIREMENTS
201512 201606
(mln EUR)
as of 31/12/2015 as of 30/06/2016
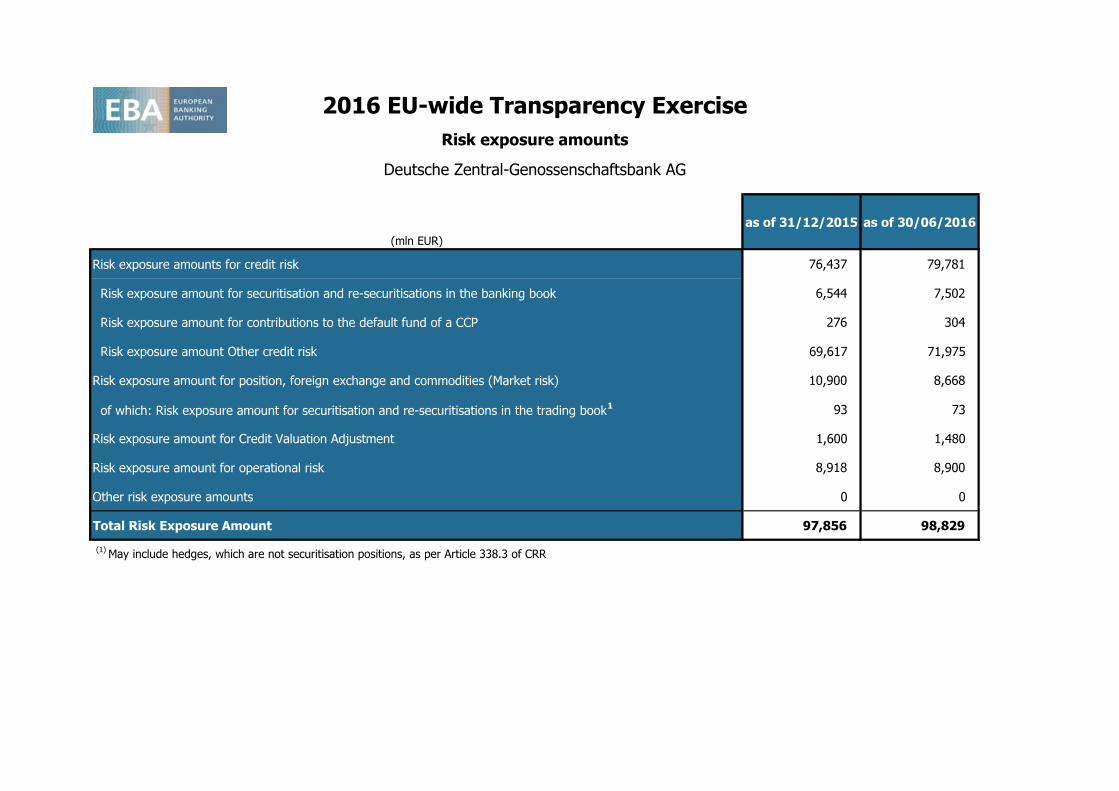
Risk exposure amounts for credit risk 76,437 79,781
Risk exposure amount for securitisation and re-securitisations in the banking book 6,544 7,502
Risk exposure amount for contributions to the default fund of a CCP 276 304
Risk exposure amount Other credit risk 69,617 71,975
Risk exposure amount for position, foreign exchange and commodities (Market risk) 10,900 8,668
of which: Risk exposure amount for securitisation and re-securitisations in the trading book1 93 73
Risk exposure amount for Credit Valuation Adjustment 1,600 1,480
Risk exposure amount for operational risk 8,918 8,900
Other risk exposure amounts 0 0
Total Risk Exposure Amount 97,856 98,829
(1)
May include hedges, which are not securitisation positions, as per Article 338.3 of CRR
2016 EU-wide Transparency Exercise
Risk exposure amounts
Deutsche Zentral-Genossenschaftsbank AG

201512 201606
(mln EUR)
Interest income 11,844 5,752
Of which debt securities income 764 297
Of which loans and advances income 5,911 2,718
Interest expenses 8,904 4,420
(Of which deposits expenses) 3,163 1,522
(Of which debt securities issued expenses) 741 337
(Expenses on share capital repayable on demand) 5 1
Dividend income 157 72
Net Fee and commission income 1,792 967
Gains or (-) losses on derecognition of financial assets and liabilities not measured at fair value through profit or loss, and of non financial
assets, net62 122
Gains or (-) losses on financial assets and liabilities held for trading, net 63 46
Gains or (-) losses on financial assets and liabilities designated at fair value through profit or loss, net 351 65
Gains or (-) losses from hedge accounting, net 39 5
Exchange differences [gain or (-) loss], net 147 153
Net other operating income /(expenses) 15 57
TOTAL OPERATING INCOME, NET 5,562 2,819
(Administrative expenses) 3,250 1,699
(Depreciation) 165 82
(Provisions or (-) reversal of provisions) -67 86
(Commitments and guarantees given) -21 16
(Other provisions) -46 70
Of which pending legal issues and tax litigation1 -5
Of which restructuring1 1
(Impairment or (-) reversal of impairment on financial assets not measured at fair value through profit or loss) 283 112
(Loans and receivables) 257 112
(Held to maturity investments, AFS assets and financial assets measured at cost) 26 0
(Impairment or (-) reversal of impairment of investments in subsidaries, joint ventures and associates and on non-financial assets) 51 7
(of which Goodwill) 26 0
Negative goodwill recognised in profit or loss 0 0
Share of the profit or (-) loss of investments in subsidaries, joint ventures and associates 348 196
Profit or (-) loss from non-current assets and disposal groups classified as held for sale not qualifying as discontinued operations 0 6
PROFIT OR (-) LOSS BEFORE TAX FROM CONTINUING OPERATIONS 2,228 1,035
PROFIT OR (-) LOSS AFTER TAX FROM CONTINUING OPERATIONS 1,650 796
Profit or (-) loss after tax from discontinued operations 0 0
PROFIT OR (-) LOSS FOR THE YEAR 1,650 796
Of which attributable to owners of the parent 1,421 705 (1)
Information available only as of end of the year
2016 EU-wide Transparency ExerciseP&L
Deutsche Zentral-Genossenschaftsbank AG
As of 31/12/2015As of
30/06/2016
201512 201606 201512 201512 201512 201512 201512 201512 201512 201512 201512 201512 201606 201606 201606 201606 201606 201606 201606 201606 201606 201606
As of
31/12/2015
As of
30/06/2016
(mln EUR)
MULTIPLICATION
FACTOR (mc) x
AVERAGE OF
PREVIOUS 60
WORKING DAYS
(VaRavg)
PREVIOUS
DAY (VaRt-1)
MULTIPLICATION
FACTOR (ms) x
AVERAGE OF
PREVIOUS 60
WORKING DAYS
(SVaRavg)
LATEST
AVAILABLE
(SVaRt-1)
12 WEEKS
AVERAGE
MEASURE
LAST
MEASUREFLOOR
12 WEEKS
AVERAGE
MEASURE
LAST
MEASURE
MULTIPLICATION
FACTOR (mc) x
AVERAGE OF
PREVIOUS 60
WORKING DAYS
(VaRavg)
PREVIOUS
DAY (VaRt-1)
MULTIPLICATION
FACTOR (ms) x
AVERAGE OF
PREVIOUS 60
WORKING DAYS
(SVaRavg)
LATEST
AVAILABLE
(SVaRt-1)
12 WEEKS
AVERAGE
MEASURE
LAST
MEASUREFLOOR
12 WEEKS
AVERAGE
MEASURE
LAST
MEASURE
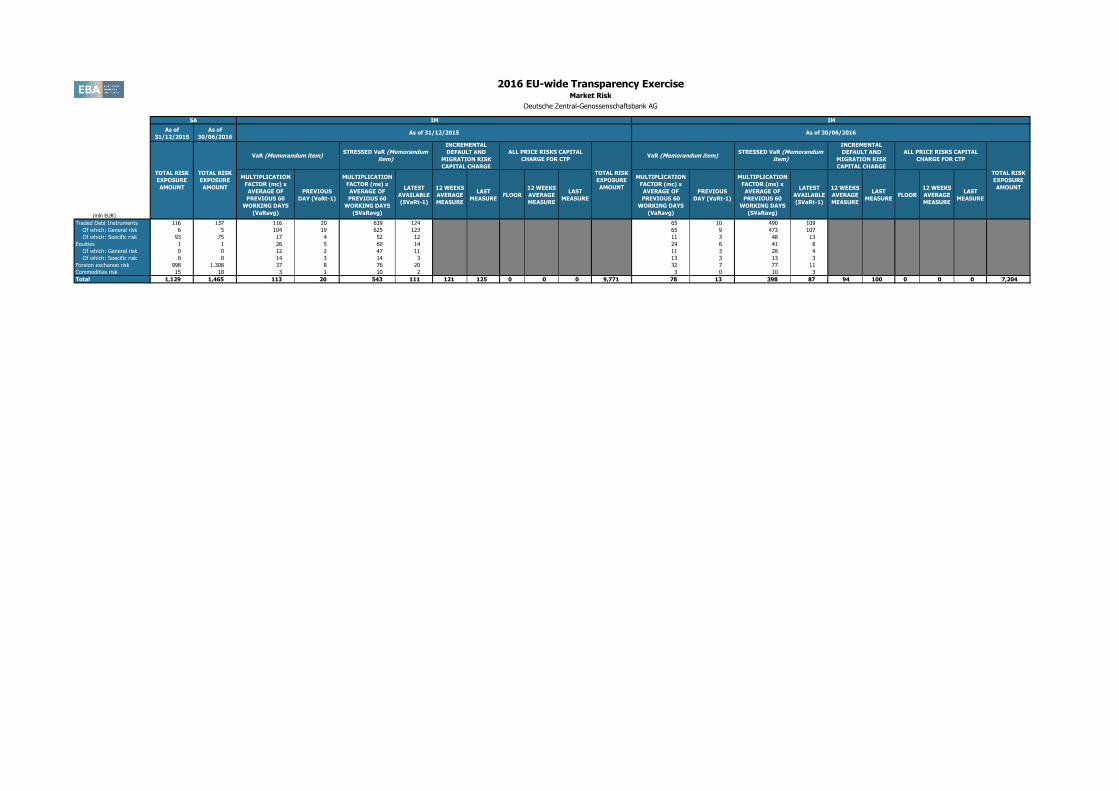
Traded Debt Instruments 116 137 116 20 639 124 65 10 490 109
Of which: General risk 6 5 104 19 625 123 65 9 473 107
Of which: Specific risk 93 75 17 4 52 12 11 3 48 13
Equities 1 1 26 5 60 14 24 6 41 8
Of which: General risk 0 0 12 2 47 11 11 3 28 4
Of which: Specific risk 0 0 14 3 14 3 13 3 13 3
Foreign exchange risk 998 1,308 37 8 76 20 32 7 77 11
Commodities risk 15 18 3 1 10 2 3 0 10 3
Total 1,129 1,465 113 20 543 111 121 125 0 0 0 9,771 78 13 398 87 94 100 0 0 0 7,204
2016 EU-wide Transparency ExerciseMarket Risk
Deutsche Zentral-Genossenschaftsbank AG
SA IM IM
TOTAL RISK
EXPOSURE
AMOUNT
TOTAL RISK
EXPOSURE
AMOUNT
VaR (Memorandum item)STRESSED VaR (Memorandum
item)
INCREMENTAL
DEFAULT AND
MIGRATION RISK
CAPITAL CHARGE
STRESSED VaR (Memorandum
item)
INCREMENTAL
DEFAULT AND
MIGRATION RISK
CAPITAL CHARGE
ALL PRICE RISKS CAPITAL
CHARGE FOR CTP
TOTAL RISK
EXPOSURE
AMOUNT
As of 31/12/2015 As of 30/06/2016
ALL PRICE RISKS CAPITAL
CHARGE FOR CTP
TOTAL RISK
EXPOSURE
AMOUNT
VaR (Memorandum item)

201512 201512 201512 201512 201606 201606 201606 201606
(mln EUR, %)
Central governments or central banks 11,615 13,629 1,732 26,608 27,485 1,802
Regional governments or local authorities 31,485 31,935 265 30,783 30,956 248
Public sector entities 12,566 12,430 51 12,819 12,326 65
Multilateral Development Banks 207 207 0 206 206 0
International Organisations 938 938 0 961 961 0
Institutions 77,052 63,348 430 77,999 63,319 382
Corporates 14,131 8,390 7,352 13,211 8,139 7,231
of which: SME 1,839 1,681 1,638 1,962 1,631 1,630
Retail 5,697 3,532 2,326 6,086 3,722 2,449
of which: SME 1,257 1,206 689 1,280 1,240 708
Secured by mortgages on immovable property 1,768 1,678 838 1,775 1,678 830
of which: SME 119 116 54 120 117 54
Exposures in default 905 240 291 649 880 292 379 572
Items associated with particularly high risk 334 168 252 286 180 271
Covered bonds 322 322 64 274 274 55
Claims on institutions and corporates with a ST credit assessment 464 322 90 329 195 81
Collective investments undertakings (CIU) 1,649 1,646 944 1,791 1,791 1,164
Equity 4,208 4,167 4,263 4,559 4,517 4,618
Securitisation 3,701 3,508 4,681 3,241 3,067 4,281
Other exposures 501 500 886 458 457 1,162
Standardised Total 167,542 146,960 24,464 1,156 182,264 159,566 25,018 982(1)
Original exposure, unlike Exposure value, is reported before taking into account any effect due to credit conversion factors or credit risk mitigation techniques (e.g. substitution effects).
1 (mln EUR, %)
Central governments or central banks 4,561 5,708 1,703 17,697 18,916 1,738
Regional governments or local authorities 28,444 28,709 4 27,893 27,990 4
Public sector entities 11,965 11,730 44 12,346 11,896 42
Multilateral Development Banks 0 0 0 0 0 0
International Organisations 0 0 0 0 0 0
Institutions 76,036 62,357 207 76,809 62,153 127
Corporates 9,184 5,248 4,707 8,979 5,123 4,608
of which: SME 1,818 1,662 1,618 1,919 1,610 1,609
Retail 4,508 2,319 1,529 4,848 2,449 1,615
of which: SME 1,241 1,205 689 1,273 1,240 708
Secured by mortgages on immovable property 715 710 494 686 680 479
of which: SME 119 116 54 120 117 54
Exposures in default 566 130 150 427 537 116 134 412
Items associated with particularly high risk 201 109 164 235 130 195
Covered bonds 30 30 6 30 30 6
Claims on institutions and corporates with a ST credit assessment 302 202 39 106 8 1
Collective investments undertakings (CIU) 132 132 69 205 205 121
Equity 4,055 4,014 4,110 4,394 4,353 4,454
Securitisation
Other exposures 300 300 509 294 294 740
Standardised Total2 579 536
(1) Original exposure, unlike Exposure value, is reported before taking into account any effect due to credit conversion factors or credit risk mitigation techniques (e.g. substitution effects).
(2) Total value adjustments and provisions per country of counterparty does not include Securistisation exposures
2 (mln EUR, %)
Central governments or central banks 0 0 0 0 0 0
Regional governments or local authorities 288 288 101 254 254 96
Public sector entities 0 0 0 0 0 0
Multilateral Development Banks 14 14 0 14 14 0
International Organisations 0 0 0 0 0 0
Institutions 117 142 37 140 158 34
Corporates 268 281 247 288 295 261
of which: SME 11 11 11 7 7 7
Retail 3 3 2 2 2 2
of which: SME 0 0 0 0 0 0
Secured by mortgages on immovable property 0 0 0 0 0 0
of which: SME 0 0 0 0 0 0
Exposures in default 4 0 0 4 23 17 25 7
Items associated with particularly high risk 0 0 0 0 0 0
Covered bonds 0 0 0 0 0 0
Claims on institutions and corporates with a ST credit assessment 0 9 2 0 9 2
Collective investments undertakings (CIU) 189 189 127 191 191 113
Equity 0 0 0 25 25 25
Securitisation
Other exposures 0 0 0 0 0 0
Standardised Total2 4 9
(1) Original exposure, unlike Exposure value, is reported before taking into account any effect due to credit conversion factors or credit risk mitigation techniques (e.g. substitution effects).
(2) Total value adjustments and provisions per country of counterparty does not include Securistisation exposures
3 (mln EUR, %)
Central governments or central banks 116 193 0 1,777 1,777 0
Regional governments or local authorities 0 0 0 0 0 0
Public sector entities 0 0 0 0 0 0
Multilateral Development Banks 0 0 0 0 0 0
International Organisations 0 0 0 0 0 0
Institutions 334 334 67 453 453 91
Corporates 670 279 207 622 305 201
of which: SME 0 0 0 0 0 0
Retail 3 3 3 2 2 1
of which: SME 0 0 0 0 0 0
Secured by mortgages on immovable property 61 61 21 36 36 13
of which: SME 0 0 0 0 0 0
Exposures in default 0 0 0 0 0 0 0 0
Items associated with particularly high risk 0 0 0 0 0 0
Covered bonds 33 33 7 33 33 7
Claims on institutions and corporates with a ST credit assessment 162 89 44 222 156 74
Collective investments undertakings (CIU) 118 118 65 145 145 98
Equity 0 0 0 0 0 0
Securitisation
Other exposures 0 0 0 0 0 0
Standardised Total2 4 1
(1) Original exposure, unlike Exposure value, is reported before taking into account any effect due to credit conversion factors or credit risk mitigation techniques (e.g. substitution effects).
(2) Total value adjustments and provisions per country of counterparty does not include Securistisation exposures
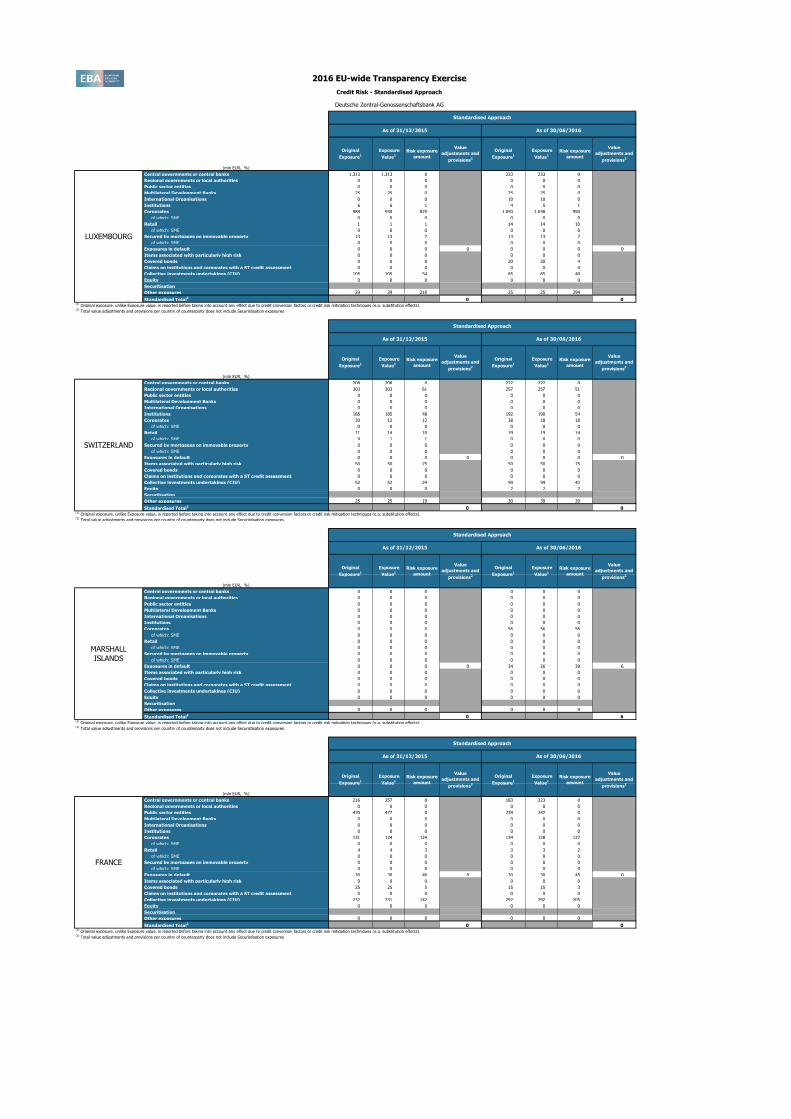
2016 EU-wide Transparency Exercise
Credit Risk - Standardised Approach
Deutsche Zentral-Genossenschaftsbank AG
Standardised Approach
As of 31/12/2015 As of 30/06/2016
Risk exposure
amount
Value
adjustments and
provisions
Consolidated data
Standardised Approach
As of 31/12/2015 As of 30/06/2016
Original
Exposure1
Exposure
Value1
Risk exposure
amount
Value
adjustments and
provisions
Original
Exposure1
Exposure
Value1
Risk exposure
amount
Value
adjustments and
provisions2
GERMANY
Standardised Approach
As of 31/12/2015 As of 30/06/2016
Original
Exposure1
Exposure
Value1
Risk exposure
amount
Value
adjustments and
provisions2
Original
Exposure1
Exposure
Value1
Risk exposure
amount
Value
adjustments and
provisions2
UNITED STATES
Standardised Approach
As of 31/12/2015 As of 30/06/2016
Original
Exposure1
Exposure
Value1
Risk exposure
amount
Value
adjustments and
provisions2
Original
Exposure1
Exposure
Value1
Risk exposure
amount
Value
adjustments and
provisions2
UNITED KINGDOM
Original
Exposure1
Exposure
Value1
Risk exposure
amount
Value
adjustments and
provisions2
Original
Exposure1
Exposure
Value1
2016 EU-wide Transparency Exercise
Credit Risk - Standardised Approach
Deutsche Zentral-Genossenschaftsbank AG
4 (mln EUR, %)
Central governments or central banks 1,313 1,313 0 233 233 0
Regional governments or local authorities 0 0 0 0 0 0
Public sector entities 0 0 0 0 0 0
Multilateral Development Banks 25 25 0 25 25 0
International Organisations 0 0 0 10 10 0
Institutions 6 6 1 4 5 1
Corporates 989 930 825 1,050 1,038 950
of which: SME 0 0 0 0 0 0
Retail 1 1 1 14 14 10
of which: SME 0 0 0 0 0 0
Secured by mortgages on immovable property 13 13 7 13 13 7
of which: SME 0 0 0 0 0 0
Exposures in default 0 0 0 0 0 0 0 0
Items associated with particularly high risk 0 0 0 0 0 0
Covered bonds 0 0 0 20 20 4
Claims on institutions and corporates with a ST credit assessment 0 0 0 0 0 0
Collective investments undertakings (CIU) 105 105 54 85 85 49
Equity 0 0 0 0 0 0
Securitisation
Other exposures 29 29 210 25 25 294
Standardised Total2 0 0
(1) Original exposure, unlike Exposure value, is reported before taking into account any effect due to credit conversion factors or credit risk mitigation techniques (e.g. substitution effects).
(2) Total value adjustments and provisions per country of counterparty does not include Securistisation exposures
5 (mln EUR, %)
Central governments or central banks 208 208 0 222 222 0
Regional governments or local authorities 303 303 61 257 257 51
Public sector entities 0 0 0 0 0 0
Multilateral Development Banks 0 0 0 0 0 0
International Organisations 0 0 0 0 0 0
Institutions 185 185 48 192 190 54
Corporates 30 12 12 38 18 18
of which: SME 0 0 0 0 0 0
Retail 21 14 10 19 19 14
of which: SME 9 1 1 0 0 0
Secured by mortgages on immovable property 0 0 0 0 0 0
of which: SME 0 0 0 0 0 0
Exposures in default 0 0 0 0 0 0 0 0
Items associated with particularly high risk 50 50 75 50 50 75
Covered bonds 0 0 0 0 0 0
Claims on institutions and corporates with a ST credit assessment 0 0 0 0 0 0
Collective investments undertakings (CIU) 52 52 24 59 59 42
Equity 0 0 0 2 2 2
Securitisation
Other exposures 25 25 19 30 30 20
Standardised Total2 0 0
(1) Original exposure, unlike Exposure value, is reported before taking into account any effect due to credit conversion factors or credit risk mitigation techniques (e.g. substitution effects).
(2) Total value adjustments and provisions per country of counterparty does not include Securistisation exposures
6 (mln EUR, %)
Central governments or central banks 0 0 0 0 0 0
Regional governments or local authorities 0 0 0 0 0 0
Public sector entities 0 0 0 0 0 0
Multilateral Development Banks 0 0 0 0 0 0
International Organisations 0 0 0 0 0 0
Institutions 0 0 0 0 0 0
Corporates 0 0 0 56 56 56
of which: SME 0 0 0 0 0 0
Retail 0 0 0 0 0 0
of which: SME 0 0 0 0 0 0
Secured by mortgages on immovable property 0 0 0 0 0 0
of which: SME 0 0 0 0 0 0
Exposures in default 0 0 0 0 34 26 39 6
Items associated with particularly high risk 0 0 0 0 0 0
Covered bonds 0 0 0 0 0 0
Claims on institutions and corporates with a ST credit assessment 0 0 0 0 0 0
Collective investments undertakings (CIU) 0 0 0 0 0 0
Equity 0 0 0 0 0 0
Securitisation
Other exposures 0 0 0 0 0 0
Standardised Total2 0 6
(1) Original exposure, unlike Exposure value, is reported before taking into account any effect due to credit conversion factors or credit risk mitigation techniques (e.g. substitution effects).
(2) Total value adjustments and provisions per country of counterparty does not include Securistisation exposures
7 (mln EUR, %)
Central governments or central banks 216 257 0 183 223 0
Regional governments or local authorities 0 0 0 0 0 0
Public sector entities 470 477 0 239 247 0
Multilateral Development Banks 0 0 0 0 0 0
International Organisations 0 0 0 0 0 0
Institutions 0 0 0 0 0 0
Corporates 131 124 124 134 128 127
of which: SME 0 0 0 0 0 0
Retail 4 4 3 3 3 2
of which: SME 0 0 0 0 0 0
Secured by mortgages on immovable property 0 0 0 0 0 0
of which: SME 0 0 0 0 0 0
Exposures in default 30 30 46 0 30 30 45 0
Items associated with particularly high risk 0 0 0 0 0 0
Covered bonds 25 25 5 15 15 3
Claims on institutions and corporates with a ST credit assessment 0 0 0 0 0 0
Collective investments undertakings (CIU) 232 231 142 292 292 205
Equity 0 0 0 0 0 0
Securitisation
Other exposures 0 0 0 0 0 0
Standardised Total2 0 0
(1) Original exposure, unlike Exposure value, is reported before taking into account any effect due to credit conversion factors or credit risk mitigation techniques (e.g. substitution effects).
(2) Total value adjustments and provisions per country of counterparty does not include Securistisation exposures
Standardised Approach
As of 31/12/2015 As of 30/06/2016
Risk exposure
amount
Value
adjustments and
provisions2
LUXEMBOURG
Standardised Approach
As of 31/12/2015 As of 30/06/2016
Original
Exposure1
Exposure
Value1
Risk exposure
amount
Value
adjustments and
provisions2
Original
Exposure1
Exposure
Value1
Risk exposure
amount
Value
adjustments and
provisions2
SWITZERLAND
Standardised Approach
As of 31/12/2015 As of 30/06/2016
Original
Exposure1
Exposure
Value1
Risk exposure
amount
Value
adjustments and
provisions2
Original
Exposure1
Exposure
Value1
Risk exposure
amount
Value
adjustments and
provisions2
MARSHALL
ISLANDS
Standardised Approach
As of 31/12/2015 As of 30/06/2016
Original
Exposure1
Exposure
Value1
Risk exposure
amount
Value
adjustments and
provisions2
Original
Exposure1
Exposure
Value1
Risk exposure
amount
Value
adjustments and
provisions2
FRANCE
Original
Exposure1
Exposure
Value1
Risk exposure
amount
Value
adjustments and
provisions2
Original
Exposure1
Exposure
Value1

2016 EU-wide Transparency Exercise
Credit Risk - Standardised Approach
Deutsche Zentral-Genossenschaftsbank AG
8 (mln EUR, %)
Central governments or central banks 368 368 0 377 470 0
Regional governments or local authorities 0 0 0 0 0 0
Public sector entities 0 121 0 0 26 0
Multilateral Development Banks 0 0 0 0 0 0
International Organisations 0 0 0 0 0 0
Institutions 32 32 6 28 28 6
Corporates 502 343 293 496 377 326
of which: SME 0 0 0 0 0 0
Retail 2 1 1 2 1 1
of which: SME 0 0 0 0 0 0
Secured by mortgages on immovable property 0 0 0 0 0 0
of which: SME 0 0 0 0 0 0
Exposures in default 6 3 3 2 6 3 3 2
Items associated with particularly high risk 0 0 0 0 0 0
Covered bonds 29 29 6 28 28 6
Claims on institutions and corporates with a ST credit assessment 0 0 0 1 1 1
Collective investments undertakings (CIU) 125 125 65 132 132 78
Equity 119 119 119 127 127 127
Securitisation
Other exposures 0 0 0 0 0 0
Standardised Total2 3 13
(1) Original exposure, unlike Exposure value, is reported before taking into account any effect due to credit conversion factors or credit risk mitigation techniques (e.g. substitution effects).
(2) Total value adjustments and provisions per country of counterparty does not include Securistisation exposures
9 (mln EUR, %)
Central governments or central banks 4 4 0 4 4 0
Regional governments or local authorities 1,902 1,926 0 1,849 1,872 0
Public sector entities 29 4 2 30 6 6
Multilateral Development Banks 0 0 0 0 0 0
International Organisations 0 0 0 0 0 0
Institutions 3 3 2 3 3 1
Corporates 2 1 1 3 1 1
of which: SME 0 0 0 0 0 0
Retail 0 0 0 0 0 0
of which: SME 0 0 0 0 0 0
Secured by mortgages on immovable property 0 0 0 0 0 0
of which: SME 0 0 0 0 0 0
Exposures in default 15 11 11 3 15 3 3 12
Items associated with particularly high risk 0 0 0 0 0 0
Covered bonds 75 75 15 53 53 11
Claims on institutions and corporates with a ST credit assessment 0 0 0 0 0 0
Collective investments undertakings (CIU) 140 140 77 169 169 130
Equity 0 0 0 0 0 0
Securitisation
Other exposures 0 0 0 0 0 0
Standardised Total2 5 13
(1) Original exposure, unlike Exposure value, is reported before taking into account any effect due to credit conversion factors or credit risk mitigation techniques (e.g. substitution effects).
(2) Total value adjustments and provisions per country of counterparty does not include Securistisation exposures
10 (mln EUR, %)
Central governments or central banks 682 702 0 720 740 0
Regional governments or local authorities 0 112 0 0 3 0
Public sector entities 0 0 0 0 0 0
Multilateral Development Banks 0 0 0 0 0 0
International Organisations 0 0 0 0 0 0
Institutions 32 33 7 14 14 3
Corporates 139 59 57 106 34 31
of which: SME 2 1 1 0 0 0
Retail 351 346 259 427 412 309
of which: SME 0 0 0 0 0 0
Secured by mortgages on immovable property 0 0 0 0 0 0
of which: SME 0 0 0 0 0 0
Exposures in default 65 28 41 37 39 28 41 11
Items associated with particularly high risk 0 0 0 0 0 0
Covered bonds 0 0 0 0 0 0
Claims on institutions and corporates with a ST credit assessment 0 0 0 0 0 0
Collective investments undertakings (CIU) 35 35 32 30 30 29
Equity 18 18 18 0 0 0
Securitisation
Other exposures 0 0 0 0 0 0
Standardised Total2 43 17
(1) Original exposure, unlike Exposure value, is reported before taking into account any effect due to credit conversion factors or credit risk mitigation techniques (e.g. substitution effects).
(2) Total value adjustments and provisions per country of counterparty does not include Securistisation exposures
Standardised Approach
As of 31/12/2015 As of 30/06/2016
Risk exposure
amount
Value
adjustments and
provisions2
NETHERLANDS
Standardised Approach
As of 31/12/2015 As of 30/06/2016
Original
Exposure1
Exposure
Value1
Risk exposure
amount
Value
adjustments and
provisions2
Original
Exposure1
Exposure
Value1
Risk exposure
amount
Value
adjustments and
provisions2
SPAIN
Standardised Approach
As of 31/12/2015 As of 30/06/2016
Original
Exposure1
Exposure
Value1
Risk exposure
amount
Value
adjustments and
provisions2
Original
Exposure1
Exposure
Value1
Risk exposure
amount
Value
adjustments and
provisions2
AUSTRIA
Original
Exposure1
Exposure
Value1
Risk exposure
amount
Value
adjustments and
provisions2
Original
Exposure1
Exposure
Value1

201512 201512 201512 201512 201512 201512 201606 201606 201606 201606 201606 201606
(mln EUR, %)
Of which:
defaulted
Of which:
defaulted
Of which:
defaulted
Of which:
defaulted
Central banks and central governments 5,202 12 5,492 723 4 7 9,429 0 9,731 1,006 4 16
Institutions 35,658 211 35,227 7,224 5 174 36,059 142 35,748 7,190 5 133
Corporates 81,153 3,264 70,420 26,730 0 1,404 82,288 3,450 71,329 28,877 0 1,335
Corporates - Of Which: Specialised Lending 22,726 796 20,626 9,945 0 452 24,099 686 21,715 10,757 0 411
Corporates - Of Which: SME 2,018 132 1,315 899 0 107 2,034 49 1,253 903 0 43
Retail 51,254 371 51,250 11,315 288 584 52,349 352 52,349 11,391 290 551
Retail - Secured on real estate property 36,743 48 36,739 6,287 19 164 37,746 38 37,746 6,273 15 157
Retail - Secured on real estate property - Of Which: SME 0 0 0 0 0 0 0 0 0 0 0 0
Retail - Secured on real estate property - Of Which: non-
SME
36,743 48 36,739 6,287 19 164 37,746 38 37,746 6,273 15 157
Retail - Qualifying Revolving 0 0 0 0 0 0 0 0 0 0 0 0
Retail - Other Retail 14,511 323 14,511 5,028 270 421 14,603 314 14,603 5,118 275 394
Retail - Other Retail - Of Which: SME 1 0 1 0 0 0 0 0 0 0 0 0
Retail - Other Retail - Of Which: non-SME 14,511 323 14,511 5,028 270 421 14,603 314 14,603 5,118 275 394
Equity 422 0 422 1,693 0 213 0 213 914 0
Securitisation 3,447 3,447 1,863 3 3,756 3,681 3,221 4
Other non credit-obligation assets 2,149 1,861
IRB Total 51,697 54,459(1)
Original exposure, unlike Exposure value, is reported before taking into account any effect due to credit conversion factors or credit risk mitigation techniques (e.g. substitution effects).
1 (mln EUR, %)
Of which:
defaulted
Of which:
defaulted
Of which:
defaulted
Of which:
defaulted
Central banks and central governments 265 0 265 14 0 0 239 0 239 12 0 0
Institutions 14,177 0 14,427 2,937 1 3 14,646 0 14,875 3,123 2 3
Corporates 44,005 1,438 36,627 18,311 0 953 45,201 1,325 37,585 18,763 0 918
Corporates - Of Which: Specialised Lending 16,194 541 14,999 7,023 0 338 16,759 457 15,493 7,490 0 298
Corporates - Of Which: SME 2,006 132 1,310 894 0 107 2,021 49 1,247 898 0 43
Retail 49,242 368 49,238 10,883 286 371 50,369 349 50,369 10,966 287 368
Retail - Secured on real estate property 35,219 47 35,214 5,942 19 21 36,218 38 36,218 5,930 15 17
Retail - Secured on real estate property - Of Which: SME 0 0 0 0 0 0 0 0 0 0 0 0
Retail - Secured on real estate property - Of Which: non-
SME
35,219 47 35,214 5,942 19 21 36,218 38 36,218 5,930 15 17
Retail - Qualifying Revolving 0 0 0 0 0 0 0 0 0 0 0 0
Retail - Other Retail 14,024 320 14,024 4,941 267 350 14,151 311 14,151 5,036 272 351
Retail - Other Retail - Of Which: SME 1 0 1 0 0 0 0 0 0 0 0 0
Retail - Other Retail - Of Which: non-SME 14,023 320 14,023 4,941 267 350 14,151 311 14,151 5,036 272 351
Equity 321 0 321 1,318 0 0 201 0 201 868 0 0
Securitisation
Other non credit-obligation assets
IRB Total(1)
Original exposure, unlike Exposure value, is reported before taking into account any effect due to credit conversion factors or credit risk mitigation techniques (e.g. substitution effects).
2 (mln EUR, %)
Of which:
defaulted
Of which:
defaulted
Of which:
defaulted
Of which:
defaulted
Central banks and central governments 233 0 254 20 0 0 3,765 0 3,791 303 0 0
Institutions 2,004 24 2,004 368 0 25 1,892 0 1,892 289 0 0
Corporates 5,410 64 4,854 1,410 0 36 5,260 98 4,719 1,345 0 31
Corporates - Of Which: Specialised Lending 1,062 50 893 630 0 25 979 50 818 612 0 24
Corporates - Of Which: SME 1 0 1 1 0 0 1 0 0 0 0 0
Retail 13 0 13 3 0 0 12 0 12 3 0 0
Retail - Secured on real estate property 10 0 10 2 0 0 10 0 10 2 0 0
Retail - Secured on real estate property - Of Which: SME 0 0 0 0 0 0 0 0 0 0 0 0
Retail - Secured on real estate property - Of Which: non-
SME
10 0 10 2 0 0 10 0 10 2 0 0
Retail - Qualifying Revolving 0 0 0 0 0 0 0 0 0 0 0 0
Retail - Other Retail 2 0 2 0 0 0 3 0 3 0 0 0
Retail - Other Retail - Of Which: SME 0 0 0 0 0 0 0 0 0 0 0 0
Retail - Other Retail - Of Which: non-SME 2 0 2 0 0 0 3 0 3 0 0 0
Equity 0 0 0 0 0 0 0 0 0 0 0 0
Securitisation
Other non credit-obligation assets
IRB Total(1)
Original exposure, unlike Exposure value, is reported before taking into account any effect due to credit conversion factors or credit risk mitigation techniques (e.g. substitution effects).
3 (mln EUR, %)
Of which:
defaulted
Of which:
defaulted
Of which:
defaulted
Of which:
defaulted
Central banks and central governments 0 0 5 0 0 0 0 0 5 0 0 0
Institutions 4,349 33 4,285 554 1 34 5,020 33 4,914 601 1 34
Corporates 1,500 20 1,347 559 0 7 1,421 30 1,301 462 0 16
Corporates - Of Which: Specialised Lending 478 10 418 215 0 3 468 8 429 219 0 3
Corporates - Of Which: SME 0 0 0 0 0 0 0 0 0 0 0 0
Retail 10 0 10 2 0 0 10 0 10 2 0 0
Retail - Secured on real estate property 8 0 8 2 0 0 7 0 7 2 0 0
Retail - Secured on real estate property - Of Which: SME 0 0 0 0 0 0 0 0 0 0 0 0
Retail - Secured on real estate property - Of Which: non-
SME
8 0 8 2 0 0 7 0 7 2 0 0
Retail - Qualifying Revolving 0 0 0 0 0 0 0 0 0 0 0 0
Retail - Other Retail 3 0 3 1 0 0 3 0 3 1 0 0
Retail - Other Retail - Of Which: SME 0 0 0 0 0 0 0 0 0 0 0 0
Retail - Other Retail - Of Which: non-SME 3 0 3 1 0 0 3 0 3 1 0 0
Equity 97 0 97 359 0 0 7 0 7 26 0 0
Securitisation
Other non credit-obligation assets
IRB Total(1)
Original exposure, unlike Exposure value, is reported before taking into account any effect due to credit conversion factors or credit risk mitigation techniques (e.g. substitution effects).
2016 EU-wide Transparency Exercise
Credit Risk - IRB Approach
Deutsche Zentral-Genossenschaftsbank AG
IRB Approach
As of 31/12/2015 As of 30/06/2016
Risk exposure amount Value
adjustments
and
provisions
Consolidated data
IRB Approach
As of 31/12/2015 As of 30/06/2016
Original Exposure1
Exposure
Value1
Risk exposure amount Value
adjustments
and
provisions
Original Exposure1
Exposure
Value1
Risk exposure amount Value
adjustments
and
provisions
GERMANY
IRB Approach
As of 31/12/2015 As of 30/06/2016
Original Exposure1
Exposure
Value1
Risk exposure amount Value
adjustments
and
provisions
Original Exposure1
Exposure
Value1
Risk exposure amount Value
adjustments
and
provisions
UNITED STATES
IRB Approach
As of 31/12/2015 As of 30/06/2016
Original Exposure1
Exposure
Value1
Risk exposure amount Value
adjustments
and
provisions
Original Exposure1
Exposure
Value1
Risk exposure amount Value
adjustments
and
provisions
UNITED KINGDOM
Original Exposure1
Exposure
Value1
Risk exposure amount Value
adjustments
and
provisions
Original Exposure1
Exposure
Value1

2016 EU-wide Transparency Exercise
Credit Risk - IRB Approach
Deutsche Zentral-Genossenschaftsbank AG
4 (mln EUR, %)
Of which:
defaulted
Of which:
defaulted
Of which:
defaulted
Of which:
defaulted
Central banks and central governments 0 0 0 0 0 0 0 0 0 0 0 0
Institutions 871 0 853 102 0 0 493 0 478 83 0 0
Corporates 2,003 0 1,945 800 0 2 2,670 13 2,569 1,011 0 2
Corporates - Of Which: Specialised Lending 1,804 0 1,757 669 0 1 2,378 0 2,292 882 0 2
Corporates - Of Which: SME 0 0 0 0 0 0 0 0 0 0 0 0
Retail 25 0 25 9 0 0 25 0 25 8 0 0
Retail - Secured on real estate property 21 0 21 8 0 0 21 0 21 7 0 0
Retail - Secured on real estate property - Of Which: SME 0 0 0 0 0 0 0 0 0 0 0 0
Retail - Secured on real estate property - Of Which: non-
SME
21 0 21 8 0 0 21 0 21 7 0 0
Retail - Qualifying Revolving 0 0 0 0 0 0 0 0 0 0 0 0
Retail - Other Retail 4 0 4 1 0 0 4 0 4 1 0 0
Retail - Other Retail - Of Which: SME 0 0 0 0 0 0 0 0 0 0 0 0
Retail - Other Retail - Of Which: non-SME 4 0 4 1 0 0 4 0 4 1 0 0
Equity 4 0 4 16 0 0 4 0 4 15 0 0
Securitisation
Other non credit-obligation assets
IRB Total(1)
Original exposure, unlike Exposure value, is reported before taking into account any effect due to credit conversion factors or credit risk mitigation techniques (e.g. substitution effects).
5 (mln EUR, %)
Of which:
defaulted
Of which:
defaulted
Of which:
defaulted
Of which:
defaulted
Central banks and central governments 1,818 0 1,824 145 0 0 2,458 0 2,465 197 0 0
Institutions 1,439 52 1,441 249 0 37 1,303 52 1,303 281 0 37
Corporates 811 0 430 221 0 1 718 0 427 231 0 1
Corporates - Of Which: Specialised Lending 140 0 49 26 0 0 134 0 47 24 0 0
Corporates - Of Which: SME 4 0 0 0 0 0 3 0 0 0 0 0
Retail 87 1 87 15 1 1 93 1 93 15 0 1
Retail - Secured on real estate property 23 0 23 7 0 0 25 0 25 7 0 0
Retail - Secured on real estate property - Of Which: SME 0 0 0 0 0 0 0 0 0 0 0 0
Retail - Secured on real estate property - Of Which: non-
SME
23 0 23 7 0 0 25 0 25 7 0 0
Retail - Qualifying Revolving 0 0 0 0 0 0 0 0 0 0 0 0
Retail - Other Retail 64 1 64 8 1 1 68 1 68 8 0 1
Retail - Other Retail - Of Which: SME 0 0 0 0 0 0 0 0 0 0 0 0
Retail - Other Retail - Of Which: non-SME 64 1 64 8 1 1 68 1 68 8 0 1
Equity 0 0 0 0 0 0 0 0 0 0 0 0
Securitisation
Other non credit-obligation assets
IRB Total(1)
Original exposure, unlike Exposure value, is reported before taking into account any effect due to credit conversion factors or credit risk mitigation techniques (e.g. substitution effects).
6 (mln EUR, %)
Of which:
defaulted
Of which:
defaulted
Of which:
defaulted
Of which:
defaulted
Central banks and central governments 0 0 0 0 0 0 0 0 0 0 0 0
Institutions 0 0 0 0 0 0 0 0 0 0 0 0
Corporates 4,906 686 4,786 930 0 156 4,622 695 4,512 1,138 0 126
Corporates - Of Which: Specialised Lending 85 0 5 4 0 1 73 0 4 4 0 1
Corporates - Of Which: SME 0 0 0 0 0 0 0 0 0 0 0 0
Retail 0 0 0 0 0 0 0 0 0 0 0 0
Retail - Secured on real estate property 0 0 0 0 0 0 0 0 0 0 0 0
Retail - Secured on real estate property - Of Which: SME 0 0 0 0 0 0 0 0 0 0 0 0
Retail - Secured on real estate property - Of Which: non-
SME
0 0 0 0 0 0 0 0 0 0 0 0
Retail - Qualifying Revolving 0 0 0 0 0 0 0 0 0 0 0 0
Retail - Other Retail 0 0 0 0 0 0 0 0 0 0 0 0
Retail - Other Retail - Of Which: SME 0 0 0 0 0 0 0 0 0 0 0 0
Retail - Other Retail - Of Which: non-SME 0 0 0 0 0 0 0 0 0 0 0 0
Equity 0 0 0 0 0 0 0 0 0 0 0 0
Securitisation
Other non credit-obligation assets
IRB Total(1)
Original exposure, unlike Exposure value, is reported before taking into account any effect due to credit conversion factors or credit risk mitigation techniques (e.g. substitution effects).
7 (mln EUR, %)
Of which:
defaulted
Of which:
defaulted
Of which:
defaulted
Of which:
defaulted
Central banks and central governments 132 0 129 10 0 0 309 0 306 24 0 0
Institutions 2,732 0 2,728 483 0 1 3,059 0 3,055 448 0 0
Corporates 830 24 783 252 0 12 842 23 826 257 0 10
Corporates - Of Which: Specialised Lending 396 24 309 162 0 12 401 23 316 148 0 10
Corporates - Of Which: SME 0 0 0 0 0 0 0 0 0 0 0 0
Retail 60 0 60 14 0 0 59 0 59 13 0 0
Retail - Secured on real estate property 52 0 52 12 0 0 50 0 50 11 0 0
Retail - Secured on real estate property - Of Which: SME 0 0 0 0 0 0 0 0 0 0 0 0
Retail - Secured on real estate property - Of Which: non-
SME
52 0 52 12 0 0 50 0 50 11 0 0
Retail - Qualifying Revolving 0 0 0 0 0 0 0 0 0 0 0 0
Retail - Other Retail 9 0 9 2 0 0 9 0 9 2 0 0
Retail - Other Retail - Of Which: SME 0 0 0 0 0 0 0 0 0 0 0 0
Retail - Other Retail - Of Which: non-SME 9 0 9 2 0 0 9 0 9 2 0 0
Equity 0 0 0 0 0 0 0 0 0 0 0 0
Securitisation
Other non credit-obligation assets
IRB Total(1)
Original exposure, unlike Exposure value, is reported before taking into account any effect due to credit conversion factors or credit risk mitigation techniques (e.g. substitution effects).
IRB Approach
As of 31/12/2015 As of 30/06/2016
Risk exposure amount Value
adjustments
and
provisions
LUXEMBOURG
IRB Approach
As of 31/12/2015 As of 30/06/2016
Original Exposure1
Exposure
Value1
Risk exposure amount Value
adjustments
and
provisions
Original Exposure1
Exposure
Value1
Risk exposure amount Value
adjustments
and
provisions
SWITZERLAND
IRB Approach
As of 31/12/2015 As of 30/06/2016
Original Exposure1
Exposure
Value1
Risk exposure amount Value
adjustments
and
provisions
Original Exposure1
Exposure
Value1
Risk exposure amount Value
adjustments
and
provisions
MARSHALL ISLANDS
IRB Approach
As of 31/12/2015 As of 30/06/2016
Original Exposure1
Exposure
Value1
Risk exposure amount Value
adjustments
and
provisions
Original Exposure1
Exposure
Value1
Risk exposure amount Value
adjustments
and
provisions
FRANCE
Original Exposure1
Exposure
Value1
Risk exposure amount Value
adjustments
and
provisions
Original Exposure1
Exposure
Value1
2016 EU-wide Transparency Exercise
Credit Risk - IRB Approach
Deutsche Zentral-Genossenschaftsbank AG
8 (mln EUR, %)
Of which:
defaulted
Of which:
defaulted
Of which:
defaulted
Of which:
defaulted
Central banks and central governments 212 0 212 24 0 0 178 0 178 24 0 0
Institutions 979 0 968 209 0 0 963 0 965 160 0 0
Corporates 1,716 140 1,530 568 0 41 1,748 127 1,552 635 0 32
Corporates - Of Which: Specialised Lending 483 40 439 173 0 20 560 38 513 222 0 20
Corporates - Of Which: SME 1 0 1 1 0 0 0 0 0 0 0 0
Retail 33 0 33 6 0 0 35 0 35 7 0 0
Retail - Secured on real estate property 29 0 29 5 0 0 31 0 31 6 0 0
Retail - Secured on real estate property - Of Which: SME 0 0 0 0 0 0 0 0 0 0 0 0
Retail - Secured on real estate property - Of Which: non-
SME
29 0 29 5 0 0 31 0 31 6 0 0
Retail - Qualifying Revolving 0 0 0 0 0 0 0 0 0 0 0 0
Retail - Other Retail 5 0 5 1 0 0 4 0 4 1 0 0
Retail - Other Retail - Of Which: SME 0 0 0 0 0 0 0 0 0 0 0 0
Retail - Other Retail - Of Which: non-SME 5 0 5 1 0 0 4 0 4 1 0 0
Equity 0 0 0 0 0 0 0 0 0 0 0 0
Securitisation
Other non credit-obligation assets
IRB Total(1)
Original exposure, unlike Exposure value, is reported before taking into account any effect due to credit conversion factors or credit risk mitigation techniques (e.g. substitution effects).
9 (mln EUR, %)
Of which:
defaulted
Of which:
defaulted
Of which:
defaulted
Of which:
defaulted
Central banks and central governments 0 0 0 0 0 0 0 0 0 0 0 0
Institutions 1,458 0 1,457 336 0 1 849 0 848 210 0 1
Corporates 104 0 97 55 0 0 175 0 158 80 0 0
Corporates - Of Which: Specialised Lending 9 0 9 4 0 0 11 0 11 3 0 0
Corporates - Of Which: SME 0 0 0 0 0 0 0 0 0 0 0 0
Retail 6 0 6 1 0 0 6 0 6 1 0 0
Retail - Secured on real estate property 2 0 2 0 0 0 2 0 2 0 0 0
Retail - Secured on real estate property - Of Which: SME 0 0 0 0 0 0 0 0 0 0 0 0
Retail - Secured on real estate property - Of Which: non-
SME
2 0 2 0 0 0 2 0 2 0 0 0
Retail - Qualifying Revolving 0 0 0 0 0 0 0 0 0 0 0 0
Retail - Other Retail 4 0 4 1 0 0 4 0 4 1 0 0
Retail - Other Retail - Of Which: SME 0 0 0 0 0 0 0 0 0 0 0 0
Retail - Other Retail - Of Which: non-SME 4 0 4 1 0 0 4 0 4 1 0 0
Equity 0 0 0 0 0 0 0 0 0 0 0 0
Securitisation
Other non credit-obligation assets
IRB Total(1)
Original exposure, unlike Exposure value, is reported before taking into account any effect due to credit conversion factors or credit risk mitigation techniques (e.g. substitution effects).
10 (mln EUR, %)
Of which:
defaulted
Of which:
defaulted
Of which:
defaulted
Of which:
defaulted
Central banks and central governments 224 0 224 18 0 0 228 0 228 18 0 0
Institutions 1,056 0 958 381 0 1 1,074 0 1,083 425 0 1
Corporates 922 0 620 267 0 2 1,030 0 716 354 0 3
Corporates - Of Which: Specialised Lending 229 0 181 59 0 0 201 0 156 58 0 1
Corporates - Of Which: SME 0 0 0 0 0 0 1 0 1 1 0 0
Retail 47 0 47 9 0 0 48 0 48 9 0 0
Retail - Secured on real estate property 38 0 38 7 0 0 40 0 40 7 0 0
Retail - Secured on real estate property - Of Which: SME 0 0 0 0 0 0 0 0 0 0 0 0
Retail - Secured on real estate property - Of Which: non-
SME
38 0 38 7 0 0 40 0 40 7 0 0
Retail - Qualifying Revolving 0 0 0 0 0 0 0 0 0 0 0 0
Retail - Other Retail 9 0 9 2 0 0 8 0 8 2 0 0
Retail - Other Retail - Of Which: SME 0 0 0 0 0 0 0 0 0 0 0 0
Retail - Other Retail - Of Which: non-SME 9 0 9 2 0 0 8 0 8 2 0 0
Equity 0 0 0 0 0 0 0 0 0 0 0 0
Securitisation
Other non credit-obligation assets
IRB Total(1)
Original exposure, unlike Exposure value, is reported before taking into account any effect due to credit conversion factors or credit risk mitigation techniques (e.g. substitution effects).
IRB Approach
As of 31/12/2015 As of 30/06/2016
Risk exposure amount Value
adjustments
and
provisions
NETHERLANDS
IRB Approach
As of 31/12/2015 As of 30/06/2016
Original Exposure1
Exposure
Value1
Risk exposure amount Value
adjustments
and
provisions
Original Exposure1
Exposure
Value1
Risk exposure amount Value
adjustments
and
provisions
SPAIN
IRB Approach
As of 31/12/2015 As of 30/06/2016
Original Exposure1
Exposure
Value1
Risk exposure amount Value
adjustments
and
provisions
Original Exposure1
Exposure
Value1
Risk exposure amount Value
adjustments
and
provisions
AUSTRIA
Original Exposure1
Exposure
Value1
Risk exposure amount Value
adjustments
and
provisions
Original Exposure1
Exposure
Value1
201512 201512 201512 201512 201512 201512 201512 201512 201512 201512 201512 201512 201512 201512 201512 201512 201512 201512
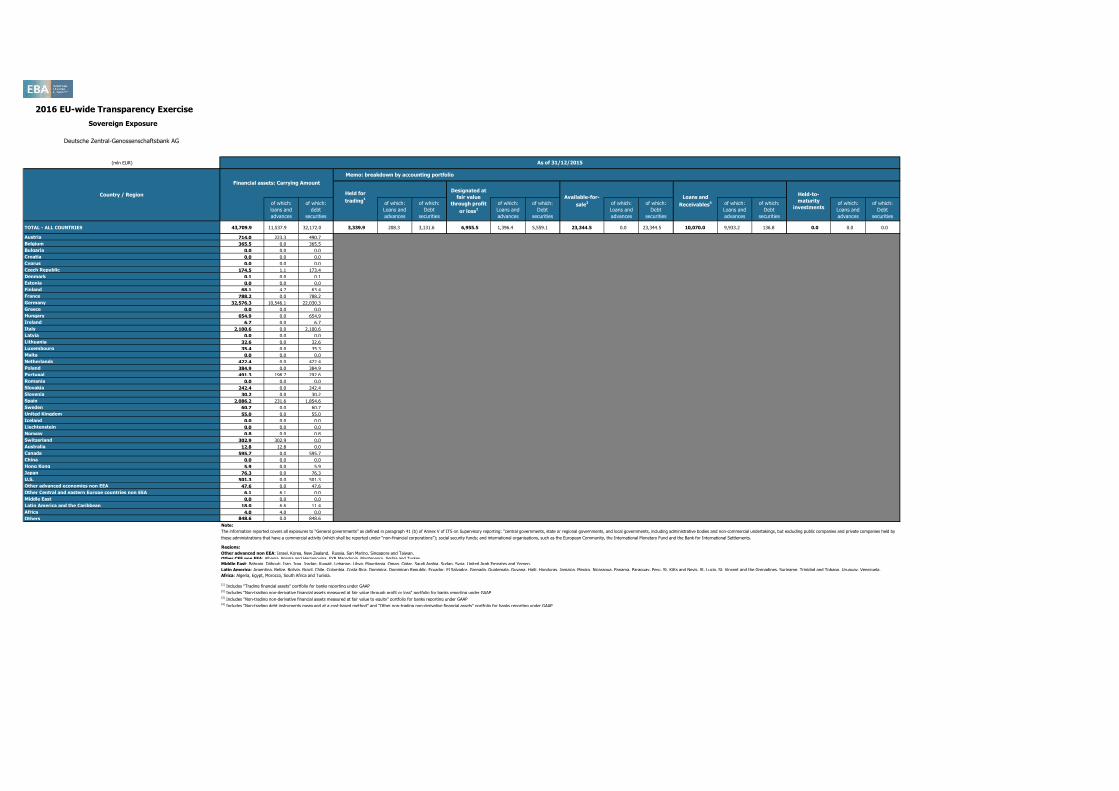
2016 EU-wide Transparency Exercise
Sovereign Exposure
Deutsche Zentral-Genossenschaftsbank AG
(mln EUR)
of which:
loans and
advances
of which:
debt
securities
of which:
Loans and
advances
of which:
Debt
securities
of which:
Loans and
advances
of which:
Debt
securities
of which:
Loans and
advances
of which:
Debt
securities
of which:
Loans and
advances
of which:
Debt
securities
of which:
Loans and
advances
of which:
Debt
securities
TOTAL - ALL COUNTRIES 43,709.9 11,537.9 32,172.0 3,339.9 208.3 3,131.6 6,955.5 1,396.4 5,559.1 23,344.5 0.0 23,344.5 10,070.0 9,933.2 136.8 0.0 0.0 0.0
Austria 714.0 223.3 490.7
Belgium 365.5 0.0 365.5
Bulgaria 0.0 0.0 0.0
Croatia 0.0 0.0 0.0
Cyprus 0.0 0.0 0.0
Czech Republic 174.5 1.1 173.4
Denmark 0.1 0.0 0.1
Estonia 0.0 0.0 0.0
Finland 68.1 4.7 63.4
France 788.2 0.0 788.2
Germany 32,576.3 10,546.1 22,030.3
Greece 0.0 0.0 0.0
Hungary 654.9 0.0 654.9
Ireland 6.7 0.0 6.7
Italy 2,100.6 0.0 2,100.6
Latvia 0.0 0.0 0.0
Lithuania 32.6 0.0 32.6
Luxembourg 35.4 0.0 35.3
Malta 0.0 0.0 0.0
Netherlands 422.4 0.0 422.4
Poland 384.9 0.0 384.9
Portugal 491.3 198.7 292.6
Romania 0.0 0.0 0.0
Slovakia 242.4 0.0 242.4
Slovenia 30.2 0.0 30.2
Spain 2,086.2 231.6 1,854.6
Sweden 60.7 0.0 60.7
United Kingdom 55.0 0.0 55.0
Iceland 0.0 0.0 0.0
Liechtenstein 0.0 0.0 0.0
Norway 0.8 0.0 0.8
Switzerland 302.9 302.9 0.0
Australia 12.8 12.8 0.0
Canada 595.7 0.0 595.7
China 0.0 0.0 0.0
Hong Kong 5.9 0.0 5.9
Japan 76.3 0.0 76.3
U.S. 501.3 0.0 501.3
Other advanced economies non EEA 47.6 0.0 47.6
Other Central and eastern Europe countries non EEA 6.1 6.1 0.0
Middle East 0.0 0.0 0.0
Latin America and the Caribbean 18.0 6.6 11.4
Africa 4.0 4.0 0.0
Others 848.6 0.0 848.6
Note:
The information reported covers all exposures to “General governments” as defined in paragraph 41 (b) of Annex V of ITS on Supervisory reporting: “central governments, state or regional governments, and local governments, including administrative bodies and non-commercial undertakings, but excluding public companies and private companies held by
these administrations that have a commercial activity (which shall be reported under “non-financial corporations”); social security funds; and international organisations, such as the European Community, the International Monetary Fund and the Bank for International Settlements.
Regions:
Other advanced non EEA: Israel, Korea, New Zealand, Russia, San Marino, Singapore and Taiwan.
Other CEE non EEA: Albania, Bosnia and Herzegovina, FYR Macedonia, Montenegro, Serbia and Turkey.
Middle East: Bahrain, Djibouti, Iran, Iraq, Jordan, Kuwait, Lebanon, Libya, Mauritania, Oman, Qatar, Saudi Arabia, Sudan, Syria, United Arab Emirates and Yemen.
Latin America: Argentina, Belize, Bolivia, Brazil, Chile, Colombia, Costa Rica, Dominica, Dominican Republic, Ecuador, El Salvador, Grenada, Guatemala, Guyana, Haiti, Honduras, Jamaica, Mexico, Nicaragua, Panama, Paraguay, Peru, St. Kitts and Nevis, St. Lucia, St. Vincent and the Grenadines, Suriname, Trinidad and Tobago, Uruguay, Venezuela.
Africa: Algeria, Egypt, Morocco, South Africa and Tunisia.
(1) Includes "Trading financial assets" portfolio for banks reporting under GAAP(2) Includes "Non-trading non-derivative financial assets measured at fair value through profit or loss" portfolio for banks reporting under GAAP(3) Includes "Non-trading non-derivative financial assets measured at fair value to equity" portfolio for banks reporting under GAAP(4) Includes "Non-trading debt instruments measured at a cost-based method" and "Other non-trading non-derivative financial assets" portfolio for banks reporting under GAAP
As of 31/12/2015
Country / Region
Financial assets: Carrying Amount
Memo: breakdown by accounting portfolio
Held for
trading1
Designated at
fair value
through profit
or loss2
Available-for-
sale3
Loans and
Receivables4
Held-to-
maturity
investments
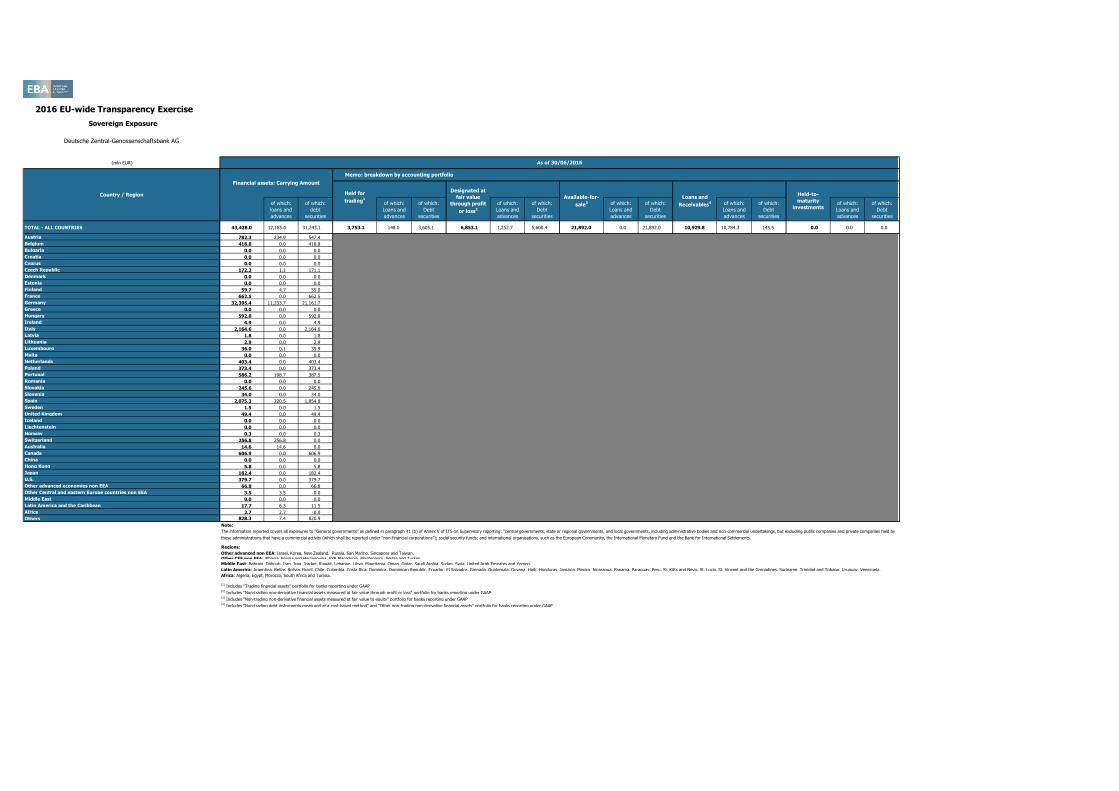
2016 EU-wide Transparency Exercise
Sovereign Exposure
Deutsche Zentral-Genossenschaftsbank AG
(mln EUR)
TOTAL - ALL COUNTRIES
Austria
Belgium
Bulgaria
Croatia
Cyprus
Czech Republic
Denmark
Estonia
Finland
France
Germany
Greece
Hungary
Ireland
Italy
Latvia
Lithuania
Luxembourg
Malta
Netherlands
Poland
Portugal
Romania
Slovakia
Slovenia
Spain
Sweden
United Kingdom
Iceland
Liechtenstein
Norway
Switzerland
Australia
Canada
China
Hong Kong
Japan
U.S.
Other advanced economies non EEA
Other Central and eastern Europe countries non EEA
Middle East
Latin America and the Caribbean
Africa
Others
Country / Region
201606 201606 201606 201606 201606 201606 201606 201606 201606 201606 201606 201606 201606 201606 201606 201606 201606 201606
of which:
loans and
advances
of which:
debt
securities
of which:
Loans and
advances
of which:
Debt
securities
of which:
Loans and
advances
of which:
Debt
securities
of which:
Loans and
advances
of which:
Debt
securities
of which:
Loans and
advances
of which:
Debt
securities
of which:
Loans and
advances
of which:
Debt
securities
43,428.0 12,185.0 31,243.1 3,753.1 148.0 3,605.1 6,853.1 1,252.7 5,600.4 21,892.0 0.0 21,892.0 10,929.8 10,784.3 145.5 0.0 0.0 0.0
782.3 234.9 547.4
418.8 0.0 418.8
0.0 0.0 0.0
0.0 0.0 0.0
0.0 0.0 0.0
172.2 1.1 171.1
0.0 0.0 0.0
0.0 0.0 0.0
59.7 4.7 55.0
662.5 0.0 662.5
32,395.4 11,233.7 21,161.7
0.0 0.0 0.0
592.8 0.0 592.8
4.9 0.0 4.9
2,164.6 0.0 2,164.6
1.8 0.0 1.8
2.9 0.0 2.9
36.0 0.1 35.9
0.0 0.0 0.0
403.4 0.0 403.4
373.4 0.0 373.4
586.2 198.7 387.5
0.0 0.0 0.0
245.6 0.0 245.6
34.0 0.0 34.0
2,075.3 220.5 1,854.8
1.5 0.0 1.5
49.4 0.0 49.4
0.0 0.0 0.0
0.0 0.0 0.0
0.3 0.0 0.3
256.8 256.8 0.0
14.6 14.6 0.0
606.9 0.0 606.9
0.0 0.0 0.0
5.8 0.0 5.8
182.4 0.0 182.4
379.7 0.0 379.7
66.8 0.0 66.8
3.5 3.5 0.0
0.0 0.0 0.0
17.7 6.3 11.5
2.7 2.7 0.0
828.3 7.4 820.9
Note:
The information reported covers all exposures to “General governments” as defined in paragraph 41 (b) of Annex V of ITS on Supervisory reporting: “central governments, state or regional governments, and local governments, including administrative bodies and non-commercial undertakings, but excluding public companies and private companies held by
these administrations that have a commercial activity (which shall be reported under “non-financial corporations”); social security funds; and international organisations, such as the European Community, the International Monetary Fund and the Bank for International Settlements.
Regions:
Other advanced non EEA: Israel, Korea, New Zealand, Russia, San Marino, Singapore and Taiwan.
Other CEE non EEA: Albania, Bosnia and Herzegovina, FYR Macedonia, Montenegro, Serbia and Turkey.
Middle East: Bahrain, Djibouti, Iran, Iraq, Jordan, Kuwait, Lebanon, Libya, Mauritania, Oman, Qatar, Saudi Arabia, Sudan, Syria, United Arab Emirates and Yemen.
Latin America: Argentina, Belize, Bolivia, Brazil, Chile, Colombia, Costa Rica, Dominica, Dominican Republic, Ecuador, El Salvador, Grenada, Guatemala, Guyana, Haiti, Honduras, Jamaica, Mexico, Nicaragua, Panama, Paraguay, Peru, St. Kitts and Nevis, St. Lucia, St. Vincent and the Grenadines, Suriname, Trinidad and Tobago, Uruguay, Venezuela.
Africa: Algeria, Egypt, Morocco, South Africa and Tunisia.
(1) Includes "Trading financial assets" portfolio for banks reporting under GAAP(2) Includes "Non-trading non-derivative financial assets measured at fair value through profit or loss" portfolio for banks reporting under GAAP(3) Includes "Non-trading non-derivative financial assets measured at fair value to equity" portfolio for banks reporting under GAAP(4) Includes "Non-trading debt instruments measured at a cost-based method" and "Other non-trading non-derivative financial assets" portfolio for banks reporting under GAAP
As of 30/06/2016
Financial assets: Carrying Amount
Memo: breakdown by accounting portfolio
Held-to-
maturity
investments
Held for
trading1
Designated at
fair value
through profit
or loss2
Available-for-
sale3
Loans and
Receivables4

201512 201512 201512 201512 201512 201512 201512 201606 201606 201606 201606 201606 201606 201606
(mln EUR, %)
Of which:
defaulted
Of which:
defaulted
Debt securities (including at amortised cost and fair value) 52,405 0 205 111 763 58 0 49,974 0 180 76 937 49 0
Central banks 16 0 0 0 0 0 0 12 0 0 0 0 0 0
General governments 29,683 0 36 11 642 0 0 28,486 0 54 0 848 0 0
Credit institutions 16,496 0 6 6 36 5 0 16,022 0 0 0 38 0 0
Other financial corporations 4,886 0 147 93 35 53 0 4,200 0 126 76 27 49 0
Non-financial corporations 1,325 0 15 0 50 0 0 1,253 0 0 0 23 0 0
Loans and advances(including at amortised cost and fair value) 219,280 422 4,923 4,523 462 1,788 2,544 236,607 331 5,180 4,898 477 1,670 2,641
Central banks 7,033 0 0 0 0 0 0 24,869 0 0 0 0 0 0
General governments 11,337 0 0 0 8 0 0 12,043 0 1 0 5 0 0
Credit institutions 80,110 21 42 42 19 36 31 76,354 0 40 40 19 10 16
Other financial corporations 7,336 67 356 342 11 115 151 7,690 1 307 287 10 75 159
Non-financial corporations 61,757 95 3,249 2,934 177 1,175 1,696 62,525 215 3,661 3,468 185 1,146 1,925
of which: small and medium-sized enterprises at amortised cost 1,705 1 172 167 7 122 45 1,524 0 108 105 8 67 25
Households 51,707 238 1,276 1,205 247 462 666 53,126 114 1,170 1,102 258 439 541
DEBT INSTRUMENTS other than HFT 271,685 422 5,127 4,634 1,225 1,846 2,544 286,581 331 5,359 4,973 1,415 1,719 2,641
OFF-BALANCE SHEET EXPOSURES 47,473 504 211 47 102 26 48,252 296 283 58 110 23
(1) For the definition of non-performing exposures please refer to COMMISSION IMPLEMENTING REGULATION (EU) 2015/227 of 9 January 2015, ANNEX V, Part 2-Template related instructions, subtitle 29(2) Insitutions report here collective allowances for incurrred but not reported losses (instruments at amortised cost) and changes in fair value of performing exposures due to credit risk and provisions (instruments at fair value other than HFT)(3) Insitutions report here specific allowances for financial assets, individually and collectively estimated (instruments at amortised cost) and changes in fair value of NPE due to credit risk and provisions (instruments at fair value other than HFT)
2016 EU-wide Transparency ExercisePerforming and non-performing exposures
Deutsche Zentral-Genossenschaftsbank AG
As of 31/12/2015 As of 30/06/2016
On non-
performing
exposures3
Collaterals and
financial
guarantees
received on non-
performing
exposures
Of which
performing but
past due >30
days and <=90
days
Of which non-performing1
On performing
exposures2
On non-
performing
exposures3
Of which
performing but
past due >30
days and <=90
days
Of which non-performing1
On performing
exposures2
Gross carrying amount
Accumulated impairment,
accumulated changes in fair
value due to credit risk and
provisionsCollaterals and
financial
guarantees
received on non-
performing
exposures
Gross carrying amount
Accumulated impairment,
accumulated changes in fair
value due to credit risk and
provisions

201512 201512 201512 201512 201512 201606 201606 201606 201606 201606
(mln EUR, %)
Debt securities (including at amortised cost and fair value) 2 2 0 0 0 2 0 0 0 0
Central banks 0 0 0 0 0 0 0 0 0 0
General governments 0 0 0 0 0 0 0 0 0 0
Credit institutions 0 0 0 0 0 0 0 0 0 0
Other financial corporations 0 0 0 0 0 0 0 0 0 0
Non-financial corporations 2 2 0 0 0 2 0 0 0 0
Loans and advances (including at amortised cost and fair value) 3,704 2,904 1,050 1,034 2,139 4,275 3,057 986 966 2,470
Central banks 0 0 0 0 0 0 0 0 0 0
General governments 8 0 0 0 8 8 0 0 0 8
Credit institutions 42 42 34 34 31 21 21 2 2 0
Other financial corporations 224 194 72 72 93 180 152 38 38 84
Non-financial corporations 2,668 2,186 828 825 1,495 3,274 2,413 842 833 1,787
of which: small and medium-sized enterprises at amortised cost 154 147 104 104 39 95 87 51 51 20
Households 762 483 115 103 511 792 471 104 94 591
DEBT INSTRUMENTS other than HFT 3,706 2,906 1,050 1,034 2,139 4,276 3,057 986 966 2,470
Loan commitments given 70 46 10 10 3 48 34 14 14 3
(1) For the definition of forborne exposures please refer to COMMISSION IMPLEMENTING REGULATION (EU) 2015/227 of 9 January 2015, ANNEX V, Part 2-Template related instructions, subtitle 30
2016 EU-wide Transparency ExerciseForborne exposures
Deutsche Zentral-Genossenschaftsbank AG
As of 31/12/2015 As of 30/06/2016
Collateral and
financial
guarantees
received on
exposures with
forbearance
measures
Of which non-
performing
exposures with
forbearance
measures
Of which on non-
performing
exposures with
forbearance
measures
Of which non-
performing
exposures with
forbearance
measures
Of which on non-
performing
exposures with
forbearance
measures
Gross carrying amount of
exposures with forbearance
measures
Accumulated impairment,
accumulated changes in fair value
due to credit risk and provisions
for exposures with forbearance
measures
Collateral and
financial
guarantees
received on
exposures with
forbearance
measures
Gross carrying amount of
exposures with forbearance
measures
Accumulated impairment,
accumulated changes in fair value
due to credit risk and provisions
for exposures with forbearance
measures