2016 Economic and Housing Real Estate Forecast-California Realtors Association
76
2016 ECONOMIC AND HOUSING MARKET FORECAST April 22, 2016 CA Community College Real Estate Education Center Oscar Wei, Senior Economist of C.A.R.
-
Upload
realestateeducation -
Category
Real Estate
-
view
437 -
download
2
Transcript of 2016 Economic and Housing Real Estate Forecast-California Realtors Association

2016 ECONOMIC AND HOUSING MARKET
FORECASTApril 22, 2016
CA Community College Real Estate Education Center
Oscar Wei, Senior Economist of C.A.R.

OVERVIEW
• Economic Outlook
• California Housing Market Outlook
• Regional Housing Market Outlook
• 2016 Forecast

ECONOMIC OUTLOOK

MACRO ECONOMY SUMMARY
1.4%
GDP 2015-Q4
1.9%
Job Growth2016-02
5.0%
Unemployment2016-03
2.2%
Consumption2015-Q4

-4%
-3%
-2%
-1%
0%
1%
2%
3%
4%
5%
2005
2007
2009
2011
2013
2015
Q2-1
1
Q4-1
1
Q2-1
2
Q4-1
2
Q2-1
3
Q4-1
3
Q2-1
4
Q4-1
4
Q2-1
5
Q4-1
5
US GDP: AT RISK FROM WEAK GLOBAL GROWTH?
2015: 2.4%; 2015 Q4: 1.4%; 2016 (F): 2.7%
ANNUAL PERCENT CHANGE, CHAIN-TYPE (2005) $
ANNUALLY QUARTERLY
2009 Largest Annual Drop since 1938 (-3.4%)
SERIES: GDPSOURCE: US Dept. of Commerce, Bureau of Economic Analysis

PROGRESS CONTINUES, UNIMPRESSIVELY
10,000
11,000
12,000
13,000
14,000
15,000
16,000
17,000
18,000
19,000Q
1-0
0
Q1-0
1
Q1-0
2
Q1-0
3
Q1-0
4
Q1-0
5
Q1-0
6
Q1-0
7
Q1-0
8
Q1-0
9
Q1-1
0
Q1-1
1
Q1-1
2
Q1-1
3
Q1-1
4
Q1-1
5
$ B
illio
ns
Actual Trend
SERIES: U.S. Real Gross Domestic Product (GDP)
SOURCE: U.S. Bureau of Economic Analysis
24 Consecutive quarters of yty growth, but still below long-run trend

UNEMPLOYMENT RATES AT 8-YEAR LOWS
US 5.0% (Mar 2016), CA 5.4% (Mar 2016)
0%
2%
4%
6%
8%
10%
12%
14%
Jan
-05
Jul-
05
Jan
-06
Jul-
06
Jan
-07
Jul-
07
Jan
-08
Jul-
08
Jan
-09
Jul-
09
Jan
-10
Jul-
10
Jan
-11
Jul-
11
Jan
-12
Jul-
12
Jan
-13
Jul-
13
Jan
-14
Jul-
14
Jan
-15
Jul-
15
Jan
-16
CA US
SERIES: Unemployment Rate SOURCE: US Bureau of Labor Statistics, CA Employment Development Division

EMPLOYMENT GROWTH, CALIFORNIA VS. U.S.
2.6%
2.0%
-8
-6
-4
-2
0
2
4
6
Jan
-05
Jul-
05
Jan
-06
Jul-
06
Jan
-07
Jul-
07
Jan
-08
Jul-
08
Jan
-09
Jul-
09
Jan
-10
Jul-
10
Jan
-11
Jul-
11
Jan
-12
Jul-
12
Jan
-13
Jul-
13
Jan
-14
Jul-
14
Jan
-15
Jul-
15
Jan
-16
California USANNUAL PERCENT CHANGE
SERIES: Total Nonfarm EmploymentSOURCE: US Bureau of Labor Statistics, CA Employment Development Division

JOB TRENDS BY CALIFORNIA METRO AREA
1.0%
1.4%
2.0%
2.2%
2.3%
2.4%
2.6%
2.9%
3.1%
3.2%
3.3%
3.5%
3.7%
0.0% 0.5% 1.0% 1.5% 2.0% 2.5% 3.0% 3.5% 4.0%
Ventura
Bakersfield
Los Angeles
San Luis Obispo
Oakland
Sacramento
San Diego
Orange County
Fresno MSA
Modesto
Inland Empire
San Jose/Santa Clara
Stockton MSA
SERIES: Total Nonfarm Employment SOURCE: CA Employment Development Division
ANNUAL PERCENT CHANGE
March 2016: CA +2.6%, +420,800
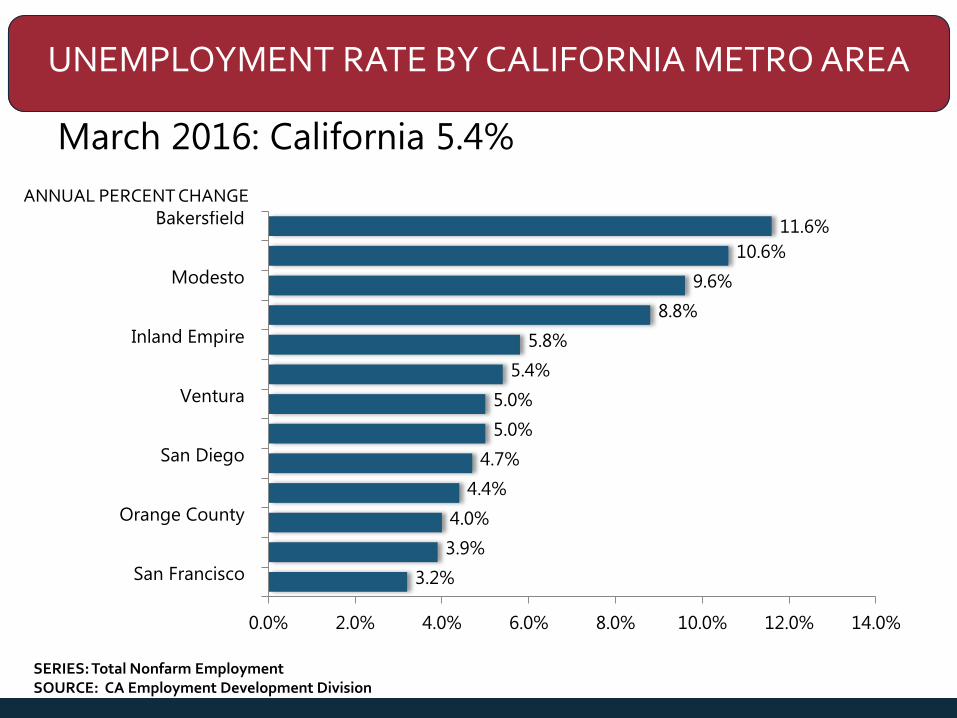
UNEMPLOYMENT RATE BY CALIFORNIA METRO AREA
3.2%
3.9%
4.0%
4.4%
4.7%
5.0%
5.0%
5.4%
5.8%
8.8%
9.6%
10.6%
11.6%
0.0% 2.0% 4.0% 6.0% 8.0% 10.0% 12.0% 14.0%
San Francisco
Orange County
San Diego
Ventura
Inland Empire
Modesto
Bakersfield
SERIES: Total Nonfarm Employment SOURCE: CA Employment Development Division
ANNUAL PERCENT CHANGE
March 2016: California 5.4%

OIL’S DRAG COMING TO CLOSE? MAYBE…
Dollars per Barrel
$0
$20
$40
$60
$80
$100
$120
$140
$160
Mar-
06
No
v-06
Jul-
07
Mar-
08
No
v-08
Jul-
09
Mar-
10
No
v-10
Jul-
11
Mar-
12
No
v-12
Jul-
13
Mar-
14
No
v-14
Jul-
15
Mar-
16
SERIES: Crude Oil Prices: West Texas IntermediateSOURCE: U.S. Energy Information Administration
3rd Week of March: $38.32; 5th consecutive week of growth
74% Drop

CONSUMER CONFIDENCE INDEX
March 2016: 96.2
0
20
40
60
80
100
120
Jan
-05
Jul-
05
Jan
-06
Jul-
06
Jan
-07
Jul-
07
Jan
-08
Jul-
08
Jan
-09
Jul-
09
Jan
-10
Jul-
10
Jan
-11
Jul-
11
Jan
-12
Jul-
12
Jan
-13
Jul-
13
Jan
-14
Jul-
14
Jan
-15
Jul-
15
Jan
-16
INDEX, 100=1985
SERIES: Consumer ConfidenceSOURCE: The Conference Board

MORTGAGE RATES LOWER NOW THAN 2015
January 2009 – March 2016
0%
1%
2%
3%
4%
5%
6%
2009/0
1
2009/0
7
2010/0
1
2010/0
7
2011/0
1
2011/0
7
2012/0
1
2012/0
7
2013/0
1
2013/0
7
2014/0
1
2014/0
7
2015/0
1
2015/0
7
2016/0
1
11.2
6.1
5
01.0
7.1
6
02.1
8.1
6
FRM
MONTHLY WEEKLY
SERIES: 30Yr FRM, 5Yr ARMSOURCE: Freddie Mac

WHERE ARE WE HEADED?
- Fed takes a more dovish tone, leave interest rates unchanged, will gradually increase rates in 2016 and 2017. Action will be “data determined”
- Risk of rates increasing too fast: bringing economic growth to a halt
- Risk of rates increasing too slow: zero leverage when next downturn hits

U.S. ECONOMIC OUTLOOK
2010 2011 2012 2013 2014 2015 2016f
US GDP 2.4% 1.8% 2.3% 2.2% 2.4% 2.4% 2.7%
Nonfarm Job Growth -0.7% 1.2% 1.7% 1.7% 1.9% 2.1% 1.8%
Unemployment 9.6% 8.9% 8.1% 7.4% 6.2% 5.3% 5.0%
CPI 1.6% 3.1% 2.1% 1.5% 1.6% 0.1% 2.1%
Real Disposable
Income, % Change 1.0% 2.5% 3.1% -1.4% 2.7% 3.5% 2.7%
30-Yr FRM 4.7% 4.5% 3.7% 4.0% 4.2% 3.9% 4.5%
SERIES: U.S. Economic OutlookSOURCE: CALIFORNIA ASSOCIATION OF REALTORS®

CALIFORNIA ECONOMIC OUTLOOK
2010 2011 2012 2013 2014 2015 2016f
Nonfarm Job Growth -1.1% 1.1% 2.4% 3.2% 3.1% 3.0% 2.3%
Unemployment Rate 12.3% 11.8% 10.4% 8.9% 7.5% 6.2% 5.5%
Population Growth 0.7% 0.7% 0.7% 0.9% 0.9% 0.9% 0.9%
Real Disposable
Income, % Change 0.9% 3.4% 4.7% 0.2% 3.0% 4.3% 4.5%
SERIES: CA Economic OutlookSOURCE: CALIFORNIA ASSOCIATION OF REALTORS®

CALIFORNIA HOUSING MARKET OUTLOOK

SALES OF EXISTING DETACHED HOMES
California, Mar. 2016 Sales: 415,220 Units, +6.9% YTD, +5.7% YTY
-
100,000
200,000
300,000
400,000
500,000
600,000
700,000
Jan
-05
Sep
-05
May-
06
Jan
-07
Sep
-07
May-
08
Jan
-09
Sep
-09
May-
10
Jan
-11
Sep
-11
May-
12
Jan
-13
Sep
-13
May-
14
Jan
-15
Sep
-15
*Sales are seasonally adjusted and annualized SERIES: Sales of Existing Single Family HomesSOURCE: CALIFORNIA ASSOCIATION OF REALTORS®
Mar16: 415,220
Mar-15: 392,660

HOUSEHOLD FORMATION REBOUNDING
SERIES: Household FormationSOURCE: U.S. Census Bureau, Housing Vacancy Survey
1.5
1.9
1.2
0.60.4
0.6 0.6 0.6
0.9
0.7
1.0
1.3
0.0
0.2
0.4
0.6
0.8
1.0
1.2
1.4
1.6
1.8
2.0
2004 2005 2006 2007 2008 2009 2010 2011 2012 2013 2014 2015
Annual Household Growth Millions

MEDIAN PRICE OF EXISTING DETACHED HOMES
California, Mar. 2016: $483,280, +8.9% MTM, +4.0% YTY
$-
$100,000
$200,000
$300,000
$400,000
$500,000
$600,000
$700,000
Jan
-05
Sep
-05
May-
06
Jan
-07
Sep
-07
May-
08
Jan
-09
Sep
-09
May-
10
Jan
-11
Sep
-11
May-
12
Jan
-13
Sep
-13
May-
14
Jan
-15
Sep
-15
P: May-07$594,530
T: Feb-09$245,230
-59% frompeak
SERIES: Median Price of Existing Single Family HomesSOURCE: CALIFORNIA ASSOCIATION OF REALTORS®
Mar-16: $483,280
Mar-15: $464,640

INVENTORY CONTINUED TO DECLINE FROM LAST YEAR
Mar. 2015: 3.8 Months; Mar. 2016: 3.6 Months
Note: “Unsold Inventory Index” represents the number of months it would take to sell the remaining inventory for the month in question. The remaining inventory for the month is defined as the number of properties that were “Active”, “Pending”, and “Contingent” (when available) and divide the sum by the number of “Sold” properties for the month in question.
0.0
2.0
4.0
6.0
8.0
10.0
12.0
14.0
16.0
18.0
Jan
-05
Sep
-05
May-
06
Jan
-07
Sep
-07
May-
08
Jan
-09
Sep
-09
May-
10
Jan
-11
Sep
-11
May-
12
Jan
-13
Sep
-13
May-
14
Jan
-15
Sep
-15
SERIES: Unsold Inventory Index of Existing Single Family HomesSOURCE: CALIFORNIA ASSOCIATION OF REALTORS®

INVENTORY DROPPED SIGNIFICANTLY IN THE BAY AREA SINCE 2009 BUT REMAINED TIGHT
Note: “Unsold Inventory Index” represents the number of months it would take to sell the remaining inventory for the month in question. The remaining inventory for the month is defined as the number of properties that were “Active”, “Pending”, and “Contingent” (when available) and divide the sum by the number of “Sold” properties for the month in question.
2.6
3.33.3
0.0
1.0
2.0
3.0
4.0
5.0
6.0
7.0
8.0
9.0
Jan
-09
Jul-
09
Jan
-10
Jul-
10
Jan
-11
Jul-
11
Jan
-12
Jul-
12
Jan
-13
Jul-
13
Jan
-14
Jul-
14
Jan
-15
Jul-
15
Jan
-16
Bay Area So CA Central Valley
SERIES: Unsold Inventory Index of Existing Single Family HomesSOURCE: CALIFORNIA ASSOCIATION OF REALTORS®

INVENTORY IMPROVED IN THE BAY AREA, BUT DROPPED IN SO CA AND CENTRAL VALLEY
-8%
1%
7%
3%
-3%
-9%
-20%
-10%
0%
10%
San Francisco Bay Area Southern California Central Valley
Sales Active ListingsYear-to-Year % Chg
SOURCE: CALIFORNIA ASSOCIATION OF REALTORS®
Mar. 2016

WHERE IS THE INVENTORY?
– Affordability challenge for repeat buyers• Low rate on current mortgage • Low property taxes• Concerned with capital gains• Why list when there is nowhere to go I can
afford?• Could not qualify for a mortgage today
– New construction recovering but LOW– Demographics: Trade-up buyer pool is smaller– Measurement error? Off- MLS (aka “pocket’)
listings not being counted in listing stats
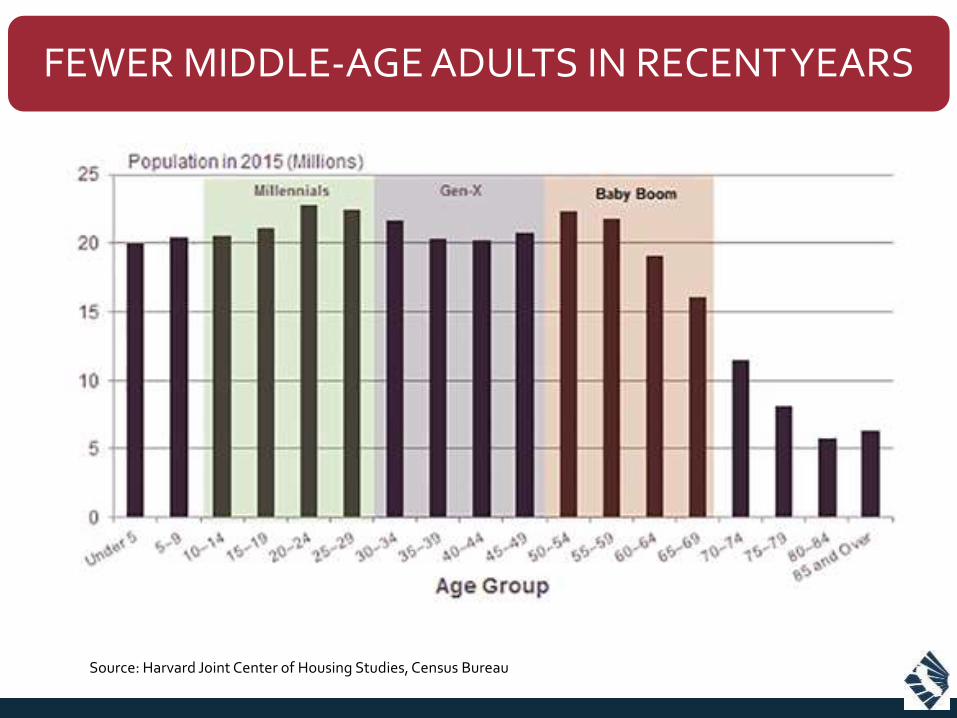
FEWER MIDDLE-AGE ADULTS IN RECENT YEARS
Source: Harvard Joint Center of Housing Studies, Census Bureau

DROP IN HOMEOWNERSHIP
Source: Harvard Joint Center of Housing Studies, Census Bureau

DECLINE IN # OF TRADE UP BUYERS DUE TO POPULATION LOSS & DROP IN HOMEOWNERSHIP RATE
Source: Harvard Joint Center of Housing Studies, Census Bureau
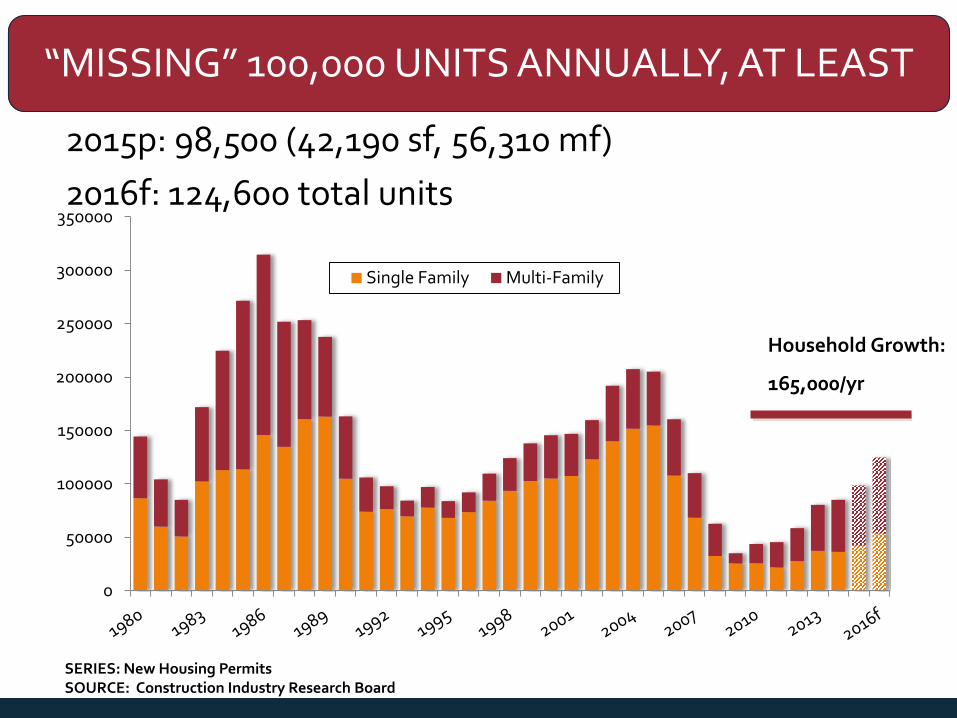
“MISSING” 100,000 UNITS ANNUALLY, AT LEAST
2015p: 98,500 (42,190 sf, 56,310 mf)
2016f: 124,600 total units
SERIES: New Housing PermitsSOURCE: Construction Industry Research Board
0
50000
100000
150000
200000
250000
300000
350000
Single Family Multi-Family
Household Growth:
165,000/yr

HOUSING AFFORDABILITY PEAKED Q1 2012PRICES V. LOW RATES AND INCOME GROWTH
California vs. U.S. – 1984-2015% OF HOUSEHOLDS THAT CAN BUY A MEDIAN-PRICED HOME
SERIES: Housing Affordability Index of Traditional BuyersSOURCE: CALIFORNIA ASSOCIATION OF REALTORS®
30%
58%
0%
10%
20%
30%
40%
50%
60%
70%
80% CA USAnnual Quarterly

6158
55 54 5349 48
46 45 4440 39 38 37
3027 26 26 26 25 25
23 22 21 21 21 2017
1411
0
10
20
30
40
50
60
70
HOUSING AFFORDABILITY IN CA: BY COUNTY
SERIES: Housing Affordability IndexSOURCE: CALIFORNIA ASSOCIATION OF REALTORS®
2015-Q4: % able to purchase median priced home

$27,010
$45,340
$69,990 $71,630
$87,520 $89,250
$98,400
$119,970
$96,642
$0
$20,000
$40,000
$60,000
$80,000
$100,000
$120,000
RetailSalespersons
Chefs andHead Cooks
ElementarySchool
Teachers
Firefighters Police andSherriff's
PatrolOfficers
ComputerProgrammers
RegisteredNurses
SoftwareDevelopers
(Applications)
Min. IncRequired toBuy a Med.
Home
HOW WAGES MEASURED AGAINST INCOME REQUIRED TO BUY A HOME
SOURCE: Bureau of Labor Statistics, C.A.R.
2014 Annual Mean Wage
California

SHARE OF FIRST-TIME BUYERS REMAINS BELOW LONG-RUN AVERAGE
29.5%
0%
10%
20%
30%
40%
50%
% First-Time Home Buyers Long Run Average
Long Run Average = 38%
SERIES: 2015 Housing Market SurveySOURCE: CALIFORNIA ASSOCIATION OF REALTORS®

THE SHARE OF INTERNATIONAL BUYERS DROPPED TO THE LOWEST LEVEL IN 8 YEARS
4%
0%
1%
2%
3%
4%
5%
6%
7%
8%
9%
2008 2009 2010 2011 2012 2013 2014 2015
Q. Was the buyer an international buyer – a person who was a citizen of another country who wished to purchase residential real estate in the U.S.?
SERIES: 2015 Housing Market SurveySOURCE: CALIFORNIA ASSOCIATION OF REALTORS®

ESTIMATE OF SALES BY COUNTRY
SERIES: 2015 Profile of International Home Buying ActivitySOURCE: NATIONAL ASSOCIATION OF REALTORS®

ESTIMATE OF SALES TO INTERNATIONAL CLIENTS(IN BILLION DOLLARS)
SERIES: 2015 Profile of International Home Buying ActivitySOURCE: NATIONAL ASSOCIATION OF REALTORS®

4 STATES ACCOUNTED FOR ½ OF INTERNATIONAL SALES
SERIES: 2015 Profile of International Home Buying ActivitySOURCE: NATIONAL ASSOCIATION OF REALTORS®

COUNTRY OF INTERNATIONAL BUYER
• China (43%)
• Mexico (8%)
• South Korea (8%)
SERIES: 2015 Housing Market SurveySOURCE: CALIFORNIA ASSOCIATION OF REALTORS®

BAY AREA HOUSING MARKET

0
1,000
2,000
3,000
4,000
5,000
6,000
7,000
8,000
SALES OF EXISTING DETACHED HOMES
Bay Area, Mar. 2016: 3,665 Units, -3.4% YTD, -8.1% YTY
SERIES: Sales of Existing Detached HomesSOURCE: CALIFORNIA ASSOCIATION OF REALTORS®

0
10000
20000
30000
40000
50000
60000
70000
2000 2001 2002 2003 2004 2005 2006 2007 2008 2009 2010 2011 2012 2013 2014 2015
SALES BOUNCED BACK AFTER DECLINING IN 2013 AND 2014
Bay Area, 2015: +3.5%, 2016 YTD: -3.4%
SERIES: Sales of Existing Detached HomesSOURCE: CALIFORNIA ASSOCIATION OF REALTORS®
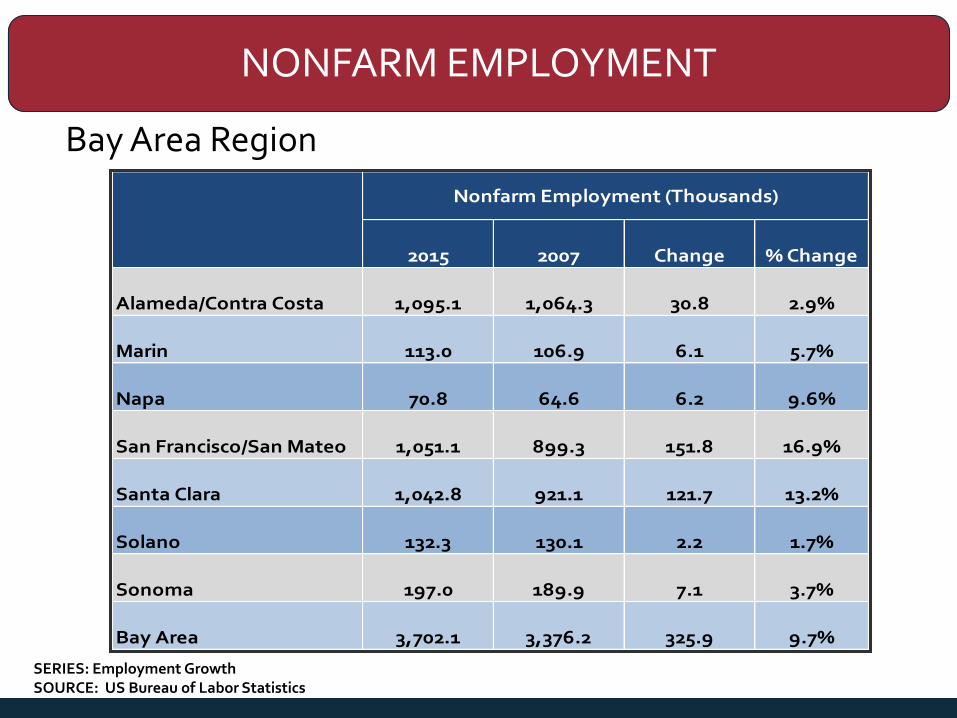
NONFARM EMPLOYMENT
Bay Area Region
SERIES: Employment GrowthSOURCE: US Bureau of Labor Statistics
2015 2007 Change % Change
Alameda/Contra Costa 1,095.1 1,064.3 30.8 2.9%
Marin 113.0 106.9 6.1 5.7%
Napa 70.8 64.6 6.2 9.6%
San Francisco/San Mateo 1,051.1 899.3 151.8 16.9%
Santa Clara 1,042.8 921.1 121.7 13.2%
Solano 132.3 130.1 2.2 1.7%
Sonoma 197.0 189.9 7.1 3.7%
Bay Area 3,702.1 3,376.2 325.9 9.7%
Nonfarm Employment (Thousands)

SALES OF EXISTING DETACHED HOMES
Bay Area Counties
Alameda 722 447 781 61.5% -7.6% -4.6%
Contra -Costa 798 541 866 47.5% -7.9% -6.6%
M arin 128 94 183 36.2% -30.1% -16.8%
Napa 94 55 105 70.9% -10.5% -5.8%
San Franc isc o 151 99 182 52.5% -17.0% -12.0%
San M a teo 302 199 349 51.8% -13.5% -2.3%
Santa Cla ra 741 488 846 51.8% -12.4% -2.3%
Solano 390 325 352 20.0% 10.8% 12.0%
Sonoma 339 243 323 39.5% 5.0% 8.5%
Y-t-DY-t-YCounty Mar-16 Feb-16 Mar-15 M-t-M
SERIES: Sales of Existing Detached HomesSOURCE: CALIFORNIA ASSOCIATION OF REALTORS®

March2016
February 2016
March2015
Median Time on the Market21.2 Days 25.5 Days 21.6 Days
Unsold Inventory Index2.6 Mos. 3.2 Mos. 2.1 Mos.
SUPPLY INDICATORS
Bay Area
Note: The Unsold Inventory Index represents the number of months it would take to deplete the remaining inventory at the end of a particular month with the sales rate of the month in consideration. Inventory includes listings with “Active”, “Pending”, and “Contingent” (when available) statuses.
SERIES: Median Time of Market, Unsold Inventory IndexSOURCE: CALIFORNIA ASSOCIATION OF REALTORS®

UNSOLD INVENTORY INDEX (MONTHS)
Bay Area
SERIES: Unsold Inventory IndexSOURCE: CALIFORNIA ASSOCIATION OF REALTORS®
County Mar-16 Feb-16 Mar-15
Alamed a 2.2 3.0 2.1
Contra-Costa 2.4 3.0 1.3
Marin 3.8 3.8 2.6
Napa 4.6 6.5 4.1
San Franc isco 2.7 3.3 1.6
San Mateo 2.2 2.7 1.6
Santa Clara 2.4 2.9 1.9
Solano 2.6 2.8 3.7
Sonoma 3.1 3.9 3.7
S. F. Bay Area 2.6 3.2 2.1

MASSIVE HOUSING SHORTAGE
MetroJob Creation2010-2015
New HomeConstruction2010-2015
Ratio
San Francisco-Oakland
234,000 30,000 7.8
Grand Rapids 46,000 6,000 7.8
San Jose 118,000 23,000 5.1
San Diego 101,000 21,000 4.9
Miami-Ft. Lauderdale
191,000 48,000 3.9
Salt Lake City 57,000 15,000 3.9
New York City 400,000 114,000 3.5

TIGHT SUPPLY CREATED MORE MARKET COMPETITION
4
3 3
0
1
1
2
2
3
3
4
4
5
San FranciscoBay Area
SouthernCalifornia
Other Counties inCalifornia
Number of Multiple Offers
SERIES: 2015 Housing Market SurveySOURCE: CALIFORNIA ASSOCIATION OF REALTORS®
36%
56%
63%
0% 20% 40% 60% 80%
Other Counties inCalifornia
Southern California
San Francisco BayArea
Percent with Multiple Offers

MEDIAN PRICE OF EXISTING DETACHED HOMES
Bay Area, March 2016: $761,160, Up 4.2% YTY
$-
$100,000
$200,000
$300,000
$400,000
$500,000
$600,000
$700,000
$800,000
$900,000
SERIES: Median Price of Existing Detached HomesSOURCE: CALIFORNIA ASSOCIATION OF REALTORS®

MEDIAN PRICE OF EXISTING DETACHED HOMES
Bay Area Counties
•
Alameda $762,570 $712,990 $713,060 7.0% 6.9%
Contra -Costa $572,620 $538,650 $491,780 6.3% 16.4%
M arin $1,148,150 $1,113,640 $1,085,230 3.1% 5.8%
Napa $666,670 $664,470 $562,500 0.3% 18.5%
San Franc isc o $1,360,580 $1,437,500 $1,275,000 -5.4% 6.7%
San M a teo $1,205,000 $1,200,000 $1,300,000 0.4% -7.3%
Santa Cla ra $1,065,000 $942,500 $932,100 13.0% 14.3%
Solano $376,420 $365,620 $345,100 3.0% 9.1%
Sonoma $596,090 $554,610 $519,500 7.5% 14.7%
Y-t-YCounty Mar-16 Feb-16 Mar-15 M-t-M
SERIES: Median Price of Existing Detached HomesSOURCE: CALIFORNIA ASSOCIATION OF REALTORS®

HOUSING DEMAND INCREASED IN MORE AFFORDABLE REGIONS
Annual % Change in Sales
SERIES: Sales of Existing SFHSOURCE: CALIFORNIA ASSOCIATION OF REALTORS®
County 2015 (yty% chg.)
Alam eda -0.7%
Contra-Costa 7.9%
Marin -3.8%
Napa 10.5%
San Franc isc o -8.2%
San Mateo -6.4%
Santa Clara 6.0%
Solano 18.6%
Sonom a 2.8%
S. F. Bay Area 3.5%

SAN FRANCISCO COUNTY

0
50
100
150
200
250
300
350
400
450
Jan
-05
Sep
-05
May-
06
Jan
-07
Sep
-07
May-
08
Jan
-09
Sep
-09
May-
10
Jan
-11
Sep
-11
May-
12
Jan
-13
Sep
-13
May-
14
Jan
-15
Sep
-15
SALES OF EXISTING DETACHED HOMES
San Francisco County, Mar. 2016: 151 Units, -12.0% YTD, -17.0% YTY
SERIES: Sales of Existing Single Family HomesSOURCE: CALIFORNIA ASSOCIATION OF REALTORS®

0
500
1000
1500
2000
2500
3000
3500
2005 2006 2007 2008 2009 2010 2011 2012 2013 2014 2015
SALES DOWN TWO YEARS IN A ROW AFTER REACHING THE RECENT PEAK IN 2013
San Francisco, 2015: -8.2%, 2016 YTD: -7.8%
SERIES: Sales of Existing Detached HomesSOURCE: CALIFORNIA ASSOCIATION OF REALTORS®

EMPLOYMENT GROWTH:CALIFORNIA VS. SAN FRANCISCO/SAN MATEO
Feb 2016: 2.8%
Feb 2016: 4.0%
-8.0%
-6.0%
-4.0%
-2.0%
0.0%
2.0%
4.0%
6.0%
8.0%
Jan
-08
Jul-
08
Jan
-09
Jul-
09
Jan
-10
Jul-
10
Jan
-11
Jul-
11
Jan
-12
Jul-
12
Jan
-13
Jul-
13
Jan
-14
Jul-
14
Jan
-15
Jul-
15
Jan
-16
California San Francisco/San MateoANNUAL PERCENT CHANGE
SERIES: Total Nonfarm EmploymentSOURCE: US Bureau of Labor Statistics, CA Employment Development Division

UNSOLD INVENTORY INDEX
San Francisco County, March 2016: 2.7 Months
Note: The Unsold Inventory Index represents the number of months it would take to deplete the remaining inventory at the end of a particular month with the sales rate of the month in consideration. Inventory includes listings with “Active”, “Pending”, and “Contingent” (when available) statuses.
0
2
4
6
8
10
12
Jan
-05
Sep
-05
May-
06
Jan
-07
Sep
-07
May-
08
Jan
-09
Sep
-09
May-
10
Jan
-11
Sep
-11
May-
12
Jan
-13
Sep
-13
May-
14
Jan
-15
Sep
-15
SERIES: Unsold Inventory Index of Existing Single Family HomesSOURCE: CALIFORNIA ASSOCIATION OF REALTORS®

NEW HOUSING PERMITS
San Francisco County, Feb. 2016: 635 Units, +101.8% YTD
0
200
400
600
800
1,000
1,200
Jan
-05
Sep
-05
May-
06
Jan
-07
Sep
-07
May-
08
Jan
-09
Sep
-09
May-
10
Jan
-11
Sep
-11
May-
12
Jan
-13
Sep
-13
May-
14
Jan
-15
Sep
-15
Single Family Multi-Family
SERIES: New Housing PermitsSOURCE: Construction Industry Research Board
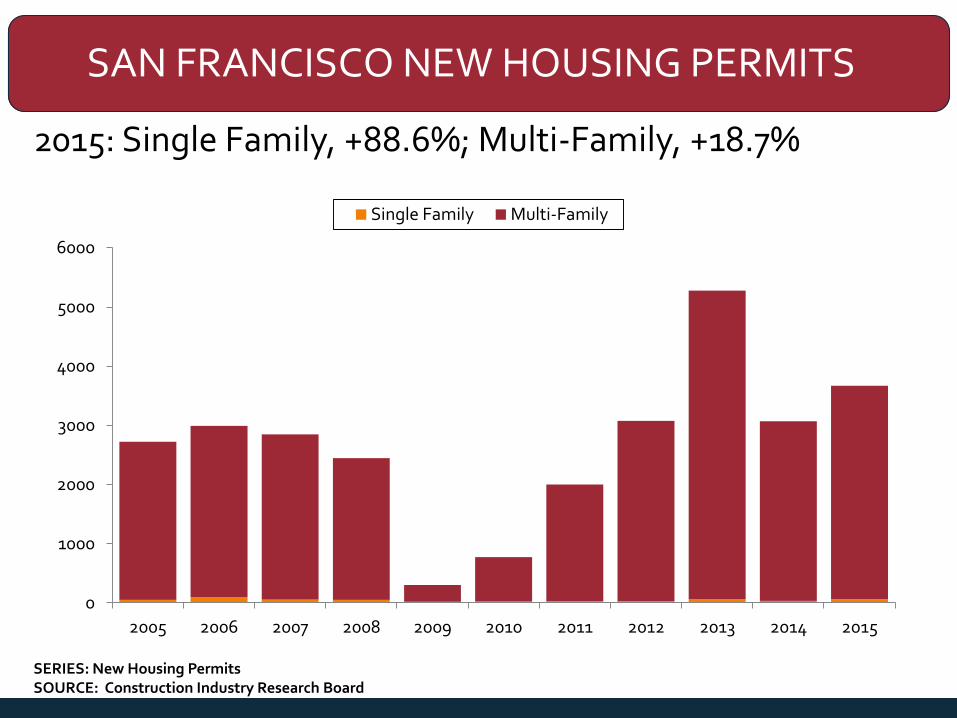
0
1000
2000
3000
4000
5000
6000
2005 2006 2007 2008 2009 2010 2011 2012 2013 2014 2015
Single Family Multi-Family
SAN FRANCISCO NEW HOUSING PERMITS
2015: Single Family, +88.6%; Multi-Family, +18.7%
SERIES: New Housing PermitsSOURCE: Construction Industry Research Board

MEDIAN PRICE OF EXISTING DETACHED HOMES
San Francisco County, Mar. 2016: $1,360,580, Up 6.7% YTY
$0
$200,000
$400,000
$600,000
$800,000
$1,000,000
$1,200,000
$1,400,000
$1,600,000
Jan
-05
Sep
-05
May-
06
Jan
-07
Sep
-07
May-
08
Jan
-09
Sep
-09
May-
10
Jan
-11
Sep
-11
May-
12
Jan
-13
Sep
-13
May-
14
Jan
-15
Sep
-15
SERIES: Median Price of Existing Single Family HomesSOURCE: CALIFORNIA ASSOCIATION OF REALTORS®
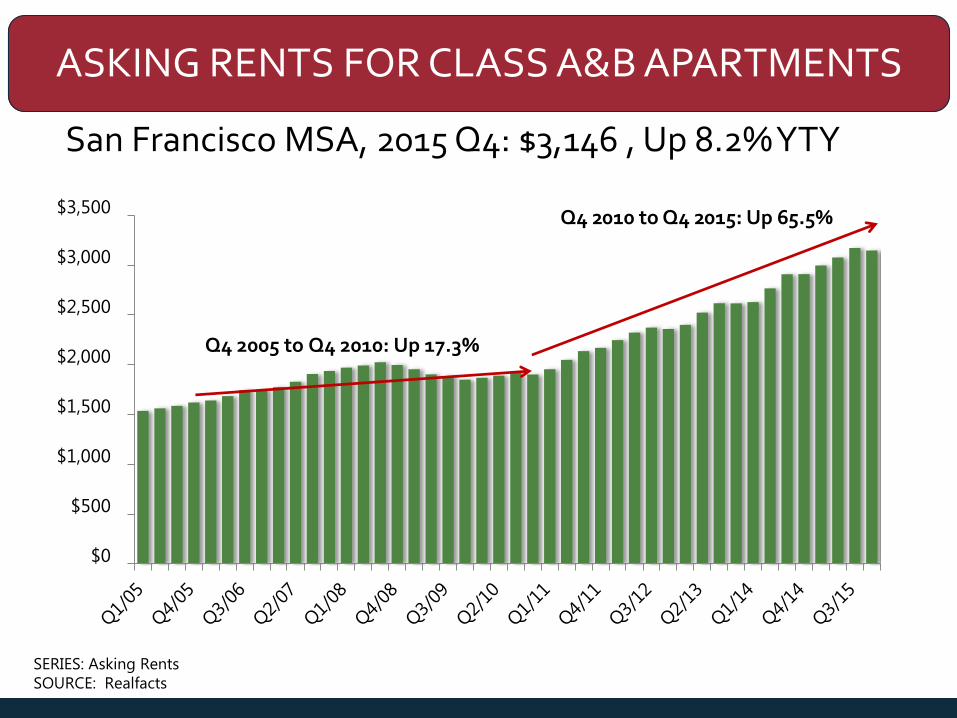
ASKING RENTS FOR CLASS A&B APARTMENTS
San Francisco MSA, 2015 Q4: $3,146 , Up 8.2% YTY
$0
$500
$1,000
$1,500
$2,000
$2,500
$3,000
$3,500
Q4 2005 to Q4 2010: Up 17.3%
SERIES: Asking RentsSOURCE: Realfacts
Q4 2010 to Q4 2015: Up 65.5%

0%
1%
2%
3%
4%
5%
6%
7%
Q1/05Q4/05Q3/06Q2/07Q1/08Q4/08Q3/09Q2/10Q1/11Q4/11Q3/12Q2/13Q1/14Q4/14Q3/15
VACANCY RATES FOR CLASS A&B APARTMENTS
San Francisco MSA, 2015 Q4: 5.6%
SERIES: Vacancy RatesSOURCE: Realfacts

HOUSING AFFORDABILITY INDEX
San Francisco County, 4th Quarter 2015: 11%% OF HOUSEHOLDS THAT CAN BUY
0%
5%
10%
15%
20%
25%
30%
35%
SERIES: Housing Affordability Index of Traditional BuyersSOURCE: CALIFORNIA ASSOCIATION OF REALTORS®

$30,340
$52,690 $49,230
$70,680$88,390
$97,570
$124,980 $118,690
$254,107
$0
$50,000
$100,000
$150,000
$200,000
$250,000
$300,000
RetailSalespersons
Auto.Mechanics
Chefs andHead Cooks
ElementarySchool
Teachers
Firefighters ComputerProgrammers
RegisteredNurses
SoftwareDevelopers
(Applications)
Min. IncRequired toBuy a Med.
Home
HOW WAGES MEASURED AGAINST INCOME REQUIRED TO BUY A HOME
SOURCE: Bureau of Labor Statistics, C.A.R.
Annual Mean Wage
San Francisco

OAKLAND

SALES OF SINGLE FAMILY HOMES
Oakland, March 2016: 188 Units
-1.1% 2015 YTD, +4.5% 2016 YTD, +0.5% YTY
SOURCE: Clarus Market Metrics

MEDIAN PRICE OF SINGLE FAMILY HOMES
Oakland, March 2016: $600,000
Up 14.6% MTM, Up 10.1% YTY
SOURCE: Clarus Market Metrics

FOR SALE PROPERTIES
Oakland, March 2016: 561 Units
-9.4% 2015 YTD, -12.7% 2016 YTD, -9.7% YTY
SOURCE: Clarus Market Metrics
Note: “For Sale Properties” represents the overall supply that exist throughout the entire month, including any listings that appear as “Active” any point in time during the month.

CITY OF SANTA CLARA

SALES OF SINGLE FAMILY HOMES
City of Santa Clara, March 2016: 26 Units
-9.1% 2015 YTD, -19.7% 2016 YTD, -42.2% YTY
SOURCE: Clarus Market Metrics

MEDIAN PRICE OF SINGLE FAMILY HOMES
City of Santa Clara, March 2016: $1,200,000
Up 4.3% MTM, Up 29.0% YTY
SOURCE: Clarus Market Metrics

FOR SALE PROPERTIES
City of Santa Clara, March 2016: 88 Units
+0.6% 2015 YTD, -19.7% 2016 YTD, -3.3% YTY
SOURCE: Clarus Market Metrics
Note: “For Sale Properties” represents the overall supply that exist throughout the entire month, including any listings that appear as “Active” any point in time during the month.

2016 FORECAST

CALIFORNIA HOUSING MARKET OUTLOOK
2010 2011 2012 2013 2014 2015 2016f
SFH Resales (000s) 416.5 422.6 439.8 414.9 382.7 407.1 432.6
% Change -12.3% 1.4% 4.1% -5.9% -7.8% 6.4% 6.3%
Median Price ($000s) $305.0 $286.0 $319.3 $407.2 $446.9 $474.4 $489.4
% Change 10.9% -6.2% 11.6% 27.5% 9.8% 6.2% 3.2%
Housing Affordability
Index 48% 53% 51% 36% 30% 31% 28%
30-Yr FRM 4.7% 4.5% 3.7% 4.0% 4.2% 3.9% 4.5%
SERIES: CA Housing Market OutlookSOURCE: CALIFORNIA ASSOCIATION OF REALTORS®

SALES UP FOR 2015 AND CONTINUE TO IMPROVE IN 2016; PRICE WILL GROW STEADILY THIS YEAR AND NEXT
Units (Thousand)
407.1432.6
0
100
200
300
400
500
600
700
2005 2007 2009 2011 2013 2015
Th
ou
san
ds
Sales of Existing Detached Homes
$474 $489
$0
$100
$200
$300
$400
$500
$600
2005 2007 2009 2011 2013 2015p
Th
ou
san
ds
Median Price
Price (Thousand)
SERIES: CA Housing Market OutlookSOURCE: CALIFORNIA ASSOCIATION OF REALTORS®
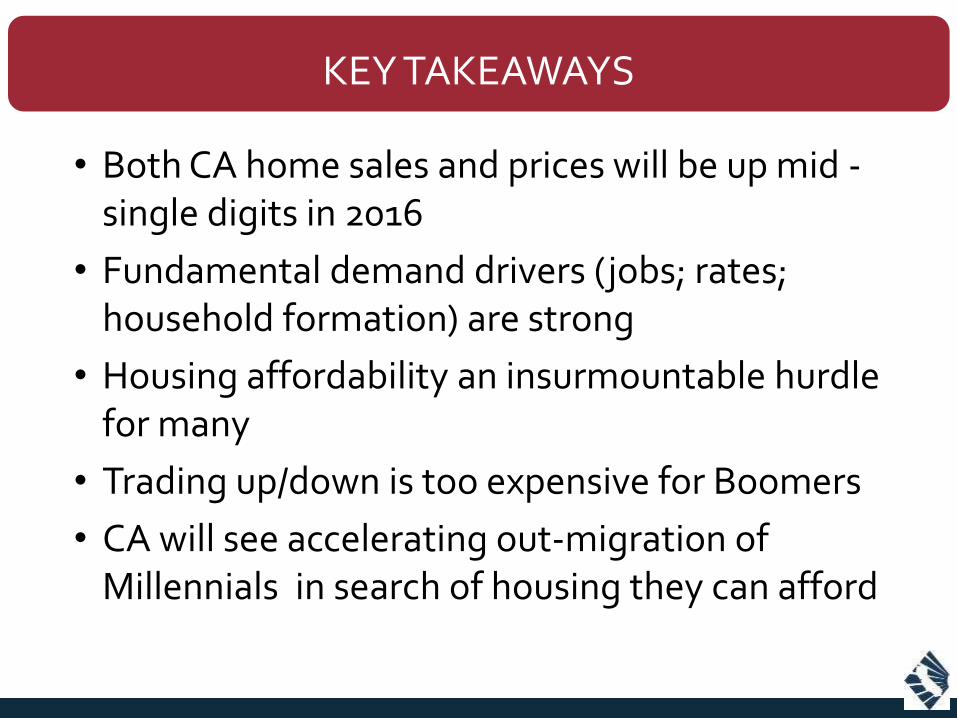
• Both CA home sales and prices will be up mid -single digits in 2016
• Fundamental demand drivers (jobs; rates; household formation) are strong
• Housing affordability an insurmountable hurdle for many
• Trading up/down is too expensive for Boomers
• CA will see accelerating out-migration of Millennials in search of housing they can afford
KEY TAKEAWAYS

STAY CONNECTED WITH RESEARCH
CARResearchGroup
CARResearchInfo
On.car.org/CARResearch
Housingmatters.car.org

“The Impact of Investors on California’s Housing Market”
Friday, April 29, 2016
1:00 PM – 1:30 PM
To register: WWW.CAR.ORG/MARKETDATA/VIDEOS
Join us for our next webinar…

THANK YOU!
www.car.org/marketdata
This presentation can be found on
www.car.org/marketdata
Speeches & Presentations