2016 DOE Hydrogen and Fuel Cells Program Review · 2016-06-17 · 2016 DOE Hydrogen and Fuel Cells...
32
2016 DOE Hydrogen and Fuel Cells Program Review Fuel Cell Vehicle and Bus Cost Analysis PI: Brian D. James Strategic Analysis Inc. 9 June 2016 This presentation contains no proprietary, confidential, or otherwise restricted information. Project ID# FC018
Transcript of 2016 DOE Hydrogen and Fuel Cells Program Review · 2016-06-17 · 2016 DOE Hydrogen and Fuel Cells...

2016 DOE Hydrogen and Fuel Cells Program Review
Fuel Cell Vehicle and Bus Cost Analysis
PI: Brian D. JamesStrategic Analysis Inc.
9 June 2016
This presentation contains no proprietary, confidential, or otherwise restricted information.
Project ID# FC018
Overview
• Project Start Date: 9/30/11• Project End Date: 9/30/16• % complete: 90% (in year 5 of 5)
Timeline
• Total Project Budget: $739,997 (SA portion)– FY 2012-2015: $615k– FY 2016: $125k
Budget
• B: System cost – Realistic, process-based system costs– Need for realistic values for current and
future cost targets• Demonstrates impact of technical
targets & barriers on system cost:– Balance of plant components– Materials of construction– System size and capacity (weight and
volume)
Barriers
• Project Lead: Strategic Analysis Inc.• National Renewable Energy
Laboratory (NREL)• Argonne National Lab (ANL)
Partners
2

Relevance• Project a future cost of automotive and bus fuel cell systems at high
manufacturing rates. • Project impact of technology improvements on system cost• Identify low cost pathways to achieve the DOE 2020 goal of $40/kWnet
(automotive) at 500,000 systems per year• Benchmark against production vehicle power systems• Identify fuel cell system cost drivers to facilitate Fuel Cell Technology
Office programmatic decisions.
Objectives:
• Latest de-alloyed PtNi/C catalysts increase power density at lower sys. cost• BPP designs and prod. methods influence cost and require development to
achieve low cost & practical production at high volume• Initial bus FCS life cycle cost analysis will allow future trade-off analyses
Impact since 2015 AMR:
3

Approach: Automotive System Cost StatusPreliminary 2016 Projection Compared to DOE Targets
• ~$6/kWnet cost reduction from new high power density catalyst system• Currently investigating drivers of cost uncertainty• Preliminary 2016 system cost: $50-$57/kWnet
Error bar based on Monte Carlo sensitivity analysis
Error bars based on range in potential cost
4

Topics ExaminedAnnually apply new technological advances and design of transportation systems into techno-economic models
Changes since 2015 AMR that Affect Baseline Automotive System• Dispersed binary catalyst (de-alloyed PtNi/C): Combined 2015 DFMA® of catalyst
synthesis/application with 2016 performance projection (provided by ANL)• NSTF binary catalyst (de-alloyed PtNi) with cathode interlayer: 2016 analysis of
combined DFMA® catalyst synthesis with performance projection (provided by ANL)• Re-Eval. of Bipolar Plate Stamping: Updated parameters based on 2016 industry input• Re-Eval. of Laser Welding: Updated parameters based on 2016 industry input• Detailed investigation of GDL: Preliminary 2016 DFMA® results for GDL fabrication
2015/2016 Side Studies for Automotive System (not affecting baseline)• Giner Inert Thin Film Membrane Support: Performed DFMA® analysis of Giner
Dimensionally Stable Membranes (DSM)TM
• Manufacturing Readiness Level (MRLs): Applied to both fuel cell industry and assessment of risk to achieve high volume manufacturing
• Evaluation of Toyota Mirai Manufacturing Cost: Preliminary cost estimates for various Mirai-specific fuel cell system components
2015/2016 Bus System• Bus Life Cycle Cost: Preliminary results compared to diesel bus for two drive cycles
Approach:
5

Catalyst De-alloyed PtNi (on Carbon) Binary System on Cathode
Development Group 3M Johnson-Matthey/General Motors
Synthesis Method NSTF Wet Syn., De-alloyed
Application Method NSTF with de-alloying bath Dispersion/Inking
Polarization Experimental Data
JM/GM experimental data from 2015
Polarization Modeling ANL Optimization Modeling
Cost ModelingSynthesis and
Slot Die Coating of Catalyst
Auto System Cost
Accomplishments and Progress:
2015/2016 Catalyst Cost Analysis Work
NSTF= 3M’s nano-structured, thin film catalyst
New completed analysis since 2015 AMRCatalyst De-alloyed PtNi (on Carbon) Binary System on Cathode
Development Group 3M Johnson-Matthey/General Motors
Synthesis Method NSTF Wet Syn., De-alloyed
Application Method NSTF with de-alloying bath Dispersion/Inking
Polarization Experimental Data
JM/GM experimental data from 2015
Polarization Modeling ANL Optimization Modeling
Cost ModelingSynthesis and
Slot Die Coating of Catalyst Integration with Polarization
Auto System Cost 2015 System Cost: $53/kWnet
Catalyst De-alloyed PtNi (on Carbon) Binary System on Cathode
Development Group 3M Johnson-Matthey/General Motors
Synthesis Method NSTF Wet Syn., De-alloyed
Application Method NSTF with de-alloying bath Dispersion/Inking
Polarization Experimental Data
3M exp. data January and March 2016
JM/GM experimental data from 2015
Polarization Modeling ANL Optimization Modeling ANL Optimization Modeling
Cost Modeling
De-alloying of NSTFSlot Die Coating of Cathode
InterlayerIntegration with Polarization
Synthesis andSlot Die Coating of Catalyst
Integration with Polarization
Auto System Cost 2016 System Cost: $49/kWnet 2015 System Cost: $53/kWnet
6

Accomplishments and Progress:
DFMA® Model of 3M de-alloyed PtNi/C NSTF CatalystNanostructured Thin Film (NSTF) process combined with de-alloying step
Sublimation of PR-149 onto
polyamide web
VacuumAnnealing
Sputtering of Pt and Ni onto
whiskers
Slot Die Coat Interlayer Slurry
DryUnroll GDL Re-wind GDL
DFMA® Process Diagram: Interlayer Coat onto Cathode GDL
WebRe-Roll
De-alloy web for 5 minutes in 1M ferric acid bath
under air (~40°C, bubble agitation)
RinseRe-wind Web Dry
Interlayer: PtC (0.016mg/cm2)Cathode: D-Pt3Ni7 (0.096mg/cm2)
Cathode GDL
MembraneAnode: PtCoMn (0.019mg/cm2)MEA
Total Pt loading:0.131mg/cm2
Anode GDL
Slot Die Coating
NSTF
DFMA® Process Diagram: 3M de-alloyed PtNi/C NSTF Catalyst
Calendaring (Membr.+ Electrode + GDL)
7

Accomplishments and Progress:
3M de-alloyed PtNi/C NSTF Catalyst Cost Results with Performance
• Modeled one machine for de-alloying/rinsing/drying• Effective de-alloy bath web speed 7m/min (100cm web width, 5min dwell time)• Six simultaneous lines for 500k systems/year, $2.5M each based on Chemcut quote
• Interlayer and de-alloying steps contribute a small amount of cost to the whole process, but those steps are crucial for high performance at low catalyst loading
• Membrane thickness reduced from 25 microns (850EW) to 14 microns (725EW)• Reduces amount of ionomer needed (↓$0.22/kWnet)
• Material costs dominate at high production rates.
• De-alloy and interlayer processing cost are <25% of total catalyst cost at all rates
• Cost to add interlayer at high volume ($0.15/kWnet) is low (interlayer improves operational robustness).
8

Accomplishments and Progress:
Reconsideration of Bipolar Plate CostFactors that affect BPP cost:• Plate Forming
– Flow Field Design• Fine Features (<1mm)• Course Features (>2mm)• “Fine Mesh” (Toyota)
– Stamping Force (500 to 3,000 tons)• Cost correlates with force• Strokes/min correlates with force• Coining vs. Stamping
• Coating– TreadStone Technologies (Baseline)– Carbon coating
• Joining (of the two BPP halves)– Adhesive (not selected)– Laser Welding (baseline)– Matching rates (stamping and laser)
• Quality Control
• Wide range of stamping cost possible.• For 2016, we are revisiting parameters
to link flow field design assumptions to stamping force and cost.
Reported BPP Costs
9

Accomplishments and Progress:
Reconsideration of Laser WeldingFactors that affect welding price:• Welding speed (0.125 m/s)• Extent of welded length
• Minimum: Just perimeter (~134cm)• Maximum: All BPP contact channels (~23m)
• Laser cost (solid state fiber lasers)• Number of mirror galvanometers (galvos) & stations
(all at 500k systems/year)
Single Welding Station(Indiv. Plates, robot load/unload)
Progressive Welding(Coil fed, Quad-Galvos, six stations)
Min Max Min Modeled (2016 Prelim.)
Max
Welded length 1.3m 23m 1.3m 5.7m (20%) 23m
Capital Cost (station only) $332k $332k $1.3M $1.3M $1.3M
Total Welding Time 31 sec 204 sec 11 sec 46 sec 185 sec
Effect. Cycle Time/part 31 sec 204 sec 1 sec 2.4 sec 8.2 sec
Welding Cost $2.42/kW $16.07/kW $0.26/kW $0.65/kW $2.18/kW
• Wide range of Laser Welding costs is possible.• Engineering solutions can dramatically reduce cost.
10

Accomplishments and Progress:
Reconsideration of the Gas Diffusion Layer (GDL)
• Wide range of vendor price estimates
• Past SA cost projections based on Ballard GDL values• From 2011 Ballard Material
Products (BMP) study (BMP is now Avcarb)
• ~$4.50/m2 at 500k sys/year• Cost, not price
• Assumed GDL is a purchased item and applied a markup of 25% for current GDL
• Full SA DFMA® analysis initiated to explore cost driversBallard projection used in 2015.
11

Accomplishments and Progress:
DFMA® Analysis of GDL
Preliminary DFMA® analysis completed to compare with quotations and to gain better insighto Projected GDL cost is ~$6/m2 (at 500ksys/yr)
o Cost driven by • Carbon fiber• Manufacturing
1. Treated Carbon Fiber Papera) Wet-laid papermakingb) Oxidationc) Carbonization2. Microporous Layer (MPL)a) Inkingb) Oxidationc) Sintering
GDL Process Flow
MPL
GDL
45 µm layer dMPL = 1.0 g/cc 5 wt.% PTFE
190 µm dGDL = 0.28 g/cc 15 wt.% FEP
235µm
12

Accomplishments and Progress:Preliminary 2016 Baseline Automotive Fuel Cell System Cost
Reason for Change Change from previous value ($/kWnet)
Cost ($/kWnet)@ 500k sys/yr
2015 Final Cost $52.84
Switch from dispersed JM d-PtNi catalyst to NSTF catalyst, thinner membrane, and lower Pt loading (0.142 to 0.131mgPt/cm2). -$5.63 $47.21
Exchanged low flow ejector for H2 recirculation blower. +3.10 $50.31
Bipolar Plate stamping and laser welding assumption changes. +$1.47 $51.78
Miscellaneous: Added profit markup on GDL cost, other minor changes +$0.29 $52.07
2016 Preliminary Cost -$0.77 $52.07
Significant Updates and Analyses (Jan-April 2016)
Operating Conditions 2015 2016 Power Density (mW/cm2) 746 941
Cell Voltage (V) 0.661 0.664
Coolant Exit Temp (°C) 94 94
Total Pt Loading (mg/cm2) 0.142 0.131
Stack Gross Power (kW) 88.2 88.3
Stack Pressure (atm) 2.5 2.5
Stack voltage (V) 250 250
Cathode/Air Stoich 1.5 1.5
Q/∆T 1.45 1.4513

Accomplishments and Progress:
Giner DSMTM Production (Side Study)
[1] Mittelsteadt, C., Argun, A., Lacier, C., Willey, J., “Dimensionally Stable High Performance Membranes”, Giner, Inc. presentation at the 2014 US DOE Fuel Cell Program Annual Merit Review and Peer Evaluation Meeting, Arlington, VA, June 18,2015. (slide 19)
Giner DSMTM [1]
• Objective: Analyze lower cost PEM membrane supports (as alternative to ePTFE)
• Mechanical pressing of PFSA/PSU to achieve uniform pores
• Price projections are for substrate alone, do not include ionomer
• Conclusion: At mod/high volumes, Giner DSMTM can be a low price alternative to ePTFE assuming the same electrochemical performance
SA Estimates of Giner DSMTM Mod. Prod.
High Prod.
Prod. Vol., sys/yr 10k 500k
Prod. Vol., m2/yr 115k 5.7M
Material Cost, $/m2 $1.30 $0.61
Process Cost, $/m2 $9.06 $3.24
Total Est. DSMTM Price, $/m2 $10.36 $3.85
ePTFE Ref. Price, $/m2 $16.76 $7.14
DFMA® analysis of Giner Dimensionally Stable MembraneTM (DSMTM)
14

Accomplishments and Progress:Collaboration with NREL on MRL and Risk Assessment
Component
•MRL = Manufacturing Readiness Level• Ind. MRL = Industry MRL: level at which current industrial practices exist for process • FC MRL = Fuel Cell MRL: level at which current fuel cell practices exist for process
Values in this table are based on educated opinions of SA and NREL
Medium Risk
Low Risk
High Risk
High RiskUnique to FCsHigh cost risk
Rate limiting for throughput
*MRL values defined in technical backup slides 31 & 32. 15

Accomplishments and Progress:
Benchmarking Against Commercial FCEVWhat can we learn from the Toyota Mirai design?• Design of stack and operation can eliminate BOP components or reduce sizing
• Internal humidification eliminates external humidifier • Low pressure requirements reduce air compressor sizing/lowers air cooling
• Mirai has higher stack cost (30g of Pt, titanium BPPs), may boost durability• Mirai Q/∆T (estimated at >2.0) exceeds DOE design criteria of Q/∆T<=1.45• Despite different designs, preliminary SA projection of Mirai FC power system is
similar to SA DOE baseline cost projection • 1k sys/year: ~$200/kWnet for Mirai vs. ~$190/kWnet SA baseline (scaled to Mirai power)
SA Estimate of Mirai
SA Baseline Design
Preliminary Results
Preliminary ResultsPreliminary Results
Benchmarking assumptions detailed in technical backup slides 37-39.16

Accomplishments and Progress:
FC Bus Life Cycle Cost AnalysisCollaboration with ANL and Aalto University to estimate bus life cycle cost based on three different air compressor systems and two types of drive cycles
• ANL performance modeling of bus efficiency and fuel consumption based on experimental results from three different air compressor systems
1. Centrifugal compressor without expander (Centrifugal)2. Roots compressor only (Roots Compress.)3. Roots compressor with expander (Roots CEM)
• Aalto University used ANL performance model to estimate average drive cycle fuel consumption for multiple drive cycles1 (two chosen for LCC analysis)
1. Braunschweig German Bus Route2. Berkeley Line 51B Bus Route
Line 51B Bus RouteFigure from transit.511.org
1Lajunen, A., Lipman, T., “Lifecycle cost assessment and carbon dioxide emissions of diesel, natural gas, hybrid electric, fuel cell hybrid and electric transit buses”, Energy, March 2016. 17
B??-8J4;6>8/0A6%10+%7,-.,/66D%
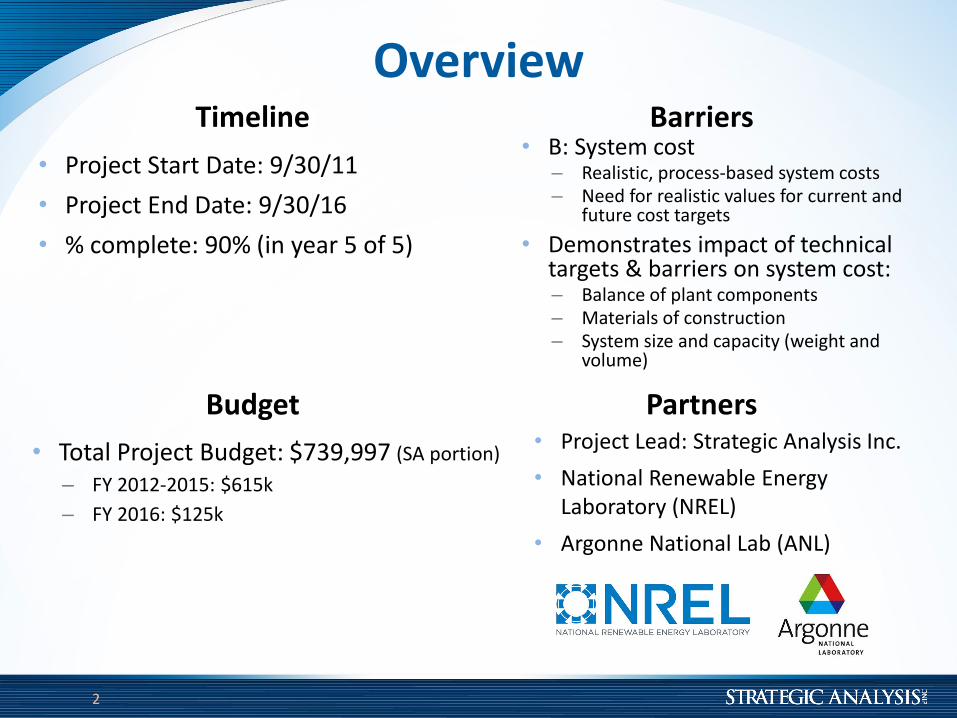
7,/4;8;01,*%9/634A6%N-,%25%@36%[;N/%5*?4/%5-6A%B014*6;6%
1m(
•! @36%4;N/%?*?4/%?-6A%N-,%A<-%+,;:/%?*?4/6%R16/+%-0D%•! ^*8;'*9(^#N'(#>(J^(PCN(•! [8%"*I3D(%j8%3N%N,(>C%9(*34(7*;3'%3*3&%(•! O%89*&%7%3'(&#N'N,(J^()'*&MG(SC7;4;g%"G(P*i%"<G(P*9*3&%(#>(PCN(•! !'(N*9R*D%(&"%4;'(
•! G8144%:1,;1K-0%;0%[55%R/A<//0%6*6A/8%A*J/6%?-8J1,/+%A-%R36%+,;:/%?*?4/6E%•! G/06;K:;A*%1014*6;6%6>-<6%%-J/,1K0.%K8/%W+;6A10?/%+,;:/0%1003144*Z%10+%81;0A/010?/%?-6A6%?10%>1:/%1%J,-N-30+%;8J1?A%-0%4;N/%?*?4/%?-6AE(
1G000(N<N'%7N.<%*"(
@,1306?></;.%1A%%#L"""%6*6A/86Y*/1,%
BCN(9;>%(&<&9%(&#N'(*NNC78I#3N(;3('%&S3;&*9(P*&MC8(N9;4%(/0Z(
Accomplishments and Progress:
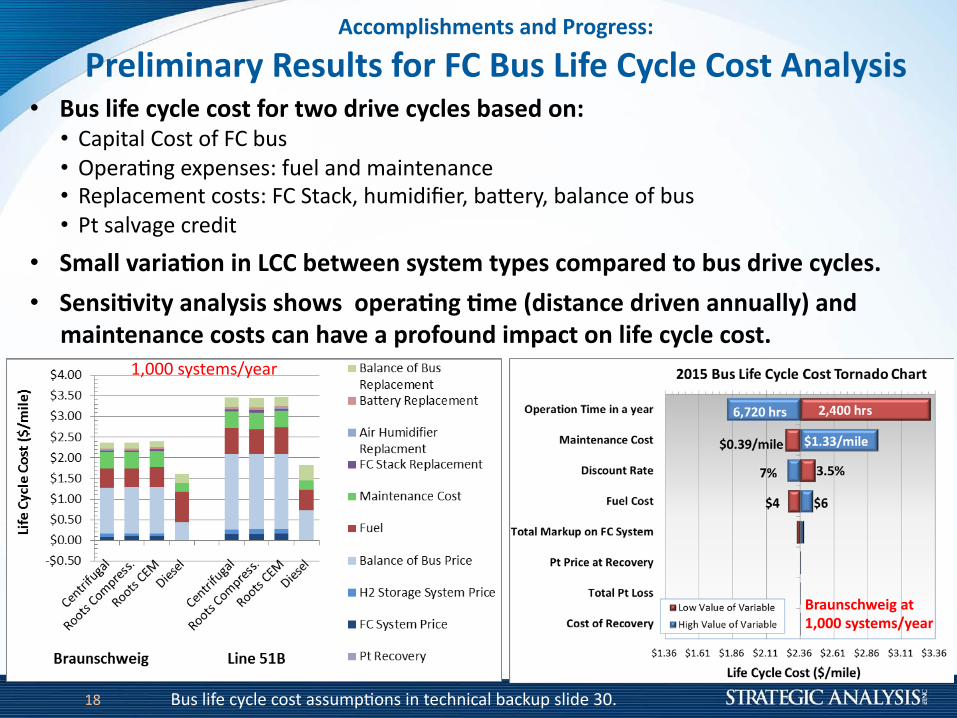
Responses to Previous Year’s Reviewers’ Comments
Reviewer’s Comments Response to Reviewer’s Comment
“Guidelines for determining costs for other, perhaps similar, systems would be helpful to the community. For example, for the design of an 80 kW system, there should be a discussion of the applicable vehicle platforms and how the costs (at the vehicle level in particular) may vary for vehicle classes that are larger or smaller.”
The size of the power plant is meant to be broadly representative and to facilitate comparison year-to-year. SA updates a simplified cost model where the size of the power plant is varied between 60kW and 120kW on an annual basis (although results were not presented in the AMR presentation).
Toyota and/or other automotive OEMs should be added to make sure this work is aligned with industry, not behind it.
There has been great interest /effort to contact Toyota, however they are unable to share much information, other than what is publically available. SA receives input from all the Fuel Cell Technical Team members (primarily Ford and GM) and additional comments from Nissan. Plus SA has modeled the Mirai system (to extent possible) to achieve better cost understanding.
19

CollaborationsPartner/Collaborator/Vendor Project Role
National Renewable Energy Laboratory (NREL)(sub on contract)
• Provides knowledge and expertise on QC systems for FC manufacturing lines.
• Reviews and provides feedback on SA’s assumptions for MEA processing and techniques for gasket application
• Collaborates with SA on determination of manufacturing readiness levels (MRLs) and the risks involved in getting to high volume production for fuel cell components.
Argonne National Laboratory (ANL) (sub on contract)
• Supplies detailed modeling results for optimized fuel cell operating conditions (based on experimental cell data)
• Provides SA with model results for system pressures, mass flows, CEM efficiencies, and membrane area requirements for optimized system.
• Collaborates with Aalto University to determine fuel usage and system power during bus drive cycles to feed into life cycle cost analyses using SA-derived FC bus costs.
2015/2016 DOE Sponsored Collaborators• 3M, GM/JM, Giner Electrochemical
Systems, Inc.
• 3M and GM/JM continue to support the FCTO for MEA development
• Giner provided many processing assumptions for SA to estimate the cost of Dimensionally Stable Membranes (DSMTM) processing for high volumes.
Vendors/Suppliers See back-up material for list of ~30 other companies with which we have consulted.
*Additional Collaborations Listed in Reviewer Slides
20

Remaining Barriers and ChallengesAutomotive System• In order to meet demands at high volume, Bipolar Plates may require a roll-to-
roll process (coating/forming/welding) for speed and alignment of BPPs.• Large variation in prospective GDL quotations • Close to meeting Pt loading targets, although Pt cost reduction or alternative
catalyst material is needed to proceed to ultimate target $30/kWnet• PANI (non-Pt catalyst) requires greater power density (>475mW/cm2) to be
cost competitive with Pt-based catalysts.• LCC is difficult without more data on stack/humidifier durability, BOP MTBF, etc.
Bus System• Solicitation of feedback on performance and cost analysis results is greatly
needed to ensure legitimacy of analysis.
21

Proposed Future Work Automotive System• Ejector vs. H2 Recirculation Blower: further cost tradeoff analysis• BPP Stamping & Laser Welding: continued work on stamping force
correlation with flow field design, and optimal laser line speed• Coatings: re-evaluation of BPP coating (Treadstone vs. carbon coating) • Toyota Mirai Comparison: continued work to compare design,
component manufacturing process, and cost• Complete Final Auto Report
Bus System• Life cycle cost (LCC) analysis: Further analysis to include variation in
operating pressures • Complete Final Bus Report
22

Technology Transfer Activities
Not applicable for SA’s Cost Analysis
23

Summary• Baseline auto cost results show continued slight decline:
• ~$55/kWnet (2014), $53/kWnet (2015), and ~$50-57/kWnet (prelim 2016)
• Combining performance and DFMA® cost analysis for 3M Binary de-alloyed PtNi NSTF catalyst shows significant cost reduction due to high power density at lower catalyst loading, cathode interlayer, & thinner membrane.
• Bipolar plate stamping changed from a bending operation to coining, requiring greater press force.
• GDL cost quotes vary considerably. DFMA® conducted to gain understanding.
• Evaluation of stack FC manufacturing readiness level shows that MEA sealing and stack assembly runs a greater risk to get to high volumes due to the potential wastage of costly materials and industry design variations.
• Prelim. DFMA® analysis of Toyota Mirai FC system: ~$200k/kWnet (at 1ksys/yr)
• Bus LCC analysis can be used for system cost optimization.
24

Summary• Overview
– Annually updated cost analysis of automobile & bus fuel cell systems– Exploring subsystem alternative configurations and benchmark cost where possible– In year 5 of 5 year transportation project
• Relevance– Cost analysis used to assess practicality of proposed power system,
determine key cost drivers, and provide insight for direction of R&D priorities• Approach
– Process based cost analysis methodologies (e.g. DFMA®)• Accomplishments
– 2015 Automobile & Bus analysis completed (report available)– 2016 Automotive & Bus analysis underway– Components newly analyzed or revisited:
• 3M NSTF de-alloyed PtNi catalyst, GDL, laser welding, plate stamping– New or expanded studies
• Manufacturing Readiness Level (MRL) assessment• Bus Life Cycle Cost analysis
• Collaborations– ANL and NREL provide cooperative analysis and vetting of assumptions/results
• Future Work– Complete studies and final report.2525

Thank you!
Questions?
26
Technical Backup Slides
27

Approach: Automotive System Cost StatusPotential Cost Reduction Based on US DRIVE Targets
• Example pathway to a $40/kW fuel cell system by applying combination of US DRIVE Fuel Cell Technical Team Roadmap target values and DOE targets within SA’s DFMA® cost model
• Example pathway to a $30/kW fuel cell system w/out humidifier, lower BOP component costs, and catalyst material cost reduction
US DRIVE targets: http://energy.gov/sites/prod/files/2014/02/f8/fctt_roadmap_june2013.pdfUS DOE System target: http://hydrogen.energy.gov/pdfs/14012_fuel_cell_system_cost_2013.pdf
$52/kW based on d-PtNi NSTF catalyst and centrifugal compressor unit
28

Approach: Topics ExaminedTopics Timeline Topic Status Estimated Cost Status
Automotive System Ongoing2015 Final system cost analysis completed andpreliminary draft report written. Preliminary 2016 system cost.
2015: $53/kWnet2016:$50-57/kWnet (prelim)
Giner Inert Thin FilmMembrane Support
2015 (side analysis)
Performed DFMA® analysis of Ginerdimensionally stable membrane (DSMTM), compared to ePTFE
Giner: $3.85/m2
Baseline ePTFE: $7.14/m2
MRL and Risk Assessment of FC Stack
2015(side analysis)
Collaborated with NREL to assign ManufacturingReadiness Levels (MRLs) and to evaluate the Risk to achieving high volume manufacturing.
Lowest FC MRL ValuesGasket Seals: 5
Stack Conditioning: 6
Dispersed binary catalyst (d-PtNiC)
2015(Impacts 2015 Baseline Cost)
In 2015, combined binary catalyst DFMA® with performance. $11/kWnet
NSTF binary catalyst (d-PtNiC)
2016(Impacts 2016 Baseline Cost)
Combined DFMA® analysis of NSTF binary catalyst with cathode interlayer with ANL’s performance data.
2016 $8.62/kWnet
Re-evaluation of BPP Cost Estimation
2016(Impacts 2016 Baseline Cost)
Discussions with BPP vendors suggest metal pricing, stamping, and welding processing parameters could be improved/updated. Additional information on alternative Hydrogate forming.
2015 Value $0.74/BPP (26.27cm x 19cm) or $14.82/m2
2016 Value $0.74/BPP (23.5cm x 17cm) or $18.43/m2
Re-evaluation of GDL Cost Estimation
2016(Impacts 2016 Baseline Cost)
Discussions with GDL vendors suggest disagreement in GDL pricing. Baseline cost from Ballard required markup for profit.
2015 Value $5/m2
2016 Value $6-10/m2
Evaluation of Toyota MiraiManufacturing Costs
2016(side analysis)
Preliminary evaluation of Toyota Mirai FC vehicle manufacturing costs. $173/kWnet (1,000 sys/yr)
Bus System Ongoing 2015 final system cost analysis completed with life cycle cost analysis.
$262/kWnet (1k sys/yr)$2.30-$3.50/mile
Annually apply new technological advances and design of transportation systems into techno-economic models
(All estimated costs at 500k sys/yr unless stated otherwise)29

Bus Life Cycle Cost AssumptionsBus LCC Parameter Value @ 1k
sys/yr Assumption
Fuel Cell System PriceStack:$102/kWnet
BOP: 43/kWnetStorage: $299/kWnet
SA 2015 DFMA® Analysis: (Stack/BOP) Assume 16% markup for bus company profit (New Flyer 14% gross margin) and 40% markup for extended warranty beyond 1 year.
Total Hybrid Bus Price $864k/system Includes battery system, chassi/body, power electronics, electric motors, labor for drivetrain integration and OEM investment costs (26% of subtotal) 1
Bus Operational Time 4,000 hrs/yr Based on roughly 12hrs/day, 7 days/week
Bus Service Life 12 years Based on DOE Target and FTA lifetime for diesel transit buses2
Annual Distance Braunschweig: 56k milesLine 51B: 34k miles Based on drive cycle miles per hr provided by Aalto University
Discount Rate 5.25% Middle value of two reported values (3.5% & 7%)1,2
Maintenance Cost $0.54/mile NREL report: $0.06/mile for scheduled; $0.48/mile for unscheduled maintenance 3
Fuel Cost $5/kg Based on previous auto LCC analysis
FC Stack Operating Hrs 25,000 hrs Based on DOE ultimate target
Humidifier Operating Hrs 5,000 hrs Based on Gore/Dpoint report on plate frame membrane humidifier
Balance of Bus Replacement Costs
$128k/life Total diesel bus replacements would be $210k. Excluding diesel engine parts and fuel parts equates to $128k.
1 Hzaetta, R., Madden, B., “Hydrogen Fuel Cell Bus Technology State of the Art Review” Element Energy, February 2011.2 Federal Transit Administration (FTA) Report, “Useful Life of Transit Buses and Vans”, Report No. FTA VA-26-7229-07.1, April 2007.3 Eudy, L., Post, M., “American Fuel Cell Bus Report Evaluation: Second Report”, National Renewable Energy Laboratory, September 2015.
30

Manufacturing Readiness LevelsMRL Definitions
1 Manufacturing Feasibility Assessed – Top level assessment of feasibility based on technical concept and laboratory data.
2 Manufacturing Concepts Defined – Initiate demonstration of feasibility of producing a prototype system or component.
3 Manufacturing Concepts Developed – Manufacturing concepts identified and based on laboratory studies.
4Laboratory Manufacturing Process Demonstration: Manufacturing processes identified and assessed in lab. Mitigation strategies identified to address manufacturing/producibility shortfalls. Targets set for cost as an independent variable, and initial cost drivers identified.
5
Manufacturing Process Development: Trade studies and laboratory experiments result in development of key manufacturing processes and initial sigma levels. Preliminary manufacturing assembly sequences identified. Process, tooling, inspection, and test equipment in development. Significant engineering and design changes. Quality and reliability levels not yet established. Tooling and machines demonstrated in the laboratory. Physical and functional interfaces have not been completely defined.
6
Critical Manufacturing Process Prototyped: Critical manufacturing processes prototyped, targets for improved yield established. Process and tooling mature. Frequent design changes still occur. Investment in machining and tooling identified. Quality and reliability levels identified. Design to cost goals identified. Pilot line operation demonstrated.
7
Prototype Manufacturing System: Prototype system built on soft tooling, initial sigma levels established. Ready for low rate initial production (LRIP). Design changes decrease significantly. Process tooling and inspection and test equipment demonstrated in production environment. Manufacturing processes generally well understood. Machines and tooling proven. Materials initially demonstrated in production. Manufacturing process and procedures initially demonstrated. Design to cost goals validated.
31

Manufacturing Readiness Levels
8
Manufacturing Process Maturity Demonstration: Manufacturing processes demonstrate acceptable yield and producibility levels for pilot line. All design requirements satisfied. Manufacturing process well understood and controlled to 3-sigma or appropriate quality level. Minimal investment in machine and tooling - machines and tooling should have completed demonstration in production environment. All materials are in production and readily available. Cost estimates <125% cost goals (e.g., design to cost goals met for LRIP).
9
Manufacturing Processes Proven: Manufacturing line operating at desired initial sigma level. Stable production. Design stable, few or no design changes. All manufacturing processes controlled to 6-sigma or appropriate quality level. Affordability issues built into initial production and evolutionary acquisition milestones. Cost estimates <110% cost goals or meet cost goals (e.g., design to cost goals met). Actual cost model developed for FRP environment, with impact of continuous improvement. Full rate process control concepts underdevelopment. Training and budget plans in place for transition to full rate production.
10
Full Rate Production demonstrated and lean production practices in place: The system, component or item is in full rate production. Technologies have matured to at least TRL 9. This level of manufacturing is normally associated with the Production or Sustainment phases of the acquisition life cycle. System, components, or items are in full rate production and meet all engineering, performance, quality, and reliability requirements. All materials, manufacturing processes and procedures, inspection and test equipment are in production and controlled to six-sigma or some other appropriate quality level. Rate production unit costs meet goals, and funding is sufficient for production at required rates. Lean practices are well established and continuous process improvements are ongoing.
32