2016 Assessment of the Civilian Acquisition Workforce...
232
• NATIONAL DEFENSE RESEARCH INSTITUTE 2016 Assessment of the Civilian Acquisition Workforce Personnel Demonstration Proiect Jennifer Lamping Lewis, Laura Werber, Cameron Wright, Irina Danescu, Jessica Hwang, Lindsay Daugherty Prepared for the Office of the Secretary of Defense Approved for public releose; distribution unlimited
Transcript of 2016 Assessment of the Civilian Acquisition Workforce...

• NATIONAL DEFENSE RESEARCH INSTITUTE
2016 Assessment of the Civilian Acquisition Workforce Personnel Demonstration Proiect
Jennifer Lamping Lewis, Laura Werber, Cameron Wright, Irina Danescu,
Jessica Hwang, Lindsay Daugherty
Prepared for the Office of the Secretary of Defense
Approved for public releose; distribution unlimited

For more information on this publication, visit www.rand.org/t/RR 1 783
Library of Congress Cataloging-in-Publication Data is available for this publication.
ISBN: 978·0·8330-9731·6
Published by the RAND Corporation, Santa Monica, Calif.
© Copyright 2017 RAND Corporation
RAND• is a registered trademark.
Limited Print and Electronic Distribution Rights
This document and trademark(s) contained herein are protected by law. This representation of RAND intellectual property is provided for noncommercial use only. Unauthorized posting of this publ ication online is prohibited. Permission is given to duplicate this document for personal use only, as long as it is unaltered and complete. Permission is required from RAND to reproduce, or reuse in another form, any of its research documents for commercial use. For information on reprint and linking permissions, please visit www.rand.org/pubs/permissions.
The RAND Corporation is a research organization that develops solutions to public policy challenges co help make communities throughout the world safer and more secure, healthier and more prosperous. RAND is nonprofit, nonpartisan, and committed to the public interest.
RAND's publications do not necessarily reflect the opinions of its research clients and sponsors.
Support RAND Make a tax-deductible charitable contribution at
www.rand.org/giving/contribute
www.rand.org

Pref ace
In August 2015, Rene Thomas-Rizzo, director, Human Capital Initiatives, Office of the Under Secretary of Defense (OUSD) for Acquisition, Technology, and Logistics (AT&L), asked the RAND Corporation to undertake a study to accomplish the fiscal year (FY) 2016 Civilian Acquisition Workforce Personnel Demonstration Project (AcqDemo) assessment mandated in the National Defense Authorization Act (NDAA) of FY 201 1 . The assessment used multiple data sources-both quantitative and qualitative, both objective- and perception-based-to evaluate AcqDemo using the original 12 criteria enumerated in the NDAA, as well as five new criteria specified by the AcqDemo Program Office. These criteria call for a look at the following:
• AcqDemo's key features pertaining to hiring, appointments, and performance appraisal • the adequacy of its guidance, protections for diversity, efforts to ensure fairness and trans
parency, and means used to involve employees in improving AcqDemo • AcqDemo's impact on career outcomes, such as compensation, promotion, and retention,
particularly with respect to similar outcomes for the General Schedule workforce • AcqDemo's· ability to support the acquisition mission.
This research should be of interest to U.S. Department of Defense personnel involved with civilian manpower and personnel policy issues and to congressional representatives and staff responsible for AcqDemo project oversight. Some expertise about government civilian personnel management and performance-based personnel systems is presumed.
This research was sponsored by Human Capital Initiatives, OUSD for AT&L, and conducted within the Forces and Resources Policy Center of the RAND National Defense Research Institute, a federally funded research and development center sponsored by· the Office of the Secretary of Defense, the Joint Staff, the Unified Combatant Commands, the Navy, the Marine Corps, the defense agencies, and the defense Intelligence Community.
For more information on the RAND Forces and Resources Policy Center, see www.rand.org/nsrd/ndri/centers/frp or contact the director (contact information is provided on the web page).
i ii

Contents
Preface . . . . . . . . . . . . . . . . . . . . . . . . . . . . . . . . . . . . . . . . . . . . . . . . . . . . . . . . . . . . . . . . . . . . . . . . . . . . . . . . . . . . . . . . . . . . . . . . . . . . . . . . . . . iii Figures . . . . . . . . . . . . . . . . . . . . . . . . . . . . . . . . . . . . . . . . . . . . . . . . . . . . . . . . . . . . . . . . . . . . . . . . . . . . . . . . . . . . . . . . . . . . . . . . . . . . . . . . . . . vii Tables . . . . . . . . . . . . . . . . . . . . . . . . . . . . . . . . . . . . . . . . . . . . . . . . . . . . . . . . . . . . . . . . . . . . . . . . . . . . . . . . . . . . . . . . . . . . . . . . . . . . . . . . . . . . ix Summary . . . . . . . . . . . . . . . . . . . . . . . . . . . . . . . . . . . . . . . . . . . . . . . . . . . . . . . . . . . . . . . . . . . . . . . . . . . . . . . . . . . . . . . . . . . . . . . . . . . . . . . xiii Acknowledgments . . . . . . . . . . . . . . . . . . . . . . . . . . . . . . . . . . . . . . . . . . . . . . . . . . . . . . . . . . . . . . . . . . . . . . . . . . . . . . . . . . . . . . . . . . . xxv
CHAPTER ONE Introduction . . . . . . . . . . . . . . . . . . . . . . . . . . . . . . . . . . . . . . . . . . . . . . . . . . . . . . . . . . . . . . . . . . . . . . . . . . . . . . . . . . . . . . . . . . . . . . . . . . . . . 1 Assessment Approach . . . . . . . . . . . . . . . . . . . . . . . . . . . . . . . . . . . . . . . . . . . . . . . . . . . . . . . . . . . . . . . . . . . . . . . . . . . . . . . . . . . . . . . . . . . . 3 Organization of This Report . . . . . . . . . . . . . . . . . . . . . . . . . . . . . . . . . . . . . . . . . . . . . . . . . . . . . . . . . . . . . . . . . . . . . . . . . . . . . . . . . . . 1 1
CHAPTER TWO What Is AcqDemo? . . . . . . . . . . . . . . . . . . . . . . . . . . . . . . . . . . . . . . . . . . . . . . . . . . . . . . . . . . . . . . . . . . . . . . . . . . . . . . . . . . . . . . . . . . . . 15 Appointment Flexibilities . . . . . . . . . . . . . . . . . . . . . . . . . . . . . . . . . . . . . . . . . . . . . . . . . . . . . . . . . . . . . . . . . . . . . . . . . . . . . . . . . . . . . . 15 Performance Appraisal System . . . . . . . . . . . . . . . . . . . . . . . . . . . . . . . . . . . . . . . . . . . . . . . . . . . . . . . . . . . . . . . . . . . . . . . . . . . . . . . . 17 How AcqDemo Supports Organizations' Missions . . . . . . . . . . . . . . . . . . . . . . . . . . . . . . . . . . . . . . . . . . . . . . . . . . . . . . . . 22 Summary . . . . . . . . . . . . . . . . . . . . . . . . . . . . . . . . . . . . . . . . . . . . . . . . . . . . . . . . . . . . . . . . . . . . . . . . . . . . . . . . . . . . . . . . . . . . . . . . . . . . . . . . 22
CHAPTER THREE Whom Does AcqDemo Include? . . . . . . . . . . . . . . . . . . . . . . . . . . . . . . . . . . . . . . . . . . . . . . . . . . . . . . . . . . . . . . . . . . . . . . . . . . . . 25 AcqDemo Workforce Composition . . . . . . . . . . . . . . . . . . . . . . . . . . . . . . . . . . . . . . . . . . . . . . . . . . . . . . . . . . . . . . . . . . . . . . . . . . . 25 Appropriateness of AcqDemo for the Workforce . . . . . . . . . . . . . . . . . . . . . . . . . . . . . . . . . . . . . . . . . . . . . . . . . . . . . . . . . . . . 31 Summary . . . . . . . . . . . . . . . . . . . . . . . . . . . . . . . . . . . . . . . . . . . . . . . . . . . . . . . . . . . . . . . . . . . . . . . . . . . . . . . . . . . . . . . . . . . . . . . . . . . . . . . . . 37
CHAPTER FOUR What Protections Are in Place to Support AcqDemo? . . . . . . . . . . . . . . . . . . . . . . . . . . . . . . . . . . . . . . . . . . . . . . . . . . 39 AcqDemo Guidance . . . . . . . . . . . . . . . . . . . . . . . . . . . . . . . . . . . . . . . . . . . . . . . . . . . . . . . . . . . . . . . . . . . . . . . . . . . . . . . . . . . . . . . . . . . . 39 Steps to Ensure Fairness and Transparency. . . . . . . . . . . . . . . . . . . . . . . . . . . . . . . . . . . . . . . . . . . . . . . . . . . . . . . . . . . . . . . . . 46 Employee Involvement in AcqDemo's Development and Improvement . . . . . . . . . . . . . . . . . . . . . . . . . . . . . . . . 48 Summary . . . . . . . . . . . . . . . . . . . . . . . . . . . . . . . . . . . . . . . . . . . . . . . . . . . . . . . . . . . . . . . . . . . . . . . . . . . . . . . . . . . . . . . . . . . . . . . . . . . . . . . . 50
CHAPTER FIVE How Has AcqDemo Performed So Far? Career Outcomes and Flexibility Usage . . . . . . . . . . . . . . . . . 53 Effects on Retention . . . . . . . . . . . . . . . . . . . . . . . . . . . . . . . . . . . . . . . . . . . . . . . . . . . . . . . . . . . . . . . . . . . . . . . . . . . . . . . . . . . . . . . . . . . 54 Effects on Compensation . . . . . . . . . . . . . . . . . . . . . . . . . . . . . . . . . . . . . . . . . . . . . . . . . . . . . . . . . . . . . . . . . . . . . . . . . . . . . . . . . . . . . . . 58 Effects on Promotion . . . . . . . . . . . . . . . . . . . . . . . . . . . . . . . . . . . . . . . . . . . . . . . . . . . . . . . . . . . . . . . . . . . . . . . . . . . . . . . . . . . . . . . . . . 64
v

vi 2016 Assessment of the Civilian Acquisition Workforce Personnel Demonstration Project
Career Outcomes for Subgroups of Interest . . . ... . ..... . . . ........ . . . . . . ...... . ... . ... . ........... . . . .. . . . . . . 67 Use of Appointment and Appraisal Flexibilities . . . . . . . . . . . . . . . . . . . . . . . . . . . . . . . . . . . . . . . . . . . . . . . . . . . . . . . . . . . . 77 Summary . . . . . . . . . . . . .. . . . . . . . .... . .. . .. . . . . . . . ... . . .. . . . . . ... . ........ . . . . .... . .. .. . . . . . .. . . . . . . . . ...... . ... . ... . 85
CHAPTER SIX How Has AcqDemo Performed So Far? Protections for Diversity . . . . . . . . . . . . . .... . . . . . . . . . ...... . .. 89 Women . . . ... . . . . . . . . ... . . . . . . . . . .. . . . . . . . . . . . . . . . . ........ . . . . ... . ....... . .. . .. . . . .. . . . . . . . . . . . . . . . . .. . . . . . . . . . . . 89 Blacks . . . . . . . . . . . . . . . . . . . . . . . . . . . . . . . . . . . . . . . . . . . . . . . . . . . . . . . . . . . . . . . . . . . . . . . . . . . . . . . . . . . . . . . . . . . . . . . . . . . . . . . . . . . . . 93 Asians .. . .. . . . . . .... . .. . . . . ... . . . . . . . . . . . . . . . . . . . . . . . . .. . . . ... . . . ... . . . ..... . . . . . . . . . . . . . . . . . . . . . . . . . . .... . . . . . . . . 98 Hispanics .... . .. .. . .. . . . . . . . . . . . . . ...... . . . . .. . .... . . . . . . . . .. . . � . . . .... . . . . .. . .. . ....... . . . . . . . .. . . . . ... . . . .. . . . 101 Summary .. . .... . . . .. . ... . ... . .. . .. ... .... .... . .. ... .. . ... . . ....... . .. . .... . .... . . .. . . . . .. . . .. .... . ... ...... .. . . 103
CHAPTER SEVEN How Has AcqDemo Performed So Far? Barriers to Flexibility Usage, Support for
Mission Needs, and Overall Effectiveness ......................................................... 105 Barriers to Use of Flexibilities . . . . . . . . . . . . . . . . . . . . . . . . . . . . . . . . . . . . . . . . . . . . . . . . . . . . . . . . . . . . . . . . . . . . . . . . . . . . . . . 105 AcqDemo,s Potential Influence on Organizations, Acquisition Mission .. . ............... . . . ........ . . 120 AcqDemo
,s Effectiveness as a Performance-Based Personnel System ...... . ..... . ...... ......... . . . . . . . 129
Summary ................................ . .................... . . .... . . . . . .. . . . ...... . . . ... . . . . ..... . . . .. .. . . . . .. 136
CHAPTER EIGHT Concluding Remarks........................................................ . . . . . . . . . . . . . . . . . . . . . . . . . . . . . . . . 141 AcqDemo Performance Summary . ............... . .. . . . . . . .... . · . . . . . . . . . . . . . . . . . . . . . . . . . . . . . . . . . . . . . . . . . . . . 142 Considerations for Future Assessments . . . . . . . . . . . . . . . . . . . .... . ...... .. . .... . . . ......... . . .... . . . ......... . . 144
APPENDIXES A. AcqDemo Survey Data Quantitative Analysis . . . . . . . . . . . . . . . . . . . . . . . . . . . . . . . . . . . . . . . . . . . . . . . . . . . . 145 B. Qualitative Data Analysis . ... . ... . . . . . . . . . . . . . . . . . . . . . . . . . . . . ...... . . . . . . . . .. . . . . . . . . . ... . ............ 161 C. Administrative Data Analysis . . . . . . . . . . . . . . . . . . . . . . . . . . . . . . . . . . . . . . . . . . . . . . . . . . . . . . . . . . . . . . . . . . . . . . . . 173
Abbreviations. . . . . . . . . . . . . . . . . . . . . . . . . . . . . . . . . . . . . . . . . . . . . . . . . . . . . . . . . . . . . . . . . . . . . . . . . . . . . . . . . . . . . . . . . . . . . . . . . 213 References........................................................ . . . . . . . . . . . . . . . . . . . . . . . . . . . . . . . . . . . . . . . . . . . . . 215

Figures
S. l. Career Paths and Broadband Structure . . . . . . . . . . . . ..... . . . . . . . .. . . . . . . . . . . . . . . . ... . .. . . . . . . .. xvii 2 . 1 . Career Paths and Broadband Structure . . . . . . . . . . . . . . . .. . . . . . . . . . . . . . . . . . . .. . . . . . . . . . . . . . . . . . . . . 16 2.2. Relationship Between OCS and Base Pay . . . . . . . . . . . . . . . . . . . . . . . . . . . . . . . . . . . . . . . . . . . . . . . . . . . .. . 19 4. 1. Employee Satisfaction with Training . . . . . . . .. . . . . . . . . . . . . . . . . . . . . . . . . . . . . . . . . . . . . . . . . . . . . . . . . . . 43 4.2. Supervisor Perceptions of AcqDemo Comprehension . . . . . . . .. . . . . . . . . . . . . . . . . . . . . . . . . . . . ... . 46 5.1 . Employee Perceptions of AcqDemo Retention Outcomes . . . . . . . . . . . . . . . . . . . . . . . . . . . . . . . . . . . . 57 5.2. Employee Perceptions Relating to Satisfaction with Pay . . . . . . . . . . . . . . . . . . . . . . . . . . . .. . . . . . . . . . 63 5.3. Employee Perceptions of the Relationship Between Contribution and Pay . . . . . . . . . . . . . . . . 63 5.4. Employee Perceptions of AcqDemo Promotion Outcomes .. . . . . . . . . . . . . . . . . . . . . . . . . . . . . . . . . 68 5.5. Employee Perceptions of Retention by Union Membership . . . . . . . . . . . . . . . . . . . . . . . . . . . . . . . . . . 72 5.6. Employee Perceptions of Promotion Opportunities by Supervisory Status . . . . . . . . . . . . . . . . . 76 5.7. Supervisor Perceptions of AcqDemo's Appointment Flexibilities . . .. . . . . . . . . . . . . . . . . . . . . . . . . 78 5.8. Employee Perceptions of Feedback Under AcqDemo . . . . .. . .. . . . . . . . . . . .. . . . . . . . . . . . . . . . . . . . 82 6.1 . Employee Perceptions of AcqDemo's Influence on Satisfaction with Pay, by
Gender . . . . . . . . . . .. . . . . . . . . . . . . . . . . . . . . . . . . . . . . . . .. . . . . . . . . . . .. . . . . . . . . . . . .. . . . . . . . . . . . . . . . . . . . . . . . . . 93 6.2. Employee Perceptions of Retention, by Race . . . . . . . . . . . . . . . . . . . . . . . . . . . . . .. . . . . . . . . . . . . . . . . . . . 96 6.3. Employee Perceptions of Satisfaction with Pay, by Race. . . . . . . . . . . . . . . . . . . . . . . . . . . . . . . . . . . . . 97 6.4. Employee Perceptions of AcqDemo's Influence on Satisfaction with Pay, by Race. . . . .. . 97 6.5. Employee Perceptions of AcqDemo's Influence on Promotion Opportunities, by
Race . . . . . . . . . . . . . . . . . . . . . . . . . . . . . . . . . . . . . . . . . . . . . . . . . . . . . . . . . . . . . . . . . . . . . . . . . . . . . . . . . . . . . . . . . . . . . . . . 98 7. 1 . Employee Perceptions of AcqDemo's Administration . . . . . . . . . . . . . . . . . .. . . . . . . . . . . . . . . . . . . . . 1 12 7.2. Employee Perceptions of AcqDemo's Administration of Pay, by Gender . . . . . . . . . . . . . . . . . 1 13 7.3. Employee Perceptions of AcqDemo's Administration of Contribution Appraisal,
by Gender .. . . . . . . . . . . . . . . . . . . . . . . . . .. . . . . . . . . . . . . . . . . . . . . . . . . . . . . . . . . . . . . . .. . . . . . . . . . . . . . . . . .. . . . . . 1 13 7.4. Employee Perceptions of AcqDemo's Administration of Pay, by Race . . . . . . . . . . . . . . . . . . . . 1 14 7.5. Employee Perceptions of AcqDemo's Administration of Contribution Appraisal
System, by Race. . . . . . . . . . . . . . . . . . . . . . . . . . . . . . . . . . . . . . . . . . . . . . . . . . . . . . . . . . . . . . . . . . . . . . . . . . . . . . . . . . 1 14 7.6. Employee Perceptions of Supervisor Fairness. . .. . . . . . . . . . . . . . . . . . . . . . . . . . . . . . . . . . . . . . . . . . . . . . 1 15 7.7. Employee Perceptions of Supervisor Fairness (Individual Contributions), by
Gender . . . . . . . . . . . .. . . . . .. . . . . . . . . . . . . . . . . . . . . .. . . . . . . . . . . . . . . . . . . . . . . . . . . . ... .. . . . . .. . . . . . . . . . . . . . 1 16 7.8. Employee Perceptions of Supervisor Fairness (Team Contributions), by Gender . . . . . .. . 1 16 7.9. Supervisor Perceptions of AcqDemo's Flexibilities . . . . . . . . . . . . . . . . . .. . . . . . . . . . . . . . . . . . . . . . . . . 123
7.10. Employee Perceptions of Group Dynamics . . . . . . . . . . . . . . . . . .. . . . . . . . . . . . . . . . . . . . . . . . . . . . . . .. . 125 7.1 1 . Employee Perceptions of Appraisal Factors' Adequacy. . . . . . . . . . . . . . . . . . . . . . . . . . . . . . . . . . . . . . 135 C.l . Accessions to and Separations from the AcqDemo Workforce, September 30, 201 1 ,
to September 30, 2015 . .. .. . . .... ...... ....... .. .. . .. .. ...... . . .. ...... ..... .. . ............ . ... . 175
vii

Tables
S.l . AcqDemo Assessment Criteria .. . .. . ... . .. .. . . .. ....... . ...... . .. .. .. . . . .. .. . . .. . ... .... . . .. . . . . xiv S.2. Characteristics of AcqDemo Participants, DoD Employees in the GS System, and
GS Employees in AcqDemo-Eligible Organizations, September 30, 20I5 .. . .... .. . ..... . xix · 1 . 1 . Legislatively Prescribed Assessment Criteria for FY 20I2 and FY 20I6 Assessments ... .. . . 2 I .2. AcqDemo Expansion Plans . . . . .. . .... .. ... .. ... .. .. . ... .... ... .. .. .. .. .. . . .. . ... .. . . . .. . . ... .. ... . 3 1 .3. New Criteria for FY 20I6 Assessments . ... . ... .. .. . . ... . .. . . . .. . .. . . . . . . .. . ... . . . . . . .. . . . . . . .. . . . 3 I .4. Data Sources by Guiding Questions and Assessment Criteria ..... . ..... .. ........ ... . . . . ... . 9 1 .5. Report Organization by Assessment Criteria . . . . .. ... .. . . . .. . . . . . .. . .. . .. . . .. . .. . ... . . . . .. . . . .. 1 1 2.1 . Eligibility for Various Compensation Types by Appraisal Zone .. . . . . . .. . . . . . . ... . . .... . .. . 20 3. 1. Characteristics of the AcqDemo Workforce, September 30, 201 1 , and
September 30, 20I5 . . . .... . ... . .. ... .... . . . . . . . . . . .. . .... . . ... .. .. .. . . . .. . . .... . ... .. . . . . .. . ...... 26 3.2. Characteristics of AcqDemo Participants, DoD Employees in the GS System,
and GS Employees in AcqDemo-Eligible Organizations, September 30, 20I5 . .. .. . . .. .. 28 3.3. Summary of Qualitative Evidence Related to AcqDemo's Appropriateness by
Employee Characteristic . . . . .. .. . .. ... . ... . . . . . ... . . . ...... . . . . ... . . . . . .......... . . .. .. . . . . .. . . ... 33 3.4. Summary of Favorability Toward AcqDemo by Employee Characteristic . . .. . . ... . . . . . . . . 36 5.1 . Employee Retention Rates, September 30, 201 1 , Cohorts ... . . . . ... . . .. .. . .. .. . . . . . . . . .... . .. 55 5.2. Effect of a I-Point Increase in .c10CS on Retention in the Following Fiscal Year .. . . . .. . 56 5.3. Average Annualized Basic Pay, September 30, 201 1, and September 30, 20I5 . ..... .. ..... 59 5.4. Effect of AcqDemo Participation on Annualized Basic Pay, September 30, 20I I,
Cohorts . . . . . . . . . . . . . . . . . . . . . . . . . . . . . . . . . . . . . . . . . . . . . . . . . . . . . . . . . . . . . . . . . . . . . . . . . . . . . . . . . . . . . . . . . . . . . 60 5.5. Effect of a I-Point Increase in .c10CS on Annualized Basic Pay in the Following
Fiscal Year .. ... . . . . . .. . . .... .. ..... . .. . . . .. .. ... .. ... ..... . ...... .... . . . ... . . . .. . . ... . . . . . . . . . . . . . ... 6I 5.6. Average Annualized Percentage Growth in Basic Pay for AcqDemo Participants,
September 30, 201 1 , Cohort . .. . . .. ... ... ... . . . . .. .. . . . . ..... ..... . .. . . .. . . .... . . .. .. ... . ... . .. . . . 62 5.7. Effect of Broadband on Promotion Within the NH Career Path .. ... . . .... . . ... . . .. . . . .. . . 66 5.8. Promotions Among NH-2 and NH-3 Employees .. . . . ... . . . . .. . . . .... . .. ... .. . . . . . . . . ... .. . . 66 5.9. Effect of a I-Point Increase in .c10CS on Promotion in the Following Fiscal Year .. .. . . .. 67
5.10. Career Outcomes of Unionized Employees in AcqDemo Relative to Those of Unionized Employees in the GS System, September 30, 20I I, Cohorts .. ....... . ...... . . . . 69
5.Il. Career Outcomes of Unionized Employees in AcqDemo Relative to Those of Nonunionized Employees in AcqDemo, September 30, 20I I, Cohort ... . . . . .. . . . . ... . .. .. 71
5.12. Career Outcomes of AW Members in AcqDemo Relative to Those of AW Members in the GS System, September 30, 201 1, Cohort . .. . . . ... . . .. .. . .... . . ... .. .. ... . . . ... . .... . .. .. 74
5.13. Career Outcomes of Supervisors in AcqDemo Relative to Those of Supervisors in the GS System, September 30, 20I I, Cohort . .. .. ..... .... . . . .. . .. . ... ...... ... ..... . . . .... . 75
5.I4. Career Outcomes of Veterans in AcqDemo Relative to Those of Veterans in the GS System, September 30, 20II, Cohort .. . .. . . . . . . . ... .. .. .. . . .. . .. . .. . . . .. . . .... . . . . . . . .. .. . 77
ix

x 2016 Assessment of the Civilian Acquisition Workforce Personnel Demonstration Project
5.15. Number and Share of Temporary Appointments, September 30 of Each Year, 201 1 to 2015 ....... ... ........ .. .. ...................................................................... .. 79
5.16. Prevalence of Starting Salaries at the Top of the Pay Band, Newly Hired Employees Between December 31, 2010, and September 30, 2015 .. ... . ... .. ..... . . ...... . 80
5.17. Compensation Actions, FY 2015 Appraisal Cycle . .. ..... . .. .. . .... . .. ... . ... ... . . .. . . ..... . . 84 6.1. Career Outcomes of Women in AcqDemo Relative to Those of Women in the
GS System, September 30, 2011, Cohorts ... .. .... . ... . .. ..... ..... .. .... . .. ... .. . . .. . . ...... . 90 6.2. Career Outcomes of Women in AcqDemo Relative to Those of Men in AcqDemo,
September 30, 201 1 , Cohorts ... . ........ ..... .. ... ....... ... ....... ....... . .. .... .. ... .... . .. .... 91 6.3. Career Outcomes of Blacks in AcqDemo Relative to Those of Blacks in the GS
System, September 30, 201 1 , Cohorts ... ........... ... .. ... ... . ... . . . . .. .. .. . . .. . . .. ........... 94 6.4. Career Outcomes of Blacks in AcqDemo Relative to Those of Whites in AcqDemo,
September 30, 201 1 , Cohorts . ... .... .. ... .. .. .... ........ . . . . . ...... .. ..... ... ...... .. ... . . ..... 96 6.5. Career Outcomes of Asians in AcqDemo Relative to Those of Asians in the GS
System, September 30, 201 1, Cohorts ..... .. .. . ..... .... .. . . ..... .. ... .. ... . .. .... . .. .......... 99 6.6. Career Outcomes of Asians in AcqDemo Relative to Those of Whites in
AcqDemo, September 30, 201 1, Cohorts .................... . .. .. ........ ....... . . ....... .. .. 100 6.7. Career Outcomes of Hispanics in AcqDemo Relative to Those of Hispanics in
the GS System, September 30, 201 1 , Cohorts ... ......................... .... ... . ... .... .. .. . 101 6.8. Career Outcomes of Hispanics in AcqDemo Relative to Those of Non-Hispanics
in AcqDemo, September 30, 201 1, Cohorts . ... . . . .. . ... . .... . . .. . . . .. ... .. .. . . .. . .. . ... .. . .. 102 7.1 . Compensation Actions by Pay Band Position, FY 2015 Appraisal Cycle .......... ...... . 107 7.2. CR!, CA, and CRI Carryover Award Sizes by Career Path, FY 2015 Appraisal
Cycle . . . . . . . . . . . . . . . . . . . . . . . . . . . . . . . . . . . . . . . . . . . . . . . . . . . . . . . . . . . . . . . . . . . . . . . . . . . . . . . . . . . . . . . . . . . . . . . 130 7.3. Distribution of the AcqDemo Workforce Across Appraisal Zones and
f10CS Ranges . .. .. .. .. . . .. . ......... .. ..... ........ ..... .. . .. . .. . .. . . .. . . . . . ..................... 132 7.4. Distribution of Annualized Basic Pay Within AcqDemo ......... ..... ............... . ..... 133
A.I. Demographic Comparison of2015 AcqDemo Population and 2016 Survey Sample .. . . ... ...... . ..... .. ...... .. .. ... ... ... .. . .. ... . .... .... . .. . .... . ...... .... ... . . .. . . ... .. .. . 147
A.2. Demographic Comparison of201 1 AcqDemo Population and 2012 Survey Sample .... .. ........... .... ......... ........................ . ... . .... .. ... ... .. . ... ... . . ... . ...... . 148
A.3. Demographic Comparison of 2012 and 2016 Survey Samples ......................... . . .. 150 A.4. Weighted Response Frequencies for the 2012 and 2016 AcqDemo Survey Items
Included in This Report, Full Sample . . .. ...... .. .. .. ... .. . . . ... ..... ... .. . .... .. . . . ... . .... . . 151 A.5. Weighted Response Frequencies for the 2012 and 2016 AcqDemo Survey Items
Included in This Report, by Subgroup .. . ...... .. ... ... .... .. ... ..... . . . . . . . . . . . . . . . . . . . . . . . . . 154 B.1 . Breakdown of Responses to Open-Ended Survey Items ... ..... ......... .. .. . .............. 162 B.2. Demographic Comparison of Respondents and Nonrespondents to the
Open-Ended Survey Items .... .. .. . .. .... .. .. . .... .. ....... . .. .. . . .. . . ... . . .. . . . .. . . . . . . . . . . . . .. 163 B.3. Interview Protocol for Enterprise-Level AcqDemo Representatives .. . . . .... .. . . . .. . . . ... . 168 B.4. Interview Protocol for Enterprise-Level Personnel Tasked with AcqDemo-Related
Training . . . ......... .......... .. .. ... ........... ..... . .. ... ... ..... .... ...... .. ..... ... . . . . . . ... . . . 171 B.5. Interview Protocol for Pay Pool Managers. . . . . . . . . . . . . . . . . . . . . . . . . . . . . . . . . . . . . . . . . . . . . . . . . . . . 172 C.1 . Balance Between AcqDemo and AcqDemo-Eligible Organizations in the GS
System After Propensity Score Weighting, September 30, 201 1 , Cohorts ... . ... . . .. . . .. . 177 C.2. Movement Between AcqDemo and AcqDemo-Eligible Organizations in the GS
System, September 30, 201 1 , Cohorts ..... ...... . . . ...... . ... . . . . .. .. . .. .. .. .. ... . . .. ....... . . 179 C.3. Retention Rates, September 30, 201 1, Cohorts . .. . .... . .. . . .. . . ... . . . . . . . . . . .. .... .. .. .. .. . . 182 C.4. CPH Model of Months to Separation, September 30, 201 1 , Cohorts . .. ...... . ... ........ 183

C.5. Balance Between AcqDemo and AcqDemo-Eligible Organizations in the GS System After Propensity Score Weighting, Newly Hired Employees,
Tables xi
December 31, 2010, to September 30, 2015 . . . . . . . . . . . . . . . . . . . . . . . . . . . . . . . . . . . . . . . . . . . .. . ... . 186 C.6. Linear Regression Model of Starting Salary, Newly Hired Employees,
December 31, 2010, to September 30, 2015 . . . . . . . . . . . . . . . . . . . . . . .. . . . . . . . . . . . . . . . . . . . . . . . . . . 187 C.7. Linear Regression Model of2015 Annualized Basic Pay, September 30, 201 1 ,
Cohorts . . . . . . . . . . . . . . . . . . . . . . . . . . . . . . . . . . . . . . . . . . . . . . . . . . . . . . . . . . . . . . . . . . . . . . . . . . . . . . . . . . . . . . . . . . . . 189 C.8. Linear Regression Model of2015 Annualized Rate of Salary Growth,
September 30, 201 1, Cohorts. . . . . .. . ... . . . . . . . . . . . . . . . . . . . . . . . . . . . . . . . . . . . . . . . . . . . . . . . . . . . . . . . . 191 C.9. Balance Between AcqDemo and AcqDemo-Eligible Organizations in the GS
System After Propensity Score Weighting, September 30, 201 1 , Cohorts after Excluding NH-4 Employees and Employees with Demotions. . . . . . . . . . . . . . . . . . . . . . . . . . . . . 193
C. 10. Poisson Regression Model of Number of Promotions, September 30, 201 1, Cohorts After Excluding NH-4 Employees and Employees with Demotions . . . . . . . . . .. 195
C.1 1 . Estimating the Effect of Performance in FY 2014 on Retention in FY 2015 Within AcqDemo, September 30, 201 1 , Cohorts . . . . . . . . . . . . . . . . . . . . . . . . . . . . . . . . . . . . . . .. . . . . 198
C. 12. Estimating the Effect of Broadband in FY 2014 on Retention in FY 2015 Within the NH Career Path, September 30, 201 1 , Cohorts . . .. .. . . . .. . . . . . . . . . . . . . . . . . . .. 200
C.13. Cox Proportional Hazards Model of Months to Separation with Interaction Terms, September 30, 2011 , Cohorts . . ... .. . . . . . . . . . . . . . . . .. . . . . . . . . . . . . . . . . . . . . . . . . . . . . . . . . . . 203
C.14. Linear Regression Model of Starting Salary with Interaction Terms, Newly Hired Employees, December 31 , 2010, to September 30, 2015 . . . . . . . . . . . . . . . . . . . . . . . .. . . . 204
C.15. Linear Regression Model of2015 Annualized Basic Pay with Interaction Terms, September 30, 201 1 , Cohorts . . . . . . . . . . . . . . . . . . . . . . . . . . . . . . . . . . . . . . . . . . . . .. . .. . . . . . . . . . . . . . . . . . . 206
C. 16. Linear Regression Model of2015 Annualized Rate of Salary Growth with Interaction Terms, September 30, 201 1 , Cohorts . .. . . . . . . . . . . . . . . . . . . . . . . . . . . . . . . . . . . . . . . . . . 208
C.17. Poisson Regression Model of Number of Promotions with Interaction Terms, September 30, 201 1 , Cohorts, After Excluding NH-4 Employees and Employees with Demotions . . . . ... . . . . . . . . . . . . . . . . . . . . . . . . . . . . . . . .. . . . . . . . . .. . . . . . . . . . . . . . . ... . .. . . .. . . . . . . . . 209

Summary
The majority of federal civilian employees work on the General Schedule (GS) classification and pay personnel system. However, many criticisms have been voiced about the GS system, including the view that poorly performing employees are tolerated for extended periods and that compensation is not directly linked to performance. To "stimulate constructive change in federal personnel management," Congress included provisions for a limited number of demonstration projects in the Civil Service Reform Act of 1978 (U.S. Merit Systems Protection Board, 1992). Demonstration projects are alternative personnel management systems, which temporarily exempt agencies "from the coverage of particular laws and regulations in order to test new ideas" (U.S. Merit Systems Protection Board, 1992). One such demonstration project, the Department of Defense Civilian Acquisition Workforce Personnel Demonstration Project (AcqDemo), is the subject of this report.
AcqDemo was authorized in the National Defense Authorization Act (NOAA) for fiscal year {FY) 1996 (Pub. L. 104-106, 1996), as amended by Section 845 of the NOAA for FY 1998 (Pub L. 105-85, 1997). This legislation permitted the U.S. Department of Defense (DoD), with approval from the Office of Personnel Management {OPM), to conduct a personnel demonstration project within its civilian acquisition workforce (AW). AcqDemo was designed in 1998 and implemented in 1999 under Federal Register Notice (FRN) 64 (OPM, 1999). The project was regarded as an opportunity to transform civilian personnel management policies and procedures to meet the needs of the Acquisition, Technology, and Logistics (AT&L) workforce and to better support the DoD acquisition mission. Specifically, AcqDemo aims to provide a system that retains, recognizes, and rewards employees for their contributions and supports their personal and professional development.
The FY 201 1 NOAA instructed the Secretary of Defense to designate an independent organization to conduct two assessments of AcqDemo. This report is the second of these assessments. The 12 legislatively mandated elements for the assessment, along with five additional assessment criteria developed by the AcqDemo Program Office in consultation with OPM, are listed in Table S.l.
Study Approach
Our assessment, conducted over a nine-month period, was informed by multiple data sources: • program documents • archival data • interviews with AcqDemo subject-matter experts (SMEs) • 2012 and 2016 AcqDemo surveys conducted by CSRA Inc. • administrative data.
xiii

xiv 201 6 Assessment of the Civilian Acquisition Workforce Personnel Demonstration Project
Table S.1 AcqDemo Assessment Criteria
Legislatively Mandated Assessment Criteria
A. A description of the workforce included in the project
B. An explanation of the flexibilities used in the project to appoint individuals to the acquisition workforce, and whether those appointments are based on competitive procedures and recognize veterans' preferences
C. An explanation of the flexibilities used in the project to develop a performance appraisal system that recognizes excellence in performance and offers opportunities for improvement
D. The steps taken to ensure that such a system is fair and transparent for all employees in the project
E. How the project allows the organization to better meet mission needs
F. An analysis of how the flexibilities in points B and C are used and what barriers have been encountered that inhibit their use
· G. Whether there is a process for
a. ensuring ongoing performance feedback and dialogue among supervisors, managers, and employees throughout the performance appraisal period
b. setting timetables for performance appraisals
H. The project's impact on career progression
I . The project's appropriateness or inappropriateness in light of the complexities of the workforce affected
J. The project's sufficiency in terms of providing protections for diversity in promotion and retention of personnel
K. The adequacy of the training, policy guidelines, and other preparations afforded in connection with using the project
L. Whether there is a process for ensuring employee involvement in the development and improvement of the project
Additional Criteria Specified by the AcqDemo Program Office
1 . Salary cost growth comparison with General Schedule (GS) equivalent population (both acquisition workforce and non-acquisition workforce, as applicable)-the implementing FRN requires cost d iscipl ine, not cost neutrality a. overall program cost comparison b. starting salaries for new hires
2. AcqDemo versus GS retention and turnover rates a. by appraisal zone b. by broadband and career path
3. A comparison of results for bargaining unit employees participating in AcqDemo, versus those not participating in AcqDemo
4. Career progression comparison with GS, by Broadband and Career Path a. Contribution-Based Compensation and Appraisal System (CCAS) increases versus within grade
increase (WIGI) rates
5. A follow-up assessment of AcqDemo's impact on retention and compensation of unionized employees
SOURCES: 10 U.S.C. 1 762, amended 201 5; AcqDemo Program Office Statement of Requirement, June 1 2015.

Summary xv
Program documents were collected from AcqDemo's website and directly from theAcqDemo Program Office. These documents included FRNs, the AcqDemo operating procedures manual, a list of eligibility requirements for joining AcqDemo, pay cycle reports, and training materials. Archival data included site histories, AcqDemo Executive Council meeting minutes, training session feedback summaries, and grievance data. Twenty-two semi-structured interviews were conducted with AcqDemo SMEs: seven interviews with enterprise-level AcqDemo representatives, six with enterprise-level personnel tasked with AcqDemo-related training, and nine interviews with pay pool managers. Survey data were obtained from the 2012 and 2016 AcqDemo surveys, which were designed and administered by CSRA Inc., a contractor employed by the AcqDemo Program Office. The surveys provided us with both quantitative data in the form of responses to multiple-choice questions and qualitative data in the form of write-in responses to open-ended questions. The Defense Manpower Data Center (DMDC) and the AcqDemo Program Office provided administrative data. The DMDC data covered both AcqDemo participants and GS employees over the period beginning on October l, 2010, and ending on September 30, 2015. The data provided by the AcqDemo Program Office covered only AcqDemo participants and consisted of annual snapshots taken on September 30 ofFYs 201 1 through 2015.
Qualitative data collected from the site histories, AcqDemo Executive Council meeting minutes, interviews with AcqDemo SMEs, and write-in responses to open-ended questions in the 2016 AcqDemo survey were systematically catalogued and analyzed to identify prominent themes based on prevalence, data richness, and ubiquity. As is common in qualitative research, we focused on topics that repeatedly occurred in the data. We also noted the presence of disparate views to distinguish topics or phenomena with a broad range of views from topics or phenomena with a relatively narrow range of views.
The quantitative survey data consisted of the responses to multiple-choice questions posed by the 2012 and 2016 AcqDemo surveys. The surveys were fielded to the entire AcqDemo workforce, as well as to a set of DoD organizations that were not participating in AcqDemo. However, we restricted our analysis to the responses from AcqDemo participants because of the low response rates among non-AcqDemo employees. To account for demographic differences between the survey respondents and the AcqDemo workforce at large, we applied weights to the survey respondents so as to make their responses more representative of the AcqDemo population. We used the weighted responses to conduct statistical analyses of the full samples from both 2012 and 2016, as well as statistical analyses of subgroups, including those based on gender, race or ethnicity, bargaining unit membership, and supervisory status.
The administrative data provided by DMDC included records for every civilian employee in DoD. Using these data, we constructed a longitudinal data set, which permitted us to track individual employees over time. The AcqDemo Program Office provided more detailed data on the performance ratings a
·nd compensation actions of AcqDemo participants specifically,
which we merged with the longitudinal data set constructed from the DMDC files. The administrative data were used primarily to assess the composition of the AcqDemo workforce and to estimate AcqDemo's effect on various career outcomes, including compensation, promotion, and retention. In order to isolate the effect of AcqDemo participation on each career outcome, we constructed a comparison group of GS employees in DoD organizations that were eligible for, but not panicipating in, AcqDemo. Weights were applied to the comparison group so that it more closely resembled the AcqDemo workforce with respect to age, gender, race or ethnicity, education level, component, occupation, career level, AW membership, bargaining unit membership, and a number of other characteristics. Regression analysis was applied to a data
xvi 201 6 Assessment of the Civilian Acquisition Workforce Personnel Demonstration Project
set consisting of the AcqDemo population and the weighted GS comparison group to estimate the extent to which career outcomes in AcqDemo differed from those in GS, after controlling for other factors.
It is worth noting that the various data sources were not without their limitations. For example, we were not able to assess the perceptions of AcqDemo participants in relation to the perceptions of comparable GS employees, and we could not correct for the general tendency toward negativity in open-ended responses to employee surveys. To compensate, we used 2012 AcqDemo survey results as a referent group, and our approach to analyzing write-in responses entailed not only identifying salient themes but also conveying the range of responses for them. While we were able to construct a GS comparison group from the administrative data for our analysis of AcqDemo's effect on career outcomes, our ability to control for differences between the AcqDemo and GS populations was limited by the characteristics captured in the DMDC data files. We were not able to account for unobserved differences using a difference-in-difference approach because the overwhelming majority of AcqDemo participants transferred into the project from the National Security Personnel System (NSPS), rather than the GS system. In addition, our analysis of the relationship between employee performance and career outcomes was limited to the AcqDemo population because the performance rating data for GS employees were too coarse and unreliable.
Despite their limitations, the multiple data sources-when taken together-provided a solid foundation for RAND's assessment. Rigorous analytical methods were applied to each data source, and the findings were compared across sources to construct a comprehensive assessment for each criterion.
Assessment Overview
Using the methods described earlier, we carefully addressed each of the 17 assessment criteria listed in Table S.1 . The full report provides a detailed account of the results. In this summary, we provide an overview of the most salient findings related to AcqDemo's performance. We begin with a brief description of AcqDemo's structure and flexibilities and follow it with a comparison of the AcqDemo workforce to the population of GS employees. We then review those aspects of AcqDemo that appear to be performing well. The summary concludes with a discussion of areas where the project's performance could be improved.
AcqDemo's Structure and Flexibilities
AcqDemo differs from the GS system in many ways, but there are two features of the project that are particularly relevant to this assessment: its use of broadbands to classify employees and its performance appraisal system, which ties compensation to contribution to the organizational mission.
When employees enter AcqDemo, they are assigned to one of three career paths based on their occupations: business management and technical management professional (NH), technical management support (NJ), and administrative support (NK). As shown in Figure S.l, the NH and NJ career paths each have four pay bands, and the NK career path has three pay bands. Because each pay band corresponds to two or more GS grades, the pay bands are referred to as broadbands. When personnel enter AcqDemo, their supervisors have pay-setting flexibility, meaning that they have the ability to set the new employee's initial compensation at different

Figure S.1 Career Paths and Broadband Structure
Business management and technical management professional (NH)
(GS 1-4)
Technical management support (NJ)
I II
{GS 1-4) (GS 5-8)
Administrative support (NK)
II
(GS 1-4) (GS 5-7)
SOURCE: AcqDemo Program Office, 201 6. RAND RR1783-S. f
I I
(GS 5-1 1)
I l l
{GS 9-1 1 )
Il l
(GS 8-10)
Summary xvii
Ill IV
(GS 1 2-13) {GS 14-1 5)
IV
(GS 1 2-1 3)
points within the broadband. Employees can typically be reassigned within the same broadband without changes in pay or job description. However, changes to an employee's broadband or career path require that the employee apply for a competitive position.
AcqDemo's CCAS is designed to provide an equitable and flexible method for evaluating and compensating the workforce. It differs fundamentally from the GS system in that it explicitly ties an employee's compensation to his or her contribution to the organizational mission. By rewarding high contributors and withholding remuneration from low contributors, CCAS is intended to attract and retain a highly qualified workforce of employees who are motivated to maximize their contributions.
CCAS is an annual process with six distinct phases: contribution planning, midpoint review, employee self-assessment, supervisor annual appraisal, pay pool process, and communication of results. This process is distinct from the GS appraisal system in its focus on employee contribution to the organizational mission as a determinant of compensation actions, its provision of designated intervals for communication and feedback, and its use of pay pools to finalize ratings and compensations actions.
AcqDemo employees' contributions are documented and rated based on six factors: problem-solving, teamwork and cooperation, customer relations, leadership and supervision, communication, and resource management. These factors serve as an organizing framework when employees complete their self-assessments. Supervisors subsequently use this input and their own observations to generate an annual appraisal for each employee, which includes preliminary factor scores.
Supervisor appraisals are reviewed during the pay pool process. A pay pool is a group of employees who are evaluated collectively. These employees typically work in the same part of an organization and represent a variety of functional areas. Every pay pool convenes a panel

xviii 2016 Assessment of the Civi lian Acquisition Workforce Personnel Demonstration Project
of supervisors to review the complete set of annual appraisals. A senior leader and supporting staff facilitate the meeting. During the meeting, the pay pool panel reviews the preliminary factor scores reported in the annual appraisals and adjusts them as needed to ensure equity and consistency across employees. The final factor scores are averaged, and the resulting overall contribution score (OCS) becomes the employee's rating of record.
An algorithm is used to translate the OCS into a recommended compensation action. Employees who perform at or above their expected OCSs can receive basic pay increases or one-time awards. The algorithm is designed to provide greater rewards to employees who make greater contributions to the organizational mission.
Composition of the AcqDemo Workforce
Using administrative data provided by DMDC, we examined the characteristics of the AcqDemo workforce on September 30, 2015, the most recent date for which data were available. On that date, AcqDemo had 16,258 participants, of which 16,000 were permanent, full-time employees. The population was heavily male, highly educated, relatively senior, and unionized at a low rate. The Army employed nearly half of AcqDemo participants, while the Navy employed fewer than 5 percent. Approximately three-fourths of AcqDemo participants were members of the AW.
We also compared the characteristics of the AcqDemo workforce with those of two distinct populations of GS employees: the full set of DoD civilian personnel in the GS system and the subset of those GS employees who were in AcqDemo-eligible organizations (ADEOs}. Table S.2 summarizes the characteristics of permanent, full-time employees in all three groups. When compared with the full set of GS employees, the AcqDemo workforce was markedly less unionized. Only 9 percent of AcqDemo participants were members of a bargaining unit, while more than half of the GS group was unionized. The AcqDemo workforce was also more highly educated, more concentrated in technical fields, and more likely to hold senior-level positions. Not surprisingly, AcqDemo participants were more highly compensated than GS employees were. After excluding employees on retained pay, the average AcqDemo participant earned $89,921 per year in basic pay, while the average GS employee earned $62,919 per year.1
Restricting the comparison group to GS employees in ADEOs (without applying any weights) mitigated some of the disparities between the AcqDemo and GS populations but did not close the gaps entirely. For example, AW employees constituted only 20 percent of the full set of GS employees but 37 percent of GS employees in ADEOs, which still fell short of the 74-percent representation in AcqDemo. The most notable remaining disparity was in compensation: Restricting the comparison group raised average annualized basic pay, but only to $66,933. In the next section, we assess the extent to which the pay disparity can be attributed to factors other than AcqDemo.
As noted earlier, the figures in Table S.2 are from September 30, 2015. AcqDemo grew considerably during the assessment time frame, and the project has plans to expand further. Its
1 Employees on retained pay were omitted from the average because the annualized basic pay data include locality pay for employees on retained pay but exclude locality pay for employees not on retained pay. Consequently, basic pay data are not directly comparable across the two groups. As shown in Table S .2. 6 percent of AcqDemo participants and 4 percent of GS employees were on retained pay on September 30, 2015. A DoD civilian employee may be put on retained pay status if his or her grade or pay would otherwise be reduced as a result of an involuntary personnel action or other personnel action determined to be in the best interest of the government, such as a reduction in force or a position redassificacion. For more information, see DoD Instruction 1400.25, Vol. 536, 2006.

Summary xix
Table S.2 Characteristics of AcqDemo Participants, DoD Employees in the GS System, and GS Employees in AcqDemo-Eligible Organizations, September 30, 2015
GS Employees in AcqDemo-
AcqDemo DoD Employees Eligible Demographic Category Characteristic Participants in the GS System Organizations
Gender (%) Male 65.1 60.5 58.0 Female 34.9 39.5 42.0
Race (%) White 76.1 70.4 71 .0 Black 13.8 1 6.9 17.1 Asian 4.3 5.2 4.9 Other 5.8 7.6 7.0
Hispanic (%) Yes 5.1 6.4 5.9 No 94.9 93.6 94.1
Education level (%) No college 12.9 29.0 21.8 Some college 9.3 20.0 18.1
Bachelor's degree 34.6 28.4 32.5 Graduate degree 43.2 22.7 27.7
Veteran (%) Yes 39.6 46.9 42.6 No 60.4 53.1 57.4
Component (%) Army 48.2 37.0 59.9 Air Force 19.0 23.0 13.4
DoD agencies 17.0 15.9 24.1 Marine Corps 1 1 .6 2.6 0.0
Navy 4.2 2 1 .5 2.6
Occupational group (%) Engineers 22.4 8.8 12.0 Logistics management 20.7 14.2 22.9 Central management 18.1 1 6.0 15.2
General office operations 1 1 .2 1 .8 0.6 Data systems management 5.5 6.5 4.4
Mathematicians 3.8 0.6 0.7 Financial management 2.8 6.2 4.4
Financial clerks 2.3 1 .2 0.3 Logistics technicians 1 .9 5.2 6.6
Secretarial 1 .0 1 .2 0.9 Other 10.2 40.0 3 1 .7
Career level (%) Entry level 10.8 23.7 17.1 Midlevel 50.1 68.2 73.0
Senior level 39.3 8.1 9.9
Retirement eligibility (%) Eligible 39.8 33.5 35.8 Not eligible 60.1 66.2 63.9 Unknown 0.1 0.3 0.3
Acquisition workforce (%) Yes 74.4 19.7 37.4 No 25.6 80.3 62.6
Supervisor (%) Yes 23.4 14.7 12.6 No 76.6 85.3 87.4
Bargaining unit (%) Yes 9.5 55.7 62.0 No 90.5 44.3 38.0
Retained pay (%) Yes 6.0 3.8 3.8 No 94.0 96.0 96.2
Average age 48.9 47.6 47.9

xx 201 6 Assessment of the Civilian Acquisition Workforce Personnel Demonstration Project
Table S.2-Continued
GS Employees in AcqDemo-
AcqDemo DoD Employees Eligible Demograph ic Category Characteristic Participants in the GS System Organ izations
Average years of federal 1 6.5 15.1 1 5.7 service
Average annualized basic pay $89,921 $62,919 $66,933
Total personnel 16,000 466,878 124,166
SOURCES: DMDC civilian personnel inventory files; DAWIA personnel files.
NOTES: Percentages may not add up to 100 due to rounding. The data presented include only permanent, fulltime employees whose compensation was at least $15,080, the salary equivalent of working a full year at federal minimum wage. The average annualized basic pay figures exclude employees on retained pay and are expressed in 2015 dollars. Neither the population of DoD employees in the GS system nor the population of GS employees in AcqDemo-eligible organizations is weighted.
population is expected to grow from about 20,000 employees in early 2016 to approximately 50,000 by the end of FY 2018. Twenty-one new organizations are scheduled to join AcqDemo, primarily from the Air Force.
Aspects of AcqDemo That Are Performing Well
Our assessment revealed that AcqDemo is performing well in many respects. The $23,000 premium observed when comparing the salaries of AcqDemo participants with the salaries of GS employees in ADEOs {see Table S.2) was largely explained by differences between the two populations: Only $1,500 to $1,800 could be attributed to AcqDemo icsel£ In addition, salary growth and retention outcomes in AcqDemo were similar to those in the GS system. From FY 2011 to FY 2015, salaries in AcqDemo rose at an average annualized rate of 1 .2 percent, and about 78 percent of permanent, full-time employees who were in AcqDemo on September 30, 2011 , remained in the DoD civilian workforce over the ensuing four years. There were no statistically significant differences between these figures and the corresponding figures for GS employees in ADEOs once we controlled for other factors.
Unionized employees in AcqDemo have fared well in terms of their career outcomes. In comparing unionized employees in AcqDemo to unionized employees in the GS system, we found that starting salaries in AcqDemo were about $12,000 higher, even after controlling for other factors. Overall, AcqDemo also paid higher salaries by a margin of about $700 to $1,400. In comparing unionized and nonunionized employees within AcqDemo, we found no discernible differences in starting salaries or overall salaries, but salaries increased more rapidly for unionized employees. Promotions were more likely among unionized employees than among nonunionized employees, while the reverse was true within the GS comparison group. Retention was measurably better for unionized AcqDemo employees than for their nonunionized counterparts, but the same pattern was present within the GS comparison group.
One of AcqDemo's central tenets is that employees should be appropriately rewarded for their contributions to the organizational mission. Our analysis of administrative data indicated that within AcqDemo, higher levels of contribution were associated with higher salaries, morerapid salary growth, more promotions, and a greater likelihood of retention. The overwhelming majority of AcqOemo participants can reasonably expect additional efforts or contribu-

Summary xxi
tions to augment their salaries by $900 to $1 ,800 annually and to raise the annualized rate of salary growth by 0.4 to 1 . 1 percentage points. In addition, employees with higher OCSs were more likely to be promoted and retained than were employees with lower OCSs, although the margins were small for both career outcomes.
The SMEs we interviewed explained that AcqDemo supports the acquisition mission by attracting and retaining a high-quality workforce and by offering more agility to meet changing mission requirements. We could not assess objectively whether AcqDemo helped with recruiting talent, but SMEs perceived that it had done so, while write-in comments from the 2016 AcqDemo survey reflected mixed views from supervisors in this regard. As discussed earlier, our analysis of administrative data indicated that retention was higher among highcontributing employees than among low contributors. Supervisors who completed the 2016 survey tended to believe that AcqDemo was flexible enough to allow for workforce adjustments in response to workload and mission changes and that the job classification system was flexible enough to respond to changing requirements. However, they were less positive about their ability to reassign employees to permanent positions within their organizations.
Survey respondents expressed positive sentiments regarding their communication with their supervisors. More than 60 percent of survey respondents agreed that their supervisors set clear contribution goals, effectively communicate expectations for positions, and provide adequate feedback on contributions. They also tended to agree that meaningful performance appraisal sessions can take place. In addition, the majority of AcqDemo survey respondents agreed that high levels of trust exist or can be developed between supervisors and subordinates and that their respective supervisors have earned their trust and confidence.
Aspects of AcqDemo That Leave Room for Improvement
Other aspects of AcqDemo leave room for improvement. One of the more heralded flexibilities that AcqDemo offers is the ability to set starting salaries at different points within the broadband. This pay-setting flexibility was designed to position AcqDemo to compete more effectively for highly skilled and motivated personnel. Our analysis of administrative data provides strong evidence that supervisors and managers are applying this flexibility: Starting salaries for employees who entered the DoD civilian workforce as AcqDemo participants were about $13,000 higher than starting salaries for comparable employees who entered the DoD civilian workforce as GS employees in ADEOs. However, it is not clear whether the flexibility has been used appropriately. ADEOs in the GS system appear to have hired comparable employees at lower starting salaries, although the comparison suffers from our inability to control for performance.
Our analysis of administrative data also showed that promotions were less prevalent in AcqDemo than in the equivalent GS population, even after normalizing promotions within the GS system and controlling for other factors. 2 AcqDemo participants experienced 23 percent fewer promotions than did comparable GS employees. This means that for the average
2 Because each of AcqDemo's broadbands corresponds to two or more GS grades (sec Figure S.1), promotions occurred at least twice as ofren in GS. For instance, a program manager ascending from the GS-14 to GS-15 level would earn a promotion in the GS system but not in AcqDemo because the NH-4 broadband encompasses both grades. We corrected for this problem by assigning an AcqDemo career path and broadband to each GS employee in an ADEO and crediting promotions within the GS system only when the employee moved to a higher career path within a broadband or a higher broadband within a career path. In this way, we brought the definition of promotion within the GS comparison group in line with the definition of promotion within AcqDemo.

xxii 2016 Assessment of the Civilian Acquisition Workforce Personnel Demonstration Project
employee, AcqDemo participation reduced the probability of promotion from about 19 percent to about 14 percent over the four years that elapsed from September 30, 201 1, to September 20, 2015. Only 25 percent to 30 percent of AcqDemo survey respondents felt satisfied with their opportunities for promotion, and even fewer reported positive sentiments regarding the project's influence on their promotion opportunities.
In some cases, we observed disparities in career outcomes across gender and race or ethnicity groups. When compared with the GS system, AcqDemo raised starting salaries and overall salaries for every gender and race or ethnicity group we examined, but the rising tide did not lift all boats equally. For example, the AcqDemo starting salary premium was about $13,000 for the population at large, but the premium was only about $1 1 ,000 for black employees. Female and nonwhite employees in AcqDemo experienced fewer promotions and less-rapid salary growth than their counterparts in the GS system. For instance, AcqDemo participation reduced the likelihood of promotion for the average nonwhite employee from about 19 percent to about 13 percent. Within AcqDemo, female employees were retained at a lower rate than male employees, but that pattern was also present within the equivalent GS population. However, black and Asian employees were retained at higher rates than their white counterparts.
As noted in the previous section, higher levels of contribution were associated with higher salaries. However, only about 40 percent of survey respondents perceived a link between contribution and compensation. This figure is lower than comparable survey statistics from other demonstration projects. We offer three possible explanations for the misalignment between employee perceptions and the empirical reality. First, the misalignment may be due to a perceived lack of transparency regarding how ratings are calculated and translated to pay, how the pay pool process works, and how pay pool results are shared. These perceptions emerged from our analysis of write-in comments from the 2016 AcqDemo survey and, in some cases, were corroborated by evidence from the SME interviews. For instance, one SME explained that
[i]n AcqDemo, there's no way to compute what the payouts are going to be because there's a big algorithm that does it. Over time, I learned based on consistency year after year what a plus I looks like for someone in the 90 range, 80 range . . . but in terms of employees, they don't know until they get their first paycheck after evaluation what the payout will be. It's an opaque process in terms of payout.
Second, employees may feel that OCSs do not adequately capture their contributions. Survey and interview evidence indicate perceived subjectivity in the performance review process and mixed views regarding whether performance can be objectively and inclusively measured. Senior-level employees and supervisors are heavily represented in AcqDemo (see Table S.2), and academic research suggests that objective measures of managers' performance may be difficult to specify in advance, given the nonroutine nature of their work.
Finally, the misalignment between employee perceptions and the empirical reality may be explained by employees feeling that compensation does not vary enough with contribution. As mentioned in the previous section, the overwhelming majority of AcqDemo participants can reasonably expect additional efforts or contributions to augment their salaries by $900 to $1,800 per year-approximately 1 percent to 2 percent of an average annualized basic pay rate.
Pay caps, in part, constrain the magnitude of these salary increases. In FY 2015, nearly 40 percent of AcqDemo employees were subject to pay caps associated with being at the top of their pay bands or were nearing a control point within their pay bands. Pay caps associated

Summary xxiii
with being at the top of a pay band are artifacts of the GS system. As shown in Figure S.l , each AcqDemo broadband corresponds to two or more GS grades. Accordingly, the pay cap that applies to AcqDemo employees at the top of the NH-2 broadband is a byproduct of the pay cap that applies to GS-1 1 employees who are at step 10. The establishment of control points, on the other hand, is at the discretion of the organization. AcqDemo organizations may set compensation limits within a pay band to ensure equity and consistency within the organization. In some cases, control points have been used to align pay bands with the GS system. For instance, one SME reported that his organization had established a control point within the NH-4 broadband to distinguish between employees at the GS-14 level and employees at the GS-15 level.
While pay caps are not unique to AcqDemo and are intended to promote cost discipline, they present a greater challenge to AcqDemo than to the GS system for two reasons. First, pay caps are more prevalent among AcqDemo participants: In FY 2015, only 14 percent of GS employees in ADEOs were at step 10 of their respective grades. Second, pay caps run counter to one of AcqDemo's central tenets, which is that employees should be appropriately rewarded for their contributions to the organizational mission. As in the GS system, the pool of funds available for salary increases in AcqDemo is limited. However, maintaining the integrity of AcqDemo's foundation as a performance-based pay system requires the distribution of this limited pool of funds to be determined by, or at least strongly associated with, differences in employee contribution. Pay caps erode this association, and, with nearly 40 percent of the workforce subject to a pay cap, the degree of that erosion could be significant.
AcqDemo also offers one-time bonuses in the form of CRI carryover awards and contribution awards (CAs). CRI carryover awards are intended to compensate employees who forfeit salary increases as a result of pay caps; CAs are intended to reward contributions to the mission, independent of whether the employee is subject to a pay cap. Our analysis of administrative data indicated that CRI carryover awards do not fully compensate for the salary increases denied because of pay caps. CAs boost employee compensation by about $1,000 on average but do not vary widely across employees. In the FY 2015 appraisal cycle, 92 percent of AcqDemo participants received a CA, and the overwhelming majority of those received an award totaling less than $2,000. Like other federal agencies, AcqDemo is subject to limits on the size of its award budget because of policies issued by OPM, the Office of Management and Budget, and DoD. However, in practice, AcqDemo organizations have opted to use their policy-constrained award budgets to give smaller awards to the majority of employees, rather than to provide larger awards to a smaller percentage of employees.
When the variance in salary increases and awards is constrained, be it by pay caps or business practices, the link between contribution and compensation is diminished. Of particular concern is that the link appears to have weakened over time. Our estimates of the effect of OCS increases on salary levels show that the effect declined over the four years that elapsed between September 30, 201 1, and September 30, 2015. Moreover, the variance, or spread, in AcqDemo salaries contracted over the same period. Because employees with a high OCS in one year tend to also have a high OCS in subsequent years, one would expect the variance in salaries to increase as rewards are granted to the same high-contributing employees year after year, but this is not what we observed. Potential causes of the narrowing spread in salaries include the aforementioned pay caps, the tendency to assign OCS within a narrow range, and the operation of the pay pool process, in which supervisors aim to reach a consensus on pay actions. Whatever the cause, it is important for AcqDemo to strengthen the link between compensation and contribution, both
xxiv 201 6 Assessment of the Civilian Acquisition Workforce Personnel Demonstration Project
perceived and actual. This relationship is the foundational principle of the system, and, as such, any further deterioration in the pay-contribution link might threaten the viability of AcqDemo.
As mentioned earlier, qualitative evidence from the AcqDemo surveys revealed a perceived lack of transparency around business rules, especially control points; the process by which ratings are calculated and translated to pay; pay pool processes; and pay pool results, including how employees compare with their peers. In some cases, evidence from the SME interviews corroborated these perceptions. In other cases, SMEs acknowledged that these concerns exist but expressed more positive views; this was particularly true with respect to the transparency of pay pool results.
Concerns about transparency were often closely intertwined with concerns about fairness. Quantitative results from the survey indicated that fewer than 40 percent of AcqDemo employees agreed that their organizations administer pay fairly. Nearly 50 percent of survey respondents agreed that supervisors are fair in recognizing individual contributions, but female employees were significantly less likely to agree with the statement than male employees. Qualitative evidence from the survey included both positive and negative comments regarding AcqDemo's fairness, but the theme was primarily negative in tone.
Taken together, skepticism about the pay-contribution link and concerns about transparency and fairness suggest that employees lack confidence in AcqDemo. This lack of confidence may adversely affect the use of the project's flexibilities by diminishing employees' motivation to participate fully in the CCAS process. For example, employees may not believe it is worth the time and effort to write thorough self-assessments or to engage their supervisors in a meaningful dialogue about how they can improve their contribution to the mission. Moreover, the lack of confidence in AcqDemo may lead to negative job attitudes and behaviors, such as low commitment and reduced productivity, which, in turn, may compromise organizations' abilities to achieve their missions. It is important to note that the lack of confidence is fueled, in part, by the misperception that there is no link between contribution and compensatipn; this suggests that AcqDemo leadership may be able to mitigate the issue through communication strategies.
Finally, the business literature suggests that performance-based pay systems are often regarded as requiring a problematic amount of time, and AcqDemo appears to be no exception. Qualitative evidence from both the SME interviews and survey write-in responses suggests that appraisal writing, feedback sessions, and pay pool administration, in particular, were perceived to be time-consuming. Interviewees and survey respondents recognized the value of these AcqDemo features but felt that they were inefficient. Survey respondents indicated that the time and effort required to implement these processes might discourage employees from fully engaging in them. Interviewees and survey respondents also expressed concerns about shortcuts that supervisors might take when pressed for time to write numerous performance appraisals. Plans to cut the number of appraisal factors from six to three could help AcqDemo achieve a better balance between providing valuable feedback and minimizing the resources invested in that function.

Acknowledgments
We appreciate the research sponsorship of Rene Thomas-Rizzo, director, Human Capital Initiatives, Office of the Under Secretary of Defense for Acquisition, Technology and Logistics. We especially benefited from the support of Darryl Burgan, former Civilian Acquisition Workforce Personnel Demonstration Project {AcqDemo) program director, and Steven Edsall, AcqDemo deputy program manager, who also served as our action officer.
RAND staff spoke with a number of subject-matter experts whose time, insights, and participation we greatly appreciated. They are not identified here to protect their confidentiality.
We also thank Bob Rue, Herb Escobar, and Darlene Reinhard of CSRA Inc. for answering numerous questions regarding the personnel data files provided by the AcqDemo Program Office. Scott Seggerman of the Defense Manpower Data Center (DMDC) prepared both the AcqDemo Program Office data files and the DMDC data files for delivery to RAND staff and answered several questions regarding the DMDC data.
Our RAND colleagues Beth Asch, Ryan Brown, Matthew Cefalu, Susan Gates, Edward Keating, David Kennedy, and Gery Ryan provided ongoing insights and suggestions on this research project. John Winkler and Lisa Harrington provided guidance as the director and associate director of the Forces and Resources Policy Center. Elizabeth Roth, Cheryl Montemayor, and Rouslan Karimov provided programming support, while Christopher Dirks and Donna White provided administrative support.
We received constructive reviews of an earlier version of this report from James Hosek and Ellen Tunstall. Craig Bond orchestrated the RAND National Defense Research Institute quality assurance process.
We thank them all, but we retain full responsibility for the objectivity, accuracy, and analytic integrity of the work presented in this report.
xxv

CHAPTER ONE
Introduction
The National Defense Authorization Act (NDAA) for fiscal year (FY) 1996 (Pub L. 104-106, 1996), as amended by Section 845 of the NDAA for FY 1998 (Pub L. 105-85, 1997), allowed the U.S. Department of Defense (DoD), with approval of the Office of Personnel Management (OPM), to conduct a personnel demonstration project within its civilian acquisition workforce (AW). The Department of Defense Civilian Acquisition Workforce Personnel Demonstration Project (AcqDemo) was designed in 1998 and implemented in 1999 under Federal Register Notice (FRN) 64 (OPM, 1999). AcqDemo was regarded as an opportunity to reengineer civilian personnel management policies and procedures to meet the needs of the Acquisition, Technology, and Logistics (AT&L) workforce and to facilitate the fulfillment of the DoD acquisition mission. Specifically, AcqDemo aims to present an alternative to the General Schedule (GS) system: an inherently flexible human resource management pay and personnel system that retains, recognizes, and rewards employees for their contributions and supports their personal and professional development.
In 2007, more than 71 percent of AcqDemo's participants were converted into the National Security Personnel System (NSPS), an alternative personnel management system that embodied many of the elements of existing personnel demonstration projects, including AcqDemo. Accordingly, AcqDemo's progress ceased at that time. The NDAA for FY 2010 directed the termination of NSPS and the transition of employees to the personnel system under which they were last assigned. This mandate resulted in former AcqDemo organizations returning to AcqDemo upon their exiting NSPS. Extension of the AcqDemo authority from FY 2012 to FY 2017 was approved in Section 872 of the NDAA for FY 201 1 . This legislation also instructed the Secretary of Defense to designate an independent organization to conduct two assessments of AcqDemo. The mandated criteria for those assessments are provided in Table 1 . 1 .
In 2012, RAND conducted the first of these two assessments (Werber et al., 2012). RAND found that AcqDemo was faring well in terms of many of the specified criteria. For example, the AcqDemo Program Office had embarked on an extensive training program, and both interview and survey data suggested that many aspects of AcqDemo were positively perceived. However, the perceived complexity of AcqDemo's personnel evaluation system was a concern, although these concerns were partially mitigated because the AcqDemo workforce was generally well educated. In addition, barriers affecting the ability of employees to be rewarded for their contributions, such as constrained budgets and broadband ceilings, posed challenges. On balance, RAND was sanguine about AcqDemo, citing both the challenges associated with quintupling the project's size in 201 1 and the need for more and better evidence.
2 2016 Assessment of the Civi lian Acquisition Workforce Personnel Demonstration Project
Table 1 .1 Legislatively Prescribed Assessment Criteria for FY 2012 and FY 2016 Assessments
Criteria
A. A description of the workforce included in the project
B. An explanation of the flexibilities used in the project to appoint individuals to the acquisition workforce, and whether those appointments are based on competitive procedures and recognize veterans' preferences
c. An explanation of the flexibilities used in the project to develop a performance appraisal system that rec-ognizes excellence in performance and offers opportunities for improvement
D. The steps taken to ensure that such a system is fair and transparent for all employees in the project
E. How the project allows the organization to better meet mission needs
F. An analysis of how the flexibilities in points B and C are used and what barriers have been encountered that inhibit their use
G. Whether there is a process for a. ensuring ongoing performance feedback and dialogue among supervisors, managers, and employees throughout the performance appraisal period b. setting timetables for performance appraisals
H. The project's impact on career progression
I . The project's appropriateness or inappropriateness in light of the complexities of the workforce affected
J. The project's sufficiency in terms of providing protections for diversity in promotion and retention of personnel
K. The adequacy of the training, policy guidelines, and other preparations afforded in connection with using the project
L. Whether there is a process for ensuring employee involvement in the development and improvement of the project
SOURCE: 1 0 U.S.C. 1762, amended 2015.
In Section 846 of the NOAA for FY 2016, Congress extended the authority for AcqDemo to December 31, 2020. Soon thereafter, the AcqDemo Program Office announced extensive growth plans for AcqDemo. As shown in Table 1.2, its population is expected to grow from about 20,000 employees in early 2016 to approximately 50,000 by the end of FY 2018. Twentyone new organizations are slated to join AcqDemo, primarily from the Air Force. Several modifications to the project were also pending at the time. of this report's publication, including a reduction to the number of appraisal factors, supervisory and team leader cash differentials, additional scoring options (105 and 1 10) for the most-senior individuals in AcqDemo, and an improved reduction-in-force crediting process.
It is within this context that the AcqDemo Program Office has embarked on the second NOAA-mandated program assessment, required to be completed by September 30, 2016, and forwarded to Congress. The second assessment includes not only the 1 2 criteria enumerated in the FY 201 1 NOAA but also five new criteria, listed in Table 1 .3, which focus primarily on comparisons between AcqDemo and the GS system. The AcqDemo Program Office, in consultation with OPM, developed these criteria.

Introduction 3
Table 1.2 AcqDemo Expansion Plans
FY 2017 FY 2018 Q2 FY 2016 FY 2016 Planned Prospective Prospective
Component Participants Additions Additions Additions Revised Totals
Army 7,839 660 0 0 8,499
Air Force 3,165 13,048 500 10,754 27,467
DoD agencies 2,861 0 2,1 50 0 5,01 1
Marine Corps 1 ,858 0 0 0 1 ,858
Navy 4,524 0 742 3,161 8,427
Totals 20,247 13,708 3,392 13,915 51 ,262
SOURCE: AcqDemo Program Office.
Table 1.3 New Criteria for FY 2016 Assessments
Criteria
1 . Salary cost growth comparison with General Schedule (GS) equivalent population (both acquisition workforce and non-acquisition workforce, as applicable)-the implementing FRN requires cost discipline, not cost neutrality a. overall program cost comparison b. starting salaries for new hires
2. AcqOemo versus GS retention and turnover rates a. by appraisal zone b. by broadband and career path
3. A comparison of results for bargaining unit employees participating in AcqDemo versus those not participating in AcqOemo
4. Career progression comparison with GS, by Broadband and Career Path a. Contribution-Based Compensation and Appraisal System (CCAS) increases versus within-grade increase {WIGI) rates
5. A follow-up assessment of AcqDemo's impact on retention and compensation of unionized employees
SOURCE: AcqDemo Program Office, June 1, 201 5.
Assessment Approach
We had nine months to conduct this assessment. Work commenced in October 2015 and the draft report was completed in July 2016. Given the large number of assessment criteria (17) and their interrelatedness, the assessment team used the following four overarching policy questions to guide its work:
1 . What is AcqDemo? (NOAA criteria B , C, E, and G) 2. Whom does AcqOemo include? (NOAA criteria A and I) 3. What protections are in place to support AcqOemo? (NOAA criteria D, K, and L) 4. How has AcqOemo performed so far? (NOAA criteria E, F, H, J, and K; and the five
new 2016 criteria)

4 2016 Assessment of the Civilian Acquisition Workforce Personnel Demonstration Project
Since large-scale data collection efforts {e.g., an AcqDemo-wide survey, employee interviews} were beyond the scope of this assessment, we sought to obtain all data available as of spring 2016, both subjective and objective, to inform our analysis. Ultimately, we used the following five types of data sources in our assessment:
• program documents • archival data • interviews with AcqDemo subject-matter experts (SMEs) • 2012 and 2016 AcqDemo surveys conducted by CSRA Inc; • administrative data.
These are described in greater detail in the following sections. Some information was available through publicly available sources, such as FRNs and
the AcqDemo website; others, such as the Defense Manpower Data Center (DMDC) civilian personnel data files, were already available at RAND and required data use agreements; and a third set of sources were acquired in close coordination with the AcqDemo Program Office.
Program Documents
The first data source we employed in our assessment was AcqDemo program documents, including FRN 64 (OPM, 1999, p. 1426), the AcqDemo Operating Procedures in use at the time of our assessment (AcqDemo Program Office, 2003), AcqDemo Organization Participation Requirements (AcqDemo, undated}, pay cycle reports, and training materials. The training materials consisted of introductory briefings for different groups of personnel {e.g., human resources [HR] professionals, employees, and supervisors} and the AcqDemo readiness checklist. Our team reviewed all these materials and determined which documents informed each assessment criterion and how. They also informed the development of interview protocols, and in the case of FRN 64 and the Organization Participation Requirements, the documentation also informed our statistical analysis of administrative data files.
Archival Data
Archival data included site histories, Executive Council minutes, training session feedback summaries, and grievance data. Site histories were prepared using a standard template by location-specific site historians at the request of the AcqDemo Program Office and were intended to catalog developments that could have influenced how AcqDemo was implemented in a specific organization. We received 89 site histories from the AcqDemo Program Office from the 2012-2015 time frame. The Executive Council was established to oversee AcqDemo's implementation and operations, and its members included representatives from the AcqDemo Program Office, the military services, and DoD agencies with organizations in AcqDemo. We received 30 sets of Executive Council meeting minutes covering the 2012-2016 time frame. In addition, we received summaries of the initial training conducted by the AcqDemo Program Office for organizations just entering AcqDemo. Specifically, the AcqDemo Program Office provided 77 training summaries from the 2015 and 2016 training classes. The summaries indicated students' level of satisfaction with training and provided suggestions for new courses. Finally, we received summaries of CCAS grievances for FYs 2013 and 2014, Equal Employment Opportunity (EEO) grievances, and Unfair Labor Practice reports. The analytical approach used for these data sources varied. For example, the training summary scores were

Introduction 5
tallied across training classes, and the site visit histories and Executive Council minutes were coded. Analysis of these and other qualitative data sources is detailed in Appendix B.
Interviews
We conducted 22 semi-structured interviews with three types of AcqDemo SMEs, broken down as follows:
• seven interviews with enterprise-level AcqDemo representatives, including the AcqDemo program manager and component representatives from the Army, Air Force, Marine Corps, Navy, Missile Defense Agency (MDA), and Office of the Under Secretary of Defense (OUSD) for AT&L
• six interviews with enterprise-level personnel tasked with AcqDemo-related training, including the training leads from the AcqDemo program office and representatives from the Army, Marine Corps, Navy, and OUSD for AT&L
• nine interviews with pay pool managers: four from the· Army, two from the Air Force, one from the Navy, one from the Marine Corps, and one from MDA; the interviewees represented pay pools in existence for at least one appraisal cycle.
In the first two cases, the SMEs appear to represent a large proportion of the population (seven out of eight and five out of eight, respectively). In the third case, because of DoD licensing requirements, we were limited to nine interviews, and our sample represents approximately 10 percent of all pay pool managers: There were 84 pay pools in 2014, and nine pay pools were added in FY 2015. Obtaining the necessary approvals for a larger set of interviews was beyond the scope of this project because of the long review timeline, which typically exceeds six months. However, the seniority and experience level of this group of interviewees, along with academic research about interview sampling requirements, suggest that nine interviews were sufficient to identify salient themes in this context.
Enterprise-level AcqDemo representatives and training professionals were identified by the AcqDemo Program Office in response to our sampling guidelines, 1 and the military components and DoD agencies nominated pay pool managers in accordance with our sampling parameters. For pay pool managers, we opted to use purposive sampling, rather than selecting interviewees randomly. This enabled us to focus on pay pools that had gone through at least one appraisal cycle and individuals who had served as pay pool managers for at least one cycle. We also sought-and achieved-variance in the size of the pay pools represented in the interviews. The protocols used for these semi-structured interviews are provided in Appendix B. Note that in keeping with the semi-structured interview approach, these protocols represent an interview starting point. Interviewers had discretion to delve into potentially fruitful lines of inquiry as they emerged and to limit time spent on questions already answered in earlier responses or those less relevant, given the nature of the dialogue. Interview topics were based on the assessment criteria: The questions covered AcqDemo's suitability for different types of personnel, its training and guidance (including flexibilities and barriers to their use), efforts to ensure fairness and transparency, protections for diversity, provisions for employee involvement, its impact on promotion and retention, its impact on organizations' missions, perceptions about its overall
1 For example, we asked to speak with "component personnel responsible for AcqDcmo initial and/or refresher training."

6 2016 Assessment of the Civilian Acquisition Workforce Personnel Demonstration Project
performance, and suggestions for improvement. The questions were informed by our review of AcqDemo program documentation and our analysis of AcqDemo archival data.
Interview data were captured in detailed notes, and the notes were incorporated into our analysis of different criteria. The semi-structured nature of the interview approach means that different questions were posed to different interviewees, and some remarks were elicited, while others were shared spontaneously. This type of variance, and, in the case of pay pool managers, the use of nonrandom sampling, suggests that it would not be appropriate to count these data for the purpose of generating estimates of population parameters. Instead, we used qualitative data analysis to demonstrate the range of views within AcqDemo, to convey the language used by AcqDemo's members, and to identify salient themes. A more-extensive description of our analysis of these and other qualitative data is provided in Appendix B.
2012 and 2016 AcqDemo Surveys
Although we did not have time to develop, field, and analyze an independent survey of the AcqDemo workforce, we had full access to survey data collected in 2012 and 2016 by CSRA Inc., a contractor employed by the AcqDemo Program Office.2 Under the auspices of the AcqOemo Program Office and in consultation with the Executive Council, CSRA Inc. surveyed the entire AcqOemo workforce, as well as a set of organizations outside of AcqDemo that were intended to serve as a comparison group. The survey instruments included general questions about demographics, group dynamics, and career development that were presented to both groups, as well as a series of AcqDemo-specific questions included only in the survey fielded to the AcqDemo workforce. Most of the questions were in a multiple-choice format, and many made use of Likert scales with a neutral midpoint. However, the survey also included a small number of open-ended questions for write-in responses.
In 2012, 5,21 1 AcqDemo employees and 700 employees from comparison-group organizations submitted a survey, corresponding to overall response rates of 34 percent and 16 percent, respectively. In 2016, 5,264 AcqDemo employees submitted a survey, an overall response rate of28 percent. A comparison group survey was fielded in 2016, but only 52 responses were collected. CSRA Inc. provided us with the survey instruments and data for each survey. We received the full data files, including write-in text responses to open-ended questions.
Upon receipt of the survey data files, we first assessed how representative the survey was of the AcqDemo workforce. In many ways, we found that the survey sample was quite a close match to the AcqDemo population. However, older personnel, supervisors, and those with graduate degrees were highly overrepresented in the survey, while nonsupervisors, those with bachelor's degrees, and those with high school education or less were underrepresented. To account for these differences between the survey respondents .and the AcqDemo population at large, we applied weights to the survey responses that essentially leveled out the skewed responses in terms of education, organization, supervisory status, and gender. After this weighting procedure was completed, we used the weighted responses to conduct statistical analyses of the full samples from both 2012 and 2016, as well as statistical analyses of subgroups, including those based on gender, race or ethnicity, bargaining unit membership, and supervisory status. For both types of analysis, we focused on the subset of survey items that we deemed
2 There was also an AcqDcmo survey fielded in 2014. However, as we discuss in Appendix A, there were problems with the administration of the survey that caused us to exclude it from our assessment.

I ntroduction 7
relevant to the assessment criteria. For a more-detailed discussion of how we conducted these analytical steps, refer to Appendix A.
We also analyzed 4,728 write-in responses from the 2016 AcqDemo survey. We coded two open-ended questions that both employees and supervisors could answer: one pertaining to perceived problems with the administration of AcqDemo and one asking for observations related to all of the multiple-choice questions they had completed up to that point. Supervisors were also provided with three additional write-in opportunities after three shorter sets of multiple-choice questions about AcqDemo's features and impact. Overall, more than 50 percent of all survey respondents (2,546) answered at least one of the five write-in questions. The highest response rate, 45 percent, was for the question about problems with AcqDemo's administration. Response rates for the other questions were lower, ranging from 18 percent to 27 percent.
We found that survey respondents who opted to provide write-in comments differed significantly from nonrespondents in terms of both demographic attributes (e.g., race or ethnicity) and situational characteristics (e.g., organizational membership, career path). There is no method to adjust for those differences. In particular, we could not weight the data as we did for the quantitative survey responses. Moreover, given the numerous and diverse ways in which respondents and nonrespondents differed, we could not accurately assess the nature and extent of their bias beyond the general bias toward negativity present in write-in comments on employee surveys (Andrews, 2005; Pancheri et al., 2008). In addition, the write-in questions were broad, rather than narrowly focused on a specific issue; in one case, respondents were instructed to write any comments related to the preceding 56 questions. For these reasons, we again used qualitative data analysis not to generate population parameter estimates but rather to demonstrate the range of views within AcqDemo, to convey the language used by AcqDemo's members, and to identify salient themes. A more-extensive discussion of our analysis of these data is provided in Appendix B.
Administrative Data
The administrative data employed in this study were collected from two sources. DMDC provided data on the DoD civilian workforce at large. These data covered both AcqDemo participants and GS employees and captured an array of characteristics for each employee, including demographic information, component, occupation, annual compensation, promotions, and separations. The AcqDemo Program Office provided more-detailed data on the performance ratings and compensation actions of AcqDemo participants.
We drew from three DMDC data files-the civilian personnel inventory file, the civilian personnel transaction file, and the Defense Acquisition Workforce Improvement Act (DAWIA) personnel file-to construct a longitudinal data set of DoD civilian personnel. The constructed data set covered the period beginning October l, 2010, and ending September 30, 2015, and included every civilian employee in DoD. We pared down the data set by excluding any employee who was not full time, any individual who was not a permanent employee, and any employee whose annualized basic pay fell below $15,080. The third exclusion criterion requires that the reported annualized basic pay for permanent, full-time employees comply with federal minimum wage laws. The three exclusion criteria collectively resulted in the loss of fewer than 2 percent of AcqDemo employees and fewer than 5 percent of GS employees from the data set.
We supplemented the constructed data set with individual-level data provided by the AcqDemo Program Office. These data covered AcqDemo participants only; analogous data

8 2016 Assessment of the Civilian Acquisition Workforce Personnel Demonstration Project
were not available for GS employees. The data files consisted of annual snapshots taken on September 30 of each year, beginning in 201 1 and ending in 2015. Individual identifiers were included in these snapshots, and, as a result, we were able to both track each AcqDemo participant over time within the data files provided by the Program Office and merge these data with the data set constructed from the DMDC data files.
The administrative data were used primarily to explore the following four questions:
• What is the composition of the AcqDemo workforce? • What is the effect of AcqDemo on retention? • What is the effect of AcqDemo on compensation and salary growth? • What is the effect of AcqDemo on promotion?
The principal challenge of the career outcomes analyses was determining the extent to which observed differences between the AcqDemo and GS populations could be attributed to AcqDemo itsel£ To this end, we constructed a comparison group of GS employees who were as similar as possible to the AcqDemo workforce along an array of preexisting or immutable characteristics. The first step in constructing the comparison group was to restrict the population of GS employees to those who were in DoD organizations that were eligible for, but not participating in, AcqDemo. The second step was to apply weights to the comparison group so that it more closely resembled the AcqDemo workforce with respect to age, gender, race or ethnicity, education level, component, occupation, career level, AW membership, bargaining unit membership, and a number of other characteristics. Regression analysis was applied to a data set consisting of the AcqDemo population and the weighted GS comparison group to estimate AcqDemo's effect on each career outcome. For more information on the content of the administrative data sets and the analytical methods applied to the data, see Appendix C.
Taken together, these varied data sources, qualitative and quantitative, objective and subjective, provided the foundation for our analysis. Table 1 .4 identifies the sources used to address the assessment criteria (in italics), which we grouped using the four guiding questions.
Assessment Limitations
Although the multiple data sources available to us together provided a solid foundation for our assessment, there were important data and analysis shortcomings that should be noted. First, organizations in AcqDemo did not consistently collect data that would indicate how AcqDemo's .flexibilities have been used since the last assessment. For example, data related to the use of hiring and appointment .flexibilities, such as the number of Position Requirements Documents (PRDs} and offer-accept ratios, were not available, nor were data about performance feedback completion rates, such as the percentage of supervisors completing midcycle reviews. Instead, we relied primarily on perceptions expressed in the interviews and AcqDemo survey about the application of these flexibilities. Some archival data sources were also limited: Many organizations did not routinely submit site histories, as requested, for instance, and grievance data were only available for 2013 and 2014. In addition, the number of interviews we were able to conduct was constrained because we did not have time to complete the governmen-

Introduction 9
Table 1 .4 Data Sources by Guiding Questions and Assessment Criteria
Program AcqDemo Administrative Documents Archival Data Interviews Survey Data
What is AcqDemo? ./ ./ NOAA Criteria B, C, E, and G
Whom does AcqDemo include? ./ ./ ./ ./ NOAA Criteria A and I
What protections are in place to ./ ./ ./ support AcqDemo?
NOAA Criteria 0, K, and L
How has AcqDemo performed so ./ ./ far?
NOAA Criteria E, F, H, J, and K; and the five new 2016 criteria
tal approval processes required to collect information for more than nine of the same type of person.3
There were also limitations related to the AcqDemo survey. Only about one-fourth of AcqDemo employees completed the 2016 AcqDemo survey, representing a response rate decrease of about 20 percent. Our statistical weighting technique corrected for the most prominent forms of response bias, but some bias still may have been present. In addition, we lacked a true referent group against which to compare AcqDemo employee responses. The response rate for the 2016 control group survey was insufficient for any type of analysis. In addition, at the outset of our study, we were advised that the results of the 2015 Federal Employee Viewpoint Survey (FEVS) would be available as a basis for .comparison. Administered by OPM, the FEVS is an extensive survey of the fed�ral civilian workforce intended to gauge employee perceptions of the extent to which their organizations engage in exemplary human capital strategy practices. The FEVS includes items similar to those included in the AcqDemo survey, as well as the ability to isolate survey respondents in AcqDemo. However, FEVS data were not available at the level of detail necessary to create an appropriate control group-that is, a comparison group that accounts for characteristics, such as supervisory status, gender, age, and other individual attributes that could influence responses beyond any sort of '�cqDemo effect." Accordingly, we abandoned our initial plans for a control group and instead relied on comparing AcqDemo survey responses from 2012, the time of the first mandated assessment, with those from 2016. Finally, the write-in survey responses could not be adjusted for response bias. Academic studies have shown that there is a general tendency toward negativity in openended responses to employee surveys (Andrews, 2005; Borg and Zuell, 2012; Poncheri et al., 2008). Unfortunately, we could not correct for this issue. In addition, we could not estimate or correct for the differences between survey respondents who opted to write in comments and those who did not. Nevertheless, we elected to retain and analyze the responses of 2,546
3 DoD regulations require intcragcncy data collection efforts that involve more than nine of the same type of people to be approved and licensed with an information control symbol at the Office of the Secretary of Defense (OSD) component level. Past RAND experience suggests that these processes take at least three to six months, which we could not accommodate within our assessment time frame.
10 2016 Assessment of the Civilian Acquisition Workforce Personnel Demonstration Project
personnel, while being mindful of these biases. We believe that our qualitative data analysis approach, which focused on identifying salient themes and conveying the range of responses for them, is especially appropriate in light of these limitations.
The administrative data came with their own set of shortcomings. First, a small fraction (fewer than 0.05 percent) of permanent, full-time GS employees showed annualized basic pay ofless than $15,080, the salary equivalent of working a full year at federal minimum wage. We attributed this phenomenon to a data reporting error and dropped these individuals from our data set. Second, the administrative data covered a period of only four to five years; a longer period would have offered greater insight into retention and promotion outcomes. Third, our ability to control for differences between the AcqDemo and GS populations was limited by the characteristics captured in the DMDC data files. Any differences between the two groups that influenced career outcomes but were not captured by the 20 observable characteristics used in our analysis may have resulted in biased estimates. The standard approach to correcting for the potential omitted variable bias is to employ a difference-in-difference analysis (Card and Krueger, 1994). However, the validity of the difference-in-difference approach rests on the parallel trends assumption: Career outcomes in the AcqDemo and GS comparison groups would have followed the same time trend had the AcqDemo group remained in the GS system. Unfortunately, we were not able to verify this assumption because the majority (more than 80 percent) of AcqDemo participants transferred into the project from NSPS, a personnel management system that differed meaningfully from the GS system. Instead, we adopted a morestraightforward approach to estimating AcqDemo's effect on the various career outcomes with the understanding that the estimates may be biased if the set of characteristics drawn from the DMDC data files do not adequately capture differences between the AcqDemo and GS populations. Fourth, the administrative data did not permit us to identify GS employees whose entry into AcqDemo was delayed so that they could ascend to the tops of their career ladders. This deficiency in the data might have introduced selection bias in the promotion analysis, causing us to underestimate promotion rates in AcqDemo and overestimate rates in the GS comparison group. Finally, the performance ratings contained in the DMDC data files were too coarse and unreliable to be useful. Roughly half of permanent, full-time GS employees were rated on the full five-point scale; the majority of the remaining employees were rated on a one-or-three (pass/fail) scale. Among those who were rated on a five-point scale, virtually none (less than 0.50 percent) received the two lowest ratings, meaning that the five-point scale was effectively reduced to a three-point scale. Moreover, the five-point performance ratings appear to have experienced inflation over time, both within AcqDemo and within the GS system. Given the array of problems associated with the ratings, we elected to disregard them entirely. Instead, we leveraged the performance data contained in the files provided by the AcqDemo Program Office. Because these data were limited to AcqDemo participants, we were not able to make ratings-related comparisons with the GS population.
Organization of This Report
The bulk of the report is aligned with our assessment's guiding questions. Chapter One provides background information and an overview of our assessment approach. Chapter Two answers the question "What is AcqDemo?" with a description of its flexibilities and performance appraisal system. Chapter Three provides insights related to the question "Whom

Introduction 1 1
does AcqDemo include?" discussing first the characteristics of the AcqDemo workforce and then how appropriate the demonstration project appears to be for its members. Chapter Four covers the protections in place for AcqDemo, such as the project's guidance, processes intended to promote fairness and transparency, and procedures for soliciting employee input to further develop and improve the project. Chapters Five through Seven focus on how AcqDemo has performed thus far. Chapter Five reports on the application of AcqDemo's flexibilities and AcqDemo's effect on various career outcomes, including compensation, promotion, and retention. Chapter Six examines how well AcqDemo has provided protections for diversity. Chapter Seven discusses barriers to the application of AcqDemo's flexibilities, assesses how the project supports the acquisition mission, and evaluates AcqDemo in relation to Lawler's (1971) effectiveness criteria. In Chapter Eight, we summarize this assessment and offer a few considerations for future assessments. Readers seeking results by assessment criteria should refer to Table 1 .5 for a summary of how the criteria are addressed across chapters.
The report also includes three methodological appendixes. Appendix A describes the methods used to analyze the quantitative data collected by the 2012 and 2016 AcqDemo surveys and provides weighted response frequencies for survey items cited in the main report. Appendix B explains our analysis of the qualitative data collected from the archival data, the SME interviews, and the write-in responses to the AcqDemo surveys and includes the SME
Table 1.5 Report Organization by Assessment Criteria
Legislatively Mandated Assessment Criteria
A. A description of the workforce included in the project
B. An explanation of the flexibilities used in the project to appoint individuals to the acquisition workforce, and whether those appointments are based on competitive procedures and recognize veterans' preferences
C. An explanation of the flexibilities used in the project to develop a performance appraisal system that recognizes excellence in performance and offers opportunities for improvement
D. The steps taken to ensure that such a system is fair and transparent for all employees in the project
E. How the project allows the organization to better meet mission needs
F. An analysis of how the flexibilities in points B and C are used and what barriers have been encountered that inhibit their use
Two
./
Chapter
Three Four Five Six Seven
./

12 2016 Assessment of the Civilian Acquisition Workforce Personnel Demonstration Project
Table 1 .5-Continued
Two
G. Whether there is a process ./ for
a. ensuring ongoing performance feedback and dialogue among supervisors, managers, and employees throughout the performance appraisal period b. setting timetables for performance appraisals
H. The project's impact on career progression
I . The project's appropriateness or inappropriateness in light of the complexities of the workforce affected
J. The project's sufficiency in terms of providing protections for diversity in promotion and retention of personnel
K. The adequacy of the training, policy guidelines, and other preparations afforded in connection with using the project
L. Whether there is a process for ensuring employee involvement in the development and improvement of the project
Three
Additional Criteria Specified by the AcqDemo Program Office
1 . Salary cost growth comparison with GS equivalent population (both acquisition workforce and non-acquisition workforce, as applicable)-the implementing FRN requires cost discipline, not cost neutrality
a. overal l program cost comparison b. starting salaries for new hires
2. AcqDemo versus GS retention and turnover rates
a. by"appraisal zone b. by broadband and career path
3. A comparison of results for bargaining unit employees participating in AcqDemo versus those not participating in AcqDemo
4. Career progression comparison with GS, by Broadband and Career Path
a. CCAS increases versus WIG I rates
5. A follow-up assessment of AcqDemo's impact on retention and compensation of unionized employees
Chapter
Four Five
./
./
Six Seven

Introduction 13
interview protocols. Appendix C covers the methods used to analyze the administrative data and provides samples of the statistical results generated by the analyses.

CHAPTER lWO
What Is AcqDemo7
In this chapter, we use AcqDemo program materials and interview data to build on the description of AcqDemo provided in Chapter One. We address the following four assessment criteria:
• NDAA criterion B: an explanation of the flexibilities used in the project to appoint individuals to the AW and whether those appointments are based on competitive procedures and recognize veterans' preferences
• NDAA criterion C: an explanation of the flexibilities used in the project to develop a performance appraisal system that recognizes excellence in performance and offers opportunities for improvement
• 1 NDAA criterion E: how the project helps organizations better meet mission needs • NDAA criterion G: whether there is a process for (a) ensuring ongoing performance feed
back and dialogue among supervisors, managers, and employees throughout the performance appraisal period and (b) setting timetables for performance appraisals.
In the following sections, we discuss AcqDemo's appointment-related flexibilities and performance appraisal system, including feedback mechanisms and timetables, and examine how these and other aspects of AcqDemo are intended to help organizations achieve their missions. 1
Appointment Flexibilities
AcqDemo includes appointment flexibilities designed to make DoD organizations more agile and improve their ability to compete for talent, especially from the private sector. The AcqDemo Program Office practices a decentralized approach to policies related to hiring new employees, which means that there is no overarching AcqDemo system in place for competitive procedures and the recognition of veterans' preferences. AcqDemo organizations have the
1 This chapter draws on information found in AcqDemo training materials, most notably "Conversion to DoD Civilian Acquisition Workforce Personnel Demonstration Project (AcqDemo): 2016 Employee Orientation Briefing" (AcqDemo Program Office, 2016); "An Employee's Guide co CCAS: Understanding the Contribution-Based Compensation and Appraisal System of the AcqDemo" (AcqDemo, 201 1); and "HR Elements for Human Resources Professionals 2014"
(AcqDemo, 2014). In addition, the following also served as references: Delegated Examining Operations Handbook: A Guide for Federal Agency Examining Offices (OPM, 2007); "Improving the Federal Recruitment and Hiring Process" (The White House, 2010); AcqDnno 2014 Cycle Evaluation Summary Report (Simmons et al., 2015); DoD Civilian Acquisition Personnel Workforce Dnnonstration Project Operating Procedures (AcqDemo Program Office, 2003); and Draft Republication Federal Register Notice 0401 16, provided by the AcqDemo Program Office to RAND in April 2016.
1 5

16 2016 Assessment of the Civilian Acquisition Workforce Personnel Demonstration Project
ability to follow various hiring processes at their discretion, but similar to GS system-based organizations, all must be OPM-approved methods. Specifically, AcqDemo organizations are free to develop their own ranking and rating processes so long as they are in accordance with the May 2007 Delegated Examining Operations Handbook: A Guide for Federal Agency Examining Office (OPM, 2007) and the May 2010 presidential memorandum "Improving the Federal Recruitment and Hiring Process" (The White House, 2010). The AcqDemo Program Office does not systemically track individual organizations' applications of these federal policies.
AcqDemo also largely resembles the GS system in providing five appointment options. Permanent appointments are career and career-conditional appointments. Temporary limited positions are one-year positions, and modified terms allow for five-year positions based on locally approved extensions. All new hires undergo a one-year probationary period, during which employees must demonstrate adequate contribution. Employers can extend this probationary period for employees in the business management and technical management professional (NH) career path beyond a year (equal to the length of any educational or training assignment that places the employees outside normal supervisor review) to allow the supervisor time to sufficiently and objectively evaluate an employee's contribution. Finally, there are excepted service positions, which vary by organization but can include student interns and recent college graduates.
The main appointment flexibility that distinguishes AcqDemo from the GS system is its use of broadbands. All employees covered by AcqDemo are grouped together based on their occupations and then classified into one of three career paths: NH, technical management support (NJ), and administrative support (NK). As shown in Figure 2.1 , the NH and NJ career paths have four pay bands, and the NK career path has three pay bands. These bands are tied to GS grades and salaries and provide employees with the opportunity to earn a salary any-
Figure 2.1 Career Paths and Broadband Structure
Business management and technical management professional (NH)
(GS 1-4)
Technical management support (NJ)
II
(GS 1 -4) (GS 5-8)
Administrative support (NK)
I I
(GS 1-4) (GS 5-7)
SOURCE: AcqDemo Program Office, 201 6. RAND RR1783·2.1
II
(GS 5-1 1)
I l l
(GS 9-1 1 )
Ill
(GS 8-10)
Ill IV
(GS 1 2-1 3) (GS 14-1 5)
IV
(GS 1 2-1 3)

What Is AcqDemo? 17
where within the band in which they fall. When personnel enter AcqDemo, their supervisors have pay-setting flexibility, meaning that they have the ability to set the new employee's initial compensation at different points within the broadband. In addition, the broadband structure offers high-contributing employees the potential for faster growth in compensation relative to the GS step model. As is the case for GS employees who have reached step 10, AcqDemo employees at the top of their pay bands need a promotion to an open position in the next pay band to achieve additional salary increases. While these pay band-constrained employees do not qualify for permanent salary increases, they do remain eligible for contribution and carryover awards. Contribution awards (CAs) are one-time bonuses that are designed to reward employees for their contributions to the organization's mission. Carryover awards are also onetime payments, but these are designed to compensate employees who are subject to pay caps by providing them with the salary increase to which they are otherwise entitled in that one year.
For employees brought into AcqDemo from other government pay plans, first-level supervisors are respo�sible for determining position requirements, developing a PRO, and providing classification recommendations. PRDs consolidate an array of position information into one document. This information includes the position's title, career path, and broadband level; its purpose and the duties it carries; skills and credentials required for the position; and the factors, descriptors, and discriminators that together convey the primary work involved in the position, as well as its complexity, scope, value, and contribution level. To motivate development, PRDs are written to describe the top of each broadband. The career paths and PRDs are used to classify positions within the various broadbands. Employees who are not satisfied with their classification can file a formal classification appeal. Employees who are involuntarily placed, for reasons other than performance or conduct, in a broadband with a salary range that falls below their previous salary are placed on retained pay status. 2 These employees continue to receive their pre-AcqDemo salary but are temporarily ineligible for additional contributionbased salary increases.
The broadbands provide significant flexibility in allowing management to reassign employees to new positions within the AcqDemo project. In many cases, employees can be reassigned within the same broadband level without changes in pay or job description. However, changes to employee broadband or career path typically require employees to apply for a competitive position. Salary movement within a broadband is determined solely by the contribution of the employee.
Performance Appraisal System
CCAS is designed to provide an equitable and flexible method for evaluating and compensating the workforce. By linking compensation to an individual's contribution to the mission (a different measure than performance), CCAS provides incentives for employees to improve their contributions and encourages supervisors to work closely with employees to develop a dear line of accountability for the work being performed and its contribution to the organiza-
2 In general, a DoD civilian employee may be put on retained pay status if his or her grade or pay would otherwise be reduced as a result of an involuntary personnel action or other personnel action determined to be in the best interest of the government, such as a reduction in force or a position reclassification. For more information, see DoD Instruction 1400.25,
Vol. 536, 2006.

18 2016 Assessment of the Civilian Acquisition Workforce Personnel Demonstration Project
tion's mission. This is fundamentally different from the GS system, which does not explicitly tie compensation to either performance or contribution. By rewarding high contributors and withholding remuneration from low contributors, CCAS is intended to attract and retain a highly qualified workforce with employees who are motivated to maximize productivity in contribution to the mission.
CCAS is an annual process with six distinct phases: contribution planning, midpoint review, employee self-assessment, supervisor annual appraisal, pay pool panel process, and communication of CCAS results. The process is both facilitated and documented by the Contribution-Based Compensation and App�isal System Software for the Internet, better known as CAS2Net.
The annual appraisal cycle begins on October 1 and ends on September 30. The cycle starts with contribution planning, during which employees meet with their supervisors to discuss how the employee will contribute to the organization's mission over the course of the next year. This meeting, in which supervisors must clearly communicate expectations to employees regarding the contributions for the year, is required to occur within 45 days of the start of the appraisal period (or within 45 days of hiring for new employees or supervisors). The process is designed to ensure that employees are clear on what they will be rated against and to offer employees the opportunity to note where accommodations may be necessary. AcqDemo employees' contributions are documented and rated based on six factors:
• problem-solving • teamwork and cooperation • customer relations • leadership and supervision • communication • resource management.
At the time of our assessment, a draft FRN was being circulated for comment that included plans to reduce the six factors to three: job achievement or innovation, communication or teamwork, and mission support. Descriptors and discriminators specific to the three career paths and broadband levels serve as the rubric by which ratings are determined for each factor.
Informal communication throughout the year provides an opportunity for supervisors to provide employees with feedback on strengths and weaknesses and to discuss professional development. In addition, employees participate in a formal, documented midpoint review with their supervisor halfway through the CCAS cycle. This review includes a self-assessment by the employee and a narrative written by the supervisor, and the results are documented within CAS2Net.
As the CCAS cycle comes to a close, employees complete a self-assessment in which they assess their contributions to the mission using the six factors as the organizing framework. Supervisors use this input and their own observations to generate their annual appraisal, which includes their preliminary factor scores. This is typically completed by mid-October.
Next, the pay pool process is initiated. A pay pool is a group of employees who are reviewed together as part of CCAS. These employees typically work in the same part of an organization and represent a variety of functional areas. Organizations with bargaining units can opt to construct pay pools in which all the members are part of the bargaining unit. AcqDemo guidance suggests a pay pool size of 35 to 300. Larger pay pools are often broken

What Is AcqDemo? 19
into sub-pay pools as the process unfolds. As part of the pay pool process, a senior leader and supporting staff facilitate a meeting of a peer group of supervisors, referred to as the pay pool panel, from across the organization. The pay pool panel reviews the complete set of annual employee appraisals for all members of the pay pool to ensure equity and consistency. The pay pool panel has the authority to adjust factor scores so that they accurately and consistently reflect contribution to the mission.
After several reviews by the pay pool panel and a final review and approval by the pay pool manager, the six factor scores are averaged, and the resulting overall contribution score (OCS) becomes the employee's rating of record. Figure 2.2 demonstrates how the OCS is used to determine increases in base pay. The employee represented by the figure has a current annual base pay of $89,750. To determine the employee's expected OCS, AcqDemo plots the employee's current pay out to the Standard Pay Line (SPL) and back down to the horizontal axis along the blue lines. In this case, the employee's expected OCS is 80. Note that because the SPL slopes upward, employees with higher base pay are expected to achieve higher contribution scores. The employee
,s actual OCS, or rating of record, is 90, which yields a difference
between actual and expected OCS-known as 80CS-of 10. To determine the employee's target annual base pay, AcqDemo plots the employee's actual OCS up to the SPL and over to the vertical axis along the green lines. In this case, the employee's target pay is $ 109,450, which implies that the employee is undercompensated by $19,700. This amount is referred to as the employee's 8salary. The employee's actual increase in annual base pay is generally a fraction of
Figure 2.2
Relationship Between OCS and Base Pay
1 60,000 -------------------------------.
1 20,000 Target pay
1 09,450 14-------------------------�·
Current pay 89,750 1--------------------------,,,....-
� a. 80,000
; m
Standard pay line, (SPL) \
\ \
V\ u 0 "C QI t QI a. )( w
I t.OCS =10
II\ u 0 n; :l t <(
0 -----------------i---------------------------------------___. 0 1 0 20 30 40 so 60 70 80
Overall contribution score (OCS)
SOURCES: AcqDemo Program Office, 201 1 ; AcqDemo Expected Contribution Range Calculator, 201 6. RAND RR1783-Z.2
90 1 00

20 2016 Assessment of the Civilian Acquisition Workforce Personnel Demonstration Project
his or her Asalary: An algorithm within the CCAS software computes the fraction based on the funds that the pay pool has available for base pay increases. 3
Permanent increases in base pay, which are known as contribution rating increases (CRis), are not the only form of compensation over which pay pool panels exercise authority. The panels may also award general pay increases (GPis) and CAs. GPis are pay increases authorized by Congress and the President that are generally awarded to every employee; CAs are one-time bonuses that do not affect the employee's base pay. Employees subject to pay caps that make them ineligible to receive CRis may also receive carryover awards. Like CAs, these are onetime bonuses that do not affect the employee's base pay. As noted earlier, carryover awards are intended to provide employees with the dollar amount they would have received that year had they been eligible for CRis.
Although federal law permits cash awards based on the rating of record to be as large as 10 percent of salary or as large as 20 percent for exceptional performance (5 U.S.C. 4302, 2009; 5 U.S .C. 4503, 1996; 5 U.S.C. 4505[a] , 2012; 5 CPR 451 .104, 2007), OPM, the Office of Management and Budget (OMB), and DoD have issued guidance that imposes additional constraints on the funding available for cash awards (DoD Instruction 1400.25, Vol. 45, 2013; OPM, 2005). For example, in FYs 2014 and 2015, OPM and OMB instructed organizations to spend no more than 0.96 percent of total employee salaries on individual performance and individual contribution awards for all employees, including both senior-level employees, such as Senior Executive Service (SES), and non-senior-level employees (OMB and OPM, 2013; DoD, Assistant Secretary of Defense, 2014). DoD issued a similar limit on awards in FY 2014, advising agencies to spend no more than I percent of total employee salaries for awards to nonsenior employees.
Table 2. 1 summarizes the relationship between an employee's contribution and his or her eligibility for the three primary forms of compensation. The column on the far left lists three appraisal zones, each of which corresponds to a distinct area in Figure 2.2. Zone C corresponds to the area between the two black curves, or rails. Zone A corresponds to the area above the upper rail, while Zone B corresponds to the area below the lower rail. Employees are placed
Table 2.1 Eligibility for Various Compensation Types by Appraisal Zone
General Pay Contribution Rating Contribution Appraisal Zone Increase (GPI) Increase (CRI) Award (CA)
A Can be given in full, No No (above the rails) reduced, or denied
c Yes Yes Yes (between the rails) (up to 6%)
B Yes Yes Yes (below the rails) (up to 20%)
SOURCE: AcqDemo Program Office, 201 1 . ·
3 Each pay pool must set aside at least 2 percent of the sum of its employees' current annual base pays to fund permanent increases in base pay for the following calendar year.

What Is AcqDemo? 21
into zones based on the intersection of their current base pay and actual OCS, denoted by the yellow star in Figure 2.2. Employees in Zone C are considered appropriately compensated, or in the Normal Pay Range; those in Zone A are considered overcompensated; and those in Zone B are considered undercompensated. Table 2.1 indicates that employees in Zones C and B are eligible for all three forms of compensation. However, employees in Zone A are eligible only for the GPI.
Table 2. 1 also shows that the sizes ofCRis in Zones B and C are capped. More generally, AcqDemo pay rules include the following limits on basic pay and pay adjustments:
• No employee can receive a new basic pay that exceeds the maximum for his or her broadband and career path (except employees on retained pay).
• An employee in Zone B may not receive new basic pay that is more than 6 percent above the lower rail for his or her OCS.
• An employee in Zone C may not receive a new basic pay that is above the upper rail for his or her OCS.
• No CRI increase can exceed 20 percent for employees in Zone B or 6 percent for employees in Zone C; employees in Zone A are not eligible for CRis.
Note that the restriction described in the first bullet is carried over from the GS system. As shown in Figure 2.1, each AcqDemo broadband corresponds to two or more GS grades. Accordingly, the pay cap that applies to AcqDemo employees at the top of the NH-2 broadband is a byproduct of the pay cap that applies to GS-1 1 employees who are at step 10. Similarly, the pay cap that applies to AcqDemo employees at the top of the NH-3 broadband is a byproduct of the pay cap that applies to GS-13 employees who are at step 10.
When an employee's contribution falls well below expectations, a Contribution Improvement Plan (CIP) may be issued. A CIP is triggered when the employee's actual OCS places him or her in Zone A or when the employee's score in any one of the six factors falls short of the midpoint of the next-lower broadband level. Failure to improve levels of contribution under the CIP during the specified period or any subsequent failure within two years can result in reduction in pay or removal of the employee.
After the pay pool manager approves the pay panel decisions, ratings are distributed to supervisors so that they can communicate CCAS results to their employees. Supervisors initiate formal discussions with employees, in which they review the employee's assessment, the OCS approved by the pay pool manager, changes to the employee's compensation, and ways to sustain or improve the employee's contribution over the next year. The compensation changes become effective in the first full pay period of January. If an employee's contribution falls short of expectations, a CIP is developed. A CIP is a formal, written plan that describes where or how the employee is not contributing adequately and identifies in great detail the necessary improvements. CIPs also outline the potential consequences to the employee if he or she does not bring his or her contribution up to an acceptable level.
How AcqDemo Supports Organizations' Missions
The appointment flexibilities and performance appraisal system are designed to help organizations achieve their missions in two primary ways: (1) by ensuring that organizations have

22 2016 Assessment of the Civilian Acquisition Workforce Personnel Demonstration Project
a highly qualified and motivated workforce and (2) by making organizations more agile and adept in responding to evolving mission needs or changes in the environment. For example, the pay-setting flexibility can enable organizations to compete more effectively in recruiting highly skilled employees, particularly from the private sector. Providing a stronger, clearer link between compensation and contribution can improve retention among the most productive members of the workforce, while encouraging those whose contribution falls short to either improve or leave the organization. Moreover, the broadbands should make it easier than it is under the GS system to reassign or reclassify employees as necessary to support the mission.
AcqDemo also includes a number of features that are not the focus of this assessment but might help organizations better meet mission needs. For example, while DAWIA authorized opportunities for greater professional development for employees in acquisition-coded positions, AcqDemo expanded those degree and certification opportunities for employees participating in the project. AcqDemo also supports career growth and development through the use of sabbaticals. Three- to 12-month sabbaticals are available to AcqDemo employees with at least seven years of experience. Although requirements vary by organization, typically, an employee on sabbatical must use the time to develop a product, service, or report that benefits the acquisition community. Finally, AcqDemo provides a way for its retiring or separating employees to continue contributing to their organizations. The Voluntary Emeritus Program offers the opportunity for AcqDemo participants to keep working after accepting a retirement or buyout package. All of these features represent efforts to cultivate an engaged, highly skilled workforce that is well situated and motivated to support DoD's acquisition mission.
Summary
AcqDemo's appointment and performance appraisal-related flexibilities are intended to help organizations achieve their missions by ensuring that they have a highly qualified and motivated workforce and by making them more agile and adept in responding to evolving mission needs or changes in the environment. AcqDemo and the GS system are similar in that initial appointments are made in accordance with federal requirements and OPM guidance. What distinguishes AcqDemo is its use of broadbands. When personnel enter AcqDemo, they are assigned to one of three career paths based on their occupations: NH, NJ, or NK. The NH and NJ career paths each have four pay bands, while the NK career path has three pay bands. Because each pay band corresponds to two or more GS grades, the pay bands are referred to as broadbands. Supervisors have pay-setting flexibility, meaning that they have the agency to set new employees' initial compensation at different points within the broadband. Employees can typically be reassigned within the same broadband without changes in pay or job description. However, changes to an employee's broadband or career path require that the employee apply for a competitive position.
AcqDemo's performance appraisal system, CCAS, is designed to provide an equitable and flexible method for evaluating and compensating the workforce. By rewarding high performers and withholding remuneration from low performers, CCAS is intended to attract and retain a highly qualified workforce of employees who are motivated to maximize their contributions to the mission. CCAS is an annual process with six distinct phases: contribution planning, midpoint review, employee self-assessment, supervisor annual appraisal, pay pool process, and communication of results. This process is distinct from the GS appraisal system in its focus on
What Is AcqDemo? 23
employee contribution to organizational mission as a determinant of compensation actions, its provision of designated intervals for communication and feedback, and its use of pay pools to finalize ratings and compensations actions.
AcqDemo employees' contributions are documented and rated based on six factors: problem-solving, teamwork and cooperation, customer relations, leadership and supervision, communication, and resource management. The performance appraisal process requires dialogue at three intervals during the annual pay cycle: an initial meeting at the start of the cycle to discuss these factors and discuss how the employee will contribute to the mission over the course of the new year; a midpoint review that includes an employee self-assessment and a narrative written by the supervisor; and, as the pay cycle comes to an end, a second employee self-assessment, which informs his or her supervisor's annual appraisal narrative. These three required milestones are documented in CAS2Net, which is also used to monitor whether these sessions take place. Supervisors subsequently use this input and their own observations to generate an annual appraisal for each employee, which includes preliminary factor scores.
Supervisor appraisals are reviewed during the next step, the pay pool process. A pay pool is a group of employees who are evaluated collectively. These employees typically work in the same part of an organization and represent a variety of functional areas. Every pay pool convenes a panel of supervisors to review the complete set of annual appraisals. The meeting is facilitated by a senior leader and supporting staff. During the meeting, the pay pool panel reviews the preliminary factor scores reported in the annual appraisals and adjusts them as needed to ensure equity and consistency across employees. The final factor scores are averaged, and the resulting OCS becomes the employee's rating of record. An algorithm is used to translate the OCS into a recommended compensation action. Employees who perform at or above their expected OCSs may receive a basic pay increase and one-time awards. The algorithm is designed to provide greater rewards to employees who make greater contributions to the organizational mission.

CHAPTER THREE
Whom Does AcqDemo Include?
In this chapter, we use administrative data drawn from the DMDC civilian personnel inventory file to describe the AcqOemo workforce and compare it with DoD civilian employees on the GS pay plan. We also report findings from the AcqDemo survey and our interviews that provide insights regarding AcqDemo's appropriateness in light of the complexities of the affected workforce. Accordingly, this chapter addresses the following two assessment criteria:
• NOAA criterion A: a description of the workforce included in the project • NDAA criterion I: the project's appropriateness or inappropriateness in light of the com
plexities of the workforce affected.
AcqDemo Workforce Composition
Using data contained in the DMDC civilian personnel inventory files, 1 we examined the characteristics of the AcqDemo workforce. Table 3.1 provides a detailed breakdown of these characteristics for two points in time: September 30, 201 1, and September 30, 2015.
The AcqDemo workforce, as of September 30, 2015, was heavily male, highly educated, relatively senior, and unionized at a low rate. Forty-three percent of AcqDemo participants held a graduate degree, and an additional 35 percent had a bachelor's degree as their terminal degree. Only 14 percent of AcqDemo employees were in entry-level positions, compared with 39 percent in senior-level positions.2 This lines up with the fairly high average age (48 years old) of AcqDemo workers and the fact that 23 percent of workers were supervisors. AcqDemo also had a highly technical workforce, with more than a quarter of AcqDemo members in either the engineer or mathematician occupational groups. AcqDemo is a program for civilian personnel, but the AcqDemo workforce is not lacking in military experience: Nearly 40 percent of AcqDemo workers were veterans. Among AcqDemo participants not on retained pay, average annualized basic pay was $89,921.3
1 A detailed description of this data source can be found in Appendix C.
2 Entry level includes GS 1-8, NH 1-2, NJ 1-2, and NK 1-2. Midlevel includes GS 9-13, N H-3, NJ 3-4, and NK-3. Senior level includes GS 14-15 and NH-4. This taxonomy is consistent with the classification used by Guo, Hall-Partyka, and Gates (2014).
3 Employees on retained pay were omitted from the average because the annualized basic pay data include locality pay for employees on retained pay but exclude locality pay for employees not on retained pay. Consequently, basic pay data arc not directly comparable across the two groups. As shown in Table 3. 1, the fraction of the AcqDemo workforce on retained pay
25

26 2016 Assessment of the Civilian Acquisition Workforce Personnel Demonstration Project
Table 3.1 Characteristics of the AcqDemo Workforce, September 30, 2011, and September 30, 2015
Demographic category
Gender {%)
Race {%)
Hispanic {%)
Education level (%)
Veteran (%)
Component {%)
Career level {%)
Acquisition workforce {%)
Supervisor {%)
Bargaining unit (%)
Retained pay {%)
Average age
Average years of federal service
Average annualized basic pay
Total personnel
Characteristic
Male Female
White Black Asian Other
Yes No
No college Some college
Bachelor's degree Graduate degree
Yes No
Army Air Force
DoD agencies Marine Corps
Navy
Entry level Midlevel
Senior level
Yes No
Yes No
Yes No
Yes No
September 30, 2011
62.5 37.5
75.5 14.4 4.4 5.7
4.9 95.1
1 6.4 1 1 .8 35.0 36.6
38.0 62.0
49.9 18.8 16.6 13.4
1 .4
13.8 46.8 39.2
74.3 25.7
21.8 78.2
1 1 .2 88.8
1 1 .9 88.1
47.8
1 5.6
$89,717
14,957
SOURCE: DMDC civilian personnel inventory files; DAWIA personnel files.
September 30, 2015
65.1 34.9
76.1 13.8 4.3 5.8
5.1 94.9
1 2.9 9.3
34.6 43.2
39.6 60.4
48.2 19.0 17.0 1 1 .6 4.2
1 0.8 50.1 39.3
74.4 25.6
23.4 76.6
9.5 90.5
6.0 94.0
48.9
16 .5
$89,921
1 6,000
NOTES: Percentages may not add up to 1 00 due to rounding. The data presented include only permanent, fulltime employees whose compensation was at least $15,080, the salary equivalent of working a full year at federal minimum wage. The average annualized basic pay figures exclude employees on retained pay and are expressed in 2015 dollars.

Whom Does AcqDemo Include? 27
About one-fourth of AcqDemo participants were not in the AW. This is due, in part, to organizations, not individuals, being selected to join AcqDemo. When an organization joins, every employee in that organization becomes an AcqDemo participant. An organization is eligible to join AcqDemo if the following -three requirements are met:
• At least one-third of the organization's workforce consists of members of the AW. • At least two-thirds of the organization's workforce consists of members of the AW and
supporting personnel assigned to work directly with the AW • If the organization has bargaining unit employees, a written agreement between the orga
nization and any union representing those employees must be in place before the organization joins AcqDemo (AcqDemo, undated).
Thus, being in the AW is neither a necessary nor a sufficient condition for AcqDemo participation.
Changes in the AcqDemo Workforce Since 2010 The data reported in Table 3.1 indicate minimal change in the composition of the AcqDemo workforce from September 30, 201 1, to September 30, 2015. The number of employees rose from 15,250 to 16,258, an increase of approximately 7 percent:M The workforce became slightly more educated, with the fraction holding a graduate degree increasing from 37 percent to 43 percent, and slightly more senior, with the fraction in an entry-level position falling from 14 percent to 1 1 percent. But, generally speaking, the composition of the AcqDemo workforce was remarkably stable over the four-year period.
Despite the minor increases in education and career level, the AcqDemo workforce did not experience a meaningful increase in average annualized basic pay. After adjusting for inflation and excluding employees on retained pay, the increase in average annualized basic pay amounted to $204.
The stability that characterized FY 2012 to FY 2015 is a recent phenomenon. As detailed in RAND's 2012 assessment, AcqDemo experienced considerable growth during FY 201 1 . On September 30, 2010, there were 3,096 AcqDemo participants, but over the 12 months that followed, the count ballooned to 15,250. The growth was due primarily to the influx of employees from NSPS, which closed in 201 1 .
Comparing the AcqDemo Workforce with DoD Civilian Personnel in the G S System
Table 3.2 compares AcqDemo participants with two populations of GS system employees. In this section, we compare the AcqDemo workforce with DoD civilian personnel in the GS system. In the next section, we compare the AcqDemo workforce with a more-limited, and more-comparable, population: GS employees in AcqDemo-eligible organizations (ADEOs). For greater comparability, we restrict all three groups to permanent, full-time employees who
was nearly 1 2 percent in FY 201 1 but only 6 percent in FY 2015. The larger fraction reported for FY 201 1 may have been due to the influx of employees from NSPS.
4 These figures arc comprehensive counts of the number of employees in AcqDcmo. The figures rcporced in Table 3.1 apply only to permanent, full-time employees with annual compensation of at least $15,080, the salary equivalent of working a full year at federal minimum wage.
5 Details on the entry and exit of AcqDcmo employees can be found in Appendix C.

28 2016 Assessment of the Civilian Acquisition Workforce Personnel Demonstration Project
Table 3.2 Characteristics of AcqDemo Participants, DoD Employees in the GS System, and GS Employees in AcqDemo-Eligible Organizations, September 30, 2015
GS Employees in AcqDemo-
AcqDemo DoD Employees Eligible Demographic Category Characteristic Participants in the GS System Organizations
Gender (%) Male 65.1 60.5 58.0 Female 34.9 39.5 42.0
Race {%) White 76.1 70.4 71 .0 Black 13.8 1 6.9 1 7.1 Asian 4.3 5.2 4.9 Other 5.8 7.6 7.0
Hispanic (%) Yes 5.1 6.4 5.9 No 94.9 93.6 94.1
Education level (%) No college 12.9 29.0 2 1 .8 Some college 9.3 20.0 18.1
Bachelor's degree 34.6 28.4 32.5 Graduate degree 43.2 22.7 27.7
Veteran {%) Yes 39.6 46.9 42.6 No 60.4 53.1 57.4
Component {%) Army 48.2 37.0 59.9 Air Force 19.0 23.0 13.4
DoD agencies 17.0 1 5.9 24.1 Marine Corps 1 1 .6 2.6 0.0
Navy 4.2 21 .5 2 .6
Occupational group (%) Engineers 22.4 8.8 12.0 Logistics management 20.7 1 4.2 22.9 Central management 18.1 1 6.0 1 5.2
General office operations 1 1 .2 1 .8 0.6 Data systems management 5.5 6.5 4.4
Mathematicians 3.8 0.6 0.7 Financial management 2.8 6.2 4.4
Financial clerks 2.3 1 .2 0.3 Logistics technicians 1 .9 5.2 6.6
Secretarial 1 .0 1 .2 0.9 Other 10.2 40.0 31 .7
Career level (%) Entry level 10.8 23.7 17.1 Midlevel 50.1 68.2 73.0
Senior level 39.3 8.1 9.9
Retirement eligibility {%) Eligible 39.8 33.5 35.8 Not eligible 60.1 66.2 63.9 Unknown 0.1 0.3 0.3
Acquisition workforce (%) Yes 74.4 19.7 37.4 No 25.6 80.3 62.6
Supervisor {%) Yes 23.4 14.7 12.6 No 76.6 85.3 87.4
Bargaining unit (%) Yes 9.5 55.7 62.0 No 90.S 44.3 38.0
Retained pay {%) Yes 6.0 3.8 3.8 No 94.0 96.0 96.2
Average age 48.9 47.6 47.9

Whom Does AcqDemo Include? 29
Table 3.2-Continued
GS Employees in AcqDemo-
AcqDemo DoD Employees El igible Demographic Category Characteristic Participants in the GS System Organizations
Average years of federal 16.5 1 5.1 1 5.7 service
Average annualized basic pay $89,921 $62,919 $66,933
Total personnel 16,000 466,878 1 24,166
SOURCES: DMDC civilian personnel inventory files; DAWIA personnel files.
NOTES: Percentages may not add up to 100 due to rounding. The data presented include only permanent, ful ltime employees whose compensation was at least $15,080, the salary equivalent of working a full year at federal minimum wage. The average annualized basic pay figures exclude employees on retained pay and are expressed in 2015 dollars. Neither the population of DoD employees in the GS system nor the population of GS employees in AcqDemo-eligible organizations is weighted.
earn at least $15,080 annually, the salary equivalent of working a full year at federal minimum wage.6
The AcqDemo workforce made up a small fraction of the DoD civilian workforce. On September 30, 2015, there were 16,000 employees in AcqDemo, compared with 466,878 DoD civilian employees in the GS system. The two workforces exhibited a number of similarities. They were both heavily male and had a large veteran contingent. However, AcqDemo had a larger proportion of men and a smaller proportion of veterans when compared with the DoD GS workforce. The racial and ethnic makeup of the two populations was also largely similar, although AcqDemo was slightly less diverse (i.e., had smaller proportions of all minorities) when compared with the DoD GS workforce.
Along other dimensions, the workforces were quite different. AcqDemo was far less unionized: Only 9 percent of AcqDemo participants were members of a bargaining unit, while more than half of DoD employees in the GS system were in a bargaining unit. AcqDemo members were also much more likely to be supervisors than DoD GS employees were. As noted earlier, 74 percent of AcqDemo participants were in the AW; this percentage was much higher than the share of DoD GS employees in the AW (20 percent). AcqDemo participants were more likely to be in the Army, Marine Corps, or a DoD agency than were members of the DoD GS workforce. In contrast, the Navy was particularly underrepresented in AcqDemo.
AcqDemo workers were also further along in their careers than DoD GS employees were. The average AcqDemo participant had amassed 16.5 years of federal service, which exceeds the average time served by DoD GS employees by nearly two years. AcqDemo workers were more likely to occupy senior-level positions than were DoD employees in the GS system. Forty percent of AcqDemo participants were in the NH-4 broadband, while only IO percent of the DoD GS workforce consisted of GS-14 or GS-15 employees. The AcqDemo workforce was also more highly educated. Seventy-eight percent of AcqDemo participants had at least a bachelor's degree, and more than half of those held a graduate degree. In contrast, only 51 percent
6 These three restrictions arc satisfied by 98.4 percent of AcqDcmo employees, 95.2 percent of DoD employees in the GS system, and 96.4 percent of GS employees in ADEOs. Sec Appendix C for more details.

30 2016 Assessment of the Civilian Acquisition Workforce Personnel Demonstration Project
of DoD GS employees held a bachelor's degree, and fewer than half of those held a graduate degree.7
On average, AcqDemo workers were compensated at a much higher level ($89,921) than were DoD employees in the GS system ($62,919), even after excluding employees on retained pay. The disparity in compensation is large but can be explained, in part, because AcqDemo participants are more highly educated, more likely to work in technical fields, and more likely to occupy senior-level positions. Chapter Five provides an in-depth analysis of this issue.
Comparing the AcqDemo Workforce with GS Employees in AcqDemo-Eligible Organizations
Organizations eligible for AcqDemo are systematically different from DoD organizations that are not eligible for the project. As previously described, the eligibility criteria require that at least one-third of the organization's workforce consist of members of the AW and at least two-thirds of the organization's workforce consist of members of the AW and supporting personnel assigned to work directly with the AW. At the time of our assessment, only a fraction of eligible organizations had joined AcqDemo. Consequently, we were able to construct a more-comparable referent group: GS employees in ADEOs. 8
Restricting the referent group to GS employees in ADEOs mitigated some of the differences we observed between the AcqDemo population and the DoD GS population. GS employees in ADEOs were more highly educated and more likely to hold senior-level positions (GS-14 or GS-15) than were GS employees in DoD at large. AcqDemo-eligible GS employees were also more likely to work in technical fields, such as engineering or logistics management. Not surprisingly, GS employees in ADEOs were more likely to be members of the AW. Thirty-seven percent of AcqDemo-eligible GS employees were in the AW, which exceeded the threshold of 33 percent set by the eligibility criteria. In contrast, only 20 percent of DoD GS employees were in the AW.
The distribution of AcqDemo-eligible GS employees across the four services and DoD agencies explained, to some extent, the distribution we observed among AcqDemo participants. As previously noted, the Army and DoD agencies were heavily represented within AcqDemo, comprising 48 percent and 17 percent of the AcqDemo workforce, respectively. These components were even more heavily represented among GS employees in ADEOs, with 60 percent of the population in the Army and 24 percent in DoD agencies. At the other extreme, the Navy appeared to be underrepresented in AcqDemo, comprising just 4 percent of the AcqDemo workforce but 22 percent of DoD GS employees. However, among AcqDemo-eligible GS employees, the fraction of Navy civilian personnel was only 3 percent.
Restricting the comparison group to GS employees in ADEOs also reduced the basic pay disparity between the AcqDemo and DoD GS populations. After excluding employees on retained pay, the average AcqDemo-eligible GS worker earned $66,933, while the average DoD GS worker earned $62,919. However, a meaningful pay gap remained: AcqDemo participants who were not on retained pay earned $89,921 , on average. Chapter Five provides a more-detailed analysis of this issue.
7 The higher education levels cxhibired by AcqDcmo parricipanrs may be due to the prevalence of rhe AW within AcqDcmo. Government civilian employees in rhe AW are subject to more-stringent educational requiremenrs than arc other members of the DoD civilian workforce (10 U.S.C. 1732, 2010).
8 For details on how we identified GS employees in ADEOs, sec Appendix C.

Whom Does AcqDemo Include? 31
A number of other sizable differences remained. AcqDemo-eligible GS employees were more likely to be female and slightly more diverse than AcqDemo participants were. AcqDemoeligible GS workers were less likely to be supervisors and more likely to be unionized than AcqDemo workers were. Among GS employees in ADEOs, 13 percent were supervisors and 62 percent were in a bargaining unit. While restricting the comparison group to AcqDemodigible GS employees raised the share of GS employees in the AW from 20 percent to 37 percent, the AW was even more heavily represented in AcqDemo proper: 74 percent of AcqDemo participants were in the AW. These differences suggest that as AcqDemo expands in the coming years, it will absorb employees who are more likely to be in a bargaining unit and less likely to be in the AW relative to the current population of AcqDemo participants.
Upcoming Changes in the AcqDemo Workforce
After four years of stability, AcqDemo is once again entering a growth phase. The period of relative stability in the population of AcqDemo has come to a dose. As discussed in Chapter One, the AcqDemo Program Office reports that the total count of AcqDemo employees is expected to reach 33,955 by the end of FY 2016, more than doubling the size of the AcqDemo workforce in just one year. The majority of this growth is coming from the accession of Air Force and Navy organizations. Rapid growth is expected to continue through FY 2018, with additional accessions from the Air Force, Navy, and DoD agencies. The AcqDemo Program Office projects that AcqDemo will support 51 ,262 participants by the end of FY 2018.
Appropriateness of AcqDemo for the Workforce
The ideal approach to address criterion I, the project's appropriateness or inappropriateness in light of the complexities of the workforce affected, is somewhat unclear. What basis does an analyst employ to determine whether AcqDemo is appropriate for the workforce that has joined it? Analysis of career outcomes, such as performance ratings, compensation changes, and promotions, could lead to erroneous conclusions: Differences in outcomes, such as a disparity between male and female employees' promotion rates, do not necessarily imply that AcqDemo is more appropriate for the group with the more favorable outcome or, conversely, less appropriate for the comparison group or groups. Given this problem, we opted to rely on perceptions of AcqDemo's appropriateness or suitability for its workforce, including results from our SME interviews and both qualitative and qualitative evidence from the AcqDemo survey.
In their interviews, the seven enterprise-level AcqDemo representatives were specifically asked to discuss the types of employees for which AcqDemo seemed well suited, those for which the project seemed less appropriate, and why. The other SMEs, who did not have the same high-level perspective, were not presented with the same question, but comments related to appropriateness were offered without prompting. Similarly, survey write-in responses to questions not expressly asked about this topic included pertinent remarks. As shown in the following comments, the view that AcqDemo was suitable for all types of employees was a salient theme in the SME interviews:
I think it [AcqDemo] is suited for the entire acquisition workforce, regardless of career field . . . We have accounting, business and finance, as well as product development. It incentivizes them to work hard and perform their duties. We do have some administrative employ-

32 2016 Assessment of the Civilian Acquisition Workforce Personnel Demonstration Project
ees as well under AcqDemo, as well as those in the career fields. I think it is suited for all of the employees [who] are here to perform a job and make contributions to the organization. Since they are part of the organization, they are here to do a job and provide a valuable service. I haven't seen any one that couldn't value from this or AcqDemo couldn't be a value to them. (SME 17)9 I've done AcqOemo and LabOemo across labs, client organizations, air staff organizations, and across all career fields {we had everyone in AcqDemo at [LOCATION]). It's actually the best personnel system I've seen for rewarding people for what they've done and communicating how they're doing amongst their peers. It's very transparent, and you can tell people what they can improve: this is what you were supposed to accomplish, this is what you did accomplish. I've used it across a lot of areas, geographically and work series, and I've found it to work in all instances. (SME 3)
I think it works well with every employee. (SME 6)
A similar theme was not salient among survey write-in responses. Instead, evidence about AcqDemo's suitability pertained to a wide array of employee attributes. This is fitting because one of the most complex aspects of AcqDemo's workforce is arguably its heterogeneity along dimensions that affect how AcqDemo's key features, particulady the link between contribution and pay, are implemented. As the project has grown in size, it has diversified in many ways, particularly in terms of bringing in new organizations and a wide range of occupations, including positions not coded as part of the AW. Moreover, plans to add more Air Force personnel from Air Force Materiel Command mean that the proportion of AcqDemo employees in bargaining units, heretofore a relatively small minority, will likely increase. Table 3.3 summarizes this type of evidence from both the survey write-in responses and SME interviews, providing a list of the characteristics by which AcqDemo's appropriateness was perceived to vary and exemplar quotes to convey both the nature of each theme and its range. AcqDemo's suitability was viewed positively for those in the AW and those in business and technical professions. Conversely, AcqDemo was perceived as less suitable for those in administrative or support roles, those in bargaining units, those working in lower-profile areas or on low-impact projects, and those geographically separated from their AcqDemo raters, although there were some divergent views present in the data. Views about the appropriateness of AcqDemo for supervisors and those subject to pay caps also tended to vary from positive to negative.
Quantitative results from the AcqDemo survey provide additional insights. The 2016 survey did not include any items that directly addressed the appropriateness of AcqDemo, so, consistent with the 2012 assessment (Werber et al., 2012), we elected to use respondents' favorability toward AcqDemo as a proxy. Overall, we found that 42 percent of survey respondents agreed or strongly agreed with the statement "I am in favor of AcqDemo for my organization." The majority of respondents either disagreed or took a neutral position. Results did not change
9 Afrcr each quotation. we provide some details about the interview or survey participant. Each participant was assigned a unique identifier, but the identifier docs not have any significance and cannot be used to identify the individual. The purpose of including the number is to show that we arc not serially quoting any single individual. To provide an indication of both a theme's context and its ubiquity, we also include relevant demographic information for the survey respondents. For example, we note whether the respondent is a supervisor or employee and his or her organization. We also edited the comments to correct spelling mistakes and punctuation but did not revise the words used by the comments' authors. Finally. we redacted potentially identifying details to protect participant confidentiality.
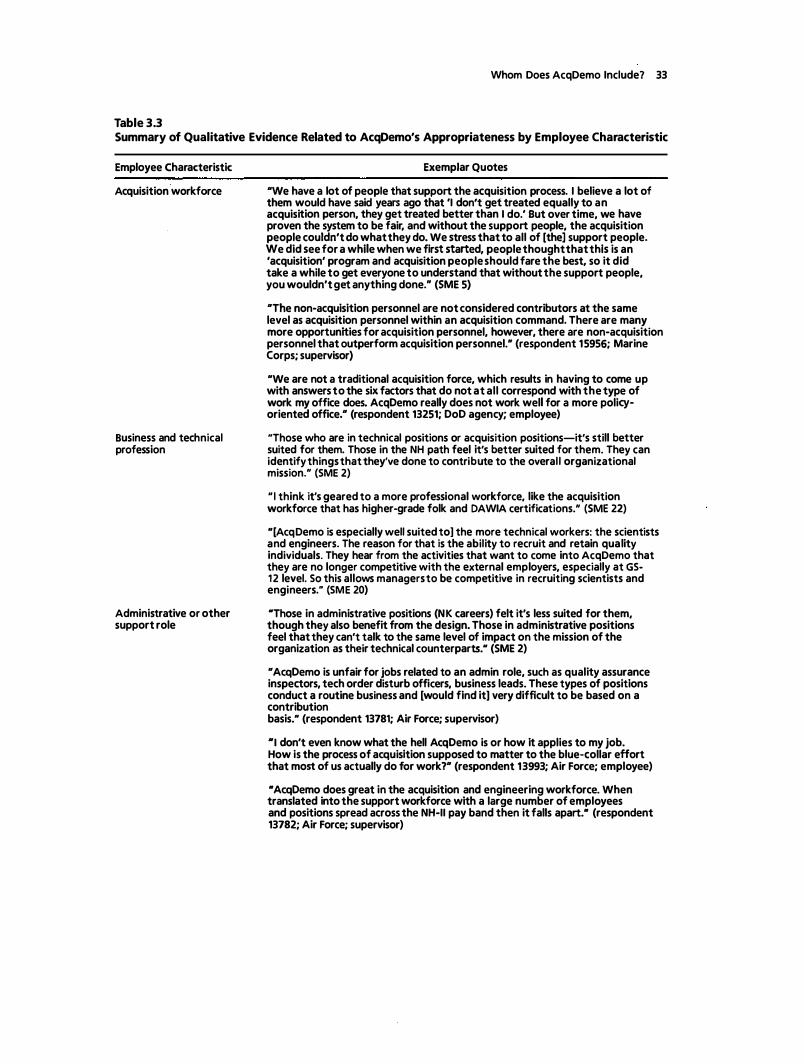
Whom Does AcqDemo Include? 33
Table 3.3 Summary of Qualitative Evidence Related to AcqDemo's Appropriateness by Employee Characteristic
Employee Characteristic
Acquisition workforce
Business and technical profession
Administrative or other support role
Exemplar Quotes
uwe have a lot of people that support the acquisition process. I believe a lot of them would have said years ago that 'I don't get treated equally to an acquisition person, they get treated better than I do.' But over time, we have proven the system to be fair, and without the support people, the acquisition people couldn't do what they do. We stress that to all of [the] support people. We did see.for a while when we first started, people thought that this is an 'acquisition' program and acquisition people should fare the best, so it did take a while to get everyone to understand that without the support people, you wouldn't get anything done. n (SME 5)
"The non-acquisition personnel are not considered contributors at the same level as acquisition personnel within an acquisition command. There are many more opportunities for acquisition personnel, however, there are non-acquisition personnel that outperform acquisition personnel.n (respondent 15956; Marine Corps; supervisor)
"We are not a traditional acquisition force, which results in having to come up with answers to the six factors that do not at all correspond with the type of work my office does. AcqDemo really does not work well for a more policyoriented office." (respondent 13251; DoD agency; employee)
"Those who are in technical positions or acquisition positions-it's still better suited for them. Those in the NH path feel it's better suited for them. They can identify things that they've done to contribute to the overal l organizational mission." (SME 2)
" I think it's geared to a more professional workforce, like the acquisition workforce that has higher-grade folk and DAWIA certifications." (SME 22)
"[AcqDemo is especially well suited to] the more technical workers: the scientists and engineers. The reason for that is the ability to recruit and retain quality individuals. They hear from the activities that want to come into AcqDemo that they are no longer competitive with the external employers, especially at GS-12 level. So this allows managers to be competitive in recruiting scientists and engineers." (SME 20)
'"Those in administrative positions (NK careers) felt it's less suited for them, though they also benefit from the design. Those in administrative positions feel that they can't talk to the same level of impact on the mission of the organization as their technical counterparts." (SME 2)
'"AcqDemo is unfair for jobs related to an admin role, such as quality assurance inspectors, tech order disturb officers, business leads. These types of positions conduct a routine business and [would find it] very difficult to be based on a contribution basis." (respondent 13781; Air Force; supervisor)
"I don't even know what the hell AcqDemo is or how it applies to my job. How is the process of acquisition supposed to matter to the blue-collar effort that most of us actually do for work?" (respondent 13993; Air Force; employee)
•AcqDemo does great in the acquisition and engineering workforce. When translated into the support workforce with a large number of employees and positions spread across the NH-II pay band then it falls apart.• (respondent 13782; Air Force; supervisor)

34 2016 Assessment of the Civilian Acquisition Workforce Personnel Demonstration Project
Table 3.3-Continued
Employee Characteristic
Supervisory status
Bargaining unit
Perceived va lue or visibility of work (high or low)
Physical proximity to raters
Exemplar Quotes
"I have read that new rules will permit those who supervise to obtain more in rewards than nonsupervisors, which is not a good rule." (respondent 13642; Army; employee)
"Supervisor pay differential is not available in AcqDemo. My agency a l lows supervisors to work here from the Department of Army where those supervisors receive a large pay differential that allows them to make significantly more money than MDA supervisors that are bound by the rules of AcqDemo." (respondent 16651 ; DoD agency; supervisor)
"Due to union agreements, nonsupervisors will get twice the combination pay raise/bonus as supervisors. As a result, some of the people I supervise are paid more than me and that gap will continue to grow-regardless of my performance or theirs. Unless I get out of a supervisory rote soon, more of those I supervise wil l pass me in total earnings in the next few years." (respondent 13535; Army; supervisor)
"The unions don't necessarily agree with some of AcqDemo's flexibilities. I don't see how they can benefit the unions. In some ways, there are too many flexibilities; there's no black and white. The union looks at it as the flexibil ities are not likely to benefit its members." (SME 12)
"The labor unions want salaries to go as high as possible, so they don't necessarily think that pay-for-contribution will benefit their membership as much as pay for tenure." (SME 21)
· "For the most part there is little difference in the day-to-day work task between AcqDemo and other systems. Opportunity for pay increases has more to do with assignment/duties than contribution. The same effort or performance does not have the same impact to the mission. Example: Two test engineers are responsible for saving their program one day of schedule. The first engineer is a test lead in a component software lab and his effort saves the program $300,000. The second engineer is a test lead at a test range and h is effort saves the program $2,300,000. Both employees saved a day of schedule, but the impact was different because of the assignment. Everyone cannot have the high-profile assignment." (respondent 17892; DoD agency; supervisor)
"[I] believe the AcqDemo process has some inherent issues related to how visible you and/or your mission is across the organization." (respondent 1 5696; Army; supervisor)
"Our mission is all about ships, if you don't work in a division that doesn't deal with ships, systems, or acquisition there's a possibility you could be overlooked." (respondent 18373; Navy; supervisor)
"Upper management is geographically located in a different state/section of the country and make up the pay pool. Upper management does not visit our location even occasionally so they have no idea what we do or how we perform." {respondent 13248; DoD agency; employee)
"Since the pay pool and overal l determinations are made at the main location and I am at a geographically separated location, I have no insight into how the payouts are actually administered." {respondent 14287; Army; employee)
"Contribution awards seem to be less at locations geographically separated from the main command. My contribution awards {or lack thereof) do not match up with the exceptional performance appraisals that I receive." (respondent 17261 ; Marine Corps; employee)
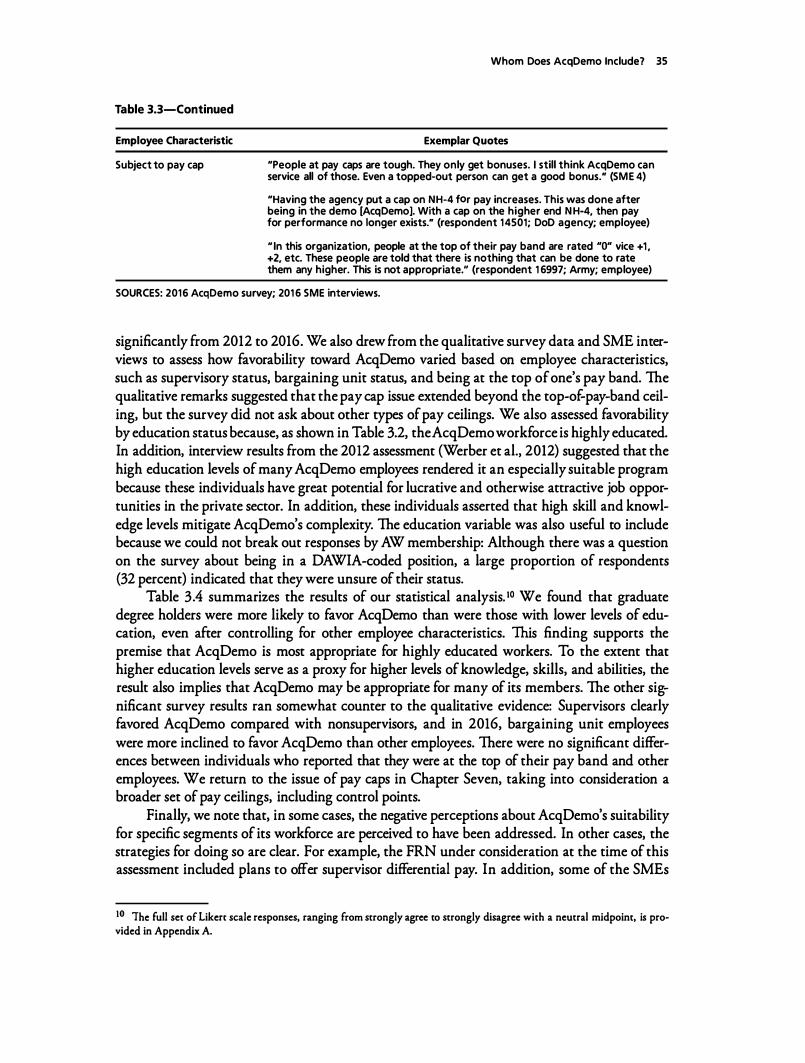
Table 3.3-Continued
Employee Characteristic
Subject to pay cap
Whom Does AcqDemo Include? 35
Exemplar Quotes
"People at pay caps are tough. They only get bonuses. I still think AcqDemo can service all of those. Even a topped-out person can get a good bonus." {SME 4)
"Having the agency put a cap on NH-4 for pay increases. This was done after being in the demo [AcqDemo]. With a cap on the higher end N H-4, then pay for performance no longer exists." {respondent 14501; DoD agency; employee)
" In this organization, people at the top of their pay band are rated "O" vice +1 , +2, etc. These people are told that there is nothing that can be done to rate them any higher. This is not appropriate." {respondent 1 6997; Army; employee)
SOURCES: 2016 AcqDemo survey; 201 6 SME interviews.
significantly from 2012 to 2016. We also drew from the qualitative survey data and SME interviews to assess how favorability toward AcqDemo varied based on employee characteristics, such as supervisory status, bargaining unit status, and being at the top of one's pay band. The qualitative remarks suggested that the pay cap issue extended beyond the top-of-pay-band ceiling, but the survey did not ask about other types of pay ceilings. We also assessed favorability by education status because, as shown in Table 3.2, the AcqDemo workforce is highly educated. In addition, interview results from the 2012 assessment (Werber et al., 2012) suggested that the high education levels of many AcqDemo employees rendered it an especially suitable program because these individuals have great potential for lucrative and otherwise attractive job opportunities in the private sector. In addition, these individuals asserted that high skill and knowledge levels mitigate AcqDemo's complexity. The education variable was also useful to include because we could not break out responses by AW membership: Although there was a question on the survey about being in a DAWIA-coded position, a large proportion of respondents (32 percent) indicated that they were unsure of their status.
Table 3.4 summarizes the results of our statistical analysis. 1° We found that graduate degree holders were more likely to favor AcqDemo than were those with lower levels of education, even after controlling for other employee characteristics. This finding supports the premise that AcqDemo is most appropriate for highly educated workers. To the extent that higher education levels serve as a proxy for higher levels of knowledge, skills, and abilities, the result also implies that AcqDemo may be appropriate for many of its members. The other significant survey results ran somewhat counter to the qualitative evidence: Supervisors clearly favored AcqDemo compared with nonsupervisors, and in 2016, bargaining unit employees were more inclined to favor AcqDemo than other employees. There were no significant differences between individuals who reported that they were at the top of their pay band and other employees. We return to the issue of pay caps in Chapter Seven, taking into consideration a broader set of pay ceilings, including control points.
Finally, we note that, in some cases, the negative perceptions about AcqDemo's suitability for specific segments of its workforce are perceived to have been addressed. In other cases, the strategies for doing so are clear. For example, the FRN under consideration at the time of this assessment included plans to offer supervisor differential pay. In addition, some of the SMEs
10 The full set of Liken scale responses, ranging from strongly agree to strongly disagree with a neutral midpoint, is provided in Appendix A.
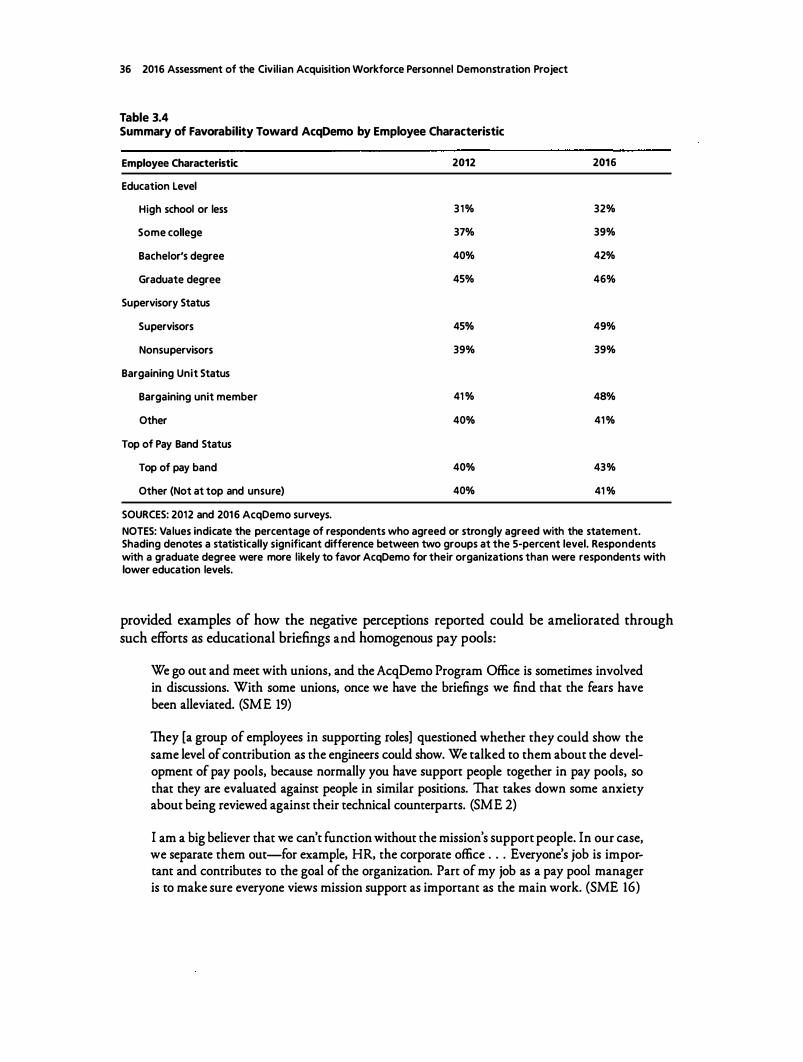
36 2016 Assessment of the Civilian Acquisition Workforce Personnel Demonstration Project
Table 3.4 Summary of Favorability Toward AcqDemo by Employee Characteristic
Employee Characteristic 2012 2016
Education Level
High school or less 3 1% 32%
Some college 37% 39%
Bachelor's degree 40% 42%
Graduate degree 45% 46%
Supervisory Status
Supervisors 45% 49%
Nonsupervisors 39% 39%
Bargaining Unit Status
Bargaining unit member 41 % 48%
Other 40% 41 %
Top of Pay Band Status
Top of pay band 40% 43%
Other (Not at top and unsure) 40% 41 %
SOURCES: 2012 and 2016 AcqDemo surveys.
NOTES: Values indicate the percentage of respondents who agreed or strongly agreed with the statement. Shading denotes a statistically significant difference between two groups at the 5-percent level. Respondents with a graduate degree were more likely to favor AcqDemo for their organizations than were respondents with lower education levels.
provided examples of how the negative perceptions reported could be ameliorated through such efforts as educational briefings and homogenous pay pools:
We go out and meet with unions, and the AcqDemo Program Office is sometimes involved in discussions. With some unions, once we have the briefings we find that the fears have been alleviated. (SME 19) They [a group of employees in supporting roles] questioned whether they could show the same level of contribution as the engineers could show. We talked to them about the development of pay pools, because normally you have support people together in pay pools, so that they are evaluated against people in similar positions. That takes down some anxiety about being reviewed against their technical counterparts. (SME 2)
I am a big believer that we can't function without the mission's support people. In our case, we separate them out-for example, HR, the corporate office . . . Everyone's job is important and contributes to the goal of the organization. Part of my job as a pay pool manager is to make sure everyone views mission support as important as the main work. (SME 16)

Whom Does AcqDemo Include? 37
Summary
As of September 30, 2015, AcqDemo had 16,258 participants, 16,000 of which were permanent, full-time employees. The population was heavily male, highly educated, relatively senior, and unionized at a low rate. The Army employed nearly half of AcqDemo participants, while the Navy employed fewer than 5 percent. Approximately three-fourths of AcqDemo participants were members of the AW.
When compared with DoD civilian personnel in the GS system, the AcqDemo workforce was markedly less unionized. Only 9 percent of AcqDemo participants were members of a bargaining unit, while more than half of DoD employees in the GS system were unionized. The AcqDemo workforce was also more highly educated, more concentrated in technical fields, and more likely to hold senior-level positions. Not surprisingly, AcqDemo participants were more highly compensated than DoD GS employees were. After excluding employees on retained pay, the average AcqDemo participant earned $89,921 per year in basic pay, while the average DoD GS employee earned $62,919 per year.
Restricting the comparison group to GS employees in ADEOs mitigated some of the disparities between the AcqDemo and GS popul�tions but did not dose the gaps entirely. Most notably, restricting the comparison group raised average annualized basic pay, but only to $66,933. A meaningful gap between compensation in AcqDemo and compensation in the GS system remained.
AcqDemo's appropriateness for its workforce is somewhat difficult to assess. Disparate career outcomes for different types of employees do not always indicate whether AcqDemo is more or less suited to a specific employee segment. Although SMEs expressed views that AcqDemo was well suited to all employees, there was also qualitative evidence indicating that AcqDemo's suitability varied with a number of employee characteristics. For instance, some SMEs and survey respondents reported that AcqDemo was more appropriate for personnel in business and technical positions and less appropriate for personnel in administrative or support roles. Not surprisingly, AcqDemo was also viewed as being well suited to employees in the AW. These perceptions were consistent with quantitative data collected by the AcqDemo surveys: Favorability toward AcqDemo increased with the employee's education level, even after controlling for other characteristics.
For other employee characteristics, the evidence was less clear-cut. The qualitative data revealed some concerns about whether supervisors are appropriately compensated under AcqDemo; however, the survey data indicate that supervisors are more likely than nonsupervisors to regard AcqDemo favorably. Similarly, some SMEs suggested that AcqDemo might not be apt for bargaining unit employees despite survey data indicating favorability toward AcqDemo increases with union membership. The qualitative data also highlighted more subtle distinctions, such as working on lower-profile or lower-impact assignments or being geographically separate from one's raters, which might affect AcqDemo's suitability. While these issues are not unique to AcqDemo, it may be the case that the project exacerbates them.
SMEs suggested that some of the perceptions regarding AcqDemo's inappropriateness for particular segments of the workforce seem to have been addressed or can be, primarily via education campaigns and the separation of different groups in pay pools.

CHAPTER FOUR
What Protections Are in Place to Support AcqDemo?
In this chapter, we draw from multiple data sources-AcqDemo survey data, SME interviews, archival data, and AcqDemo program materials-to discuss the protections in place to support AcqDemo. In doing so, we address the following four assessment criteria:
• NDAA criterion D: the steps taken to ensure that such a system is fair and transparent for all employees in the project
• NDAA criterion J: the project's sufficiency in terms of providing protections for diversity in promotion and retention of personnel
• NDAA criterion K: the adequacy of the training, policy guidelines, and other preparations afforded in connection with using the project
• NDAA criterion L: whether there is a process for ensuring employee involvement in the development and improvement of the project.
In the following sections, we cover the policies and training that support AcqDemo; the processes in place to ensure fairness and transparency, including equitable treatment for diverse personnel; and the processes for ensuring employee involvement in AcqDemo's implementation and ongoing development.
AcqDemo Guidance
Policy and Training Overview
The AcqDemo Program Office and the organizations participating in AcqDemo bear responsibility for AcqDemo policy and training guidance. The AcqDemo Program Office provides general policy guidance in the form of FRNs, an operating procedure manual, and AcqDemo memoranda. Since 1999, when the FRN announcing the creation of AcqDemo was published, there have been a series of amendments issued, including a significant set of changes in a March 2015 amendment and the most-recent changes in a February 2016 amendment (still under review at the time of this report's completion). The operating procedures manual was developed in 2003 and has not been revised since then. However, several memoranda have been released with specific operating guidance for a number of topics, including pay-setting and the dissemination of aggregated pay pool results. 1 The AcqDemo Program Office also has
1 For example, the AcqDemo Memorandum (AM) 13-02 directs pay pools to provide employees with data tables by career path and broadband level that display average OCS, average .60CS, average CRI, and average CA (DoD, OUSD, 2016).
39

40 2016 Assessment of the Civilian Acquisition Workforce Personnel Demonstration Project
primary responsibility for preparing organizations to enter AcqDemo and for training personnel new to AcqDemo. To facilitate organizational entry, the AcqDemo Program Office developed the AcqDemo Readiness Tool, which is essentially a detailed checklist of the activities an entering organization should complete and the desired timing for each.
The AcqDemo Program Office standard is that 75 percent of employees should be trained before organizations can join AcqDemo, and the Readiness Tool lists the following training activities in particular:
• training needs assessment for senior leaders, HR practitioners, employees, civilian and military practitioners, and pay pool administrators (180 days before entry)
• preparation of training (e.g., obtaining materials, reserving facilities) and communicating of training plans to the organization's members (150 days)
• completion of conversion training for HR professionals, supervisors, and employees (90 days).
The AcqDemo Program Office provides the training recommended in the AcqDemo Readiness Tool, as well as additional training. The timing may vary from the timing listed in the Readiness Tool, with some training typically occurring closer to the entry date than 90 days out. An AcqDemo Program Office contractor handles much of this training. One notable exception is the training provided to Army organizations. The Army has its own central AcqDemo office that provides the requisite training activities in AcqDemo, using the general AcqDemo training modules as a starting point.
We learned through our SME interviews that the Program Office contractor provides instructor-led training for the transition. Training includes courses for HR professionals that support the organization, employees, supervisors, and pay pool managers. Employees and supervisors attend a two- to three-hour, lecture-style overview of the AcqDemo process and their organizations' own chain of command resources. After that course, supervisors participate in a second training focused on CCAS. This is a full-day session that includes both lectures and exercises intended to help supervisors learn how CCAS and pay pools work, how to develop appraisals, and how OCSs are developed and used, including for final pay adjustments. There is also a one-time course regarding CAS2Net operations, again a combination of lecture and hands-on content. This course is offered as soon as employees gain access to their organization's version of CAS2Net. It teaches users how to get into the system, how to use it, and how to troubleshoot at the end of the session. Finally, there is a course for pay pool managers and administrators. At the time of our assessment, it was a web-based course given once to each organization. We learned that this course is moving toward a pay pool simulation, which will include real-life examples and allow participants to see the tools used during the process. These instructor-led courses are supplemented by a set of eLearning modules on the AcqDemo website, including an AcqDemo 101 course and a CCAS course specifically for supervisors. The AcqDemo Program Office also maintains a help desk to answer questions about AcqDemo.
Although the courses are standardized in many ways, they are tailored to suit different audiences and are reviewed and updated annually. For example, the CCAS course is tailored to include specific organizational policies and examples relevant to the workforce receiving the training. One interviewee told us that the Air Force Materiel Command, a new entrant to AcqDemo, includes a smaller proportion of acquisition professionals and more personnel

What Protections Are in Place to Support AcqDemo? 41
in support functions, such as aircraft maintenance, so changes to the training were made in recognition of that difference. Courses also were revised to include policy changes, the latest CAS2Net screen shots, and the most recent pay tables.
As noted earlier, the organizations entering AcqDemo also provide significant guidance. Each organization is supposed to develop its own business rules that specify how AcqDemo's flexibilities will be implemented. Organizations have a great deal of discretion in the implementation of certain aspects of the project, such as pay-setting and pay pool funding levels. For example, one interviewee told us that after the first year, CRI funding must be set at no less than 2 percent, but no more than 2.26 percent, of the sum of the salaries of all employees in the pay pool. This means that one pay pool may elect to fund at the floor and another may elect to fund at the ceiling. Organizations may also differ in the business rules that govern the use of "control points," compensation limits within pay bands that are intended to ensure equity and consistency within an organization. Control points are described as follows in official AcqDemo program guidance:
Although broadbanding makes available a broader range of compensation choices, basic pay adjustments known within AcqDemo as Contribution Rating Increase (CRI) adjustments are not the sole means to compensate employees, and in some cases are not the recommended means. As the compensation value of organizational positions are identified, managers should consider employing appropriate means to preserve those values . . . . Means to preserve the identified compensation values may include the establishment of control points or pay ranges within a broadband level. . . . These tools should be considered to, at a minimum, require a management decision to establish an appropriate compensation value or to increase an employee's basic pay above the identified compensation value. The use of such methodologies establishes compensation equity, consistency, and transparency for employees and supervisors alike throughout the organization. No matter what the compensation system, over time positions reach a plateau where salary growth levels off; some at the top of the pay scale and others at other points. (forthcoming AcqDemo FRN)
Some organizations use control points to align pay bands with the GS system. For example, one interviewee told us that his organization uses control points within the NH-4 band to distinguish between employees at the GS-14 level and employees at the GS-15 level.
In addition, AcqDemo organizations have primary responsibility for sustainment training activities, such as training personnel who are new to AcqDemo or who have changed roles within AcqDemo, answering questions about AcqDemo over the course of a pay cycle, and conducting refresher training. As noted earlier, the Army, which has a large number of personnel in AcqDemo, has a robust training program led by its central AcqDemo office. This office oversees instructor-led, slideshow-based training for HR personnel, senior executives, pay pool managers and panel members, data maintainers, supervisors, and employees. The office also administers a "train the trainer" program to prepare individuals to lead training at different Army locations with employees under AcqDemo. In addition to offering a full array of training activities to entering organizations, the Army provides sustainment training activities. Refresher training is provided by request based on the organization's needs. Online training modules and deskside support from local training personnel, such as pay pool administrators, are provided to new personnel and personnel in new roles. Local trainers develop briefings based on their process observations, modifying the Army and DoD briefings used to train everyone formally.

42 2016 Assessment of the Civilian Acquisition Workforce Personnel Demonstration Project
Through our interviews, we learned that organizations outside the Army follow a similar pattern of providing training via a central representative, such as the AcqDemo component representative, an HR professional, or a pay pool administrator. These organizations rely heavily on training modules developed by the AcqDemo Program Office and housed on the AcqDemo website. In some cases, the training is provided in person; in other cases, personnel are provided with materials and website links to review on their own, after which they may follow up with questions. In a few instances, interviewees reported modifying AcqDemo Program Office slides either by trimming them to make them more user-friendly for deskside suppon or by adding the organization's business rules.
Perceived Adequacy of Policy and Training
Overall, the evidence regarding the adequacy of the policy and guidance that AcqDemo provides is mixed. Although the Program Office has issued memoranda and published policy amendments to supplement the 2003 operating procedures manual, a single comprehensive guide that brings together all the numerous changes in one place is lacking. However, after several years of effort by the AcqDemo Program Office and Executive Council, a new FRN that summarizes all the refinements to AcqDemo has been drafted. In addition, the Program Office has plans to release a DoD Instruction, which is intended to replace the 2003 operating procedures manual.
We observed more concerns about organizations' business rules than about overarching AcqDemo policy. Our SME interviews revealed that developing business rules was perceived as a potential challenge for organizations in their first year under AcqDemo. As one SME told us:
The guidance for the transition is not that great and could be improved. Everything is set based on local policy, which means an organization new to AcqDemo has to develop and set its own policies. That is very hard to do in the beginning. It's a hard adjustment, especially for organizations coming in from the GS system. That's a rocky road when you first convert . . . . Only after the organization acclimates a little to AcqDemo should local policies then be developed and used. (SME 12)
The AcqDemo Program Office provides entering organizations with examples of existing business rules and offers to provide feedback on emergent business rules. However, organizations do not always have their rules ready in time for the training provided at organizational entry, which hinders the initial instruction. In addition, some AcqDemo survey respondents commented that organization-specific approaches to implementing AcqDemo, such as how assessments are written, how ratings are assigned, how control points are used, and how pay pools are administered, were not clearly conveyed in a timely manner. The following remarks illustrate such sentiments:
There has been minimal guidance to employees and supervisors as to what differentiates a "I '' "2 " "3 ''
. A D I Id b b fi · 1 b · · I , , , etc., m cq emo. t wou e ene c1a to etter communicate expectations attributes of each category. The general guidance provided to date has not been valuable. (respondent 13670; Army; supervisor)
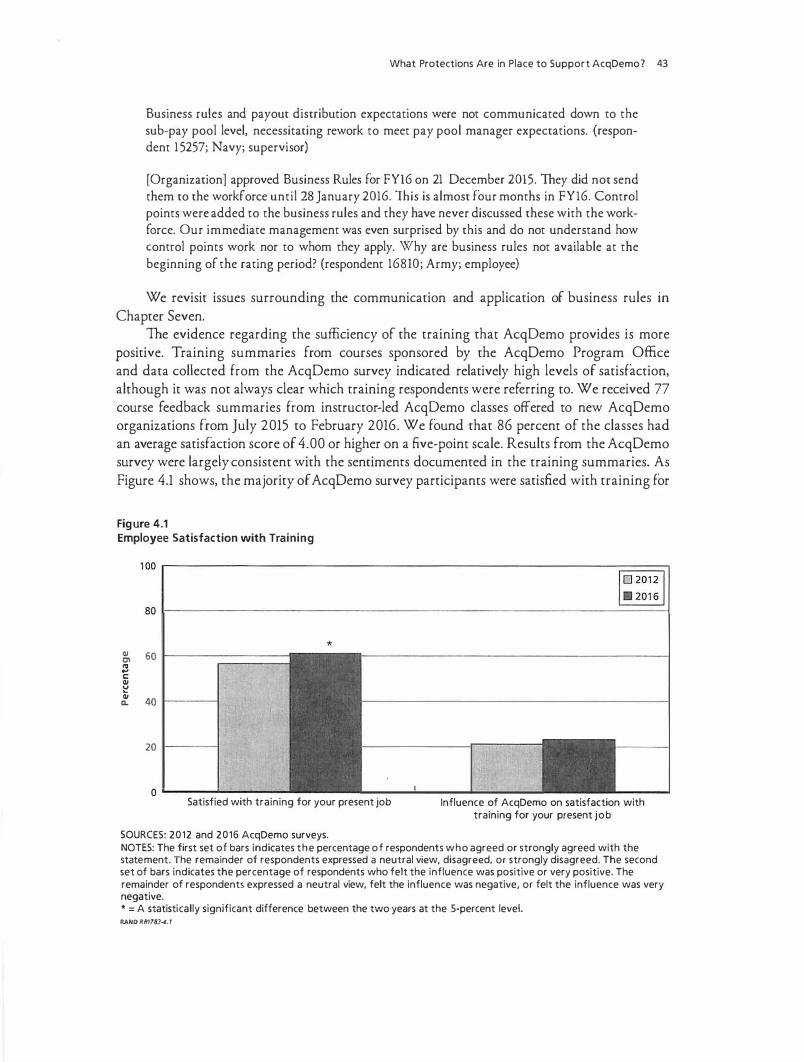
What Protections Are in Place to Support AcqDemo? 43
Business rules and payout distribution expectations were not communicated down to the sub-pay pool level, necessitating rework to meet pay pool manager expectations. (respondent 15257; Navy; supervisor)
[Organization] approved Business Rules for FY16 on 21 December 2015. They did not send them to the workforce until 28 January 2016. This is almost four months in FYI6. Control points were added to the business rules and they have never discussed these with the workforce. Our immediate management was even surprised by this and do not understand how control points work nor to whom they apply. Why are business rules not available at the beginning of the rating period? (respondent 16810; Army; employee)
We revisit issues surrounding the communication and application of business rules m Chapter Seven.
The evidence regarding the sufficiency of the training that AcqDemo provides is more positive. Training summaries from courses sponsored by the AcqOemo Program Office and data collected from the AcqDemo survey indicated relatively high levels of satisfaction, although it was not always clear which training respondents were referring to. We received 77 course feedback summaries from instructor-led AcqDemo classes offered to new AcqOemo organizations from July 2015 to February 2016. We found that 86 percent of the classes had an average satisfaction score of 4.00 or higher on a five-point scale. Results from the AcqOemo survey were largely consistent with the sencimencs documented in the training summaries. As Figure 4.1 shows, the majority of AcqOemo survey participants were satisfied with training for
Figure 4.1 Employee Satisfaction with Training
� 60 1---------1 !!! c � Gi Q. 40 1-----<
20 1-----l
*
Satisfied with training for your present job
SOURCES: 2012 and 2016 AcqDemo surveys.
Influence of AcqDemo on satisfaction with training for your present job
NOTES: The first set of bars indicates the percentage of respondents who agreed or strongly agreed with the statement. The remainder of respondents expressed a neutral view, disagreed, or strongly disagreed. The second set of bars indicates the percentage of respondents who felt the influence was positive or very positive. The remainder of respondents expressed a neutral view, felt the influence was negative, or felt the influence was very negative. * = A statistically significant difference between the two years at the 5-percent level. RAND RR17834. 1
44 2016 Assessment of the Civilian Acquisition Workforce Personnel Demonstration Project
their present jobs, and this satisfaction grew significantly from 2012 to 2016.2 Supervisors were more likely to agree that they were satisfied with their training than were nonsupervisors, and the difference in satisfaction between the two groups did not change from 2012 to 2016. However, some respondents may have interpreted the survey item to include all job-related training, rather than AcqDemo-specific training. For additional insights, we looked to the survey item that inquired about AcqDemo's influence on satisfaction with training. We found that a relatively small share of respondents indicated that AcqDemo had a positive or very positive influence on training and that the share did not change meaningfully between the two survey years.
While evidence from the survey and SME interviews is largely positive with respect to training, SME and survey respondents identified some opportunities to improve AcqDemofocused training. Some survey respondents offered broad statements about the existence of training shortcomings, such as "The training was inconsistent,
, and "Other than navigating
the technology, leadership doesn't provide training on how it [AcqDemo] actually works.'' Other comments pertained to specific aspects of AcqDemo training, some of which were also mentioned by SMEs. Both survey participants and interviewees identified the CCAS process, supervisor appraisals of personnel, the pay pool process (especially the computational piece), and OCS versus 60CS ratings as aspects of AcqDemo that are particularly challenging or problematic. Some indicated that these aspects can be confusing to personnel and may warrant additional training, either in terms of new content or a different form of delivery (e.g., more frequent training, smaller session, training simulation). Representative comments include:
Describing CCAS and the rails takes a lot of care. It is not exactly intuitive. (SME 1)
Too many people do not understand that the delta score is not a rating. Retraining is a big need. (respondent 16205; DoD agency; supervisor)
Writing of assessments and the pay pool panel process-racking and stacking properly [are difficult]. In the past, even our pay pool panel and pay pool panel manager had a different understanding of what AcqDemo is. (SME 18)
Both the survey respondents and our interviewees felt that AcqDemo was particularly demanding for first-year supervisors and that these supervisors could benefit from improved training. In addition, SMEs mentioned that pay-setting was an area that could use more training to ensure the flexibility was implemented properly. As one SME explained:
Salary flexibility can be very helpful, but getting hiring managers to use it judiciously is extremely hard. A lot of them want to automatically give applicants the top of the band, especially when they're trying to bring on a retired military member. We try, as advisors, to work with them to first value the position and then look at the person's attributes to get them to a more reasonable starting salary so they have room to climb. Giving everyone the top of band does two bad things: the civilian pay budget gets bashed, and it doesn't give employee room to climb. (SME 21)
2 The full set of Likert scale responses, ranging from strongly agree to strongly disagree with a neutral midpoint, is provided in Appendix A.

What Protections Are in Place to Support AcqDemo? 45
SMEs also suggested that more training for HR personnel could be useful because they may be supporting AcqDemo but are not in AcqDemo themselves. Moreover, some HR personnel may be providing guidance for individuals under several different pay systems. As one interviewee told us,
We have a lot of HR people that support multiple demonstration projects like Lab Demo and AcqDemo, plus the general GS structure. It can get confusing for them because they have to remember all of the different structures. (SME IO) One aspect of training that seemed insufficient was refresher training. Few of the orga
nizations represented in our SME interviews provided refresher training at regular intervals or on a mandatory basis. In a related vein, a survey respondent wrote,
We've only had training or update on how the process works once that I can recall and that was several years ago . . . . Just getting an update would be helpful to morale. (respondent 13653; DoD agency; employee)
On a positive note, individuals who did receive refresher training commented on its usefulness. Some interviewees explained that budget limitations prevented their organizations from offering refresher training systematically-instead, they provide it to individuals on request. However, others told us their organizations have a training budget that facilitates mandatory refresher training every two years.
Drawing conclusions about the adequacy of training is challenging because organizations do not use a common standard to assess training effectiveness. Through our interviews, we learned that organizations look at the results of the AcqDemo survey and that some use course evaluation forms. However, most of the feedback mechanisms described to us are informal and/or used intermittently. In many cases, organizations rely on patterns of questions or common areas of confusion as indicators that training needs to be modified:
If we find a systemic issue across the pay pools {e.g., similar questions across the pay pools), we need to close a knowledge gap and modify the training. (SME 10)
I guess it [training assessment] would be an informal evaluation. For example, I get a lot of thank you notes from people. Or I hear something negative, like maybe "I haven't heard from anyone and I don't understand this." That would be a prompt to revise my training approach. (SME 13)
At the end of every rating cycle, when we start reading all of the assessments and during the pay pool panel, if there are things we don't understand, we'll make changes to the training. (SME 18)
Given the investment of resources that formal training assessments require, this may be a satisfactory way to gauge the need for training refinements. However, it does make it difficult to conclude whether training is adequate across the AcqDemo workforce.
The AcqDemo survey provides some insights of this nature. One way to look at the adequacy of training is to examine whether AcqDemo participants understand the key concepts of AcqDemo that are covered in the training modules. In the 2012 and 2016 surveys, respondents were asked to indicate their level of agreement with the statement "I understand the difference

46 2016 Assessment of the Civilian Acquisition Workforce Personnel Demonstration Project
between contribution and performance," which is a critical AcqDemo tenet. Seventy-seven percent of 2012 respondents and 76 percent of 2016 respondents agreed or strongly agreed that they understood the difference between contribution and performance. The remaining supervisors either were neutral or disagreed. Moreover, this percentage tracks almost perfectly with the percentage of supervisors who agreed with the statement "Employees I supervise understand the difference between contribution and performance." As shown in Figure 4.2, the percentage of supervisors who felt that their employees understood the difference between contribution and performance grew significantly from 2012 to 2016. An even larger proportion of supervisors perceived their own understanding of the contribution planning process to be high, and that figure rose significantly as well between the two survey years.
Steps to Ensure Fairness and Transparency Overall Steps The AcqDemo Program Office and AcqDemo organizations take many steps to ensure that AcqDemo is fair and transparent to all its members. The first step is publishing and disseminating AcqDemo policies and organizations' business rules so that all personnel are aware of how the process works and the timing of key events. In addition, the six factors used to evaluate employee contributions are documented and publicized. Each factor has a set of discriminators that refine the factor and a set of descriptors that specify the contributions associated with the factor. The factors and their discriminators are common across career paths and broadbands; the descriptors are tailored to each career path and broadband. This information is printed i n several sources, including FRN 64 (OPM, 1999), the operating procedures manual, and the
Figure 4.2 Supervisor Perceptions of AcqDemo Comprehension
§ 20 1 2
• 2016 *
80 ·-------------------------�
� 60 ,___ ___ , 111 ... c: QJ � rf. 40 1-----1
20 ,___ ___ ,
0 .._ __ __.. ____ _ Employees I supervise understand the difference
between contribution and performance
SOURCE: 2012 and 2016 AcqDemo surveys.
I understand the contribution planning process
NOTES: The bars indicate the percentage of respondents who agreed or strongly agreed with the statements. The remainder of respondents expressed a neutral view, disagreed, or strongly disagreed. * = A statistically significant difference between the two years at the 5-percent level. RAND RRr783-4.2

What Protections Are in Place to Support AcqDemo? 47
employee's guide to CCAS, to ensure that employees are familiar with the general expectations for their positions. As described in Chapter Two, supervisors are expected to meet with employees at the beginning of the appraisal cycle to communicate these expectations and how they tie into an individual's duties and the greater organizational mission. This ensures that employees are fully aware of what factors will be used to measure their contribution from the beginning of the cycle. Informal communication between supervisors and employees throughout the appraisal cycle and a midcycle review are regarded as essential to ensure that the process is transparent, and employees are promptly informed if they are not meeting expectations. As the appraisal cycle comes to a close, employees have an opportunity to provide input in the form of a self-assessment before the supervisor rating is submitted and pay pool processes begin. The input is solicited so that employees are fairly rated based on actual contributions to the mission, particularly a concern if they seldom interact with the supervisors who are rating them.
After supervisor appraisals are prepared, the pay pool process begins. Each organization has a Personnel Policy Board that sets funding parameters for all pay pools across the organization and oversees business rules for all pay pools to ensure equity across them. Supervisors participate in the pay pool process so that they can see all the employee records and have a voice in the process. The pay pool panel members and pay pool managers act as an additional mechanism to promote fairness and consistency across employee ratings and compensation actions. The pay pool managers also review the final pay pool results, which are subsequently reviewed by organizations' Personnel Policy Boards and the AcqDemo Program Office. AcqDemo has a pay pool analysis tool, which permits the Boards and Program Office to look across pay pools and ensure that there is sound logic for any variation.
After the pay pool process is complete, the results are shared with employees. In another effort to make the process transparent, AM 13-02 calls for organizations to provide aggregate pay cycle results to their employees and describes the minimum requirements for disseminating this information. Some organizations hold town hall meetings to do this, with senior leadership walking through the results and fielding questions from employees. Others comply with the requirement by posting results on websites or emailing them to employees. Individuals who believe their ratings do not accurately reflect their contributions can discuss their concerns with their supervisors or more-senior leadership. They also have access to a formal grievance process to contest their assessment and pay pool outcomes.
In Chapter Seven, we discuss perceptions of AcqDemo's transparency and fairness, specifically how a perceived lack of these attributes may impede the use of AcqDemo's flexibilities.
Diversity-Specific Protections
The overall steps taken to promote fairness and transparency within AcqDemo also help to ensure equitable treatment for women and racial and ethnic minorities. In addition, organizations follow EEO guidelines as they employ AcqDemo's hiring and performance appraisal flexibilities. Pay pools do not typically track pay pool results by gender or race or ethnicity, but organizations' EEO offices do keep track of such demographics. The AcqDemo Program Office also conducts an annual equity review of CCAS data at both the overall agency level and the organization level. If Program Office staff observe an unusual or potentially problematic pattern, they will also review previous years' results and reach out to the pertinent pay pool managers to discuss them. There are also formal grievance procedures for CCAS and EEO grievances, as well as for unfair labor practices. In FY 2013, the AcqDemo Program Office

48 2016 Assessment of the Civilian Acquisition Workforce Personnel Demonstration Project
instituted an annual data call to receive grievance data from all organizations, which was intended as an additional fairness check across the AcqDemo workforce. In Chapter Six, we assess how well AcqDemo has provided protections for diversity by examining how the career outcomes of AcqDemo participants have varied with gender and race or ethnicity.
Employee Involvement in AcqDemo's Development and Improvement
AcqDemo has two oversight groups in place: the Executive Council and the Training Review and Advisory Committee (TRAC). The Executive Council was established in 1999, and according to its charter (AcqDemo, 2013), the Executive Council is intended
to oversee the successful implementation and operation of the AcqDemo in order to provide the Acquisition Workforce with effective and responsive personnel interventions, and the Program Office and other evaluators with sufficient information which can assist in the determination of establishing the AcqDemo design as a permanent alternative personnel system.
Executive Council members include the AcqDemo program director and deputy program manager, AcqDemo lead representatives from the military services and DoD agencies, and AcqDemo Program Office staff and contractors. The Executive Council meets several times a year, including seven times in 2014, five times in 2015, and three times by mid-2016, when this report was completed. We reviewed Executive Council meeting minutes and noted that topics on its agenda included policy updates to reflect AcqDemo project modifications, revisions to training content and modalities, CAS2Net software updates, AcqDemo expansion plans, and means of obtaining supervisor and employee input about AcqDemo.
A new charter was issued for TRAC in 2015, which indicated that the committee's primary function was "to take responsibility for advising and providing feedback to the development team and AcqDemo Program Office regarding the usability, content, and format of training materials." This includes ensuring that training objectives are adequate, providing guidance to the training development team when requirements change, and verifying that final deliverables meet all requirements. However, we did not receive TRAC meeting minutes, and it did not appear that the committee was convening regularly. AcqDemo program management indicated that TRAC is not meeting as frequently because there are fewer new eLearning training modules for it to revi�w and evaluate. Nevertheless, if TRAC was established to serve as a vehicle for employee involvement in AcqDemo-related training more generally, less-frequent meetings represent a diminishing opportunity for employee input.
Other means of employee involvement reported in the 2012 AcqDemo assessment also appear to be waning. The last series of focus groups that CSRA conducted took place in 2012, and the last set of senior leader interviews was completed in 2014. These sessions covered substantial topics, such as the overall impact of AcqDemo; specific features concerning hiring, job classification, and CCAS; AcqDemo training; and desired improvements to the project. In addition, AcqDemo held an annual conference attended by individuals tasked with AcqDemo implementation, such as HR representatives, pay pool administrators, and data maintainers. This conference once served as a venue to share ideas for improving the demonstration project, but it is no longer being organized. During our SME interviews, it was suggested that the

What Protections Are in Place to Support AcqDemo? 49
conference was discontinued because of budgetary constraints, rather than a lack of interest, which the AcqDemo Program Office later confirmed, citing OPM and DoD conference guidance issued in light of ongoing resource constraints. In a similar vein, at least one interviewee reported missing the opportunity for interaction that the conference provided.
Given that AcqDemo moved away from conferences, focus groups, and interviews as means of eliciting employee input during the time frame of our assessment, the primary source for employee views and suggestions was the AcqDemo survey. The survey was fielded in 2012, 2014, and 2016. As noted earlier, the 2016 survey suffered from a modest response rate (27 percent) and no control group. Executive Council 2015 meeting minutes indicated that the AcqDemo Program Office was considering discontinuing the AcqDemo survey and instead relying on the FEVS as the sole survey instrument used to gauge employee attitudes. Although the FEVS includes many of the same items as the AcqDemo survey and provides a way to isolate AcqDemo respondents, the lack of access to the actual data files noted in Chapter One means that AcqDemo analysts cannot control for characteristics, such as supervisory status, gender, age, and other individual attributes that might influence responses and, consequently, cannot truly assess differences in perceptions between AcqDemo members and the DoD civilian workforce at large. Thus, the usefulness of FEVS as a tool for employee involvement is limited.
In addition, AcqDemo leadership has occasionally engaged in targeted data collection efforts or pilot tests as way to obtain employee input. For example, the Executive Council in 2014 considered reducing the number of appraisal factors from six to three. The AcqDemo Program Office posted a blog article on an official AcqDemo page that included voting buttons and a comment section to solicit feedback on appraisal factor options. About 2,100 responses were received. While the input collected via the blog was not the primary factor in the decision to reduce the number of appraisal factors, the blog did represent an effort by the AcqDemo Program Office to involve employees in the AcqDemo improvement process. We identified other conduits for feedback from AcqDemo participants during our interviews. Interviewees mentioned "snap surveys" used to gauge opinions about a specific policy change or issue. In addition, they described town halls convened by senior leadership to obtain employee views and answer questions, and they mentioned that employees could also provide input through the organization's standard complaint system or suggestion box.
Turning our attention to the employee perspective, AcqDemo survey results suggest that processes for employee involvement are either not well known or insufficiently executed. The majority of survey respondents failed to confirm their knowledge of how to submit ideas to either enhance AcqDemo's benefits or improve its administration: 26 percent agreed with the statement "I know how to submit my ideas to enhance the benefits of AcqDemo," and 28 percent agreed with the statement "I know how to submit my ideas to improve the administration of AcqDemo." On the whole, it appears that employees have fewer ways to be involved in AcqDemo's development and improvement than they once had.
However, increased opportunities for employee involvement are pending. For example, the AcqDemo Program Office reported plans to convene an AcqDemo conference in May 2017. In addition, August 2016 Executive Council minutes indicate plans to conduct focus groups in spring 2017 to learn more about issues revealed in the 2016 AcqDemo survey and to develop strategies to mitigate them. There are also plans to field a revised version of the AcqDemo survey in 2018.

50 2016 Assessment of the Civilian Acquisition Workforce Personnel Demonstration Project
Summary
The AcqDemo Program Office and the organizations participating in AcqDemo share responsibility for AcqDemo policy and training guidance. The AcqDemo Program Office provides general policy guidance in the form of FRNs, an operating procedure manual, and AcqDemo memoranda. It also has primary responsibility for preparing organizations to enter AcqDemo and for training personnel new to AcqDemo. Within the constraints imposed by the guidance issued by the AcqDemo Program Office, organizations participating in AcqDemo have a great deal of discretion over how AcqDemo's flexibilities are implemented. Each organization is supposed to develop its own business rules that govern the implementation of certain aspects of the project, such as pay-setting and pay pool funding levels. In addition, AcqDemo organizations have primary responsibility for sustainment training activities, such as answering questions about AcqDemo over the course of a pay cycle and conducting refresher training.
Overall, the evidence regarding the adequacy of the policy and guidance that AcqDemo provides is mixed. The operating procedures manual was developed in 2003. Although the AcqDemo Program Office has issued memoranda and published policy amendments to supplement the manual, there is no single, comprehensive guide that brings together the numerous changes in one place. A new FRN that integrates all the refinements to AcqDemo has been drafted and was pending at the time of our assessment. In addition, the AcqDemo Program Office has plans to release a DoD Instruction, which is intended to replace the 2003 operation procedures manual. We observed more concerns about organizations' business rules than about overarching AcqDemo policy. Our SME interviews revealed that developing business rules was perceived as a potential challenge for organizations in their first year under AcqDemo. Respondents to the AcqDemo survey commented that organization-specific approaches to implementing AcqDemo, such as how assessments are written, how ratings are assigned, how control points are used, and how pay pools are administered, were not clearly conveyed in a timely manner. Evidence regarding the adequacy of the training AcqDemo provides to new entrants is largely positive, although interviewees and survey respondents did identify a few particularly challenging topics, such as the CCAS process, supervisor appraisals of personnel, and pay pool computation. They also suggested providing more support for first-year supervisors and human resources personnel. The nature and extent of refresher training varied across organizations, and, overall, it was viewed less favorably than the initial training.
AcqDemo has taken many steps to ensure that the project is fair and transparent to all employees. AcqDemo policies and organizations' business rules are published and disseminated so that all personnel are aware of how the various processes work and when key events occur. As discussed earlier, extensive training is provided to both new and existing AcqDemo participants to support their understanding of the project's policies and processes. In addition, supervisors are expected to meet with employees at the beginning of the performance appraisal cycle and again during the midcycle review to ensure that the process remains transparent. As the cycle comes to a close, employees submit self-assessments; these provide employees with the opportunity to provide input on their contributions before supervisor ratings are submitted and the pay pool process begins. Pay pool panels review and discuss each employee's appraisal to ensure that assessments are fair and consistent across supervisors. Several levels of leadership review pay pool results, and the results of the pay pool process must be shared with the workforce in aggregate form. There is a formal grievance process in place for employees who

What Protections Are in Place to Support AcqDemo? 51
feel they have not been treated fairly, and some organizations offer additional opportunities to voice concerns, such as town halls and suggestion boxes.
Opportunities for employee involvement in the development and improvement of AcqDemo include two oversight groups: the Executive Council and TRAC. Employee input has also been solicited via the AcqDemo annual conference, interviews, surveys, focus groups, town halls, and suggestion boxes. However, AcqDemo survey results suggest that less than 30 percent of the workforce knows how to submit ideas to enhance AcqDemo's benefits or improve its administration. Moreover, employees seem to have fewer ways to participate in AcqDemo's development and improvement than they once had. For example, TRAC is no longer meeting at regular intervals, the AcqDemo annual conference has not taken place in recent years, and the most-recent efforts to conduct interviews and focus groups with personnel took place in 2014. At the time of this assessment, the AcqDemo survey was the primary source of employee feedback for informing the development and improvement of the project. Additional opportunities for employee involvement are pending. These include an AcqDemo conference and focus groups in 2017 and a revised AcqDemo survey in 2018.
CHAPTER FIVE
How Has AcqDemo Performed So Far? Career Outcomes and Flexibi l ity Usage
In this chapter, we present the results of a rigorous and comprehensive assessment of AcqDemo's effects on various career outcomes. Using administrative data drawn from the DMDC civilian personnel inventory and transaction files, we estimated the extent to which AcqDemo participants and GS employees differed with respect to retention, compensation, and promotion, after controlling for other factors. We also examined how the estimated differences varied across particular groups of interest, such as union members and supervisors. Throughout, we compared the career outcomes estimated using the administrative data with perceptions of these outcomes, as indicated by responses to the AcqDemo survey.
We follow up the career outcomes analysis with a discussion on how the appointment and performance appraisal flexibilities described in Chapter Two have been used. These flexibilities include more authority over the hiring process, greater latitude to set starting salaries, more-effective communication within the appraisal system, a stronger relationship between salary increases and performance, the opportunity for rapid compensation growth within the broadband, and the option to award one-time bonuses as a reward for contributions to the
. . ' . . orgamzat1on s m1ss10n. Accordingly, this chapter addresses the following seven assessment criteria:
• NDAA criterion F: an analysis of how the flexibilities in criteria B and C are used and what barriers have been encountered that inhibits their use
• NOAA criterion H: the project's impact on career progression • New criterion 1 : salary cost growth comparison with GS equivalent population (both
AW and non-AW, as applicable)-the implementing FRN requires cost discipline, not cost neutrality - overall program cost comparison - starting salaries for new hires
• New criterion 2: AcqDemo versus GS retention and turnover rates - by appraisal zone - by broadband and career path
• New criterion 3: a comparison of results for bargaining unit employees participating in AcqDemo versus those not participating in AcqDemo
• New criterion 4: career progression comparison with GS, by broadband and career path - CCAS increases versus WIGI rates
• New criterion 5 : a follow-up assessment of AcqDemo's impact on retention and compensation of unionized employees.
53

54 2016 Assessment of the Civilian Acquisition Workforce Personnel Demonstration Project
Effects on Retention
AcqDemo has the potential to strategically affect employee retention. The project provides salary flexibility at hiring and opportunities for rapid growth, features that are intended to make AcqDemo organizations more competitive with private industry in attracting and retaining talented personnel. By tying raises, awards, and promotions to annual contribution appraisals, AcqDemo amplifies the incentive for high-performing employees to continue in their government jobs and reduces the incentive for low-performing employees to remain.
Our assessment of AcqDemo's effect on retention centered on the following questions:
1 . Are AcqDemo participants more or less likely to remain in the DoD civilian workforce relative to comparable employees in the GS system?
2. How does retention vary with career path and broadband? 3. How does retention vary with performance within AcqDemo?
To answer these questions, we identified the cohort of permanent, full-time employees who were in AcqDemo on September 30, 201 1, and tracked their retention outcomes over four years {September 30, 201 1 , to September 30, 2015). We also identified an analogous cohort of permanent, full-time employees who were in ADEOs on September 30, 201 1 , but were on the GS pay plan rather than in AcqDemo.1 Weights were applied to these AcqDemo-eligible GS employees to make the control group more similar to the AcqDemo population along an array of immutable or preexisting characteristics, such as age, race or ethnicity, gender, education level, component, occupation, career level, and compensation. The weighted cohort of AcqDemo-eligible GS employees served as a control group with which we compared the cohort of AcqDemo participants. 2
For each individual, we calculated the number of months that elapsed from September 30, 201 1 , to the first instance at which the individual separated from the DoD civilian workforce. Time to separation was set to 48 months for any individual who remained in the DoD civilian workforce for the entire four-year period. Table 5.1 presents retention rates for the AcqDemo population and the weighted control group of AcqDemo-eligible GS employees after 12, 24, 36, and 48 months. The retention rates are nearly identical across the two groups, and any differences are not statistically significant. That is, there is no evidence that AcqDemo participants are any more or less likely to remain in the DoD civilian workforce relative to comparable employees in the GS system. 3
1 Eligible organizations were listed in the FRNs for January 8, 1999; July 1, 2002; and March 31, 2015.
2 Table CJ lists the characteristics that were used in the weighting exercise and demonstrates how the cohort of AcqDcmocligiblc GS employees compared with che cohort of AcqDemo participants, both before and after weights were applied. For further details on the construction of chc control group, sec Appendix C.
3 One limitation of the analysis represented in Table 5.1 is that it docs not offer visibility into the source of any differences (however small) in the retention rates across groups. In other words, the results are only as good as the balance achieved between the AcqDemo group and the weighted control group of AcqDemo-eligible GS employees. To control for any remaining differences between the characteristics of the cwo groups, we fitted a Cox proportional hazards (CPH) regression model that included the full array of characteristics used to balance the two groups. The CPH results confirmed that there is no evidence that AcqDemo participants arc any more or less likely to be retained than comparable employees in the GS system arc. For more information on these analyses, sec Appendix C.
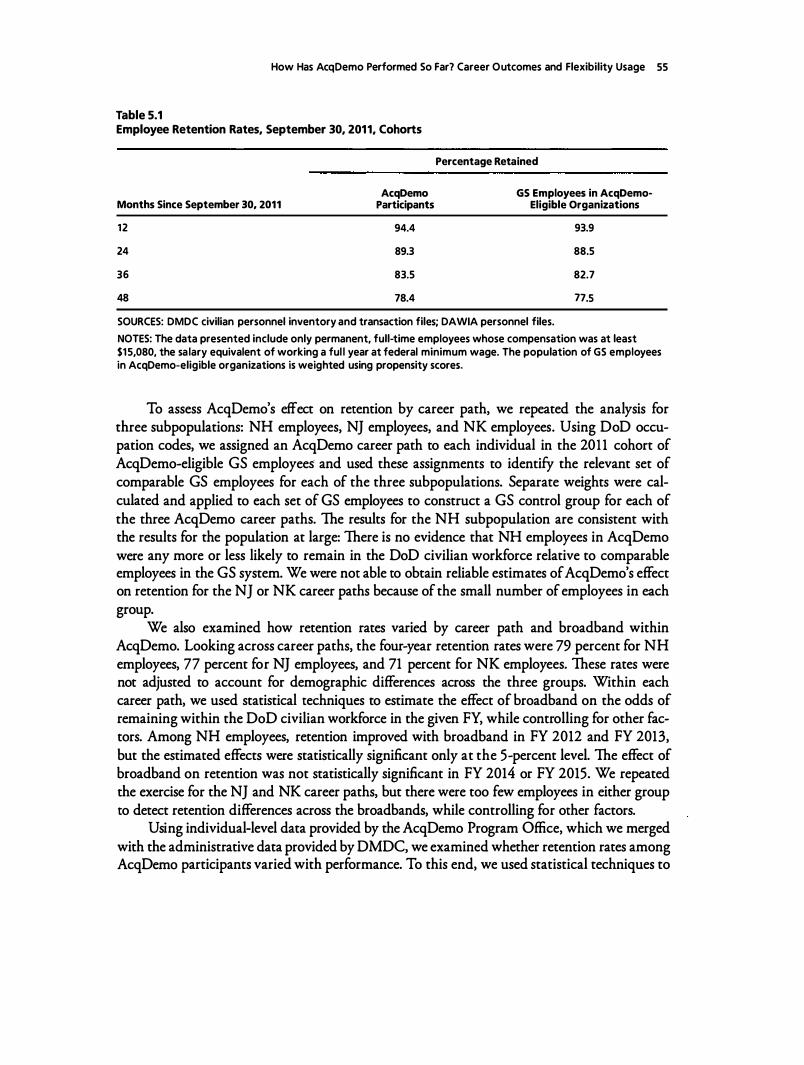
How Has AcqDemo Performed So Far? Career Outcomes and Flexibility Usage 55
Table 5.1 Employee Retention Rates, September 30, 2011, Cohorts
Months Since September 30, 2011 12
24
36
48
AcqDemo Participants
94.4
89.3
83.5
78.4
Percentage Retained
GS Employees in AcqDemo· Eligible Organizations
93.9
88.5
82.7
77.5
SOURCES: DMDC civilian personnel inventory and transaction files; DAWIA personnel files.
NOTES: The data presented include only permanent, full·time employees whose compensation was at least $15,080, the salary equivalent of working a ful l year at federal minimum wage. The population of GS employees in AcqDemo·eligible organizations is weighted using propensity scores.
To assess AcqDemo's effect on retention by career path, we repeated the analysis for three subpopulations: NH employees, NJ employees, and NK employees. Using DoD occupation codes, we assigned an AcqDemo career path to each individual in the 201 1 cohort of AcqDemo-eligible GS employees and used these assignments to identify the relevant set of comparable GS employees for each of the three subpopulations. Separate weights were calculated and applied to each set of GS employees to construct a GS control group for each of the three AcqDemo career paths. The results for the NH subpopulation are consistent with the results for the population at large: There is no evidence that NH employees in AcqDemo were any more or less likely to remain in the DoD civilian workforce relative to comparable employees in the GS system. We were not able to obtain reliable estimates of AcqDemo's effect on retention for the NJ or NK career paths because of the small number of employees in each group.
We also examined how retention rates varied by career path and broadband within AcqDemo. Looking across career paths, the four-year retention rates were 79 percent for NH employees, 77 percent for NJ employees, and 71 percent for NK employees. These rates were not adjusted to account for demographic differences across the three groups. Within each career path, we used statistical techniques to estimate the effect of broadband on the odds of remaining within the DoD civilian workforce in the given FY, while controlling for other factors. Among NH employees, retention improved with broadband in FY 2012 and FY 2013, but the estimated effects were statistically significant only at the 5-percent level. The effect of broadband on retention was not statistically significant in FY 2014 or FY 2015. We repeated the exercise for the NJ and NK career paths, but there were too few employees in either group to detect retention differences across the broadbands, while controlling for other factors.
Using individual-level data provided by the AcqDemo Program Office, which we merged with the administrative data provided by DMDC, we examined whether retention rates among AcqDemo participants varied with performance. To this end, we used statistical techniques to

56 2016 Assessment of the Civilian Acquisition Workforce Personnel Demonstration Project
estimate the effect of a 1-point increase in �OCS in the given year on the odds of remaining within the DoD civilian workforce in the following year. 4
Table 5.2 provides a summary of the results. In every year from FY 2012 to FY 2014, a higher �OCS was associated with higher retention, after controlling for an array of other factors. In particular, a 1-point increase in �OCS raised the odds of retention by approximately 20 percent over the following year. While a 20-percent increase in the odds of retention may seem large, the corresponding increase in the probability of retention is quite small: For the average AcqDemo participant, a 1-point increase in �OCS raised the probability of retention in the following year by less than 1 percentage point. Nevertheless, the effect was statistically significant, and, accordingly, we conclude that AcqDemo retains high-performing employees at a higher rate and low-performing employees at a lower rate.s
We did not conduct an analogous analysis for the weighted control group of AcqDemoeligible GS employees because the available performance rating data for GS employees were too coarse and inconsistent over time. 6 Consequently, we cannot make any statements about whether the GS system is more or less adept than AcqDemo at retaining high-performing employees and shedding low-performing employees.
It is important to note that the retention analyses were limited by the period of observation, a mere four years. We were not able to examine retention outcomes over a longer period because of the large number of employees who joined AcqDemo from NSPS during FY 201 1 .
Table 5.2 Effect of a 1-Point Increase in �OCS on Retention in the Following Fiscal Year
FY
2012
2013
2014
Change Due to a 1-Point Increase in dOCS
Percentage Change in the Odds of Retention
20.1
19.7
20.4
Average Change in the Probability of Retention
< 0.1
< 0.1
< 0.1
SOURCES: DMDC civilian personnel inventory files; DAWIA personnel files; administrative data provided by the AcqDemo Program Office.
NOTES: The data presented include only permanent, full-time employees in AcqDemo whose compensation was at least $15,080, the salary equivalent of working a full year at federal minimum wage. The estimates are statistically significant at the 1-percent level.
4 Appraisal zones arc simply a classification of LlOCS. In most cases, Zone A corresponds ro a .llOCS less than -4; Zone B corresponds to a 80CS higher than +4; and Zone C corresponds to a .llOCS from -4 to +4. Hence, this analysis serves to assess the relationship between appraisal zone and retention.
5 To account for the possibility that exceptional performance is associated with a greater likelihood of separation from the DoD civilian workforce, we included the square of 80CS in the logistic regression model. We were able co reject this hypothesis because the estimated coefficient on the square term was positive, albeit small, and statistically significant. For more details, sec Appendix C.
6 As explained in Chapter One, roughly half of permanent, full-time GS employees were rated on the full five-point scale; the majority of the remaining employees were rated on a one-or-three (pass/fail) scale. Among those who were rated on a five-point scale, virtually none (less than 0.50 percent) received the two lowest ratings, meaning that the five-point scale was effectively reduced to a three-point scale. Moreover, rhc five-point performance ratings appear to have experienced inflation over time, both within AcqDemo and within the GS system.

How Has AcqDemo Performed So Far? Career Outcomes and Flexibility Usage 57
Had we been able to observe the AcqDemo population over a longer period, we might have been able to detect meaningful changes in retention rates.
The sentiments expressed by respondents to the AcqOemo survey differed somewhat from the retention effects estimated using administrative data. Figure 5.1 indicates that approximately 60 percent of the survey respondents agreed that they see themselves working at their organizations for the next year. The remaining respondents rook a neutral stance or disagreed with this statement.7 While 60 percent constitutes a majority of the respondents, the proportion falls short of the retention rate observed in the administrative data: 78 percent over four years. The misalignment may be due to a difference in the reference point. The perceptions reported in the survey refer to employees' intentions to remain within their organizations, while the estimates from the administrative data analysis refer to the actual fraction of employees who remained within the DoD civilian workforce at large.
The survey also asked AcqDemo employees about how retention rates vary with employee performance. Fewer than 1 5 percent of survey respondents agreed that low contributors tend to leave their organizations. A higher proportion agreed that high contributors tend to remain with their organizations, but this proportion was still just 33 percent. Notably, the proportions that agreed with each of these statements decreased significantly from 2012 to 2016. These perceptions differ from the estimates presented in Table 5.2, which show that high contributors were more likely to remain in the OoD civilian workforce than were low contributors, although the magnitude of the effect was rather small.
Figure 5.1 Employee Perceptions of AcqDemo Retention Outcomes
Qj Cl nl ... c: Qj � Qj 0..
80
60
* 40 --
20
o --....... ---High contributors tend to stay
with this organization
SOURCE: 2012 and 2016 AcqDemo surveys.
*
Low contributors tend to leave this organization
0 2012 • 2016
I see myself working at my current organization one year
from now
NOTES: Bars indicate the percentage of employees that agreed or strongly agreed with the statement. The remainder of employees expressed a neutral view, disagreed, or strongly disagreed. * = A statistically significant difference between the two years at the 5-percent level or higher. RANO RR1783-5.1
7 The full set of Liken scale responses, ranging from strongly agree to strongly disagree with a neutral midpoint, is provided in Appendix A.
58 2016 Assessment of the Civilian Acquisition Workforce Personnel Demonstration Project
Effects on Compensation
As explained in Chapter Two, AcqDemo's compensation system is designed to serve the project's goals. The broadbands provide managers with the flexibility to offer competitive starting salaries and opportunities for rapid compensation growth to facilitate the recruiting and retention of talented personnel. Salary increases and bonuses are tied to employee performance to incentivize meaningful contributions to the organization's mission and increase retention among high-performing employees.
To evaluate AcqDemo's impact on compensation, we considered three metrics: starting salaries, salary levels more generally, and the rate of salary growth. Our assessment focused on the following questions:
1 . Are starting salaries in AcqDemo higher or lower than starting salaries in ADEOs in the GS system?
2. More generally, are salaries paid to AcqDemo participants higher or lower than salaries paid to comparable GS employees?
3. Do salaries paid to AcqDemo participants grow at a higher or lower rate than salaries paid to comparable GS employees do?
4. Within AcqDemo, how do salaries and salary growth rates vary with performance?
The three sets of compensation analyses were based on annualized basic pay data contained in the DMDC civilian personnel inventory files. That is, the analyses centered on basic salaries rather than total compensation; bonuses and other one-time payments were not included. Locality pay was also excluded. 8 Salary figures were adjusted for inflation and reported in 2015 dollars.
Starting Salaries
Relative to the GS system, AcqDemo provides managers with greater flexibility to set starting salaries to better attract and retain talent. The flexibility was intended to position AcqDemo to compete more effectively for highly skilled and motivated personnel.
To determine whether starting salaries paid to AcqDemo participants were higher or lower than those paid to comparable GS employees in ADEOs, we analyzed annualized basic pay in the quarter of hire as a function of AcqDemo membership and an array of other characteristics. Because the analysis centered on newly hired employees, we restricted the population to permanent, full-time employees who entered the DoD civilian workforce from December 31, 2010, to September 30, 2015.9 The treatment group consisted of 1,873 employees who entered the DoD civilian workforce as AcqDemo participants; the control group consisted of 31,822 employees
8 The annualized basic pay data include locality pay for employc:c:s on retained pay but exclude locality pay for employees not on retained pay. To account for this anomaly, the regression models used in the analysis of salary levels more generally and the rate of salary growth include an indicator for retained pay status. See Appendix C for more derails. Retained pay sracus was not an issue for the analysis of scarring salaries because che population was restricted to employees who were new to the DoD civilian workforce; transfers across pay plans within the DoD civilian workforce were excluded.
9 The pay-setting flexibility applies to any employee who joins AcqDemo, including those: who join from other OoD pay plans. However, our analysis of starring salaries included only those who joined from outside DoD. There arc two reasons for this. First, the validity of the analysis depends on identifying comparable new hires in GS. If we include within-DoD transfers in the AcqDemo group, then we must also include within-DoD transfers in the control group of employees in GS. Second, many of the transfers into GS come from AcqOemo. Hence, if we were to include within-DoD transfers in our
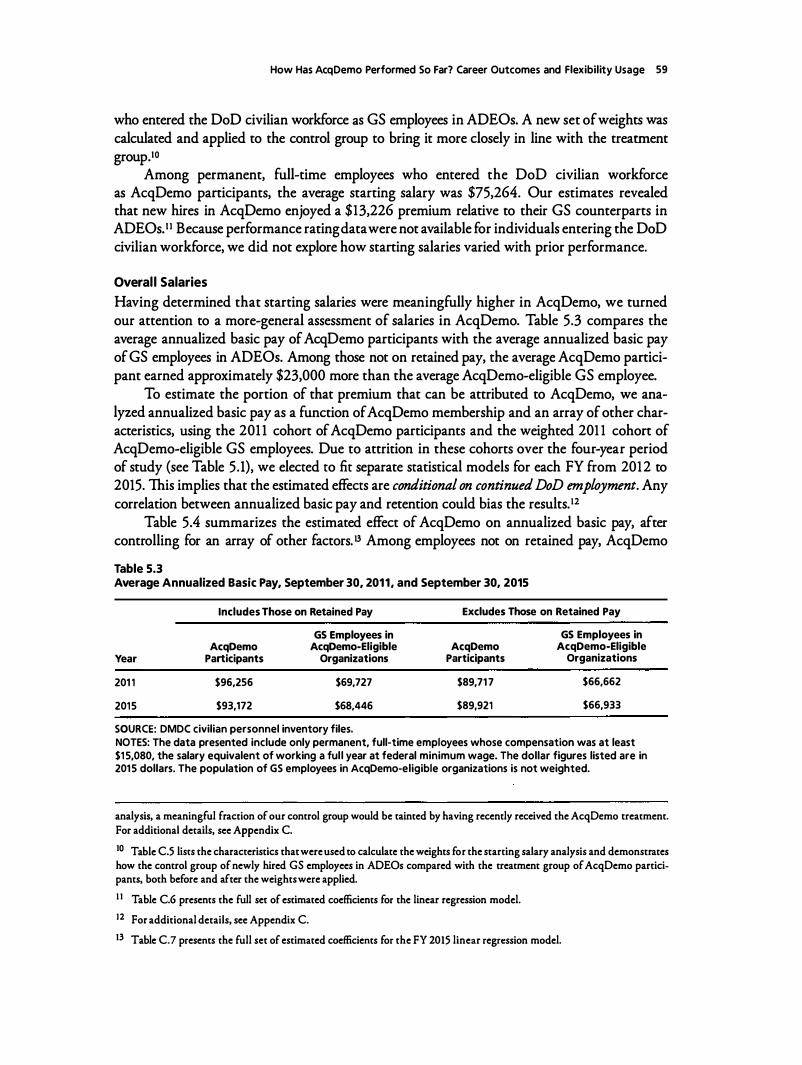
How Has AcqDemo Performed So Far? Career Outcomes and Flexibility Usage 59
who entered the DoD civilian workforce as GS employees in ADEOs. A new set of weights was calculated and applied to the control group to bring it more closely in line with the treatment group.Io
Among permanent, full-time employees who entered the DoD civilian workforce as AcqDemo panicipants, the average starting salary was $75,264. Our estimates revealed that new hires in AcqDemo enjoyed a $13,226 premium relative to their GS counterparts in ADEOs. I I Because performance rating data were not available for individuals entering the DoD civilian workforce, we did not explore how staning salaries varied with prior performance.
Overal l Salaries
Having determined that starting salaries were meaningfully higher in AcqDemo, we turned our attention to a more-general assessment of salaries in AcqDemo. Table 5.3 compares the average annualized basic pay of AcqDemo participants with the average annualized basic pay of GS employees in ADEOs. Among those not on retained pay, the average AcqDemo panicipant earned approximately $23,000 more than the average AcqDemo-eligible GS employee.
To estimate the portion of that premium that can be attributed to AcqDemo, we analyzed annualized basic pay as a function of AcqDemo membership and an array of other characteristics, using the 201 1 cohort of AcqDemo participants and the weighted 201 1 cohon of AcqDemo-eligible GS employees. Due to attrition in these cohorts over the four-year period of study (see Table 5.1), we elected to fit separate statistical models for each FY from 2012 to 2015. This implies that the estimated effects are conditional on continued DoD employment. Any correlation between annualized basic pay and retention could bias the results. I2
Table 5.4 summarizes the estimated effect of AcqDemo on annualized basic pay, after controlling for an array of other factors. I3 Among employees not on retained pay, AcqDemo
Table 5.3 Average Annualized Basic Pay, September 30, 2011, and September 30, 2015
Includes Those on Retained Pay Excludes Those on Retained Pay
GS Employees in GS Employees in AcqDemo AcqDemo-Eligible AcqDemo AcqDemo-Eligible
Year Participants Organizations Participants Organizations
201 1 $96,256 $69,727 $89,717 $66,662
2015 $93,172 $68,446 $89,921 $66,933
SOURCE: DMDC civilian personnel inventory files. NOTES: The data presented include only permanent, full-time employees whose compensation was at least $1 5,080, the salary equivalent of working a ful l year at federal minimum wage. The dollar figures listed are in 2015 dollars. The population of GS employees in AcqDemo-eligible organizations is not weighted.
analysis, a meaningful fraction of our control group would be tainted by having recently received the AcqDcmo treatment. For additional details, see Appendix C.
IO Table C.5 lists the characteristics that were used to calculate the weights for the starting salary analysis and demonstrates how the control group of newly hired GS employees in ADEOs compared with the treatment group of AcqDemo participants, both before and after the weights were applied.
I I Table C.6 presents the full set of estimated coefficients for the linear regression model.
1 2 For additional details, see Appendix C.
I3 Table C.7 presents the full set of estimated coefficients for the FY 2015 linear regression model.

60 2016 Assessment of the Civilian Acquisition Workforce Personnel Demonstration Project
Table 5.4 Effect of AcqDemo Participation on Annualized Basic Pay, September 30, 2011 , Cohorts
Increase in Annualized Basic Pay
For Employees For Employees FY Not on Retained Pay on Retained Pay
2012 $1 ,755 $1 0,124
201 3 $1 ,550 $9,356
2014 $1,609 $8,727
2015 $1 ,796 $8,437
SOURCES: DMDC civilian personnel inventory files; DAWIA personnel files.
NOTES: The data presented include only permanent, full-time employees whose compensation was at least $1 5,080, the salary equivalent of working a full year at federal minimum wage. The dollar figures listed are in 201 5 dollars. The estimates are statistically significant at the 1 -percent level.
participants earned $1,500 to $1,800 more in each year than did comparable GS employees in ADEOs. That is, only a small fraction of the $23,000 premium observed when comparing raw averages can be attributed to AcqDemo; the remainder is due to differences between the two populations. However, among employees who were on retained pay, AcqDemo's effect was much larger: AcqDemo participants earned $8,400 to $10,200 more in each year than did comparable GS employees in ADEOs. 14
Using individual-level data provided by the AcqDemo Program Office, we examined how annualized basic pay among AcqDemo participants varied with performance. For each FY from 2012 to 2014, 'we used a unique statistical model to estimate the effect of a I-point increase in AOCS on annualized basic pay in the following year. Table 5.5 provides a summary of the results. In each of the three years examined, a higher AOCS was associated with higher annualized basic pay, after controlling for an array of other factors. On average, a I-point increase in AOCS raised annualized basic pay by $ISO to $400 in the following year. From this, we conclude that high-performing employees in AcqDemo do earn more than low-performing employees, as intended. Table 5.5 also shows that the salary effect was larger for employees with positive AOCS than for employees with negative AOCS. Among those with AOCS of at least zero, a I-point increase in AOCS raised annualized basic pay by $200 to $450 in the following year, but among those with AOCS less than zero, the increase fell within a $0 to $250 range.
However, the margins are small to moderate. The majority (85 percent to 95 percent) of AcqDemo participants earned a AOCS from zero to +4. After controlling for other factors, the estimated difference in CRI between an employee with a AOCS of zero and an employee with a AOCS of +4 is $900 to $1,800-approximately I percent to 2 percent of average annualized basic pay.
Again, because the available performance rating data for GS employees were too coarse and inconsistent over time, we did not undertake an analogous analysis for AcqDemo-eligible
l4 The share of the AcqOemo workforce on retained pay in FY 201 1 was nearly 12 percent. The corresponding share within GS was nearly 7 percent. By the end of FY 2015, the share of employees on retained pay fel l within both groups, to 6 percent within AcqDemo and to below 4 percent within GS. The greater prevalence of employees on retained pay in FY 201 1 may have been due to the influx of employees from NSPS.

Table 5.5
How Has AcqDemo Performed So Far? Career Outcomes and Flexibility Usage 61
Effect of a 1-Point Increase in AOCS on Annualized Basic Pay in the Following Fiscal Year
FY
2012
2013
2014
Increase in Annualized Basic Pay in the Following FY
All AcqDemo Participants
$375
$360
$1 97
AcqDemo Participants with iiocs ::!: o
$429
$401
$238
AcqDemo Participants with iiocs < o
$104
$240
$33
SOURCES: DMDC civilian personnel inventory files; DAWIA personnel files; administrative data provided by the AcqDemo Program Office.
NOTES: The data presented include only permanent, full-time employees in AcqDemo whose compensation was at least $1 5,080, the salary equivalent of working a full year at federal minimum wage. The figures listed are in 2015 dollars. The estimates are statistically significant at the 1-percent level.
GS employees. Consequently, we cannot make any statements about whether the connection between performance and basic pay is stronger in AcqDemo or in ADEOs in the GS system.
Rate of Salary Growth
Having determined that AcqDemo is associated with both higher starting salaries and higher levels of basic pay, we examined whether AcqDemo is also associated with a higher rate of salary growth. Once again, we tracked the cohort of permanent, full-time employees who were in AcqDemo on September 30, 201 1 . Table 5.6 presents the average annualized growth rates after 12 months, 24 months, 36 months, and 48 months. Over the complete four-year period of observation, the basic pay earned by AcqDemo participants increased at an average annualized rate of 1 .24 percent.
Note that the rates presented in Table 5.6 are conditional on continued DoD employment. As indicated in Table 5 .1 , approximately 22 percent of the 201 1 cohort left the DoD civilian workforce before September 30, 2015. This might explain, in part, why the growth rates listed in Table 5.6 increased over time. In AcqDemo, high-performing employees were rewarded with larger salary increases (see Table 5.5) and were more likely to be retained (see Table 5.2). 15
To estimate AcqDemo's effect on the rate of salary growth, we analyzed annualized percentage growth in basic pay as a function of AcqDemo membership and an array of other characteristics. Separate statistical models were fit for the 12-, 24-, 36-, and 48-month periods to account for attrition in the 201 1 cohorts. Among employees not on retained pay, the difference between the annualized growth rate for AcqDemo participants and the corresponding rate for comparable GS employees in ADEOs was negligible.16 That is, after controlling for other factors, salaries paid to AcqDemo participants were higher than salaries paid to comparable GS
l5 Promotions might also explain the increase in growth rates over time. Nearly 10 percent of the 201 1 AcqDemo cohort experienced at least one promotion during the FY 201 1-FY 2015 period. Promotions arc accompanied by meaningful salary increases and opportunities for rapid salary growth within the new broadband, so they might be driving, in part, the increase in growth rates reported in Table 5.6.
16 The difference is not statistically significant for the 12-, 36-, and 48·month periods. For the 24·month period (i.e., FY 201 1 to FY 2013), the annualized growth rate for AcqDemo participants is 0.27 percentage points lower than the rate for comparable GS employees in ADEOs. However, this estimate is statistically significant only at the 5-percent level. Table C.8 presents the full set of estimated coefficients for the 48·month period.

62 2016 Assessment of the Civilian Acquisition Workforce Personnel Demonstration Project
Table 5.6 Average Annualized Percentage Growth in Basic Pay for AcqDemo Participants, September 30, 2011 , Cohort
Months Since September 30, 2011
12
24
36
48
SOURCE: DMDC civilian personnel inventory files.
Average Annualized Percentage Growth
0.31
0.50
0.73
1 .24
NOTES: The data presented include only permanent, full-time employees in AcqDemo whose compensation was at least $15,080, the salary equivalent of working a full year at federal minimum wage. The averages exclude employees on retained pay, are conditional on continued DoD employment, and are net of inflation.
employees, but there was no meaningful difference between the rate at which salaries paid to AcqDemo participants grew and the rate at which salaries paid to comparable GS employees grew.
As before, we examined how employee performance affected the rate of salary growth within AcqDemo. We found that a 1-point increase in 80CS raised the annualized growth rate by roughly 0.1 to 0.2 percentage points, after controlling for other factors. That is, highperforming employees in AcqDemo saw their salaries increase faster than lower performers did.
AcqDemo Employee Perceptions of Compensation
AcqDemo participants who responded to the AcqDemo survey reported favorable sentiments regarding their compensation. As shown in Figure 5.2, the majority of respondents-around 60 percent-said they were satisfied with their pay, with the proportion not changing significantly between 2012 and 2016. lhe remainder either held a neutral view or indicated that they were not satisfied. The satisfaction expressed by the majority is not surprising, given that the average AcqDemo participant earned about $23,000 more than the average GS employee in an ADEO did. A much smaller share of the survey respondents-around 35 percent-indicated that AcqDemo influenced their satisfaction with their pay. Although this proportion is small, it is a significant improvement over the comparable figure for 2012. These perceptions are also consistent with the administrative data analysis: After controlling for other factors, only a small fraction (less than 10 percent) of the $23,000 premium observed when comparing raw averages could be attributed to AcqDemo.
As shown in Figure 5.3, about 40 percent of respondents indicated that their pay raises depended on their contribution to the mission, which seems a bit low, given that increases in 80CS were associated with both higher salaries and higher rates of salary growth. This figure is lower than comparable figures for other federal demonstration projects but compares favorably to perceptions under the GS system. In their study of the use of performance-based pay systems in the public sector, Schay and Fisher (2013) found that agreement regarding the payperformance link ranged from 54 percent in Year 7 of the CommerceDemo to 66 percent in Years 6 and 7 of DoD Lab Demo. Governmentwide agreement levels were notably lower, at 26 percent in 2008. As explained earlier in this chapter, the administrative data analysis did not offer any insights into whether the connection between contribution and pay was stronger
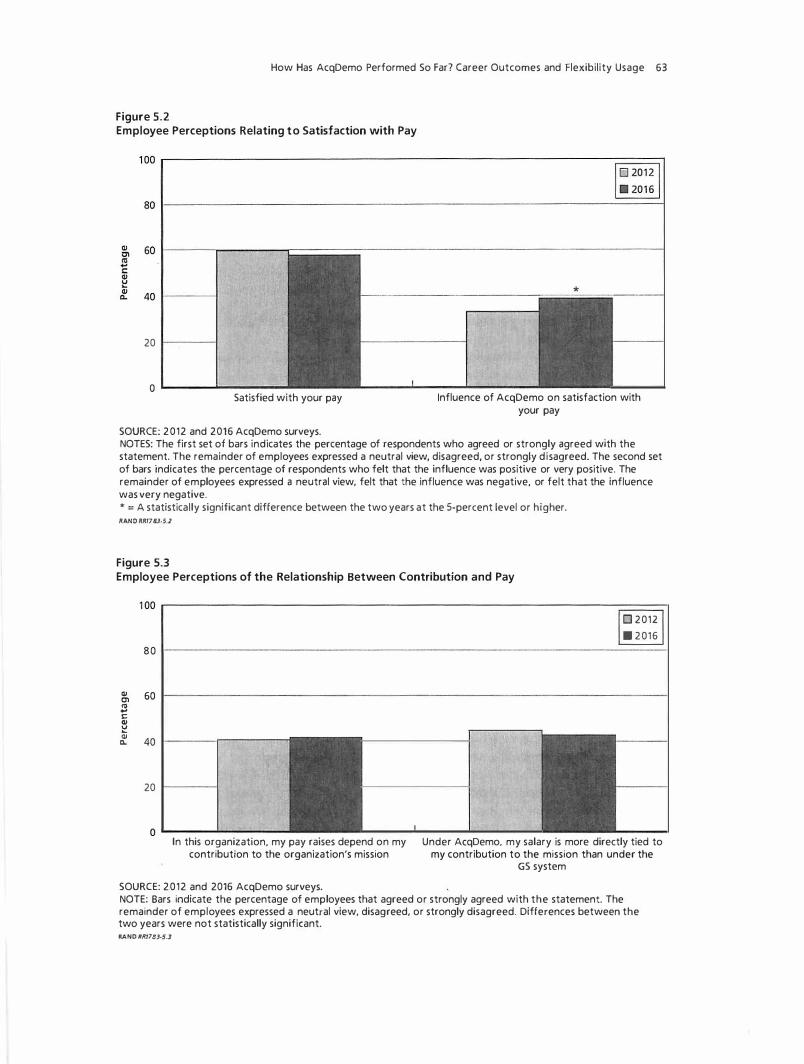
How Has AcqDemo Performed So Far? Career Outcomes and Flexibility Usage 63
Figure 5.2 Employee Perceptions Relating to Satisfaction with Pay
20 1-----1
0 ���-----���� Satisfied with your pay
SOURCE: 2012 and 2016 AcqDemo surveys.
Influence of AcqDemo on satisfaction with your pay
NOTES: The first set of bars indicates the percentage of respondents who agreed or strongly agreed with the statement. The remainder of employees expressed a neutral view, disagreed, or strongly disagreed. The second set of bars indicates the percentage of respondents who felt that the influence was positive or very positive. The remainder of employees expressed a neutral view, felt that the influence was negative, or felt that the influence was very negative. * = A statistically significant difference between the two years at the 5-percent level or higher. RAND RRl783·S.2
Figure 5.3 Employee Perceptions of the Relationship Between Contribution and Pay
0 2012 • 2016
80 ·�-------------------------------------!
� 60 !----------------------------------------! "' .. c: � 8!. 40 ·-----..------
20 J------1
In this organization, my pay raises depend on my contribution to the organization's mission
SOURCE: 2012 and 2016 AcqDemo surveys.
Under AcqDemo, my salary is more directly tied to my contribution to the mission than under the
GS system
NOTE: Bars indicate the percentage of employees that agreed or strongly agreed with the statement. The remainder of employees expressed a neutral view, disagreed, or strongly disagreed. Differences between the two years were not statistically significant. RAND RR,783·5.J

64 2016 Assessment of the Civilian Acquisition Workforce Personnel Demonstration Project
under AcqDemo or under the GS system. Nevertheless, it is worth noting that 40 percent of respondents agreed that their salaries were more closely tied to contribution under AcqDemo.
Effects on Promotion
One of AcqDemo's central tenets is that employees should be appropriately rewarded for their contributions to organizational mission. Rewards can take several forms, including salary increases, bonuses, and promotions. This section centers on AcqDemo's effects on the frequency of promotions. Our assessment addresses the following questions:
1 . Are AcqDemo participants more or less likely to be promoted than their counterparts in the GS system?
2. How does the likelihood of promotion vary with career path and broadband? 3. How does the likelihood of promotion vary with performance within AcqDemo?
Because each of AcqDemo's broadbands corresponds to two or more GS grades (see Chapter Two, Figure 2.1), promotions occurred at least twice as often in GS. For instance, a program manager (DoD occupation code 0340) ascending from the GS-14 to the GS-15 level would earn a promotion in the GS system but not in AcqDemo because the NH-4 broadband encompasses both grades. We corrected for this problem by assigning a "shadow AcqDemo career path and broadband" to each GS employee in an ADEO and crediting a promotion only when the employee moved to a higher career path within a broadband or a higher broadband within a career path. 17 In this way, we brought the definition of promotion within the GS control group in line with the definition of promotion within AcqDemo.
Like the retention, salary level, and salary growth analyses, our analysis of promotion made use of the 201 1 cohorts. However, the data were further restricted in two ways to address _issues specific to the promotion analysis. First, we excluded any AcqDemo employee in the NH-4 broadband and any GS employee in the shadow NH-4 broadband. Because the NH-4 broadband is at the top of the AcqDemo scale, NH-4 and shadow NH-4 employees are effectively ineligible for promotion. Second, we excluded any employee who appeared to have experienced one or more demotions during the four years that elapsed between September 30, 201 1, and September 30, 2015. These demotions were frequently followed by promotions and, as such, were likely due to a reorganization or downsizing, rather than employee performance. The two exclusions left us with 8,738 AcqDemo participants and 1 15,759 GS employees. Using this data set, we constructed a new set of weights for the control group.18
To estimate the effect of AcqDemo participation on the likelihood of promotion, we analyzed the number of promotions that occurred during the four-year period of observation as a function of AcqDemo participation and an array of other factors. We found that AcqDemo participants experienced 23. l percent fewer promotions than did comparable GS employees
17 For details on how the shadow career paths and broadbands were assigned, see Appendix C.
18 Table C.9 lists the characteristics used to calculate the weights for the promotion analysis and demonstrates how the control group of GS employees in ADEOs compared with the treatment group of AcqDemo participants, both before and after the weights were applied.

How Has AcqDemo Performed So Far? Career Outcomes and Flexibility Usage 65
in ADEOs.19 However, because promotions (as defined in AcqDemo) were uncommon during the four-year period, the estimated effect is not as large as it might seem. For the average employee, AcqDemo participation reduced the probability of promotion from about 19 percent to about 14 percent.
To explain the promotion disparity between AcqDemo and the GS system, the AcqDemo Program Office reported that entering organizations may elect to delay the entry of GS employees in "career ladder positions" until those employees reach the highest grade in their ladders. Career ladder positions are intended for entry-level GS employees and are developmental in nature. They facilitate rapid movement up the ranks: A GS employee in a career ladder position can move up two or more complete GS grades within a single year. The hypothesis is that the nonrandom exclusion of career ladder employees from AcqDemo introduced a bias that magnified the estimated disparity in promotion rates between AcqDemo and the GS system. Because we could not identify which GS employees experienced delayed entry into AcqDemo because of career ladder considerations, we could neither confirm nor reject this hypothesis.
To assess AcqDemo's effect on promotion by career path, we repeated the analysis for NH employees, NJ employees, and NK employees. The results for the NH career path were consistent with the results for the full sample: AcqDemo employees on the NH career path experienced 24.4 percent fewer promotions than did comparable GS employees with a shadow AcqDemo career path of NH. We were not able to obtain reliable estimates of AcqDemo's effect on promotion for the NJ or NK career paths because of the small number of employees in each group.
We also examined how promotion rates varied with career path and broadband within AcqDemo. Among permanent, full-time employees who were in AcqDemo on September 30, 201 1, 14 percent of NH employees (excluding NH-4), 12 percent of NJ employees, and 15 percent of NK employees experienced at least one promotion during the four-year period of observation. These rates were not adjusted to account for differences across the three subpopulations.
Within each career path, we applied statistical techniques to estimate the effect of broadband on the odds of experiencing at least one promotion, while controlling for other factors. As before, we were able to obtain reliable �stimates for only the NH career path; there were too few employees in the NJ and NK career paths to detect promotion differences across broadbands. Table 5.7 presents the results for the NH career path. In every year from FY 2012 to FY 2015, being an NH-3 employee, rather than an NH-1 or NH-2 employee, reduced the probability of promotion in the following year by 9 to 14 percentage points.20 Table 5.8 provides some context for this estimate. The numbers of promotions experienced by NH-2 and NH-3 employees are roughly comparable in each of the four years. However, the total numbers of NH-2 and NH-3 employees are vastly different: NH-3 employees outnumber NH-2 employees at a rate of about six to one. Hence, on a per-capita basis, promotions are much more common among NH-2 employees.
As in the previous sections, we also examined the effect of performance as measured by ilOCS. Statistical techniques were applied to estimate the effect of a I-point increase in ilOCS
19 Table C.10 presents the full set of estimated coefficients for the Poisson regression model. We also fit a Poisson regression model with exposure (or offset) to address attrition within the 20I I cohorts. The results of the Poisson regression with exposure did not differ meaningfully from the results of the standard Poisson regression.
20 NH-I and NH-2 employees were grouped together because there were fewer than five NH-I employees in any given year.

66 201 6 Assessment of the Civilian Acquisition Workforce Personnel Demonstration Project
Table 5.7 Effect of Broadband on Promotion Within the NH Career Path
FY
2012
2013
2014
2015
Change Due to Being an NH-3 Employee Instead of an N H-1 or NH-2 Employee
Percentage Change in the Odds of Promotion
-98.6
-99.3
-98.4
-98.7
Average Change in the Probability of Promotion
-13 .8
-12.5
-9.6
-1 1 .0
SOURCES: DMDC civilian personnel inventory files; DAWIA personnel files; administrative data provided by the AcqDemo Program Office.
NOTES: The data presented include only permanent, full-time employees in AcqDemo who were NH-1, N H -2, or NH-3 employees and whose compensation was at least $15,080, the salary equivalent of working a full yea r at federal minimum wage. The estimates are statistically significant at the 1 -percent level.
Table 5.8 Promotions Among NH-2 and NH-3 Employees
FY
2012
2013
2014
2015
Number of Promotions
NH-2 Employees
214
146
89
87
NH-3 Employees
143
1 1 6
88
1 30
Promotions per Capita
N H-2 Employees
0.145
0.129
0.1 00
0.120
N H-3 Employees
0.022
0.0 19
0.016
0.026
SOURCES: DMDC civilian personnel inventory files; administrative data provided by the AcqDemo Program Office.
NOTE: The data presented include only permanent, ful l-time employees in AcqDemo whose compensation was at least $1 5,080, the salary equivalent of working a full year at federal minimum wage.
in a given year on the odds of receiving a promotion in the following year. Table 5.9 provides a summary of the results. After controlling for an array of factors, we found that a I-point increase in 80CS improved the odds of promotion in the following year by 31 percent to 44 percent. While this might seem like a large effect, the corresponding increase in the probability of promotion is quite small: For the average AcqDemo participant, a 1-point increase in 80CS raised the probability of promotion in the following year by less than 1 percentage point. Nevertheless, the effect was statistically significant, and accordingly, we conclude that AcqDemo promotes high-performing employees at a higher rate and low-performing employees at a lower rate. Due to the poor quality of the available performance rating data for GS employees, we cannot make any statements about whether the GS system is more or less likely than AcqDemo to promote high-performing employees.
The sentiments expressed by respondents to the AcqDemo survey were generally consistent with the promotion effects estimated using administrative data. Figure 5.4 indicates that only 25 percent to 30 percent of the survey respondents felt satisfied with their opportunities for promotion. This is not surprising, given that only 14 percent of the 201 1 AcqDemo cohort

Table 5.9
How Has AcqDemo Performed So Far? Career Outcomes and Flexibility Usage 67
Effect of a 1-Point Increase in �OCS on Promotion in the Following Fiscal Year
Change Due to a 1-Point Increase in dOCS
FY
2012
2013
2014
Percentage Change in the Odds of Promotion
31 .5
43.7
42.2
Average Change in the Probability of Promotion
< 0.1
< 0.1
< 0.1
SOURCES: DMDC civilian personnel inventory files; DAWIA personnel files; administrative data provided by the AcqDemo Program Office.
NOTES: The data presented include only permanent, full-time employees in AcqDemo whose compensation was at least $15,080, the salary equivalent of working a full year at federal minimum wage. The estimates are statistically significant at the 1 -percent level.
(excluding NH-4) experienced one or more promotions during the four-year period of observation, and fewer than 2 percent of those experienced more than one promotion. Figure 5.4 also shows that even fewer survey respondents reported positive sentiments regarding AcqDemo's influence on their promotion opportunities. This may be due, in part, to the difference in the definition of promotion between AcqDemo and the GS system. However, it may also be due to promotions being less common within AcqDemo, even after normalizing the number of promotions within the weighted control group of GS employees in ADEOs.
Career Outcomes for Subgroups of Interest
In this section, we address a final set of questions regarding each of the career outcomes examined earlier in this chapter: Are there particular groups that exhibit markedly different career progressions? Using administrative data from the DMDC civilian personnel inventory and transaction files, we examined the retention, compensation, and promotion outcomes of bargaining unit employees, AW members, supervisors, and veterans. Whenever possible, we compared the estimated outcomes with perceptions reported in the 2012 and 2016 AcqDemo surveys. Chapter Six presents parallel analyses by race or ethnicity and gender.
Bargaining Unit Employees
As shown in Chapter Three, Table 3.2, only 10 percent of AcqDemo participants are members of a bargaining unit. In contrast, 62 percent of GS employees in ADEOs are in a bargaining unit. This section presents our assessment of AcqDemo's effects on the career outcomes of unionized employees. We begin by comparing the career outcomes of unionized employees in AcqDemo with those of unionized GS employees in ADEOs. Next, we compare the career outcomes of unionized and nonunionized employees within AcqDemo and assess any disparities in relation to analogous disparities exhibited within ADEOs in the GS system. Finally, we describe how satisfaction with career outcomes varied with union membership within AcqDemo.

68 2016 Assessment of the Civilian Acquisition Workforce Personnel Demonstration Project
Figure 5.4 Employee Perceptions of AcqDemo Promotion Outcomes
QI Cl � c: QI � QI 0..
20 1----l
o ----------Satisfied with opportunities
for promotion
SOURCE: 2012 and 2016 AcqDemo surveys.
Influence of AcqDemo on satisfaction with opportunities for promotion
NOTE: The first set of bars indicates the percentage of respondents who agreed or strongly agreed with the statement. The remainder of employees expressed a neutral view, disagreed, or strongly disagreed. The second set of bars indicates the percentage of respondents who felt that the influence was positive or very positive. The remainder of employees expressed a neutral view, felt that the influence was negative, or felt that the influence was very negative. Differences between the two years were not statistically significant. RAND RRI 78J·S.4
Comparison of Unionized Employees in the GS System This section compares the career outcomes of unionized employees in AcqDemo with those of unionized GS employees in ADEOs. The methods used here were analogous co the methods described earlier in this chapter. Most of che analyses operated on che 201 1 cohort of unionized AcqDemo employees and the corresponding cohort of unionized GS employees in ADEOs.21 A new set of weights was calculated and applied co the cohort of unionized GS employees co make chis group more similar co the cohort of unionized AcqDemo employees along an array of immutable or preexisting characteristics.
The four-year retention rate for bargaining unit employees i n AcqDemo was 80.3 percent. The corresponding race for the weigh red GS control group was 78.5 percent, and the difference in races between che two groups was not scaciscically significant. That is, there is no evidence chat union members in AcqDemo were any more or less likely to remain in che DoD civilian workforce relative to comparable union members in the GS system.
21 As nored in our earlier assessmenr (Werber er al., 2012), AcqDemo supported a sizable population of bargaining unir employees during rhe FY 2008-FY 2011 period. Our analysis of bargaining unir employees did nor reach rhac far back for
a number of reasons. First, comparing unionized and nonunionized employees wirhin AcqDemo requires char a meaningful population of nonunionized employees exist within AcqDemo. There was no such population during the FY 2008-FY 2011 period. Second, rhere were benefits ro rhe consistency inherenr in using the 2011 cohorts across all three analyses: the comparison of unionized employees in AcqDemo to unionized employees in GS, the comparison of unionized and nonunionized employees in AcqDemo, and rhe comparison of employees in AcqDemo {unionized and nonunionized) ro employees in GS {unionized and nonunionized). f-or example, when comparing outcomes in AcqDemo ro outcomes in GS, using rhe 2011 cohom for boch the bargaining unit analysis and the full sample analysis provided greater visibility inro whether trends wirhin che bargaining unit subgroup were driven by (or consiscenr wirh) trends in the population at large.

How Has AcqDemo Performed So Far? Career Outcomes and Flexibility Usage 69
For our" analysis of starting salaries, we moved away from the 201 1 cohorts and, instead, examined bargaining unit employees who entered the DoD civilian workforce between December 31, 2010, and September 30, 2015. After controlling for an array of factors, we found that starting salaries were $12,414 higher for unionized AcqDemo employees than for unionized GS employees in ADEOs. To assess AcqDemo's effect on salary levels more broadly, we returned to comparing the 201 1 cohort of unionized AcqDemo employees to the weighted 201 1 cohort of unionized GS employees in ADEOs. We found that among union members not on retained pay, annualized basic pay in AcqDemo was $700 to $1,400 higher, after controlling for other factors. Having determined that AcqDemo was associated with both higher starting salaries and higher levels of basic pay, we examined whether AcqDemo also affected the rate at which basic pay grows over time. We found that, among employees not on retained pay, there was no
. statistically significant difference between the rate of salary growth for unionized AcqDemo employees and the rate for unionized GS employees in ADEOs, after controlling for other factors.
The last career outcome we examined was promotion. As explained earlier in this chapter, each GS employee in an ADEO was assigned a "shadow AcqDemo career path and broadband" to bring the definition of promotion within the GS control group in line with the definition of promotion within AcqDemo. NH-4 and shadow NH-4 employees were excluded from the data set because they were effectively ineligible for promotion. Because of the small number of employees remaining in the data set, we were not able to obtain reliable estimates of AcqDemo's effect on promotion for bargaining unit employees.
Table 5 . 10 summarizes our comparison of the career outcomes of unionized AcqDemo participants to those of unionized GS employees in ADEOs. The results are favorable for bargaining unit employees in AcqDemo. AcqDemo paid higher starting salaries and higher salaries in general. There was no statistically significant difference in salary growth or retention between the two groups.
Table 5.10 Career Outcomes of Unionized Employees in AcqDemo Relative to Those of Unionized Employees in the GS System, September 30, 2011, Cohorts
Career Outcome
Retention
Starting salary
Salary level
Salary growth
Promotion
Comparison to a Weighted Control Group of Unionized GS Employees in AcqDemo-Eligible Organizations
No statistically significant difference
$12,414 higher in AcqDemo
$700 to $1,400 higher in AcqDemo
No statistically significant difference
N/A
SOURCES: DMDC civilian personnel inventory and transaction files; DAWIA personnel files.
NOTES: The data presented include only permanent, full-time employees in AcqDemo whose compensation was at least $15,080, the salary equivalent of working a full year at federal minimum wage. The dollar figures listed are in 2015 dollars. The starting salary estimate is based on the population of employees who were newly hired in FY 201 1 to FY 2015, rather than the September 30, 201 1 , cohort. The estimates for salary level and salary growth exclude employees on retained pay and are conditional on continued DoD employment. All estimates are statistically significant at the 1-percent level.

70 201 6 Assessment of the Civi lian Acquisition Workforce Personnel Demonstration Project
Comparison of Nonunionized Employees in AcqDemo
This section compares the career outcomes of unionized and nonunionized employees within AcqDemo. The analyses in this section were executed by reestimating the regression models for the full-sample analyses described earlier in this chapter after including the interaction of the AcqDemo and bargaining unit indicators. For more information on this approach, see Appendix C.
The retention analysis centered on estimating the effect of union membership on the hazard of separation. The hazard of separation is the probability that an employee leaves the DoD civilian workforce at a particular point in time given that the employee has not already left. Our estimates indicate that the hazard of separation was 1 1 .7 percent lower for unionized AcqDemo employees than for nonunionized AcqDemo employees, after controlling for other factors. For the average AcqDemo participant, this amounts to an increase of about 2 percentage points in the four-year retention rate. A similar disparity appeared among comparable GS employees in ADEOs.
As before, the compensation analyses examined starting salaries, salary levels more generally, and the rate of salary growth over the four FYs in the observation period. After controlling for other factors, we found no statistically significant difference in starting salaries between unionized and nonunionized employees in AcqDemo. The same pattern was present within ADEOs in the GS system. In addition, overall salaries were essentially the same for unionized and nonunionized employees in AcqDemo: Among employees not on retained pay, there were no statistically significant differences in any of the four years. The same pattern was present within ADEOs in the GS system. Our analysis did reveal a difference in salary growth rates. Among AcqDemo participants who were not on retained pay, the annualized rate of salary growth over the four-year period of observation was 0.30 percentage points higher for unionized employees than for nonunionized employees. However, within ADEOs in the GS system, there was no such disparity.
Unionized employees in AcqDemo fared quite well in terms of promotion. Our estimates revealed that, after controlling for other factors, the number of promotions earned by unionized AcqDemo participants was 7.4 percent higher than the number of promotions earned by nonunionized AcqDemo participants. This means that for the average AcqDemo employee, union membership raised the probability of promotion by about 1 percentage point. Within ADEOs in the GS system, however, unionized employees experienced 22.0 percent fewer promotions than nonunionized employees did. This amounts to a decrease in the probability of promotion of about 4 percentage points.
Table 5.1 1 summarizes our comparison of the career outcomes of unionized and nonunionized employees in AcqDemo. It also presents our assessment of how the disparities within AcqDemo compare to analogous disparities within ADEOs in the GS system. Once again, the results are favorable for bargaining unit employees in AcqDemo. There were no discernible differences in starting salaries or overall salaries between unionized and nonunionized employees within AcqDemo, and the same patterns were present within ADEOs in the GS system. Salary growth, promotion, and retention were measurably better for unionized employees within AcqDemo. An analogous disparity in retention was present within ADEOs in the GS system, but this was not the case with respect to the salary growth and promotion disparities. Interestingly, while unionized AcqDemo employees were more likely than their nonuni�nized counterparts to receive a promotion, unionized GS employees in ADEOs were less likely than their nonunionized counterparts to be promoted.

Table 5.11
How Has AcqDemo Performed So Far? Career Outcomes and Flexibi l ity Usage 71
Career Outcomes of Unionized Employees in AcqDemo Relative to Those of Nonunionized Employees in AcqDemo, September 30, 201 1, Cohort
Career Outcome
Retention
Starting salary
Salary level
Salary growth
Promotion
Outcome for Unionized Employees in AcqDemo Relative to Outcome for
Nonunionized Employees in AcqDemo
Four-year retention rate was 2.2 percentage points higher
No statistically significant difference
No statistically significant difference
Annualized growth rate over the four-year period was 0.30 percentage points higher
Number of promotions was 7.4 percent higher
Disparity in AcqDemo Relative to Disparity in AcqDemo-Eligible Organizations in the GS System
No statistically significant difference
No statistically significant difference
No statistically significant difference
Gap between nonunionized and unionized employees was larger
in AcqDemo
Gap between nonunionized and unionized employees was larger
in AcqDemo
SOURCES: DMDC civilian personnel inventory and transaction files; DAWIA personnel files.
NOTES: The data presented include only permanent, full-time employees in AcqDemo whose compensation was at least $1 5,080, the salary equivalent of working a full year at federal minimum wage. The dollar figures listed are in 2015 dollars. The starting salary estimate is based on the population of employees who were newly hired between FY 201 1 and FY 201 5, rather than the September 30, 201 1 , cohort. The estimates for salary level and salary growth exclude employees on retained pay and are conditional on continued DoD employment. For the full set of estimated coefficients, see Appendix C, Tables C.13 to C.17.
Perceptions of Career Outcomes by Union Membership
In this section, we leverage data collected in the 2012 and 2016 AcqDemo surveys to describe how satisfaction with career outcomes varied with union membership within AcqDemo. Whenever possible, we compare the perceptions reported in the survey with the outcomes estimated using administrative data. Where perceptions and realities do not align-and particularly where perceptions are more negative than the reality-there may be opportunities for AcqDemo to improve its communication regarding career outcomes and potentially counteract these negative perceptions.
The 2012 and 2016 AcqDemo surveys included questions about retention, pay and promotion opportunities, and AcqDemo's influence on pay and promotion opportunities. After controlling for a number of factors, sentiment regarding satisfaction with promotion opportunities was more positive among unionized respondents than among nonunionized respondents in 2012, but not in 2016. Unionized and nonunionized respondents were equally likely to report positive sentiments regarding AcqDemo's influence on satisfaction with their promotion opportunities, and the share of respondents who did so was quite low {less than 20 percent). These perceptions are not entirely consistent with our estimates of actual promotion outcomes. Within AcqDemo, promotions were more prevalent among unionized employees than among nonunionized employees, while within ADEOs in the GS system, promotions were less prevalent among unionized employees than among nonunionized employees. One is left wondering whether the disparity between perception and reality is rooted in the difference in promotion definitions across the two pay systems.
After controlling for a number of factors, unionized and nonunionized respondents were equally likely to report satisfaction with their pay or positive sentiments about AcqDemo's influence on satisfaction with their pay. These perceptions more closely align with our esti-
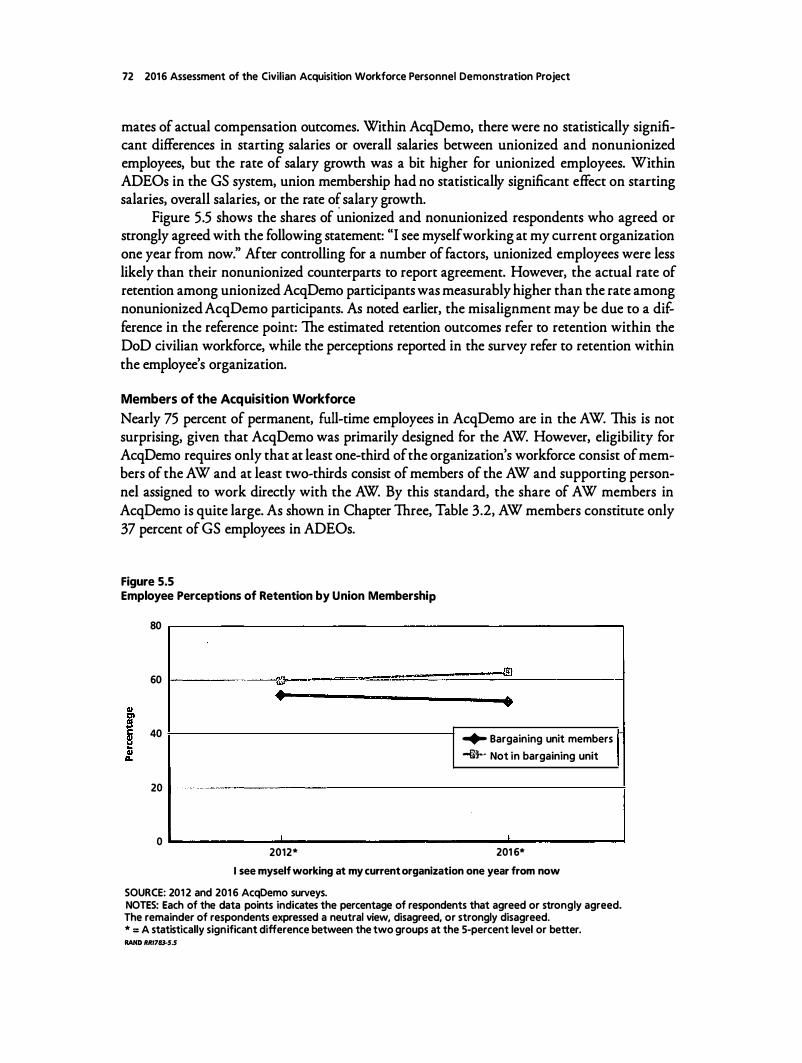
72 2016 Assessment of the Civilian Acquisition Workforce Personnel Demonstration Project
mates of actual compensation outcomes. Within AcqDemo, there were no statistically significant differences in starting salaries or overall salaries between unionized and nonunionized employees, but the rate of salary growth was a bit higher for unionized employees. Within ADEOs in the GS system, union membership had no statistically significant effect on starting salaries, overall salaries, or the rate o� salary growth.
Figure S.S shows the shares of unionized and nonunionized respondents who agreed or strongly agreed with the following statement: "I see myself working at my current organization one year from now." After controlling for a number of factors, unionized employees were less likely than their nonunionized counterparts to report agreement. However, the actual rate of retention among unionized AcqDemo participants was measurably higher than the rate among nonunionized AcqDemo participants. As noted earlier, the misalignment may be due to a difference in the reference point: The estimated retention outcomes refer to retention within the DoD civilian workforce, while the perceptions reported in the survey refer to retention within the employee's organization.
Members of the Acquisition Workforce
Nearly 75 percent of permanent, full-time employees in AcqDemo are in the AW. This is not surprising, given that AcqDemo was primarily designed for the AW. However, eligibility for AcqDemo requires only that at least one-third of the organization's workforce consist of members of the AW and at least two-thirds consist of members of the AW and supporting personnel assigned to work directly with the AW. By this standard, the share of AW members in AcqDemo is quite large. As shown in Chapter Three, Table 3.2, AW members constitute only 37 percent of GS employees in ADEOs.
Figure 5.5 Employee Perceptions of Retention by Union Membership
80
60 -� - [ID
• •
40 .... Bargaining unit members
--«'.}-- Not in bargaining unit
20 -·
0 I I
2012* 201 6*
I see myself working at my current organization one year from now
SOURCE: 2012 and 201 6 AcqDemo surveys. NOTES: Each of the data points indicates the percentage of respondents that agreed or strongly agreed. The remainder of respondents expressed a neutral view, disagreed, or strongly disagreed. * = A statistically significant difference between the two groups at the 5-percent level or better. RAND RR1783-5.5

How Has AcqDemo Performed So Far? Career Outcomes and Flexibility Usage 73
This section presents our assessment of AcqDemo' s effects on the career outcomes of employees in the AW. Using administrative data from the DMDC civilian personnel files, we compare the career outcomes of AW members in AcqDemo with the career outcomes of comparable AW members in ADEOs in the GS system. We do not compare the career outcomes of AW and non-AW members, and we do not describe how satisfaction with career outcomes varies with membership in the AW. The latter is due to an issue with survey data. While the survey did ask respondents to identify whether or not they were part of the AW, about 15 percent noted that they were not sure whether they were in the AW, which cast doubt on the reliability of the other responses to the same question.
Comparison to Acquisition Workforce Members in the GS System
The four-year retention rate for AW members in AcqDemo was 79.7 percent. The corresponding rate for the weighted control group of AW employees in the GS system was 78.7 percent, and the difference in rates between the two groups was not statistically significant. This means that there is no evidence that AW members in AcqDemo were any more or less likely than comparable AW members in the GS system to leave the DoD civilian workforce.
When examining newly hired members of the AW, we found that, after controlling for other factors, starting salaries were $14,257 higher for AW members in AcqDemo than for AW members in the GS system. When examining salary levels more generally, we found that among AW members not on retained pay, annualized basic pay was $1 ,000 to $1 ,800 higher in AcqDemo. The project also raised salary growth rates, but the effect was weak. The annualized rate of salary growth over the four-year period of observation was 0.12 percentage points higher in AcqDemo than in ADEOs in the GS system, with statistical significance at only the 5-percent level.
The final career outcome we examined was promotion. After controlling for an array of other factors, AW members in AcqDemo experienced 24.8 percent fewer promotions than did AW members in the GS system. This means that for the average AW member, AcqDemo participation reduced the probability of promotion from about 19 percent to about 14 percent. This estimate is consistent with the promotion disparity estimated for the AcqDemo population at large.
Table 5.12 summarizes our comparison of the career outcomes of AW members in AcqDemo to those of AW members in the GS system. The results are mixed. Overall, AcqDemo paid higher starting salaries and higher salaries. In addition, salaries increased at higher rates among AW members in AcqDemo than among comparable AW members in the GS system; however, this result was weak from a statistical perspective. AW members in AcqDemo experienced fewer promotions than did AW members in the GS system, but there was no statistically significant difference in retention across the two groups.
Supervisors
As noted in Chapter Three, the AcqDemo workforce was relatively senior, with 23 percent of AcqDemo participants in supervisory positions. Among GS employees in ADEOs, supervisors make up only 13 percent of the workforce. This section presents our assessment of AcqDemo's effect on the career outcomes of supervisors. Using administrative data from the DMDC civilian personnel files, we compared the career outcomes of supervisors in AcqDemo with the career outcomes of comparable supervisors in ADEOs in the GS system. We did not compare the career outcomes of supervisors and nonsupervisors. However, we did leverage data col-

74 201 6 Assessment of the Civilian Acquisition Workforce Personnel Demonstration Project
Table 5.12 Career Outcomes of AW Members in AcqDemo Relative to Those of AW Members in the GS System, September 30, 2011, Cohort
Career Outcome
Retention
Starting salary
Salary level
Salary growth
Promotion
Comparison to a Weighted Control Group of AW Members in AcqDemo-Eligible Organizations in the GS System
No statistically significant difference
$14,257 higher in AcqDemo
$1 ,000 to $1,800 higher in AcqDemo
0.12 percentage points higher in AcqDemo
24.8 percent fewer promotions in AcqDemo
SOURCES: DMDC civilian personnel inventory and transaction files; DAWIA personnel files.
NOTES: The data presented include only permanent, full-time employees in AcqDemo whose compensation was at least $1 5,080, the salary equivalent of working a full year at federal minimum wage. The dollar figures listed are in 201 5 dollars. The starting salary estimate is based on the population of employees who were newly hired in FY 201 1 to FY 201 5, rather than the September 30, 201 1 , cohort. The estimates for salary level and salary growth exclude employees on retained pay and are conditional on continued DoD employment. All estimates are statistically significant at the 1 -percent level, except the salary growth estimate, which is significant at the 5-percent level.
lected by the AcqDemo survey to examine how satisfaction with career outcomes varied with supervisory status within AcqDemo.
Comparison to Supervisors in the GS System
The four-year retention rate for supervisors in AcqDemo was 75.5 percent. The corresponding rate for the weighted control group of GS supervisors in ADEOs was 71.4 percent, and the difference in rates was statistically significant at the 5-percent level. That is, supervisors in AcqDemo were less likely to leave the DoD civilian workforce than were supervisors in the GS system.
When examining newly hired supervisors, we found that starting salaries were $ 12,079 higher for supervisors in AcqDemo than for supervisors in the GS system, after controlling for other factors. When examining salary levels more generally, we found that among supervisors not on retained pay, annualized basic pay was $2,000 to $2,900 higher in AcqDemo. The rate at which basic pay grew was also higher in AcqDemo. Among supervisors not on retained pay, the annualized rate of salary growth over the four-year period of observation was 0.34 percentage points higher in AcqDemo than in ADEOs in the GS system, after controlling for other factors.
The last career outcome we examined was promotion. As explained earlier in this chapter, NH-4 and shadow NH-4 employees were excluded from the data set because they were effectively ineligible for promotion. Due to the small number of employees remaining in the data set, we were not able to obtain reliable estimates of AcqDemo's effect on promotion for supervisors.
Table 5.13 summarizes our comparison of the career outcomes of supervisors in AcqDemo to those of supervisors in ADEOs in the GS system. The results are favorable for supervisors in AcqDemo. AcqDemo paid higher starting salaries and higher salaries in general. In addition, salaries rose faster for supervisors in AcqDemo than for GS supervisors in ADEOs, and supervisors in AcqDemo were more likely to remain within the DoD civilian workforce.

Table 5.13
How Has AcqDemo Performed So Far? Career Outcomes and Flexibility Usage 75
Career Outcomes of Supervisors in AcqDemo Relative to Those of Supervisors in the GS System, September 30, 2011 , Cohort
Career Outcome
Retention
Starting salary
Salary level
Salary growth
Promotion
Comparison to a Weighted Control Group of Supervisors in AcqDemo-Eligible Organizations in the GS System
Four-year retention rate was 4.1 percentage points higher in AcqDemo
$12,079 higher in AcqDemo
$2,000 and $2,900 higher in AcqDemo
0.34 percentage points higher in AcqDemo
N/A
SOURCES: DMDC civilian personnel inventory and transaction files; DAWIA personnel files.
NOTES: The data presented include only permanent, full-time employees in AcqDemo whose compensation was at least $15,080, the salary equivalent of working a full year at federal minimum wage. The dollar figures listed are in 201 5 dollars. The starting salary estimate is based on the population of employees who were newly hired in FY 2011 to FY 2015, rather than the September 30, 201 1 , cohort. The estimates for salary level and salary growth exclude employees on retained pay and are conditional on continued DoD employment. All estimates are statistically significant at the 1-percent level, except for the retention estimate, which was statistically significant at the 5-percent level.
Perceptions of Career Outcomes by Supervisory Status
Supervisors in AcqDemo reported high levels of satisfaction with their pay. Nearly 70 percent of survey respondents who were supervisors indicated that they were satisfied with their pay, and nearly 50 percent of supervisors reported positive sentiments regarding AcqDemo's influence on pay satisfaction. These sentiments are consistent with the estimated career outcomes presented in Table 5.13: Supervisors in AcqDemo experienced higher starting_ salaries, higher overall salaries, and higher rates of salary growth than did comparable GS supervisors in ADEOs.
The survey results also indicated that supervisors' sentiments with regard to their promotion opportunities were moderate. Approximately 40 percent of respondents who were supervisors agreed or strongly agreed that they were satisfied with their promotion opportunities; the remainder expressed a neutral view, disagreed, or strongly disagreed. As shown in Figure 5.6, the share of nonsupervisors who reported agreement was much lower, at about 25 percent. The disparity between the responses of supervisors and nonsupervisors seems to be at odds with the empirical reality presented in Tables 5.7 and 5.8, which show that the likelihood of promotion is much higher among NH-2 employees than among NH-3 employees. Approximately 20 percent of respondents who were supervisors reported positive sentiments regarding AcqDemo's influence on satisfaction with their promotion opportunities. This share is quite a bit lower than the 40 percent who reported that they were satisfied with their promotion opportunities.
Lastly, 68 percent of AcqDemo supervisors reported that they saw themselves working at their current organization in a year. This figure is roughly consistent with the observed retention rate for supervisors in AcqDemo (75.5 percent after four years). However, as explained earlier in this chapter, the survey item and the retention rates estimated using administrative data are not well aligned: The estimated rates refer to retention within the DoD civilian workforce, while the perceptions reported in the survey refer to retention within the employee's organization.

76 201 6 Assessment of the Civilian Acquisition Workforce Personnel Demonstration Project
Figure 5.6 Employee Perceptions of Promotion Opportunities by Supervisory Status
80 r-����������������������������-
� Supervisors � Non-supervisors
40 -·--·------··- ·-·--- ---.:::;::�;;;;;;;- ;;.;,, . . ... ;;;;;; ... -;,;;-· .. -·-;;;;··-·-;,;;;·-·- -·----- -- iiiiiiiiiiiiiiiiiiilili--�·�---------- ----.. ·-·---··---.. ·-·-·-
·•
��-------=------= ......... ----===--�� 20 1--����������������������������--1
0 ---------------·-------------------------------·-------------2012* 201 6*
Satisfied with opportunities for promotion
SOURCE: 2012 and 201 6 AcqDemo surveys. NOTES: Each of the data points indicates the percentage of respondents who agreed or strongly agreed. The remainder of respondents expressed a neutral view, disagreed, or strongly disagreed. * = A statistically significant difference between the two groups at the 5-percent ievel or better. RAND RR1783·5.6
Veterans
Nearly 40 percent of permanent, full-time employees in AcqDemo are veterans. The corresponding share among GS employees in ADEOs is similar, at nearly 43 percent. In this section, we present our assessment of AcqDemo's effect on the career outcomes of veterans . Using administrative data from the DMDC civilian personnel files, we compare the career outcomes of veterans in AcqDemo with the career outcomes of comparable veterans in ADEOs in the GS system. We do not compare the career outcomes of veterans and nonveterans. Because the AcqDemo surveys did not identify veterans, we are not able to describe how satisfaction with career outcomes varied with veteran status.
Comparison to Veterans in the GS System
The four-year retention rate for veterans in AcqDemo was 78.0 percent. The corresponding rate for the weighted control group of veterans in the GS system was 77.4 percent, and the difference in rates between the two groups was not statistically significant. That is, we found no evidence that veterans in AcqDemo were any more or less likely to leave the DoD civilian workforce than were comparable veterans in ADEOs in the GS system.
When examining newly hired veterans, we found that starting salaries were $13,904 higher for veterans in AcqDemo than for veterans in the GS system, after controlling for other factors. When examining salary levels more generally, we found that among veterans not on retained pay, annualized basic pay was $1,100 to $1,800 higher in AcqDemo. However, AcqDemo had no discernible effect on the rate of salary growth. Among veterans not on retained pay, there was no statistically significant difference in the annualized growth rate over the four-year period of observation between veterans in AcqDemo and veterans in the GS system.

How Has AcqDemo Performed So Far? Career Outcomes and Flexibility Usage 77
The final career outcome we examined was promotion. After controlling for an array of other factors, veterans in AcqDemo experienced 20.5 percent fewer promotions than did veterans in the GS system. For the average veteran, AcqDemo participation reduced the probability of promotion from about 15 percent to about 12 percent. This estimate is roughly consistent with the promotion disparity estimated for the AcqDemo population at large.
Table 5.14 summarizes our comparison of the career outcomes of veterans in AcqDemo to those of veterans in the GS system. The results are mixed. AcqDemo paid higher starting salaries and higher salaries in general. However, veterans in AcqDemo were promoted less frequently than were comparable veterans in ADEOs in the GS system. There was no statistically significant difference in salary growth or retention between the two groups.
Use of Appointment and Appraisal Flexibilities
AcqDemo offers a number of appointment and appraisal flexibilities designed to make DoD organizations more agile and improve their ability to attract and retain talent. For example, the project gives supervisors greater authority over the hiring process and more latitude to set starting salaries. In addition, the appraisal system encourages more-frequent and more-effective communication between supervisors and employees, ties salary increases to contributions to organizational mission, and allows for one-time bonuses.
Chapter Two describes the various flexibilities AcqDemo offers. In this section, we draw on evidence from the administrative data analysis, survey data analysis, and interviews to examine how the flexibilities have been used.
Table 5.14 Career Outcomes of Veterans in AcqDemo Relative to Those of Veterans in the GS System, September 30, 2011, Cohort
Career Outcome
Retention
Starting salary
Salary level
Salary growth
Promotion
Comparison to a Weighted Control Group of Veterans in AcqDemo-Eligible Organizations in the GS System
No statistically significant difference
$13,904 higher in AcqDemo
$1 ,100 to $1,800 higher in AcqDemo
No statistically significant difference
20.5 percent fewer promotions in AcqDemo
SOURCES: DMDC civilian personnel inventory and transaction files; DAWIA personnel files.
NOTES: The data presented include only permanent, full-time employees in AcqDemo whose compensation was at least $1 5,080, the salary equivalent of working a full year at federal minimum wage. The dollar figures listed are in 2015 dollars. The starting salary estimate is based on the population of employees who were newly hired in FY 2011 to FY 201 5, rather than the September 30, 201 1, cohort. The estimates for salary level and salary growth exclude employees on retained pay and are conditional on continued DoD employment. All estimates are statistically significant at the 1-percent level, except for the promotion estimate, which was statistically significant at the 5-percent level.

78 2016 Assessment of the Civilian Acquisition Workforce Personnel Demonstration Project
Use of Appointment Flexibilities AcqDemo is supposed to grant supervisors greater authority over the hiring process. First-level supervisors are responsible for determining position requirements, developing a PRD, and providing classification recommendations. However, when asked about AcqDemo's effect on their ability to exercise this authority, supervisors expressed a fairly dim view. Figure 5.7 presents supervisors' responses to a pair of survey questions about AcqDemo's appointment Aexibilities. While a majority (about 70 percent) of supervisors felt that the AcqDemo PRD allowed them to adequately describe the duties of the positions they supervise, a much smaller share (roughly 20 percent) agreed that AcqDemo had a positive effect on their ability to influence classification decisions. Moreover, fewer than 20 percent of supervisors agreed that they were able to be more selective in hiring under AcqDemo than under the GS system.
As described in Chapter Two, AcqDemo provides five appointment options. Career and career-conditional appointments are considered permanent. Temporary limited positions are one-year positions, and modified terms allow for five-year positions based on locally approved extensions. Excepted service positions include student interns and recent college graduates. Table 5 . 15 compares the usage of temporary appointments in AcqDemo with the usage in ADEOs in the GS system. In both groups, temporary appointments constitute a small share of the workforce, but usage was lower in AcqDemo. Perhaps temporary appointments within AcqDemo are not always recorded because the broadband structure does not require it, or perhaps the nature of the work done within AcqDemo organizations simply does not lend itself to short-term appointments.
One of the more heralded Aexibilities AcqDemo offers is the ability to set starting salaries at different points within the broadband. This pay-setting flexibility was designed to position AcqDemo to compete more effectively for highly skilled and motivated personnel. Our analy-
Figure 5.7 Supervisor Perceptions of AcqDemo's Appointment Flexibilities
*
� 60 !--------------------------� "' c: IV � � 40 1----------------------1
20 , ___ --f" ___ _
0 ----------AcqDemo has had a positive impact on my ability to influence classification decisions
The AcqDemo Position Requirements Document allows me to adequately describe the duties
of the positions that I supervise
SOURCE: 2012 and 2016 AcqDemo surveys. NOTES: Bars indicate the percentage of supervisors who agreed or strongly agreed with the statement. The remainder of supervisors expressed a neutral view, disagreed, or strongly disagreed. * = A statistically significant difference between the two groups at the 5-percent level. RAND RRI 78J.5.7

How Has AcqDemo Performed So Far? Career Outcomes and Flexibility Usage 79
Table 5.1 5 Number and Share of Temporary Appointments, September 3 0 of Each Year, 2011 t o 201 5
Temporary Appointments Number of Temporary Appointments as a Share of the Workforce
GS Employees in GS Employees in AcqDemo AcqDemo-Eligible AcqDemo AcqDemo-Eligible
Year Participants Organizations Participants Organizations
201 1 266 6,190 1 .7% 4.2%
2012 433 5,523 2.7% 3.8%
2013 408 3,823 2.6% 2.8%
2014 302 3,779 1 .9% 2.9%
201 5 237 3,746 1 .5% 2.9%
SOURCE: DMDC civilian personnel inventory files.
NOTE: The population of GS employees in AcqDemo-eligible organizations is not weighted.
sis of administrative data, which we presented earlier in this chapter, provides strong evidence that supervisors and managers are applying this flexibility: New hires in AcqDemo enjoyed a $ 13,226 premium relative to their GS counterparts in ADEOs. However, it is not dear whether the flexibility has been used appropriately. ADEOs in the GS system appear to have hired comparable employees at a lower starting salary, although the comparison suffers from our inability to control for performance.
We took a closer look at how supervisors and managers have applied the pay-setting flexibility by calculating the share of newly hired AcqDemo employees whose starting salaries were at the top of their pay bands. We repeated the exercise for newly hired GS employees in ADEOs, using the shadow AcqDemo career paths and broadbands to align the GS group with the AcqDemo group. So, for instance, we compared the share of NH-2 new hires whose starting salaries were at the top of the pay band with the share of GS-1 1 new hires in ADEOs who were at step 10. The results are presented in Table 5 .16. We focused on NH-2, NH-3, and NH-4 because nearly 90 percent of newly hired AcqDemo employees were in these broadbands.
· The data in the table indicate that starting salaries at the top of the pay band were two to
three times more prevalent in AcqDemo than in ADEOs in the GS system (unweighted). This finding provides additional evidence that supervisors and managers in AcqDemo are applying the pay-setting flexibility. However, the application does not appear to be egregious: Only 7.2 percent of newly hired AcqDemo employees were offered starting salaries at the top of their pay bands.
Strangely, many supervisors do not perceive that they have much authority to set starting salaries. Only 26 percent of supervisors agreed with the survey item "AcqDemo has had a positive impact on my authority to influence my employees' pay at hiring." Qualitative responses from the survey help to explain this low-level agreement. Specifically, supervisors felt that organization business rules, HR organizations, or upper management reduced their ability to use this type of flexibility:

80 2016 Assessment of the Civilian Acquisition Workforce Personnel Demonstration Project
Table 5.1 6 Prevalence o f Starting Salaries at the Top o f the Pay Band, Newly Hired Employees Between December 31, 2010, and September 30, 201 5
Share of New Hires at the Total Number of Top of the Broadband or at
New Hires in Broadband Step 10 of the Top GS Grade
GS Employees in GS Employees in Career Path and Top GS Grade AcqDemo AcqDemo-Eligible AcqDemo AcqDemo-Eligible Broadband in Broadband Participants Organizations Participants Organizations
NH-2 GS-1 1 473 12,202 3.8% 2.0%
NH-3 GS-13 805 7,869 9.4% 3.7%
NH-4 GS-1 5 394 1 ,261 9.4% 4.0%
Full sample 1,873 31 ,822 7.2% 2.5%
SOURCES: DMDC civilian personnel inventory files; administrative data provided by the AcqDemo Program Office.
NOTES: The data presented include only permanent, full-time employees in AcqDemo whose compensation was at least $15,080, the salary equivalent of working a full year at federal minimum wage. The population of GS employees in AcqDemo-eligible organizations is not weighted.
I have found that I have no influence over an employee's pay at hiring-pay is negotiated and set through HR; I have never been consulted. (respondent 15788; DoD agency; supervisor)
CPAC [Central Personnel Advisory Center] and [ORGANIZATION] set pay, not at my level. (respondent 15366; Army; supervisor)
AcqDemo "should" allow pay setting, but here the rules have been constrained co eliminate that benefit. {respondent 16283; Air Force; supervisor)
Higher headquarter [ORGANIZATION] rules remove much of the benefits of AcqDemo. Rules on pay-setting restricts influence at hiring. (respondent 18261; Army; supervisor)
Use of Appraisal Flexibilities
AcqDemo's appraisal system was designed to be an equitable and flexible method for evaluating and compensating the workforce. As described in Chapter Two, the system's foundational principle is that compensation should be determined by the employee's contribution to organizational mission. By rewarding high contributors and withholding remuneration from low contributors, CCAS is intended to attract and retain a highly qualified workforce with employees who are motivated to make meaningful contributions to the mission. Supervisors are encouraged to work closely with employees to develop a clear line of accountability for the work being performed and to identify how that work contributes to the organization's mission.
CCAS is structured to allow for meaningful, constructive feedback at regular intervals. We learned in our interviews that CAS2NET, the software developed to support CCAS, was designed to ensure that midpoint and annual appraisals are conducted for each employee. In particular, AcqDemo organizations can use CAS2NET to easily verify whether feed-

How Has AcqDemo Performed So Far? Career Outcomes and Flexibility Usage 81
back sessions have been completed. The SMEs we interviewed spoke quite positively about CAS2NET's utility for this purpose, as follows:
I like the tool (CAS2NET). I like that there's an automated flow and that the records remain, it forces feedback and we can monitor that. (SME 21)
We monitor that [feedback] via CAS2NET. We run regular reports to make sure the ratings officials are doing what they are supposed to be doing, like mid-year reviews, approving contribution plans, and providing employee feedback. CAS2NET requires the official to indicate how that feedback was given. We don't look at any of that unless a supervisor contacts us about an issue with an employee. In that case, the first thing we do is check the mid-year review because that's the first opportunity to document formally a problem in the system. Then if it continues and an employee is rated correctly, there's already something in the system to support it [the rating]. (SME 12)
We did not observe a theme related to CAS2NET in the write-in survey responses. Although CAS2NET provides the ability to track feedback session completion, we could
not independently verify the compliance rate because the AcqDemo Program Office does not receive feedback review-related statistics from participating organizations. SME views about compliance were mixed. One SME told us that, thanks largely to CAS2NET, his organization had missed only one appraisal in the entire time his organization had been in AcqDemo. Another explained that
It's a mix. Some supervisors are better than others. Sometimes we have to reach back to ratings officials and remind them because we [HR] are here both to support them and protect them. It's harder to protect them if they don't do everything they're supposed to do. We have some that don't do formal sessions for mid-year reviews, but do them for the annual for sure. It has gotten better over time. But if it's not stressed from higher ups, it's perceived as lower priority. (SME 12)
Survey results also offer insights on how the feedback elements of AcqDemo's appraisal flexibilities have been used, speaking specifically to the quality of feedback provided. This is important because our interviews suggest that feedback quality is not routinely monitored. Write-in comments included a wide range of views regarding employee satisfaction with the feedback they received. Comments covered the timing of feedback and its quality. Examples of positive and negative perceptions related to feedback follow:
Positive perceptions of feedback
Supervisor does face-to-face at least two times per rating year. He provides detailed feedback on areas that need improvement and also in areas where we are excelling. (respondent 16827; Army; employee)
None [no problems]. Feedback is valuable and the first cycle was a learning opportunity. (respondent 13512; Air Force; employee)

82 2016 Assessment of the Civilian Acquisition Workforce Personnel Demonstration Project
Negative perceptions of feedback
There are no meaningful discussions by supervisors co sec goals, expectations, and performance parameters. The only time one learns chat a problem exists is during che mid or end of year feedback. This feedback is usually provided in wricing with a "here, read chis and sign" mentalicy [rather] than a meaningful conversation. (respondent 14407; DoD agency; supervisor)
I received a virtually worthless feedback/evaluacion, because my supervisor was too busy (unexpected workload). My evaluation was entirely positive, because it was entirely copy/ pasted from my self-evaluation. Previous evaluations have been better, but they've always been about performance, not concribucion. (respondent 13402; Army; employee)
Feedback sessions are very minimal and there is no discussion about how co improve or future expectations. A person shouldn't have co wait over four months for the AcqDemo process to work to know how they did over the previous year. (respondent 13921; DoD agency; employee)
Negative write-in comments about feedback were more salient than positive comments, but quantitative results from the survey suggest that a minority of employees hold such concerns. As shown in Figure 5.8, employees view the feedback they receive from their supervisors favorably. AcqDemo participants largely agree chat supervisors set clear contribution goals and communicate expectations for positions. I n addition, che majority of AcqDemo participants agree that their supervisors provide adequate feedback on their contribution. All of these proportions have increased significantly since 2012. The contrast between the general tone of the
Figure 5.8 Employee Perceptions of Feedback Under AcqDemo
* � 60 , ______ , "' ... c Cll � � 40
20
o --....... ---My supervisor and I work together
to set clear contribution goals for me
SOURCE: 2012 and 2016 AcqDemo surveys.
*
My supervisor has effectively communicated to me his/her expectations for my position
*
My supervisor provides adequate feedback on my contribution
NOTES: Bars indicate the percentage of employees who agreed or strongly agreed with the statement. The remainder of employees expressed a neutral view, disagreed, or strongly disagreed. * = A statistically significant difference between the two years at the 5-percent level. RAND ltRJ 1U·S.B

How Has AcqDemo Performed So Far? Career Outcomes and Flexibility Usage 83
write-in responses regarding feedback and the quantitative responses to feedback-related survey items could be due to the employee survey negativity bias mentioned in Chapter One. Nevertheless, the qualitative responses do offer some explanations for why roughly one-third of the 20I6 survey respondents did not agree with the statements listed in Figure 5.8.
Chapter Two describes how employee contributions are assessed and converted to pay actions. The system is designed to ensure that employees are appropriately compensated, meaning that salary actions are intended to be corrections that bring the employee's compensation in line with his or her contributions. To this end, the critical metric that emerges from the appraisal process is the 80CS, which represents the difference between the employee's actual contribution and expected contribution. When AcqDemo is working as intended, salary increases accrue for employees with a positive ilOCS such that higher ilOCS values result in larger salary increases. 22
Our analysis of administrative data, which we presented earlier in this chapter, provides strong evidence of a positive relationship between ilOCS and increases in basic pay. Table 5.5 indicates that a I-point increase in ilOCS raised annualized basic pay by $150 to $400 in the following year. The effect was even stronger for the 89 percent to 97 percent of AcqDemo participants who earned a ilOCS of zero or higher. Yet only about 40 percent of survey respondents agreed that their pay raises depended on their contributions to organizational mission or that their salaries were more directly tied to their contributions under AcqDemo than under the GS system. These sentiments might reflect a sense that pay does not vary enough with contribution or that OCS is not properly capturing employees' contributions to the mission. We delve into these issues in Chapter Seven.
AcqDemo was also designed to offer opportunities for rapid salary growth to motivated employees who make large and meaningful contributions to the organization's mission. The project classifies employees using broadbands, rather than grades, with each broadband encompassing two to seven GS grades, as shown in Chapter Two, Figure 2 .I . This structure provides supervisors with the flexibility to reward high-performing employees with large or successive salary increases without triggering a formal promotion.
As explained earlier in this chapter, our analysis of administrative data indicated that salary growth in AcqDemo was indistinguishable from salary growth in the GS system. More specifically, over the four-year period of observation, there was no statistically significant difference between the rate at which salaries paid to AcqDemo participants grew and the rate at which salaries paid to comparable GS employees in ADEOs grew. The perceptions of supervisors who responded to the AcqDemo survey were somewhat consistent with the empirical finding: More than 40 percent agreed that AcqDemo had a positive effect on their authority to influence their employees' pay progression. Overall, there is not much evidence that supervisors are applying the salary growth flexibility, although it may be the case that salaries are rising rapidly within the broadband but are subsequently constrained when employees reach the top of the band. We examine the effect of this and other pay caps in Chapter Seven.
It is worth noting that the administrative data analysis provided evidence that within AcqDemo, more-rapid salary growth is tied to stronger performances. After controlling for other factors, a I-point increase in ilOCS raised the annualized rate of salary growth by roughly 0. 1 to 0.2 percentage points. That is, high-contributing employees in AcqDemo saw
22 Strict adherence to the principle of appropriate compensation would require that employees with a negative l\OCS be subject to salary cuts. AcqDemo is a bit forgiving on chis count, as indicated in Table 2.1 .

84 2016 Assessment of the Civilian Acquisition Workforce Personnel Demonstration Project
their salaries increase faster than lower contributors did. In this sense, the salary growth flexibility has been applied as intended, although we were unable to ascertain whether AcqDemo offers any improvement over the GS system in this regard.
Salaries are not the only means by which AcqDemo rewards high-contributing employees. As explained in Chapter Two, the project also offers one-time bonuses in the form of CAs and CRI carryover awards. CAs are intended to reward contributions to the mission; CRI carryover awards are intended to compensate employees who forfeit salary increases as a result of pay caps. Table 5.17 provides the number and share of employees who received each award type following the FY 2015 appraisal cycle, as well as the average (median) values of the awards.
Nearly 92 percent of permanent, full-time AcqDemo participants received a CA, when only 68 percent received a salary increase. The average (median) dollar value of a CA was $1,047, and CAs as a percentage of basic pay averaged (median) 1 . 19 percent. These figures suggest that CAs were frequently used and may have been overused. The amounts were modest on average, and it is unclear whether they were large enough to motivate employees, particularly in light of their ubiquity. We present a more in-depth discussion of this issue in Chapter Seven.
A smaller share of the AcqDemo workforce, 38 percent, received CRI carryover awards. These awards were generally larger than CAs: The average (median} dollar value was $ 1,639, and CRI carryover awards as a percentage of basic pay averaged (median} 1 .60 percent. Because these awards were designed to compensate employees for a forfeited CRI, we compared their value to the value of the CRls that were granted. We found that the average carryover award fell short of the average CRI, but only by about $100. This suggests that CRI carryover awards may be serving their intended purpose, at least in the short term; unlike CRis, CRI carryovers do not compound over time and are not included in the salary basis used to calculate retirement contributions. A more in-depth assessment of how CAs and CRI carryover awards have been used and whether they have been used effectively can be found in Chapter Seven.
Table 5.17 Compensation Actions, FY 2015 Appraisal Cycle
Compensation Action
CRI Carryover CRI CA Award
Count 1 0,932 14,686 6,106
Percentage 68.33% 91 .79% 38.1 6%
Average dollar value (median) 1 ,745 1 ,047 1 ,639
As a percent of basic pay {median) 2.04% 1 .1 9% 1 .60%
SOURCE: Administrative data provided by the AcqDemo Program Office.
NOTE: The data presented include only permanent, full-time employees in AcqDemo whose compensation was at least $15,080, the salary equivalent of working a full year at federal minimum wage.

How Has AcqDemo Performed So Far? Career Outcomes and Flexibility Usage 85
Summary
A central component of this assessment was the comparison of career outcomes in AcqDemo to those of an equivalent population of GS employees. We examined five career outcomes: starting salaries, salaries more generally, salary growth, promotion, and retention. For each outcome, we estimated the difference between AcqDemo participants and comparable GS employees, while controlling for an array of factors. Within AcqDemo, we empirically assessed the relationship between contribution to organizational mission, as measured by �OCS, and the various career outcomes.
To assess retention, we identified the cohort of permanent, full-time employees who were in AcqDemo on September 30, 201 1, and tracked them over the ensuing four years. Nearly 82 percent of this AcqDemo cohort was retained in the DoD civilian workforce. We compared this rate to the retention rate for an analogous and weighted cohort of GS employees in ADEOs and found no statistically significant differences in retention. Within AcqDemo, retention was higher among employees with higher L\OCS than among employees with lower L\OCS. The limitations of the GS performance rating data prevented us from evaluating whether the GS system was more or less adept than AcqDemo at retaining high-contributing employees and shedding low-contributing employees.
Employees who entered the DoD civilian workforce as AcqDemo participants earned about $13,000 more than did comparable employees who entered the DoD civilian workforce as GS employees in ADEOs. Overall, salaries were also higher in AcqDemo than in the GS comparison group, but the margin was considerably smaller. Among employees not on retained pay, AcqDemo participants earned $1,500 to $1 ,800 more in each year than did comparable GS employees. That is, only a small fraction of the $23,000 premium observed when comparing raw averages can be attributed to AcqDemo; the remainder is due to differences between the two populations. From FY 201 1 to FY 2015, salaries earned by AcqDemo participants grew at an average annualized rate of 1 .2 percent; there was no discernible difference between this rate and the corresponding rate for comparable GS employees. Within AcqDemo, employees with higher L\OCS earned more and experienced more-rapid salary growth than did employees with lower L\OCS. The overwhelming majority of AcqDemo participants can reasonably expect additional efforts or contributions to augment their salaries by $900 to $1,800. Because the available performance rating data for GS employees were too coarse and inconsistent over time, we cannot make any statements about whether the connection between performance and basic pay is stronger in AcqDemo or in ADEOs in the GS system.
Because each of AcqDemo's broadbands corresponds to two or more GS grades, promotions occurred at least twice as often in GS as in AcqDemo. We corrected for this problem by assigning an AcqDemo career path and broadband to each GS employee in an ADEO and crediting promotions within the GS system only when the employee moved to a higher career path within a broadband or a higher broadband within a career path. After implementing this correction and controlling for an array of other factors, we found that for the average employee, AcqDemo participation reduced the probability of earning a promotion during the four-year period from about 19 percent to about 14 percent. Within AcqDemo, highcontributing employees were promoted more frequently than were low contributors, but the margins were small. For the average AcqDemo participant, a I-point increase in L\OCS raised the probability of promotion in the following year by less than 1 percentage point. Only 25 to 30 percent of the survey respondents felt satisfied with their opportunities for promotion, and

86 2016 Assessment of the Civilian Acquisition Workforce Personnel Demonstration Project
even fewer reported positive sentiments regarding AcqDemo's influence on their promotion opportunities.
We also examined the career outcomes of particular subgroups: bargaining unit employees, AW members, supervisors, and veterans. Unionized employees in AcqDemo have fared quite well. In comparing them with unionized employees in the GS system, we found that unionized employees in AcqDemo earned higher starting salaries and higher overall salaries. Salary growth and retention outcomes in AcqDemo were statistically similar to those in the GS system. Within AcqDemo, there were no discernible differences in starting salaries or overall salaries between unionized employees and nonunionized employees; however, salaries grew more rapidly for unionized employees. Unionized AcqDemo employees were more likely than their nonunionized counterparts to receive a promotion, although the margin was small. Within the weighted GS comparison group, however, unionized employees experienced fewer promotions than nonunionized employees did. Retention was measurably better for unionized employees within AcqDemo, but an analogous disparity was present within ADEOs in the GS system.
Supervisors in AcqDemo also fared reasonably well. Starting salaries, overall salaries, salary growth, and retention were all better for supervisors in AcqDemo than for comparable supervisors in the GS system. Nearly 70 percent of survey respondents who were supervisors indicated that they were satisfied with their pay, and nearly 50 percent reported positive sentiments regarding AcqDemo's influence on pay satisfaction. Supervisors' sentiments with regard to their promotion opportunities were less positive. Approximately 40 percent agreed or strongly agreed that they were satisfied with their promotion opportunities, and only 20 percent reported positive sentiments regarding AcqDemo's influence on satisfaction with their promotion opportunities.
The effect of AcqDemo participation on members of the AW was mixed. Starting salaries, overall salaries, and salary growth were better for AW members in AcqDemo than for comparable AW members in the GS system. However, AW members in the GS system were promoted more frequently than were AW members in AcqDemo. There were no discernible differences in retention across the two groups. Similarly, veterans appeared to benefit from AcqDemo with respect to their starting salaries and overall salaries, but their promotion outcomes appeared to suffer. There were no statistically significant differences in salary growth or retention between veterans in AcqDemo and veterans in the GS system.
AcqDemo offers a number of appointment and appraisal flexibilities that were designed to make DoD organizations more agile and improve their ability to attract and retain talent. In Chapter Two, we described the various flexibilities AcqDemo offers. In this chapter, we provided an assessment of how these flexibilities have been used.
AcqDemo is supposed to grant supervisors greater authority over the hiring process, but when asked about AcqDemo's effect on their ability to exercise this authority, supervisors expressed a fairly dim view. Our analysis of AcqDemo survey data indicated that roughly 20 percent of supervisors agreed that AcqDemo had a positive impact on their ability to influence classification decisions, and fewer than 20 percent agreed that they were able to be more selective in hiring under AcqDemo than under the GS system. One of AcqDemo's more distinctive flexibilities is the ability to set starting salaries at different points within the broadband to compete more effectively for highly skilled and motivated personnel. As mentioned earlier in this section, starting salaries for employees who entered the DoD civilian workforce as AcqDemo participants were about $13,000 higher than starting salaries for comparable

How Has AcqDemo Performed So Far? Career Outcomes and Flexibility Usage 87
employees who entered the DoD civilian workforce as GS employees. We view this as strong evidence that AcqDemo is applying the pay-setting flexibility, but it is not clear whether the flexibility is being used appropriately.
AcqDemo's performance appraisal system, CCAS, was designed to be an equitable and flexible method for evaluating and compensating the workforce. The system is structured to allow for meaningful, constructive feedback at regular intervals. Quantitative results from the AcqDemo survey suggest that employees view the feedback they receive from their supervisors favorably. More than 60 percent agreed that their supervisors set dear contribution goals, effectively communicate expectations for positions, and provide adequate feedback on contributions.
The central tenet of CCAS is that compensation should be determined by the employee's contribution to organizational mission. Employees should be appropriately compensated, meaning that .salary actions should bring the employee's compensation in line with his or her contributions. As mentioned earlier in this section, we found that within AcqDemo, increases in �OCS were associated with both higher salaries and higher rates of salary growth. However, fewer than half of survey respondents agreed that their pay raises depended on their contributions to organizational mission or that their salaries were more directly tied their contributions under AcqDemo than under the GS system.
Salaries are not the only means by which AcqDemo rewards high-contributing employees: The project also offers one-time bonuses in the form of CAs and CRI carryover awards. CAs are intended to reward contributions to the mission; CRI carryover awards are intended to compensate employees who forfeit salary increases as a result of pay caps. In FY 2015, more than 90 percent of the AcqDemo workforce received a CA, and the average dollar value of an award was about $1,000. It is not clear whether CAs are large enough to motivate employees, particularly in light of their ubiquity. In the same FY, nearly 40 percent of the AcqDemo workforce received a CRI carryover award. The average dollar value was about $1,600, which fell short of the average CRI, but only by about $100.

CHAPTER SIX
How Has AcqDemo Performed So Far? Protections for Diversity
In this chapter, we assess how well AcqDemo has provided protections for diversity. Studies have shown that performance-based pay systems can increase bias and reduce equity in the workplace (Castilla, 2008; Castilla and Benard, 2010). With this in mind, we leveraged administrative data drawn from the DMDC civilian personnel inventory and transaction files to examine how the career outcomes of AcqDemo participants varied with gender and race or ethnicity. In addition, we compared career outcomes in AcqDemo with career outcomes in ADEOs in the GS system for four distinct groups: women, blacks, Asians, and Hispanics.1 Throughout, we compared the outcomes estimated using the administrative data with the perception of these outcomes as indicated by responses to the AcqDemo survey. Accordingly, this chapter addresses the following assessment criterion:
• NDAA criterion J: the project's sufficiency in terms of providing protections for diversity in promotion and retention of personnel.
While the criterion refers specifically to promotion and retention, our analysis extended beyond these two outcomes to include starting salaries, salary levels more generally, and the rate of salary growth.
Women
As we discussed in Chapter Three, the AcqDemo workforce was heavily male-only 35 percent of AcqDemo participants were women. This section presents our assessment of the protections that AcqDemo provides for these women. The methods used in this section, and in the remaining sections of this chapter, parallel those described in Chapter Five. We begin by comparing the career outcomes of women in AcqDemo with those of GS women in ADEOs. Next, we compare the career outcomes of men and women within AcqDemo and assess any disparities in relation to analogous disparities exhibited within ADEOs in the GS system. Finally, we describe how satisfaction with career outcomes varies by gender within AcqDemo.
1 The racial and ethnic taxonomy and terminology used in this chapter and elsewhere in this report were drawn from the documentation for the DMDC civilian personnel data files from October l, 2010, to September 30, 2015.
89
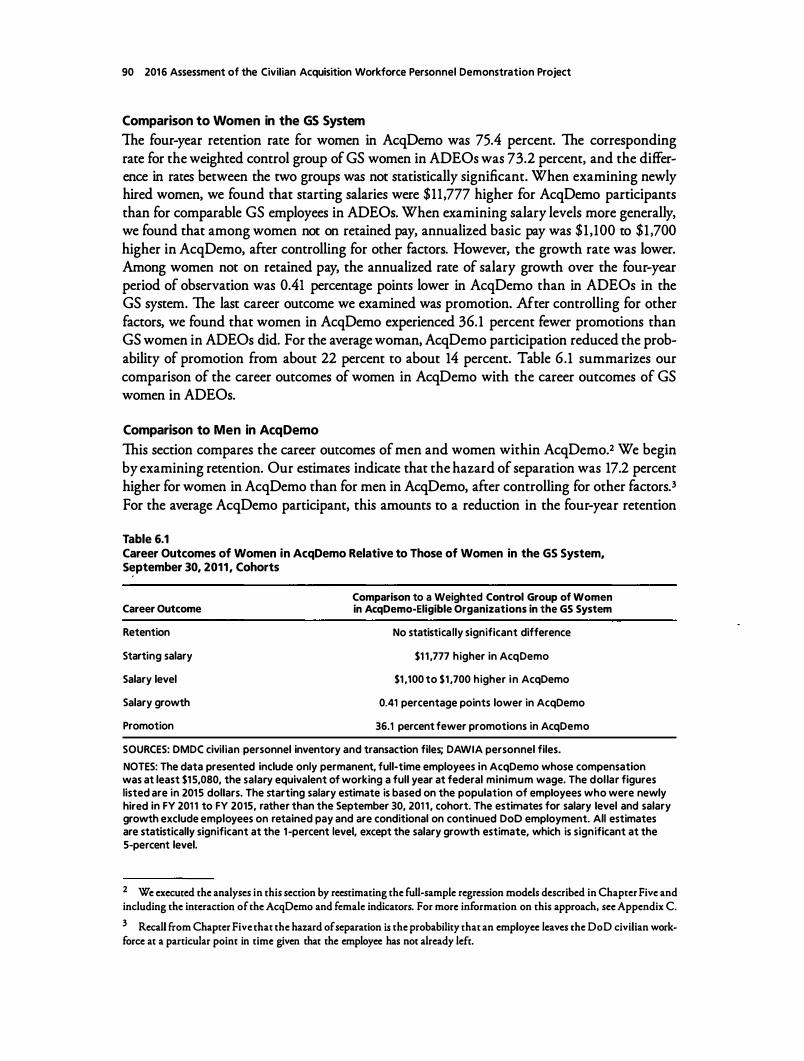
90 2016 Assessment of the Civilian Acquisition Workforce Personnel Demonstration Project
Comparison to Women in the GS System
The four-year retention rate for women in AcqDemo was 75.4 percent. The corresponding rate for the weighted control group of GS women in ADEOs was 73.2 percent, and the difference in rates between the two groups was not statistically significant. When examining newly hired women, we found that starting salaries were $11 ,777 higher for AcqDemo participants than for comparable GS employees in ADEOs. When examining salary levels more generally, we found that among women not on retained pay, annualized basic pay was $1 ,100 to $1 ,700 higher in AcqDemo, after controlling for other factors. However, the growth rate was lower. Among women not on retained pay, the annualized rate of salary growth over the four-year period of observation was 0.41 percentage points lower in AcqDemo than in ADEOs in the GS system. The last career outcome we examined was promotion. After controlling for other factors, we found that women in AcqDemo experienced 36. 1 percent fewer promotions than GS women in ADEOs did. For the average woman, AcqDemo participation reduced the probability of promotion from about 22 percent to about 14 percent. Table 6 .1 summarizes our comparison of the career outcomes of women in AcqDemo with the career outcomes of GS women in ADEOs.
Comparison to Men in AcqDemo
This section compares the career outcomes of men and women within AcqDemo.2 We begin by examining retention. Our estimates indicate that the hazard of separation was 17.2 percent higher for women in AcqDemo than for men in AcqDemo, after controlling for other factors. 3 For the average AcqDemo participant, this amounts to a reduction in the four-year retention
Table 6.1 Career Outcomes of Women in AcqDemo Relative to Those of Women in the GS System, S�ptember 30, 2011 , Cohorts
Career Outcome
Retention
Starting salary
Salary level
Salary growth
Promotion
Comparison to a Weighted Control Group of Women in AcqDemo-Eligible Organizations in the GS System
No statistically significant difference
$1 1 ,777 higher in AcqDemo
$1 ,100 to $1 ,700 higher in AcqDemo
0.41 percentage points lower in AcqDemo
36.1 percent fewer promotions in AcqDemo
SOURCES: DMDC civilian personnel inventory and transaction files; DAWIA personnel files.
NOTES: The data presented include only permanent, full-time employees in AcqDemo whose compensation was at least $15,080, the salary equivalent of working a full year at federal minimum wage. The dol lar figures listed are in 2015 dollars. The starting salary estimate is based on the population of employees who were newly hired in FY 201 1 to FY 2015, rather than the September 30, 201 1 , cohort. The estimates for salary level and salary growth exclude employees on retained pay and are conditional on continued DoD employment. All estimates are statistically significant at the 1-percent level, except the salary growth estimate, which is significant at the 5-percent level.
2 We execuced che analyses in chis seccion by reescimacing the full-sample regression models described in Chapter Five and including the interaction of the AcqDemo and female indicators. For more information on this approach, see Appendix C.
3 Recall from Chapter Five chat the hazard of separation is the probability chat an employee leaves che DoD civilian workforce at a particular point in time given that the employee has not already left.

How Has AcqDemo Performed So Far? Protections for Diversity 91
rate of about 3 percentage points. However, a similar disparity was present among GS employees in ADEOs. More specifically, there is no statistically significant difference between the female-male retention gap in AcqDemo and the analogous gap in ADEOs in the GS system.
Starting salaries were also lower among women in AcqDemo than among comparable men in AcqDemo. After controlling for other factors, we found that the salaries of newly hired women were $2,079 lower than those of newly hired men. However, a similar disparity was present among GS employees in ADEOs. When examining salary levels more generally and the rate of salary growth, we found no statistically significant differences between women and men in AcqDemo or between women and men in ADEOs in the GS system. That is, salary levels and growth rates were essentially the same for women and men, both within AcqDemo and within ADEOs in the GS system.
The final career outcome we examined was promotion. After controlling for other factors, we found that women in AcqDemo were promoted less frequently than their male counterparts. However, the margin was quite small: Women experienced 4.6 percent fewer promotions than men did. ADEOs in the GS system exhibited a different pattern: GS women experienced 53.8 percent more promotions than GS men did.
Table 6.2 summarizes our comparison of the career outcomes of men and women within AcqDemo, as well as our assessment of how the disparities within AcqDemo compare with analogous disparities within ADEOs in the GS system.
Perceptions of Career Outcomes by Gender
The AcqDemo survey included questions about retention, pay, and promotion opportunities. The items related to pay and promotion opportunities were presented in pairs. The first question asked about the employee's satisfaction with his or her pay (or promotion opportunities);
Table 6.2 Career Outcomes of Women in AcqDemo Relative to Those of Men in AcqDemo, September 30, 2011, Cohorts
Career Outcome
Retention
Starting salary
Salary level
Salary growth
Promotion
Outcome for Women in AcqDemo Relative to Outcome for Men in AcqDemo
Four-year retention rate was 2.9 percentage points lower
Starting salaries were $2,079 lower
No statistically significant difference
No statistically significant difference
Number of promotions was 4.6 percent lower
Disparity in AcqDemo Relative to Disparity in AcqDemo-Eligible Organizations in the GS System
No statistically significant difference
No statistically significant difference
No statistically significant difference
No statistica l ly significant difference
Female-male gap was larger in AcqDemo
SOURCES: DMDC civilian personnel inventory and transaction files; DAWIA personnel files.
NOTES: The data presented include only permanent, full-time employees in AcqDemo whose compensation was at least $15,080, the salary equivalent of working a full year at federal minimum wage. The dollar figures listed are in 2015 dollars. The starting salary estimate is based on the population of employees who were newly hired in FY 201 1 to FY 2015, rather than the September 30, 201 1 , cohort. The estimates for salary level and salary growth exclude employees on retained pay and are conditional on continued DoD employment. For the full set of estimated coefficients, see Appendix C, Tables C.13 through C.17.

92 201 6 Assessment of the Civi lian Acquisition Workforce Personnel Demonstration Project
the second question asked about the employee's sentiments regarding AcqDemo's influence on his or her satisfaction with pay (or promotion opportunities). We assumed that any genderbased differences in the responses to the first item reflected perceived gender-based differences in actual outcomes within AcqDemo-that is, perceived disparities in pay (or promotion) outcomes between women and men in AcqDemo.
Because the two survey items were presented together, we interpreted the second item as asking whether the employee felt that AcqDemo was responsible for the level of satisfaction reported in the first item. In other words, we assumed that the second item was effectively asking whether the employee felt his or her level of satisfaction would have been different if he or she had been in the GS system, rather than in AcqDemo. Accordingly, we understood any gender-based differences in the responses to the second item as a reflection of perceived differences between the gender disparity within AcqDemo and the gender disparity within the GS system-that is, perceived differences between the female-male pay (or promotion) gap in AcqDemo and the female-male pay (or promotion) gap in the GS system.
Sentiment regarding career outcomes did not vary much by gender. There were no statistically significant differences between the responses of women and men with regard to retention in one year, satisfaction with pay, satisfaction with promotion opportunities, or AcqDemo's influence on satisfaction with promotion opportunities. The survey responses regarding satisfaction with pay were largely consistent with the salary outcomes reported in the second column of Table 6.2: Salary levels and growth rates were essentially the same for women and men, both within AcqDemo and within ADEOs in the GS system.
However, the survey responses regarding promotion were not consistent with the estimated outcomes reported in the table. Women in AcqDemo were less likely to be promoted than their male counterparts were, although the margin was quite small, but GS women were more likely to be promoted than GS men were. The survey responses regarding retention were also out of sync with the estimated outcomes. Women and men indicated that they saw themselves working at their current organizations one year in the future in roughly equal proportions in both the 2012 and 2016 AcqDemo surveys, but actual retention was measurably lower for women. As noted in Chapter Five, the misalignment may be due to a difference in the reference point: The perceptions reported in the survey refer to retention within the employee's organization, while the estimated retention outcomes refer to retention within the DoD civilian workforce.
Responses to the survey question addressing AcqDemo's influence on satisfaction with pay did vary by gender, even after controlling for a number of factors. Figure 6.1 shows that women were significantly less likely than men to report positive sentiments about AcqDemo's influence on satisfaction with their pay. 4 This stands in contrast to the results reported in the third column of Table 6.2: There is no evidence that salary disparities between women and men in AcqDemo were any better or worse than salary disparities within AD EOs in the GS system.
4 The full set of Likert scale responses, ranging from strongly agree to strongly disagree with a neutral midpoint, is pro· vided in Appendix A.

How Has AcqDemo Performed So Far? Protections for Diversity 93
Figure 6.1 Employee Perceptions of AcqDemo's Influence on Satisfaction with Pay, by Gender
80
60
_........ "' .... ..,,... ..... ......
20
0 I I
201 2 201 6*
Influence of AcqDemo on satisfaction with your pay
SOURCE: 201 2 and 201 6 AcqDemo surveys.
-t- Male
-Iii=- Female
NOTES: Each of the data points indicates the percentage of respondents who reported positive or very positive views. The remainder of respondents expressed a neutral view, a negative view, or a very negative view. * =·A statistically significant difference between the two groups at the 5-percent level or better. RAND RR1783-6.1
Blacks
As described in Chapter Three, the AcqDemo population is heavily white-fewer than a quarter of AcqDemo workers are minorities. In particular, blacks account for 14 percent of AcqDemo workers, which is about 3 percentage points less than the comparable figure for the population of GS workers in ADEOs. This section presents our assessment of the protections AcqDemo provides for black employees. Our approach here mirrors the approach taken in our analysis of the protections provided for women. We begin by comparing the career outcomes of blacks in AcqDemo with the career outcomes of comparable blacks in ADEOs in the GS system. Next, we compare the career outcomes of blacks and whites within AcqDemo and assess any disparities in relation to analogous disparities exhibited within ADEOs in the GS system. Finally, we describe how satisfaction with career outcomes varies between blacks and whites within AcqDemo.
Comparison to Blacks in the GS System
The four-year retention rate for black employees in AcqDemo was 81 .2 percent. The corresponding rate for the weighted control group of black GS employees in ADEOs was 79. l percent, and the difference in rates between the two groups was not statistically significant. When examining newly hired black employees, we found that starting salaries were $ 1 1 ,068 higher for AcqDemo participants than for comparable GS employees in ADEOs. When examining salary levels more generally, we found that annualized basic pay was $900 to $2,500 higher in AcqDemo, after controlling for other factors. However, the growth rate was lower. Over the four-year period of observation, the annualized rate of salary growth was 1 .04 percentage

94 2016 Assessment of the Civilian Acquisition Workforce Personnel Demonstration Project
points lower in AcqDemo than in ADEOs in the GS system. We were not able to obtain reliable estimates of AcqDemo's effect on promotion for black employees. Table 6.3 summarizes our comparison of the career outcomes of black workers in AcqDemo to those of black workers in ADEOs in the GS system.
As explained in Chapter Five, our analysis of promotions operated on a more-restricted data set that excluded any AcqDemo employee in the NH-4 broadband, any GS employee who was assigned to the shadow NH-4 broadband, and any employee (AcqDemo or GS) who experienced one or more demotions. For some subgroups, including blacks and Asians, the exclusions reduced the size of the data set such that we could not obtain reliable estimates of the promotion effects.
As an alternative, we executed the promotion analysis using an aggregated data set of nonwhite employees. The AcqDemo group contained 2,529 employees, of whom 59 percent were black, 18 percent were Asian, and the remainder belonged to another nonwhite racial group. The GS group contained 34,537 employees, of whom 59 percent were black, 16 percent were Asian, and the remainder belonged to another nonwhite racial group. After controlling for other factors, we found that nonwhite employees in AcqDemo experienced 34. l percent fewer promotions than did nonwhite GS employees in ADEOs.s For the average nonwhite employee, AcqDemo participation reduced the probability of promotion from about 19 percent to about 13 percent.
Table 6.3 Career Outcomes of Blacks in AcqDemo Relative to Those of Blacks in the GS System, September 30, 2011 , Cohorts
Career Outcome
Retention
Starting salary
Salary level
Salary growth
Promotion
Comparison to a Weighted Control Group of Blacks in AcqDemo-Eligible Organizations in the GS System
No statistically significant difference
$1 1 ,068 higher in AcqDemo
$900 to $2,500 higher in AcqDemo
1 .04 percentage points lower in AcqDemo
NIA
SOURCES: DMDC civilian personnel inventory and transaction files; DAWIA personnel files.
NOTES: The data presented include on ly permanent, full-time employees in AcqDemo whose compensation was at least $1 5,080, the salary equivalent of working a ful l year at federal minimum wage. The dollar figures listed are in 201 5 dollars. The starting salary estimate is based on the population of employees who were newly hired in FY 201 1 to FY 2015, rather than the September 30, 201 1 , cohort. The estimates for salary level and salary growth exclude employees on retained pay and are conditional on continued DoD employment. All estimates are statistically significant at the 1 -percent level.
5 This estimate was statistically significant at the l·pcrcent level.

How Has AcqDemo Performed So Far? Protections for Diversity 95
Comparison to Whites in AcqDemo
This section compares the career outcomes of blacks and whites within AcqDemo. 6 We begin by examining retention. Our estimates indicate that the hazard of separation was 32 .3 percent lower for blacks in AcqDemo than for whites in AcqDemo, after controlling for other factors. For the average AcqDemo participant, this amounts to an increase in the four-year retention rate of about 6 percentage points. A similar disparity was present among GS employees in ADEOs.
Starting salaries were lower among black AcqDemo employees than among comparable white AcqDemo employees. After controlling for other factors, we found that the salaries of newly hired black employees were $3,666 lower than those of newly hired white employees. However, a similar disparity was observed among GS employees in ADEOs. When examining salary levels more generally, we found no statistically significant differences between black and white AcqDemo participants in FY 2012, FY 2013, or FY 2014. The same pattern was present within ADEOs in the GS system. However, in FY 2015, annualized basic pay was $1,072 lower for black AcqDemo participants than for white AcqDemo participants. No such disparity was present within ADEOs in the GS system. In all four years, salary growth rates were essentially the same for black and white employees, both within AcqDemo and within ADEOs in the GS system.
The final career outcome we examined was promotion. After controlling for other factors, we found no statistically significant difference between the number of promotions experienced by black AcqDemo employees and the number experienced by white AcqDemo employees. The same was true within ADEOs in the GS system.
Table 6.4 summarizes our comparison of the career outcomes of blacks and whites within AcqDemo, as well as our assessment of how the disparities within AcqDemo compare with analogous disparities within ADEOs in the GS system.
Perceptions of Career Outcomes Among Black Employees
Sentiment regarding retention and pay was less positive among black AcqDemo participants than among white AcqDemo participants. Figure 6.2 shows the proportion of survey respondents who agreed with the statement, "I see myself working at my current organization one year from now." After controlling for a number of factors, black respondents were significantly less likely than white respondents to report agreement. This stands in contrast to the actual outcome reported in the second column ofTable 6.4: Retention was measurably higher among black employees than among white employees over the four-year period of study.
Figures 6.3 and 6.4 show the survey respondents' perceptions of compensation by race. After controlling for a number of factors, we observed that black respondents were less likely than their white counterparts to be satisfied with their pay, which is consistent with the estimates reported in Table 6.4. Within AcqDemo, starting salaries were lower for black employees. While there was no discernible black-white salary gap within AcqDemo in FY 2012, FY 2013, or FY 2014, salaries were measurably lower for black employees in FY 2015. Interestingly, black and white survey respondents were equally likely to report positive feelings
6 We executed the analyses in this section by reestimating the full-sample regression models described in Chapter Five and including interactions between the AcqDemo indicator and the race-based dummy variables. For more information on this approach, see Appendix C.

96 2016 Assessment of the Civilian Acquisition Workforce Personnel Demonstration Project
Table 6.4 Career Outcomes of Blacks in AcqDemo Relative to Those of Whites in AcqDemo, September 30, 2011, Cohorts
Career Outcome
Retention
Starting salary
Salary level
Salary growth
Promotion
Outcome for Blacks in AcqDemo Relative to Outcome for Whites in AcqDemo
Four-year retention rate was 6.4 percentage points higher
Starting salaries were $3,666 lower
Salary level was $1 ,072 lower in FY 2015; no statistically significant differences
in earlier years
No statistically significant difference
No statistically significant difference
Disparity in AcqDemo Relative to Disparity in AcqDemo-Eligible Organizations in the GS System
No statistically significant difference
No statistically significant difference
Black-white gap was larger in AcqDemo in FY 201 5;
no statistically significant differences in earlier years
No statistically significant difference
No statistically significant difference
SOURCES: DMDC civilian personnel inventory and transaction files; DAWIA personnel files.
NOTES: The data presented include only permanent, full-time employees in AcqDemo whose compensation was at least $1 5,080, the salary equivalent of working a full year at federal minimum wage. The dollar figures listed are in 201 5 dollars. The starting salary estimate is based on the population of employees who were newly hired in FY 201 1 to FY 2015, rather than the September 30, 201 1 , cohort. The estimates for salary level and salary growth exclude employees on retained pay and are conditional on continued DoD employment. For the full set of estimated coefficients, see Appendix C, Tables C.13 through C.17.
Figure 6.2 Employee Perceptions of Retention, by Race
80 ----------------------------------------------------------------------------------------------------.
...... 60 '--------������.m. ..... rrft"�!"""""������::._:. �.-:_.: __ : __ :._: . .. :._::� ...... A�
v
£ . ..-v
- ..s· ··= --am&�
-:$- Asian
a@}=a Black
-&.- Other � White
0 ._,_,,_,,_,,_,,_,,_,,_,.•,_,,_,,_,,_,,_,,_,,_,,_,,_,,_,,_,,_,,_,,_,,_,,_, ..... •,_,,_,,_,,_,,_,,_,,_,,_,_ 201 2 201 6
I see myself working at my current organization one year from now
SOURCE: 201 2 and 2016 AcqDemo surveys. NOTE: Each of the data points indicates the percentage of respondents who agreed or strongly agreed with the statement. The remainder of respondents expressed a neutral view, disagreed, or strongly disagreed. Black employees (in both 2012 and 201 6) and other races (in 201 6 only) were less likely than whites to agree with the statement. These differences are statistically significant at the 5-percent level or better. RAND RR7183·6.2

How Has AcqDemo Performed So Far? Protections for Diversity 97
Figure 6.3 Employee Perceptions of Satisfaction with Pay, by Race
Cl1 en B
80
60
c 40 � Cl1
D.
20
0
-UE.._ ..... �
I
201 2
SOURCE: 201 2 and 2016 AcqDemo surveys.
Satisfied with your pay
-+- Asian 11- Black """' ..g... Other � � -®- white ::!..
""'""\1!11
�
I
201 6
NOTE: Each of the data points indicates the percentage of respondents who agreed or strongly agreed with the statement. The remainder of respondents expressed a neutral view, disagreed, or strongly disagreed. In 201 6, blacks and other races were significantly less likely than whites to agree with the statement. These differences are statistically significant at the 5-percent level or better. RAND RRf183-6.3
Figure 6.4 Employee Perceptions of AcqDemo's Influence on Satisfaction with Pay, by Race
80
60
.... � '""" --· .. ..,. -�
A ....... .. 20
0 I I
201 2 201 6
Influence of AcqDemo on satisfaction with your pay
SOURCE: 201 2 and 2016 AcqDemo surveys.
-$- Asian � Black
-ilr- Other -®- white
NOTE: Each of the data points indicates the percentage of respondents who reported positive or very positive views. The remainder of respondents expressed a neutral view, a negative view, or a very negative view. In both years, other races were significantly less likely than whites to be positive about the statement. These differences are statistically significant at the 5-percent level or better. RAND RRf783-6.4

98 2016 Assessment of the Civilian Acquisition Workforce Personnel Demonstration Project
regarding AcqDemo's influence on their pay. This, too, is largely consistent with the estimated outcomes.
After controlling for a number of factors, black and white respondents were equally likely to report satisfaction with their promotion opportunities. This is consistent with the result reported in the second column of Table 6.4: There is no statistically significant difference in promotion rates between black and white employees in AcqDemo. However, as shown in Figure 6.5, black survey respondents were more likely than their white counterparts to report positive sentiments regarding AcqDemo's influence on promotion opportunities, despite the lack of any discernible promotion disparity both within AcqDemo and within ADEOs in the GS system.
Asians
People of Asian descent constitute more than 4 percent of the AcqDemo workforce, which is comparable to their representation within the population of GS workers in ADEOs. This section presents our assessment of the protections that AcqDemo provides for Asian employees. Our approach in this section mirrors the approaches taken in our analyses of the protections provided for women and black employees.
Comparison to Asians in the GS System
The four-year retention rate for Asian employees in AcqDemo was 81 .5 percent. The corresponding rate for the weighted control group of Asian GS employees in ADEOs was 84.4 per-
Figure 6.5 Employee Perceptions of AcqDemo's Influence on Promotion Opportunities, by Race
80
_.,_ Asian
-Im=- Black
60 -is:=- Other -@- white
: � 20
® @ �
A 1 I 0 201 2 201 6
Influence of AcqDemo on satisfaction with opportunities for promotion
SOURCE: 201 2 and 201 6 AcqDemo surveys. NOTE: Each of the data points indicates the percentage of respondents who reported positive or very positive views. The remainder of respondents expressed a neutral view, a negative view, or a very negative view. In both years, blacks and Asians were more likely than whites to be positive about the statement, while other races were less likely than whites to be positive about the statement. These differences are statistically significant at the 5-percent level or better. RAND RR178J.6.5

How Has AcqDemo Performed So Far? Protections for Diversity 99
cent, and the difference in rates between the two groups was not statistically significant. When examining newly hired Asian employees, we found that starting salaries were $15,145 higher for AcqDemo participants than for comparable GS employees in ADEOs. When examining salary levels more generally, we found that AcqDemo raised annualized basic pay by $ 1,050 in FY 2014 and by $1 ,279 in FY 2015, after controlling for other factors. AcqDemo had no statistically significant effect on basic pay in FY 2012 or FY 2013. In addition, there was no statistically significant difference between the rate of salary growth for Asians in AcqDemo and the rate for comparable Asians in ADEOs in the GS system. We were not able to obtain reliable estimates of AcqDemo's effect on promotion for Asian employees. Table 6.5 summarizes our comparison of the career outcomes of Asians in AcqDemo to those of Asians in ADEOs in the GS system.
Comparison to Whites in AcqDemo
This section compares the career outcomes of Asian employees and white employees within AcqDemo.7 As shown in Table 6.6, we found no statistically significant difference in starting salaries, overall salaries, salary growth, or promotions between Asians and whites within AcqDemo, after controlling for other factors. The same patterns were present within the weighted control group of GS employees in ADEOs. Our estimates did reveal differences in retention between Asians and whites in AcqDemo. After controlling for other factors, the hazard of separation was 1 1 .7 percent lower for Asians in AcqDemo than for whites in AcqDemo. For the average AcqDemo employee, this amounts to an increase in the four-year
Table 6.5 Career Outcomes of Asians in AcqDemo Relative to Those of Asians in the GS System, September 30, 201 1 , Cohorts
Career Outcome
Retention
Starting salary
Salary level
Salary growth
Promotion
Comparison to a Weighted Control Group of Asians in AcqDemo-Ellgible Organizations in the GS System
No statistically significant difference
$15,145 higher in AcqDemo
$0 to $1,300 higher in AcqDemo
No statistically significant difference
N/A
SOURCES: DMDC civilian personnel inventory and transaction files; DAWIA personnel files.
NOTES: The data presented include only permanent, full-time employees in AcqDemo whose compensation was at least $15,080, the salary equivalent of working a full year at federal minimum wage. The dollar figures listed are in 201 5 dollars. The starting salary estimate is based on the population of employees who were newly hired in FY 2011 to FY 2015, rather than the September 30, 201 1 , cohort. The estimates for salary level and salary growth exclude employees on retained pay and are conditional on continued DoD employment. All estimates are statistically significant at the 1 -percent level, except the salary level estimate. which is significant at the 5-percent level.
7 We executed the analyses in this section by reestimating the full-sample regression models described in Chapter Five and including interactions between the AcqDemo indicator and the race-based dummy variables. For more information on this approach, sec Appendix C.

100 2016 Assessment of the Civilian Acquisition Workforce Personnel Demonstration Project
Table 6.6 Career Outcomes of Asians in AcqDemo Relative to Those of Whites in AcqDemo, September 30, 2011, Cohorts
Outcome for Asians in AcqDemo Disparity in AcqDemo Relative Relative to Outcome for to Disparity in AcqDemo-Eligible
Career Outcome Whites in AcqDemo Organizations in the GS System
Retention Four-year retention rate No statistically was 2.2 percentage points higher significant difference
Starting salary No statistically No statistically significant difference significant difference
Salary level No statistically No statistically significant difference significant difference
Salary growth No statistically No statistically significant difference significant difference
Promotion No statistically No statistically significant difference significant difference
SOURCES: DMDC civilian personnel inventory and transaction files; DAWIA personnel files.
NOTES: The data presented include only permanent, full-time employees in AcqDemo whose compensation was at least $1 5,080, the salary equivalent of working a full year at federal minimum wage. The dollar figures listed are in 2015 dollars. The starting salary estimate is based on the population of employees who were newly hired in FY 201 1 to FY 201 5, rather than the September 30, 201 1 . cohort. The estimates for salary level and salary growth exclude employees on retained pay and are conditional on continued DoD employment. For the full set of estimated coefficients, see Appendix C, Tables C.13 through C.17.
retention rate of about 2 percentage points. A similar disparity was present among GS employees in ADEOs.
Perceptions of Career Outcomes Among Asian Employees
Figures 6.2, 6.3, and 6.4 indicate that, after controlling for a number of factors, there were no statistically significant differences between the sentiments of Asian respondents and the sentiments of white respondents with respect to retention or pay. This is entirely consistent with the compensation outcomes reported in Table 6.6 but not with the retention outcome reported in the same table. However, we caution against placing much weight on this discrepancy because the survey item and estimates of actual retention are not well aligned, as explained earlier.
Asian AcqDemo participants expressed positive sentiments regarding their promotion opportunities. Asian survey respondents were as likely as white respondents to report satisfaction with their promotion opportunities, which is consistent with there being no discernible. difference in promotion rates between Asian AcqDemo participants and white AcqDemo participants. However, Figure 6.5 shows that Asian respondents were more likely than white respondents to report positive sentiments regarding AcqDemo's influence on their promotion opportunities, despite the lack of a discernible promotion disparity both within AcqDemo and within ADEOs in the GS system.

Hispanics
How Has AcqDemo Performed So Far? Protections for Diversity 101
People of Hispanic origin constitute more than 5 percent of the AcqDemo workforce, which is slightly lower than their representation within the population of GS workers in ADEOs. It is important to note that the Hispanic designation overlaps with the racial categories described in previous analyses: Those who identify as Hispanic may be of any race. This section presents our assessment of the protections that AcqDemo provides for Hispanic employees.
Comparison to Hispanics in the GS System
The four-year retention rate for Hispanic employees in AcqDemo was 80.8 percent, and the corresponding rate for the weighted control group of Hispanic GS employees in ADEOs was a nearly identical 80.9 percent. The difference in rates between the two groups was not statistically significant. When examining newly hired Hispanic employees, we found that starting salaries were $8,815 higher for AcqDemo participants than for comparable GS employees in ADEOs. When examining salary levels more generally, we found that annualized basic pay was $800 to $1 ,300 higher in AcqDemo, after controlling for other factors. However, there was no statistically significant difference between the rate of salary growth for Hispanics in AcqDemo and the rate for comparable Hispanics in ADEOs in the GS· system. We were not able to obtain reliable estimates of AcqDemo's effect on promotion for Hispanic employees. Table 6.7 summarizes our comparison of the career outcomes of Hispanics in AcqDemo with those of Hispanics in ADEOs in the GS system.
Table 6.7 Career Outcomes of Hispanics in AcqDemo Relative to Those of Hispanics in the GS System, September 30, 201 1, Cohorts
Career Outcome
Retention
Starting salary
Salary level
Salary growth
Promotion
Comparison to a Weighted Control Group of Hispanics in AcqDemo-Eligible Organizations in the GS System
No statistically significant difference
$8,81 5 higher in AcqDemo
$800 to $1,300 higher in AcqDemo
No statistically significant difference
N/A
SOURCES: DMDC civilian personnel inventory and transaction files; DAWIA personnel files.
NOTES: The data presented include only permanent, full-time employees in AcqDemo whose compensation was at least $1 5,080, the salary equivalent of working a full year at federal minimum wage. The dollar figures listed are in 2015 dollars. The starting salary estimate is based on the population of employees who were newly hired in FY 201 1 to FY 2015, rather than the September 30, 201 1, cohort. The estimates for salary level and salary growth exclude employees on retained pay and are conditional on continued DoD employment. All estimates are statistically significant at the 1 -percent level.

1 02 2016 Assessment of the Civilian Acquisition Workforce Personnel Demonstration Project
Comparison to Non-Hispanics in AcqDemo
This section compares the career outcomes of Hispanic employees and non-Hispanic employees within AcqDemo. 8 It is important to note that both Hispanics and non-Hispanics may be of any race. More specifically, Hispanics need not be nonwhite, and non-Hispanics need not be white. As shown in Table 6.8, we found no statistically significant difference in starting salaries,. salary growth, or promotions between Hispanics and non-Hispanics within AcqDemo, after controlling for other factors. The same patterns were present within ADEOs in the GS system. Our estimates did reveal a difference in salary levels between Hispanics and nonHispanics in AcqDemo, but only in FY 2012; we found no statistically significant difference in FY 2013, FY 2014, or FY 2015. Within ADEOs in the GS system, there were no discernible salary disparities between Hispanics and non-Hispanics in any of the four years. In addition, the hazard of separation was 34.8 percent higher for Hispanics in AcqDemo than for nonHispanics in AcqDemo, after controlling for other factors. For the average AcqDemo employee, this amounts to a reduction in the four-year retention rate of about 3 percentage points. A similar disparity was present among GS employees in ADEOs.
Perceptions of Career Outcomes Among Hispanic Employees
The sentiments expressed by Hispanics in AcqDemo did not differ significantly from those expressed by non-Hispanics in AcqDemo. After controlling for a number of characteristics,
Table 6.8 Career Outcomes of Hispanics in AcqDemo Relative to Those of Non-Hispanics in AcqDemo, September 30, 2011, Cohorts
Career Outcome
Retention
Starting salary
Salary level
Salary growth
Promotion
Outcome for Hispanics in AcqDemo Relative to Outcome for Non-Hispanics
ln AcqDemo
Four-year retention rate was 3.2 percentage points lower
No statistically significant difference
Salary level was $1,374 lower in FY 2012; no statistically significant differences
in later years
No statistically significant difference
No statistically significant difference
Disparity in AcqDemo Relative to Disparity in AcqDemo-Eligible Organizations in the GS System
No statistically significant difference
No statistical ly significant difference
Gap between Hispanics and non-Hispanics was larger in AcqDemo in FY 2012;
no statistically significant differences in later years
No statistical ly significant difference
No statistically significant difference
SOURCES: DMDC civilian personnel inventory and transaction files; DAWIA personnel files.
NOTES: The data presented include only permanent, full-time employees in AcqDemo whose compensation was at least $1 5,080, the salary equivalent of working a full year at federal minimum wage. The dollar figures listed are in 2015 dollars. The starting salary estimate is based on the population of employees who were newly hired in FY 201 1 to FY 201 5, rather than the September 30, 201 1 , cohort. The estimates for salary level and salary growth exclude employees on retained pay and are conditional on continued DoD employment. For the full set of estimated coefficients, see Appendix C, Tables C.13 through C.17.
8 We executed the analyses in this section by reestimating the full�sample regression models described in Chapter Five and including the interaction between the AcqDemo and Hispanic indicators. For more information on this approach, sec Appcndix C.

How Has AcqDemo Performed So Far? Protections for Diversity 1 03
there was not a single discernible difference between the responses submitted by Hispanic employees and non-Hispanic employees on satisfaction with pay or promotion opportunities, the influence of AcqDemo on satisfaction with pay or promotion opportunities, or retention after one year. This result is largely consistent with the compensation and promotion outcomes documented in Table 6.8 but not with the retention outcome: Hispanic employees in AcqDemo were more likely to separate from the DoD civilian workforce than were nonHispanic employees in AcqDemo. However, we caution against placing much weight on this discrepancy because the survey item and estimates of actual retention are not well aligned, as explained earlier.
Summary
To assess how well AcqDemo has fared in providing protections for diversity, we examined how the career outcomes of AcqDemo participants varied with gender and race or ethnicity. In addition, we compared career outcomes in AcqDemo with those in the GS comparison group for four distinct subpopulations: women, blacks, Asians, and Hispanics. Throughout, we compared the outcomes estimated using the administrative data with the perception of these outcomes as indicated by responses to the AcqDemo survey.
Within AcqDemo, there were no gender gaps with respect to salary level or salary growth; however, starting salaries, promotion, and retention were measurably lower for women in AcqDemo than for their male counterparts. Interestingly, within ADEOs in the GS system, promotions occurred more frequently among women than among men. In comparing women in AcqDemo with women in the GS system, we found that after controlling for a wide array of factors, AcqDemo paid higher starting salaries and higher overall salaries, but salaries rose at a faster rate and promotions occurred more frequently for statistically similar women in the GS system. Sentiment regarding career outcomes did not vary much by gender. There were no discernible differences between the responses of women and men with regard to retention in one year, satisfaction with pay, satisfaction with promotion opportunities, or AcqDemo's influence on satisfaction with promotion opportunities. However, women were less likely than men to express positive sentiments about AcqDemo's influence on satisfaction with their pay.
After controlling for other factors, black employees in AcqDemo fared worse than their white counterparts in terms of starting salaries and salaries more generally but were more likely to be retained. In comparing black employees in AcqDemo to statistically similar black employees in the GS system, we found that AcqDemo paid higher starting salaries and higher overall salaries, but salaries increased at a faster rate for black employees in the GS system. Due to the small size of the sample, we were not able to obtain a reliable estimate of the promotion difference between black employees in AcqDemo and comparable black employees in the GS system. As an alternative, we executed the promotion analysis using an aggregated data set of nonwhite employees, of whom 59 percent were black and the remainder belonged to other nonwhite racial groups. After controlling for other factors, we found that nonwhite employees in AcqDemo experienced 34 percent fewer promotions than nonwhite GS employees in ADEOs did.Jhis means that for the average nonwhite employee, AcqDemo participation reduced the probability of promotion from about 19 percent to about 13 percent. Sentiment regarding retention and pay was less positive among black AcqDemo participants than among white AcqDemo participants. However, black and white survey respondents were equally likely to

104 2016 Assessment of the Civilian Acquisition Workforce Personnel Demonstration Project
report satisfaction with their promotion opportunities, and black respondents were more likely to report positive sentiments regarding AcqDemo's influence on their promotion opportunities.
Within AcqDemo, Asian and white employees fared equally well with respect to compensation and promotion. Retention was higher among Asians in AcqDemo than among comparable whites in AcqDemo, but the same pattern was present within ADEOs in the GS system. In comparing Asians in AcqDemo to Asians in the GS system, we found that starting salaries and overall salaries were higher in AcqDemo, but there were no discernible differences in salary growth or retention across the two groups. The sentiments reported by Asian and white survey respondents were similar. There were no discernible differences with respect to retention or pay. However, Asian respondents were more likely than white respondents to report positive sentiments regarding AcqDemo's influence on their promotion opportunities.
We found no discernible differences in compensation or promotion between Hispanic and non-Hispanic employees in AcqDemo. Hispanic AcqDemo participants were more likely to separate from the DoD civilian workforce than were their non-Hispanic counterparts, but this disparity was no better or worse than the disparity present within ADEOs in the GS system. In comparing Hispanics in AcqDemo to Hispanics in the GS system, we found that AcqDemo paid higher starting salaries and higher overall salaries, but there were no statistically significant differences in salary growth or retention. The sentiments reported by Hispanic and non-Hispanic survey respondents were similar: There was not a single discernible difference with respect to pay, promotion, or retention.

CHAPTER SEVEN
How Has AcqDemo Performed So Far? Barriers to Flexibil ity Usage, Support for M ission Needs, and Overal l Effectiveness
Earlier in the reportf we described AcqDemo's flexibilities related to hiring, appointments, and performance appraisal, discussed how they were intended to help organizations better meet mission needs, and used different data sources to convey how those flexibilities have been implemented thus far. In this chapter, we identify three barriers1 we believe are limiting the use of AcqDemo's flexibilities: pay caps, employees' lack of confidence in AcqDemo, and AcqDemo's resource-intensive nature. We also draw from our data sources to suggest how AcqDemo is supporting acquisition-related mission needs. Specifically, AcqDemo seems to have an influence at different levels: organization, work group, employee, and leader. Finally, we apply our evidence to Lawler's effectiveness criteria for performance-based personnel management systems (Lawler, 1971; Lawler, 1975) to assess how AcqDemo is faring along those lines. In doing so, we provide insights related to the following criteria:
• NOAA criterion E: how the project helps organizations better meet mission needs • NOAA criterion F: an analysis of how the flexibilities in points B and C are used and
what barriers have been encountered that inhibit their use.
Barriers to Use of Flexibilities
Pay Caps
As explained in Chapters Two and Four, AcqDemo participants are subject to a number of caps on their compensation. Some of them are caps that apply to all federal agencies that use the GS system, whereas others are AcqDemo-specific and vary across organizations, depending on their AcqDemo business rules. In particular, salary increases are restricted for employees on retained pay, employees at the top of their pay bands, and employees whose salaries hit control points within their pay bands. In its January 2016 summary of CCAS 2015 results, CSRA Inc. reported that 39 percent of AcqDemo employees were subject to a pay cap. This estimate includes employees whose salaries are constrained by control points but excludes employees on retained pay. This figure appears relatively stable: In 2012, CSRA Inc. reported that pay caps affected 42 percent of AcqDemo employees (Werber et al., 2012). Administrative data provided to us by DMDC indicate that 6 percent of AcqDemo employees were on retained
1 We used a definition of barrier from the Merriam-Webster dictionary: "Something immaterial that impedes or separates: obstacle." (Merriam-Webster.com, undated)
105

106 2016 Assessment of the Civilian Acquisition Workforce Persor:mel Demonstration Project
pay on September 30, 2015. In addition, there are business rules that limit pay-setting to avoid situations in which a large number of employees enter AcqDemo at the top of their pay bands.
Some of these pay caps are artifacts of the GS system. As shown in Figure 2 . 1 , each AcqDemo broadband corresponds to two or more GS grades. Accordingly, the pay cap that applies to AcqDemo employees at the top of the NH-2 broadband is a byproduct of the pay cap that applies to GS-1 1 employees who are at step 10. Similarly, the pay cap that applies to AcqDemo employees at the top of the NH-3 broadband is a byproduct of the pay cap that applies to GS-13 employees who are at step 10. Nevertheless, the fraction of AcqDemo employees whose salaries are constrained by being at the top of their pay bands is relatively large. At the end of FY 2015, 20 percent of AcqDemo employees were at the top of their pay bands, while only 14 percent of GS employees in ADEOs were at step 10 of their respective grades. The differential appears particularly large when one considers that the 14 percent includes employees whose GS grades are in the interior of the corresponding AcqDemo broadbands.
The pay caps that apply to federal employees in general and to AcqDemo employees in particular are intended to promote cost discipline. However, these pay caps present a greater challenge to AcqDemo's implementation than to that of the GS system for two reasons. First, pay caps are more prevalent among AcqDemo participants than among GS employees, as noted above. Second, pay caps run counter to one of AcqDemo's central tenets, which is that employees should be appropriately rewarded for their contributions to organizational mission. As in the GS system, the pool of funds available for salary increases in AcqDemo is limited. However, maintaining the integrity of AcqDemo's foundation as a performance-based pay system requires that the distribution of this limited pool of funds be determined by, or at least strongly associated with, differences in employee contribution. Pay caps erode this association, and with roughly 40 percent of the workforce subject to a pay cap in FY 2015, the degree of that erosion could be significant. Write-in responses from the survey included concerns about how this practice undermined AcqDemo's intent:
Pay lanes were instituted putting artificial cap on salaries within the pay bands, they need to end. I am not at top of broadband, but above cap so no more pay raises. This defeats [the] purpose of performance-based pay and also breaks a promise to employees they could rise in pay up to top of band if they performed well. (respondent 14741; Army; supervisor)
The organization does not use AcqDemo to their benefit. They create artificial ceilings within each band to limit employee growth. This basically treats AcqDemo like the GS system and this practice limits the ability to recognize high performers within the command. (respondent 13458; Marine Corps; employee)
During interviews, SMEs told us that CRI carryover awards mitigate this barrier for high contributors. For example, one explained:
I hear about the impact for step 10s coming into AcqDemo. Individuals at step 10 of GS-12 have the ability for salaries to increase because they are no longer stopping at step 10; they can move up in the broadband to salaries at the GS-13 level. The 13-lOs and the 15-IOs don't have opportunity for pay increases, but do have opportunity for bonuses every year. For most people, you're going to walk out with a larger award because the GS increase will be less than 1 percent and it could be more than 1 percent in AcqDemo. But the concern among some is, "I'm at top of band, what are you going to do for me?" {SME 20)

Barriers to Flexibility Usage, Support for Mission Needs, and Overall Effectiveness 1 07
As we touched on in our discussion of the use of performance appraisal flexibilities in Chapter Five, the majority (85 percent) ofindividuals at the top of their pay bands did receive a CRI carryover award following the FY 2015 appraisal cycle. Table 7.1 compares CRI increases and CRI carryover awards received by those at the top of their pay bands with analogous figures for those not at the top of their pay bands. The data suggest that awards do not fully compensate for pay caps. In the FY 2015 appraisal cycle, the sum of the two award amounts averaged (median) 1 .8 percent of basic pay for employees at the top of their pay bands, compared with 2 .2 percent for employees not at the top of their pay bands. Moreover, those in the latter group typically received permanent salary increases in the form of CRis, while those in the former group did not. Thus, pay caps may be affecting AcqDemo's ability to provide greater rewards to high contributors. With 20 percent of AcqDemo participants at the top of their pay bands, this effect could be significant. We were unable to compute similar statistics for individuals subject to control points within pay bands, a population that constitutes another sizeable proportion of the AcqDemo workforce.
Employees• Lack of Confidence in AcqDemo
Employee perceptions of the aforementioned pay cap barrier, along with views that AcqDemo falls short in terms of both transparency and fairness, are the basis for another barrier: employees' lack of confidence in AcqDemo. These perceptions undermine employees' belief that contribution influences pay, one of AcqDemo's main tenets. Chapter Five presented evidence that increases in .llOCS were associated with both higher salaries and higher rates of salary growth. However, survey responses suggest that employees are skeptical. Only about 40 percent agreed that their pay raises depended on their contribution to the mission, and a similar percentage agreed that their salaries were more directly tied to their contributions under AcqDemo than
Table 7.1 Compensation Actions by Pay Band Position, FY 2015 Appraisal Cycle
Total count
Contribution Rating Increase (CRI)
Count
CRI as a percent of basic pay (median)
CRI carryover Award
Count
CRI carryover award as a percent of basic pay (median)
CRI or CRI Carryover Award
Count
Sum of CRI and CRI carryover award as a percent of basic pay (median)
Top of Pay Band
3,239
1 , 170
0.01 %
2,766
1 .79%
2,772
1 .79%
SOURCE: Administrative data provided by the AcqDemo Program Office.
Not at Top of Pay Band
12,699
9,762
2.1 5%
3,340
1 .30%
1 1 ,227
2.21 %
NOTE: The data presented include only permanent, ful l-time employees in AcqDemo whose compensation was at least $15,080, the salary equivalent of working a ful l year at federal minimum wage.

108 2016 Assessment of the Civilian Acquisition Workforce Personnel Demonstration Project
under the GS system. The remainder either expressed neutral views or disagreed. These results, which control for an array of characteristics, did not differ statistically across the 2012 and 2016 surveys. Additional analysis revealed that nonsupervisors were even less likely to agree that their pay raises depend on their contribution to the organization's mission.
The following comments from survey respondents offer some explanations for these results:
Pay pool results did not reflect the desire to compensate those most contributing to the mission during the reporting period as much as they reflected the desire to equalize pay and level the playing field . . . . Payouts, in many cases, did not reflect individual accomplishments that directly supported the organization's mission. (respondent 13334; Navy; employee)
[T]he link between performance and rating seems somewhat tenuous. For example, the difference between a 79 and an 81 in AcqDemo is less clear than the difference between a 2 and a 1 in GS. There is also the concern that some factors are harder to tie to mission contributions, descriptors, and discriminators than others. (respondent 18068; Army; supervisor)
There is no incentive to perform other than my personal work ethic. High performers are not rewarded. The pay for performance system is based on "taking turns.,, (respondent 13940; Marine Corps; employee)
My employees now understand there is no link between contribution and pay. They are not ignorant and see that their peers with far less contributions receive the same pay increase. (respondent 17342; DoD agency; supervisor)
The discrepancy between the evidence presented in Chapter Five and the sentiments reported by most survey respondents is difficult to reconcile. One possibility is that while the link between D.OCS and salary increases remains intact, the link between contribution and OCS may be tenuous.
Perceptions about a lack of transparency also contribute to employees' lack of confidence in the system. Qualitative evidence reveals concerns about a lack of transparency around (1) business rules, especially control points; (2) the process by which ratings are calculated and translated to pay; (3) pay pool processes; and (4) pay pool results, including how employees compare with their peers:
Business rules
Control points are used in each pay band and for each position to limit the maximum pay available to that billet. These control points are treated as secret and an employee is only provided the control point for his position. It is impossible to plan on a career progression when you don't know the pay for the possible future positions. I have no idea what the pay is for a position above mine. The control points for all positions should be provided to all employees. (respondent 15005; Air Force; employee)
The administration of AcqDemo is a big secret in my organization. Control points are not readily available to employees and are not included in PDs or in job announcements. I have
Barriers to Flexibility Usage, Support for Mission Needs, and Overall Effectiveness 109
been here two years and still only have a vague idea what my control points are for this job. (respondent 14032; Air Force; employee)
Ratings calculation
Neither [organization name] nor [organization name] has ever fully explained how our pay levels and contributions are computed. There are algorithms embedded in spreadsheets that they will not reveal. Their secretiveness leads me to believe our leadership is intentionally hiding something they are afraid of letting us know. (respondent 14510; Army; employee)
It's not transparent. It's not for lack of trying . . . in NSPS, you'd get shares and each person would figure out how much money they'd get for each share. In AcqDemo, there's no way to compute what the payouts are going to be because there's a big algorithm that does it. Over time, I learned based on consistency year after year what a plus 1 looks like for someone in the 90 range, 80 range . . . but in terms of employees, they don't know until they get their first paycheck after evaluation what the payout will be. It's an opaque process in terms of payout. (SME 15)
The AcqDemo methodology for pay increases is terrible. It is a secret black box formula that makes something simple (determining pay raise and/or bonus) exceedingly complex and opaque. Supervisors don't even know which complex formula will be used, since executive leadership determines which "rail" to base calculations on. (respondent 14983; DoD agency; supervisor)
Pay pool process
Before AcqDemo, people didn't like that one person has power over their appraisal. On the flip side now, people don't like that a pay pool panel is responsible for this because the member may not know the employee. The process feels like a black box to some people. We could do better to make people comfortable with this. (SME 2)
No transparency into the inner workings of the pay rewards process. Appraisals are subjective. (respondent 15850; Marine Corps; employee)
Pay pool results
There is no transparency. I have no idea what the other individuals get and how they are treated when it comes to ratings. Results are not shared even ifit was without name association. (respondent 17772; Army; supervisor)
Command has not announced whether it will provide statistics and trends for contribution payouts and bonuses across the command. While individual scores and info should be kept private, failure to publish command-wide trends and statistics breeds mistrust in the command and dissatisfaction with AcqDemo. (respondent 13074; Marine Corps; employee)
AcqDemo scores are hidden behind the scenes. No one really knows how [the] pay pool works or what the dialogue is during the pay pools. It's impossible to see how your score compares to peers' scores. (respondent 14067; Army; employee)

1 10 2016 Assessment of the Civilian Acquisition Workforce Personnel Demonstration Project
In our qualitative analysis, we examined the extent to which views surrounding a particular theme varied in their tone and content, as well as the extent to which these views diverged across data sources. As indicated by the exemplar quotes presented earlier, the views expressed by the SMEs and survey respondents were generally consistent with respect to the transparency of business rules, ratings calculations, and pay pool processes. However, there was one area in which the perceptions of the SMEs and survey respondents differed notably: the transparency of pay pool results. The SMEs with whom we spoke discussed the requirement to share those outcomes in aggregate and the practices for doing so, such as town halls, which we outlined in Chapter Four. Perhaps the reason for this discrepancy is that employees would like a finer level of detail, such as by pay pool, although some organizations do report results by job series and pay band.
The transparency issues noted were often closely intertwined with concerns about AcqDemo's lack of fuirness:
The mechanics behind the appraisal process is like "the man behind the curtain:,, no one knows what's going on or how the process works. What are the methods used to get to a ·rating, a salary dollar figure, and the value of a performance award? This leaves little room for belief that the system works fairly, which leads to my second concern. (respondent 18451; Army; supervisor)
Rating averages across the different business units are not transparent . . . which creates suspicion of fairness. (respondent 16763; DoD agency; supervisor)
[Organization name] approved Business Rules for FY16 in December 2015. They did not send them to the workforce until January 2016. This is almost four months in FY16. Control Points were added to the business rules and they have never discussed these with the workforce. Our immediate management was even surprised by this and do not understand how control points work nor to whom they apply. Why are business rules not available at the beginning of the rating period? How are we to know if pay is distributed fairly? (respondent 16810; Army; employee)
There were also perceptions of unfair treatment or results that seemed distinct from problems with transparency. Other issues perceived to contribute to a lack of fairness were AcqDemo's subjectivity, favoritism or a "good old boys' network," and bias related to such factors as writing ability or position visibility. The following set of comments illustrates such sentiments:
This system does not provide pay for performance but does enhance cronyism. Additionally, at my organization they have made it a numbers game. Rather than pay based on performance, they finagle the ratings so that they can pay people what they want. (respondent 17246; organization not provided; employee)
Even though the pay pool is supposed to be a fair and equitable way of rewarding people, I believe that favoritism is still predominate [sic] within the pay pool. (respondent 1 6718; Air Force; supervisor)
The problem with AcqDemo is that supervisors rate personnel with bias. It is a subjective tool to measure performance, rather than objective. (respondent 18237; Army; employee)

Barriers to Flexibility Usage, Support for Mission Needs, and Overall Effectiveness 1 1 1
Pay is based on writing skills, supervisor's writing skills, and politics. (respondent 1751 1 ; Army; supervisor)
Unless yo� are working on a program with high visibility, you will not get awards or recognition . . . . What part of the organization and what programs get· assigned by supervisors has more to do with who gets recognized than work does. (respondent 16908; Army; employee)
Unlike the views expressed regarding AcqDemo's transparency, the perceptions reported regarding AcqDemo's fairness included a relatively small share of positive sentiments, such as the following:
AcqDemo is administered fairly within my Program Management Office but from my experience is not administered in this same manner across all of the programs within my [OFFICE] or between other offices. (respondent 13544; no organization provided; supervisor)
The process is as fair as anyone should expect. I'm a 24 year retired veteran and the evaluation process is as fair as it can get in my opinion. Everyone needs to realize there is no perfect system. Each employee must earn their evaluation; the process will not give you an increase. Each person is responsible for their professional development and work ethic. The process is designed to reward each employee based on [his or her] contributions and I believe the process is doing that in most cases. (respondent 13323; Army employee)
The last AcqDemo appraisal period cook longer but was much more fair and fulfilling than the previous one as management recently changed. (respondent 14813; no organization provided; supervisor)
I believe it is done fairly but it is hard to know where you stand with your co-workers. I know we all must strive to do the best we can 100 percent of the time but it's nice to know where you rank with others. {respondent 16764; Army; supervisor)
We did not find any survey write-in responses that explicitly addressed fairness without offering some form of negative sentiment in conjunction with it.
The qualitative perceptions summarized above do much to explain why the lack of confidence in AcqDemo is present within its workforce. Quantitative data from the survey provide additional insights about the pervasiveness of this barrier. Like many performance-based demonstration projects for government civilian personnel, AcqDemo has monitored perceptions of fairness through widely used survey measures. A comparison of performance-based government personnel systems showed that in its early history, AcqDemo fared worse in terms of perceived fairness than other systems (Schay and Fisher, 2013). For example, while other demonstration projects showed improvement over time in perceptions of fair pay administration, perceptions among AcqDemo employees did not change significantly in this regard, hovering around 40 percent in agreement. Figure 7. 1 shows employee responses to the survey item addressing fairness in pay administration, as well as the responses to a related survey item addressing comfort with the administration of the contribution appraisal system. In all

112 2016 Assessment of the Civilian Acquisition Workforce Personnel Demonstration Project
cases, the percentage of respondents who agreed or strongly agreed with the statements about AcqDemo's adminiscrarion fell below 40 percent.2
Figures 7.2 through Figure 7.5 show responses to the same questions broken down by gender (Figures 7.2 and 7.3) and race (Figures 7.4 and 7.5). After controlling for a number of factors, we found that women were less likely than men to agree with these statements in both 2012 and 2016. Ic is clear that women perceived the pay actions and CCAS process to be less fair than men did. As we discussed in Chapter Six, there is some basis for the disparity in views: Within AcqDemo, starting salaries were measurably lower for women than for men, even after controlling for an array of other factors. Turning our attention to race, black employees were significantly less likely than white employees to agree that their organization administers pay fairly, as shown in Figure 7.4. Black employees were also less l ikely than white employees to be comfortable with the contribution appraisal system in 2012, but this was no longer the case in 2016. These perceptions have some empirical grounding as well: As oudined in Chapter Six, starting salaries and salary levels were lower among blacks than among whites within AcqDemo.
Figures 7.6. 7.7, and 7.8 feature the level of agreement with items that focus on the supervisor instead of the organization. Figure 7.6 summarizes responses for all survey respondents, and Figures 7.7 and 7.8 provide breakdowns by gender. The proportions of respondents who agree that supervisors are fair in recognizing individual and team contributions are about 10 percentage points higher but still well short of a majority view. In addition, a gender difference is clearly presenr, with female employees significantly less likely to agree that their supervisors are fair in recognizing either type of contribution. With respect to individual con-
Figure 7.1 Employee Perceptions of AcqDemo's Administration
20 1----l
My organization administers pay fairly
SOURCE: 2012 and 2016 AcqDemo surveys.
I am comfortable with the way my organization administers the contribution appraisal system
NOTE: Bars indicate the percentage of employees who agreed or strongly agreed with the statement. The remainder of respondents expressed a neutral view, disagreed, or strongly disagreed. Differences between the two years were not statistically significant. RAND RR1783·7.J
2 The full sec of Likerr scale responses, ranging from strongly agree to strongly disagree wich a neutral midpoint, is provided in Appendix A.

Figure 7.2
Barriers to Flexibility Usage, Support for Mission Needs, and Overall Effectiveness 1 13
Employee Perceptions of AcqDemo's Administration of Pay, by Gender
-+- Male
-@-- Female
60 ----------------·-----.. ----·---·--------·-·-------·- -- -----
Cl1 C'I ns +.# c 40 --··-- · � • Cl1 A. 1------------------....... -=-------=---lm IE1I
20
0 ._ _______________ • __________________________________ , ______________ __ 2012*
My organization administers pay fairly
SOURCE: 201 2 and 201 6 AcqDemo surveys.
201 6*
NOTES: Each of the data points indicates the percentage of respondents who agreed or strongly agreed with the statement. The remainder of respondents expressed a neutral view, disagreed, or strongly disagreed. * = A statistically significant difference between the two groups at the 5-percent level. RAND RR1783-7.2
Figure 7.3 Employee Perceptions of AcqDemo's Administration of Contribution Appraisal, by Gender
80 r----�------------------------------+- Male
-m:J.- Female
60 � -- - -------- _________ ___ . __ .. ___ _____ ___ - ------ -·----- . - .. " - -.. ----
40 ·- - · ------------------------·- · ··----·-- ·-----------.-
20 -------
• •
---------------------- ---------·-·-
0 ._ _______________ , __________________________________ , ______________ __ 2012* 2016*
I am comfortable with the way my organization administers the contribution appraisal system
SOURCE: 201 2 and 201 6 AcqDemo surveys. NOTES: Each of the data points indicates the percentage of respondents who agreed or strongly agreed with the statement. The remainder of respondents expressed a neutral view, disagreed, or strongly disagreed. * = A statistically significant difference between the two groups at the 5-percent level. RAND RR1783-7.3

1 14 201 6 Assessment of the Civilian Acquisition Workforce Personnel Demonstration Project
Figure 7.4 Employee Perceptions of AcqDemo's Administration of Pay, by Race
80
60
i a ... E �- $
20 ml=---�---...... ···�-....._ __ .. _
0 I
201 2
My organization administers pay fairly
SOURCE: 201 2 and 201 6 AcqDemo surveys.
Im 1£.
I
201 6
� Asian .... Black ..._ Other -8- white
NOTE: Each of the data points indicates the percentage of respondents who agreed or strongly agreed with the statement. The remainder of respondents expressed a neutral view, disagreed, or strongly disagreed. In both 201 2 and 201 6, blacks and those of other races were significantly less likely than whites to agree that their organization administers pay fairly. RAND RR1783·7.4
Figure 7.5 Employee Perceptions of AcqDemo's Administration of Contribution Appraisal System, by Race
80
-$- Asian
-ml- Black
60 -"'ltr- Other -@- white
:: � ·-::::! � � -- ---�
20
0 I I
201 2 2016
I am comfortable with the way my organization administers the contribution appraisal system
SOURCE: 2012 and 201 6 AcqDemo surveys. NOTE: Each of the data points indicates the percentage of respondents who agreed or strongly agreed with the statement. The remainder of respondents expressed a neutral view, disagreed, or strongly disagreed. In 201 2, blacks and those of other races were significantly less likely than whites to agree that they were comfortable with the way their organizations administered the contribution appraisal system. However, in 201 6, the difference between black and white respondents was no longer statistically significant. RAND RR1183·1.5

Barriers to Flexibility Usage, Support for Mission Needs, and Overall Effectiveness 115
Figure 7.6 Employee Perceptions of Supervisor Fairness
� 60 ·----------------------------------------! ro .... c: Cl> � :. 40 1------1
20 1----l
Supervisors are fair in recognizing individual contributions
SOURCE: 2012 and 2016 AcqDemo surveys.
Supervisors are fair in recognizing team contributions
NOTE: Bars indicate the percentage of employees who agreed or strongly agreed with the statement. The remainder of employees expressed a neutral view, disagreed, or strongly disagreed. Differences between the two years were not statistically significant. RAND RR178J..7.6
tributions, this difference was significant in both years. For team contributions, the gender difference was only significanr in 2016.
Taken together, skepticism about the pay-contribution link-particularly the link between the size of the reward and the value of the contribution-and concerns about transparency and fairness suggest that there are problems with employee perceptions of both procedural and distributive justice. Procedural justice pertains to the perceived fairness of the process through which an outcome was obtained, and distributive justice pertains to the perceived fairness of the outcome itself. The following example from the survey shows that people distinguish between the two concepts:
AcqDemo seems to be administrated fairly. I am just not sure that the compensation is doled out fairly. For example, my co-worker received about the same as I did, however, he wasn't in the position the entire year. I have no major issue with this, but it does go to show that the pay pool isn't entirely fair. (respondent 15843; Army; employee)
The academic literature includes many examples of the negative consequences of low levels of procedural and distributive juscice.3 Accordingly, this barrier might affect the use of
3 Comprehensive reviews of procedural justice and distributive justice research (e.g., Konovsky, 2000; Cohen-Charash and Spector, 2001) show chat both cypes of justice, and in some cases, procedural juscice in particular, are related co job acritudes such as pay sacisfaccion, organizational commitment, motivation, and turnover intentions, as well as work performance-related behaviors, including counterproductive work behaviors and organizational citizenship behavior (i.e., extra-role behaviors seen as going above and beyond role expeccations). These relationships are robusc across settings, and many have been examined wichin the specific contcxr of performance-based pay syscems. For example, Isaac (2001) discussed che importance of perceived fairness in che concexc of performance-related pay. Kim and Rubiancy (2011) determined that percepcions of procedural fairness were associated wich intrinsic mocivacion. Kim (2016) found chat perceived unfairness in performance appraisal, espe-

1 1 6 2016 Assessment of the Civilian Acquisition Workforce Personnel Demonstration Project
Figure 7.7 Employee Perceptions of Supervisor Fairness (Individual Contributions), by Gender
80
I � Male
-IS- Female
60
• • ,.,.,,. -&.:111
20
0 I I
201 2* 201 6*
Supervisors are fair in recognizing individual contributions
SOURCE: 2012 and 201 6 AcqDemo surveys. NOTE: Each of the data points indicates the percentage of respondents who agreed or strongly agreed with the statement. The remainder of respondents expressed a neutral view, disagreed, or strongly disagreed. * = A statistically significant difference between the two groups at the 5-percent level. RAND RR1183-1.1
Figure 7.8 Employee Perceptions of Supervisor Fairness (Team Contributi�ns), by Gender
80
60
.... ..,. � .... ..... -
20
0 I I
2012 201 6*
Supervisors are fair in recognizing team contributions
SOURCE: 2012 and 201 6 AcqDemo surveys.
� Male
-S- Female
NOTE: Each of the data points indicates the percentage of respondents who agreed or strongly agreed with the statement. The remainder of respondents expressed a neutral view, disagreed, or strongly disagreed. * = A statistically significant difference between the two groups at the 5-percent level. RAND RR1183·1.8

Barriers to Flexibility Usage, Support for Mission Needs, and Overall Effectiveness 117
AcqDemo' s flexibilities by diminishing employees' motivation to participate fully in the CCAS process. For example, employees may not believe it is worth the time and effort to write thorough self-assessments or to engage their supervisors in a meaningful dialogue about how they can improve their contribution to the mission. Moreover, as we discuss later in this chapter, the lack of confidence in AcqDemo may lead to negative job attitudes and behaviors, such as low commitment and reduced productivity, which in turn may compromise organizations' ability to achieve their missions.
It is important to note that this barrier is fueled in part by a misperception, which is that no link between contribution and pay exists in AcqDemo. This means that AcqDemo leadership may be able to minimize this barrier through communication strategies. Some survey respondents were aware of this opportunity and offered remarks that suggest there is nothing to hide:
Although not a problem with the administration of AcqDemo, transparency of the process can always improve. There is still a misperception with some of the workforce that feel that evaluations are not appropriately discussed and adjusted during the sub-pay and pay pools. When new supervisors enter the process for the first time, they are often surprised and pleased in the amount of discussion and work that is conducted during the sub-pay and pay pools and how fair the process actually is. If this could somehow be better translated to individuals who are not directly involved in process [they] can have an appreciation of the fairness in the process. {respondent 14121; Marine Corps; supervisor)
However, improving the perceptions of fairness held by female and black employees might prove to be more challenging, given that their views of inequity have a valid basis.
AcqDemo's Resource-Intensive Nature
The amount of management time required to implement performance-based systems is a common problem (Pfeffer, 1998), and one that seems to have affected AcqDemo. Specifically, the time, effort, and administrative burden associated with AcqDemo may influence how the performance appraisal flexibilities are used. Appraisal writing, feedback sessions, and pay pool administration were cited in both our interviews and the survey as time-consuming processes that seemed inefficient. The following comments, one from an employee and the other from a pay pool manager, provide a thorough overview of the concerns:
Process is overly burdensome for everyone involved. Employees have to write novels detailing their accomplishments. Supervisors have to write a novel on each employee or risk not getting them a .60CS . . . . Employees cake a day each to write assessments. Supervisors (if doing it correctly) can cake two-three full workdays to write assessments. The pay pool process takes senior-level civilians days to deliberate. When added together, the Agency takes a large amount of time {and cost) for something that is widely viewed as a writing contest. Doing some quick math with the above assumptions the agency spends 32,000 hours[,] 4000 work days[,] 16 man years[, or] $2-2.SM every year just writing and administering the existing process (this is simply the writing and evaluating process, not appeals or improving/evaluating system performance). The largest frustration expressed by many
cially a perceived lack of clarity in appraisal criteria and politicization of the appraisal process, had a significant relationship with the performance-based pay system's effectiveness.

1 18 2016 Assessment of the Civilian Acquisition Workforce Personnel Demonstration Project
is the amount of time required to write the annual appraisals. (respondent 17036; DoD Agency; supervisor)
We spend three days conducting subpanels, one to two days on the supervisor panel, and a half day on the integration panel. The set-up time and prepping: each person reads 120 supervisor appraisals, and they've rated everything they've read, which probably takes several days. Most of the folks on the panel probably do it at night outside of business hours. We could probably add another day to let them read, but trying to be efficient for time ends up being inefficient for the individual. The administration of the panels is mostly on HR. (SME 7)
Although these comments-and others-provide rough estimates of the time and administrative costs involved, there were no data available that would have enabled us to accurately quantify the amount of time spent by employees, supervisors, pay pool managers, pay pool panel members and administrators, data maintainers, and other personnel involved in supporting AcqDemo's implementation. The data issues were exacerbated because AcqDemo is managed by participating organizations (rather than centrally managed) and varies accordingly. CAS2NET also has its costs: The Executive Council meeting minutes included many discussions of requested CAS2NET revisions and planned software updates. But again, the actual resource investment data were not readily available to quantify this administrative cost. Instead, we relied exclusively on the perceptions of personnel, which were conveyed in the following remarks from employees:
The way che system is implemented requires volumes and volumes of writing (for employee input) at least twice a year. The amount of time and effort required co implement che system is completely outsized for any possible benefit. In an organization where all employees are GS-IS equivalent or SES, there's no point at all in taking the trouble to administer AcqDemo. (respondent 13148; DoD agency; employee)
AcqDemo requires too much administrative activities to be efficient. Employees, supervisors, and managers must spend an inordinate amount of time to make this system work. We write lengthy write-ups for each employee in CAS2NET and then [are] asked to bulletize it for the pay pools. . . . to include several racking and stacking efforts. (respondent 13262; Marine Corps; supervisor)
While I don't think the problem is unique to my location, federal employees spend far much time and effort dealing with AcqDemo. The self-assessments and process of determining AcqDemo ratings are labor-intensive and a waste of taxpayer dollars. (respondent 16475; DoD agency; employee)
Another employee focused on how this problem is compounded by the challenges of the other two barriers-pay caps and employees' lack of confidence in AcqDemo-which we discussed earlier:
It's an inequitable system, burdened with multiple steps and process (all of which consume way too much time and effort for no discernible benefit), and the employees if they are doing well are rated as "zeroes," which makes them feel badly. Really-a zero is someone who contributes and does their job? That sounds ridiculous to everyone, yet we are told that is how we have to score people. Writing to six different contributing factors to rate someone

Barriers to Flexibility Usage, Support for Mission Needs, and Overall Effectiveness 1 19
a zero and give them no pay raise seems completely stupid. {respondent 16819; no organization provided; supervisor)
Survey participants were not the only ones who had reservations about AcqDemo's resource intensity. As the following remarks illustrate, we heard similar sentiments during our SME interviews:
I would say the biggest challenge is the amount of time that it takes to sit down and write up the reviews and counsel the employees. Having to do the mid-year, the annual assessment, and have to take part in the pay pools. A lot of supervisors have that complaint. I think it is worth it from where I am sitting-the amount of time that the process takes and especially when an employee files a grievance. An EEO complaint will also add on to their time. (SME 14)
It takes time for the supervisors to write appraisals, for the pay pool panel members to read of all of the appraisals, and to come back for the second round. We tried to streamline the process with three factors to cut down on time requirement. You have some supervisors who don't want to take ownership of talking to employees about areas they have excelled in and areas with challenges. Everybody will say the time investment is the biggest challenge. (SME 2)
[A]s a supervisor that reads several people's evals, it's very difficult and time consuming-at both midyear and end of year reviews-to adequately write to the six factors to rate your employees. Because of our OPTEMPO [operational tempo], there's no time to do it during the day, so you do it on nights and weekends. I am looking forward to moving to three factors. And when you get to the pay pools {we do about 30 of them by the end), we're geographically dispersed, and getting everyone together and having to read and assess against six factors for everyone wears you out. (SME 21)
As part of the process of analyzing qualitative data related to the resource intensity theme, we sought to understand the extent to which the evidence reflected a range of views about the resources required to implement AcqDemo. There were no remarks suggesting that AcqDemo was not resource-intensive; there were also no comments indicating that AcqDemo was more efficient than the GS system within the context of performance appraisal. 4 Comments relating to the resource intensity theme fell within a relatively narrow range. Even those expressing positive sentiments about AcqDemo noted this impediment:
In the end, the AcqDemo system has many positive attributes to reward/recognize performing employees. However, one consensus of those I talk with is that the system is too [laden] with time-consuming processes in all the writing, reviews, etc. A look at ways to keep the intended outcomes of the system, but doing so in a more streamlined process is something to consider. {respondent 13652; Army; supervisor)
Plans under way at the time of our assessment to cut the number of appraisal factors in half from six to three seem to be a response to this suggestion, and the SME comments noted earlier suggest that the plans are a welcome effort to reduce the time and administrative burden
4 We did note an instance in which survey respondents felt that AcqDemo helped to streamline the hiring process.

120 201 6 Assessment of the Civilian Acquisition Workforce Personnel Demonstration Project
of implementing AcqDemo. Cutting the appraisal factors from six to three may help AcqDemo strike a better balance between providing the ongoing feedback that is a hallmark of AcqDemo (Chapter Two) and is perceived favorably by a large segment of the workforce (Chapter Five) and minimizing the resources allocated to implementing this AcqDemo feature.
Such actions are critical because the high level of effort required might deter personnel from fully engaging in the system. As one survey respondent put it,
The amount of effort required for the writing of each factor is not worth it. Nothing you enter into the system makes a difference. When the budget declines and overhead cuts coming, nothing is going to change. (respondent 13179; DoD agency; employee)
Interviewees and survey respondents voiced concerns about the consequences of supervisors' feeling pressed for time when writing appraisals, such as verbatim use of an employee's self-appraisal:
It takes significantly too much time for meaningful assessment to be made. The "short cut" is to copy and paste what the employee says if they agree. This doesn't lead to discussions that will create improvement. (respondent 14933; Navy; employee)
Earlier we noted that feedback is an important aspect of AcqDemo's performance appraisal flexibilities and suggested that there is a careful balance to strike between providing valuable feedback and minimizing the resources invested in that function. In a related vein, SMEs explained that a well-run pay pool process requires adequate time:
I'm a big believer that if you can invest time in it, it's such a more fair process for employees . . . AcqDemo is more of a commitment on the leader's part to do it but allows them to compensate people fairly. (SME 8) The shift from six factors to three may also help to ensure that pay pool managers can
readily devote the time required to execute this critical part of the appraisal cycle.
AcqDemo's Potential Influence on Organizations' Acquisition M ission
Influence on Agility and Workforce Quality
The AcqDemo project comprises a wide variety of organizations and career fields, each of which has a specific function or purpose. Rather than assess how AcqDemo serves each organization's mission, we considered how AcqDemo supports a higher-level, acquisitionfocused mission statement: to obtain the best possible acquisition outcomes in support of the warfighter while protecting the taxpayer. This statement is similar to mission statements and goals articulated in various websites, initiatives, and documents developed under the auspices ofOUSD for AT&L. As a validity check for this approach, we asked the SMEs we interviewed about their organizations' missions . Their responses were diverse, covering different parts of the acquisition life cycle, including concept development; designing, building, and maintaining weapons systems; procurements; and acquisition policy oversight.
We also asked the SMEs we spoke with how AcqDemo supported their organization's mission. While they noted that it would be difficult to prove exactly how AcqDemo affected

Barriers to Flexibility Usage, Support for Mission Needs, and Overall Effectiveness 121
the mission given the many other influences on mission success, they did have ideas in mind regarding its intended purpose, as shown in the following comments:
It has helped us to recruit and retain very talented individuals that are able to help us meet our mission more quickly and better. It plays a lot into the caliber of people that we hire and retain. The ones that are not helping us to meet the mission we are able to address a lot more quickly. (SME 14)
We have a really high OPTEMPO . . . I'm surprised that we keep as many people as we do, considering the OPTEMPO and the stress, but people stay. They love the work, and I think AcqDemo helps. If we were in GS and people had to compete for higher ranks, we would see more turnover. (SME 21)
In general, our interviewees felt that AcqDemo did provide more agility to meet changing mission requirements, and they believed it helped to attract and retain a high-quality workforce. We also noted positive sentiments among survey respondents regarding AcqDemo's effect on hiring and recruiting a high-quality workforce:
I love the flexibility of the system with regard to pay setting. It definitely has to be handled carefully to set the correct expectations but for recruitment it is much better. (respondent 16205; DoD agency; supervisor)
Hiring of very skilled and educated engineers etc., has improved in quality. The time it takes to hire is poor and has not improved with AcqDemo. (respondent 14648; Air Force; supervisor)
I had the opportunity to work under AcqDemo at [LOCATION] and in my experience [AcqDemo] provides better opportunities for supervisors to hire rapid, outstanding talent. AcqDemo allows for faster career advancement and allows supervisors to compensate high performers, which creates a beneficial work environment and culture. {respondent 16583; Army employee)
However, survey results also included some views that differed from those expressed by the SMEs regarding AcqDemo's effect on hiring and recruitment. For example, as mentioned in Chapter Five, survey evidence indicated than only about 20 percent of supervisors agreed that they were able to be more selective in hiring under AcqDemo. Turning our attention to the write-in responses, some concerns were AcqDemo-specific and pertained to the system's complexities or how it was implemented within the respondent's organization:
AcqDemo, its bands and its compensation process [are] almost impossible to explain to new hires. It is a detriment to hiring and confuses and makes unpredictable pay progression. New employees are leery of the system and are reluctant to embrace the system. (respondent 18186; Navy; supervisor)
AcqDemo pay scale is confusing to applicants and has slowed the hiring process. (respondent 14879; no organization provided; supervisor)

122 2016 Assessment of the Civilian Acquisition Workforce Personnel Demonstration Project
The system is not conducive to hiring new people-they apply, but they don't accept the position. Personnel will not approve pay beyond a GS-equivalent, which negates the incentive of J\cqOemo. (respondent 13553; DoD agency; supervisor)
My organization's leadership hamstrings the flexibility of AcqOemo in hiring personnel by making us list job openings as NH-XX "Low," "Medium," or "High." We should have the flexibility to hire anywhere in the range we need in order to attract high-quality candidates. Since my organization implemented these changes I have had a significantly harder time attracting high-quality candidates for my organization. (respondent 13777; no organization provided; supervisor)
Other recruitment-related sentiments focused on governmentwide concerns:
Hiring GS or AcqDemo are both extremely difficult under current budget restrictions. (respondent 18453; Army; supervisor)
The hiring system is broken. AcqDemo does nothing to help that. (respondent 13101; Army; supervisor)
AcqDemo only provides the construct within which to hire people (for example, specifying a series and band). Actual government hiring is much more complex, where any new positions have to be approved in a Concept Plan, put on a TOA [Tables of Distribution and Allowances], make it through the hiring freeze approval process, go through USAStaffing, be posted on USAJobs [website], and go through a full competitive selection of candidates. That process is a minimum of a year to change an employee position or bring new hires on board. Also, it is nearly impossible to hire based on potential; hardworking candidates are beat out by longevity or experience. (respondent 17303; no organization provided; supervisor)
While such comments may be due in part to the general negativity bias in responses to open-ended items in employee surveys, they are generally consistent with the quantitative survey items about hiring and appointment flexibilities. They may also reflect overarching frustration with government hiring abilities. We did not have any empirical evidence to assess the accuracy of perceptions regarding the extent to which AcqDemo helps with attracting talent.
Survey results were largely consistent with SME views of the flexibility AcqDemo offers. Specifically, supervisors who completed the AcqDemo survey largely agreed that AcqDemo allows for the flexibility to make adjustments to changing workforce and mission needs; however, they were less positive about AcqDemo easing the reassignment of workers to different jobs in the same organization. Figure 7.9 summarizes their level of agreement with pertinent survey items included in both the 2012 and 2016 surveys. More than 50 percent of supervisors agreed that AcqDemo rules are flexible enough to allow for workforce adjustments in response to workload and mission changes, and this percentage has grown significantly since 2012. A majority also agreed that the job classification system is flexible enough to respond to changing requirements. There was less support for the ease of employee reassignment: 38 percent of supervisors agreed that it was easy to reassign employees to permanent positions within their organizations.
Turning our attention to retaining talent, we observed a pattern in the qualitative data that was similar to what we documented for attracting talent: The perceptions of SMEs were

Barriers to Flexibility Usage, Support for Mission Needs, and Overall Effectiveness 123
Figure 7.9 Supervisor Perceptions of AcqDemo's Flexibilities
C1I Cl '° ... i: C1I � C1I 0..
60 *
40
20 --
o ------AcqDemo personnel rules provide
the flexibility needed to make workforce adjustments in response to workload and mission changes
The AcqDemo job classification system is flexible
enough to respond to changing requirements
Under AcqDemo, it is easy to reassign employees to
permanent positions within this organization in responses to
mission and workload changes
SOURCE: 2012 and 2016 AcqDemo surveys. NOTE: Bars indicate the percentage of supervisors who agreed or strongly agreed with the statement. The remainder of supervisors expressed a neutral view, disagreed, or strongly disagreed. * = A statistically significant difference between the two years at the 5-percent level. RAND RRl78J·7.9
largely positive while the perceptions of survey respondents fell along a broader spectrum, ranging from positive to negative:
General comment-I fully support the principles of AcqDemo and believe it is superior to the GS for retaining and rewarding high performance. (respondent 15348; DoD agency; supervisor)
Having a long history with GS and NSPS, I applaud AcqDemo. However, the recently implemented localized control points appear to strip many of the salary benefits that have otherwise been seen in NSPS and AcqDemo. These control points make it extremely difficult for a supervisor to explain to an outstanding employee why he/she cannot reach the maximum on his/her otherwise GS equivalent. It seems very likely that it will lead to retention issues and has already led to disillusionment and confusion among all levels of employees. (respondent 15304; Air Force; supervisor)
The low performers get rewarded well enough to stay performing low. The high performers do not get rewarded at a level that retains them. Retention is a huge problem at [LOCATION]. Some of it is frustration due to employees having to make up for poor performers' low contribution, bur management acts as if their hands are tied and cannot get rid of people. The end result is high performers get very frustrated and leave and the low performers stay. Therefore, as years go by there is a high turnover of high performers and the same low performers are "stuck" at [LOCATION]. (respondent 18450; Air Force; employee)
124 201 6 Assessment of the Civilian Acquisition Workforce Personnel Demonstration Project
poor retaining of high performing personnel: We do a great job of retaining mediocre employees (they get an equal slice of the pie, so there's nothing to complain about), but a poor job of retaining high performers. In many cases high performers are rated at the same level as their peers, when they should be rating higher. When that happens, motivation is lost and folks decide to move on to another agency that may really reward them for their high performance. (respondent 15744; Marine Corps; supervisor)
AcqDemo sucks. It's not a performance management system nor is it a pay schedule. It doesn't allow for me to recruit or retain the best and brightest any better than a good classification system would. It's a waste. (respondent 14281 ; Air Force; supervisor)
The views expressed by SMEs and survey respondents regarding AcqDemo's effect on retaining talent should be considered in light of the actual retention outcomes estimated and reported in Chapter Five. Retention-related evidence from our administrative data analysis is mixed. Over the four years covered by our analysis, AcqDemo members were no more or less likely to remain in the DoD civilian workforce relative to comparable employees in the GS system. However, we did find that AcqDemo retained high contributors at a higher rate and low contributors at a lower rate, providing some support for SME statements about AcqDemo's ability to develop a high-quality workforce. As noted in Chapter Five, we were not able to assess whether the GS system was more or less adept than AcqDemo at retaining high contributors and shedding low contributors because of the poor quality of performance rating data for GS employees.
Influence on Work Group Dynamics
Work group processes may also affect the organizational mission. The 1999 FRN, which announced the establishment of AcqDemo, cited the move toward a more-dynamic and teambased work environment as an impetus for AcqDemo. Quantitative survey evidence suggests AcqDemo is faring well in this regard. As shown in Figure 7.10, most respondents agreed or strongly agreed with positive statements about knowledge sharing, cooperation across groups, and teamwork within their group, and there was a statistically significant increase in agreement with the survey items regarding knowledge sharing and inter-group cooperation from 2012 to 2016, even after controlling for other characteristics.
A potential explanation for these favorable views may be that one of the six factors included in the appraisal process is Teamwork/Cooperation, described in FRN 64 (OPM, 1999) as follows:
TEAMWORK/COOPERATION
FACTOR DESCRIPTION: This factor, applicable to all teams, describes/captures individual and organizational teamwork and cooperation.
EXPECTED PERFORMANCE CRITERIA (Applicable to all contributions at all levels): Work is timely, efficient, and of acceptable quality. Personal and organizational interactions exhibit and foster cooperation and teamwork. Flexibility, adaptability, and decisiveness are exercised appropriately.
However, the plans announced during our assessment to reduce the number of appraisal factors from six to three indicate that this factor will be renamed "Communications and/or

Barriers to Flexibi lity Usage, Support for Mission Needs, and Overall Effectiveness 125
Figure 7.10 Employee Perceptions of Group Dynamics
CV Cl l'O .... c: � Q; �
100 ....--���������������������������������-
80t-���������������������������
*
60 1--�----l
40
20
0 ,___...._ __ _, Employees share their
knowledge with each other
*
Different work groups cooperate My group works well together to get the job done in my
organization
SOURCE: 2012 and 201 6 AcqDemo surveys. NOTES: Bars indicate the percentage of employees who agreed or strongly agreed with the statement. The remainder of employees expressed a neutral view, disagreed, or strongly disagreed. * = A statistically significant difference between the two years at the 5-percent level. RANO RRl783·7. IO
Teamwork" and redefined. The new description and criteria listed in the Draft Republication FRN 0401 16, provided to us by the AcqDemo Program Office in April 2016, are as follows:
FACTOR: 2. Communication and/or Teamwork
FACTOR DESCRIPTION: This factor captures communication, both verbal and written; interactions with customers, coworkers, and groups; and assignments crossing functional boundaries appropriate for the positions classified to the broadband levels of the [NH] career path.
EXPECTED CONTRIBUTION CRITERIA: Effectively communicates, verbally and in writing, as needed to coordinate work and keep chain-of-command, coworkers and customers informed of work-related issues, developments and statuses. Actively seeks and promotes diverse ideas and inputs. Works well with and in groups, and with others to accomplish mission requirements.
Work is timely, efficient, and of acceptable quality. Communications are clear, concise, and at the appropriate level. Personal and organizational interactions exhibit and foster teamwork. Flexibility, adaptability, and decisiveness are exercised appropriately.
This new factor appears to be less focused on teamwork: The conjunction in the factor name suggests that communication or teamwork may be assessed, and the factor description and criteria emphasize communication, not information sharing per se. I n light of this pending appraisal factor change, AcqDemo leadership may wish to monitor these employee perceptions of group dynamics closely co ensure that they remain at their highly favorable level while
126 201 6 Assessment of the Civilian Acquisition Workforce Personnel Demonstration Project
the aforementioned benefits of scaling down to three are achieved. Research has highlighted concerns that performance-based systems can trigger dysfunctional competition for limited financial rewards and career advancement opportunities. For example, Drago and Garvey (1998) suggest that employees are less likely to share knowledge and help their colleagues when they are competing for limited funds, and Schay and Fisher (2013) noted that critics of performance-based compensation systems express concerns about their negative impact on teamwork. Indeed, comments recorded in the 1999 FRN included observations that "CCAS would harm teamwork and lead to excessive competition among employees {or between managers and employees) for a finite amount of funds within a pay pool" (OPM, 1999, p. 1428). The teamwork-related theme in the survey write-in responses reflected a primarily negative perspective:
[F]rom the beginning, I have indicated that AcqDemo (vice GS) doesn't promote teamwork; instead, it incentivizes an "every man for himself" attitude. (respondent 17791; Marine Corps; employee)
AcqDemo is designed to increase competition between employees. My organization already has issues with stovepiped organizations and inadequate communication between organizations. Under AcqDemo, it is counterproductive to help a coworker because it results in a higher contribution for them and lower contribution for the helper. This exacerbates the already existing stovepipes and inadequate communication. Government employees should be rewarded for working together, crossing stovepipes and communicating, not punished. (respondent 18038; Navy; supervisor)
AcqDemo destroys teamwork and creates an "individual" mentality, which contradicts the "team" concept between competencies. (respondent 16620; Marine Corps; employee)
Overarching conclusion is that AcqDemo: (1) is fraught with subjective ratings that are highly dependent on supervisor [and} (2) incentivizes competition and information hoarding. (respondent 15107; Air Force; supervisor)
Influence on Employee Attitudes and Behaviors
The barriers to use of the flexibilities that we discussed earlier in this chapter may also have implications for achieving the mission. Specifically, the pay cap limitations and lack of confidence in AcqDemo may affect employee morale and motivation. With respect to the former, the remarks that follow suggest that some employees were demoralized because pay caps had limited their potential for higher pay:
Employees who are at the top of the pay band are not eligible for ratings above 0 delta regardless of performance. This negatively impacts morale. (respondent 13140; Air Force; employee)
Major stumbling block within the organization is the inclusion of control points within the bands. This appears to be a major reason for employees actively searching for other jobs, morale problems, and lack of advancement. (respondent 14066; Army; supervisor)

Barriers to Flexibility Usage, Support for Mission Needs, and Overall Effectiveness 127
The "recent" implementation of ceilings for different positions within pay bands is just plain dumb. We might as well go back to GS pay scales. If a person is up against one of these ceilings what is the point of trying to contribute more to the mission? There is no monetary incentive for taking on more work . . . . and it flies in the face of what AcqDemo was supposed to do and what we were told when we initially went into the program years ago. (respondent 13688; no organization provided; employee)
The control point placed at midband is a problem for [organization name) . Employees are topping out in their band. The organization continues to ask more of personnel with no lasting reward. A one-time bonus may be given. Improvements by groups or individuals save [organization name] millions over years with no lasting incentive for the personnel to do any more than required or stay with the organization. (respondent 18387; Army; employee)
Bottom Line: Under the current implementation of AcqDemo in my organization, my salary growth has now been limited or capped and has removed any direct correlation to actual performance. In an already high-performing environment, that limitation greatly reduces or eliminates the desire to take on additional taskings above the current baseline due to the lack of compensation or the perception of fair distribution. Overall-In my organization it has been bad for morale, retention, and performance. (respondent 15243; DoD agency; employee)
The last two comments suggest that for some, CR! carryover awards may not fully compensate for salary increases forfeited due to pay caps, either because the award values fall short of the forfeited CRis or because the awards do not compound over time or both.
The lack of confidence in AcqDemo-particularly the beliefs that the project does not truly pay for performance (or, more precisely, contribution) and that the system is not always fair-may also negatively affect employee job attitudes and, consequently, their productivity:
I do not believe employees are adequately compensated for going above and beyond. Everyone gets the same portion of the pool, regardless of [his or her] performance. This could pose a huge issue relative to motivation and morale. (respondent 13720; Army; supervisor)
Poor performers, average performers, and above average performers all get the same crappy 0 or +l �OCS . . . . [T]he poor performers getting the same rating as the above average employee totally and completely kills morale. (respondent 13497; DoD agency; employee)
Forcing positions between "the rails" does nothing to encourage innovation or productivity or high contributors. It does encourage mediocrity and apathy. (respondent 14509; Air Force; employee)
The political nature of rewarding employed contribution results in not all deserving members receiving a warranted pay raise. This decreases morale, motivation, and productivity. (respondent 15853; Air Force; supervisor)
These concerns also emerged in the 2012 assessment. In that assessment, Werber et al. (2012) noted that perceived lack of fairness contributed to the failure of some performancebased systems. Furthermore, they cited research (e.g., Martinko and Gardner, 1982) indicating that when employees do not believe that performance and rewards are linked, learned

128 2016 Assessment of the Civilian Acquisition Workforce Personnel Demonstration Project
helplessness may develop. Consequences of this passive and apathetic state include low job satisfaction, reduced motivation, and higher rates of absenteeism. This is a concern in addition to the potential negative consequences of low perceived procedural and distributive justice, discussed earlier in this chapter. As these views were shared via optional write-in comments on the survey by a limited number of participants, rather than responses to a multiple-choice survey item presented to all, we cannot estimate how prevalent these opinions are. However, given the potential negative influence these attitudes may have on the acquisition mission, they are notable.
In addition, because some of these comments reveal misperceptions, they present an opportunity for AcqDemo leadership to shape employee views. In Chapter Five, we provided evidence that high-performing employees in AcqDemo do earn more than low-performing employees, as intended. In particular, we showed that a 1-point increase in �OCS raised annualized basic pay by $150 to $400 in the following year, after controlling for other factors. However, employees may feel that these increases are not large enough or that OCSs are unfairly assigned. We delve into these issues, and others, in the final section of this chapter.
Influence on Leader Attention to Mission
Another barrier that we described earlier in this chapter, AcqDemo's resource-intensive nature, may affect not only how the project's flexibilities are implemented but also organizations' ability to meet the acquisition mission. In this case, the concern that emerged from the survey and interview data was that leaders' attention is diverted from direct mission support to AcqDemo administration. For example, survey respondents wrote:
The pay pool takes the entire leadership of the organization out of the picture for several weeks, twice per year. This causes an extreme slowdown of all processes across my organization. (respondent 13942; Army; employee)
Problem is that it takes way too long to complete the evaluation process. Employees have to take eight to 15 hours of time to try to ensure they get the correct wording in all the categories to receive deserved promotions, and the supervisors have to take 40+ hours to write responses. All this is time taken away from the actual mission. And oh, by the way, this has to be done twice a year. (respondent 14690; no organization provided; employee)
Similarly, SMEs told us:
AcqDemo is a great system, but it takes a lot of management time. I think permanency of the system will help a lot when Congress decides funding levels. It's very time-consuming. We have missions that we are trying to accomplish, we're trying to help the war.fighter, and we spend a lot of time in pay pool panels. (SME 8)
The amount of time spent by everyone in pay pools and sub-pay pools takes away from the ability to do the mission. (SME 21)
The extent to which this is an impediment likely varies across organizations and leaders due to their different applications of AcqDemo. Thus, the examples offered may represent extreme cases rather the common occurrences. As the number of organizations in AcqDemo grows, leadership can assess the actual nature and extent of this effect and its relationship to

Barriers to Flexibility Usage, Support for Mission Needs, and Overall Effectiveness 129
AcqDemo policy and organizations' business rules. It is important to note that the move from six appraisal factors to three, which we cited in our initial discussion of the resource intensity barrier as potentially helpful, also has favorable implications for this issue.
AcqDemo's Effectiveness as a Performance-Based Personnel System
Another way to consider how well AcqDemo supports mission needs is to gauge it against the following seven criteria, developed by Lawler (1971, 1975), which are widely regarded as useful means by which to assess performance-based personnel systems, such as AcqDemo:
I . Significant rewards can be given and tied to performance. 2. Information is communicated to employees about how rewards are given. 3. Supervisors are willing to explain and support the reward system. 4. Rewards can vary widely, depending on performance. 5. Meaningful performance appraisal sessions can take place. 6 . Performance can be objectively and inclusively measured. 7. High levels of trust exist or can be developed between supervisors and employees (U.S.
House of Representatives, 2005).
OPM has employed these criteria in its evaluations of federal employee demonstration projects (U.S. House of Representatives, 2005; Schay, 2007). In this section, we consider how evidence collected in the context of our assessment can be applied to these criteria.
Lawler Criterion 1 : Significant Rewards Can Be Given and Tied to Performance
Our evidence is mixed in this regard: The administrative data analysis, summarized in Chapter Five, indicates that there is a modest link between compensation and contribution, but it is unclear whether the rewards are large enough. Responses to the AcqDemo 2016 survey suggest that many .employees do not perceive this link.
To explore the notion of reward significance, we examined the sizes of CRis, CAs, and CRI carryover awards in the FY 2015 appraisal cycle using administrative data provided by the AcqDemo Program Office. Table 7.2 provides the average (median) and top 10 percent for each compensation type, both in dollar terms and as a percentage of basic pay.5 The averages range from 1 .9 percent to 2.0 percent of basic pay for CRls, from 1 . 1 percent to 1 .2 percent for CAs, and from 1 .5 percent to 1 .8 percent for CRI carryover awards, depending on the career path. The top decile values are notably larger, ranging from 3.2 percent to 4.1 percent for CRls, from 1 .5 percent to 2.6 percent for CAs, and from 2.6 percent to 3 .0 percent for CRI carryover awards. Whether these figures constitute "significant rewards" depends in large part on employees' choice of referent. When compared with the compensation of peers in the GS system, these rewards may be perceived as significant; after all, many of the constraints on award budgets apply not only to AcqDemo but also to federal agencies with employees in the GS system, as described earlier in this report. When compared with the compensation of peers
5 We opted to report the top 10 percent instead of the maximum value to eliminate some outliers that were extremely high (e.g., 20.56-percent CRI increase for NH career path). Such values, if accurate, arc likely too rare to influence perceptions of reward significance:.

130 201 6 Assessment of the Civilian Acquisition Workforce Personnel Demonstration Project
Table 7.2 CRI, CA, and CRI Carryover Award Sizes by Career Path, FY 2015 Appraisal Cycle
Compensation Action
CRI CA CRI Carryover Award
NH Career Path (n = 1 5,022)
Count
Actual value ($)
As a percentage of basic pay
NJ Career Path (n = 482)
Count
Actual value ($)
As a percentage of basic pay
NK Career Path (n = 496)
Count
Actual value ($)
As a percentage of basic pay
Median Top 10%
Median Top 1 0%
Median Top 10%
Median Top 10%
Median Top 10%
Median Top 10%
1 0,366
1,801 3,361
2.04% 4.07%
224
1 ,038 1,975
1 .92% 3.17%
342
861 1 ,617
2.03% 3.88%
SOURCE: Administrative data provided by the AcqDemo Program Office.
13,758 5,540
1 ,079 1 ,747 1 ,810 3,428
1 .19% 1 .60% 1 .81% 2.85%
466 346
706 895 983 1 ,703
1 .07% 1 .51% 1 .47% 2.57%
462 220
515 782 1 ,060 1 ,401
1 .19% 1 .81 % 2.60% 2.96%
NOTE: The data presented include only permanent, full-time employees in AcqDemo whose compensation was at least $15,080, the salary equivalent of working a full year at federal minimum wage.
working in the private sector, however, the rewards paid to AcqDemo participants may not be perceived as significant.
The potential for significant rewards to motivate behavior hinges on whether employees believe they truly have the opportunity to attain these rewards. Earlier, we identified employees' lack of confidence in AcqDemo as a barrier to its implementation and noted that employees' failure to perceive a link between pay and contribution fed into this barrier. Specifically, fewer than half of the survey respondents agreed that pay raises depended on their contributions to the mission and that salaries were more directly tied to contribution under AcqDemo than they were under the GS system. This is a critical shortcoming; research suggests that one of the most important measures of a performance-based system's effectiveness is the perceived link between pay and performance (Schay and Fisher, 2013).
Lawler Criterion 2: Information Is Communicated to Employees About How Rewards Are Given
Most of the evidence related to this criterion was covered earlier in this report. In Chapter Four, we described the steps taken to ensure that AcqDemo is fair and transparent for all

Barriers to Flexibility Usage, Support for Mission Needs, and Overall Effectiveness 131
employees in the project, including various forms of communication. However, many of the communication efforts in place, such as emailing pay pool outcomes and conducting town halls, focus more on conveying results than on conveying process. The latter tends to be covered at a high level, primarily in initial training. As mentioned previously, employees voiced many concerns about the transparency of AcqDemo's appraisal process, including how ratings are transformed into pay actions and how the pay pools are run. In addition, the 2016 AcqDemo survey included an item that specifically pertains to this criterion: AcqDemo participants were asked whether "Information is communicated to employees on how the rewards are given." Fifty-eight percent of respondents either disagreed with or took a neutral position regarding this statement. These data imply that AcqDemo has not been very effective with respect to this criterion.
Lawler Criterion 3: Supervisors Are Willing to Explain and Support the Reward System
We have few findings that speak directly to this criterion. Qualitative evidence suggests that the system can be challenging for supervisors, especially those in their first AcqDemo cycle. For example, as we noted in Chapter Four, supervisors' written appraisals of personnel were identified as an aspect of AcqDemo that could present some challenges and thus may warrant additional training. In addition, AcqDemo's time-intensive nature might affect supervisors' willingness to explain and support the project. Participating in contribution planning meetings at the start of the CCAS cycle, providing feedback informally throughout the cycle, and participating in and documenting feedback formally both midcycle and at its end can be a significant investment of time and effort for supervisors, especially those with many direct reports or those less familiar with the system. While we do not have input from supervisors themselves regarding these potential effects, the 2016 survey provides some insights from the employee perspective. Specifically, 52 percent of employees either expressed a neutral view or disagreed with the statement "Supervisors are willing to explain and support the reward system." As this was a new addition to the AcqDemo survey, we cannot comment on whether or how this perception changed over time. Nevertheless, the 2016 responses provide an indicator of AcqDemo's effectiveness that needs to be explored more thoroughly and possibly improved.
Lawler Criterion 4: Rewards Can Vary Widely, Depending on Performance
As we discussed earlier, the administrative data analysis demonstrated a link between salary increases and performance (as measured by L\OCS). However, whether these increases vary widely is open to interpretation. First, there are a variety of pay caps, some of which are specific to AcqDemo and others that apply to both AcqDemo participants and other federal government employees. These caps intentionally limit the compensation an employee can receive, particularly in the form of lasting pay raises. They include restrictions related to being on retained pay, being at the top of a pay band, or hitting a control point within a pay band.
As shown in Table 7.3, the overwhelming majority (85 percent to 95 percent) of employees have a L\OCS of zero to +4, which corresponds roughly to the upper half of the L\OCS range for appraisal zone C. Our estimates indicate that, among employees with a L\OCS of at least zero, a I-point increase in L\OCS corresponds to a salary increase of approximately $350, after controlling for an array of other factors. 6 This means employees can reasonably expect
6 These factors include age, gender, race or ethnicity, education level, occupation, component, supervisory status, and union membership. For additional details, see Appendix C.

132 201 6 Assessment of the Civilian Acquisition Workforce Personnel Demonstration Project
Table 7.3 Distribution of the AcqDemo Workforce Across Appraisal Zones and AOCS Ranges
Percentage of the AcqDemo Workforce in
FY 2012 FY 2013 FY 2014 FY 2015 Appraisal Zone
A (above the rails) 0.92% 0.63% 0.49% 0.39%
C (between the rails) 90.63% 92.34% 93.68% 94.41 %
B (below the rails) 7.65% 6.10% 5.29% 4.95%
bOCS Range
-4 :::; 60CS < 0 4.73% 3.76% 3.23% 2.79%
0 :::; 60CS S 4 90.46% 91.95% 87.60% 92.96%
SOURCE: Administrative data provided by the AcqDemo Program Office.
NOTE: The data presented include only permanent, ful l-time employees in AcqDemo whose compensation was at least $15,080, the salary equivalent of working a full year at federal minimum wage.
additional efforts or contributions to result in salary increases of, at most, $1 ,400.7 It is unclear whether this constitutes wide variance in a system where the average annual salary is approximately $90,000.
Table 7.4 shows the distribution of salaries within AcqDemo. Over the four years that elapsed from September 30, 201 1, to September 30, 2015, the variance in salaries has diminished. Because an employee's 80CS is positively correlated over time, one would expect the variance in salaries to increase as rewards are granted to the same high-contributing employees year after year. 8 However, this is not what we observed. Moreover, the reduced spread in salaries is consistent with the estimates presented in Chapter Five, Table 5 .5, which indicate that the effect of a 1-point increase in 80CS on annualized basic pay declined over the years. Taken together, these results suggest that the link between contribution and compensation may have weakened.
SME and employees' divergent views further confounded the assessment of AcqDemo against this criterion. During our interviews, SMEs were generally very positive about AcqDemo's ability to provide great rewards to high contributors and suppress the compensation of low contributors:
[I]t is a fantastic system compared to the GS system. In the GS world, I can't reward my star performers. When I was a pay pool manager, every organization has a couple of superstars. I can't reward them every year with a step increase. Under AcqDemo, I can reward them with a two-step increase if I want to. I had a couple of superstars that it would have taken ten years to get through to where it took them three years under AcqDemo. (SME 6)
7 An employee's contributions may also be rewarded with a CA, of course, but more than 90 percent of employees earn a CA in any case, 75 percent ofCAs are less than $1,400, and CAs are one-time payments that do not compound over time.
8 We computed the year-to-year correlation in an employee's .6.0CS. The correlation coefficient was 0.6386, which was statistically significant at the I-percent level.

Barriers to Flexibility Usage, Support for Mission Needs, and Overall Effectiveness 133
Table 7.4 Distribution of Annualized Basic Pay Within AcqDemo
Annualized Basic Pay on September 30 of
2011 2012 2013 2014 2015 Minimum 23,616 23,138 22,804 23,295 24,000
Bottom 25 percent 74,004 72,214 71,229 70,975 73,1 1 5
Median 94,365 92,688 91 ,723 91 ,391 92,437
Top 25 percent 1 15,540 1 13,397 112,023 1 1 1 ,338 112,461
Maximum 172,042 168,554 168,672 166,719 167,270
Mean 96,256 94,021 92,706 91 ,950 93,172
Standard deviation 31,380 30,437 29,471 28,272 27,794
SOURCE: DMDC civilian personnel inventory files.
NOTES: The data presented include only permanent, full-time employees in AcqDemo whose compensation was at least $15,080, the salary equivalent of working a full year at federal minimum wage. The dollar figures listed are in 2015 dollars.
People want to be motivated. They may not have to wait those three years to get a pay increase like they would under GS. If they are hard chargers, they will have the opportunity to increase pay quickly. (SME 2)
From the managers' perspective, I think it's excellent for all employees, because I'm able to reward high performers and hold back on low performers. (SME 16)
However, 2016 survey write-in comments from employees about the link between rewards and performance focus on how rewards' possible range is constrained by pay caps and the tendency toward placing all employees between the rails, also referred to as "normalizing" pay:
I have found that although AcqDemo is intended to be contribution-based, the reality of how it's administered does not match this intent. Often, once supervisor's scores are reviewed, a pay pool is "normalized,,
so no scores are too high or too low, even if deserved. (respondent 15788; DoD agency; supervisor)
We [have] not adequately used the whole range between the rails (i.e., -4 to +3) even though this range indicates performance that is expected. Together with limiting higher ratings (+6 and above) [this] limits adequate rewarding of our higher performers. (respondent 171 17; Army; supervisor)
Control points are being applied and now employees are just beginning to understand that the full range of their broadband is not available to them . . . Even more insidious is the practice of most pay pools to score most of their employees in the 0-2 �OCS range. There is very little stratification between average employees and high performers. It seems that in an effort to manage civilian pay that many pay pools do not spend even half of the 2 percent CRI pot on salary increases. Most pay pools have an average �OCS of less than 1 .0 and some go as low as 0.4 . . . . Very few employees end up in either Zone A or B each year. About 98 percent are between the rails each year. (respondent 14928; Air Force; employee)

134 2016 Assessment of the Civilian Acquisition Workforce Personnel Demonstration Project
Finally, we found that one-time bonuses do not vary widely within AcqDemo. We reported in Chapter Five that in the FY 2015 appraisal cycle, 92 percent of AcqDemo participants received a CA. The average {median) dollar value of a CA was $1 ,047, and CAs as a percentage of basic pay averaged {median) 1 .19 percent. Table 7.2 provided a closer look at CAs by career path, showing that the average CAs ranged from 1 . 1 percent to 1 .2 percent and the top decile values ranged from 1 .5 percent to 2.6 percent. Like other federal agencies, AcqDemo is subject to limits on the size of its award budget because of policies issued by OPM, OMB, and DoD. However, in practice, AcqDemo organizations have opted to use their policyconstrained award budgets to give smaller awards to the majority of employees, rather than to give larger awards to a smaller percentage of employees.
Lawler Criterion 5: Meaningful Performance Appraisal Sessions Can Take Place
As we discussed in Chapter Five, AcqDemo seems to be faring well in this regard. CAS2NET provides a structure that facilitates feedback. Although there is qualitative evidence that some feedback sessions were missed, the majority of AcqDemo survey respondents agree that supervisors set clear contribution goals, communicate expectations for positions, and provide adequate feedback on their contributions. In addition, most survey respondents agreed or strongly agreed with the statement "Meaningful performance appraisal sessions can take place," a finding that speaks directly to and favorably about this criterion.
Lawler Criterion 6: Performance Can Be Objectively and Inclusively Measured
AcqDemo primarily consists of professional business management and technical management professionals {career path NH). The business literature is rife with studies {e.g., Mintzberg, 1973; Pearce, Stevenson, and Perry, 1985) that suggest objective measures of managers' performance may be hard to specify in advance given the nonroutine nature of management work, which typically includes much variety, fragmentation, and changes in response to crises and other events. This implies that AcqDemo may not perform well with respect to this criterion, and indeed, our evidence is mixed at best in this regard. First, as noted in our discussion of the lack of confidence in AcqDemo, survey and interview evidence indicate perceived subjectivity in the process. Moreover, only 43 percent of AcqDemo survey respondents agreed that performance can be objectively and inclusively measured; 57 percent either disagreed or took a neutral view.
For additional insights about the ability to measure performance objectively and inclusively, we reviewed survey data related to personnel's perceptions of AcqDemo's six appraisal factors. We felt that even though the six factors were in the process of being revised and cut to three factors, perceptions of the six factors' adequacy and inclusiveness still offered useful evidence related to this criterion. Moreover, if personnel did not believe the six factors were sufficient, a movement to three factors might be to the detriment of truly inclusive measurement. We found that 66 percent of survey respondents in both 2012 and 2016 reported that the six appraisal factors were adequate for them to describe their contribution. The remainder either expressed neutral views or disagreed. In addition, supervisors were more likely than nonsupervisors to agree that the six factors were adequate despite their great potential for nonroutine work {see Figure 7.1 1). A possible explanation for the disparity in responses to the two survey items may be the double-barreled nature of the first; perhaps some respondents felt that performance could be objectively measured but not inclusively, while others believed the converse.

Figure 7.11
Barriers to Flexibility Usage, Support for Mission Needs, and Overall Effectiveness 1 35
Employee Perceptions of Appraisal Factors' Adequacy
BF-----------------------------lm 60 --------------------- ---------------!
-+- Supervisors ..,. Non-supervisors
40 --------------------- ------------!
20 ,,_ __ -------- ·----------------------·-------------
0 ._ _____________ ..__. ____________________________ �·---------------2012* 201 6*
The six factors are adequate for me to describe my contribution
SOURCE: 201 2 and 201 6 AcqDemo surveys. NOTES: Each of the data points indicates the percentage of respondents who agreed or strongly agreed with the statement. The remainder of respondents expressed a neutral view, disagreed, or strongly disagreed. * = A statistically significant difference between the two groups at the 5-percent level. RAND RR1183·1.1t
Further muddying the assessment waters are qualitative data from both the interviews and survey about the difficulties related to using the six factors to document mission contribution:
AcqDemo is an attempt to try to quantify the work that is done. It's a 20th century model attempting to manage a 21st century environment. We don't produce widgets. We manage highly complex projects with equally complex problems. At the end of the day, AcqDemo becomes a writing project. (respondent 14160; Army; employee)
Contributions related to "mission accomplishment" are not always easy to align to the six categories. Perhaps "mission accomplishment" should be a separate factor. (respondent 14543; DoD agency; supervisor)
Six factors are skills/abilities and are not easily applied to contributions. A contribution usually involves more than one skill/ability. A contribution needs to be tied to the mission. (respondent 17942; DoD agency; employee)
Sometimes it can be hard to tie things to the mission; it can be difficult to write to some of the mission elements. I know I have a hard time with that myself sometimes. It's probably easier for acquisition personnel to write to the mission aspects. (SME 13)
The last remark, about the relative ease with which acquisition personnel document their mission contributions, is related to our discussion in Chapter Three about the appropriateness of AcqDemo for personnel in support positions.
To summarize, there are different reasons for AcqDemo falling short in terms of objectively and inclusively measuring contribution: There are conflicting views about the thorough-

136 2016 Assessment of the Civilian Acquisition Workforce Personnel Demonstration Project
ness of the six contribution factors {although the stronger source of evidence is positive); contribution may be difficult to measure objectively, particularly for managers and those in support positions; and even if the factors are sufficient, there are perceptions among the workforce that the appraisal process is a subjective one. Thus, AcqDemo resembles other performance-based demonstration projects that have struggled with this measure of effectiveness, including the Navy Demo (China Lake and San Diego) and National Institute of Standards and Technology (Schay, 1993).
Lawler Criterion 7: High Levels of Trust Exist or Can Be Developed Between Supervisors and Employees
A lack of trust has contributed to the failure of some performance-based systems (Pearce, Stevenson, and Perry, 1985), and a high level of trust is regarded as critical when performance cannot be objectively measured (Schay and Fisher, 2013). Fortunately, AcqDemo appears to be faring relatively well in this regard: Survey results indicate that the majority of AcqDemo participants agree that high levels of trust exist or can be developed between supervisors and subordinates and that their respective supervisors have earned their trust and confidence. The percentage of respondents that agree that their supervisors have earned their trust and confidence has increased, from 63 percent in 2012 to 67 percent in 2016. These figures are strikingly similar to those reported in Schay and Fisher (2013). In AcqDemo's initial years, the level of agreement was 63 percent, and in 2003, that figure was 66 percent. More generally, Schay and Fisher (2013) noted that trust in supervisors was at or above 60 percent in all seven federal demonstration projects they examined, ranging from 60 percent in Navy Demo to 71 percent in DoD Lab Demo.
However, it bears repeating that when it comes to supervisors' fairness in terms of recognizing individual and team contributions, the results were less favorable. For survey respondents as whole, the level of agreement with these fairness-related statements ranged from 46 percent to 48 percent, depending on the item and the survey timing {201 2 or 2016). In addition, women were significantly less likely than men to agree that supervisors were fair in these ways. Still, these views are more positive than those expressed about the overall organization. Perhaps, as the following remark suggests, trust wavers when the pay pool process and other levels of leadership are taken into consideration:
Supervisor feedback is different from pay pool results. I greatly trust my supervisor. I have little confidence and trust in the pay pool process. (respondent 15218; DoD agency; employee)
Other related comments from the 2016 survey suggest either a distrust of higher-level leaders or trust in one's immediate supervisor.
Summary
AcqDemo offers a number of appointment and appraisal flexibilities designed to make DoD organizations more agile and improve their ability to attract and retain talent. We described some of the more notable ones in Chapter Two and assessed how the flexibilities have been used in Chapter Five. In this chapter, we identified barriers that have inhibited their use.

Barriers to Flexibility Usage, Support for Mission Needs, and Overall Effectiveness 1 37
These include pay caps, employees' lack of confidence in AcqDemo, and the project's resourceintensive nature.
In FY 2015, approximately two-fifths of AcqDemo employees were subject to a pay cap. This estimate includes employees who were at the top of their pay bands and employees whose salaries hit control points within their pay bands but excludes employees on retained pay. Pay caps are not unique to AcqDemo and are intended to promote cost discipline. However, pay caps present a greater challenge to AcqDemo's implementation than to that of the GS system for two reasons. First, pay caps are more prevalent among AcqDemo participants: In FY 2015, only 14 percent of GS employees in ADEOs were at step 10 of their respective grades. Second, pay caps run counter to one of AcqDemo's central tenets, which is that employees should be appropriately rewarded for their contributions to organizational mission. As in the GS system, the pool of funds available for salary increases in AcqDemo is limited. However, maintaining the integrity of AcqDemo's foundation as a performance-based pay system requires that the distribution of this limited pool of funds be determined by, or at least strongly associated with, differences in employee contribution. Pay caps erode this association, and with nearly 40 percent of the workforce subject to a pay cap, the degree of that erosion could be significant. Our analysis of administrative data indicated that CRI carryover awards, one-time awards that are intended to mitigate the effect of pay caps, do not fully compensate for the salary increases that are denied due to pay caps.
Employee perceptions of the aforementioned pay cap barrier, along with views that AcqDemo falls short in terms of both transparency and fairness, are the basis for another barrier: employees' lack of confidence in AcqDemo. Quantitative survey results indicated that only about 40 percent of AcqDemo employees perceived a link between contribution and pay, and even fewer agreed that their organizations administer pay fairly. Nearly 50 percent of survey respondents agreed that supervisors are fair in recognizing individual contributions, but female employees were significantly less likely to agree with the statement than male employees were. Qualitative evidence from the 2016 survey included both positive and negative comments regarding AcqDemo's fairness, but the theme was primarily negative in tone. Employee confidence in AcqDemo also appeared to be undermined by a perceived lack of transparency with respect to business rules, the process by which ratings are calculated and translated to pay, pay pool processes, and pay pool results, including how employees compare to their peers. Lack of confidence in AcqDemo may adversely affect the use of its flexibilities by diminishing employees' motivation to participate fully in the CCAS process. For example, employees might not believe it is worth devoting time and effort to writing thorough self-assessments or to engaging in feedback sessions with their supervisors. It is important to note that this barrier is fueled, in part, by the misperception that contribution and pay are not linked; this suggests that AcqDemo leadership may be able to minimize this barrier through communication strategies.
The time and effort required to participate in and administer AcqDemo constitute the third barrier to using the project's performance appraisal flexibilities. The business literature suggests that performance-based pay systems are often regarded as requiring a problematic amount of time, and AcqDemo appears to be no exception. Specifically, qualitative evidence suggests that appraisal writing, feedback sessions, and pay pool administration were perceived to be time-consuming. Interviewees and survey respondents recognized the value of these AcqDemo features but felt they were inefficient. Survey respondents indicated that the time and effort required to implement these processes might discourage employees from fully engag-

138 2016 Assessment of the Civilian Acquisition Workforce Personnel Demonstration Project
ing in them. Interviewees and survey respondents also expressed concerns about shortcuts that supervisors might take when pressed for time to write numerous performance appraisals. Plans to cut the number of appraisal factors from six to three might help AcqDemo achieve a better balance between providing valuable feedback and minimizing the resources invested in that function.
This chapter also examined how AcqDemo is supporting acquisition-related mission needs. The SMEs with whom we spoke explained that AcqDemo supports the acquisition mission by offering more agility to meet changing mission requirements and by attracting and retaining a high-quality workforce. We could not assess objectively whether AcqDemo helped with recruiting talent, but SMEs perceived that it had done so, while write-in comments from the AcqDemo survey reflected mixed views from supervisors in this regard. Supervisors who completed the survey tended to believe that AcqDemo was flexible enough to allow for workforce adjustments in response to workload and mission changes and that the job classification system was flexible enough to respond to changing requirements. However, they were less positive about their ability to reassign employees to permanent positions within their organizations. As we discussed in Chapter Five, our analysis of administrative data showed that retention was higher among employees with a high �OCS than among employees with a low �OCS.
AcqDemo may also affect the mission via its influence on work group dynamics, employee attitudes and behaviors, and leader attention on the mission. Survey results suggest that levels of knowledge sharing, cooperation across groups, and teamwork are high within AcqDemo. However, our analysis of the survey data, in conjunction with our review of the academic literature, suggests that pay caps and the lack of confidence in AcqDemo may adversely affect employee attitudes and behaviors. The potential consequences include reductions in employee morale, motivation, job satisfaction, and productivity. In addition, AcqDemo's resourceintensive nature was perceived by some SMEs and survey respondents as diverting leader time away from activities directly related to the acquisition mission.
Finally, we assessed AcqDemo's ability to support mission needs using management scholar Edward Lawler's seven criteria for evaluating performance-based pay systems:
I . Significant rewards can be given and tied to performance. 2. Information is communicated to employees about how rewards are given. 3. Supervisors are willing to explain and support the reward system. 4. Rewards can vary widely, depending on performance. 5. Meaningful performance appraisal sessions can take place. 6. Performance can be objectively and inclusively measured. 7. High levels of trust exist or can be developed between supervisors and employees.
We found that AcqDemo is faring best in terms of Lawler criteria 5 and 7. The majority of AcqDemo survey respondents agreed that supervisors set clear contribution goals, effectively communicate expectations for positions, and provide adequate feedback on their contributions. They also tended to agree that meaningful performance appraisal sessions can take place, that high levels of trust exist or can be developed between supervisors and subordinates, and that their respective supervisors have earned their trust and confidence.
The evidence to assess AcqDemo using Lawler criterion 3 was insufficient, and our evi- . dence is mixed to unfavorable for the remaining criteria. With reference to Lawler criterion I , we found that there is a modest link between compensation and contribution, but it is unclear

Barriers to Flexibility Usage, Support for Mission Needs, and Overa l l Effectiveness 139
whether the rewards are large enough. Responses to the AcqDemo survey suggest that many employees do not perceive this link. With respect to Lawler criterion 2, we found that many of the communication efforts in place, such as emailing pay pool outcomes and conducting town halls, focus more on conveying results than on conveying process. Employees expressed many concerns about the transparency of AcqDemo,s appraisal process, including how ratings are transformed into pay actions and how the pay pools are run. In addition, survey results suggest ambivalence about whether information is communicated to employees on how rewards are given.
Evidence related to Lawler criterion 4 is mixed. As discussed in Chapter Five, the overwhelming majority of AcqDemo participants can reasonably expect additional efforts or contributions to augment their salaries by $900 to $1,800-approximately 1 percent to 2 percent of average annualized basic pay. CAs boost employee compensation by about $1,000 on average but do not vary widely across employees. In the FY 2015 appraisal cycle, 92 percent of AcqDemo participants received a CA, and the overwhelming majority of those received an award totaling less than $2,000. Like other federal agencies, AcqDemo is subject to limits on the budgets available for salary increases and one-time bonuses because of policies issued by OPM, OMB, and DoD. However, AcqDemo organizations have elected to use their policyconstrained budgets to give smaller awards to the overwhelming majority of employees, rather than to give larger awards to a smaller percentage of employees.
Of particular concern is that the link between compensation and contribution appears to have weakened over time. In Chapter Five, we showed that the effect of a I-point increase in �OCS on an employee
,s salary in the following year declined between FYs 2012 and 2015.
Moreover, the variance, or spread, in AcqDemo salaries contracted over the same period. Because employees with a high 80CS in one year tend to also have a high 80CS in subsequent years, one would expect the variance in salaries to increase as rewards are granted to the same high-contributing employees year after year, but this is not what we observed. Potential causes of the narrowing spread in salaries include the aforementioned pay caps, the tendency to assign OCS within a narrow range, and the operation of the pay pool process, in which supervisors aim to reach a consensus on pay actions.
Lastly, AcqDemo does not score well against Lawler criterion 6. Survey and interview evidence indicate perceived subjectivity in the performance review process. In addition, only a minority of AcqDemo survey respondents (43 percent) agreed that performance can be objectively and inclusively measured; the remainder either disagreed or took a neutral view. However, it is important to note that nearly a quarter of AcqDemo employees are supervisors and that academic research suggests that objective measures of managers' performance may be difficult to specify in advance, given the nonroutine nature of their work.

CHAPTER EIGHT
Concluding Remarks
In 2012, our capacity to assess AcqDemo was limited by fluctuations in the projeds workforce. From 2007 to 2010, AcqDemo operated on a smaller scale, with fewer than 4,000 employees in any given year. In 201 1, however, the project was rejuvenated by an influx of more than 12,000 employees resulting from the elimination of NSPS. This assessment was conducted under more favorable conditions. The size of the AcqDemo workforce remained relatively stable from FY 201 1 to FY 2015, growing from 15,250 to 16,258 employees, an increase of only 6.6 percent. This assessment also comes on the cusp of another large influx of new participants: AcqDemo is forecasted to grow to 33,955 employees by the end of FY 2016 and to more than 50,000 employees by the end of FY 2018. This surge of new participants may complicate future evaluations of AcqDemo, particularly if policies and procedures are adjusted to accommodate the characteristics of entering organizations. Moreover, the expected influx signals an opportune time to examine lessons learned over the past four years, which can be applied strategically as the project expands.
This assessment benefited from the strength of its research design. It drew from a wide range of data sources, both quantitative and qualitative: AcqDemo program documents, archival data, interviews .with AcqDemo SMEs, data from the 2012 and 2016 AcqDemo surveys, and administrative data provided by DMDC and the AcqDemo Program Office. In order to isolate the effect of AcqDemo participation on a number of career outcomes, we constructed a comparison group of GS employees in ADEOs and weighted it to bring it in line with the population of AcqDemo employees along an array of observable characteristics. To assess the strength of the relationship between contribution and compensation within AcqDemo, we leveraged supplemental data provided by the AcqDemo Program Office to estimate the effect of a I-point increase in �OCS on basic pay, after controlling for other factors. AcqDemo survey data were weighted so that the population of survey respondents would be more representative of the population of AcqDemo participants. Qualitative data collected from openended, write-in responses to the 2016 AcqDemo survey and SME interviews conducted by our study team were systematically catalogued and coded for themes. The survey and interview data together provided a view into the observations and sentiments of AcqDemo participants, which we compared with actual outcomes estimated using administrative data.
This assessment was constrained by deficiencies in the available data. The non-AcqDemo comparison group for the 2016 AcqDemo survey suffered from a low response rate, and FEVS data were not available at the necessary level of detail to serve as a substitute. Consequently, we were not able to assess the perceptions of AcqDemo participants in relation to the perceptions of comparable GS employees. While we were able to construct a comparison group from the administrative data for our analysis of AcqDemo's effect on career outcomes, our abil-
141

142 2016 Assessment of the Civilian Acquisition Workforce Personnel Demonstration Project
ity to control for differences between the AcqDemo and GS populations was limited by the characteristics captured in the DMDC data files. We were not able to account for unobserved differences using a difference-in-difference approach because the overwhelming majority of AcqDemo participants transferred into the project from NSPS, rather than the GS system. In addition, our analysis of the relationship between employee performance and career outcomes was limited to the AcqDemo population because the performance rating data for GS employees were too coarse and unreliable. Deficiencies in the available archival data imposed limitations on our assessment of how AcqDemo's flexibilities have been used. Data related to the use of hiring and appointment flexibilities, such as the number of PRDs and offer-accept ratios, were not available, nor were data relating to performance feedback completion, such as the percentage of supervisors completing midcycle reviews. Some of the archival data we were able to access were incomplete. For instance, many organizations did not routinely submit site histories as requested, and grievance data were only available for 2013 and 2014.
AcqDemo Performance Summary
Our assessment revealed that AcqDemo is performing well in some respects. Favorability toward AcqDemo increased with the education level of its employees, which suggests that AcqDemo may be most appropriate for highly educated, technical workers-that is, the workforce for which it was originally intended. The $23,000 premium observed when comparing the average salary in AcqDemo with the average salary in ADEOs in the GS system was largely explained by differences between the two populations: Only $1,500 to $1 ,800 could be attributed to AcqDemo itsel£ Salary growth and retention outcomes in AcqDemo were similar to those in ADEOs in the GS system. Unionized employees within AcqDemo have done quite well over the past four years: They earned higher salaries than did comparable unionized employees in the GS system, and they experienced more promotions and more-rapid salary growth than did comparable nonunionized employees in AcqDemo.
One of AcqDemo's central tenets is that employees should be appropriately rewarded for their contributions to organizational mission. Our analysis of administrative data indicated that higher levels of contribution, as measured by �OCS, were associated with higher salaries, more-rapid salary growth, more promotions, and a greater likelihood of retention. The SMEs we interviewed agreed that AcqDemo fosters the recruitment and retention of talented personnel. AcqDemo's performance appraisal system is structured to allow for meaningful, constructive feedback at regular intervals. SMEs spoke favorably of the communication and feedback mechanisms, and more than 60 percent of survey respondents agreed that their supervisors set clear contribution goals, effectively communicate expectations for positions, and provide adequate feedback on contributions. In addition, about 65 percent of survey respondents agreed that their supervisors have earned their trust and confidence.
Other aspects of AcqDemo leave room for improvement. Starting salaries were about $13,000 higher in AcqDemo than they were in the equivalent GS population, even after controlling for other factors. On the one hand, this constitutes evidence of AcqDemo exercising the pay-setting flexibility that was designed to attract highly skilled and motivated personnel. On the other hand, comparable employees were hired under the GS system at a lower salary level. Interestingly, only 26 percent of supervisors agreed that AcqDemo had a positive effect on their authority to influence their employees' pay at hiring. Qualitative evidence suggests

Concluding Remarks 143
that organization business rules, HR organizations, and upper management are perceived as reducing the ability to use this type of flexibility. Promotions were less prevalent in AcqDemo than in the equivalent GS population, even after normalizing promotions within the GS population and controlling for other factors. However, within AcqDemo, promotions occur more frequently among high contributors and less frequently among low contril;mtors.
In some cases, we observed disparities in career outcomes across gender and race or ethnicity groups. When compared with the GS system, AcqDemo raised starting salaries and salaries overall for every gender and race or ethnicity group we examined, but the rising tide did not lift all boats equally. For example, the AcqDemo starting salary premium was about $13,000 for the population at large, but the premium was only about $11 ,000 for black employees. Female and nonwhite employees in AcqDemo experienced fewer promotions and less-rapid salary growth than their counterparts in the GS system. For instance, AcqDemo participation reduced the likelihood of promotion for the average nonwhite employee from about 19 percent to about 13 percent.1 Within AcqDemo, female employees were retained at a lower rate than were male employees, but that pattern was also present within the equivalent GS population. Black and Asian employees, however, were retained at higher rates than their white counterparts.
As noted earlier, higher levels of contribution, as measured by .6.0CS, were as�ociated with higher salaries. However, only about 40 percent of survey respondents perceived a link between contribution and compensation. One possible explanation for the misalignment may be the perceived lack of transparency regarding how pay pool results are shared. Another explanation is that employees may feel that OCSs do not adequately capture their contributions. Senior-level employees and supervisors are heavily represented in AcqDemo, and the performance of managerial personnel can be difficult to measure objectively. In fact, only 43 percent of AcqDemo survey respondents agreed that performance can be objectively and inclusively measured.
Yet another explanation is that employees may feel that compensation does not vary enough with contribution. About 90 percent of employees have a .6.0CS of zero to +4, and within that range, employees can reasonably expect additional efforts or contributions to result in salary increases of, at most, $1 ,400. Moreover, the link between contribution and compensation has weakened over time. Potential culprits include pay caps associated with being at the top of a pay band, coming up against a control point, or being on retained pay; the tendency to corral employees into appraisal zone C, and particularly within a .6.0CS range of zero to +4; and the operation of the pay pool process, in which supervisors aim to reach a consensus on pay actions. Whatever the cause, we recommend that AcqDemo strengthen the link between compensation and contribution, both perceived and actual. This relationship is the foundational principle of the system, and, as such, any further deterioration in the pay-contribution link might threaten the viability of AcqDemo.
While AcqDemo's feedback and communication procedures were regarded favorably, both interviewees and survey respondents expressed concerns about the time, effort, and administrative burden associated with implementing AcqDemo's appraisal flexibilities. More specifically, appraisal writing, feedback sessions, and pay pool administration were described as time-consuming and potentially inefficient, with some survey respondents indicating that the time devoted to these processes may be detracting from the greater mission of the organization. Reducing the number of
1 After controlling for other factors, we found that the four-year annualized rate of salary growth among nonwhite employees in AcqDemo was 0.78 percentage points lower than the rate among nonwhite GS employees in ADEOs. This estimate was statistically significant at the 5-pcrcent level.

144 2016 Assessment of the Civilian Acquisition Workforce Personnel Demonstration Project
appraisal factors from six to three, as planned, might streamline many of these processes, thereby lightening the load on employees, supervisors, and managers.
Survey respondents and interviewees also expressed concerns about the transparency and fairness of AcqDemo's appraisal process, while opportunities for employees to contribute to the project's devdopment and improvement have diminished. Only 42 percent of survey respondents agreed that information is communicated to employees about how rewards are given. Write-in responses to the 2016 AcqDemo survey indicated that employees perceived a lack of transparency regarding how and when business rules-especially control points-are developed and disseminated, how ratings are calculated and translated to pay, how the pay pool process works, and how their ratings compare to the ratings of other employees. Some interviewees echoed the concerns raised about the transparency of the pay pool process and the transparency of the calculations used to convert ratings to pay actions. Quantitative data collected from the 2016 survey indicated that many employees perceived a lack of fairness in how the appraisal system is administered. Only 35 percent of survey respondents agreed that their organizations administer pay fairly, and the percentage was lower among employees who were female or black. A larger share, 47 percent, agreed that supervisors are fair in recognizing individual contributions, but that percentage was lower among female respondents. Concerns about the transparency and fairness of the appraisal process should be addressed before they erode employees' motivation to participate fully in CCAS.
Considerations for Future Assessments
As AcqDemo expands, it will be important to monitor not only cost growth and career outcomes but also employee perceptions. Schay and Fisher (2013) summarized research that found that performance-based pay systems are viewed more favorably by men, -managers, white-collar employees, and those with higher levels of academic achievement. However, a comparison of the demographics of AcqDemo and ADEOs in the GS system indicates that AcqDemo's new entrants are more likely to be female, less likely to hold a graduate degree, and less likely to be a supervisor or hold a senior-level position than are existing AcqDemo participants.
AcqDemo's new entrants are also more likely to be in a bargaining unit. Historically, labor unions have expressed reservations about performance-based systems, and unionized organizations have been regarded as a less-suitable context for such systems (Durham and Bartol, 2003, as cited in Schay, 2013). However, as mentioned earlier, the experiences of unionized employees in AcqDemo have been quite positive: They earned higher salaries than their GS counterparts did and experienced more-rapid salary growth and more promotions than nonunionized AcqDemo employees did.
An influx of more than 30,000 employees over the next two years may resurrect some of the issues the project grappled with in 201 1 . Our 2012 assessment found that a lack of familiarity with AcqDemo impeded its smooth implementation: It took employees a few pay cycles to acclimate to the project and its practices. The entrance of a large number of organizations within a short time frame might strain the AcqDemo Program Office's finite resources for providing support, guidance, and training. However, the backdrop in 201 1 was quite different than it is currently. At present, there is a sizable and stable population of AcqDemo participants in place. Entering organizations can draw on the experiences of veteran organizations to help them navigate AcqDemo over the first few pay cycles.

APPENDIX A
AcqDemo Survey Data Quantitative Analysis
Survey Overview
Our study team received data from CSRA Inc. for the 2012, 2014, and 2016 AcqDemo surveys on March 16, 2016.1 According to CSRA Inc., the opportunity to take the survey was offered to all AcqDemo participants, including those who had just entered the demonstration project. Each year, there was also a "control group" survey offered to organizations eligible to join AcqDemo that had not yet done so.
There were a few problems with the survey data that limited our ability to use them for our assessment. Data from the control survey were used as the basis for comparison in our 2012 assessment, but the findings were tempered by a low response rate (16 percent in 2012). This issue was an even greater concern in 2016, as only 52 control group surveys were submitted. This miniscule response rate meant that we could not use the 2016 control group for our analysis. The response rate to the 2016 survey given to AcqDemo participants was 28 percent-much higher than the rate for the control group survey, but low enough to be concerned about nonresponse bias amongst survey respondents.2 In addition, there were problems with the 2014 survey administration that led to certain key variables (such as bargaining unit status and being at the top of one's pay band) being omitted from the data. These two variables identify important groups not only for the subgroup analyses described in the next section but also for use as controls in regression models. Due to these missing data, we chose not to use 2014 survey data in our assessment.
Given the lack of a 2016 control group, the aforementioned lack of a referent group from the FEVS,3 and our decision to exclude the 2014 survey, we were left with the 2012 and 2016 surveys administered to the AcqDemo workforce. Thus, this analysis centers on the sentiments expressed in the 2016 AcqDemo survey and changes in those sentiments since the 2012 survey. Before proceeding with the analysis, we wanted to ensure that the survey respondents were indeed AcqDemo participants. Thus, we dropped survey respondents who indicated that they were not AcqDemo members (138 respondents in 2016), as well as those who indicated that they were not in an AcqDemo pay plan (e.g., SES or military personnel, 306 respondents in
1 These surveys were developed, licensed, and administered by CSRA Inc. under the purview of chc AcqDemo Program Office. We did not participate in these aspects of the survey process; we simply received the resultant data.
2 The response rate for the 2012 survey given to AcqDemo participants was 34 percent.
3 As noted earlier in the repon, although the FEVS includes items that are similar to those included in the AcqDemo survey and enables the identification of survey respondents in AcqDemo, the data necessary to construct an appropriate control group-that is, a comparison group that accounts for characteristics, such as supervisory status, gender, age, and other individual attributes that could influence responses beyond any sort of"AcqDcmo cffcct"-werc not available.
145
146 2016 Assessment of the Civilian Acquisition Workforce Personnel Demonstration Project
2012 and eight respondents in 2016). If respondents left the AcqDemo membership item blank but indicated that he or she was in an AcqDemo pay plan, the record was retained (427 respondents in 2012 and 101 respondents in 2016 were dropped for leaving the AcqDemo membership item blank and not indicating they were in an AcqDemo pay plan). After implementing these exclusions, our data files included 4,478 respondents for the 2012 AcqDemo survey and 5,017 respondents for the 2016 AcqDemo survey.
Representativeness and Weighting
Our next step was to assess how representative the survey respondents were of the AcqDemo workforce as a whole. As noted earlier, the response rate for the 2016 survey given to AcqDemo participants was 28 percent, which was low enough to call the representativeness of the survey respondents into question. To assess the representativeness, we compared the demographic makeup of AcqDemo survey respondents with the demographic makeup of the AcqDemo workforce population. Population demographics were obtained from the DMDC civilian personnel inventory files. We compared 2016 AcqDemo survey respondents with the AcqDemo workforce population on September 30, 2015, because it was the most recent date for which DMDC data were available. To maintain consistency in our approach, we compared 2012 AcqDemo survey respondents with the AcqDemo workforce population on September 30, 2011 .
Tables A.I and A.2 provide demographic comparisons for the 2012 and 2016 surveys, respectively. The survey respondents were representative with respect to many demographic categories, including Hispanic/Latino and bargaining unit. However, there were also a number of substantive differences. Older personnel, supervisors, and those with graduate degrees were highly overrepresented in the survey; nonsupervisors and employees with bachelor's degrees or less were quite underrepresented. For example, 23 percent of the 2015 AcqDemo population had supervisor status, compared with 32 percent of2016 AcqDemo survey respondents.
To correct for the nonresponse bias, we weighted the survey responses to be more representative of the AcqDemo workforce population. We used the demographic proportions of the full AcqDemo population, as indicated in the third columns of Tables A.I and A.2, as benchmark distributions for the weighting. Survey weights were calculated using a raking algorithm. 4 Because each additional demographic category used in the weighting algorithm reduces the ability to precisely match population proportions, we selected a subset of key characteristics on which to base the weights: education level, supervisory status, component, and gender.5 The results of the weighting procedures can be found in the last columns of Tables A.I and A.2.
4 Specifically, the algorithm is from the "ipfweight" command from the ipfweight package using Stata 13.1 SE software. A raking algorithm, also known as iterative proportional fitting, tries to find weights to make the demographic distributions from a sampled data set macch the demographic distribution of che general population. The algorithm iteratively tries different combinations of weights until general population distributions arc perfectly matched or fall within a specified tolerance.
5 Component was included because of the disproportionate response rate. Gender was included because the weighting process distorted the gender balance when gender was omitted from the weighting algorithm.

Table A.1
AcqDemo Survey Data Quantitative Analysis 147
Demographic Comparison of 2015 AcqDemo Population and 2016 Survey Sample
Percentage
Weighted AcqDemo 2016 Survey 2016 Survey Population Respondents Respondents
Demographic Category Characteristic (N = 16,258) (N = 5,017) (N = 5,017)
Age Younger than 30 4 2 2 30-39 17 14 14 40-49 23 2 1 20 50-59 43 48 49
60 or older 12 1 5 1 5
Gender Male 65 65 65 Female 35 35 35
Race White 78 78 78 Black 15 14 13 Asian 4 3 3 Other 3 5 6
Hispanic/Latino Yes 5 6 6 No 95 94 94
Education level No college 14 2 14 Some college 9 13 9
Bachelor's degree 37 32 37 Graduate degree 40 54 40
Component Army 48 44 48 Air Force 19 1 9 1 9
DoD agencies 17 19 17 Marine Corps 1 1 12 11
Navy 4 5 4
Career path NH 94 96 93 NJ 3 2 3 NK 3 2 4
Supervisor Yes 23 32 23 No 77 68 77
Bargaining unit Yes 9 8 9 No 91 92 91
SOURCES: DMDC civilian personnel inventory files, September 30, 201 5, snapshot; 201 6 AcqDemo survey.
NOTE: Percentages may not add up to 1 00 due to rounding.
Analytic Methods
After properly weighting survey responses to more closely represent the AcqDemo population, we proceeded with our analysis of the quantitative survey data. Most of the substantive survey items take the form of a statement that the respondent is asked to evaluate using a five-point Likert scale of agreement or sentiment (strongly agree, agree, neither agree nor disagree, disagree, and strongly disagree or very positive, positive, neither positive nor negative, negative, and very negative) along with a "no basis to judge" option. For ease of presentation and interpretation, we often collapsed these scales into two bins: strongly agree/agree versus neutral/

148 2016 Assessment of the Civilian Acquisition Workforce Personnel Demonstration Project
Table A.2 Demographic Comparison of 2011 AcqDemo Population and 2012 Survey Sample
Percentage
Weighted AcqDemo 2012 Survey 2012 Survey Population Respondents Respondents
Demographic Category Characteristic (N = 15,250) (N = 4,478) (N = 4,478)
Age Younger than 30 6 4 5 30-39 14 12 12 40-49 31 30 30 50-59 39 43 42
60 or older 10 1 1 1 1
Gender Male 62 64 62 Female 38 36 38
Race White 78 80 81 Black 15 12 1 1 Asian 5 4 4 Other 2 4 4
Hispanic/Latino Yes 5 5 5 No 95 9S 9S
Education level No college 17 2 17 Some college 8 17 1 1
Bachelor's degree 39 33 39 Graduate degree 31 49 33
Component Army so 42 so Air Force 1 9 21 1 9
DoD agencies 17 32 17 Marine Corps 13 4 13
Navy 1 1 1
Career path NH 93 95 90 NJ 3 3 3 NK 4 2 7
Supervisor Yes 21 3S 21 No 79 GS 79
Bargaining unit Yes 1 1 1 0 12 No 89 90 88
SOURCES: DMDC civilian personnel data files, September 30, 201 1 , snapshot; 2012 AcqDemo survey.
NOTE: Percentages may not add up to 1 00 due to rounding.
disagree/strongly disagree.6 In the 2012 assessment, we noted that there were issues with high proportions of "no basis to judge
,, responses on certain survey items. In the four years that have
passed since that assessment, AcqDemo members have gained a lot of experience with different aspects of the system, and "no basis to judge
,, responses are considerably less prevalent in the
6 For chose survey items with responses based on a five·point Liken scale, ordered logic regression models were used as a robustness check on the collapsed cwo·category findings. These models arc the best fit for the analysis of Liken scale survey items, but the difficulty in presenting these results led us to concentrate on the simple logistic models. The findings from the ordered logistic regression models mirrored the simpler logistic models for the majority of survey items. This enabled us co present the collapsed scales with confidence that we were nor obscuring important variation, such as changes in high levels of extreme agreement or disagreement, with this method.

AcqDemo Survey Data Quantitative Analysis 149
2016 data. For all regression analyses, responses that indicated "no basis to judge" were coded as missing for that particular survey item.
Since the last assessment, a number of additional organizations have joined AcqDemo. This was a concern for the survey analysis because the entry of these organizations clouded comparisons across the two survey years.7 To maximize the fidelity of these comparisons, we included only organizations that had respondents for both the 2012 and 2016 surveys. This excluded about 10 percent of the respondents in 2016 (515 respondents) and fewer than 1 percent of the respondents in 2012 (20 respondents). The demographic breakdown of the final analytic data set can be found in Table A.3.
Primary Analysis
As previously stated, the survey data ·analysis centered on the responses to the 2016 AcqDemo survey and comparisons between the 2016 survey and 2012 survey responses. This approach provided a current snapshot of the sentiments of AcqDemo participants and enabled us to identify areas where sentiment had changed notably over time, either positively or negatively. We did not analyze every item from the survey. Instead, we focused on the survey items most relevant to the legislatively prescribed assessment criteria. A summary of the items cited in Chapters Three through Seven, including their weighted response frequencies, is provided at the end of this appendix in Table A.4. We used logistic regression models to examine the change over time in �e outcome of interest for individual survey items while controlling for demographic characteristics. In most cases, the outcome of interest was the percentage of the AcqDemo sample that agreed or strongly agreed with {or was positive or very positive about) a survey item. A handful of items that included yes or no responses were analyzed in a similar manner.
There were significant differences in the demographics of 2012 and 2016 survey respondents in every one of the key variables except Hispanic/Latino {as shown in Table A.3), so the influence of these differences needed to be taken into account. All regressions discussed and presented in this report controlled for the demographic variables listed in Table A.3. In all cases, results reported as statistically significant were significant at the 5-percent level.
Subgroup Analysis
We also conducted extensive analyses comparing the survey item responses from different subgroups of the AcqDemo workforce. Some of these subgroup analyses were mandated. For instance, because criterion J called for an analysis of diversity, we examined how responses to the survey items varied by gender and race or ethnicity. A number of other subgroup analyses were not required by the assessment criteria but were deemed important by RAND's study team. For example, we examined whether employees at the top of their pay bands perceived the fairness of pay administration differently. A summary of the items reported at the subgroup level in Chapters Three through Seven, including their weighted response frequencies, is provided in Table A.5.
To analyze the responses to items that were asked on both the 2012 and 2016 surveys, we employed a difference-in-difference approach. We used logistic regression to determine whether there were significant differences between the responses of the subgroups in both 2012 and 2016 individually and then checked to see if the difference-in-difference estima-
7 The issue can cut both ways. The more obvious situation is the one in which organizations with 2016 responses had no 201 2 responses (because they were not in AcqDcmo in 2012), but, alternatively, there may be organizations with 2012 responses that had no 2016 responses.

150 2016 Assessment of the Civilian Acquisition Workforce Personnel Demonstration Project
Table A.3 Demographic Comparison of 2012 and 2016 Survey Samples
Percentage
Weighted 2016 Survey Weighted 2012 Respondents Survey Respondents
Demographic Category Characteristic (N = 4,502) (N = 4,458)
Age* Younger than 30 2 5 30-39 13 12 40-49 20 30 50-59 49 42
60 or older 1 5 1 1
Gender* Male 65 63 Female 35 37
Race* White 78 81 Black 13 1 1 Asian 3 4 Other 6 4
Hispanic/Latino Yes 6 5 No 94 95
Education level* No college 13 17 Some college 9 1 1
Bachelor's degree 38 39 Graduate degree 40 33
Component* Army 51 so Air Force 17 19
DoD agencies 19 17 Marine Corps 13 13
Navy 1 1
Career path* NH 92 90 NJ 4 3 NK 4 7
Supervisor* Yes 22 22 No 78 78
Bargaining unit* Yes 9 12 No 91 88
SOURCE: 2012 and 201 6 AcqDemo surveys.
NOTES: The data include only organizations that had respondents for both the 2012 and 2016 surveys. Responses from individual locations of Army Contracting Command and Army Test and Evaluation Command offices were aggregated for 2016 and compared with 2012 responses from the parent organization. Percentages may not add up to 100 due to rounding. * = Significant difference on chi-squared test at the 5-percent level.
tor was significant. This estimator tests for whether the difference in sentiment or agreement between the subgroups changed from 2012 to 2016. By way of illustration, consider the following example: In both 2012 and 2016, there was a 15-percentage-point difference between the agreement reported by supervisors (50 percent) and the agreement reported by nonsupervisors (35 percent) for a specific survey item. All else equal, this scenario would likely deliver a statistically insignificant difference-in-difference estimator because the percentage-point difference between the two groups did not change over time. However, if the percentage-point difference were to have changed from 15 points in 2012 to 3 points in 2016, the difference-in-difference estimator may have been statistically significant.

AcqDemo Survey Data Quantitative Analysis 1 51
Table A.4 Weighted Response Frequencies for the 2012 and 2016 AcqDemo Survey Items Included in This Report, Full Sample
2012 Survey 2016 Survey
Survey Item SA A N D SD SA A N D SD
Chapter Three
I am in favor of AcqDemo 15 25 31 12 17 15 27 27 12 20 for my organization
Chapter Four
Satisfied with training 14 43 23 14 6 14 47 24 1 0 5 for your present job
Influence of AcqDemo 5 16 69 8 2 5 1 8 68 7 3 on satisfaction with training for your present job
I understand the difference 23 53 13 8 2 23 52 12 9 4 between Contribution and Performance
Employees I supervise understand 10 56 26 6 2 16 59 19 5 the difference between contribution and performance
I understand the contribution 15 62 15 7 26 63 8 2 planning process
I know how to submit my ideas Not included in survey 5 21 29 30 1 5 to enhance the benefits of AcqDemo
I know how to submit my ideas Not included in survey 5 23 28 29 15 to improve the administration of AcqDemo
Chapter Five
I see myself working at my current 19 39 23 8 1 1 20 41 21 9 1 0 organization one year from now
High contributors tend to stay 1 0 31 34 17 8 8 26 34 20 13 with this organization
Low contributors tend to leave this 4 15 42 25 14 3 1 0 41 27 1 9 organization
Satisfied with your pay 1 5 45 18 1 6 7 1 5 43 17 1 6 9
Influence of AcqDemo 10 23 41 1 8 8 1 0 28 35 17 9 on satisfaction with your pay
In this organization, my pay raises depend on 9 32 23 19 17 9 33 21 19 18 my contribution to the organization's mission
Under AcqDemo, my salary is more directly 19 25 27 1 3 1 5 1 5 27 25 14 18 tied to my contribution to the mission than under the GS system
Satisfied with opportunities for promotion 6 20 31 21 22 7 21 27 22 23
Influence of AcqDemo on satisfaction with 4 1 1 57 20 7 4 1 2 54 20 1 0 opportunities for promotion

1 52 2016 Assessment of the Civilian Acquisition Workforce Personnel Demonstration Project
Table A.4-Continued
2012 Survey 201 6 Survey
Survey Item SA A N D SD SA A N D SD
AcqDemo has had a positive impact on my 4 19 41 1 8 1 9 4 18 48 1 8 12 ability to influence classification decisions
The AcqDemo Position Requirements 6 37 38 1 1 7 13 55 21 7 3 Document allows me to adequately describe the duties of the positions I supervise
The hiring process was faster under 6 15 47 21 1 1 5 1 0 44 26 1 5 AcqDemo than under the GS system
AcqDemo allowed me to be more 5 20 44 19 12 5 10 47 24 14 selective in hiring than I was under the GS system
AcqDemo has had a positive impact 4 18 31 22 25 7 21 35 21 1 6 o n my authority to influence my employees' pay at hiring
My supervisor and I work together 21 35 20 14 1 0 1 8 43 20 12 7 to set clear contribution goals for me
My supervisor has effectively 19 43 17 12 9 22 46 1 6 1 0 6 communicated to me his/her expectations for my position
My supervisor provides adequate 25 34 17 12 12 24 40 18 1 0 8 feedback on my contribution
Chapter Six
I see myself working at my current 19 39 23 8 1 1 20 41 21 9 1 0 organization one year from now
Satisfied with your pay 15 45 18 16 7 15 43 17 1 6 9
Influence of AcqDemo on satisfaction 10 23 41 18 8 1 0 28 35 17 9 with your pay
Satisfied with opportunities 6 20 31 21 22 7 21 27 22 23 for promotion
Influence of AcqDemo on satisfaction 4 11 57 20 7 4 12 54 20 1 0 with opportunities for promotion
Chapter Seven
In this organization, my pay raises 9 32 23 19 17 9 33 21 1 9 1 8 depend o n m y contribution to the organization's mission
Under AcqDemo, my salary is more 19 25 27 13 1 5 1 5 27 25 14 18 directly tied to my contribution to the mission than under the GS system
My organization administers pay fairly 8 26 27 20 1 9 7 28 25 21 1 9
I a m comfortable with the way my 9 25 26 20 21 7 28 23 22 20 organization administers the contribution appraisal system
Supervisors are fair in recognizing 10 37 21 20 12 9 37 26 15 14 individual contributions
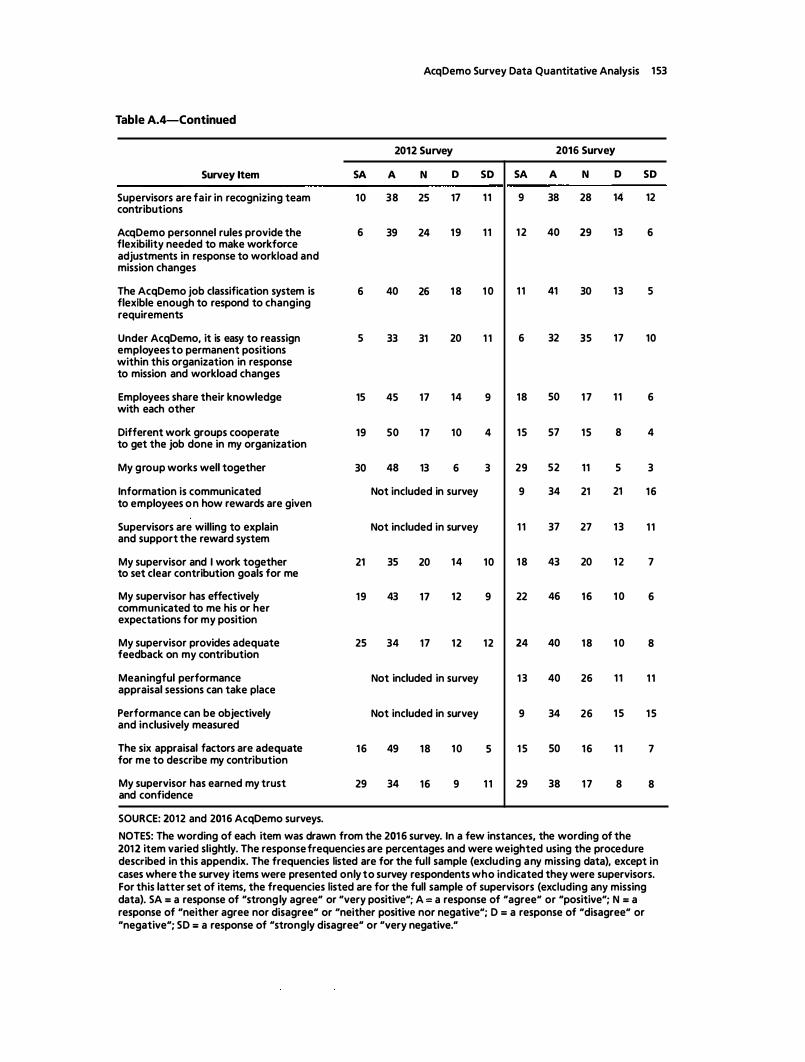
AcqDemo Survey Data Quantitative Analysis 153
Table A.4-Continued
2012 Survey 2016 Survey
Survey Item SA A N D SD SA A N D SD
Supervisors are fair in recognizing team 10 38 25 17 1 1 9 38 28 14 12 contributions
AcqDemo personnel rules provide the 6 39 24 19 1 1 12 40 29 13 6 flexibility needed to make workforce adjustments in response to workload and mission changes
The AcqDemo job classification system is 6 40 26 1 8 1 0 1 1 41 30 13 5 flexible enough to respond to changing requirements
Under AcqDemo, it is easy to reassign 5 33 31 20 1 1 6 32 35 17 10 employees to permanent positions within this organization in response to mission and workload changes
Employees share their knowledge 15 45 17 14 9 18 50 17 1 1 6 with each other
Different work groups cooperate 19 50 17 10 4 15 57 15 8 4 to get the job done in my organization
My group works well together 30 48 13 6 3 29 52 11 5 3
Information is communicated Not included in survey 9 34 21 21 16 to employees on how rewards are given
Supervisors are willing to explain Not included in survey 1 1 37 27 13 1 1 and support the reward system
My supervisor and I work together 21 35 20 14 10 18 43 20 12 7 to set clear contribution goals for me
My supervisor has effectively 19 43 17 12 9 22 46 16 1 0 6 communicated to me his or her expectations for my position
My supervisor provides adequate 25 34 17 12 12 24 40 18 1 0 8 feedback on my contribution
Meaningful performance Not included in survey 13 40 26 1 1 1 1 appraisal sessions can take place
Performance can be objectively Not included in survey 9 34 26 1 5 1 5 and inclusively measured
The six appraisal factors are adequate 16 49 18 10 5 1 5 so 16 1 1 7 for me to describe my contribution
My supervisor has earned my trust 29 34 16 9 1 1 29 38 17 8 8 and confidence
SOURCE: 2012 and 2016 AcqOemo surveys.
NOTES: The wording of each item was drawn from the 201 6 survey. In a few instances, the wording of the 2012 item varied slightly. The response frequencies are percentages and were weighted using the procedure described in this appendix. The frequencies listed are for the full sample (excluding any missing data), except in cases where the survey items were presented only to survey respondents who indicated they were supervisors. For this latter set of items, the frequencies listed are for the full sample of supervisors (excluding any missing data). SA = a response of "strong ly agree" or "very positive"; A = a response of "agree" or "positive"; N = a response of "neither agree nor disagree" or "neither positive nor negative"; D = a response of "disagree" or "negative"; SD = a response of "strongly disagree" or "very negative."

154 2016 Assessment of the Civilian Acquisition Workforce Personnel Demonstration Project
Table A.5 Weighted Response Frequencies for the 2012 and 2016 AcqDemo Survey Items Included in This Report, by Subgroup
2012 Survey 2016 Survey
Survey Item Characteristic Subgroup SA A N D SD SA A N D SD
Chapter Three
I am in favor Education level No college 14 17 34 15 19 1 0 22 25 12 32 of AcqDemo for my Some college 1 1 26 31 14 1 8 1 2 27 29 13 20 organization
Bachelor's 14 26 31 12 17 14 28 28 12 18 degree
Graduate 18 27 29 10 1 5 1 8 27 27 1 1 1 6 degree
Supervisory Nonsupervisor 14 24 31 13 17 13 26 28 12 21 status
Supervisor 18 27 30 10 15 21 28 24 1 1 1 5
Bargaining Nonunion 16 25 30 12 17 14 26 27 12 19 unit status member
Union member 13 28 37 9 13 20 28 25 8 1 9
Pay band Not at the top 15 25 31 13 16 14 27 27 12 20 position of the pay band
At the top of 16 24 30 1 1 19 1 7 26 27 12 19 the pay band
Chapter Four
Satisfied with Supervisory Nonsupervisor 13 42 23 14 7 13 46 24 1 1 5 training for status your present Supervisor 16 48 21 11 3 1 8 49 22 8 4 job
Employees Supervisory Supervisor 10 59 23 6 3 1 6 61 17 6 I supervise status understand the difference between contribution and performance
I understand Supervisory Supervisor 15 62 15 7 26 63 8 2 the contribution status planning process
Chapter Five
I see myself Supervisory Nonsupervisor 18 39 23 8 1 1 1 8 40 22 9 1 1 working at status my current Supervisor 23 42 18 8 9 25 43 18 7 7 organization one year from Bargaining Nonunion 20 40 23 8 1 0 20 42 20 9 9 now unit status member
Union member 16 39 20 12 14 20 32 24 6 1 8

AcqDemo Survey Data Quantitative Analysis 1 55
Table A.5-Continued
2012 Survey 2016 Survey
Survey Item Characteristic Subgroup SA A N D SD SA A N D SD
Satisfied with Supervisory Nonsupervisor 13 44 19 17 8 12 42 1 8 18 10 your pay status
Supervisor 21 49 12 14 5 22 46 14 12 6
Bargaining Nonunion 15 44 18 15 7 14 43 1 7 1 7 9 unit status member
Union 1 1 51 1 5 17 6 1 5 41 17 15 1 1 member
Influence of Supervisory Nonsupervisor 9 23 42 1 8 8 1 0 26 36 18 9 AcqDemo on status satisfaction Supervisor 1 1 26 38 18 8 13 34 32 14 6 with your pay
Bargaining Nonunion 10 22 42 18 8 1 0 28 35 17 9 unit status member
Union 8 31 41 14 5 12 29 35 1 8 7 member
Satisfied with Supervisory Nonsupervisor 5 18 30 22 25 6 1 9 26 24 26 opportunities status for promotion Supervisor 8 28 34 18 12 10 30 31 16 12
Bargaining unit Nonunion 6 19 32 21 22 7 22 27 22 22 status member
Union 4 26 29 22 18 9 1 9 22 21 28 member
Influence of Supervisory Nonsupervisor 4 1 1 56 21 8 4 1 1 52 21 11 AcqDemo on status satisfaction Supervisor 4 14 62 15 5 5 17 58 14 5 with opportunities Bargaining Nonunion 4 1 1 58 20 7 4 13 54 20 1 0 for promotion unit status member
Union 3 14 56 19 7 6 1 1 51 19 14 member
AcqDemo has Supervisory Supervisor 4 19 41 18 19 4 18 48 1 8 12 had a positive status impact on my ability to influence classification decisions
The AcqDemo Supervisory Supervisor 6 37 38 1 1 7 13 55 21 7 3 Position status Requirements Document allows me to adequately describe the duties of the positions I supervise

156 2016 Assessment of the Civilian Acquisition Workforce Personnel Demonstration Project
Table A.5-Continued
2012 Survey 2016 Survey
Survey Item Characteristic Subgroup SA A N D SD SA A N D SD
The hiring Supervisory Supervisor 5 1 5 47 21 1 1 5 1 0 44 26 15 process was status faster under AcqDemo than under the GS system
AcqDemo Supervisory Supervisor 5 20 44 19 12 5 1 0 47 24 14 allowed me to status be more selective in hiring than I was under the GS system
AcqDemo has Supervisory Supervisor 4 18 31 22 25 7 21 35 21 16 had a positive status impact on my authority to influence my employees' pay at hiring
Chapter Six
I see myself Gender Female 18 41 23 9 9 17 41 21 1 0 1 1 working at my current Male 20 38 22 8 1 1 22 41 20 8 9 organization one year from Race Asian 24 33 31 7 4 23 34 25 7 1 1 now
Black 16 36 27 8 13 17 35 27 1 0 1 2
Other/ 25 24 23 1 1 17 15 38 1 8 1 5 14 multirace
White 19 41 21 8 1 0 21 43 1 9 8 9
Hispanic/ Yes 26 27 26 9 12 15 44 20 6 13 Latino
No 19 40 22 8 1 1 21 41 21 9 10
Satisfied with Gender Female 16 41 16 17 10 12 42 17 1 8 1 1 your pay
Male 14 47 18 15 5 1 6 43 17 16 8
Race Asian 18 38 27 1 1 7 1 8 36 23 1 1 1 2
Black 1 1 46 19 1 5 9 13 36 19 21 1 1
Other/ 21 29 14 27 8 7 38 20 20 15 multirace
White 15 46 17 16 7 16 45 1 6 1 5 8
Hispanic/ Yes 1 9 34 27 14 6 1 1 44 17 1 5 1 3 /.
Latino No 15 46 17 16 7 1 5 43 17 1 6 9

Table A.5-Continued
Survey Item
Influence of AcqDemo on satisfaction with your pay
Satisfied with opportunities for promotion
Influence of AcqDemo on satisfaction with opportunities for promotion
Characteristic
Gender
Race
Hispanic/ Latino
Gender
Race
Hispanic/ Latino
Gender
Race
Hispanic/ Latino
Subgroup
Female
Male
Asian
Black
Other/ multi race
White
Yes
No
Female
Male
Asian
Black
Other/ multi race
White
Yes
No
Female
Male
Asian
Black
Other/ multirace
White
Yes
No
AcqDemo Survey Data Quantitative Analysis 1 57
2012 Survey 2016 Survey
SA A N D SD SA A N D SD
9 23 40 19 9 8 27 37 19 10
10 23 42 17 7 12 29 35 17 8
16 20 37 21 6
8 28 39 14 1 1
5 16 43 2 3 12
10 23 42 18 7
14 22 41 17
18
6
10 23 41 8
6
5
18 34 22 1 9
21 30 21 24
13 21 33 18 1 5
6
8
5
6
6
19 33 24 1 9
22 18 23 29
20 32 21 23
21 37 19 1 7
20 31 21 22
4 12 55 22 7
4 1 1 59 1 8 7
10 20 38 25 7
5
2
4
4
4
18 50 20 6
3 57 23 1 5
10 60 1 9 7
14 57 1 6 1 0
1 1 58 19 7
13 29 32 20 6
8 29 37 18 8
6 22 38 22 1 3
1 1 2 9 35 17 8
1 0 26 31 19 14
1 1 28 36 17 8
7
7
21 26 23 23
22 28 21 23
10 19 27 19 25
6
7
7
9
7
4
5
8
5
2
4
4
4
21 26 24 22
1 6 26 1 6 34
22 27 22 22
21 24 18 27
21 27 22 22
13 52 20 1 1
12 54 1 9 9
1 7 38 23 13
18 45 20 1 1
7 49 27 1 5
12 56 1 9 9
17 49 1 6 1 5
12 54 20 1 0

1 58 2016 Assessment of the Civilian Acquisition Workforce Personnel Demonstration Project
Table A.5-Continued
2012 Survey 2016 Survey
Survey Item Characteristic Subgroup SA A N D SD SA A N D SD
Chapter Seven
My organization Gender Female 7 22 28 20 22 5 25 27 23 21 administers pay fairly Male 9 28 26 20 17 8 30 24 20 18
Race Asian 13 19 30 22 1 6 1 2 25 23 17 22
Black 6 19 38 16 22 6 23 32 19 21
Other/ 1 1 1 2 35 20 22 3 19 26 2 1 3 1 multi race
White 8 28 25 20 19 7 30 24 21 17
I am comfortable Gender Female 8 22 28 21 22 5 24 23 25 23 with the way my organization Male 9 27 25 19 20 8 29 22 21 19 administers the contribution Race Asian 12 17 31 23 17 12 22 28 1 5 22 appraisal system
Black 6 19 36 20 20 7 23 27 22 22
Other/ 1 1 14 36 1 5 25 4 22 22 21 30 multirace
White 9 27 23 20 21 7 29 22 23 1 9
Supervisors are Gender Female 9 32 20 23 16 7 33 25 17 18 fair in recognizing Male 10 40 21 18 1 1 1 0 39 26 14 1 1 individual contributions
Supervisors Gender Female 9 37 24 1 9 12 7 34 28 15 16 are fair in recognizing team Male 10 39 25 1 6 1 0 1 0 3 9 28 13 10 contributions
AcqDemo Supervisory Supervisor 6 40 24 19 1 1 1 2 40 29 13 6 personnel status rules provide the flexibility needed to make workforce adjustments in response to workload and mission changes
The AcqDemo Supervisory Supervisor 6 39 26 18 10 1 1 41 30 13 5 job classification status system is flexible enough to respond to changing requirements

Table A.5-Continued
Survey Item
Under AcqDemo, it is easy to reassign employees to permanent positions within this organization in response to mission and workload changes
The six appraisal factors are adequate for me to describe my contribution
Characteristic
Supervisory status
Supervisory status
Subgroup
Supervisor
Supervisor
Nonsupervisor
SOURCE: 2012 and 2016 AcqDemo surveys.
SA
5
21
15
AcqDemo Survey Data Quantitative Analysis 1 59
2012 Survey 2016 Survey
A
33
51
49
N
31
16
19
D
20
7
1 1
SD
1 1
5
5
SA
6
21
13
A N D SD
32 35 17 10
5 1 13 1 0 5
so 18 1 1 8
NOTES: The wording of each item was drawn from the 201 6 survey. In a few instances, the wording of the 2012 item varied slightly. The response frequencies are percentages and were weighted using the procedure described in this appendix. SA = a response of "strongly agree" or "very positive"; A = a response of "agree" or "positive"; N = a response of "neither agree nor disagree" or "neither positive nor negative"; 0 = a response of "disagree" or "negative"; SD = a response of "strongly disagree" or "very negative."

APPENDIX B
Qualitative Data Analysis
RAND's assessment was informed by qualitative analysis of four distinct data sources:
• site histories • Executive Council meeting minutes • write-in responses from the 2016 AcqDemo survey • interviews conducted by the RAND study team.
At the request of the AcqDemo Program Office, location-specific site historians prepared site histories. The site histories were intended to help the AcqDemo Program Office by describing events, policies, and procedures that could influence how AcqDemo was implemented in a specific organization. As such, we regarded them as a useful source of contextual information that might apply to several of the assessment criteria. We received 89 site histories from the AcqDemo Program Office: 34 from 2012, 30 from 2013, 10 from 2014, 13 from 2015, and two without a date. The organizations providing the site histories spanned the components. The histories were based on a standard template that included a place for the organization's site historian to enter high-level events, policies, and procedures and specific sections {environmental, mission, procedural, and other) in which more detail was provided. Overall, the data contained in the site histories were relatively thin: Sections were often left blank, and when descriptions were provided, they were relatively short.
We also used a second archival data source in our assessment, Executive Council meeting minutes, which proved to be a richer source of information. According to its charter (AcqDemo, 2013), the Executive Council was established:
to oversee the successful implementation and operation of the AcqDemo in order to provide the Acquisition Workforce with effective and responsive personnel interventions, and the Program Office and other evaluators with sufficient information which can assist in the determination of establishing the AcqDemo design as a permanent alternative personnel system.
Executive Council members included the AcqDemo program directors, deputy director, AcqDemo lead representatives from the military services and DoD agencies, and AcqDemo Program Office staff and contractors. The Executive Council met several times a year, although the frequency varied over the life of the demonstration project. The AcqDemo Program Office provided us with 30 sets of meeting minutes: nine from 2012, seven from 2013, seven from 2014, five from 2015, and two from 2016.
161

162 201 6 Assessment of the Civilian Acquisition Workforce Personnel Demonstration Project
The 2016 AcqDemo survey was a third source of qualitative data. In addition to responding to multiple-choice questions, survey respondents had several opportunities to write in freetext responses. We analyzed responses to two open-ended questions that both employees and supervisors could answer (survey items 55 and 75), one pertaining to perceived problems with the administration of AcqDemo and one asking for observations related to all of the multiplechoice questions they had completed up to that point. Supervisors were also provided with three additional write-in opportunities after three shorter sets of multiple-choice questions about AcqDemo's features and effects (survey items 86, 95, and 100). Across the five questions, there were 4,728 instances of some sort of manually entered, written response. Table B.l provides a breakdown of respondents for all five write-in opportunities. Overall, more than half of all survey respondents answered at least one of the five write-in questions. The highest response rate, 45 percent, was for the question about problems with AcqDemo's administration. Response rates for the other questions, especially the items presented only to those who indicated they were supervisors, were notably lower.
Given the large proportion of individuals who opted not to write comments, we used chi-squared tests and pairwise tests of significance to look for differences between respondents and nonrespondents. Our rationale was that this would help us better understand possible bias based on the demographics measured. As shown in Table B .2, there were many differences between those respondents who chose to write in comments and those who did not. Overall, there did not appear to be systematic differences cutting across multiple demographic attributes that were indicative of a specific write-in bias direction or other tendency. However, we do note that there is limited evidence in the academic literature of an overall negativity bias associated with write-in responses to employee surveys. Specifically, dissatisfied employees are more likely to provide responses, and their responses tend to be longer (Andrews, 2005; Borg
Table B.1 Breakdown of Responses to Open-Ended Survey Items
Survey Item
Briefly (fescribe any problems with the administration of AcqDemo at your location
Please enter any comments you have regarding topics in questions 17-72 above
Add any comments for questions 75-83 (supervisors only)
Please enter any comments you have regarding topics in questions 85-92 above (supervisors only)
Please enter any comments you have regarding topics in questions 94-97 above (supervisors only)
Answered at least one of the five questions above
SOURCE: 2016 AcqDemo survey.
Responses
2,256
1 ,328
402
287
307
2,546
NOTE: Responses include any entry not treated as system-missing.
Non responses Response Rate
2,761 45.0%
3,689 26.5%
1 ,220 24.8%
1 ,335 17.7%
1 ,315 1 8.9%
2,471 50.7%

Qualitative Data Analysis 163
Table B.2 Demographic Comparison of Respondents and Nonrespondents to the Open-Ended Survey Items
Open-Ended Survey Items Presented Open-Ended Survey Items Presented to the Full Sample Only to Supervisors
Statistical Statistical Demographic Category Response Rate Significance Response Rate Significance
Age * *
Younger than 30 38 6 4
30-39 45 20
40-49 45 4 24
50-59 49 3 28
60 or older 46 28
Gender
Male 46 26
Female 45 29
Race **
White 48 2 28 2, 3
Black 43 18
Asian 43 1 6
American Indian/Alaska 47 25 Native
Hawaiian/Pacific Islander so 14
Multi race 48 25
Hispanic/Latino
Yes 46 26
No 47 26
Education level ** *
High school 40 6 14
Some college 39 4, 5, 6 1 9 5
Associate's degree 43 6 12 5 , 6
Bachelor's degree 45 2, 6 27
Master's degree 49 2, 6 28 2, 3
Doctorate 61 All 32 3
Component **
Army 46 3, 4 27

164 2016 Assessment of the Civilian Acquisition Workforce Personnel Demonstration Project
Table B.2-Continued
Open-Ended Survey Items Presented Open-Ended Survey Items Presented to the Full Sample Only to Supervisors
Statistical Statistical Demographic Category Response Rate Significance Response Rate Significance
Air Force 44 3, 4 27
DoD agencies 51 1, 2 25
Marine Corps 52 1, 2 29
Navy 46 27
Career path ** **
NH-1 0 0
NH-2 39 3, 4 1 6 4
NH-3 45 2, 4 20 4
NH-4 50 2, 3, 6 30 2, 3, 6
NJ 46 17
NK 36 4 0 4
Top of pay band **
Yes 49 3 29
No 46 3 25
Not sure 37 1, 2 21
Number of AcqDemo ratings **
0 36 All 24
1-2 44 1, 4 24
3-5 48 25
6 or more 48 1, 2 29
DAWIA position ** * *
Yes 48 3 27 3
No 46 29 3
Not sure 41 18 1 , 2
Supervisor **
Yes 46 2 N/A
No 54 N/A
Bargaining unit * *
Yes 46 46 2

Table B.2-Continued
Demographic Category
No
Number of respondents
SOURCE: 2016 AcqDemo survey.
Qualitative Data Analysis 165
Open-Ended Survey Items Presented Open-Ended Survey Items Presented to the Full Sample Only to Supervisors
Response Rate
54
2,331
Statistical Significance Response Rate
54
571
Statistical Significance
NOTES: This table relates to the open-ended survey items presented to all respondents (survey items 55 and 75) and to the open-ended items presented to supervisors only (survey items 86, 95, and 1 00). It compares characteristics of respondents and nonrespondents. Individuals who did not provide their supervisory status in the survey were omitted from this analysis. The statistical significance columns present the results of the chisquared analysis and the pairwise analysis. The numbers listed in the statistical significance columns indicate the categories for which the response rates are statistically different, at the 5-percent level, from the response rate for the category in that row according to pairwise analysis. * = significant difference on chi-squared test at the 5-percent level. ** = statistical significance at the 1-percent level.
and Zuell, 2012; Poncheri et al., 2008). In addition, Poncheri et al. (2008) and Bord and Zuell (2012) both found that the tone of open-ended comments in such surveys tends to be disproportionately negative.
Our final source of qualitative data was interview data. Specifically, we conducted 22 interviews with three types of AcqDemo SMEs, broken down as follows:
• seven interviews with enterprise-level AcqDemo representatives, including the AcqDemo program manager and component representatives from the Army, Air Force, Marine Corps, Navy, MDA, and OUSD for AT&L; based on Executive Council composition and a review of council meeting minutes, the only missing organization was the Defense Acquisition University (DAU)
• six interviews with enterprise-level personnel tasked with AcqDemo-related training, including the training leads from the AcqDemo program office and representatives from the Army, Marine Corps, Navy, and OUSD for AT&L; missing organizations included the Air Force, DAU, and MDA (which indicated that its new employee training is all computer-based)
• nine interviews with pay pool managers: four from the Army, two from the Air Force, one from the Navy, one from the Marine Corps, and one from MDA. The interviewees represented pay pools that had been in existence for at least one appraisal cycle, and all of them had experience as pay pool managers for at least one appraisal cycle. In FY 2014, there were 84 pay pools, and nine pay pools were added in FY 2015. Thus, we interviewed roughly 10 percent of pay pool managers.
In the first two cases, the SMEs represent a large proportion of the population. In the third case, because of DoD licensing requirements, we were limited to nine interviews per personnel type. Obtaining the necessary approvals for a larger set of interviews was beyond the scope of this project due to the long review timeline, which typically exceeds six months.

166 2016 Assessment of the Civilian Acquisition Workforce Personnel Demonstration Project
However, we are confident that nine pay pool interviews were sufficient to identify themes. As noted earlier, the individuals were all experienced with pay pool management, and they were all senior-level employees (e.g., SES or political appointees). This suggests that they had a high level of "cultural competence" or, in other words, awareness of and familiarity with their organization's norms and operating conditions. Research indicates that when cultural competence is high, nine informants (or interviewees) provide a high level of confidence in the cultural accuracy of the results (Romney, Weller, and Batchelder, 1986).
Enterprise-level AcqDemo representatives and training professionals were identified by the AcqDemo Program Office in response to our sampling guidelines, 1 and the military components and DoD agencies nominated pay pool managers in accordance with our sampling parameters. For pay pool managers, we opted to use purposive sampling rather than select interviewees randomly. This enabled us to focus on pay pools that had gone through at least one appraisal cycle and individuals who had served as pay pool managers for at least one cycle. We also sought-and achieved-variance in the size of the pay pools represented in the interviews.
Interviews were conducted over the telephone by two or three members of the RAND study team, with one team member leading the interview using a semi-structured interview protocol and the others taking detailed notes. A semi-structured interview protocol is one that sets forth opening questions and clear instructions but maintains discretion to delve into potentially fruitful lines of inquiry as they surface. Semi-structured interviews allow the conversation between the researcher and the participant to flow as necessary to explore issues thoroughly and permit the researcher to limit time spent on questions already answered in earlier responses or those less relevant, given the nature of the dialogue. This approach is ideal in situations where it would be difficult to interview the same person more than once, which would be necessary to follow leads that emerged during a structured interview. The semistructured interview is the type of interview most frequently written about and used in professional contexts. Semi-structured interviews work well in studies that involve people accustomed to efficient use of their time, such as DoD acquisition professionals, who likely would have neither the time nor the inclination to participate in a series of purely free-Bowing, unstructured interviews. 2
The three protocols used as the starting basis for our SME interviews are provided at the end of this appendix in Tables B.3, B.4, and B.S. In general, interview topics were aligned with the assessment criteria, and the questions covered AcqDemo's suitability for different types of personnel, its training and guidance, its flexibilities and barriers to their use, its efforts to ensure fairness and transparency, its protections for diversity, its provisions for employee involvement, its impact on promotion and retention, its effects on organizations' missions, perceptions about its overall performance, and suggestions for improvement. The topics were informed by our review of AcqDemo program documentation and our analysis of AcqDemo archival data.
Members of our study team coded all four data sources. Codes are essentially tags used to organize qualitative data by topic and other characteristics. The interviews, Executive Council minutes, and site histories were coded using QSR NVivo I 0, a software package that enables its users to review, categorize, and analyze qualitative data, such as text, visual images, and audio
1 For example, we asked to speak with "component personnel responsible for AcqDemo initial and/or refresher training."
2 For more information regarding the use of semi-structured interviews, in particular for expert or elite interviewing, see Aberbach and Rockman (2002) and DiCicco-Bloom and Crabtree (2006).

Qualitative Data Analysis 167
recordings. NVivo 10 permits analysts to assign codes to passages of text and later retrieve passages of similarly coded text within and across documents. NVivo 10 is also capable of simple word-based searches and more-sophisticated text searches, such as Boolean searches involving combinations of codes. The AcqDemo survey write-in data differed significantly in structure: Instead of long passages of text as part of a single, longer narrative, these data consisted of many very short passages written by different respondents. Accordingly, we opted to code this data source using Excel.
In all cases, the study team worked together to develop coding "trees,,
to facilitate the tagging of relevant text. Coding "turns free-flowing text into a set of nominal variables" (Bernard, 2002, p. 463), and a coding tree is a set of labels for assigning units of meaning to information compiled during a study. Codes are used to retrieve and organize qualitative data by topic and other characteristics (Miles and Huberman, 1994). For this study, coding was largely a priori, meaning that codes were based on the interview questions and assessment criteria (e.g., such codes as "hiring flexibilities, "training and guidance," and "fairness/transparency"), but we also used an inductive approach, in which we identified patterns in the data that appeared to be important to the assessment (e.g., observations about control points).
It is important to note that the purpose of coding was not to count responses and generate population parameter estimates; this would be a flawed approach for numerous reasons. For example, survey respondents who opted to provide write-in comments differed significantly from nonrespondents in terms of both demographic attributes (e.g., race or ethnicity) and situational characteristics {e.g., organizational membership, career path). There is no method to adjust for those differences. In particular, we could not weight the data as we did for the quantitative survey responses. Moreover, given the numerous and diverse ways in which respondents and nonrespondents differed, we could not accurately assess the nature and extent of their bias beyond the general bias toward negativity present in write-in comments on employee surveys (Andrews, 2005; Borg and Zuell, 2012; Poncheri et al., 2008). We observed this negativity bias in our coding of AcqDemo survey write-ins: Regardless of the topic, responses with a negative tone were far more prevalent than those expressing positive sentiments. In addition, the write-in questions were very broad, rather than narrowly focused on a specific issue; in one case, respondents were instructed to write any comments related to the preceding 56 questions. With respect to the interviews, the semi-structured approach we employed means that few questions were presented in exactly the same way to all interviewees and many unique probes were used to delve more deeply into the responses provided. Furthermore, pay pool managers were not randomly selected. Thus, in this context, qualitative data analysis was used to demonstrate the range of views within AcqDemo, to convey the language used by AcqDemo's members, and to identify salient themes. Coarse estimates of prevalence provide insights about salience, but salience is also a function of the richness of the data and its ubiquity across different contexts. For example, when examining AcqDemo survey responses, we viewed themes that cut across organizations and were present in both employee and supervisory remarks as high in ubiquity.
Accordingly, after the coding was complete, we generated coding reports that enabled us to review all the passages tagged with a specific code together. We reviewed coding reports not only within a single data source but also across data sources. For example, for the criterion pertaining to the adequacy of training and guidance, we analyzed the coding results for "training and guidance" from the site histories, AcqDemo survey write-in responses, interviews, and Executive Council minutes. The purpose of these reviews was to identify promi-

168 2016 Assessment of the Civilian Acquisition Workforce Personnel Demonstration Project
nent themes based on prevalence, data richness, and ubiquity. The measure of prevalence was a coarse one; as is common in qualitative research, we focused on repetition, looking for topics that occur and reoccur in the data (Ryan and Bernard, 2003). We also noted the presence of disparate views to distinguish topics or phenomena for which there was a broad range of views from topics or phenomena for which the range of views was relatively narrow. Many of the themes we identified were also supported by previous studies, including the 2012 AcqDemo assessment {Werber et al., 2012) and literature on procedural and distributive justice, thereby increasing our confidence in the validity of the results. Moreover, in some cases, results emerging from the qualitative data were supported by quantitative data results. Following Bernard {2002), we identified "exemplar quotes" {p. 471)-verbatim passages from the qualitative data sources-to help readers of the assessment to understand themes quickly and without jargon. Such exemplar quotes are included throughout the report, and we provide the respondent's employee type and organization for each to help convey theme ubiquity.
Table B.3 Interview Protocol for Enterprise-Level AcqDemo Representatives
Number Question
1 . To start, please tell us about your current responsibilities, particularly those related to AcqDemo, and how long you've served in your current role.
2. What is your organization's mission?
a. Probe: What is your organization's acquisition-related mission?
b. Probe: How do the Better Buying Power (BBP) practices relate to this mission, if at all? [If not familiar with BBP, explain: "Better Buying Power is the implementation of best practices to strengthen DoD's buying power, improve industry productivity, and provide affordable, value-added military capability to the warfighter. It encompasses a set of fundamental acquisition principles to achieve greater efficiencies through affordability, cost control, elimination of unproductive processes and bureaucracy, and promotion of competition. It also incentivizes productivity and innovation."]
3. What is your understanding of why AcqDemo was developed and implemented? What was it intended to accomplish?
a. Probe: How does AcqDemo support or complement the Better Buying Power practices?
4. For what kinds of employees was AcqDemo intended?
a. Prompt: We'd like to understand the types of DoD civilian employees for which AcqDemo was developed.
b. Probe: Was AcqDemo intended for unionized employees or members of bargaining units?
5. For what kinds of employees is AcqDemo especially well suited, and why?
a. Prompt: We understand that the features and complexities of AcqDemo may be more appropriate for certain positions or certain types of employees and would l ike to learn more about that.
b. Probe: On the flip side, for what kinds of employees is AcqDemo less appropriate or even problematic? Why?
6. A review of AcqDemo's history shows that unions and bargaining units occasionally have had concerns about joining AcqDemo and at least one union opted to exit AcqDemo. How would you characterize union concerns about AcqDemo?
a. Probe: What characteristics of AcqDemo make it more challenging for union members?

Qualitative Data Analysis 169
Table 8.3-Continued
Number Question
b. Probe: What efforts have been undertaken to allay union concerns?
7. My next set of questions is about some of AcqDemo's main features: its hiring and appointment flexibilities, its performance appraisal system, and its performance feedback processes. First, what do you see as AcqDemo's key features related to hiring and appointments?
a. Probe: How have these features changed since your organization joined AcqDemo, if at all?
b. Probe: How adequate is the guidance related to these features? Why do you say that?
8. How has your organization used AcqDemo's hiring and appointment flexibilities?
a. Probe: How does your organization track usage of these flexibilities, if at all?
b. Probe: How helpful have these flexibilities been?
c. Probe: What barriers, if any, make it hard to use them?
9. What do you see as AcqDemo's key features related to performance appraisals?
a. Probe: How have these features changed since your organization joined AcqDemo, if at all?
b. Probe: How adequate is the guidance related to these features? Why do you say that?
10. How has your organization used AcqDemo's performance appraisal-related flexibilities?
a. Probe: How does your organization track usage of these flexibilities, if at all?
b. Probe: How helpful have these flexibilities been?
c. Probe: What barriers, if any, make it hard to use them?
1 1 . I also have some questions related to the pay pool process. First, how are pay pool managers selected?
12. What are the specific duties of a pay pool manager?
13. What are the characteristics of a well-executed or well-run pay pool process?
a. Probe: What makes it difficult for pay pools to function in that way?
14. How does the process vary across pay pools, if at all?
15. What aspects of the pay pool process help to ensure fairness and transparency?
16. How are pay pool decisions reviewed or audited?
17. What opportunities do members of the pay pool have to provide feedback about the process?
18. Thank you for that information. Let's shift gears to discuss a different type of feedback. How does your organization ensure there are processes in place-and in use-related to ongoing performance feedback? We're interested in processes related to both interim and final feedback as part of the pay cycle.
a. Probe: How high is the level of adherence to those processes? How do you know?
19. How does your organization ensure there are timetables in place-and in use-for performance appraisals?
a. Probe: How high is the level of adherence to those timetables? How do you know?
20. How does your organization ensure that AcqDemo's features are applied in a way that is fair and transparent for all employees in the project?
a. Prompt: We'd like to understand the processes, communication approaches, and other steps that your organization takes to ensure that your personnel perceive AcqDemo as a fair and transparent system.

170 2016 Assessment of the Civilian Acquisition Workforce Personnel Demonstration Project
Table B.3-Continued
Number Question
b. Probe: What concerns, if any, have you heard regarding AcqDemo's fairness and/or its transparency?
21 . What process or processes does your organization have in place to provide employees with a voice in how AcqOemo is implemented and potentially improved within your organization?
a. Probe: Do you believe these processes are sufficient? Why do you say that?
b. Probe: What additional processes or actions are needed, if any, to encourage employee involvement in developing and implementing AcqDemo?
22. What protections does your organization have in place for diversity in promotion and retention?
a. Probe: How adequate have those protections been, and why do you say that?
b. Probe: What additional protections or other measures are needed, if any, to ensure equitable treatment of employees regardless of their demographic d iversity?
23. Speaking of promotion and retention, in your professional opinion, how has AcqDemo affected these career outcomes?
a. Probe: Which of AcqDemo's aspects or features have had the greatest impact in this regard? Which have been less useful?
b. Probe: How do you or your organization assess AcqDemo's impact in this regard? In other words, what informed your viewpoint?
24. Earlier you mentioned your organization's mission was [RECAP QUESTION 2). How is AcqDemo intended to help your organization achieve that mission?
a. Probe: How well is it doing in that regard? Why do you say that?
25. [If mission differs from this, ask:] How does AcqDemo help your organization to equip the warfighter as efficiently and effectively as possible?
26. Thank you for your time today. I have just a few more questions before we wrap up. What do you see as AcqDemo's greatest advantages or best features? Why do you say that?
27. We talked a little bit already about barriers to using some of AcqDemo's flexibilities. What other barriers or challenges related to AcqDemo has your organization encountered?
28. What suggestions for improving AcqDemo would you like DoD leadership or Congress to consider?
29. More generally, what would you tell DoD leadership or Congress about how well AcqDemo is working?

Qua litative Data Analysis 171
Table B.4 Interview Protocol for Enterprise-Level Personnel Tasked with AcqDemo-Related Training
Number Question
1 . [For sustainment training:) To start, please tell us about your current responsibilities, particularly those related to AcqDemo, and how long you've served in your current role. [For AcqDemo initial training:) To start, please tell us about your role in the AcqDemo program office, and how long you've served in your current role.
2. Please give us an overview of the AcqDemo training your organization provides. We'd like to know details, such as who receives training, how often it's provided, and what form it takes (for example, classroom instruction or Internet-based training).
a. Probe: Who receives the training-employees, supervisors, pay pool managers, others?
b. Probe: How often is training provided-what intervals or events? How does this vary by personnel type?
c. Probe: What form does the training take? How does this vary either by personnel type or interval?
3. Who provides the training?
4. How are these individuals selected?
5. What training do they receive? In other words, who trains the trainers, and how are they supported?
6. How are the trainers evaluated?
7. How does AcqDemo training vary across sites or organizations, if at all?
8. In what situations is AcqDemo training tailored to suit different audiences?
a. Probe: How is the training modified? Please provide an example or two.
9. What aspects of AcqDemo require the most training time or investment of other resources?
a. Probe: How do you know this?
10. How has AcqDemo training evolved over time?
a. Probe: What notable changes to AcqDemo training have been made, particularly in recent years when a large group of personnel entered AcqDemo?
1 1 . How do you determine what modifications to AcqDemo training are needed?
a. Probe: What are some examples of changes to AcqDemo training and why were they made?
12. What role does feedback on training, either formal or informal, play in this process?
a. Prompt: For example, what is the formal feedback process after training is provided?
13. More generally, how do you determine whether training is adequate or effective?
a. Probe: How do you ensure personnel understand the training and retain it over time?
14. What changes are in the works for AcqDemo training, if any? For example, are new materials being developed?
a. [If yes, probe:] Why are these changes being made?
15. [For sustainment training:] We have just a few more questions for you. Al l in al l , how well has training for AcqDemo gone since your organization entered AcqD�mo?
16. Are certain types of training more difficult than others? If yes, please tell me about them.
a. Prompt: For example, for different types of personnel or different aspects of AcqDemo?
17. What aspects of AcqDemo might benefit from additional training?

172 2016 Assessment of the Civilian Acquisition Workforce Personnel Demonstration Project
Table B.4-Continued
Number Question
a. Prompt: This might include training on specific topics or for specific groups within the AcqDemo workforce.
18. What [other] ways can AcqDemo training be improved?
19. In closing, is there anything you would like to add about AcqDemo training? Anything we didn't ask about but should have?
20. More generally, what would you tell DoD leadership or Congress about how well AcqOemo is working?
21. What suggestions for improving AcqDemo would you like DoD leadership or Congress to consider?
Table B.S Interview Protocol for Pay Pool Managers
Number Question
1 . To start, please tell us about your current responsibilities, particularly those related to AcqDemo, and how long you've served in your current role.
2. What are your specific duties as pay pool manager?
a. Probe: How does the pay pool manager fit into the overall pay pool process? We'd like to understand better how the process unfolds in your organization.
3. How much time do you spend on pay pool management? An estimate is fine. We're interested in both how much time you spend on these responsibilities on average as well as how much time you spend during the most intense part of the process.
4. How were you selected to serve as a pay pool manager?
5. How long do pay pool managers typically serve in that role? How long do you expect to be a pay pool manager?
6. What kind of training or preparation did you receive to perform your pay pool-related responsibilities?
7. How adequate was the training you received? Why do you think that?
8. In what areas do you believe additional training for pay pool managers would be useful?
9. In your opinion, what are the characteristics of a well-run pay pool panel review process?
10. What aspects of the pay pool process are designed to ensure fairness?
a. Probe: How well are they doing in that regard?
1 1 . What aspects of the pay pool process are intended to make the process transparent?
a. Probe: How well are they doing in that regard?
12. What challenges have you and others encountered in establishing and running a pay pool?
13. Is the pay pool process {or AcqDemo more generally) more or less suitable for certain types of employees? If yes, please tell me which types and why you think that.
a. Prompt: For example, we have heard that pay caps may affect certain types of employees and that certain types of employees, such as those in support positio ns or geographically remote, are harder to evaluate.
14. In closing, is there anything you would like to add about the AcqDemo pay pool process?
15. More general ly, what would you tell DoD leadership or Congress about how well AcqDemo is working?
16. What suggestions for improving AcqDemo would you like DoD leadership or Congress to consider?

APPENDIX C
Administrative Data Analysis
The administrative data employed in this study were collected from two sources. DMDC provided data on the DoD civilian workforce at large. These data covered both AcqDemo participants and GS employees and captured an array of characteristics for each employee, including demographic information, component, occupation, annual compensation, promotions, and separations. The AcqDemo Program Office provided more-detailed data on the performance ratings and compensation actions of AcqDemo participants.
The administrative data were used primarily to explore the following four questions:
• What is the composition of the AcqDemo workforce? • What is the effect of AcqDemo on retention? • What is the effect of AcqDemo on salaries and salary growth? • What is the effect of AcqDemo on promotion?
In isolated cases, we also referred to the administrative data to inform other questions addressed by the study. These instances are noted in the main text.
This appendix provides the details of the administrative data analysis. We begin with a description of the data collected from DMDC and the AcqDemo Program Office and explain how the data were pared down to construct a data set suitable for the analyses at hand. We then discuss potential sources of selection bias and explain how we corrected for these selection issues in constructing a control group of GS employees to which the AcqDemo population was compared. Finally, we describe the methods and models used to estimate AcqDemo's effects on retention, compensation, and promotion.
Data Description
A longitudinal data set of DoD civilian personnel was constructed by drawing data from three DMDC data files: the civilian personnel inventory file, the civilian personnel transaction file, and the DAWIA personnel file. The civilian personnel inventory file provided quarterly snapshots of each member of the DoD civilian workforce. These snapshots contained an array of personnel characteristics, including demographic information, geographic location, component, occupation, supervisory status, years of federal service, pay plan, and annual compensation. The civilian personnel transaction file provided a complete log of personnel actions, as well as the associated dates. These actions included appointments, reappointments, promo-
173

1 74 201 6 Assessment of the Civilian Acquisition Workforce Personnel Demonstration Project
tions, and separations. The DAWIA personnel file was used to determine which employees were in the AW
The constructed data set covered the period beginning October l, 2010, and ending September 30, 2015, and included every civilian employee in DoD. We pared down the data set in three ways. First, we excluded any employee who was not on full-time status in every quarter during which he or she appeared in the data set. Second, we excluded any individual who was not a permanent employee in every quarter during which he or she appeared in the data set. Third, we excluded any employee whose annualized basic pay fell below $15,080 in any quarter during which he or she appeared in the data set. The third exclusion criterion amounts to a requirement that the reported annualized basic pay for permanent, full-time employees comply with federal minimum wage laws.
We supplemented this data set with individual-level data provided by the AcqDemo Program Office. These data consisted of more-detailed information on the performance ratings and compensation actions of AcqDemo participants. Analogous data were not available for GS employees. The AcqDemo Program Office provided annual snapshots taken on September 30 of each year, beginning in 2011 and ending in 2015. Individual identifiers were included in these snapshots, and as a consequence, we were able to track each AcqDemo participant over tii:ne within the data provided by the AcqDemo Program Office and merge these data with the data set constructed from the DMDC data files.
For most of the analyses conducted using administrative data, our approach was to track a cohort of AcqDemo participants and GS employees over the period beginning on September 30, 201 1, and ending on September 30, 2015. That is, we restricted the constructed data set to individuals who were present on September 30, 2011 , and then tracked their characteristics and outcomes over the four years that followed. Outcomes relating to retention, compensation, and promotion were of particular interest.
We selected the cohort associated with September 30, 201 1 , for two reasons. First, the workforce managed under the AcqDemo project nearly quintupled in FY 201 1, growing from 3,069 employees at the end of FY 2010 to 15,250 employees at the end of FY 201 1 . Selecting an earlier cohort would have excluded these accessions from the analyses. Second, the AcqDemo workforce was relatively stable over the four years that elapsed from September 30, 2011 , to September 30, 2015. During this period, the AcqDemo workforce grew to 16,258 employees, an increase of 6.6 percent. The numbers of accessions and separations in each FY were relatively small, averaging 1,745 and 1,493, respectively. Figure C.1 provides the counts for each FY.
The tracking period ended on September 30, 2015, because that was the most recent date for which administrative data were available at the time the analyses were conducted. However, it is worth noting that extending the tracking period for another FY would have presented a meaningful challenge due to the large number of employees scheduled to join AcqDemo in FY 2016. As indicated in Table 1 .2, the AcqDemo workforce is expected to grow to 33,955 employees by September 30, 2016, more than doubling in size over the course of the FY. The influx of employees from the GS pay plan to the AcqDemo pay plans would have compromised the control group, which we discuss in greater detail in the next section.

Administrative Data Analysis 175
Figure C.1 Accessions to and Separations from the AcqDemo Workforce, September 30, 2011, to September 30, 2015
1 8,000 r-------------;:::=========:;-------------, I D Separation D Accession I
� 14,000 � Q. ·;:; 'f 12,000 � Q. � 1 0,000 ·---Ir."• Qj 0 C' v �
.... 0 � 6,000
..c E ::i
z 4,000
2,000
5.2 1 5,77 S.857 5,723 6,258
0 ._�...._� ...... ��� ....... �---����"--�..__���-'-�-'-���--'�--"--�� 2011 2012 2013 2014 201 5
SOURCE: DMDC civilian personnel inventory files. RAND RRl7&3·C I
Control Group Construction
Fiscal Year
AcqDemo participants differ from GS employees in a number of ways, as discussed in Chapter Three. By design, AcqDemo participants are more likely to be members of the AW. They earn higher pay on average but are also more likely to have earned graduate degrees and to occupy supervisory positions. AcqOemo participants are more likely to be on retained pay and less likely to be in a bargaining unit.
The principal challenge of the administrative data analysis was determining the extent to which differences between the AcqOemo and GS populations were caused by AcqDemo itself. Because AcqDemo participants were not randomly selected from the population of GS employees, they differed from GS employees in meaningful ways before joining the demonstration project. We sought to understand the process by which individuals were selected for participation in AcqDemo to identify any sources of nonrandom selection and correct for them in constructing a valid control group of GS employees.
The most salient feature of the process was that participation occurred at the organization level, not at the individual level. That is, organizations, not individuals, were selected to join AcqDemo, and when an organization joined, every employee within that organization became an AcqDemo participant. Organizations were considered eligible to participate in AcqDemo if the following three requirements were met:
1 . At least one-third of the organization's workforce consisted of members of the AW. 2. At least two-thirds of the organization's workforce consisted of members of the AW and
supporting personnel assigned to work directly with the AW.

176 2016 Assessment of the Civilian Acquisition Workforce Personnel Demonstration Project
3. If the organization had bargaining unit employees, a written agreement between the organization and any union representing those employees had to be in place before the organization joined AcqDemo.
Eligible organizations were listed in the AcqDemo FRNs for January 8, 1999; July l, 2002; and March 31, 2015. Eligible organizations wishing to join AcqDemo were then required to request approval to participate in the demonstration project {AcqDemo, undated). The AcqDemo Program Office reported that every eligible organization that applied was admitted as soon as the Program Office was able to train and absorb the organization's employees.
The three requirements listed earlier suggest that organizations deemed eligible to participate in AcqDemo are systematically different from ineligible organizations. In order to account for this, we restricted our control group of GS employees to those who were in ADEOs on September 30, 201 1 . The process for identifying these GS employees began by compiling a list of ADEOs, which we drew from the FRNs. We then searched for the six-digit unit identification codes (UICs) associated with these organizations. Our primary reference was a UIC catalog that was provided to RAND by Human Capital Initiatives, OUSD for AT&L, in 2013. The catalog covered all four military services, as well as the DoD agencies. Any uncertainty in identifying the appropriate UICs was resolved by being more inclusive-that is, by assuming the UIC was associated with an ADEO. In some cases, the organizations listed in the 1999 and 2002 FRNs were defunct by 2013. In those cases, we used web searches to trace the path from the defunct organization to its 2013 equivalent (if it existed) and then identified the UICs associated with the 2013 equivalent. The final list of UICs associated with ADEOs contained 1 ,546 distinct codes. Any GS employee associated with one of these UICs on September 30, 2011 was considered AcqDemo-eligible and retained in the data set. All other GS employees were excluded.
· Restricting the population of GS employees in this fashion brought the control group
more closely in line with the population of AcqDemo participants with respect to a number of characteristics, as shown in Chapter Three, Table 3.2. In particular, the restriction reduced disparities in education level, component, occupational group, career level, and AW membership. However, a number of sizable differences remained, most notably with respect to gender, supervisory status, bargaining unit membership, and basic pay. These remaining disparities suggest that there may be systematic differences between organizations that applied to and joined AcqDemo prior to September 30, 201 1, and ADEOs that did not join the project before September 30, 201 1 . To address this issue, we estimated propensity scores using generalized boosted modeling (GBM) and used the scores to construct weights, which were applied to the September 30, 201 1, cohort of GS employees in ADEOs (McCaffrey, Ridgeway, and Morral, 2004; Rosenbaum and Rubin, 1983). The weights brought the control group of GS employees in ADEOs more closely in line with the treatment group of AcqDemo participants along an array of preexisting or immutable characteristics. The balance between the treatment group of AcqDemo employees and the weighted control group of GS employees in ADEOs is shown in Table C.l; the unweighted control group of GS employees in ADEOs is also shown for reference.
The propensity score weights were constructed to produce estimates of the average treatment effect on the treated. That is, the weighting technique permits us to estimate AcqDemo's effect on the 201 1 cohort of AcqDemo participants. The effects we estimate in this study pre-

Administrative Data Analysis 177
Table C.1 Balance Between AcqDemo and AcqDemo-Eligible Organizations in the GS System After Propensity Score Weighting, September 30, 2011, Cohorts
Mean, Mean, Weighted Mean, Unweighted Characteristic AcqDemo Control Group P-Value Control Group
Age 47.823 47.685 0.407 47.121
Male 0.626 0.629 0.757 0.579
Race 0.009
White 0.755 0.735 0.712
Black 0.144 0.148 0.170
Asian 0.044 0.045 0.047
Other 0.057 0.072 0.071
Hispanic 0.049 0.067 0.000 0.058
Handicap 0.256
Handicap, not targeted 0.057 0.059 0.069
Handicap, targeted 0.002 0.003 0.005
Education level 0.145
No college 0.164 0.1 53 0.247
Some college 0.1 17 0.125 0.202
Bachelor's degree 0.350 0.360 0.320
Graduate degree 0.366 0.361 0.230
Veteran 0.379 0.352 0.001 0.392
Component 0.000
Army 0.498 0.552 0.585
Air Force 0.188 0.217 0.1 53
DoD agencies 0.166 0.190 0.238
Marine Corps 0.135 0.016 0.000
Navy 0.014 0.026 0.024
Occupational group 0.000
Engineers 0.2 1 1 0.229 0.127
Logistics management 0.207 0.253 0.229
Central management 0.178 0.174 0.154
General office operations 0.131 0.031 0.007
Data systems management 0.053 0.042 0.050
Mathematicians 0.041 0.054 0.007
Financial management 0.028 0.029 0.049

178 2016 Assessment of the Civilian Acquisition Workforce Personnel Demonstration Project
Table C.1-Continued
Mean, Mean, Weighted Mean, Unweighted Characteristic AcqDemo Control Group P-Value Control Group
Financial clerks · 0.022 0.003 0.003
Logistics technicians 0.019 0.027 0.059
Secretarial 0.017 0.027 0.013
Other 0.095 0.130 0.302
Career level 0.000
Entry level 0.137 0.1 14 0.1 88
Mid level 0.469 0.51 5 0.712
Senior level 0.393 0.372 0.099
Years of federal service 15.653 16.399 0.000 1 5.712
New hire 0.059 0.065 0.092 0.065
Eligible to retire 0.360 0.386 0.004 0.370
Acquisition workforce 0.744 0.699 0.000 0.360
Supervisor 0.218 0.233 0.039 0.124
Bargaining unit 0.1 12 0.1 56 0.000 0.617
In the United States 0.993 0.987 0.0 00 0.972
In the D.C. metropolitan area 0.279 0.188 0.000 0.069
Annualized basic pay in FY 2011 $86,614.68 $83,364.58 0.000 $64,893.61
On retained pay in FY 201 1 0.005 0.015 0.000 0.066
SOURCE: DMDC civilian personnel inventory files; DAWIA personnel files.
NOTES: The data presented include only permanent, full-time employees whose compensation was at least $1 5,080, the salary equivalent of working a full year at federal minimum wage. The dollar figures listed are in 2015 dollars.
diet AcqDemo's effect on other groups of employees only insofar as they resemble the employees in the 201 1 cohort.
After taking the measures enumerated in this appendix thus far, we were left with a treatment group that consisted of 14, 777 AcqDemo participants and a weighted control group that consisted of 136,121 GS employees in ADEOs.
Dilution of Estimated Effects
As explained earlier in this appendix, most of the administrative data analyses involved tracking the 201 1 cohorts (treatment and weighted control) over the four-year period beginning on September 30, 201 1 , and ending on September 30, 2015. During this time, 21 percent of the 2011 AcqDemo cohort separated from the DoD civilian workforce entirely, and another 8 percent left AcqDemo and joined another pay plan within the DoD civilian workforce. Similarly,

Administrative Data Analysis 179
22 percent of the weighted 201 1 cohort of GS employees in ADEOs separated from the DoD civilian workforce entirely, and another 10 percent joined AcqDemo. Table C.2 provides a more-detailed accounting of such movements.
Because of these movements, the effects we estimated are slightly diluted. Essentially, 8 percent of the individuals in the AcqOemo cohort were not fully "treated" before the observation period ended or they separated from the DoD civilian workforce, whichever came first. This diluted AcqDemo's effect on the treatment group as a whole. Similarly, 10 percent of the weighted control group received "partial treatment" before the observation period ended or
Table C.2 Movement Between AcqDemo and AcqDemo-Eligible Organizations in the GS System, S�ptember 30, 2011, Cohorts
September 30 of
2011 2012 2013 2014 2015
AcqDemo Cohort
ln AcqDemo Count 14,777 13,523 12,479 1 1 ,406 10,471
Percentage of AcqDemo 100.0 91.5 84.4 77.2 70.9 cohort
In DoD but not Count 0 435 739 989 1,199 in AcqDemo
Percentage of AcqDemo 0.0 2.9 5.0 6.7 8.1 cohort
Separated from Count 0 819 1,559 2,382 3,107 DoD
Percentage of AcqDemo 0.0 5.5 1 0.6 1 6.1 21 .0 cohort
Control Group
ln AcqDemo Count 0 760 1 ,199 1,969 2,717
Percentage of control group 0.0 0.6 0.9 1 .4 2.0
Weighted percentage of 0.0 1 .9 5.3 9.0 9.9 control group
In DoD but not Count 136,121 125,916 117,362 1 08,637 1 01 ,105 in AcqDemo
Percentage of AcqDemo 1 00.0 92.5 86.2 79.8 74.3 cohort
Weighted percentage of 100.0 92.1 83.4 74.1 68.3 control group
Separated from Count 0 9,445 17,560 25,515 32,299 DoD
Percentage of AcqDemo 0.0 6.9 12.9 18.7 23.7 cohort
Weighted percentage of 0.0 6.0 1 1 .3 1 6.9 21 .9 control group
SOURCE: DMDC civilian personnel inventory files; DAWIA personnel files.
NOTE: The data presented include only permanent, full-time employees whose compensation was at least $15,080, the salary equ ivalent of working a full year at federal minimum wage.

180 2016 Assessment of the Civilian Acquisition Workforce Personnel Demonstration Project
they separated from the DoD civilian workforce. This partial treatment was a consequence of the time they spent in AcqDemo during the observation period. It, too, diluted the estimated effect of AcqDemo on the treatment group.
The alternative would have been to exclude the 8 percent of the AcqDemo cohort that was not fully treated and the 10 percent of the weighted control group that received partial treatment from the data set entirely. We elected not to take this approach because of the concern that the individuals excluded were systematically different from the remaining individuals . with respect to one or more career outcomes. If this were the case, restricting the data set by excluding these individuals might bias our estimates of AcqDemo' s effect on these outcomes. So, instead, we elected to tolerate the diluted effects with the understanding that we should interpret our estimates as conservative.
Statistical Models and Results
As noted earlier in this appendix, the administrative data were used primarily to assess AcqDemo's effect on the career outcomes of its participants. The analysis focused on five outcomes in particular: retention, starting salaries, salaries overall, salary growth, and promotion. The overarching analytical approach was to leverage the treatment and weighted control groups to estimate differences in the five outcomes across the two groups. Regression models were fitted to predict each of the five career outcomes. We controlled for the remaining imbalances shown in Table C.1 by including the full set of characteristics used to construct the weights as covariates in the regression models.
Ideally, we would have adopted a difference-in-difference approach to estimating the causal effect of AcqDemo participation on each of the five career outcomes (Card and Krueger, 1994). This approach would have accounted for differences between the treatment and control groups that were not captured by the observable characteristics listed in Table C.1 but may have influenced the career outcomes of interest. The validity of the difference-in-difference approach, however, rests on the parallel trends assumption: The outcome in the treatment and control groups would have followed the same time trend in the absence of treatment. Accordingly, common practice in applying a difference-in-difference analysis includes verifying that the parallel trends assumption held for the pretreatment period. For the analysis in this assessment, verifying the parallel trends assumption was stymied by the large influx of employees into AcqDemo from NSPS, a personnel management system that differed meaningfully from the GS system. More than 80 percent of the treatment group transferred into AcqDemo from NSPS during the nine months that preceded the September 30, 201 1 , baseline. Consequently, it was not possible to observe the 201 1 AcqDemo cohort in an untreated (GS or GS-like) state.
So, instead, we adopted a more straightforward approach to estimating AcqDemo's effect on the various career outcomes with the understanding that the estimates may be subject to omitted variable bias if the characteristics listed in Table C.1 do not adequately capture differences between the treatment and control groups. The specifications of the regression models used are detailed in the remainder of this appendix. Each model includes an AcqDemo indicator in addition to the full set of characteristics used to construct the weights for the control group. We look to both the magnitude and statistical significance of the estimated coefficient on the AcqDemo indicator as a measure of AcqDemo's effect on the career outcome in question. Due to the possibility of omitted variable bias, we cannot assert that the estimated effects

Administrative Data Analysis 1 81
are causal. Accordingly, we interpret the coefficient on the AcqDemo indicator as the estimated difference in career outcome between AcqDemo participants and GS employees, after controlling for an array of observable factors.
While the focus of the administrative data analysis was on comparing career outcomes in AcqDemo to career outcomes in the GS system, we also conducted a handful of withinAcqDemo analyses to explore the effects of employee performance {as measured by �OCS) and broadband on the five career outcomes. These analyses exploited the supplemental data provided by the AcqDemo Program Office, which we merged with the data provided by DMDC.
In addition, we executed a number of analyses that centered on the career outcomes of particular subgroups of interest. The eight subgroups we examined were women, blacks, Asians, Hispanics, bargaining unit employees, the AW, supervisors, and veterans. For each subgroup, we compared the career outcomes of AcqDemo participants with the career outcomes of GS employees, using techniques that paralleled the techniques that were applied to the full sample. For the gender, race or ethnicity, and bargaining unit subgroups, we also assessed the outcomes of the subgroup relative to the outcomes of the most salient or natural comparison group. For example, the career outcomes of women were compared with the career outcomes of men, both within AcqDemo and within the weighted control group of GS employees in ADEOs.
The remainder of this appendix presents the statistical models and techniques that were used in each of these analyses. We also provide samples of the output generated by these models.
Analysis of Retention
As explained earlier, we tracked two 201 1 cohorts-a treatment group of AcqDemo participants and a weighted control group of GS employees in ADEOs-over the four years that elapsed from September 30, 201 1 , to September 30, 2015. We considered an individual separated from the DoD civilian workforce if that individual's record disappeared from the DoD civilian personnel inventory files for one or more consecutive quarters. The date of separation was retrieved from the DoD civilian personnel transaction files, and the time to separation was defined as the number of months that elapsed from September 30, 201 1, to the date of separation.
Kaplan-Meier survival curves were computed for the treatment group and the weighted control group. An important advantage of Kaplan-Meier survival analysis is that the method accommodates censored data, particularly right-censoring, which happens if the event in question-in this case, separation from the DoD civilian workforce-does not occur before the observation period ends. Our data are right-censored because nearly 80 percent of the individuals we tracked did not separate before September 30, 2015. To assess whether the treatment group and weighted control group had different survival distributions (i.e., different retention patterns), we conducted a weighted log-rank test. The weighted log-rank p-value was 0.1739, indicating that there was no statistically significant difference between the two survival distributions.
The weighted log-rank test assessed the difference in retention patterns over the four-year period of observation as a whole. In order to test for differences in retention rates at discrete points in time, retention rates were calculated at 12 months, 24 months, 36 months, and 48 months for the treatment group and the weighted control group. P-values were also computed to test for differences in retention rates across the two groups. The results are presented in

182 2016 Assessment of the Civilian Acquisition Workforce Personnel Demonstration Project
Table C.3 Retention Rates, September 30, 2011, Cohorts
Number of Percentage Retained P-Values Months Since September 30, Weighted Unweighted 2011 AcqDemo Control Group Control Group
Weighted Unweighted Control Group Control Group
12 94.4 93.9 93.0 0.244 0.000
24 89.3 88.S 86.9 0.147 0.000
36 83.5 82.7 80.6 0.222 0.000
48 78.4 77.5 75.3 0.180 0.000
SOURCE: DMDC civilian personnel inventory and transaction files; DAWIA personnel files.
NOTE: The data presented include only permanent, full-time employees whose compensation was at least $1 5,080, the salary equivalent of working a full year at federal minimum wage.
Table C.3. There was no statistically significant difference in retention between the two groups at the 12-month, 24-month, 36-month, or 48-month mark.
Note that we repeated the exercise using the unweighted control group and found a statistically significant difference in retention between AcqDemo and the unweighted control group, with retention higher in AcqDemo. The retention difference was no longer present once the control group was weighted, which suggests that the retention difference between AcqDemo and the unweighted control group was driven by differences in the characteristics of the two populations, rather than by AcqDemo itsel£
As shown in Table C.l, differences between the treatment group of AcqDemo participants and the control group of GS employees in ADEOs remained, even after the propensity score weights were applied. To ensure that remaining imbalances between the treatment and weighted control groups did not drive the results of the Kaplan-Meier survival analysis, we fitted a CPH model, which included all of the covariates listed in Table C.l as well as an AcqDemo indicator. The estimates delivered by the CPH model are presented in Table C.4. The p-value for AcqDemo participation indicates that AcqDemo's effect on retention was not statistically significant, which is consistent with the results delivered by the Kaplan-Meier survival analysis.
Analysis of Starting Salaries
For the analysis of AcqDemo's effect on starting salaries, we set aside the .201 1 cohorts described earlier and, instead, examined the population of employees who entered the DoD civilian workforce between December 31, 2010, and September 30, 2015. As before, we restricted the population to permanent, full-time employees whose annualized basic pay was at least $15,080, the salary equivalent of working a full year at federal minimum wage. The treatment group consisted of 1 ,873 employees who entered the DoD civilian workforce as AcqDemo participants, and the control group consisted of 31 ,822 employees who entered the DoD civilian workforce as GS employees in ADEOs.
Employees who entered AcqDemo from other DoD pay plans were excluded from the treatment group. Similarly, employees who entered ADEOs in the GS system from other DoD pay plans or from organizations on the GS pay plan that were not AcqDemo-eligible

Administrative Data Analysis 183
Table C.4 CPH Model of Months to Separation, September 30, 2011, Cohorts
Characteristic Coefficient Estimate Standard Error Hazard Ratio P-Value
AcqDemo participation -0.017 0.043 0.983 0.693
Age 0.036 0.003 1 .037 0.000
Female 0.196 0.038 1 .217 0.000
Black -0.335 0.057 0.715 0.000
Asian -0.159 0.072 0.853 0.027
Other -0.004 0.084 0.996 0.961
Hispanic 0.212 0.088 1 .236 0.016
Handicap, not targeted 0.165 0.052 1 .180 0.002
Handicap, targeted -0.124 0.178 0.884 0.488
Some college -0.041 0.057 0.959 0.464
Bachelor's degree 0.059 0.058 1 .061 0.307
Graduate degree -0.024 0.065 0.977 0.717
Veteran 0.201 0.037 1 .222 0.000
Air Force 0.040 0.037 1 .041 0.276
DoD agencies -0.087 0.051 0.917 0.090
Marine Corps -0.171 0.076 0.843 0.025
Navy -0.384 0.103 0.681 0.000
Logistics management 0.238 0.052 1 .269 0.000
Central management 0.173 0.062 1 .189 0.005
General office operations 0.033 0.076 1 .034 0.662
Data systems management 0.215 0,078 1 .240 0.006
Mathematicians 0.1 57 0.101 1 .170 0.120
Financial management 0.200 0.080 1 .222 0.013
Financial clerks 0.086 0.123 1 .089 0.486
Logistics technicians 0.021 0.090 1 .021 0.817
Secretarial 0.026 0.108 1 .026 0.812
Other 0.253 0.064 1 .288 0.000
Midlevel -0.285 0.072 0.752 0.000
Senior level -0.447 0.103 0.640 0.000
Years of federal service 0.023 0.002 1 .023 0.000
New hire 0.396 0.074 1 .486 0.000
Eligible to retire 0.541 0.051 1 .718 0.000

184 2016 Assessment of the Civilian Acquisition Workforce Personnel Demonstration Project
Table C.4 -Continued
Characteristic Coefficient Estimate Standard Error Hazard Ratio P-Value
Acquisition workforce 0.035 0.041 1 .036 0.389
Supervisor 0.081 0.044 1 .085 0.063
Bargaining unit -0.1 14 0.039 0.892 0.003
In the United States -0.077 0.105 0.925 0.460
In the D.C. metropolitan area 0.313 0.049 1 .367 0.000
Annual compensation in FY 0.000 0.000 1 .000 0.316 201 1
On retained pay in FY 2011 0.015 0.099 1 .016 0.876
SOURCE: DMDC civilian personnel inventory and transaction files; DAWIA personnel files.
NOTE: The data presented include only permanent, full-time employees whose compensation was at least $15,080, the salary equivalent of working a full year at federal minimum wage.
were excluded from the control group. This decision was driven by our analytical approach, which depended on identifying comparable GS new hires in ADEOs to populate the control group. Had we included within-DoD transfers in the treatment group, we would have also had to include within-DoD transfers in the control group. However, many of the transfers into ADEOs in the GS system came from AcqDemo. Including these transfers would have tainted the control group in the sense that some fraction of the group would have recently received the AcqDemo treatment.
· Repeating the process we executed for the 201 1 cohorts, we estimated propensity scores
using GBM and used the scores to construct weights, which were applied to the control group of newly hired GS employees in ADEOs. The balance between the treatment group of newly hired AcqDemo employees and the weighted control group of newly hired GS employees in ADEOs is shown in Table C.5. The unweighted control group is also shown for reference.
Using the data set that combined the treatment group of newly hired AcqDemo participants and the weighted control group of newly hired GS employees in ADEOs, we regressed annualized basic pay in the quarter of hire on the characteristics listed in Table C.5, as well as an indicator for AcqDemo participation. The annualized basic pay data excluded locality pay and were adjusted for inflation to 2015 dollars. The resulting estimates are presented in Table C.6. The coefficient and p-value for AcqDemo participation indicate that starting salaries in AcqDemo were $13,226 higher than starting salaries in the GS system, after controlling for other factors, and that this estimate is statistically significant at the I-percent level.
Analysis of Salaries Overall
For the analysis of AcqDemo's effect on overall salaries, we returned to the 201 1 cohorts described earlier. For each year from 2012 to 2015, we regressed annualized basic pay as reported on September 30 of that year on an array of characteristics and an indicator for AcqDemo participation. As previously noted, the annualized basic pay data were adjusted for inflation to 2015 dollars. Of particular note is the inclusion of an indicator for retained pay

Administrative Data Analysis 1 85
Table C.5 Balance Between AcqDemo and AcqDemo-Eligible Organizations in the GS System After Propensity Score Weighting. Newly Hired Employees, December 31, 2010, to September 30, 201 5
Mean, Weighted Mean, Unweighted Characteristic Mean, AcqDemo Control Group P-Value Control Group
Hire year 0.080
FY 2011 0.206 0.236 0.302
FY 2012 0.261 0.220 0.198
FY 2013 0.222 0.221 0.133
FY 2014 0.089 0.099 0.140
FY 2015 0.223 0.224 0.227
Age 41 .624 40.694 0.018 40.163
Male 0.686 0.666 0.249 0.557
Race 0.981
White 0.820 0.820 0.768
Black 0.096 0.098 0.140
Asian 0.031 0.032 0.038
Other 0.053 0.050 0.054
Hispanic 0.049 0.060 0.430 0.049
Handicap 0.833
Handicap, not targeted 0.042 0.043 0.040
Handicap, targeted 0.002 0.002 0.003
Education level 0.017
No college 0.235 0.197 0.353
Some college 0.089 0.081 0.160
Bachelor's degree 0.337 0.364 0.264
Graduate degree 0.335 0.357 0.221
Veteran 0.509 0.490 0.306 0.517
Component 0.003
Army 0.327 0.364 0.61 1
Air Force 0.330 0.302 0.131
DoD agencies 0.208 0.272 0.233
Marine Corps 0.103 0.019 0.000
Navy 0.032 0.043 0.025
Occupational group 0.000
Engineers 0.1 53 0.199 0.070

186 2016 Assessment of the Civilian Acquisition Workforce Personnel Demonstration Project
Table C.5-Continued
Mean, Weighted Mean, Unweighted Characteristic Mean, AcqDemo Control Group P-Value Control Group
Logistics management 0.187 0.225 0.169
Central management 0.164 0.193 0.099
General office operations 0.091 0.020 0.01 1
Data systems management 0.161 0.087 0.053
Mathematicians 0.033 0.039 0.007
Financial management 0.027 0.033 0.027
Financial clerks 0.020 0.002 0.004
Logistics technicians 0.009 0.014 0.054
Secretarial 0.016 0.014 0.01 1
Other 0.137 0.171 0.494
Career level 0.031
Entry level 0.335 0.3 1 1 0.416
Midi eve I 0.448 0.468 0 .544
Senior level 0.210 0.220 0.040
Years of federal service* 4.31 9 4.442 0.580 3 .959
Eligible to retire 0.035 0.041 0.353 0.031
Acquisition workforce 0.680 0.680 0.995 0 .274
Supervisor 0.062 0.077 0.090 0.043
Bargaining unit 0.1 14 0.141 0.004 0 .683
In the United States 0.988 0.986 0.395 0 .969
In the D.C. metropolitan area 0.306 0.279 0.183 0 .078
SOURCES: DMDC civi lian personnel inventory files; DAWIA personnel files.
NOTES: The data presented include only permanent, full-time employees whose compensation was at least $15,080, the salary equivalent of working a full year at federal minimum wage. The dollar figures listed are in 2015 dollars.
* = Years of federal service include previous experience in the DoD civilian workforce, in the federal civilian workforce outside of DoD, or as an active duty service member. Among employees who were newly hired between Decemb�r 31, 2010, and September 30, 201 5, 51 percent had at least three months of federa l service at the time of hire. Among these, 13 percent had previous experience in the DoD civilian workforce; 54 percent had previous experience as an active-duty service member; 12 percent had previous experience both i n the DoD civilian workforce and as an active-duty service member; and 20 percent had neither DoD civilian nor active-duty experience.

Administrative Data Analysis 1 87
Table C.6 Linear Regression Model of Starting Salary, Newly Hired Employees, December 31, 2010, to September 30, 201 5
Coefficient Estimate ($) Standard Error ($) P-Value
Intercept 25,198.46 2,028.25 0.000
AcqDemo participation 13,225.60 392.04 0.000
Hire year: FY 2012 -2,371.11 582.85 0.000
Hire year: FY 2013 -3,859.64 632.48 0.000
Hire year: FY 2014 -6,352.56 741.74 0.000
Hire year: FY 2015 -3,801.71 530.58 0.000
Age 3,05.46 20.39 0.000
Female -1,937.99 466.1 6 0.000
Black -3,122.44 628.87 0.000
Asian 723.34 919.63 0.432
Other -2,063.33 821 .54 0.012
Hispanic 726.07 91 6.00 0.428
Handicap, not targeted -182.46 1,085.47 0.867
Handicap, targeted -4,468.66 1,914.47 0.020
Some college -363.80 694.24 0.600
Bachelor's degree 2,621 .05 597.03 0.000
Graduate degree 3,835.44 638.78 0.000
Veteran -158.05 453.62 0.728
Air Force -2,400.77 519.36 0.000
DoD agencies -148.50 554.37 0.789
Marine Corps -1,380.27 989.39 0.163
Navy -801 .21 1,178.22 0.497
Logistics management -4,343.90 607.01 0.000
Central management -518.73 761 .31 0.496
General office operations -1 1 .59 1 ,090.39 0.992
Data systems management -486.08 710.41 0.494
Mathematicians -2,01 5.38 1,200.98 0.093
Financial management -2,028.21 1 ,123 .53 0.071
Financial clerks -824.51 1 ,592.49 0.605
Logistics technicians -6,490.04 1 ,667.96 0.000
Secretarial -10,215.52 1 ,287.39 0.000
Other -6,274.78 739.55 0.000

188 2016 Assessment of the Civilian Acquisition Workforce Personnel Demonstration Project
Table C.6-Continued
Coefficient Estimate ($) Standard Error ($) P-Value
Midlevel 24,729.44 471.63 0.000
Senior level 54,278.53 841 .56 0.000
Years of federal service 249.99 41 . 18 0.000
Eligible to retire 595.07 1 ,359.25 0.662
Acquisition workforce 3,259.53 502.60 0.000
Supervisor 5,955.53 1 ,077.72 0.000
Bargaining unit -169.40 572.47 0.767
In the United States 979.24 1 ,462.04 0.503
In the D.C. metropolitan area 3,833.46 565.51 0.000
SOURCE: DMDC civilian personnel inventory files; DAWIA personnel files.
NOTES: The data presented include only permanent, full-time employees whose compensation was at least $1 5,080, the salary equivalent of working a full year at federal minimum wage. The dollar figures listed are in 2015 dollars.
status, as well as the interaction of the retained pay status indicator with the AcqDemo participation indicator. This construction permitted us to estimate separate effects for employees on retained pay and employees not on retained pay. Estimating separate effects was necessary because the annualized basic pay data exclude locality pay for employees not on retained pay but include locality pay for employees on retained pay. Retained pay status was not an issue for the analysis of starting salaries because the population was restricted to employees who were new to the DoD civilian workforce; transfers across pay plans within the DoD civilian workforce were excluded.
The estimates for the 2015 linear regression model are presented in Table C.7. The coefficient for AcqDemo participation indicates that, among employees not on retained pay, salaries in AcqDemo were $1 ,796 higher than salaries in the GS system, after controlling for other factors. The p-value associated with the coefficient indicates that the estimate is statistically significant at the I-percent level. Because the underlying data set consisted of the 201 1 cohorts, the estimates presented in Table C.7 are conditional on continued DoD employment-that is, the estimated effects apply to the subset of the 201 1 cohorts who remained in the DoD civilian workforce through September 30, 2015. Table C.3 indicates that the majority, more than 78 percent, did. Nevertheless, any correlation between annualized basic pay and separation from the DoD civilian workforce might have biased the estimates.
Analysis of Salary Growth
The analysis of AcqDemo's effect on salary growth also made use of the 201 1 cohorts described earlier. For each individual in the data set and for each year from 2012 to 2015, we calculated the individual's annualized rate of salary growth since September 3 0, 201 1 :
For example, i f an individual's annualized basic pay was $80,000 on September 30, 201 1 , and $90,000 on September 30, 2014, then the individual's annualized rate of salary growth

Administrative Data Analysis 189
Table C.7 Linear Regression Model of 2015 Annualized Basic Pay. September 30, 2011 , Cohorts
Coefficient Estimate ($) Standard Error ($) P-Value
Intercept 25,872.44 1,357.19 0.000
AcqDemo participation 1,795.53 252.22 0.000
On retained pay on September 30, 201 1 8,336.99 1 ,501 .93 0.000
Interaction (AcqDemo participation x 6,640.99 1 ,573.82 0.000 on retained pay)
Age -177.87 1 1 .70 0.000
Female 214.66 227.59 0.346
Black -688.28 182.25 0.000
Asian -947.28 257.93 0.000
Other -284.33 373.89 0.447
Hispanic 134.58 444.94 0.762
Handicap, not targeted 252.74 428.78 0.556
Handicap, targeted 884.04 665.94 0.184
Some college 680.49 355.45 0.056
Bachelor's degree 2,227.23 281 .03 0.000
Graduate degree 2,385.34 288.02 0.000
Veteran 461 .45 234.84 0.049
Air Force -1281.41 202.34 0.000
DoD agencies 565.92 293.36 0.054
Marine Corps -685.95 547.22 0.21 0
Navy 2,612.50 439.26 0.000
Logistics management 880.54 357.58 0.014
Central management 520.39 244.08 0.033
General office operations -291.52 528.12 0.581
Data systems management -536.47 345.93 0.121
Mathematicians -61 1 .34 284.05 0.031
Financial management 571.93 320.58 0.074
Financial clerks 165.70 551 .14 0.764
Logistics technicians -1,413.72 353.96 0.000
Secretarial -4,576.94 497.95 0.000
Other -2,174.36 301 .39 0.000
Midi eve I 4,995.76 544.85 0.000
Senior level 13,439.38 625.86 0.000

190 2016 Assessment of the Civilian Acquisition Workforce Personnel Demonstration Project
Table C.7-Continued
Coefficient Estimate (S) Standard Error ($) P-Value
Years of federal service -82.58 1 1 .1 7 0.000
New hire -1,250.35 252.27 0.000
Eligible to retire 1 ,303.90 252.51 0.000
Acquisition workforce 992.63 184.02 0.000
Supervisor 2,077.36 268.96 0.000
Bargaining unit 468.27 221 .50 O.Q35
In the United States -885.65 716.46 0.216
In the D.C. metropolitan area 1 ,658.1 5 251 .87 0.000
Annual compensation in FY 201 1 0.79 0.01 0.000
SOURCES: DMDC civilian personnel inventory files; DAWIA personnel files.
NOTES: The data presented include only permanent, full-time employees whose compensation was at least $15,080, the salary equivalent of working a full year at federal minimum wage. The dollar figures listed are in 201 5 dollars.
( Annualized Basic Pay in the Current Year )Number ofYeors _ Annualized Basic Pay on September 30, 201 1
1
over the three-year period was 4 percent. Because the annualized basic pay data were adjusted for inflation to 2015 dollars, the growth rates calculated were net of inflation.
For each year from 2012 through 2015, we regressed the annualized rate of salary growth for that year on an array of characteristics and an indicator for AcqDemo participation. As in the analysis of salary levels, we included an indicator for retained pay status, as well as the interaction of the retained pay status indicator with AcqDemo participation indicator. The estimates for the 2015 linear regression model are presented in Table C.8. The p-value for AcqDemo participation indicates that, over the four years that elapsed from September 30, 201 1, to September 30, 2015, and among employees not on retained pay, the difference between the rate of salary growth in AcqDemo and the rate in the GS system was not statistically significant, after controlling for other factors.
While we estimated separate models for each of the four years, we focused most on the results of the 2015 regression model because it delivered results that spoke to an average rate of growth over a four-year period. The benefit of this approach was that it was less likely to be sensitive to the particularities of a given year. The drawback was that it was more vulnerable to bias due to attrition within the 201 1 cohorts.
Analysis of Promotion Because each of AcqDemo's broadbands corresponds to two or more GS grades (see Figure 2.1), promotions occurred at least twice as often in GS as they did in AcqDemo. For instance, a

Administrative Data Analysis 191
Table C.8 Linear Regression Model of 201 5 Annualized Rate of Salary Growth, September 30, 2011, Cohorts
Coefficient Estimate Standard Error P-Value
Intercept 8.773 0.619 0.000
AcqDemo participation -0.213 0.161 0.1 87
On retained pay on September 30, 2011 -2.421 0.299 0.000
Interaction {AcqDemo participation x 0.553 0.278 0.047 on retained pay)
Age -0.063 0.006 0.000
Female 0.078 0.066 0.240
Black 0.023 0.178 0.897
Asian -0.216 0.069 0.002
Other -0.030 0.1 56 0.846
Hispanic -0.098 0.192 0.61 1
Handicap, not targeted -0.100 0.066 0.128
Handicap, targeted -0.229 0.208 0.272
Some college 0.613 0.259 0.018
Bachelor's degree 0.580 0.083 0.000
Graduate degree 0.625 0.079 0.000
Veteran 0.052 0.052 0.315
Air Force -0.360 0.059 0.000
DoD agencies 0.41 1 0.196 0.036
Marine Corps 0.294 0.287 0.305
Navy 0.310 0.139 0.026
Logistics management 0.179 0.070 0.010
Central management 0.153 0.074 0.038
General office operations 0.547 0.325 0.093
Data systems management -0.206 0.089 0.021
Mathematicians -0.1 16 0.081 0.1 54
Financial management -0.034 0.108 0.754
Financial clerks 0.025 0.171 0.885
Logistics technicians -0.459 0.1 1 9 0.000
Secretarial -1 .130 0.265 0.000
Other -0.506 0.123 0.000
Mid level -0.732 0.348 0.035
Senior level 0.491 0.419 0.241

192 2016 Assessment of the Civilian Acquisition Workforce Personnel Demonstration Project
Table C.8-Continued
Coefficient Estimate Standard Error P-Value
Years of federal service -0.030 0.003 0.000
New hire 0.424 0.079 0.000
Eligible to retire 0.638 0.129 0.000
Acquisition workforce 0.193 0.068 0.004
Supervisor 0.375 0.049 0.000
Bargaining unit 0.076 0.081 0.347
In the United States -0.535 0.1 84 0.004
In the D.C. metropolitan area 0.126 0.124 0.312
Annual compensation in FY 201 1 0.000 0.000 0.000
SOURCES: DMDC civilian personnel inventory files; DAWIA personnel files.
NOTES: The data presented include only permanent, full-time employees whose compensation was at least $1 5,080, the salary equivalent of working a full year at federal minimum wage. The dollar figures listed are in 2015 dollars.
program manager (DoD occupation code 0340) ascending from the GS-14 to the GS-15 level would earn a promotion in the GS system but not in AcqDemo because the NH-4 broadband encompasse� both grades. We corrected for this problem by assigning a shadow AcqDemo career path and broadband to each GS employee in an ADEO and crediting a promotion only when the employee moved to a higher career path within a broadband or a higher broadband within a career path. In this way, we brought the definition of promotion within the GS control group in line with the definition of promotion within AcqDemo. Shadow AcqDemo career paths were assigned by referring to Table 2 of the 1999 AcqDemo FRN (OPM, 1999) and its amendments. The table provides a mapping from DoD occupation codes to AcqDemo career paths. After assigning shadow career paths to every GS employee in an ADEO, we placed each employee in a broadband by referring to Figure 2 . 1 .
Like the retention, salary level, and salary growth analyses, our analysis of promotion made use of the 201 1 cohorts. However, the data were further restricted in two ways to address issues specific to the promotion analysis. First, we excluded any AcqDemo employee in the NH-4 broadband and any GS employee in the shadow NH-4 broadband. Because the NH-4 broadband is at the top of the AcqDemo scale, NH-4 and shadow NH-4 employees are effectively ineligible for promotion. Second, we excluded any employee who appeared to have experienced one or more demotions during the four years that elapsed from September 30, 201 1 , to September 30, 2015.1 In examining the data, we noted a small number of employees who appeared to have experienced both a demotion and a subsequent promotion. Our conversations with the sponsor and RAND colleagues with expertise in DoD civilian personnel manage-
1 Our definition of demotion was analogous ro our definition of promotion. Using the AcqDcmo career paths and broadbands and the assigned shadow AcqDcmo career paths and broadbands, we defined demotion as a movement to a lower career path within a broadband or a lower broadband within a career path.

Administrative Data Analysis 193
ment suggested that these movements were likdy because of a reorganization or downsizing, rather than employee performance.
These two exclusions left us with 8,738 AcqDemo participants in the treatment group and 1 15,759 GS employees in the control group. Using this data set, we reestimated propensity scores using GBM and used the scores to construct weights for the control group. The balance between the treatment group and the weighted control group is shown in Table C.9. As before, the unweighted control group is also shown for reference.
As explained earlier, we calculated the number of promotions experienced by each employee from September 30, 201 1 , to September 30, 2015. Promotion within the treatment
Table C.9 Balance Between AcqDemo and AcqDemo-Eligible Organizations in the GS System After Propensity Score Weighting, September 30, 2011, Cohorts after Excluding NH-4 Employees and Employees with Demotions
Mean, Weighted Mean, Unweighted Characteristic Mean. AcqDemo Control Group P-Value Control Group
Age 46.1 10 46.323 0.383 46.890
Male 0.569 0.540 0.045 0.563
Race 0.308
White 0.71 1 0.707 0.702
Black 0.169 0.158 0.176
Asian 0.051 0.052 0.048
Other 0.069 0.082 0.074
Hispanic 0.059 0.073 0.008 0.060
Handicap 0.441
Handicap, not targeted 0.057 0.055 0.071
Handicap, targeted 0.002 0.003 0.005
Education level 0.048
No college 0.228 0.203 0.267
Some college 0.165 0.189 0.221
Bachelor's degree 0.359 0.350 0.318
Graduate degree 0.245 0.257 0.193
Veteran 0.392 0.328 0.000 0.394
Component 0.000
Army 0.469 0.577 0.594
Air Force 0.275 0.284 0.155
DoD agencies 0.087 0.1 1 8 0.236
Marine Corps 0.158 0.003 0.000
Navy 0.011 0.017 0.015

194 2016 Assessment of the Civilian Acquisition Workforce Personnel Demonstration Project
Table C.9-Continued
Mean, Weighted Mean, Unweighted Characteristic Mean, AcqDemo Control Group P-Value Control Group
Occupational group 0.000
Engineers 0.167 0.194 0.1 1 5
Logistics management 0.205 0.232 0.230
Central management 0.150 0.125 0.1 39
General office operations 0.134 0.048 0.008
Data systems management 0.066 0.037 0.050
Mathematicians 0.035 0.050 0.005
Financial management 0.030 0.025 0.046
Financial clerks 0.026 0.004 0.004
Logistics technicians 0.028 0.027 0.064
Secretaria l 0.027 0.070 0.01 5
Other 0.131 0.189 0.324
Career level 0.092
Entry level 0.224 0.203 0.212
Midi eve I 0.774 0.797 0.788
Senior level 0.000 0.000 0.000
Years of federal service 13.646 15.070 0.000 15.356
New hire 0.064 0.063 0.748 0.069
Eligible to retire 0.301 0.349 0.001 0.361
Acquisition workforce 0.669 0.601 0.000 0.340
Supervisor 0.074 O.Q78 0.428 0.076
Bargaining unit 0.144 0.191 0.000 0.680
In the United States 0.991 0.988 0.027 0.974
In the D.C. metropolitan area 0.238 0.136 0.000 0.046
Annualized basic pay in FY 201 1 $70,969.04 $68,786.69 0.000 $59,743.96
On retained pay in FY 201 1 0.003 0.005 0.000 0.054
SOURCES: DMDC civilian personnel inventory files; DAWIA personnel files.
NOTES: The data presented include only permanent, full-time employees whose compensation was at least $15,080, the salary equivalent of working a full year at federal minimum wage. The dollar figures listed are in 2015 dollars.

Administrative Data Analysis 195
group was defined as a movement to a higher career path within a broadband or a higher broadband within a career path; promotion within the control group was defined analogously using the assigned shadow AcqDemo career paths and broadbands. Of the 8,738 individuals in the treatment group, 1 ,241 (14.2 percent) experienced at least one promotion, and of the 1 15,759 individuals in the control group, 15,553 (13.4 percent, unweighted) experienced at least one promotion. The majority of individuals in both groups experienced one promotion or none at all.
To estimate AcqDemo's effect on the likelihood of promotion, we fitted a Poisson regression model, in which number of promotions served as the count variable. The regression results are presented in Table C.10. The coefficient for AcqDemo participation indicates that employees in AcqDemo experienced 23.l percent fewer promotions than employees in the GS system
Table C.10 Poisson Regression Model of Number of Promotions, September 30, 2011, Cohorts After Excluding NH-4 Employees and Employees with Demotions
Coefficient Incidence Rate Estimate Standard Error Ratio P-Value
Intercept -0.365 0.238 0.126
AcqDemo participation -0.262 0.081 0.769 0.001
Age -0.044 0.004 0.957 0.000
Female 0.134 0.069 1 .144 0.050
Black -0.121 0.1 1 1 0.886 0.278
Asian -0.302 0.1 14 0.739 0.008
Other -0.098 0.098 0.907 0.319
Hispanic 0.065 0.1 05 1 .067 0.535
Handicap, not targeted -0.172 0.104 0.842 0.097
Handicap, targeted -0.038 0.402 0.963 0.924
Some col lege 0.244 0.088 1 .277 0.005
Bachelor's degree 0.472 0.080 1 .604 0.000
Graduate degree 0.624 0.080 1 .867 0.000
Veteran 0.091 0.070 1 .095 0.196
Air Force -0.017 0.064 0.983 0.792
DoD agencies 0.358 0.092 1 .431 0.000
Marine Corps -0.218 0.132 0.804 0.099
Navy 0.599 0.1 50 1 .820 0.000
Logistics management 0.482 0.091 1 .620 0.000
Central management 0.1 19 0.088 1 .126 0.175

1 96 2016 Assessment of the Civilian Acquisition Workforce Personnel Demonstration Project
Table C.10-Continued
Coefficient Incidence Rate Estimate Standard Error Ratio P-Value
General office operations 0.214 0.130 1 .239 0.101
Data systems management 0.048 0.1 07 1 .049 0.656
Mathematicians 0.267 0.166 1 .306 0.108
Financial management 0.343 0.104 1 .409 0.001
Financial clerks 0.601 0.127 1 .823 0.000
Logistics technicians 0.053 0.176 1 .054 0.765
Secretaria l -0.505 0.172 0.603 0.003
Other -0.009 0.084 0.991 0.919
Midlevel -1 .851 0.073 0.1 57 0.000
Years of federal service -0.020 0.005 0.980 0.000
New hire -0.333 0.093 0.717 0.000
Eligible to retire 0.033 0.192 1 .034 0.862
Acquisition workforce -0.091 0.059 0.913 0.124
Supervisor 0.241 0.1 12 1 .272 0.032
Bargaining unit -0.100 0.082 0.905 0.223
In the United States -0.254 0.1 52 0.776 0.094
In the D.C. metropolitan area 0.208 0.124 1 . 232 0.092
Annual compensation in FY 201 1 0.000 0.000 1 .000 0.000
On retained pay in FY 201 1 -0.181 0.306 0.834 0.553
SOURCES: DMDC civilian personnel inventory files; DAWIA personnel files.
NOTE: The data presented include only permanent, full-time employees whose compensation was at least $1 5,080, the salary equivalent of working a full year at federal minimum wage.
did, after controlling for an array of other factors. The p-value indicates that this estimate is statistically significant at the I-percent level. 2
As noted earlier, more than 20 percent of the 201 1 cohort separated from the DoD civilian workforce before September 30, 2015. To account for the possibility that these separations affected the results of the promotion analysis, we also fitted a Poisson regression model, in which the time to separation, which we calculated as part of the retention analysis, was included as an exposure. The results were entirely consistent with the results of the standard Poisson regression model.
2 We converted the estimated coefficient on AcqDemo pamc1pation to the incidence rate ratio as follows: exp(-0.262) = 0.769. The interpretation is that the expected number of promotions in AcqDemo is 76.9 percent of the expected number of promotions in ADEOs in the GS system, after controlling for the other factors included in the Poisson regression model.

Administrative Data Analysis 1 97
Within-AcqDemo Analyses
Having estimated AcqDemo's effect on each of the five career outcomes in relation to the GS pay plan, we conducted a handful of within-AcqDemo analyses to explore the effects of employee performance and broadband on the various career outcomes. These analyses exploited the supplemental data provided by the AcqDemo Program Office, which we merged with the data provided by DMDC. Both sets of analyses operated on the 201 1 cohort of AcqDemo participants. Propensity score weights were neither calculated nor applied since these analyses did not require a GS control group.
Our analysis of the effect of employee performance on the various career outcomes used 80CS as the performance metric. There were two reasons for taking this approach. First, assessment criterion 2 called for an analysis of retention by appraisal zone. As explained in Chapter Two, appraisal zones are effectively defined by the 80CS metric: In most cases, Zone A corresponds to 80CS values less than -4, Zone B corresponds to 80CS values greater than +4, and Zone C corresponds to 80CS values from -4 to +4. Because more than 90 percent of AcqDemo participants fell within Zone C and fewer than 1 percent of AcqDemo participants fell within Zone A (see Table 7.3), we elected to estimate the relationship between 80CS and retention rather than the relationship between appraisal zone and retention.
The second reason we used 80CS as the performance metric is that the alternative metric, OCS, is not informative without normalizing it using base pay. As depicted in Figure 2.2, the performance level represented by the OCS metric varies with the base pay of the employee. For example, an OCS of70 is considered outstanding (well into Zone B) for an employee who earns $40,000 in base pay but is considered unsatisfactory (well into Zone A) for an employee who earns $120,000 in base pay. The 80CS metric normalizes the OCS metric by calculating the difference between the employee's OCS and the employee's expected OCS given his or her base pay. As explained earlier, employees with a 80CS from -4 to +4 are in Zone C, which means they are meeting expectations; employees with a 80CS greater than +4 are in Zone B, which means they are exceeding expectations; and employees with a 80CS less than -4 are in Zone A, which means they are not meeting expectations.
To estimate the effect of 80CS on retention, we fitted a logistic regression model for each year from 2011 to 2014. The dependent variable was a binary indicator of the employee's presence in the DoD civilian workforce in the following year. The data set for each regression consisted of the subset of the 201 1 AcqDemo cohort that was not only in the DoD civilian workforce but also in AcqDemo during the regression year. This restriction was necessary to ensure the availability of 80CS for every individual in the data set. The results of the 2014 regression model are presented in Table C.1 1 . The coefficients for �OCS and the square of 80CS indicate that a I-point increase in 80CS in FY 2014 was associated with a 20.4 percent increase in the odds of retention in FY 2015, after controlling for an array of other factors.3
We estimated the effect of 80CS on salary level, salary growth, and promotion in a similar fashion. Linear regression models were fitted for the salary level and salary growth analyses; logistic regression models were fitted for the promotion analysis. The square of �OCS was included only the regression models for retention. An analysis of the effect of 80CS on start-
3 Given the nonlinearity inherent in including the square of .6.0CS in the specification, we evaluated the effect of a I-point increase in .6.0CS in a neighborhood around the average value of .6.0CS. In FY 2014, the average .6.0CS was 1 .33. We obtained the 20.4-percent figure as follows: exp(0.179 + 0.003(1.832 - 0.832]) = 1 .204 .

198 2016 Assessment of the Civilian Acquisition Workforce Personnel Demonstration Project
Table C.11 Estimating the Effect of Performance in FY 2014 on Retention in FY 2015 Within AcqDemo, September 30, 2011, Cohorts
Coefficient Estimate Standard Error Odds Ratio P-Value
Intercept 5.495 0.710 0.000
.60CS for FY 2014 0.179 0.027 1 .196 0.000
aocs2 for FY 2014 0.003 0.001 1 .003 0.003
Top of pay band -0.153 0.134 0.858 0.253
Age -0.051 0.007 0.950 0.000
Female -0.109 0.104 0.897 0.294
Black 0.490 0.131 1 .632 0.000
Asian 0.037 0.197 1 .038 0.851
Other -0.026 0.236 0.975 0.913
Hispanic -0.145 0.257 0.865 0.573
Handicap, not targeted -0.072 0.151 0.931 0.636
Handicap, targeted 0.724 1.027 2.063 0.481
Some college 0.249 0.1 54 1 .282 0.106
Bachelor's degree -0.020 0.133 0.980 0.878
Graduate degree 0.138 0.137 1 .147 0.31 6
Veteran -0.096 0.102 0.909 0.347
Air Force 0.029 0.129 1 .030 0.81 9
DoD agencies 0.196 0.139 1 .21 6 0.160
Marine Corps 0.014 0.147 1 .014 0.923
Navy 0.149 0.397 1 .160 0.708
Logistics management -0.239 0.142 0.788 0.092
Central management 0.021 0.1 53 1 .021 0.893
General office operations 0.057 0.172 1 .059 0.738
Data systems management -0.173 0.210 0.841 0.41 1
Mathematicians -0.066 0.230 0.936 0.776
Financial management -0.291 0.250 0.748 0.244
Financial clerks 0.450 0.372 1 . 568 0.226
Logistics technicians -0.061 0.311 0.941 0.845
Secretarial -0.582 0.330 0.559 0.078
Other -0.208 0.185 0.812 0.262
Mid level -0.336 0.195 0.7 15 0.086

Administrative Data Analysis 199
Table C.11-Continued
Coefficient Estimate Standard Error Odds Ratio P-Value
Senior level -0.481 0.306 0.61 8 0.1 17
Years of federal service -0.032 0.006 0.969 0.000
New hire on September 30, 201 1 -0.134 0.209 0.875 0.522
Eligible to retire -0.184 0.142 0.832 0.1 94
Acquisition workforce 0.146 0.123 1 . 157 0.233
Supervisor 0.135 0.1 19 1 .145 0.255
Bargaining unit 0.142 0.150 1 .152 0.345
In the United States 0.235 0.498 1 .265 0.637
In the D.C. metropolitan area -0.160 0.1 12 0.852 0.1 54
Compensation on September 30, 0.000 0.000 1 .000 0.080 201 1
Salary growth up to September 30, -0.041 0.029 0.960 0.149 2014
On retained pay on September 30, -0.337 0.206 0.714 0.1 02 2014
SOURCES: DMDC civilian personnel inventory files; DAWIA personnel files; administrative data provided by the AcqDemo Program Office.
NOTE: The data presented include only permanent, full-time employees whose compensation was at least $15,080, the salary equivalent of working a full year at federal minimum wage.
ing salaries was omitted because L'.lOCS data were not available for the FY preceding entry into AcqDemo.
We further explored the effect of L'.lOCS on salary level and salary growth by adding two terms to the relevant regression models: an indicator for a negative L'.lOCS and the interaction of that indicator with the existing L'.lOCS term. This specification permitted us to estimate separate effects for employees with L'.lOCS less than zero and employees with L'.lOCS greater than or equal to zero. Across the board, the magnitudes of the effects were larger for those with L'.lOCS of at least zero. For instance, when averaging over the entire AcqDemo workforce, a I-point increase in L'.lOCS in FY 2014 was associated with a $197 increase in annualized basic pay in FY 2015, after controlling for an array of other factors. However, when averaging over AcqDemo participants with L'.lOCS of at least zero, the estimated increase was $238. The estimated increase was only $33 when averaging over AcqDemo participants with L'.lOCS less than zero.
To estimate the effect of broadband on retention, we fitted a logistic regression model for each year (201 1 through 2014) and each career path (NH, NJ, NK), for a total of 12 regressions. As before, the dependent variable was a binary indicator of the employee's presence in the DoD civilian workforce in the following year. The data set for each regression consisted of the subset of the 201 1 AcqDemo cohort that was in the specified career path during the regression

200 2016 Assessment of the Civilian Acquisition Workforce Personnel Demonstration Project
year. For example, the 2013 NH regression was restricted to individuals in the 20I I AcqDemo cohort who were in the NH pay plan on September 30, 2013.
Table C.12 presents the results of the 20I4 regression model for the NH career path. The p-values associated with NH-3 and NH-4 indicate that the effect of broadband in FY 20I4 on retention in FY 20I5 was not statistically significant, after controlling for an array of other factors. Note that broadbands within the NH career path were classified into three categories rather than four: NH-I and NH-2 were grouped together because there were very few NH-I employees in any of the four years.
Table C.12 Estimating the Effect of Broadband in FY 2014 on Retention in FY 2015 Within the NH Career Path, September 30, 2011, Cohorts
Coefficient Estimate Standard Error Odds Ratio P-Value
Intercept 6.014 0.767 0.000
NH-3 in FY 2014 -O.o75 0.223 0.927 0.735
NH-4 in FY 2014 -0.202 0.350 0.8 1 7 0.565
Top of pay band -0.200 0.148 0.8 1 9 0.177
Age -0.058 0.007 0.944 0.000
Female -0.086 0.107 0.917 0.418
Black 0.449 0.138 1 .5 67 0.001
Asian 0.005 0.203 1 .005 0.981
Other -0.1 18 0.244 0.889 0.629
Hispanic -0.219 0.269 0.803 0.41 5
Handicap, not targeted -0.161 0.156 0.851 0.300
Handicap, targeted 0.627 1 .024 1 .871 0.541
Some college 0.304 0.177 1 . 356 0.086
Bachelor's degree 0.004 0.143 1 .004 0.979
Graduate degree 0.1 56 0.146 1 .1 69 0.284
Veteran -0.076 0.106 0.927 0.475
Air Force -0.102 0.136 0.903 0.450
DoD agencies 0.145 0.144 1.1 56 0.315
Marine Corps -0.251 0.146 0.778 0.087
Navy 0.196 0.413 1 .216 0.635
Logistics management -0.210 0.143 0.81 1 0.142
Central management 0.101 0.154 1 .1 06 0.513
General office operations 0.092 0.173 1 .096 0.597
Data systems management -0.1 13 0.210 0.8 93 0.591

Administrative Data Analysis
Table C.12-Continued
Coefficient Estimate Standard Error Odds Ratio P-Value
Mathematicians -0.043 0.231 0.958 0.851
Financial management -0.242 0.252 0.785 0.336
Financial clerks 0.592 0.391 1 .808 0.129
Logistics technicians 0.105 0.363 1 .1 1 0 0.773
Other -0.285 0.202 0.752 0.1 58
Years of federal service -0.034 0.006 0.966 0.000
New hire on September 30, 201 1 -0.131 0.216 0.877 0.543
Eligible to retire -0.202 0.148 0.817 0.171
Acquisition workforce 0.o76 0.126 1 .079 0.545
Supervisor 0.199 0.121 1 .220 0.1 00
Bargaining unit 0.147 0.156 1 .1 59 0.345
In the United States 0.148 0.540 1 .160 0.784
In the D.C. metropolitan area -0.164 0.1 16 0.849 0.1 58
Compensation on 0.000 0.000 1 .000 0.137 September 30, 201 1
Salary growth up to -0.032 0.032 0.968 0.303 September 30, 2014
On retained pay on -0.255 0.237 0.775 0.282 September 30, 2014
SOURCES: DMDC civilian personnel inventory files; DAWIA personnel files; administrative data provided by the AcqDemo Program Office.
NOTE: The data presented include only permanent, full-time employees whose compensation was at least $1 5,080, the salary equivalent of working a ful l year at federal minimum wage.
201
We estimated the effect of broadband on salary level, salary growth, and promotion in a similar fashion. Linear regression models were fitted for the salary level and salary growth analyses; logistic regression models were fitted for the promotion analysis. NH-4 employees were excluded from the promotion regressions for the NH career path because NH-4 employees were not eligible for promotion. Results from the promotion regressions for the NJ and NK career paths were not reliable because promotion counts within those career paths were too low. An analysis of the effect of broadband on starting salaries was omitted because broadband data were not available for the FY preceding entry into AcqDemo.
Subgroup Analyses
There were eight subgroups that were of particular interest to Congress and/or the AcqDemo Program Office: women, blacks, Asians, Hispanics, bargaining unit employees, the AW, supervisors, and veterans. For each subgroup, we estimated AcqDemo's effect on each of the five

202 201 6 Assessment of the Civilian Acquisition Workforce Personnel D emonstration Project
career outcomes, using techniques that paralleled the techniques that were applied to the full sample. For example, to assess AcqDemo's effect on supervisors, we excluded nonsupervisors from the 201 1 cohorts, reestimated the propensity scores, and constructed a new set of weights, which were applied to the 201 1 cohort of supervisors in ADEOs in the GS system. This process delivered a treatment group of supervisors who were in AcqDemo on September 30, 201 1 , and a weighted control group of supervisors who were in ADEOs in the GS system on September 30, 201 1 . The statistical techniques described in the sections on retention, starting salaries, salaries overall, salary growth, and promotion were applied to the treatment and weighted control groups to assess how supervisors in AcqDemo fared relative to supervisors in the GS system, after controlling for an array of factors.
For the gender, race or ethnicity, and bargaining unit subgroups, we also assessed the outcomes of the subgroup relative to the outcomes of the most salient or natural comparison group. For example, the career outcomes of women were compared with the career outcomes of men, both within AcqDemo and within the weighted control group of GS employees in ADEOs. Similarly, the career outcomes of blacks and Asians were compared with the career outcomes of whites; the career outcomes of Hispanics were compared with the career outcomes of non-Hispanics; and the career outcomes of unionized employees were compared with the career outcomes of nonunionized employees.
To execute this set of analyses, we reestimated the full-sample regression models for the five career outcomes, augmenting each model with interactions between the gender, race or ethnicity, and bargaining unit indicators with the AcqDemo participation indicator. Tables C.13 through C.17 provide a sample of the results. The coefficients on the interaction terms provide estimates of the difference between AcqDemo's effect for the subgroup of interest and AcqOemo's effect for the most salient comparison group. For example, in Table C.15, the estimated coefficient on the AcqDemo-black interaction term suggests that the black-white salary gap in AcqOemo is $1,046 larger than the black-white salary gap among comparable GS employees in ADEOs, after controlling for an array of other factors. The associated p-value indicates that this estimate is statistically significant at the I-percent level.

Administrative Data Analysis 203
Table C.13 Cox Proportional Hazards Model of Months to Separation with Interaction Terms, September 30, 2011, Cohorts
Coefficient Estimate Standard Error Hazard Ratio P-Value
AcqDemo participation 0.040 0.057 1 .041 0.484
Female 0.256 0.060 1 .292 0.000
Interaction (AcqDemo participation x -0.097 0.068 0.907 0.1 53 female)
Black -0.260 0.1 1 3 0.771 0.021
Interaction (AcqDemo participation x -0.129 0.125 0.879 0.301 black)
Asian -0.225 0.1 09 0.798 0.039
I nteraction {AcqDemo participation x 0.100 0.144 1 .105 0.486 Asian)
Other -0.003 0.084 0.997 0.975
Hispanic 0.243 0.1 1 5 1 .276 0.035
Interaction (AcqDemo participation x 0.056 0.130 1.057 0.668 Hispanic)
Bargaining unit -0.102 0.041 0.903 0.013
Interaction (AcqDemo participation x -0.022 0.073 0.978 0.762 bargaining unit)
Age 0.036 0.003 1 .037 0.000
Handicap, not targeted 0.165 0.053 1 .179 0.002
Handicap, targeted -0.1 19 0.176 0.888 0.500
Some college -0.046 0.057 0.955 0.41 5
Bachelor's degree 0.059 0.058 1.061 0.312
Graduate degree -0.025 0.065 0.975 0.699
Veteran 0.199 0.037 1 .221 0.000
Air Force 0.037 0.037 1 .038 0.312
DoD agencies -0.093 0.052 0.91 1 0.074
Marine Corps -0.178 0.078 0.837 0.023
Navy -0.382 0.1 03 0.682 0.000
Logistics management 0.233 0.052 1.262 0.000
Central management 0.170 0.062 1 .185 0.006
General office operations 0.026 0.076 1 .026 0.733
Data systems management 0.211 O.D78 1 .235 0.007
Mathematicians 0.1 53 0.1 01 1 .165 0.131
Financial management 0.202 0.080 1.223 0.012

204 2016 Assessment of the Civilian Acquisition Workforce Personnel Demonstration Project
Table C.13-Continued
Coefficient Estimate Standard Error Hazard Ratio P-Value
Financial clerks 0.090 0.123 1 .094 0.464
Logistics technicians 0.01 8 0.090 1 .018 0.843
Secretarial 0.01 1 0.1 09 1 .011 0.920
Other 0.252 0.064 1 .286 0.000
Mid level -0.287 0.073 0.751 0.000
Senior level -0.454 0.1 05 0.635 0.000
Years of federal service 0.023 0.002 1 .023 0.000
New hire 0.397 0.074 1 .487 0.000
Eligible to retire 0.539 0.051 1 .71 5 0.000
Acquisition workforce 0.036 0.041 1 .037 0.372
Supervisor 0.083 0.043 1 .087 0.054
In the United States -0.078 0.1 06 0.925 0.461
In the D.C. metropolitan area 0.314 0.049 1 .369 0.000
Annual compensation in FY 201 1 0.000 0.000 1 .000 0.326
On retained pay in FY 2011 0.013 0.100 1 .013 0.897
SOURCES: DMDC civilian personnel inventory and transaction files; DAWIA personnel files.
NOTE: The data presented include only permanent, full-time employees whose compensation was at least $1 5,080, the salary equivalent of working a full year at federal minimum wage.
Table C.14 Linear Regression Model of Starting Salary with Interaction Terms, Newly Hired Employees, December 31, 2010, to September 30, 201 5
Coefficient Estimate ($) Standard Error ($) P-Value
Intercept 24,127.1 5 2,184.31 0.000
AcqDemo participation 13,418.23 524.42 0.000
Female -1 ,691 .73 581.62 0.004
Interaction (AcqDemo participation x female) -387.18 768.45 0.614
Black -2,374.12 865.27 0.006
Interaction (AcqDemo participation x black) -1,292.30 1 ,226.1 0 0.292
Asian 255.46 939.91 0.786
Interaction (AcqDemo participation x Asian) 761 .57 1 ,690.98 0.652
Other -2,1 19.92 816.14 0.009
Hispanic 1 ,718.18 1 ,244.45 0.167

Administrative Data Analysis 205
Table C.14-Continued
Coefficient Estimate ($) Standard Error ($) P-Value
Interaction (AcqDemo participation x Hispanic) 1 ,841 .32 1 ,596.89 0.249
Bargaining unit 1 19.72 431 .03 0.781
Interaction (AcqOemo participation x -544.86 953.21 0.568 bargaining unit)
Hire year: FY 2012 -2,374.07 587.91 0.000
Hire year: FY 2013 -3,868.67 634.81 0.000
Hire year: FY 2014 -6,359.55 740.97 0.000
Hire year: FY 2015 -3,853.54 535.97 0.000
Age 304.45 20.44 0.000
Handicap, not targeted -188.01 1 ,086.21 0.863
Handicap, targeted -4,354.42 1 ,939.36 0.025
Some college -356.12 693.56 0.608
Bachelor's degree 2,625.36 599.15 0.000
Graduate degree 3,855.51 639.01 0.000
Veteran -133.95 453.69 0.768
Air Force -2,416.72 519.54 0.000
DoD agencies -177.08 559.57 0.752
Marine Corps -1,264.46 982.52 0.198
Navy -790.84 1 , 179.49 0.503
Logistics management -4,401.31 607.90 0.000
Central management -513.66 761 .56 0.500
General office operations -34.28 1 ,087.23 0.975
Data systems management -569.74 717.81 0.427
Mathematicians -2,083.03 1 ,201 .72 0.083
Financial management -2,057.70 1 ,1 23.62 0.067
Financial clerks -809.31 1 ,589.00 0.61 1
Logistics technicians -6,521.89 1 ,659.41 0.000
Secretarial -10,170.35 1 ,282.05 0.000
Other -6,310.55 740.18 0.000
Midlevel 24,754.57 471 .90 0.000
Senior level 54,298.1 0 839.76 0.000
Years of federal service 249.82 41 .19 0.000
Eligible to retire 617.06 1 ,357.73 0.649

206 2016 Assessment of the Civilian Acquisition Workforce Personnel Demonstration Project
Table C.14-Continued
Coefficient Estimate ($) Standard Error ($) P-Value
Acquisition workforce 3,275.34 502.67 0.000
Supervisor 5,966.65 1 ,076.69 0.000
In the United States 990.05 1 ,476.49 0.503
In the D.C. metropolitan area 3,815.54 563.96 0.000
SOURCES: DMDC civilian personnel inventory files; DAWIA personnel files.
NOTES: The data presented include only permanent, full-time employees whose com pensation was at least $1 5,080, the salary equivalent of working a full year at federal minimum wage. The dollar figures listed are in 2015 dollars.
Table C.15 Linear Regression Model of 2015 Annualized Basic Pay with Interaction Terms, September 30, 2011 , Cohorts
Coefficient Estimate ($) Standard Error ($) P-Value
Intercept 26,743.42 1 840.1 8 0.000
AcqDemo participation 2,028.37 354.93 0.000
Female 129.99 381 .45 0.733
Interaction (AcqDemo participation x female) 1 14.91 331 .30 0.729
Black -25.94 358.30 0.942
Interaction (AcqDemo participation x black) -1,046.12 389.35 0.007
Asian -223.21 504.24 0.658
Interaction (AcqDemo participation x Asian) -1 ,139.58 585.19 0.051
Other -369.81 332.38 0.266
Hispanic -909.52 1 ,096.75 0.407
Interaction (AcqDemo participation x Hispanic) -1,757.46 1 ,235.88 0.1 55
Bargaining unit 266.18 394.19 0.500
Interaction (AcqDemo participation x 342.63 41 6.45 0.41 1 bargaining unit)
On retained pay, September 30, 201 1 8,297.13 1 ,508.00 0.000
Interaction (AcqDemo participation x 6,678.16 1 ,583.88 0.000 retained pay)
Age -177.93 1 1 .77 0.000
Handicap, not targeted 251.51 431 .58 0.560
Handicap, targeted 899.06 665.1 0 0.176
Some college 661 .37 345.54 0.056
Bachelor's degree 2,222.17 277. 18 0.000

Administrative Data Analysis 207
Table C.15-Continued
Coefficient Estimate ($) Standard Error ($) P-Value
Graduate degree 2,393.22 285.95 0.000
Veteran 468.45 232.1 0 0.044
Air Force -1 ,235.54 188.41 0.000
DoD agencies 557.83 301 .51 0.064
Marine Corps -685.02 534.44 0.200
Navy 2,661 .56 443.53 0.000
Logistics management 917.23 353.87 0.010
Central management 541 .06 235.58 0.022
General office operations -292.36 526.31 0.579
Data systems management -510.02 342.36 0.136
Mathematicians -593.81 281 .1 0 0.035
Financial management 603.07 31 5.74 0.056
Financial clerks 184.05 545.06 0.736
Logistics technicians -1 ,375.56 347.25 0.000
Secretarial -4,563.51 486.36 0.000
Other -2,138.08 288.38 0.000
Midlevel 5,006.65 531 .92 0.000
Senior level 13,435.18 610.01 0.000
Years of federal service -82.1 6 1 1 .03 0.000
New hire -1 ,252.17 251 .12 0.000
Eligible to retire 1 ,299.50 251 .92 0.000
Acquisition workforce 979.29 181 .62 0.000
Supervisor 2,075.45 269.66 0.000
In the United States -872.62 709.40 0.219
In the D.C. metropolitan area 1,664.63 251 .00 0.000
Annual compensation in FY 201 1 0.79 O.o1 0.000
SOURCES: DMDC civilian personnel inventory files; DAWIA personnel files.
NOTES: The data presented include only permanent, full-time employees whose compensation was at least $15,080, the salary equivalent of working a full year at federal minimum wage. The dollar figures listed are in 2015 dollars.

208 2016 Assessment of the Civilian Acquisition Workforce Personnel Demonstration Project
Table C.16 Linear Regression Model of 201 5 Annualized Rate of Salary Growth with Interaction Terms, September 30, 2011, Cohorts
Coefficient Estimate Standard Error P-Value
Intercept 9.030 0.889 0.000
AcqDemo participation -0.034 0.1 12 0.757
Female 0.264 0.1 68 0.1 1 5
Interaction (AcqDemo participation x female) -0.308 0.191 0.106
Black 0.431 0.444 0.331
Interaction (AcqDemo participation x black} -0.654 0.444 0.141
Asian -0.226 0.125 · 0.070
Interaction (AcqDemo participation x Asian) 0.033 0.1 54 0.829
Other -0.060 0.129 0.644
Hispanic -0.486 0.525 0.355
Interaction (AcqDemo participation x Hispanic} -0.657 0.593 0.268
Bargaining unit -0.205 0.166 0.216
Interaction (AcqDemo participation x 0.503 0.1 80 0.005 bargaining unit}
On retained pay on September 30, 201 1 -2.397 0.288 0.000
Interaction (AcqDemo participation x 0.544 0.285 0.056 retained pay)
Age -0.062 0.005 0.000
Handicap, not targeted -0.100 0.066 0.126
Handicap, targeted -0.192 0.1 98 0.331
Some college 0.593 0.238 0.013
Bachelor's degree 0.576 0.080 0.000
Graduate degree 0.630 0.079 0.000
Veteran 0.046 0.052 0.374
Air Force -0.336 0.051 0.000
DoD agencies 0.413 0.1 83 0.024
Marine Corps 0.307 0.281 0.273
Navy 0.327 0.143 0.022
Logistics management 0.185 0.063 0.003
Central management 0.156 0.068 0.022
General office operations 0.528 0.299 0.077
Data systems management -0.195 0.083 0.019

Administrative Data Analysis
Table C.16-Continued
Coefficient Estimate Standard Error P-Value
Mathematicians -0.1 1 5 0.075 0.126
Financial management -0.012 0.099 0.905
Financial clerks 0.084 0.1 64 0.609
Logistics technicians -0.438 0.1 10 0.000
Secretarial -1 .195 0.277 0.000
Other -0.486 0.1 1 1 0.000
Midlevel -0.723 0.333 0.030
Senior level 0.495 0.404 0.221
Years of federal service -0.030 0.003 0.000
New hire 0.424 0.079 0.000
Eligible to retire 0.631 0.121 0.000
Acquisition workforce 0.182 0.066 0.006
Supervisor 0.385 0.046 0.000
In the United States -0.504 0.179 0.005
In the D.C. metropolitan area 0.135 0.1 17 0.248
Annual compensation in FY 201 1 0.000 0.000 0.000
SOURCES: DMDC civilian personnel inventory files; DAWIA personnel files.
NOTES: The data presented include only permanent, full-time employees whose compensation was at least $15,080, the salary equivalent of working a full year at federal minimum wage. The dollar figures listed are in . 2015 dollars.
Table C.17 Poisson Regression Model of N umber of Promotions with Interaction Terms, September 30, 2011, Cohorts, After Excluding NH-4 Employees and Employees with Demotions
Coefficient Incidence Rate
209
Estimate Standard Error Ratio P-Value
Intercept -0.814 0.284 0.004
AcqDemo participation -0.039 0.092 0.962 0.676
Female 0.431 0.133 1 .538 0.001
Interaction {AcqDemo participation x -0.478 0.136 0.620 0.000 female)
Black 0.059 0.193 1 .061 0.758
Interaction {AcqDemo participation x -0.305 0.195 0.737 0.1 1 8 black)
Asian -0.477 0.267 0.621 0.074

210 2016 Assessment of the Civilian Acquisition Workforce Personnel Demonstration Project
Table C.17-Continued
Coefficient Incidence Rate Estimate Standard Error Ratio P-Value
Interaction (AcqDemo participation x 0.271 0.288 1 .312 0.347 Asian)
Other -0.097 0.095 0.908 0.308
Hispanic 0.287 0.1 59 1 .332 0.071
Interaction (AcqDemo participation x 0.336 0.181 1 .400 0.064 Hispanic)
Bargaining unit -0.248 0.1 07 0.780 0.020
Interaction (AcqDemo participation x 0.320 0.125 1 .377 0.011 bargaining unit)
Age -0.042 0.003 0.958 0.000
Handicap, not targeted -0.171 0.1 06 0.843 0.106
Handicap, targeted -0.021 0.399 0.979 0.959
Some college 0.230 0.083 1 .259 0.006
Bachelor's degree 0.478 0.080 1 .613 0.000
Graduate degree 0.645 0.080 1 .906 0.000
Veteran 0.074 0.069 1.076 0.288
Air Force -0.010 0.061 0.990 0.864
DoD agencies 0.351 0.085 1 .421 0.000
Marine Corps -0.200 0.125 0.81 8 0.1 10
Navy 0.596 0.149 1 .814 0.000
Logistics management 0.485 0.090 1 .624 0.000
Central management 0.126 0.086 1 .135 0.142
General office operations 0.1 55 0.1 10 1 .1 68 0.160
Data systems management 0.041 0.1 06 1 .042 0.695
Mathematicians 0.269 0.170 1 .309 0.1 14
Financial management 0.380 0.1 03 1 .462 0.000
Financial clerks 0.654 0.127 1 .922 0.000
Logistics technicians 0.036 0.174 1 .036 0.837
Secretarial -0.581 0.176 0.559 0.001
Other 0.008 0.084 1 .008 0.928
Midlevel -1 .855 0.071 0.1 56 0.000
Years of federal service -0.020 0.004 0.981 0.000
New hire -0.333 0.092 0.716 0.000
Eligible to retire -0.01 0 0.173 0.990 0.953

Administrative Data Analysis 211
Table C.17-Continued
Coefficient Incidence Rate Estimate Standard Error Ratio P-Value
Acquisition workforce -0.086 0.060 0.918 0.151
Supervisor 0.248 0.1 10 1 .282 0.024
In the United States -0.203 0.1 53 0.816 0.185
In the D.C. metropolitan area 0.228 0.1 17 1 .256 0.052
Annual compensation in FY 201 1 0.000 0.000 1 .000 0.000
On retained pay in FY 201 1 -0.174 0.304 0.840 0.567
SOURCE: DMDC civilian personnel inventory files; DAWIA personnel file.
NOTE: The data presented include only permanent, full-time employees whose compensation was at least $15,080, the salary equivalent of working a full year at federal minimum wage.

Abbreviations
AcqDemo
ADEO
AM
AT&L
AW
CA
CAS2Net
CCAS
CIP
CPH
CRI
DAU
DAWIA
DMDC
DoD
EEO
FEVS
FR
FRN
FY
GBM
Department of Defense Civilian Acquisition Workforce Personnel Demonstration Project
AcqDemo-eligible organization
AcqDemo memorandum
Acquisition, Technology, and Logistics
acquisition workforce
contribution award
Contribution-Based Compensation and Appraisal Software for the Internet
Contribution-Based Compensation and Appraisal System
Contribution Improvement Plan
Cox proportional hazards
contribution rating increase
Defense Acquisition University
Defense Acquisition Workforce Improvement Act
U.S. Defense Manpower Data Center
U.S. Department of Defense
Equal Employment Opportunity
Federal Employee Viewpoint Survey
Federal Register
Federal Register Notice
fiscal year
generalized boosted modeling
213

214 2016 Assessment of the Civilian Acquisition Workforce Personnel Demonstration Project
GPI
GS
HR
MDA
NDAA
NH
NJ
NK
NSPS
ocs
OMB
OPM
OPTEMPO
OSD
OUSD
PRO
SES
SME
SPL
TRAC
UIC
WIGI
general pay increase
General Schedule
human resources
Missile Defense Agency
National Defense Authorization Act
business management and technical management professional
technical management support
administrative support
National Security Personnel System
overall contribution score
Office of Management and Budget
Office of Personnel Management
operational tempo
Office of the Secretary of Defense
Office of the Under Secretary of Defense
Position Requirements Document
Senior Executive Service
subject-matter expert
Standard Pay Line
Training Review and Advisory Committee
Unit Identification Code
within-grade increase

References
Aberbach, Joel D., and Bert A. Rockman, "Conducting and Coding Elite Interviews," PS: Political Science and Politics, Vol. 35, No. 4, 2002, pp. 673-676.
AcqDemo-see Department of Defense Civilian Acquisition Workforce Personnel Demonstration Project.
Andrews, Mark, Who Is Being Heard? Response Bias in Open-Ended Responses in a Large Government Employee Survey, 60th Annual Conference of the American Association for Public Opinion Research, Miami Beach, Fla., 2005, pp. 3760-3766. As of December 13, 2016: http://ww2.amstat.org/sections/SRMS/Proceedings/y2005/Files/JSM2005-000924.pdf
Bernard, H. Russell, Research Methods in Anthropology: Qualitative and Quantitative Methods, Third Edition, Walnut Creek, Calif.: AltaMira Press, 2002.
Borg, Ingwer, and Cornelius Zuell, "Write-in Comments in Employee Surveys," lnternational]ournal of Manpower, Vol. 33, No. 2, 2012, pp. 206-220.
Card, David, and Alan B. Krueger, "Minimum Wages and Employment: A Case Study of the Fast-Food Industry in New Jersey and Pennsylvania," American Economic Review, Vol. 84, No. 4, September 1994, pp. 772-793.
Castilla, Emilio J., "Gender, Race, and Meritocracy in Organizational Careers," American journal of Sociology, Vol. 1 13, No. 6, May 2008.
Castilla, Emilio ]., and Stephen Benard, "The Paradox of Meritocracy in Organizations," Administrative Science Quarterly, Vol. 55, No. 4, December 2010.
Code ofFederal Regulations, Title 5, Awards, Part 451 . 104, Federal Register, Vol. 72, No. 7, January 1 1, 2007. As of December 13, 2016: https://www.gpo.gov/fdsys/pkg/FR-2007-0 l-l l /pdf/E7-230.pdf#page= 1
Cohen-Charash, Y., and Paul E. Spector, "The Role of Justice in Organizations: A Meta-Analysis," Organizational Behavior and Human Decision Processes, Vol. 82, No. 2, 2001, pp. 278-321 .
Department of Defense Civilian Acquisition Workforce Personnel Demonstration Project, "Organization Participation Requirements," undated. As of November 16, 2016: http://acqdemo.hci.mil/new_organization.html
Department of Defense Civilian Acquisition Workforce Personnel Demonstration Project, ·�n Employee's Guide to CCAS: Understanding the Contribution-Based Compensation and Appraisal System of the AcqDemo," 201 1 . As of November 16, 2016: http://acqdemo.hci.mil/tools/Employee� Guide_to_ CCAS_201 1 .pdf
Department of Defense Civilian Acquisition Workforce Personnel Demonstration Project, Executive Council Charter, February 28, 2013.
Department of Defense Civilian Acquisition Workforce Personnel Demonstration Project, "HR Elements for Human Resources Professionals," 2014. As of November 16, 2016: http://acqdemo.hci.mil/docs/HRE_HRP _Participant_ Guide. pdf
Department of Defense Civilian Acquisition Workforce Personnel Demonstration Project Expected Contribution Range Calculator, 2016. As of pecember 8, 2016: http://acqdemo.hci.mil/tools.html
215

216 2016 Assessment of the Civilian Acquisition Workforce Personnel Demonstration Project
Department of Defense Civilian Acquisition Workforce Personnel Demonstration Project Program Office, DoD Civilian Acquisition Personnel Workforce Demonstration Project Operating Procedures, May 15, 2003. As of November 16, 2016: http://acqdemo.hci.mil/docs/OP _Proc_with_am.pdf
Department of Defense Civilian Acquisition Workforce Personnel Demonstration Project Program Office, "Transition to DoD Civilian Acquisition Workforce Personnel Demonstration Project (AcqDemo)," Employee Orientation Briefing, Winter/Spring 201 1 .
Department of Defense Civilian Acquisition Workforce Personnel Demonstration Project Program Office, Statement of Requirement, June 1, 2015.
Department of Defense Civilian Acquisition Workforce Personnel Demonstration Project Program Office, "Conversion to DoD Civilian Acquisition Workforce Personnel Demonstration Project (AcqDemo): 2016 Employee Orientation Briefing," 2016.
DiCicco-Bloom, Barbara, and Benjamin F. Crabtree, "The Qualitative Research Interview," Medical Education, Vol. 40, No. 4, 2006, pp. 314-321 .
Drago, Robert, and Gerald Garvey, "Incentives for Helping on the Job: Theory and Evidence," Journal of Labor Economics, Vol. 16, No. l, 1998, pp. 1-25.
Guo, Christopher, Philip Hall-Partyka, and Susan M. Gates, Retention and Promotion of High-Quality Civil Service Workers in the Department of Defense Acquisition Workforce, Santa Monica, Calif.: RAND Corporation, RR-748-0SD, 2014. As of November 27, 2016: http://www.rand.org/pubs/research_reports/RR748.html
Isaac, Joe E., "Performance Related Pay: The Importance of Fairness," The Journal of Industrial Relations, Vol. 43, No. 2, June 2001 , pp. 1 1 1-123.
Kim, Jungin, "Impact of Performance Appraisal Justice on the Effectiveness of Pay-for-Performance Systems After Civil Service Reform," Public Personnel Management, Vol. 45, No. 2, 2016, pp. 148-170.
Kim, Seok Eun, and Dian Rubianty, "Perceived Fairness of Performance Appraisals in the Federal Government: Does It Matter?" Review of Public Personnel Administration, Vol. 31, No. 4, 201 1 , pp. 329-348.
Konovsky, Mary A., "Understanding Procedural Justice and Its Impact on Business Organizations," journal of Management, Vol. 26, No. 3, 2000, pp. 489-511 .
Lawler, Edward E. , Pay and Organiza.tional Effectiveness: A Psychological View, New York, N.Y.: McGraw-Hill, 1971.
Lawler, Edward E., "Using Pay to Motivate Job Performance," in R. M. Steers, and L. W. Porter, eds., Motivation and Work Behavior, New York, N.Y.: McGraw-Hill, 1975, pp. 534-548.
Martinko, Mark J., and William L. Gardner. "Learned Helplessness: An Alternative Explanation for Performance Deficits," Academy of Management Review, Vol. 7, No. 2, 1982, pp. 195-204.
McCaffrey, Daniel F., Greg Ridgeway, and Andrew R. Morral, "Propensity Score Estimation with Boosted Regression for Evaluating Causal Effects in Observational Studies," Psychological Methods, Vol. 9, No. 4, 2004, pp. 403-425.
Merriam-Webster.com, "Barrier," undated. As of November 22, 2016: http://www.merriam-webster.com/dictionary/barrier
Miles, Matthew B., and A. Michael Huberman, Qualitative Data Analysis: An Expanded Sourcebook, Second Edition, Thousand Oaks, Cali£: Sage Publications, 1994.
Mintzberg, Henry, 1he Nature of Managerial Work, New York, N.Y.: Harper and Row, 1973.
OPM-see U.S. Office of Personnel Management.
Pearce, Jone L., William B. Stevenson, and James L. Perry, "Managerial Compensation Based on Organizational Performance: A Time Series Analysis of the Effects of Merit Pay," Academy of Management Journal, Vol. 28, No. 2, 1985, pp. 261-278.
Pfeffer, Jeffrey, "Six Dangerous Myths About Pay," Harvard Business Review, Vol. 76, No. 3, May-June 1998, pp. 109-1 19.

References 217
Poncheri, Reanna M., Jennifer T. Lindberg, Lorrie F. Thompson, and Eric A. Surface, "A Comment on Employee Surveys: Negativity Bias in Open-Ended Responses," Organizational Research Methods, Vol. 1 1 , No. 3 , 2008, pp. 614-630.
Public Law 104-106, National Defense Authorization Act of Fiscal 1996, February 1, 1996. As of December 8, 2016: https://www.gpo.gov/fdsys/pkg/PLA W-104publ 106/html/PLA W-104publl 06.htm
Public Law 105-85, National Defense Authorization Act of Fiscal Year 1998, November 18, 1997. As of December 8, 2016: https://www.gpo.gov/fdsys/pkg/PLA W-105publ85/html/PLA W-105publ85.htm
Romney, A. Kimball, Susan C. Weller, and William H. Batchelder. "Culture as Consensus: A Theory of Culture and Informant Accuracy," American Anthropologist, Vol. 88, No. 2, 1986, pp. 313-338.
Rosenbaum, Paul R., and Donald B. Rubin, "The Central Role of the Propensity Score in Observational Studies for Causal Effects," Biometrika, Vol. 70, No. l, April 1983, pp. 41-55.
Ryan, Gery W., and H. Russell Bernard, "Techniques to Identify Themes," Field Methods, Vol. 15, February 2003, pp. 85-109.
Schay, Brigitte W., "In Search of the Holy Grail: Lessons in Performance Management," Public Personnel Management, Vol. 22, Issue 4, Winter 1993, pp. 649-668.
Schay, Brigitte W., "Summative Evaluation of Personnel Management and Compensation Initiatives," in Titus Galama and James Hosek, eds., Perspectives on U.S. Competitiveness in Sdence and Technology, Santa Monica, Cali£: RAND Corporation, CF-235-0SD, 2007, pp. 121-128. As of November 28, 2016: http://www.rand.org/pubs/conf_proceedings/CF235.html
Schay, Brigitte W., and Sidney F. Fisher, "The Challenge of Making Performance-Based Pay Systems Work in the Public Sector," Public Personnel Management, September 2013, Vol. 42, pp. 359-384.
Simmons, Michael W., Herb A. Escobar, Danielle Dancy, and Robert C. Rue, AcqDemo 2014 Cycle Evaluation Summary Report, SRA International, 2015.
U.S. Assistant Secretary of Defense, "Supplemental Guidance on Award Limitations for the Department of Defense Civilian Employees," memorandum for assistant secretary of the Army, assistant secretary of the Navy, assistant secretary of the Air Force, and director, Administration and Management, Office of the Deputy Chief Management Officer, December 11 , 2014. As of November 28, 2016: https://www.cpms.osd.mil/Content/Documents/DoD _Award_Spendin�Limitations_Fy15. pdf
U.S. Code, Title 5, Section 4302, Establishment of Performance Appraisal Systems, September 30, 2009. As of December 13, 2016: https://www.gpo.gov/fdsys/pkg/USCODE-2008-title5/pdf/ USCO D E-2008-tide5-partllI-subpartC-chap43-subchapI-sec4302.pdf
U.S. Code, Tide 5, Section 4503, Agency Awards, January 16, 1996. As of December 13, 2016: https://www.gpo.gov/fdsys/pkg/USCODE-1995-title5/pdf/ USCO DE-1995-tide5-partlII-subpartC-chap45-subchapI-sec4503.pdf
U.S. Code, Title 5, Section 4505(a), Performance Based Cash Awards, January 3, 2012. As of December 13, 2016: https://www.gpo.gov/fdsys/pkg/USCODE-201 1-tide5/pdf/ USCODE-201 1-tide5-partlII-subpartC-chap45-subchapl-sec4505a.pdf
U.S. Code, Title 10, Section 1732, Selection Criteria and Procedures, February 10, 2010. As of November 17, 2016: https://www.gpo.gov/fdsys/pkg/USCODE-2009-titlelO/pdf/ USCODE-2009-tidelO-subtideA-partlI-chap87-subchapIII-secl732.pdf
U.S. Code, Title 10, Section 1762, Demonstration Project Relating to Certain Acquisition Personnel Management Policies and Procedures, January 201 1, amended 2015. As of November 16, 201 6: https://www.gpo.gov/fdsys/granule/USCODE-2010-titlelO/ USCODE-2010-title 1O-subtideA-partlI-chap87-subchapV-secl762

218 2016 Assessment of the Civilian Acquisition Workforce Personnel Demonstration Project
U.S. Department of Defense Instruction 1400.25, Vol. 45, "Civilian Personnel Management System: Awards," November 4, 2013. As of November 16, 2016: http://www.dtic.mil/whs/directives/corres/pdf/140025 _ vol451 . pdf
U.S. Department of Defense Instruction 1400.25, Vol. 536, "DoD Civilian Personnel Management System: Grade and Pay Retention," June 28, 2006. As of November 16, 2016: http://www.dtic.mil/whs/directives/corres/pdf/1400.25 .V536. pdf
U.S. Department of Defense, Assistant Secretary of Defense, "Supplemental Guidance on Award Limitations for Department of Defense Civilian Employees," memorandum, December 1 1 , 2014. As of December 13, 2016: https://www.cpms.osd.mil/Content/Documents/OoD_A�ard_Spending_Limitations_Fy15.pdf
U.S. Department of Defense, Office of the Under Secretary of Defense, "AcqDemo Memorandum (AM) 13-02-Release of Aggregate Appraisal Feedback to the AcqDemo Workforce," memorandum, Washington, D.C., February 19, 2013. As of December 13, 2016: http://acqdemo.hci.mil/docs/AM_13_02.pdf
U.S. House of Representatives, Mom. Apple Pie, and Working for America: Accountability and Rewards for the Federal Workforce, Hearing Before the Subcommittee on the Federal Workforce and Agency Organization of the Committee on Government Reform, First Session, Washington, D.C.: U.S. Government Printing Office, October 5, 2005, p. 55.
U.S. Merit Systems Protection Board, Federal Personnel Research Programs and Demonstration Projects: Catalysts for Change, Washington, D.C., December 1992. As of November 28, 2016: http://www.mspb.gov/MSPBSEARCH/viewdocs.aspx?docnumber=817994&version=821 190&application=AC RO BAT
U.S. Office of Management & Budget and Office of Personnel Management, Guidance on Awards for Fiscal Year 2014 (M-14-02), memorandum for heads of executive departments and agencies, November 1, 2013. As of November 28, 2016: https://www.whicehouse.gov/sices/defaulc/files/omb/memoranda/2014/m-14-02.pdf
U.S. Office of Personnel Management, "Notice of Approval of a Demonstration Project Final Plan," Federal Register, Vol. 64, No. 5, January 8, 1999, pp. 1426-1492. As of November 16, 2016: https://www.gpo.gov/fdsys/granule/FR-l 999-01-08/99-79
U.S. Office of Personnel Management, Incentives and Employee Recognition Guide, September 2005. As of November 17, 2016: https://www.opm.gov/policy-data-oversight/human-capital-management/reference-materials/ talent-management/incentivesrecognition.pdf
U.S. Office of Personnel Management, "Notice of Amendments co the Project Plan for the Department of Defense (DoD) Civilian Acquisition Workforce Personnel Demonstration Project (AcqDemo)," Federal Register, Vol. 80, No. 61, March 31, 2015. As of November 16, 2016: http://acqdemo.hci.mil/docs/FR_Amendment_31 Mar2015.pdf
U.S. Office of Personnel Management, Delegated Examining Operations Handbook: A Guide for Federal Agency Examining Offices, May 2007, As of November 16, 2016: https://www.opm.gov/policy-data-oversight/hiring-information/competitive-hiring/deo_handbook.pdf
Werber, Laura, Lindsay Daugherty, Edward G. Keating, and Matthew Hoover, An Assessment of the Civilian Acquisition Workforce Personnel Demonstration Project, Santa Monica, Cali£: RAND Corporation, TR-1286-0SD, 2012. As of November 28, 2016: http://www.rand.org/pubs/technical_reports/TR1286.html
The White House, "Improving the Federal Recruitment and Hiring Process," Office of the Press Secretary, presidential memorandum, May 2010. As of November 28, 2016: https://www.whitehouse.gov/the-press-office/ presidential-memorandum-improving-federal-recruitment-and-hiring-process