2016 ANNUAL WASTEWATER TREATMENT SYSTEM SUMMARY REPORT ... Repor… · 2016 ANNUAL WASTEWATER...
70
Drumbo Wastewater Treatment Plant | D1 2016 ANNUAL WASTEWATER TREATMENT SYSTEM SUMMARY REPORT Drumbo Wastewater Treatment Plant 1. General Information Oxford County prepares individual annual reports summarizing each wastewater treatment plant’s operation and treated effluent discharge quality for the nine wastewater treatment plants it owns and operates. The reports detail the latest quality testing results and quantity statistics and any non-compliance conditions that may have occurred. They are available for review by the end of February on the internet at www.oxfordcounty.ca/Services- for-You/Water-Wastewater/Wastewater/Annual-reports or by contacting the Public Works Department. All efforts have been made to ensure the information presented in this report is as accurate as possible. If you have any questions or comments concerning the report, please contact the County of Oxford at the address and phone number listed below or by email at [email protected]. Wastewater Treatment Plant: Drumbo Wastewater Treatment Plant Wastewater Treatment Plant Number: 120002479 Wastewater Treatment Plant Owner & Contact Information: Oxford County Public Works Department Environmental Services (Wastewater) P.O. Box 1614, 21 Reeve Street Woodstock, ON N4S 7Y3 Telephone: 519-539-9800 | Toll Free: 866-537-7778 Reporting Period: January 1, 2016 – December 31, 2016 1.1. System Description The Drumbo Sequencing Batch Reactor (SBR) provided effective wastewater treatment in 2016 with an average plant flow of 252 m 3 /d, which represents 84% of the design capacity of 300 m 3 /d. The total flow in 2016 was 92,086 m 3 . The Drumbo WWTP rated capacity was increased from 272 m 3 /d to 300 m 3 /d as reflected in the amended Environmental Compliance Approval (ECA) issued by MOECC in February 2015. The wastewater treatment plant is located at 93 Peterson Street, Drumbo, Ontario. The Facility description is provided below. Facility Drumbo Wastewater Treatment Plant Design Capacity 300 m 3 /d (re-rated February 2015) 2016 Average Daily Flow 252 m 3 /d 2016 Maximum Daily Flow 729 m 3 /d 2016 Total Volume of Wastewater 92,086 m 3 /year Classification WWT – II Environmental Compliance Approval (ECA) #8752-9Q4H96 (February 9, 2015)
Transcript of 2016 ANNUAL WASTEWATER TREATMENT SYSTEM SUMMARY REPORT ... Repor… · 2016 ANNUAL WASTEWATER...

Drumbo Wastewater Treatment Plant | D1
2016 ANNUAL WASTEWATER TREATMENT SYSTEM SUMMARY REPORT
Drumbo Wastewater Treatment Plant
1. General Information
Oxford County prepares individual annual reports summarizing each wastewater treatment plant’s operation and treated effluent discharge quality for the nine wastewater treatment plants it owns and operates. The reports detail the latest quality testing results and quantity statistics and any non-compliance conditions that may have occurred. They are available for review by the end of February on the internet at www.oxfordcounty.ca/Services-for-You/Water-Wastewater/Wastewater/Annual-reports or by contacting the Public Works Department.
All efforts have been made to ensure the information presented in this report is as accurate as possible. If you have any questions or comments concerning the report, please contact the County of Oxford at the address and phone number listed below or by email at [email protected].
Wastewater Treatment Plant: Drumbo Wastewater Treatment Plant Wastewater Treatment Plant Number: 120002479
Wastewater Treatment Plant Owner & Contact Information:
Oxford County Public Works Department Environmental Services (Wastewater) P.O. Box 1614, 21 Reeve Street Woodstock, ON N4S 7Y3 Telephone: 519-539-9800 | Toll Free: 866-537-7778
Reporting Period: January 1, 2016 – December 31, 2016
1.1. System Description
The Drumbo Sequencing Batch Reactor (SBR) provided effective wastewater treatment in 2016 with an average plant flow of 252 m3/d, which represents 84% of the design capacity of 300 m3/d. The total flow in 2016 was 92,086 m3. The Drumbo WWTP rated capacity was increased from 272 m3/d to 300 m3/d as reflected in the amended Environmental Compliance Approval (ECA) issued by MOECC in February 2015.
The wastewater treatment plant is located at 93 Peterson Street, Drumbo, Ontario. The Facility description is provided below.
Facility Drumbo Wastewater Treatment Plant
Design Capacity 300 m3/d (re-rated February 2015)
2016 Average Daily Flow 252 m3/d
2016 Maximum Daily Flow 729 m3/d
2016 Total Volume of Wastewater 92,086 m3/year
Classification WWT – II
Environmental Compliance Approval (ECA) #8752-9Q4H96 (February 9, 2015)
Drumbo Wastewater Treatment Plant | D2
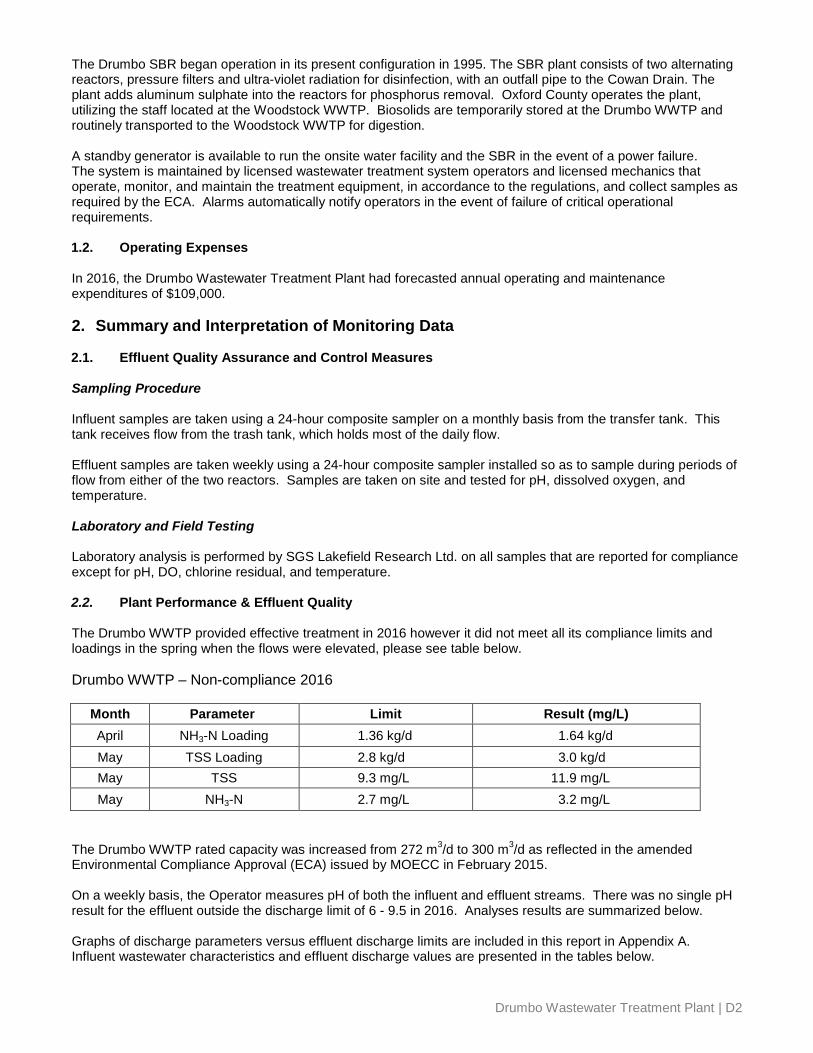
The Drumbo SBR began operation in its present configuration in 1995. The SBR plant consists of two alternating reactors, pressure filters and ultra-violet radiation for disinfection, with an outfall pipe to the Cowan Drain. The plant adds aluminum sulphate into the reactors for phosphorus removal. Oxford County operates the plant, utilizing the staff located at the Woodstock WWTP. Biosolids are temporarily stored at the Drumbo WWTP and routinely transported to the Woodstock WWTP for digestion. A standby generator is available to run the onsite water facility and the SBR in the event of a power failure. The system is maintained by licensed wastewater treatment system operators and licensed mechanics that operate, monitor, and maintain the treatment equipment, in accordance to the regulations, and collect samples as required by the ECA. Alarms automatically notify operators in the event of failure of critical operational requirements. 1.2. Operating Expenses In 2016, the Drumbo Wastewater Treatment Plant had forecasted annual operating and maintenance expenditures of $109,000. 2. Summary and Interpretation of Monitoring Data 2.1. Effluent Quality Assurance and Control Measures Sampling Procedure Influent samples are taken using a 24-hour composite sampler on a monthly basis from the transfer tank. This tank receives flow from the trash tank, which holds most of the daily flow. Effluent samples are taken weekly using a 24-hour composite sampler installed so as to sample during periods of flow from either of the two reactors. Samples are taken on site and tested for pH, dissolved oxygen, and temperature. Laboratory and Field Testing Laboratory analysis is performed by SGS Lakefield Research Ltd. on all samples that are reported for compliance except for pH, DO, chlorine residual, and temperature. 2.2. Plant Performance & Effluent Quality The Drumbo WWTP provided effective treatment in 2016 however it did not meet all its compliance limits and loadings in the spring when the flows were elevated, please see table below. Drumbo WWTP – Non-compliance 2016
Month Parameter Limit Result (mg/L) April NH3-N Loading 1.36 kg/d 1.64 kg/d May TSS Loading 2.8 kg/d 3.0 kg/d May TSS 9.3 mg/L 11.9 mg/L May NH3-N 2.7 mg/L 3.2 mg/L
The Drumbo WWTP rated capacity was increased from 272 m3/d to 300 m3/d as reflected in the amended Environmental Compliance Approval (ECA) issued by MOECC in February 2015. On a weekly basis, the Operator measures pH of both the influent and effluent streams. There was no single pH result for the effluent outside the discharge limit of 6 - 9.5 in 2016. Analyses results are summarized below. Graphs of discharge parameters versus effluent discharge limits are included in this report in Appendix A. Influent wastewater characteristics and effluent discharge values are presented in the tables below.

Drumbo Wastewater Treatment Plant | D3
Influent Wastewater Characteristics
Parameter Concentration mg/L Loading kg/d
BOD5 121 31
Total Suspended Solids 69 17
Total Phosphorus 3 1
Total Kjeldahl Nitrogen 32 8
Effluent Parameter
Sample Frequency
ECA Effluent Limit (Monthly Average) (milligram per liter unless
otherwise indicated)
Monthly Average Result Min-Max
(milligram per liter unless otherwise
indicated) Percentage
Removal CBOD5 weekly 9.3 2 – 6 94.3 - 98.1
Total Suspended Solids weekly 9.3 2.2 – 11.9 82.7 - 96.8
Total Phosphorus weekly 0.46 0.1 - 0.3 90 – 96.7
Total Ammonia Nitrogen (May 1 to October 31)
weekly 2.7 0.5 – 3.2 --
Total Ammonia Nitrogen (Nov. 1 to April 30)
weekly 4.5 0.6 – 4.1 --
E.coli weekly 200 organisms/100 mL
(monthly Geometric Mean Density)
1 - 5 --
DO weekly 5.0 or higher 6.7 - 9.0 --
pH any single sample weekly 6.0 - 9.5 6.9 - 8.2 --
2.3. Effluent Objectives Objectives are non-enforceable effluent quality values which the owner is obligated to use best efforts to strive towards achieving on an ongoing basis. These objectives (summarized below) are to be used as a mechanism to trigger corrective action proactively, and voluntarily before environmental impairment occurs and before the compliance limits are exceeded. The following table presents the range of effluent discharge values vs. ECA Objectives.
Effluent Parameter
Sample Frequency
Monthly Average Objective Concentration
(milligram per liter unless otherwise indicated)
Monthly Average Result Min-Max
(milligram per liter unless otherwise indicated)
CBOD5 weekly 4.7 2 - 6
Total Suspended Solids weekly 4.7 2.2 – 11.9
Total Phosphorus weekly 0.27 0.1 - 0.3
Total Ammonia Nitrogen (May 1 to October 31)
weekly 1.8 0.5 - 3.2

Drumbo Wastewater Treatment Plant | D4
Total Ammonia Nitrogen (Nov. 1 to April 30)
weekly 3.6 0.6 – 4.1
E.coli weekly 150 organisms/100 mL (monthly Geometric Mean Density) 1 - 5
DO weekly 6 or higher 6.7 – 9.0
pH any single sample weekly 6.5 - 8.5 6.9 - 8.2
Drumbo SBR objective exceedances in 2016 included the following:
Month Parameter Objective (mg/L) Result (mg/L) January TSS 4.7 5.0 February INF. FLOW 300 m3/d 303.0 CBOD5 4.7 5.3 March INF. FLOW 300 m3/d 366.0 April INF. FLOW 300 m3/d 401.0 CBOD5 4.7 5.0 NH3-N 3.6 4.1 May CBOD5 4.7 6.0 TSS 4.7 11.9 NH3-N 1.8 3.2 TP 0.27 0.3 June TSS 4.7 7.8 NH3-N 1.8 1.9 TP 0.27 0.3 July TSS 4.7 5.8 August TSS 4.7 6.0 September TSS 4.7 7.0 NH3-N 1.8 1.9 October NH3-N 1.8 2.3 December TSS 4.7 6.0
External engineering consultants are currently working with Oxford County wastewater treatment operations staff for developing an optimization plan for the Drumbo WWTP to try to meet effluent objectives going forward. In addition, a Class Environmental Assessment (Class EA) is currently underway to investigate potential upgrade alternatives for the Drumbo WWTP to meet future wastewater treatment requirements for the community. To date, Oxford County has re-rated the WWTP from 272 m3/day to 300 m3/day as an interim measure to ensure that wastewater flows do not exceed the rated capacity of the plant. This was approved by MOECC. The new ECA includes more stringent effluent discharge limits and objectives in order to maintain similar loadings to the receiving stream. In addition, the following steps have been completed:
• A review of Unit Processes at the Drumbo WWTP has been completed that has determined that the plant could potentially be re-rated further to as high as 350 m3/day by implementing some process improvements, equipment upgrades, and minor construction works (Schedule C - Class EA).

Drumbo Wastewater Treatment Plant | D5
• A background study and stream sampling has been completed on the receiving stream, the Cowan Drain, to support an assimilative capacity analysis for the increased effluent flows and loadings from the upgraded Drumbo WWTP.
• An investigation of the sanitary sewer collection system and a review of the influent flows to the Drumbo WWTP have been completed. Minor improvements to the flow monitoring equipment were completed as a result of this exercise.
• Future Flows and Loadings have also been calculated, confirmed, and summarized.
• There is a Class EA study currently in progress related to servicing Drumbo and the neighbouring Princeton community.
3. Overflows, Bypassing, Upsets, Spills, and Abnormal Conditions
On March 25, 2016 there was an overflow of approximately 0.7 m3 of wastewater from the Drumbo Main sewage pumping station. This was due to a power outage affecting all three of the sewage pumping stations in Drumbo. A mobile generator was being rotated to each of the three sites however a small amount of sewage overflowed prior to full power being restored to the area. This event was reported to the MOECC at the time it occurred. 4. Maintenance of Works
The operating and maintenance staff at the Woodstock WWTP conducts regularly scheduled maintenance of the plant equipment. The Plant utilizes a database system known as City Works to issue work orders and maintain records for regular maintenance and repair at the wastewater treatment facility. 5. Monitoring Equipment Maintenance and Calibration
Calibration of flow meters is conducted yearly by Flowmetrics Technical Services Inc. The records are kept on-site at the Plant. Operational monitoring equipment calibration records are kept on-site at the Plant. 6. Biosolids 2016 Discussion: Co-thickened primary sludge is transported to Woodstock WWTP and dumped into the grit tank for treatment at that facility. 7. Result of MOECC 2016 Audit covering March 2011 to March 2016
Non-compliance with regulatory requirements and actions required
I. Over the Course of this Inspection Period March 2011 to March 2016, one month, April 2014 had an average monthly result in non-compliance for Total Ammonia Nitrogen with a result of 4.25 mg/L which was reported at the time. Action Required:
a. Owner shall use best efforts to ensure the Total Ammonia Nitrogen is less than the prescribed limits in the ECA.
II. A Municipal Wastewater System Profile Information Form is required within 30 days of a new Approval
(February 9, 2015). This form was not submitted. Action Required:
a. Form must be completed by April 30, 2016. (Form submitted April 25, 2016.)

Drumbo Wastewater Treatment Plant | D6
III. There were a handful of logbook entries not initialed over the 5 year period and some check sheets without initials or times recorded. Action Required:
a. From herein logbooks/logsheets must meet the requirements of Ontario regulation 129/04.
IV. Operations and Maintenance manual did not meet the requirements of the ECA. Action Required:
a. Make amendments and submit updated manual by December 31, 2016. (O&M Manual Submitted December 21, 2016 to MOECC.)
Summary of Recommendations and Best Practices
I. The Owner was not in conformance with the designed rated capacity for average daily flow into the works. Recommend:
a. EA is underway to explore alternatives to upgrade the works and meet the future needs of the community.
II. The effluent sampling results did not meet the effluent objectives stated in the ECA.
Recommend:
a. From herein the owner shall use best efforts to conform to the effluent objectives. 8. Summary The Drumbo WWTP operated most of the year within its design flow criteria and met most of the effluent discharge quality limits in 2016. A Class Environmental Assessment (Class EA) is currently underway to investigate potential alternatives to upgrade the Drumbo WWTP and meet future wastewater treatment requirements for the community.

Drumbo Wastewater Treatment Plant | D7
APPENDIX A: GRAPHS OF 2016 DISCHARGE PARAMETERS VS. EFFLUENT DISCHARGE LIMITS
270
303
366
401
251
217 198 193 190 197 200
237
0
50
100
150
200
250
300
350
400
450
Jan. Feb. Mar. Apr. May June July Aug. Sept. Oct. Nov. Dec.
Cubi
c M
eter
s per
Day
Month
Monthly Average Daily Flow
Average Day Design
Re-rated Flow Criteria
Drumbo WWTP Monthly Average Daily Flow in Cubic Meters per Day, 2016

Drumbo Wastewater Treatment Plant | D8
0.0
50.0
100.0
150.0
200.0
Jan. Feb. Mar. Apr. May June July Aug. Sept. Oct. Nov. Dec.
Efflu
ent E
.Col
i (#/
100
mL)
Month
Drumbo WWTP Effluent Monthly Geometric Mean Density E.Coli - 2016
E.Coli (#/100 mL)
Criteria (#/100 mL)
0.0
0.1
0.2
0.3
0.4
0.5
0.6
0.7
0.8
0.9
1.0
Jan. Feb. Mar. Apr. May June July Aug. Sept. Oct. Nov. Dec.
Efflu
ent T
P (m
g/L)
Month
Drumbo WWTP Effluent, Monthly AverageTP (mg/L), 2016
Total P (mg/L)
CriteriaRe-rated Criteria

Drumbo Wastewater Treatment Plant | D9
0
1
1
2
2
3
3
4
4
5
5
Jan. Feb. Mar. Apr. May June July Aug. Sept. Oct. Nov. Dec.
Efflu
ent A
mm
onia
(mg/
L)
Month
Drumbo WWTP Effluent Monthly Average Ammonia (mg/L), 2016
AMMONIA (mg/L)
Criteria Winter
Criteria Summer
Re-rated Criteria
Re-rated Criteria
Re-rated Criteria
0
5
10
15
20
Jan. Feb. Mar. Apr. May June July Aug. Sept. Oct. Nov. Dec.
Efflu
ent T
SS (m
g/L)
Month
Drumbo WWTP Effluent, Monthly Average TSS (mg/L), 2016
TSS (mg/L)
Criteria
Re-rated Criteria

Ingersoll Wastewater Treatment Plant | I1
2016 ANNUAL WASTEWATER TREATMENT SYSTEM SUMMARY REPORT
Ingersoll Wastewater Treatment Plant
1. General Information Oxford County prepares individual annual reports summarizing each wastewater treatment plant’s operation and treated effluent discharge quality for the nine wastewater treatment plants it owns and operates. The reports detail the latest quality testing results and quantity statistics and any non-compliance conditions that may have occurred. They are available for review by the end of February on the internet at www.oxfordcounty.ca/Services-for-You/Water-Wastewater/Wastewater/Annual-reports or by contacting the Public Works Department. All efforts have been made to ensure the information presented in this report is as accurate as possible. If you have any questions or comments concerning the report, please contact the County of Oxford at the address and phone number listed below or by email at [email protected]. Wastewater Treatment Plant: Ingersoll Wastewater Treatment Plant (WWTP) Wastewater Treatment Plant Number: 110003969
Wastewater Treatment Plant Owner & Contact Information:
Oxford County Public Works Department Environmental Services (Wastewater) P.O. Box 1614, 21 Reeve Street Woodstock ON N4S 7Y3 Telephone: 519-539-9800 | Toll Free: 866-537-7778
Reporting Period: January 1, 2016 – December 31, 2016 1.1. System Description The Ingersoll WWTP provides wastewater treatment for residential, commercial, and industrial users in the Town of Ingersoll. It also provides treatment for septic tank waste, hauled waste, holding tank waste, and landfill leachate from within Oxford County The wastewater treatment plant is located at 56 McKeand St., Ingersoll, Ontario. The Facility description is provided below.
Facility Ingersoll Wastewater Treatment Plant
Design Capacity 10,230 m3/d
2016 Average Daily Flow 7,431 m3/d
2016 Maximum Daily Flow 29,336 m3/d
2016 Total Volume of Wastewater 2,717,648 m3/year
2016 Total Received Hauled Waste 12,690 m3/year (leachate only)
Classification WWT – III
Environmental Compliance Approval (ECA) #1614-A28P9L

Ingersoll Wastewater Treatment Plant | I2
The Old and New Plants within the Ingersoll WWTP began operation in 1947 and 1974, respectively. In late August 2015, the 1947 Plant was taken out of service and emptied out as it is being replaced as part of a major upgrade project. The two facilities are conventional activated sludge plants consisting of primary and secondary treatment; both plants share the same ultraviolet light disinfection system and a combined single discharge point. The facility adds aluminum sulphate into the reactors for total phosphorus reduction. The plant utilizes anaerobic digestion followed by dewatering of the biosolids to produce stabilized biosolids. The biosolids are then transported to dedicated offsite storage prior to beneficial reuse on agricultural land. Ingersoll WWTP was under construction in 2016. Under Contract A, completed in the fall of 2015, the 1974 Plant’s secondary clarifiers were expanded to provide treatment capability through the demolition and re-construction of the 1947 plant (Contract B). Contract B was initiated before the end of 2015. The average flow of 7,431 m3/d represents 72.6% of the design capacity of 10,230 m3/d. The total volume treated in 2016 was 2,717,648 m3. A standby generator is available to run the onsite Ingersoll Main Lift Station in the event of a power failure. The system is maintained by licensed wastewater system operators and licensed mechanics that operate, monitor, and maintain the treatment equipment, in accordance to the regulations, and collect samples as required by the ECA. Alarms automatically notify operators in the event of failure of critical operational requirements. 1.2. Operating Expenses In 2016 the Ingersoll Wastewater Treatment Plant had forecasted operating and maintenance expenditures of $798,000. 2. Summary and Interpretation of Monitoring Data 2.1. Effluent Quality Assurance and Control Measures Sampling Procedure Influent samples are collected monthly and effluent samples are collected weekly using a composite sampler over a 24-hour period. Raw sewage samples are collected at the main lift station located on-site; the sample is drawn after the lift station pumps and prior to the primary tanks of either plant. Effluent is sampled directly from the combined flow after it leaves the UV disinfection system prior to final discharge and comprises the final treated effluent sample for the entire facility. Laboratory and Field Testing Laboratory analysis is performed by SGS Lakefield Research Ltd. on all samples that are reported for compliance except for pH, DO, and temperature which are field collected. All in-house testing is done for process control, the results of which are not included in this report. 2.2. Plant Performance & Effluent Quality The Ingersoll WWTP provided effective treatment in 2016 meeting all its regulatory limits for all parameters in the Plant effluent discharged to the Thames River. Approximately four times a week, the operator measures pH of both the influent and effluent streams. There was no single pH result for the effluent outside the discharge limit of 6.0 - 9.5 in 2016.

Ingersoll Wastewater Treatment Plant | I3
Graphs of discharge parameters versus effluent discharge limits are included in this report in Appendix A. Influent wastewater characteristics and effluent discharge values are presented in the tables below.
Influent Wastewater Characteristics
Parameter Concentration mg/L Loading kg/d
BOD5 112 832
Total Suspended Solids 129 959
Total Phosphorus 2.3 17
Total Kjeldahl Nitrogen 19 141
Effluent Parameter
Sample Frequency
ECA Effluent Limit (Monthly Average) (milligram per liter unless
otherwise indicated)
Monthly Average Result Min-Max
(milligram per liter unless otherwise indicated)
Percentage Removal
CBOD5 weekly 25 4.4 – 8.0 92.9 – 96.1
Total Suspended Solids
weekly 25 6.6 – 10.0 92.2 – 94.9
Total Phosphorus weekly 1 0.30 - 0.47 79.6 – 87.0
pH any single sample weekly 6.0 - 9.5 6.94 - 7.82 --
E.coli Weekly 200
organisms/100 mL (Monthly Geometric Mean
Density) 0.01 – 4.52 --
2.3. Effluent Objectives Objectives are non-enforceable effluent quality values which the owner is obligated to use best efforts to strive towards achieving on an ongoing basis. These objectives are to be used as a mechanism to trigger corrective action proactively, and voluntarily before environmental impairment occurs and before the compliance limits are exceeded. All effluent discharge objectives listed in the Plant’s ECA were met at the Ingersoll WWTP in 2016 with the exception of a single sample high Total Suspended Solids value of 16 mg/L on July 27, 2016 the objective is set at 15 mg/L. The average monthly TSS for July was 10 mg/L. The following table presents the range of effluent discharge values vs. ECA Objectives.
Effluent Parameter
Sample Frequency
Monthly Average Objective Concentration
(milligram per liter unless otherwise indicated)
Monthly Average Result Min-Max
(milligram per liter unless otherwise indicated)
CBOD5 weekly 15 4.4 – 8.0
Total Suspended Solids
weekly 15 6.6 – 10.0
Total Phosphorus weekly 0.75 0.30 - 0.47
pH any single sample weekly 6.5-9.0 6.94 - 7.82
E.coli weekly 100 organisms/100 mL (Monthly Geometric Mean Density) 0.01 - 4.52

Ingersoll Wastewater Treatment Plant | I4
3. Overflows, Bypassing, Upsets, Spills, and Abnormal Conditions There was a spill during construction on April 5, 2016 of digested sludge of approximately half a cubic meter. The pipes coupling came apart during construction, the spilt material was put back into the process tanks and contractor repaired the broken line. There was a second spill on July 26, 2016 from the same location but this time 2 m3 was spilt. A vacuum truck was used to take the material to the onsite drying beds for future disposal. The MOECC was notified verbally and a written report submitted for both events. On February 7, 2016 a leak of approximately 30 m3 of wastewater was discovered from the forcemain that connects the 401 Eastbound Service Centre to the Ingersoll sewer system. The leak was due to a faulty air release valve that allowed sewage to escape for approximately 3-4 days. Vacuum trucks were called in immediately and the affected area was cleaned up on February 7, 2016 and February 8, 2016. Crash trucks were also called in to protect the workers in the vicinity of the 401. This event was reported to the MOECC at the time it occurred. 4. Maintenance of Works
The operating and maintenance staff at the Ingersoll WWTP conducts regularly scheduled maintenance of the plant equipment. The Plant utilizes a database system known as City Works to issue work orders and maintain records for regular maintenance and repair at the treatment facility. 5. Monitoring Equipment Maintenance and Calibration Calibration of flow meters is conducted yearly by Flowmetrics Technical Services. The records are kept on-site at the Plant. Operational monitoring equipment calibration records are kept on-site at the Plant. 6. Biosolids 2016 Discussion: Biosolids are anaerobically digested and dewatered at the Ingersoll WWTP using an Alfa-Laval Centrifuge. The biosolids are then stored at the Oxford County Biosolids Centralized Storage Facility (BCSF) prior to land application. The sampling results and land application details are summarized in a separate Biosolids Annual report, available at: www.oxfordcounty.ca/Services-for-You/Water-Wastewater/Wastewater/Annual-reports 7. Result of MOECC 2016 Audit covering December 18, 2012 to February 04, 2016
Non-compliance with regulatory requirements and actions required
I. Over the Course of this Inspection period December 18, 2012 to February 04, 2016 there were multiple ECAs for the WWTP applicable at specific times over the course of the inspection period. March 2014 to March 2015 weekly sampling was not conducted but then was conducted thereafter as prescribed by various ECA’s. Action Required:
a. No further action required. Owner identified sampling issue and modified sampling program.
II. The owner did not collect samples from spills from the Carnegie Street Pump Station Action Required:
a. No further action required, owner implemented a protocol to sample overflows when possible as of 2013.
Ingersoll Wastewater Treatment Plant | I5
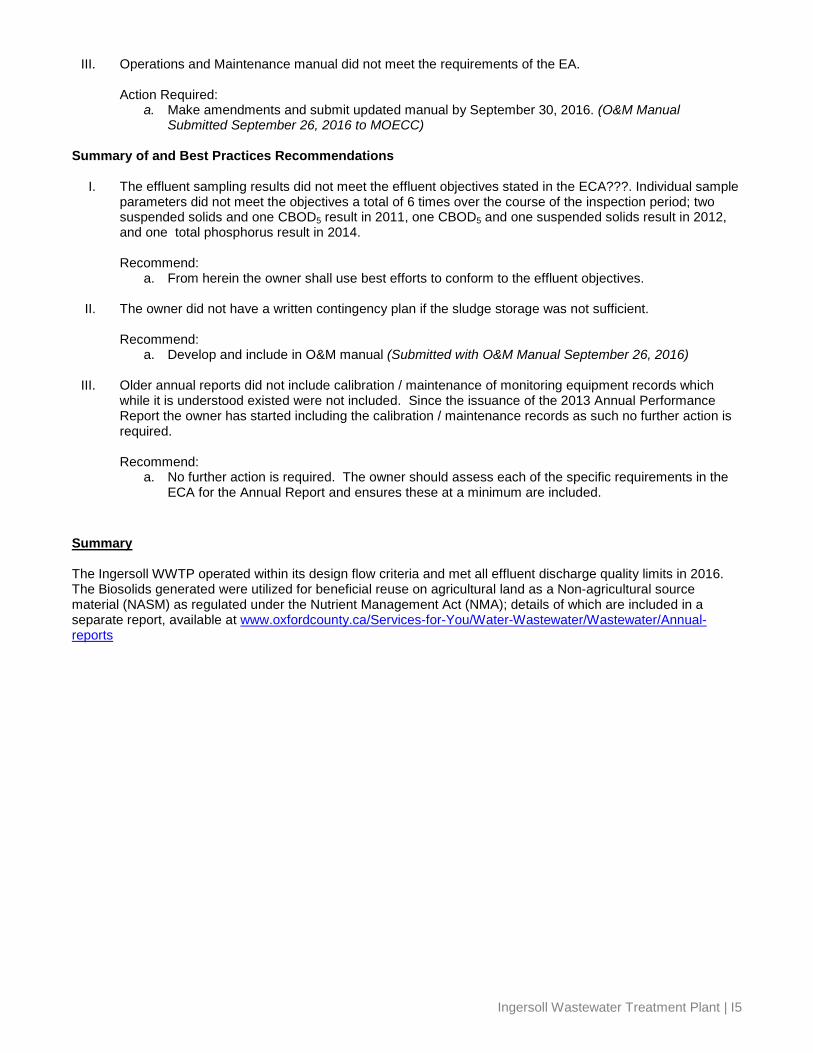
III. Operations and Maintenance manual did not meet the requirements of the EA. Action Required:
a. Make amendments and submit updated manual by September 30, 2016. (O&M Manual Submitted September 26, 2016 to MOECC)
Summary of and Best Practices Recommendations
I. The effluent sampling results did not meet the effluent objectives stated in the ECA???. Individual sample
parameters did not meet the objectives a total of 6 times over the course of the inspection period; two suspended solids and one CBOD5 result in 2011, one CBOD5 and one suspended solids result in 2012, and one total phosphorus result in 2014. Recommend:
a. From herein the owner shall use best efforts to conform to the effluent objectives.
II. The owner did not have a written contingency plan if the sludge storage was not sufficient. Recommend:
a. Develop and include in O&M manual (Submitted with O&M Manual September 26, 2016)
III. Older annual reports did not include calibration / maintenance of monitoring equipment records which while it is understood existed were not included. Since the issuance of the 2013 Annual Performance Report the owner has started including the calibration / maintenance records as such no further action is required. Recommend:
a. No further action is required. The owner should assess each of the specific requirements in the ECA for the Annual Report and ensures these at a minimum are included.
Summary The Ingersoll WWTP operated within its design flow criteria and met all effluent discharge quality limits in 2016. The Biosolids generated were utilized for beneficial reuse on agricultural land as a Non-agricultural source material (NASM) as regulated under the Nutrient Management Act (NMA); details of which are included in a separate report, available at www.oxfordcounty.ca/Services-for-You/Water-Wastewater/Wastewater/Annual-reports

Ingersoll Wastewater Treatment Plant | I6
APPENDIX A: GRAPHS OF 2016 DISCHARGE PARAMETERS VS. EFFLUENT DISCHARGE LIMITS
6968 7709
9402
11781
7611
6832
5776
6879 6230 6131
6548 7309
0
2000
4000
6000
8000
10000
12000
14000
Jan Feb Mar Apr May Jun Jul Aug Sep Oct Nov Dec
Efflu
ent F
low
Cub
ic m
eter
s pe
r day
Month
Ingersoll WWTP Effluent Flow Cubic Meters Per Day 2016
Flow (m3/d) (Combined)
Plant Capacity 10,230 m3
5.8 7.3 7.0
4.8 6.0
8.0 6.8
4.4 5.0
7.5 7.8 7.2
0
5
10
15
20
25
30
Jan Feb Mar Apr May Jun Jul Aug Sep Oct Nov Dec
Efflu
ent C
BO
D5 (
mg/
L)
Month
Ingersoll WWTP Effluent, Monthly Average CBOD5 - 2016
CBOD5 (mg/L)
Criteria
Design Flow 10,230 m3/d
Criteria 25 (mg/L)

Ingersoll Wastewater Treatment Plant | I7
9.3 9.5 9.2 7.3 6.8
9.8 10.0 8.4 7.8
9.5
6.6 8.0
0
5
10
15
20
25
30
Jan Feb Mar Apr May Jun Jul Aug Sep Oct Nov Dec
Efflu
ent T
SS (m
g/L)
Month
Ingersoll WWTP Effluent , Monthly AverageTSS - 2016
TSS (mg/L)
Criteria
0.3
0.5 0.4
0.3
0.4 0.4 0.4 0.4 0.3
0.5
0.3 0.4
0.0
0.2
0.4
0.6
0.8
1.0
1.2
Jan Feb Mar Apr May Jun Jul Aug Sep Oct Nov Dec
Efflu
ent T
P (m
g/L)
Month
Ingersoll WWTP Effluent , Monthly AverageTP - 2016
Total P (mg/L)
Criteria
Criteria 25 (mg/L)
Criteria 1 (mg/L)

Ingersoll Wastewater Treatment Plant | I8
1.4 2.8 0.0 0.1 2.0 4.5 0
50
100
150
200
250
Jan Feb Mar Apr May Jun Jul Aug Sep Oct Nov Dec
Efflu
ent E
. Col
i (#/
100
mL)
Month
Ingersoll WWTP Effluent , Monthly Geometric Mean Density E. Coli (#/100 mL), 2016
E.Coli (#/100 mL)
Criteria
Criteria 200 (#/100 mL)

Mount Elgin Wastewater Treatment Plant | ME1
2016 ANNUAL WASTEWATER TREATMENT SYSTEM SUMMARY REPORT
Mount Elgin Wastewater Treatment Plant
1. General Information Oxford County prepares individual annual reports summarizing each wastewater treatment plant’s operation and treated effluent discharge quality for the nine wastewater treatment plants it owns and operates. The reports detail the latest quality testing results and quantity statistics and any non-compliance conditions that may have occurred. They are available for review by the end of February on the internet at www.oxfordcounty.ca/Services-for-You/Water-Wastewater/Wastewater/Annual-reports or by contacting the Public Works Department. All efforts have been made to ensure the information presented in this report is as accurate as possible. If you have any questions or comments concerning the report, please contact the County of Oxford at the address and phone number listed below or by email at [email protected]. Wastewater Treatment Plant: Mount Elgin Wastewater Treatment Plant Wastewater Treatment Plant Number: 20002870
Wastewater Treatment Plant Owner & Contact Information:
Oxford County Public Works Department Environmental Services (Wastewater) P.O. Box 1614, 21 Reeve Street Woodstock, ON N4S 7Y3 Telephone: 519-539-9800 | Toll Free: 866-537-7778
Reporting Period: January 1, 2016 – December 31, 2016 1.1. System Description The Mount Elgin Wastewater Treatment Plant (WWTP) provided effective wastewater treatment in 2016. The average daily flow for 2016 was 51 m3/d. This represents 26.8 % of the design criteria of 190.5 m3/d. The wastewater treatment plant is located at 324021 Mount Elgin Road, Township of South-West Oxford. The Facility description is provided below.
Facility Mount Elgin Wastewater Treatment Plant
Design Capacity 190.5 m3/d
2016 Average Daily Flow 51 m3/d
2016 Maximum Daily Flow 108 m3/d
2016 Total Volume of Wastewater 18,601 m3/year
Classification un-classified
Environmental Compliance Approval (ECA) #0611-6Q3JQL The Mount Elgin wastewater treatment system was expanded in 2015 to include two phases of the potentially four phases included within the ECA. Phase 1 and Phase 2 are identical and operate in parallel.

Mount Elgin Wastewater Treatment Plant | ME2
The central Recirculating Sand Filter (RSF) system is one component of the overall sewage treatment system. In septic tank effluent gravity (STEG) collection systems, the wastewater is collected from individual homes in septic tanks where it is pretreated to remove solids and grease before it drains by gravity to the small diameter collection mains. The small diameter collection mains direct the primary treated effluent to a pump station located near the Mount Elgin Road entrance of the wastewater treatment plant. The primary treated effluent is the raw influent to the wastewater treatment system where it is pumped to the recirculation tanks. The influent is pumped to the recirculating sand filter and then collected and pumped to a splitter valve that allows 80% of the flow to recirculate and 20% to enter the dosing tank. From the dosing tank, treated effluent is pumped to the shallow buried trench drainfield that provides for the subsurface discharge of the treated effluent. Effluent samples are collected from the dosing tank ahead of the drainfield. A standby generator plug-in is available with a manual switch in the event a prolonged power outage requires the use of a mobile generator. 1.2. Operating Expenses In 2016, the Mount Elgin Wastewater Treatment Plant had forecasted operating and maintenance expenditures of $25,000. 2. Summary and Interpretation of Monitoring Data
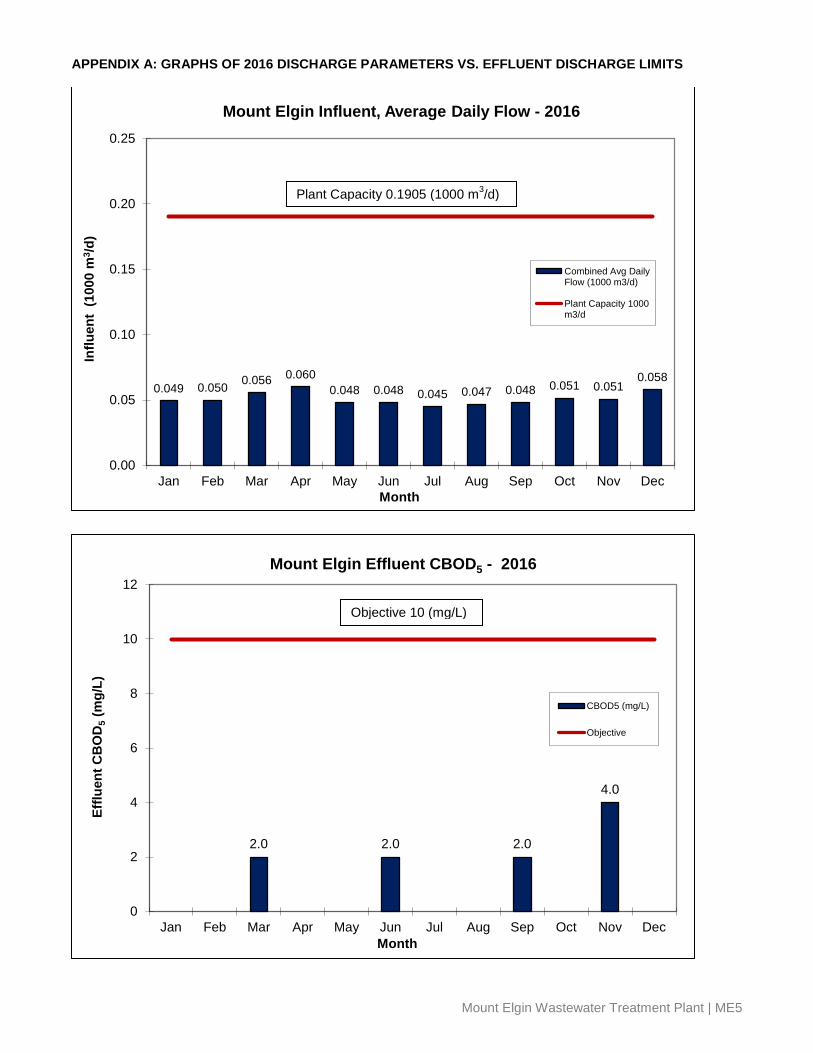
2.1. Effluent Quality Assurance and Control Measures Sampling Procedure Grab samples are collected from the influent lift station on a quarterly basis. Samples are tested for Carbonaceous Biochemical Oxygen Demand (CBOD5), Total Suspended Solids (TSS), Total Phosphorus (TP), and Total Kjeldahl Nitrogen (TKN). Effluent grab samples are analyzed for CBOD5, TSS, TP, ammonia, TKN, nitrite, nitrate, pH, and E.coli at least quarterly. Groundwater testing is done for nitrites, nitrates, and pH on a quarterly basis. Laboratory and Field Testing Laboratory analysis is performed by SGS Lakefield Research Ltd. on all samples for all parameters except for pH, which is tested in the field during collection. These results are used in this report for determination of compliance. Any information generated in-house is used in process control but is not included in this report. 2.2. Plant Performance & Effluent Quality There are no effluent limits for the system, however, the ECA requires Oxford County to use best efforts to operate the sewage treatment facility with the objective that the concentrations of both CBOD5 and Suspended Solids do not exceed 10 mg/L in the effluent ahead of the subsurface disposal system. Graphs of discharge parameters versus effluent discharge limits are included in this report in Appendix A. Influent wastewater characteristics and groundwater sampling results are presented in the tables below.
Influent Wastewater Characteristics Parameter Concentration mg/L Loading kg/d CBOD5 110 5.6 Total Suspended Solids 46 2.3 Total Phosphorus 7.5 0.4 Total Kjeldahl Nitrogen 57.3 2.9

Mount Elgin Wastewater Treatment Plant | ME3
Ground Water Results: 2016 Well 1 Well 2 Well 3 Well 1 Well 2 Well 3 Parameter March 22/16 March 22/16 March 22/16 June 20/16 June 20/16 June 20/16 Well Level (meters) 3.18 3.69 3.96(full) 2.6 2.99 3.2
Nitrite (mg/L N) 0.015 0.015 0.015 0.015 0.07 0.03
Nitrate (mg/L N) 0.03 28.8 0.03 0.03 16.0 3.89
Nitrate+Nitrite (mg/L N) 0.03 28.8 0.03 0.03 16.1 3.89
pH 6.9 7.18 7.12 7.41 7.25 7.33
Well 1 Well 2 Well 3 Well 1 Well 2 Well 3 Parameter Sept 14/16 Sept 14/16 Sept 14/16 Nov 28/16 Nov 28/16 Nov 28/16
Well Level (meters) 2.4 2.86 3.07 2.97 3.43 3.57
Nitrite (mg/L N) 0.03 0.05 0.03 0.015 0.05 0.04
Nitrate (mg/L N) 0.006 11.8 1.72 0.03 22.6 2.36
Nitrate+Nitrite (mg/L N) 0.06 11.9 1.75 0.03 22.7 2.4
pH 7.15 7.23 7.19 6.67 7.28 7.0
Well depths 3.66m 3.96m 3.96m
2.3. Effluent Objectives Objectives are non-enforceable effluent quality values which the owner is obligated to use best efforts to strive towards achieving on an ongoing basis. These objectives are to be used as a mechanism to trigger corrective action proactively, and voluntarily before environmental impairment occurs and before the compliance limits are exceeded. All effluent discharge objectives listed in the Plant’s ECA were met at the Mount Elgin WWTP in 2016. The following table presents the range of effluent discharge values vs. ECA Objectives ahead of the subsurface disposal system.
Effluent Parameter Sample
Frequency
Monthly Average Objective Concentration
(milligram per liter unless otherwise indicated)
Monthly Average Result Min-Max
(milligram per liter unless otherwise indicated)
CBOD5 weekly 10 2 - 4
Total Suspended Solids weekly 10 2

Mount Elgin Wastewater Treatment Plant | ME4
3. Overflows, Bypassing, Upsets, Spills, and Abnormal Conditions
There was an on-site spill on July 18, 2016 of 3 m³ of grey water starting at 1:00 PM and ending at 2:30 PM. Samples were collected and sent to SGS laboratories. Staff noticed abnormal trending flows on the Ingersoll SCADA computer and went to investigate on July 18, 2016 at 1:00 PM. Operational staff once on site noticed the lift station was in high alarm. The high level float was active. Lift pumps were found in the off position. The operator turned them back on and the lift station operated as normal. Lift station levels returned to normal at 2:30 PM on July 18, 2016. Samples were collected. 4. Maintenance of Works
The operating and maintenance staff at the Ingersoll WWTP conducts regularly scheduled maintenance of the plant equipment. The Plant utilizes a database system known as City Works to issue work orders and maintain records for regular maintenance and repair at the treatment facility. 5. Monitoring Equipment Maintenance and Calibration Calibration of flow meters is conducted yearly by Flowmetrics Technical Services Inc. The operational monitoring equipment calibration records are kept on-site at the Plant. Summary The Mount Elgin WWTP operated within its design flow criteria and met all effluent discharge quality objectives in 2016.
Mount Elgin Wastewater Treatment Plant | ME5
APPENDIX A: GRAPHS OF 2016 DISCHARGE PARAMETERS VS. EFFLUENT DISCHARGE LIMITS
0.049 0.050 0.056 0.060 0.048 0.048 0.045 0.047 0.048 0.051 0.051
0.058
0.00
0.05
0.10
0.15
0.20
0.25
Jan Feb Mar Apr May Jun Jul Aug Sep Oct Nov Dec
Influ
ent
(100
0 m
3 /d)
Month
Mount Elgin Influent, Average Daily Flow - 2016
Combined Avg DailyFlow (1000 m3/d)
Plant Capacity 1000m3/d
2.0 2.0 2.0
4.0
0
2
4
6
8
10
12
Jan Feb Mar Apr May Jun Jul Aug Sep Oct Nov Dec
Efflu
ent C
BO
D5 (
mg/
L)
Month
Mount Elgin Effluent CBOD5 - 2016
CBOD5 (mg/L)
Objective
Plant Capacity 0.1905 (1000 m3/d)
Objective 10 (mg/L)

Mount Elgin Wastewater Treatment Plant | ME6
2.0 2.0 2.0 2.0
0
2
4
6
8
10
12
Jan Feb Mar Apr May Jun Jul Aug Sep Oct Nov Dec
Efflu
ent S
S C
once
ntra
tion
(mg/
L)
Month
Mount Elgin Effluent, SS Concentration - 2016
SS (mg/L)
Objective
Objective 10 (mg/L)

Norwich Wastewater Treatment Plant | N1
2016 ANNUAL WASTEWATER TREATMENT SYSTEM SUMMARY REPORT
Norwich Wastewater Treatment Plant
1. General Information Oxford County prepares individual annual reports summarizing each wastewater treatment plant’s operation and treated effluent discharge quality for the nine wastewater treatment plants it owns and operates. The reports detail the latest quality testing results and quantity statistics and any non-compliance conditions that may have occurred. They are available for review by the end of February on the internet at www.oxfordcounty.ca/Services-for-You/Water-Wastewater/Wastewater/Annual-reports or by contacting the Public Works Department. All efforts have been made to ensure the information presented in this report is as accurate as possible. If you have any questions or comments concerning the report, please contact the County of Oxford at the address and phone number listed below or by email at [email protected]. Wastewater Treatment Plant: Norwich Wastewater Treatment Plant Wastewater Treatment Plant Number: 110001480
Wastewater Treatment Plant Owner & Contact Information:
Oxford County Public Works Department Environmental Services (Wastewater) P.O. Box 1614, 21 Reeve Street Woodstock, ON N4S 7Y3 Telephone: 519-539-9800 | Toll Free: 866-537-7778
Reporting Period: January 1, 2016 – December 31, 2016 1.1. System Description The Norwich WWTP provided effective wastewater treatment in 2016. The average daily flow for 2016 was 985 m3/d. This represents 64.4% of the rated capacity of 1,530 m3/d. The wastewater treatment plant is located at Lot 7, Conc. 5, Norwich Township. The Facility description is provided below.
Facility Norwich Wastewater Treatment Plant
Design Capacity 1,530 m3/d
2016 Average Daily Flow 985 m3/d
2016 Maximum Daily Flow 6,866 m3/d
2016 Total Volume of Wastewater 359,958 m3/year
Classification WWT – I
Environmental Compliance Approval (ECA) #1680-6F6QR5
The Norwich WWTP is a lagoon wastewater treatment system serving the community of Norwich. The wastewater is pumped from two pump stations to a splitter box; then to either of two lagoon cells as determined by the operator. Typically the wastewater is directed to the North Cell which is operated in series with the South Cell, followed by filtering of the effluent through the sand filter beds performed for a period each day, as required.

Norwich Wastewater Treatment Plant | N2
The lagoons may discharge year-round; however, the freezing period prevents discharge through the filter beds (normally December to April). The system is maintained by licensed wastewater system operators and licensed mechanics that operate, monitor, and maintain the treatment equipment, in accordance to the regulations, and collect samples as required by the ECA. Alarms automatically notify operators in the event of failure of critical operational requirements. 1.2. Operating Expenses In 2016 the Norwich Wastewater Treatment Plant had forecasted operating and maintenance expenditures of approximately $64,000.
2. Summary and Interpretation of Monitoring Data 2.1. Effluent Quality Assurance and Control Measures Sampling Procedure Influent samples were taken from the Lagoon influent splitter box. The sampling frequency is once per week and samples are tested for Biochemical Oxygen Demand (BOD5), Total Suspended Solids (TSS) monthly, Total Phosphorus (TP), and Total Kjeldahl Nitrogen (TKN) weekly. Effluent samples are taken using a 24-hour composite sampler set to take a sample every 15 minutes for the duration of the discharge period. BOD5 and TSS are sampled at least monthly. TP, ammonia, TKN, pH, and temperature samples are taken three times per week; E.coli and dissolved oxygen are tested at least weekly. Laboratory and Field Testing Laboratory analysis is performed by SGS Lakefield Research Ltd. on all samples for all parameters except for pH, temperature, and dissolved oxygen which are tested in the field during collection. These results are used for determination of compliance. Any information generated in-house is used in process control but is not included in this report. 2.2. Plant Performance & Effluent Quality The Norwich WWTP provided effective treatment in 2016 and met all discharge quality limits, the plant exceeded its daily maximum flow limit of 5,160 m3 with a flow of 6,866 m3 on April 1, 2016, and this was reported to the MOECC at the time it occurred. The operator measures pH of both the influent and effluent streams. There was no single pH result for the effluent outside the discharge limit of 6 - 9.5 in 2016. The lab reported un-ionized ammonia results were all less than the limits listed in the ECA for 2016. There were no exceedances of the loadings limits listed in the ECA to the Big Otter Creek in 2016. Graphs of discharge parameters versus effluent discharge limits are included in this report in Appendix A. Influent wastewater characteristics and effluent discharge values are presented in the tables below.
Influent Wastewater Characteristics
Parameter Concentration mg/L Loading kg/d BOD5 190 187 Total Suspended Solids 203 200 Total Phosphorus 4.3 4 Total Kjeldahl Nitrogen 42 41

Norwich Wastewater Treatment Plant | N3
Effluent Parameter
Sample Frequency
(when discharging)
ECA Effluent Limit (Monthly Average) (milligram per liter unless
otherwise indicated)
Monthly Average Result Min-Max
(milligram per liter unless otherwise indicated)
Percentage Removal
BOD5 monthly 10 2 – 4 97.9 – 98.9
Suspended Solids monthly 10 2 99.0
Total Phosphorus (non-freezing period)*
3/week 0.5 0.24 - 0.34 92.1 - 94.4
Total Phosphorus (freezing Period)*
3/week 1 0.24 94.4
Total Ammonia Nitrogen (non-freezing period)*
3/week 3 0.6 – 1.2 --
Total Ammonia Nitrogen (freezing period)*
3/week 5 4.1 - 4.4 --
E.coli weekly 200
organisms/100 mL (monthly Geometric Mean
Density)
16 - 108 --
pH any single sample 3/week 6.0 - 9.5 7.23 – 8.41 --
* Freezing period means the period of time during which the water temperature of the receiving stream is equal to or below 5 degrees Celsius, normally from December 1, 2016 to April 30, 2016. 2.3. Effluent Objectives Objectives are non-enforceable effluent quality values which the owner is obligated to use best efforts to strive towards achieving on an ongoing basis. These objectives are to be used as a mechanism to trigger corrective action proactively, and voluntarily before environmental impairment occurs and before the compliance limits are exceeded. There were eight single sample objective failures related to ammonia and one sample related to TP during the discharge from the lagoon in 2016. The October monthly average result for TP at 0.34 mg/L also exceeded the objective due to the single high TP sample in the month. The results are summarized below. The following table presents the range of effluent discharge values vs. ECA Objectives.
Effluent
Parameter
Sample Frequency
(when discharging)
Monthly Average Objective Concentration
(milligram per liter unless otherwise indicated)
Monthly Average Result Min-Max
(milligram per liter unless otherwise indicated)
BOD5 monthly 5 2 – 4 Total Suspended Solids monthly 5 2 Total Phosphorus (non-freezing period) * 3/week 0.3 0.24 - 0.34
Total Phosphorus (freezing period)* 3/week 0.8 0.24 Total Ammonia Nitrogen (non-freezing period) *
3/week 2 0.6 – 1.2
Total Ammonia Nitrogen (freezing period)* 3/week 4 4.1 - 4.4
E.coli weekly 150 organisms/100 mL (monthly Geometric Mean Density) 16 - 108
* Freezing period means the period of time during which the water temperature of the receiving stream is equal to or below 5 degrees Celsius, normally from December 1, 2016 to April 30, 2016.

Norwich Wastewater Treatment Plant | N4
Norwich single sample effluent objective exceedances in 2016 included the following:
Month Parameter Objective mg/L Result mg/L April 14 NH3-N 4 4.2 April 22 NH3-N 4 4.2 April 27 NH3-N 4 4.3 April 28 NH3-N 4 5.0 June 9 NH3-N 2 2.5 Oct 6 TP 0.3 0.39
Dec 08 NH3-N 4 8.0 Dec 9 NH3-N 4 6.2 Dec 12 NH3-N 4 4.2
3. Overflows, Bypassing, Upsets, Spills, and Abnormal Conditions On October 11, 2016 and October 12, 2016 there was an overflow of approximately 39 m3 from the Lossing Drive sewage pumping station that was due to faulty level measurements. The Operator noticed the problem during a routine check and started the pumps immediately. The faulty air bubbler system was replaced with a milltronics system to measure levels. This event was reported to the MOECC at the time it occurred. 4. Maintenance of Works
The operating and maintenance staff at the Ingersoll WWTP conducts regularly scheduled maintenance of the plant equipment. The Plant utilizes a database system known as City Works to issue work orders and maintain records for regular maintenance and repair at the treatment facility. 5. Monitoring Equipment Maintenance and Calibration Calibration of flow meters is conducted yearly Flowmetrics Technical Services Inc. The records are kept on-site at the Plant. Operational monitoring equipment calibration records are kept on-site at the Plant. 6. Biosolids 2016 Discussion: Biosolids are contained within the lagoon system until they are cleaned out (typically every 10-20 years). Preparations were made to the south lagoon to have it ready for biosolids removal in 2016 (i.e. by moving the material over to the inner side of the berms). During this process it was discovered that the incoming pipe was rusted off and a large depression was discovered in the bottom of the lagoon. The influent pipe was repaired and the depression was filled using clay under the supervision of a professional Hydrogeologist. Since then lab results have shown that the material lacks nutrient value to apply as a NASM on farmland. A soil specialist was hired to consult on possible uses of the material and the intent is to utilize it in 2017. Summary The Norwich WWTP operated within its design flow criteria and met all effluent discharge quality limits in 2016.

Norwich Wastewater Treatment Plant | N5
APPENDIX A: GRAPHS OF 2016 DISCHARGE PARAMETERS VS. EFFLUENT DISCHARGE LIMITS
0.958
1.245
1.563
1.973
0.880
0.717 0.660 0.693 0.683 0.746 0.760
0.946
0.0
0.5
1.0
1.5
2.0
2.5
Jan Feb Mar Apr May Jun Jul Aug Sep Oct Nov Dec
IInflu
ent F
low
(100
0 m
3 /d)
Month
Norwich Lagoon Influent, Average Daily Flow (1000 m3/d), 2016
AVERAGE DAILY FLOW (1000 m³/d)
Design (1000 m³/d)
Design Criteria 1.53 (1000 m³/d)

Norwich Wastewater Treatment Plant | N6
4.1
1.2
0.6
4.4
0
1
2
3
4
5
6
Jan Feb Mar Apr May Jun Jul Aug Sep Oct Nov Dec
Efflu
ent A
mm
onia
(mg/
L)
Month
Norwich Lagoon Effluent Monthly Average Ammonia (mg/L), 2016
AMMONIA (mg/L)
Non-freezing Criteria
Freezing Criteria
Non-freezing Criteria 3 (mg/L)
Freezing Criteria 5 (mg/L) Freezing Criteria 5 (mg/L)
0.24 0.28 0.34
0.24
0.0
0.2
0.4
0.6
0.8
1.0
1.2
1.4
1.6
1.8
2.0
Jan Feb Mar Apr May Jun Jul Aug Sep Oct Nov Dec
Efflu
en T
P (m
g/L)
Month
Norwich Lagoon Effluent, Monthly Average TP - 2016
TP (mg/L)Non-freezing CriteriaFreezing Criteria
Freezing Criteria 1 (mg/L)
Non-freezing Criteria 0.5 (mg/L)
Freezing Criteria 1 (mg/L)

Norwich Wastewater Treatment Plant | N7
78.7 69.1
108.4
16.2
0
50
100
150
200
250
Jan Feb Mar Apr May Jun Jul Aug Sep Oct Nov Dec
Efflu
ent E
.Col
i (#/
100
mL)
Month
Norwich Lagoon Effluent Monthly Geometric Mean Density E.Coli - 2016
E. Coli (#/100ml)
Criteria
2.0 2.0 2.0 2.0
0
2
4
6
8
10
12
Jan Feb Mar Apr May Jun Jul Aug Sep Oct Nov Dec
Efflu
ent S
S (m
g/L)
Month
Norwich Lagoons Effluent, Monthly Average SS - 2016
SS (mg/L)
Criteria
Criteria 200 (#/100mL)
Criteria 10 (mg/L)

Norwich Wastewater Treatment Plant | N8
4.0
2.0 2.0
4.0
0
2
4
6
8
10
12
Jan Feb Mar Apr May Jun Jul Aug Sep Oct Nov Dec
Efflu
ent B
OD
5 (m
g/L)
Month
Norwich Lagoons Effluent, Monthly Average BOD5 - 2016
BOD5 (mg/L)
Criteria
Criteria 10 (mg/L)

Plattsville Wastewater Treatment Plant | P1
2016 ANNUAL WASTEWATER TREATMENT SYSTEM SUMMARY REPORT
Plattsville Wastewater Treatment Plant
1. General Information Oxford County prepares individual annual reports summarizing each wastewater treatment plant’s operation and treated effluent discharge quality for the nine wastewater treatment plants it owns and operates. The reports detail the latest quality testing results and quantity statistics and any non-compliance conditions that may have occurred. They are available for review by the end of February on the internet at www.oxfordcounty.ca/Services-for-You/Water-Wastewater/Wastewater/Annual-reports or by contacting the Public Works Department. All efforts have been made to ensure the information presented in this report is as accurate as possible. If you have any questions or comments concerning the report, please contact the County of Oxford at the address and phone number listed below or by email at [email protected]. Wastewater Treatment Plant: Plattsville Wastewater Treatment Plant Wastewater Treatment Plant Number: 110003022
Wastewater Treatment Plant Owner & Contact Information:
Oxford County Public Works Department Environmental Services (Wastewater) P.O. Box 1614 21 Reeve Street Woodstock, ON N4S 7Y3 Telephone: 519-539-9800 Toll Free: 866-537-7778
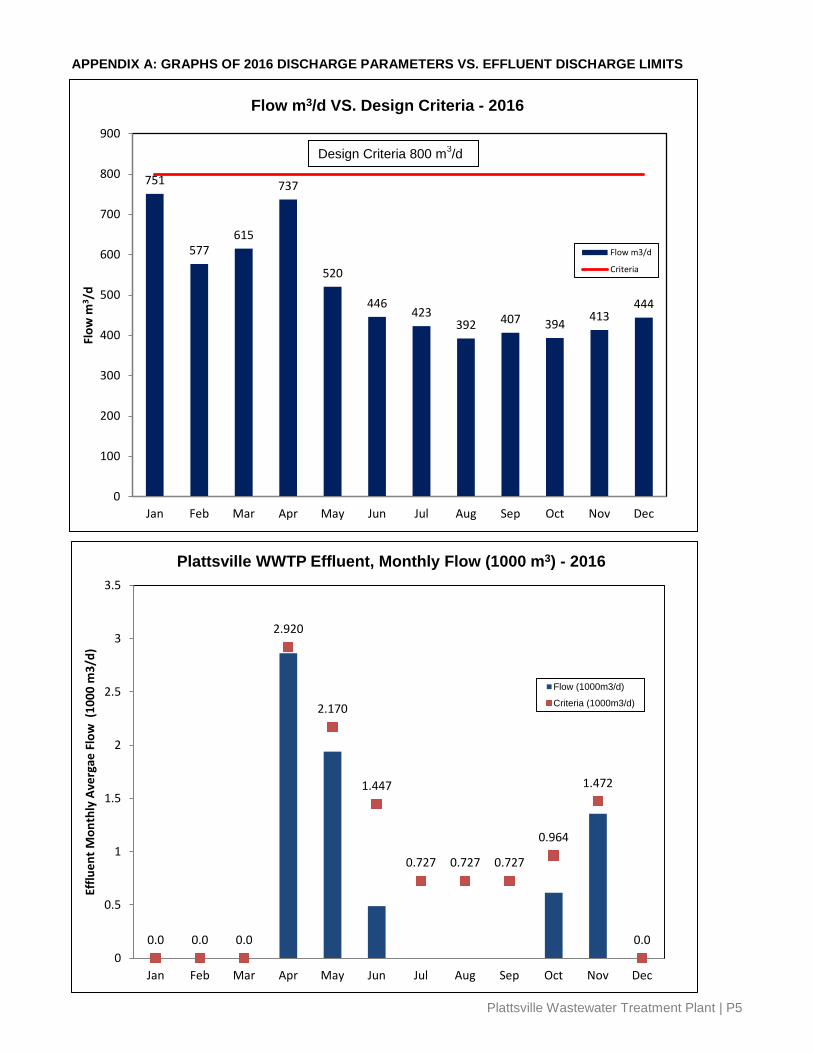
Reporting Period: January 1, 2016 – December 31, 2016 1.1. System Description The Plattsville WWTP provided effective wastewater treatment in 2016 and all effluent concentration limits were met on a monthly basis. The annual average daily flow rate was 510 m3/d; this represents 63.8% of the WWTP rated capacity of 800 m3/d. The wastewater treatment plant is located at Lot 16, Conc. 12, Township of Blandford-Blenheim. The Facility description is provided below.
Facility Plattsville Wastewater Treatment Plant
Design Capacity 800 m3/d
2016 Average Daily Flow 510 m3/d
2016 Maximum Daily Flow 1,073 m3/d
2016 Total Volume of Wastewater 186,510 m3/year
Classification WWT – I
Environmental Compliance Approval (ECA) #3133-7QWH4N

Plattsville Wastewater Treatment Plant | P2
Wastewater is treated at the Plattsville WWTP, which includes two aerated lagoon cells and two conventional wastewater stabilization ponds. Phosphorus removal is accomplished through the flow paced continuous dosing of aluminum sulphate into the splitter box prior to the wastewater entering the stabilization ponds and/or when required by batch dosing via a return pump pond mixing system, which can dose either cell and recirculate the contents. Treated wastewater is pumped to an intermittent sand filter designed for ammonia removal prior to discharge to the Nith River. Oxford County operates the facility, utilizing the staff located at the Woodstock WWTP. 1.2. Operating Expenses In 2016 the Plattsville Wastewater Treatment Plant had forecasted operating and maintenance expenditures of $115,000. 2. Summary and Interpretation of Monitoring Data
2.1. Effluent Quality Assurance and Control Measures Sampling Procedure Raw influent wastewater is sampled on a monthly basis and is analyzed for BOD5, TSS, TKN, TP and pH. Effluent discharge samples are collected bi-weekly or monthly and at an interval to meet the percentage of drawdown of the lagoon cell as stipulated in the ECA during discharge periods and analyzed for CBOD5, TSS, Total Ammonia Nitrogen, TP, E.coli, temperature and pH. Laboratory and Field Testing Laboratory analyses are performed by SGS Lakefield Research Ltd. on all samples that are reported for compliance except for pH, DO, and temperature which are field collected. All in-house laboratory testing is done for process control and is not included in this report. Groundwater Testing Groundwater monitoring requires that an annual sample be collected and tested for Total Organic Carbon, Total Phosphorus, Total Kjeldahl Nitrogen, Nitrite and Nitrate. A further evaluation of the results over the last few years was conducted by a professional Hydrogeologist and a report prepared. It concluded that there was no clear evidence of an adverse effect on groundwater quality from the Plattsville WWTP. This was forwarded to the MOECC to determine if further sampling is required. Two samples were collected in 2016 and are referred to as the shallow well sample and deep well sample:
PLATTSVILLE WWTP GROUNDWATER SAMPLING
13-Apr-16 13-Apr-16 26-Apr-16 26-Apr-16
Shallow Deep Shallow Deep Parameter
TOC (mg/L) 1.8 1.4 2.0 1.8 Total P (mg/L) 0.04 0.29 < 0.03 0.32 TKN (mg/L N) < 0.5 < 0.5 < 0.5 < 0.5 Ammonia/ium (mg/L) < 0.1 < 0.1 < 0.1 0.1 Nitrite (mg/L) < 0.03 < 0.03 < 0.03 < 0.03 Nitrate (mg/L) 0.24 < 0.06 0.24 0.06 Nitrate + Nitrite (mg/L N) 0.24 < 0.06 0.24 0.06 Chloride (mg/L) 4 20 4 19

Plattsville Wastewater Treatment Plant | P3
2.2. Plant Performance & Effluent Quality The Plattsville WWTP provided effective treatment in 2016 meeting all its regulatory limits for all parameters in the effluent discharged to the Nith River. On a bi-weekly basis (as a minimum) the operator measures pH of the effluent streams during discharge. There was no single pH result for the effluent outside the discharge limit of 6-9.5 in 2016. Graphs of discharge parameters versus effluent discharge limits are included in this report in Appendix A. Influent wastewater characteristics and effluent discharge values are presented in the tables below.
Influent Wastewater Characteristics Parameter Concentration mg/L Loading kg/d BOD5 149 76 Total Suspended Solids 149 76 Total Phosphorus 4.9 2.5 Total Kjeldahl Nitrogen 46.1 23.5
2.3. Effluent Objectives Objectives are non-enforceable effluent quality values which the owner is obligated to use best efforts to strive towards achieving on an ongoing basis. These objectives are to be used as a mechanism to trigger corrective action proactively, and voluntarily before environmental impairment occurs and before the compliance limits are exceeded. All effluent discharge objectives listed in the Plant’s ECA were met with the exception of the TSS value for June which was 6 mg/L and the result for November which was 9 mg/L, the corresponding objective limit is 5 mg/L.
Effluent Parameter
Sample Frequency
ECA Effluent Limit (Monthly Average) (milligram per liter unless
otherwise indicated)
Monthly Average Result
Min-Max (milligram per liter unless otherwise
indicated) Percentage
Removal CBOD5 weekly 10 2 - 3.5 97.5 - 98.6 Total Suspended Solids weekly 10 2 - 9 94.0 - 98.7 Total Phosphorus weekly 0.5 0.03 - 0.06 98.8 - 99.4 Total Ammonia Nitrogen (when receiving stream >12 degrees Celsius)
weekly 2 0.1 - 0.1 99.8
Total Ammonia Nitrogen (when receiving stream < or = to 12 degrees Celsius)
weekly 5 0.1 - 0.9 97.9 - 99.8
E.coli (May 1 – October 31) weekly
200 organisms/100 mL
(monthly Geometric Mean Density)
2 - 18 --
pH any single sample weekly 6.0-9.5 6.9 - 8.2 --

Plattsville Wastewater Treatment Plant | P4
The following table presents the range of effluent discharge values vs. ECA Objectives.
Effluent Parameter
Sample Frequency
Monthly Average Objective Concentration
(milligram per liter unless otherwise indicated)
Monthly Average Result Min-Max
(milligram per liter unless otherwise indicated)
CBOD5 weekly 5 2 – 3.5 Total Suspended Solids weekly 5 2 - 9
Total Phosphorus weekly 0.3 0.03 - 0.06 Total Ammonia Nitrogen (when receiving stream >12 degrees Celsius)
weekly 1 0.1 - 0.1
Total Ammonia Nitrogen (when receiving stream < or = to 12 degrees Celsius)
weekly 3 0.1 – 0.9
E.coli (May 1 – October 31) weekly 150 organisms/100 mL
(monthly Geometric Mean Density) 2 - 18 Plattsville effluent objective exceedances in 2016 included the following:
Month Parameter Objective (mg/L) Result (mg/L) June TSS 5 6 November TSS 5 9
3. Overflows, Bypassing, Upsets, Spills, and Abnormal Conditions There were no bypasses or overflows from the Plattsville WWTP in 2016. 4. Maintenance of Works
The operating and maintenance staff at the Plattsville WWTP conducts regularly scheduled maintenance of the plant equipment. The Plant utilizes a database system known as City Works to issue work orders and maintain records for regular maintenance and repair at the treatment facility. 5. Monitoring Equipment Maintenance and Calibration Calibration of flow meters is conducted yearly by Flowmetrix Technical Services Inc. The operational monitoring equipment calibration records are kept on-site at the Plant. Summary The Plattsville WWTP met all effluent discharge quality limits in 2016.
Plattsville Wastewater Treatment Plant | P5
APPENDIX A: GRAPHS OF 2016 DISCHARGE PARAMETERS VS. EFFLUENT DISCHARGE LIMITS
751
577 615
737
520
446 423
392 407 394 413 444
0
100
200
300
400
500
600
700
800
900
Jan Feb Mar Apr May Jun Jul Aug Sep Oct Nov Dec
Flow
m3 /
d Flow m3/d VS. Design Criteria - 2016
Flow m3/d
Criteria
0.0 0.0 0.0
2.920
2.170
1.447
0.727 0.727 0.727
0.964
1.472
0.0 0
0.5
1
1.5
2
2.5
3
3.5
Jan Feb Mar Apr May Jun Jul Aug Sep Oct Nov Dec
Efflu
ent M
onth
ly A
verg
ae F
low
(10
00 m
3/d)
Plattsville WWTP Effluent, Monthly Flow (1000 m3) - 2016
Flow (1000m3/d)
Criteria (1000m3/d)
Design Criteria 800 m3/d

Plattsville Wastewater Treatment Plant | P6
0.9
0.1 0.1 0.1 0.1 0
1
2
3
4
5
6
Jan Feb Mar Apr May Jun Jul Aug Sep Oct Nov Dec
Efflu
ent A
mm
onia
(mg/
L)
Month
Plattsville WWTP Effluent, Monthly Average Ammonia Discharge - 2016
Ammonia (mg/L)
Freezing Criteria
Non-freezingperiod Criteria
0.0 0.0 0.0 0.0 0.1
0.0
0.1
0.2
0.3
0.4
0.5
0.6
Jan Feb Mar Apr May Jun Jul Aug Sep Oct Nov Dec
Efflu
ent T
P (m
g/L)
Month
Plattsville WWTP Effluent, Monthly Average TP - 2016
TP (mg/L)
Criteria
Freezing Criteria 5 (mg/L)
Non-freezing Criteria 2 (mg/L)
Freezing Criteria 5 (mg/L)
Criteria 0.5 (mg/L)

Plattsville Wastewater Treatment Plant | P7
2.0 2.2
6.0
3.0
9.0
0
2
4
6
8
10
12
Jan Feb Mar Apr May Jun Jul Aug Sep Oct Nov Dec
Efflu
ent T
SS (m
g/L)
Month
Plattsville WWTP Effluent, Monthly Average TSS - 2016
TSS (mg/L)
Criteria
2.0 2.0 2.0 2.0
3.5
0
2
4
6
8
10
12
Jan Feb Mar Apr May Jun Jul Aug Sep Oct Nov Dec
Efflu
ent C
BO
D5 (
mg/
L)
Month
Plattsville WWTP Effluent, Monthly Average CBOD5 - 2016
CBOD5 (mg/L)
Criteria
Criteria 10 (mg/L)
Criteria 10 (mg/L)

Tavistock Wastewater Treatment Plant | TA1
2016 ANNUAL WASTEWATER TREATMENT SYSTEM SUMMARY REPORT
Tavistock Wastewater Treatment Plant
1. General Information Oxford County prepares individual annual reports summarizing each wastewater treatment plant’s operation and treated effluent discharge quality for the nine wastewater treatment plants it owns and operates. The reports detail the latest quality testing results and quantity statistics and any non-compliance conditions that may have occurred. They are available for review by the end of February on the internet at www.oxfordcounty.ca/Services-for-You/Water-Wastewater/Wastewater/Annual-reports or by contacting the Public Works Department. All efforts have been made to ensure the information presented in this report is as accurate as possible. If you have any questions or comments concerning the report, please contact the County of Oxford at the address and phone number listed below or by email at [email protected]. Wastewater Treatment Plant: Tavistock Wastewater Treatment Plant Wastewater Treatment Plant Number: 110000720
Wastewater Treatment Plant Owner & Contact Information:
Oxford County Public Works Department Environmental Services (Wastewater) P.O. Box 1614 21 Reeve Street Woodstock, ON N4S 7Y3 Telephone: 519-539-9800 Toll Free: 866-537-7778
Reporting Period: January 1, 2016 – December 31, 2016 1.1. System Description The Tavistock WWTP provided effective wastewater treatment in 2016 and all effluent concentration limits, as specified by the ECA, were met. The annual average daily flow in 2016 was 1,822 m3/d, which represents 72.2% of the rated capacity of 2,525 m3/d. The wastewater treatment plant is located at 381 William St., Tavistock, Ontario. The Facility description is provided below.
Facility Tavistock Wastewater Treatment Plant
Design Capacity 2,525 m3/d
2016 Average Daily Flow 1,822 m3/d
2016 Maximum Daily Flow 4,614 m3/d
2016 Total Volume of Wastewater 666,383 m3/year
Classification WWT – I
Environmental Compliance Approval (ECA) #7789-8AKJL5

Tavistock Wastewater Treatment Plant | TA2
The Tavistock WWTP consists of 3 aerated lagoon cells, one polishing pond and an Intermittent Sand Filter (ISF). The first three cells are equipped with Mat Aerators, and there are an additional six 15 HP aspirating surface aerators in Cell 1 to provide the necessary dissolved oxygen for the lagoons. There is also the provision for continuous aluminum sulphate addition for phosphorus removal. The wastewater is dosed with aluminum sulphate as it enters Cell 1 and as it enters Cell 2. Effluent from Cell 1 overflows to Cell 2, then into Cell 3 and/or Cell 4 where it is pumped through the filter beds and/or stored prior to discharge. Oxford County operates the facility, utilizing the staff located at the Woodstock WWTP. 1.2. Operating Expenses In 2016 the Tavistock Wastewater Treatment Plant had operating and maintenance expenditures of $369,000. 2. Summary and Interpretation of Monitoring Data 2.1. Effluent Quality Assurance and Control Measures Sampling Procedure Raw sewage is sampled a minimum of once monthly for CBOD5, suspended solids, TKN, total phosphorous, pH and temperature. Automatic composite samplers are used to collect raw sewage samples from Chamber 3 as the flow enters Cell 1. Automated composite samples are also taken at the same time from a major cheese processor in Tavistock. The cheese company can discharge significant loadings to the Tavistock Lagoon system and is under a surcharge agreement with Oxford County. Laboratory and Field Testing Grab samples of final effluent are taken weekly during effluent discharge and tested for CBOD5, suspended solids, total phosphorous, pH, temperature, dissolved oxygen, nitrate nitrogen, nitrite nitrogen and ammonia nitrogen. Un-ionized ammonia, BOD5, and E.coli were also included under the recent ECA amendment. SGS Lakefield Research Ltd. performs all sample analyses with the exception of pH, temperature, and dissolved oxygen which are measured in the field. 2.2. Plant Performance & Effluent Quality The Tavistock WWTP provided effective treatment in 2016, meeting all its regulatory limits for all parameters in the effluent discharged to the Thames River. On a weekly basis (minimum), the operator measures pH of the effluent stream when discharging. There was no single pH result for the effluent outside the discharge limit of 6 – 9.5 in 2016. Graphs of discharge parameters versus effluent discharge limits are included in this report in Appendix A. Influent wastewater characteristics and effluent discharge values are presented in the tables below.
Influent Wastewater Characteristics Parameter Concentration mg/L Loading kg/d CBOD5 292 532 Total Suspended Solids 279 508 Total Phosphorus 12 22 Total Kjeldahl Nitrogen 31 56
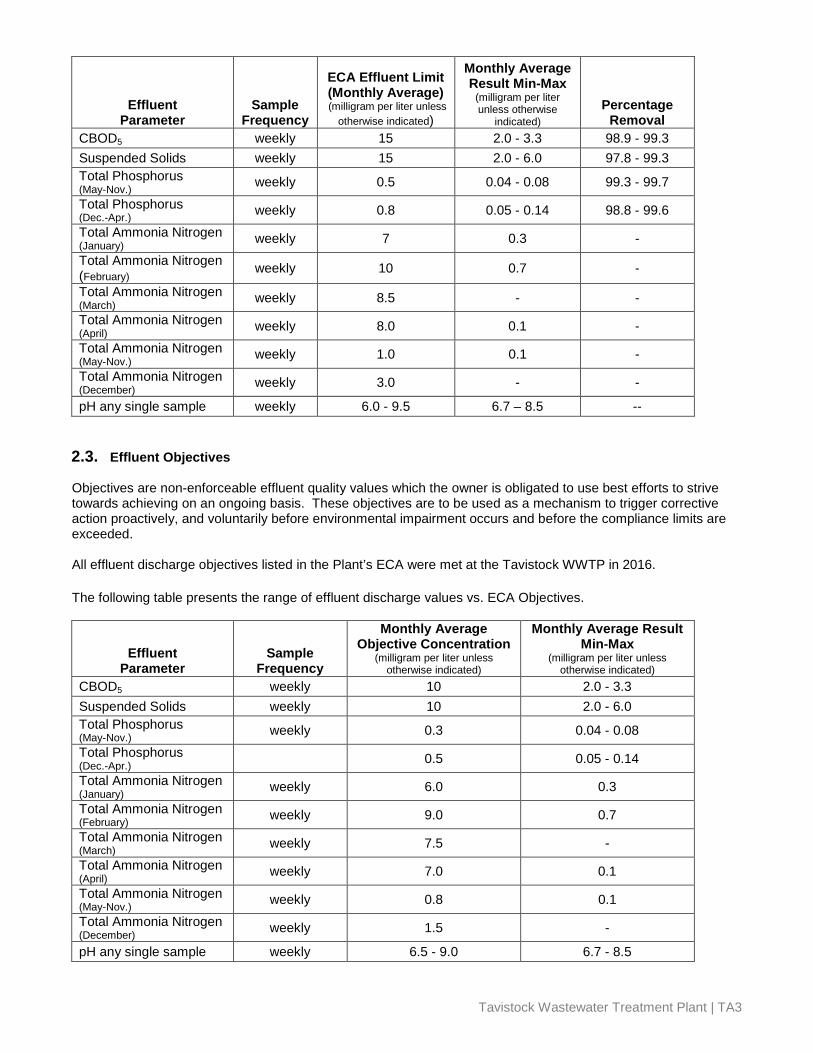
Tavistock Wastewater Treatment Plant | TA3
Effluent Parameter
Sample Frequency
ECA Effluent Limit (Monthly Average) (milligram per liter unless
otherwise indicated)
Monthly Average Result Min-Max
(milligram per liter unless otherwise
indicated) Percentage
Removal CBOD5 weekly 15 2.0 - 3.3 98.9 - 99.3 Suspended Solids weekly 15 2.0 - 6.0 97.8 - 99.3 Total Phosphorus (May-Nov.) weekly 0.5 0.04 - 0.08 99.3 - 99.7 Total Phosphorus (Dec.-Apr.) weekly 0.8 0.05 - 0.14 98.8 - 99.6 Total Ammonia Nitrogen (January) weekly 7 0.3 - Total Ammonia Nitrogen (February) weekly 10 0.7 -
Total Ammonia Nitrogen (March) weekly 8.5 - - Total Ammonia Nitrogen (April) weekly 8.0 0.1 - Total Ammonia Nitrogen (May-Nov.) weekly 1.0 0.1 -
Total Ammonia Nitrogen (December) weekly 3.0 - -
pH any single sample weekly 6.0 - 9.5 6.7 – 8.5 -- 2.3. Effluent Objectives Objectives are non-enforceable effluent quality values which the owner is obligated to use best efforts to strive towards achieving on an ongoing basis. These objectives are to be used as a mechanism to trigger corrective action proactively, and voluntarily before environmental impairment occurs and before the compliance limits are exceeded. All effluent discharge objectives listed in the Plant’s ECA were met at the Tavistock WWTP in 2016. The following table presents the range of effluent discharge values vs. ECA Objectives.
Effluent Parameter
Sample Frequency
Monthly Average Objective Concentration
(milligram per liter unless otherwise indicated)
Monthly Average Result Min-Max
(milligram per liter unless otherwise indicated)
CBOD5 weekly 10 2.0 - 3.3 Suspended Solids weekly 10 2.0 - 6.0 Total Phosphorus (May-Nov.) weekly 0.3 0.04 - 0.08 Total Phosphorus (Dec.-Apr.) 0.5 0.05 - 0.14 Total Ammonia Nitrogen (January) weekly 6.0 0.3
Total Ammonia Nitrogen (February) weekly 9.0 0.7 Total Ammonia Nitrogen (March) weekly 7.5 - Total Ammonia Nitrogen (April) weekly 7.0 0.1
Total Ammonia Nitrogen (May-Nov.) weekly 0.8 0.1 Total Ammonia Nitrogen (December) weekly 1.5 -
pH any single sample weekly 6.5 - 9.0 6.7 - 8.5

Tavistock Wastewater Treatment Plant | TA4
3. Overflows, Bypassing, Upsets, Spills, Complaints, and Abnormal Conditions There were no bypasses or overflows from the Tavistock WWTP in 2016. Neighbour reported geese flying into hydro lines March 30, 2016. This was confirmed by wastewater treatment staff as they were called out to an alarm for lost power. Erie Thames had responded to restore power. Neighbour complained about Midge Flies near house May 11, 2016. Public Health responded. It was agreed that flies will disappear after a week, a natural occurring event common in Ontario. On December 5, 2016, Oxford County sewer use bylaw staff responded to investigate an oily sheen that was reported by a wastewater treatment operator to be present in the drain both upstream and downstream of the lagoon discharge. The oily sheen seemed to originate from upstream of the lagoon discharge point. The Lagoon was not discharging and had not been for several weeks. Oxford County contacted MOECC to inform the Ministry that someone had spilled perhaps diesel fuel into the drain. East Zorra-Tavistock Township was informed the day of the event and the Township took quick action to inspect the drain and nearby possible sources and to use some absorbent material near the bridge directly to the north of the golf course on William Street. On December 13, 2016, the neighbour also emailed Oxford County to report the same oily sheen he had observed on December 5, 2016. 4. Maintenance of Works
The operating and maintenance staff at the Woodstock WWTP conducts regularly scheduled maintenance of the plant equipment. The Plant utilizes a database system known as City Works to issue work orders and maintain records for regular maintenance and repair at the treatment facility. 5. Monitoring Equipment Maintenance and Calibration Calibration of flow meters is conducted yearly by Flowmetrix Technical Services Inc. The operational monitoring equipment calibration records are kept on-site at the Plant. 6. Result of MOECC 2016 Audit covering November 01, 2010 to January 06, 2016
Non-compliance with regulatory requirements and actions required - Tavistock
I. The owner was not in compliance with maximum flow rate on one occasion over the review period. According to a letter of permission due to a storage related issue in September 2011, 150,000 m3/d was permitted to be released however 159,110 m3/d was actually released.
Action Required:
a. Owner shall ensure that the flow rates prescribed by any controlling document are met with.
II. The owner was not in compliance for one monthly average result for Total Ammonia Nitrogen over the review period. In October 2011, the reported monthly average was 2.6 mg/L; the effluent limit is 2.0 mg/L.
Action Required:
a. Owner shall ensure that the concentration is less than the prescribed limit.
III. Operations and Maintenance manual did not meet the requirements of the ECA.
Action Required: a. Make amendments and submit updated manual by June 1, 2016. (O&M Manual Submitted
May 31, 2016 to MOECC)

Tavistock Wastewater Treatment Plant | TA5
Summary of Recommendations and Best Practices - Tavistock
I. The effluent sampling results did not meet the effluent objectives stated in the ECA.
Recommend: a. From herein the owner shall use best efforts to conform to the effluent objectives.
II. a. Older annual reports did not include calibration / maintenance of monitoring equipment records
which while it is understood existed, were not included. Since the issuance of the 2013 Annual Performance Report, the owner has started including the calibration / maintenance records, as such no further action is required. b. Owner uses composite influent sampling on raw sewage instead of grab sampling.
Recommend:
a. No further action is required. The owner should assess each of the specific requirements in the ECA for the Annual Report and ensure these at a minimum are included.
b. During any modifications to the content of the ECA, the owner shall amend the sampling type
to that which is being conducted.
7. Summary The Tavistock WWTP operated within its design flow criteria and met all effluent discharge quality limits in 2016.

Tavistock Wastewater Treatment Plant | TA6
APPENDIX A: GRAPHS OF 2016 DISCHARGE PARAMETERS VS. EFFLUENT DISCHARGE LIMITS
1.816
2.028 2.011 2.142
1.666 1.670 1.599
1.881 1.757 1.689 1.740
1.862
0.0
0.2
0.4
0.6
0.8
1.0
1.2
1.4
1.6
1.8
2.0
2.2
2.4
2.6
2.8
JAN. FEB. MAR. APR. MAY JUNE JULY AUG. SEPT. OCT. NOV. DEC.
Influ
ent F
low
(100
0 m
3 /d)
Month
Tavistock WWTP Influent, Monthly Average Daily Flow - 2016
Average Influent (1000 m3/d)
Plant Capacity 2.525 (1000 m3/d)
Design Criteria 2.525 (1000 m3/d)
4.3
5.3 5.6
4.5 4.53
1.7
0.4 0.115
0.35
1.9
2.66
4.01
0.000
1.000
2.000
3.000
4.000
5.000
6.000
JAN. FEB. MAR. APR. MAY JUNE JULY AUG. SEPT. OCT. NOV. DEC.
Efflu
ent F
low
, (10
00 m
3 /d)
Month
Tavistock WWTP Effluent, Monthly Average Day Flow - 2016
Effluent Average (1000 m3/d)
Effluent Flow Criteria (1000m3/d)

Tavistock Wastewater Treatment Plant | TA7
0.0
2.0
4.0
6.0
8.0
10.0
12.0
14.0
16.0
JAN. FEB. MAR. APR. MAY JUNE JULY AUG. SEPT. OCT. NOV. DEC.
Efflu
ent C
BO
D5 (
mg/
L)
Month
Tavistock Wastewater Effluent, Monthly Average CBOD5 (mg/L), 2016
CBOD5 (mg/L)
CBOD5 Criteria (mg/L)
Criteria 15 (mg/L)
0.0
2.0
4.0
6.0
8.0
10.0
12.0
JAN. FEB. MAR. APR. MAY JUNE JULY AUG. SEPT. OCT. NOV. DEC.
Efflu
ent A
mm
onia
(mg/
L)
Month
Tavistock WWTP Effluent Monthly Average Ammonia (mg/L), 2016
AMMONIA (mg/L)
NH3-N Criteria (mg/L)
NH3-N Criteria (mg/L)
Criteria 1.0 (mg/L)

Tavistock Wastewater Treatment Plant | TA8
0.1 0.1
0.0 0.0 0.1 0.0 0.1 0.1
0.0
0.1
0.2
0.3
0.4
0.5
0.6
0.7
0.8
0.9
JAN. FEB. MAR. APR. MAY JUNE JULY AUG. SEPT. OCT. NOV. DEC.
Efflu
ent T
P (m
g/L)
Month
Tavistock WWTP Effluent, Monthly Average TP (mg/L) - 2016
TOTAL P. (mg/L)TP Freezing Criteria (mg/L)TP Non-freezing Criteria (mg/L)
Freezing Criteria 0.8 (mg/L) Freezing Criteria 0.8 (mg/L)
Non-freezing Criteria 0.5 (mg/L)
4.0
6.0
2.0 2.3 3.0
4.0 4.0
2.0
0
2
4
6
8
10
12
14
16
JAN. FEB. MAR. APR. MAY JUNE JULY AUG. SEPT. OCT. NOV. DEC.
Efflu
ent T
SS (m
g/L)
Month
Tavistock WWTP Effluent, Monthly Average TSS (mg/L) - 2016
TSS (mg/L)
TSS Criteria (mg/L)
Criteria 15 (mg/L)

Thamesford Wastewater Treatment Plant | TH1
2016 ANNUAL WASTEWATER TREATMENT SYSTEM SUMMARY REPORT
Thamesford Wastewater Treatment Plant
1. General Information Oxford County prepares individual annual reports summarizing each wastewater treatment plant’s operation and treated effluent discharge quality for the nine wastewater treatment plants it owns and operates. The reports detail the latest quality testing results and quantity statistics and any non-compliance conditions that may have occurred. They are available for review by the end of February on the internet at www.oxfordcounty.ca/Services-for-You/Water-Wastewater/Wastewater/Annual-reports or by contacting the Public Works Department. All efforts have been made to ensure the information presented in this report is as accurate as possible. If you have any questions or comments concerning the report, please contact the County of Oxford at the address and phone number listed below or by email at [email protected]. Wastewater Treatment Plant: Thamesford Wastewater Treatment Plant Wastewater Treatment Plant Number: 120002601
Wastewater Treatment Plant Owner & Contact Information:
Oxford County Public Works Department Environmental Services (Wastewater) P.O. Box 1614, 21 Reeve Street Woodstock, ON N4S 7Y3 Telephone: 519-539-9800 | Toll Free: 866-537-7778
Reporting Period: January 1, 2016 – December 31, 2016 1.1. System Description The Thamesford Wastewater Treatment Plant (WWTP) provided effective wastewater treatment in 2016 for residential, commercial, and industrial users in the Village of Thamesford. The average daily flow for 2016 was 1,384 m3/d. This represents 55% of the Plant rated capacity of 2,500 m3/d. The total annual flow was 506,451 m3. A new blower was installed at the Plant which necessitated an updated ECA. The blower change and the use of a variable frequency drive (VFD) integrated into a SCADA control loop using dissolved oxygen feedback, was intended to reduce electrical consumption. One of the two existing 40 HP blowers was replaced with a new more efficient 100 HP blower which could then be used in combination with the other 40 HP blower and the two existing 200 HP blowers for a more flexible and efficient operation of the oxygen delivery system to the biological system. In addition to increased energy efficiency, this proactive change would result in lower GHG emissions to the atmosphere. An updated ECA was received in October 2015. The blower installation would be complete in 2016. The new blower was put online in 2016 and there was a significant drop in the peak hydro demand within the facility. The wastewater treatment plant is located at 10 Middleton St., Thamesford, Ontario. The Facility description is provided below.
Facility Thamesford Wastewater Treatment Plant Design Capacity 2,500 m3/d
2016 Average Daily Flow 1,384 m3/d 2016 Maximum Daily Flow 2,375 m3/d
2016 Total Volume of Wastewater 506,451 m3/year Classification WWT – III
Environmental Compliance Approval (ECA) #6974-6FKKAY & 1897-9YAKKF
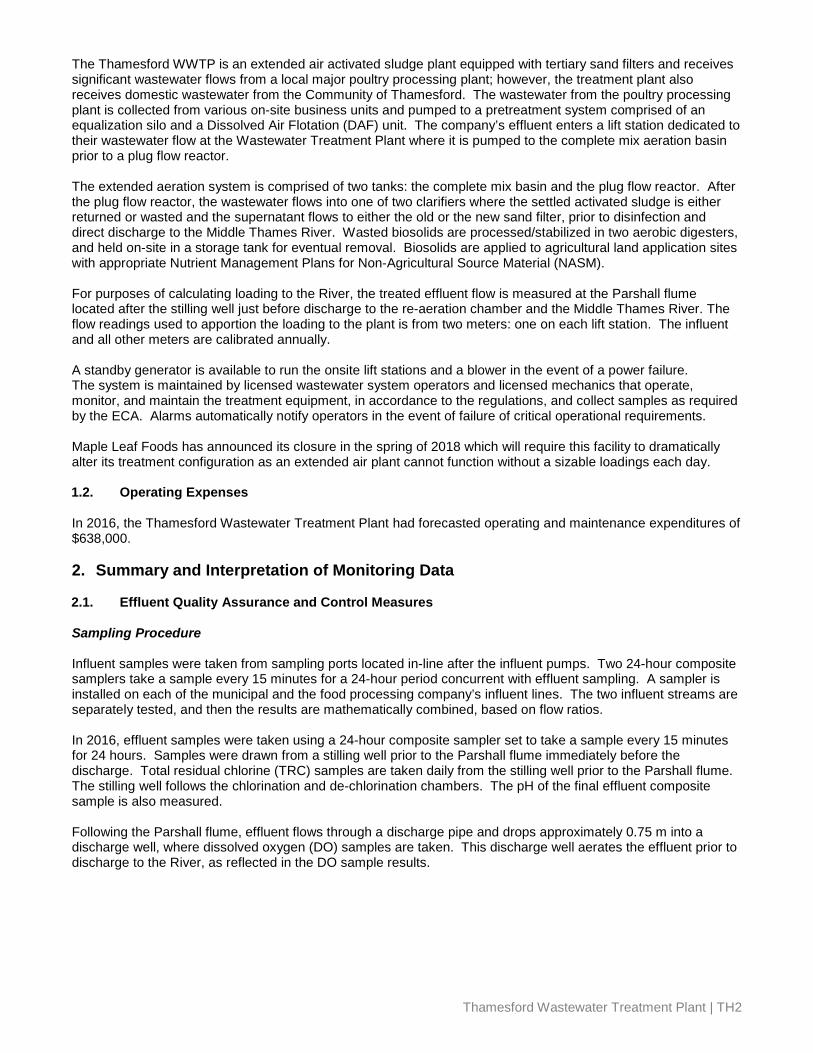
Thamesford Wastewater Treatment Plant | TH2
The Thamesford WWTP is an extended air activated sludge plant equipped with tertiary sand filters and receives significant wastewater flows from a local major poultry processing plant; however, the treatment plant also receives domestic wastewater from the Community of Thamesford. The wastewater from the poultry processing plant is collected from various on-site business units and pumped to a pretreatment system comprised of an equalization silo and a Dissolved Air Flotation (DAF) unit. The company’s effluent enters a lift station dedicated to their wastewater flow at the Wastewater Treatment Plant where it is pumped to the complete mix aeration basin prior to a plug flow reactor. The extended aeration system is comprised of two tanks: the complete mix basin and the plug flow reactor. After the plug flow reactor, the wastewater flows into one of two clarifiers where the settled activated sludge is either returned or wasted and the supernatant flows to either the old or the new sand filter, prior to disinfection and direct discharge to the Middle Thames River. Wasted biosolids are processed/stabilized in two aerobic digesters, and held on-site in a storage tank for eventual removal. Biosolids are applied to agricultural land application sites with appropriate Nutrient Management Plans for Non-Agricultural Source Material (NASM). For purposes of calculating loading to the River, the treated effluent flow is measured at the Parshall flume located after the stilling well just before discharge to the re-aeration chamber and the Middle Thames River. The flow readings used to apportion the loading to the plant is from two meters: one on each lift station. The influent and all other meters are calibrated annually. A standby generator is available to run the onsite lift stations and a blower in the event of a power failure. The system is maintained by licensed wastewater system operators and licensed mechanics that operate, monitor, and maintain the treatment equipment, in accordance to the regulations, and collect samples as required by the ECA. Alarms automatically notify operators in the event of failure of critical operational requirements. Maple Leaf Foods has announced its closure in the spring of 2018 which will require this facility to dramatically alter its treatment configuration as an extended air plant cannot function without a sizable loadings each day. 1.2. Operating Expenses In 2016, the Thamesford Wastewater Treatment Plant had forecasted operating and maintenance expenditures of $638,000. 2. Summary and Interpretation of Monitoring Data 2.1. Effluent Quality Assurance and Control Measures Sampling Procedure Influent samples were taken from sampling ports located in-line after the influent pumps. Two 24-hour composite samplers take a sample every 15 minutes for a 24-hour period concurrent with effluent sampling. A sampler is installed on each of the municipal and the food processing company’s influent lines. The two influent streams are separately tested, and then the results are mathematically combined, based on flow ratios. In 2016, effluent samples were taken using a 24-hour composite sampler set to take a sample every 15 minutes for 24 hours. Samples were drawn from a stilling well prior to the Parshall flume immediately before the discharge. Total residual chlorine (TRC) samples are taken daily from the stilling well prior to the Parshall flume. The stilling well follows the chlorination and de-chlorination chambers. The pH of the final effluent composite sample is also measured. Following the Parshall flume, effluent flows through a discharge pipe and drops approximately 0.75 m into a discharge well, where dissolved oxygen (DO) samples are taken. This discharge well aerates the effluent prior to discharge to the River, as reflected in the DO sample results.

Thamesford Wastewater Treatment Plant | TH3
Laboratory and Field Testing Laboratory analysis is performed by SGS Lakefield Research Ltd. on all samples, except for TRC, DO, and pH which are tested in the field. These results are used for determination of compliance. Any information generated in-house is used in process control but is not included in this report. 2.2. Plant Performance & Effluent Quality The Thamesford WWTP provided effective treatment in 2016 meeting all its regulatory limits for all parameters in the effluent discharged to the Thames River. There was no single laboratory pH result for the effluent outside the discharge limit of 6 - 9.5 in 2016. Staff tests Total Residual Chlorine (TRC) in the treated effluent on a daily basis; well in excess of the required weekly testing frequency. In 2016, the monthly average results at all times met the Monthly Average TRC limit of 0.02 mg/L or less and, therefore, were in compliance. The Thamesford WWTP met all its effluent loading limits required within the ECA. Graphs of discharge parameters versus effluent discharge limits are included in this report in Appendix A. Influent wastewater characteristics and effluent discharge values are presented in the tables below.
Influent Wastewater Characteristics Parameter Concentration mg/L Loading kg/d BOD5 366 507 Total Suspended Solids 155 215 Total Phosphorus 8.0 11 Total Kjeldahl Nitrogen 71 98 Oil and Grease 19 26
Effluent Parameter
Sample Frequency
ECA Effluent Limit (Monthly Average) (milligram per liter unless
otherwise indicated)
Monthly Average Result Min-Max
(milligram per liter unless otherwise
indicated) Percentage
Removal BOD5 (May 01 to November 30) weekly 10 2.0 - 2.3 99.4 - 99.5
BOD5 (December 01 to April 30) weekly 15 2.0 – 4.0 98.9 - 99.5 Total Suspended Solids (May 01 to November 30) weekly 10 2.0 – 2.2 98.6 – 98.7 Total Suspended Solids (December 01 to April 30) weekly 15 2.0 98.7
Total Phosphorus (May 01 to November 30) weekly 0.20 0.04 - 0.11 98.6 - 99.5 Total Phosphorus (December 01 to April 30) weekly 0.50 0.03 - 0.09 98.9 - 99.6 Total Ammonia Nitrogen (May 1 to November 30) weekly 2.0 0.1 --
Total Ammonia Nitrogen (Dec. 1 to April 30) weekly 5.0 0.1 --
Total Chlorine Residual weekly 0.02 0.00 --
E.coli weekly 200
organisms/100 mL (monthly Geometric Mean
Density)
0 - 4 --
pH any single sample weekly 6.0 - 9.5 6.6 - 8.0 -- Dissolved Oxygen weekly 5 and above 6.2 – 9.0 --

Thamesford Wastewater Treatment Plant | TH4
2.3. Effluent Objectives Objectives are non-enforceable effluent quality values which the owner is obligated to use best efforts to strive towards achieving on an ongoing basis. These objectives are to be used as a mechanism to trigger corrective action proactively, and voluntarily before environmental impairment occurs and before the compliance limits are exceeded. All effluent discharge objectives listed in the Plant’s ECA were met with the exception of 4 single sample results for dissolved oxygen below the objective of 6 mg/L, and three individual samples of total phosphorus (TP) over the objective of 0.1 mg/L. The monthly average TP for June also exceeded the objective of 0.1 mg/L. The following table presents the range of effluent discharge values vs. ECA Objectives.
Effluent
Parameter Sample
Frequency
Monthly Average Objective Concentration
(milligram per liter unless otherwise indicated)
Monthly Average Result Min-Max
(milligram per liter unless otherwise indicated)
BOD5 weekly 5 2.0 – 4.0 Total Suspended Solids weekly 5 2.0 – 2.2 Total Phosphorus weekly 0.10 0.03 - 0.11 Total Ammonia Nitrogen (May 1 to November 30) weekly 1.2 0.1 Total Ammonia Nitrogen (Dec. 1 to April 30) weekly 4.0 0.1
Total Chlorine Residual weekly non-detect detected E.coli (May 1 – October 31) weekly 200 organisms/100 mL
(monthly Geometric Mean Density) 0 - 4
pH any single sample weekly 6.5 - 9.0 6.6 - 8.0 Thamesford effluent objective exceedance in the monthly average result in 2016 included the following:
Month Parameter Objective Monthly Average Result June TP 0.10 mg/L 0.11 mg/L
3. Overflows, Bypassing, Upsets, Spills, and Abnormal Conditions There were no bypasses or overflows from the Thamesford WWTP in 2016. 4. Maintenance of Works The operating and maintenance staff at the Thamesford WWTP conducts regularly scheduled maintenance of the plant equipment. The Plant utilizes a database system known as City Works to issue work orders and maintain records for regular maintenance and repair at the treatment facility. 5. Monitoring Equipment Maintenance and Calibration Calibration of flow meters is conducted yearly by Flowmetrics Technical Services Inc. The records are kept on-site at the Plant. Operational monitoring equipment calibration records are also kept on-site at the Plant. 6. Biosolids 2016 Discussion: Biosolids are aerobically digested and stored as liquid at the Thamesford WWTP. The sampling results and land application details are summarized in a separate Biosolids Annual report, available at www.oxfordcounty.ca/Services-for-You/Water-Wastewater/Wastewater/Annual-reports.

Thamesford Wastewater Treatment Plant | TH5
7. Result of MOECC 2016 Audit covering October 31, 2012 to February 23, 2016
Non-compliance with regulatory requirements and actions required
I. Older annual reports did not include calibration / maintenance of monitoring equipment records which while it is understood existed were not included. Since the issuance of the 2013 Annual Performance Report the owner has started including the calibration / maintenance records as such no further action is required. The owner is required to state if all loadings and pH are within limits and must be noted in the annual report.
Action Required:
a. No further action is required the owner needs to continue providing calibration / maintenance equipment records. The owner shall ensure loadings and pHs are assessed and include a statement within the report.
II. The logs over this period did not always include the time the activities occurred and/or time the shift
started or finished. Action Required:
a. The owner shall ensure that entries made to the logbooks meet the requirements of Reg. 129/04
III. Operations and Maintenance manual did not meet the requirements of the ECA.
Action Required:
a. Make amendments and submit updated manual by November 30, 2016. (O&M Manual Submitted November 24, 2016 to MOECC)
Summary of Recommendations and Best Practices
I. The effluent sampling results did not meet the effluent objectives stated in the ECA. Recommend:
a. From herein the owner shall use best efforts to conform to the effluent objectives.
II. The owner did not have a written contingency plan if the sludge storage was not sufficient. Recommend:
a. Develop and include in O&M manual. (Submitted with O&M Manual November.24, 2016)
8. Summary The Thamesford WWTP operated within its design flow criteria and met all effluent discharge quality limits in 2016. The Biosolids generated were utilized for beneficial reuse on agricultural land as a Non-agricultural source material (NASM) as regulated under the Nutrient Management Act (NMA); details of which are included in a separate report, available at www.oxfordcounty.ca/Services-for-You/Water-Wastewater/Wastewater/Annual-reports.

Thamesford Wastewater Treatment Plant | TH6
APPENDIX A: GRAPHS OF 2016 DISCHARGE PARAMETERS VS. EFFLUENT DISCHARGE LIMITS
1.347 1.439
1.535 1.612 1.422 1.398 1.368 1.315 1.274 1.306 1.307 1.289
0.0
0.5
1.0
1.5
2.0
2.5
3.0
Jan Feb Mar Apr May Jun Jul Aug Sep Oct Nov Dec
Efflu
ent F
low
(100
0 m
3 /d)
Month
Thamesford WWTP Effluent Monthly Average Daily Flow - 2016
Average Daily Flow (1000 m3/d)
Plant Capacity 2.5 (1000 m3/day)
4.0
2.3 2.0 2.0 2.0 2.0 2.3 2.0 2.0 2.0 2.0 2.3
0
2
4
6
8
10
12
14
16
Jan Feb Mar Apr May Jun Jul Aug Sep Oct Nov Dec
Efflu
ent B
OD
5 (m
g/L)
Month
Thamesford WWTP Effluent Monthly Average Efluent BOD5 - 2016
BOD5 (mg/L)
Freezing Criteria
Non-freezing Criteria
Freezing Period Criteria 15 (mg/L)
Non-freezing Period Criteria 10 (mg/L)
Freezing Period Criteria 15 (mg/L)
Design Criteria 2.5 (1000m3/d)

Thamesford Wastewater Treatment Plant | TH7
0.10 0.10 0.10 0.10 0.10 0.10 0.10 0.10 0.10 0.10 0.10 0.10 0
1
2
3
4
5
6
Jan Feb Mar Apr May Jun Jul Aug Sep Oct Nov Dec
Efflu
ent A
mm
onia
(mg/
L)
Month
Thamesford WWTP Effluent Monthly Average Effluent Ammonia - 2016
Ammonia (mg/L)Freezing CriteriaNon-freezing Criteria
2.0 2.0 2.0 2.0 2.0 2.0 2.0 2.2 2.0 2.0 2.0 2.0
0
2
4
6
8
10
12
14
16
Jan Feb Mar Apr May Jun Jul Aug Sep Oct Nov Dec
Efflu
ent T
SS (m
g/L)
Month
Thamesford WWTP Effluent Monthly Average Effluent TSS - 2016
TSS (mg/L)Freezing CriteriaNon-freezing Criteria
Freezing Period Criteria 5 (mg/L)
Non-freezing Period Criteria 2 (mg/L)
Freezing Period Criteria 5 (mg/L)
Freezing Period Criteria 15 (mg/L)
Non-freezing Period Criteria 10 (mg/L)
Freezing Period Criteria 15 (mg/L)

Thamesford Wastewater Treatment Plant | TH8
0.07 0.09
0.05 0.04 0.04
0.11
0.07 0.06 0.05 0.04 0.04 0.03
0.0
0.1
0.2
0.3
0.4
0.5
0.6
Jan Feb Mar Apr May Jun Jul Aug Sep Oct Nov Dec
Efflu
ent T
P (m
g/L)
Month
Thamesford WWTP Effluent Monthly Average Effluent TP - 2016
TP (mg/L)
Freezing Criteria
Non-freezing Criteria
1 1 0 2 2 4 2 1 4 2 2 3 0.0
50.0
100.0
150.0
200.0
250.0
Jan Feb Mar Apr May Jun Jul Aug Sep Oct Nov Dec
E.co
li. (#
/100
mL)
Thamesford WWTP Effluent Monthly Geometric Mean Elluent E. coli. - 2016
E. coli (#/100 mL)Criteria
Month
Freezing Period Criteria 0.5 (mg/L) Freezing Period Criteria 0.5 (mg/L)
Non-freezing Period Criteria 0.2 (mg/L)
Criteria 200 (#/100 mL)

Tillsonburg Wastewater Treatment Plant | TI1
2016 ANNUAL WASTEWATER TREATMENT SYSTEM SUMMARY REPORT
Tillsonburg Wastewater Treatment Plant
1. General Information Oxford County prepares individual annual reports summarizing each wastewater treatment plant’s operation and treated effluent discharge quality for the nine wastewater treatment plants it owns and operates. The reports detail the latest quality testing results and quantity statistics and any non-compliance conditions that may have occurred. They are available for review by the end of February on the internet at www.oxfordcounty.ca/Services-for-You/Water-Wastewater/Wastewater/Annual-reports or by contacting the Public Works Department. All efforts have been made to ensure the information presented in this report is as accurate as possible. If you have any questions or comments concerning the report, please contact the County of Oxford at the address and phone number listed below or by email at [email protected]. Wastewater Treatment Plant: Tillsonburg Wastewater Treatment Plant (WWTP) Wastewater Treatment Plant Number: 110000757
Wastewater Treatment Plant Owner & Contact Information:
Oxford County Public Works Department Environmental Services (Wastewater) P.O. Box 1614, 21 Reeve Street Woodstock, ON N4S 7Y3 Telephone: 519-539-9800 | Toll Free: 866-537-7778
Reporting Period: January 1, 2016 – December 31, 2016 1.1. System Description The Tillsonburg WWTP provides wastewater treatment for residential, commercial, and industrial users in the Town of Tillsonburg. The wastewater treatment plant is located in Coronation Park, Tillsonburg, Ontario. The Facility description is provided below.
Facility Tillsonburg Wastewater Treatment Plant
Design Capacity 8,180 m3/d
2016 Average Daily Flow 5,119 m3/d
2016 Maximum Daily Flow 10,500 m3/d
2016 Total Volume of Wastewater 1,872,879 m3/year
Classification WWT – III
Environmental Compliance Approval (ECA) #9997-82RS5A
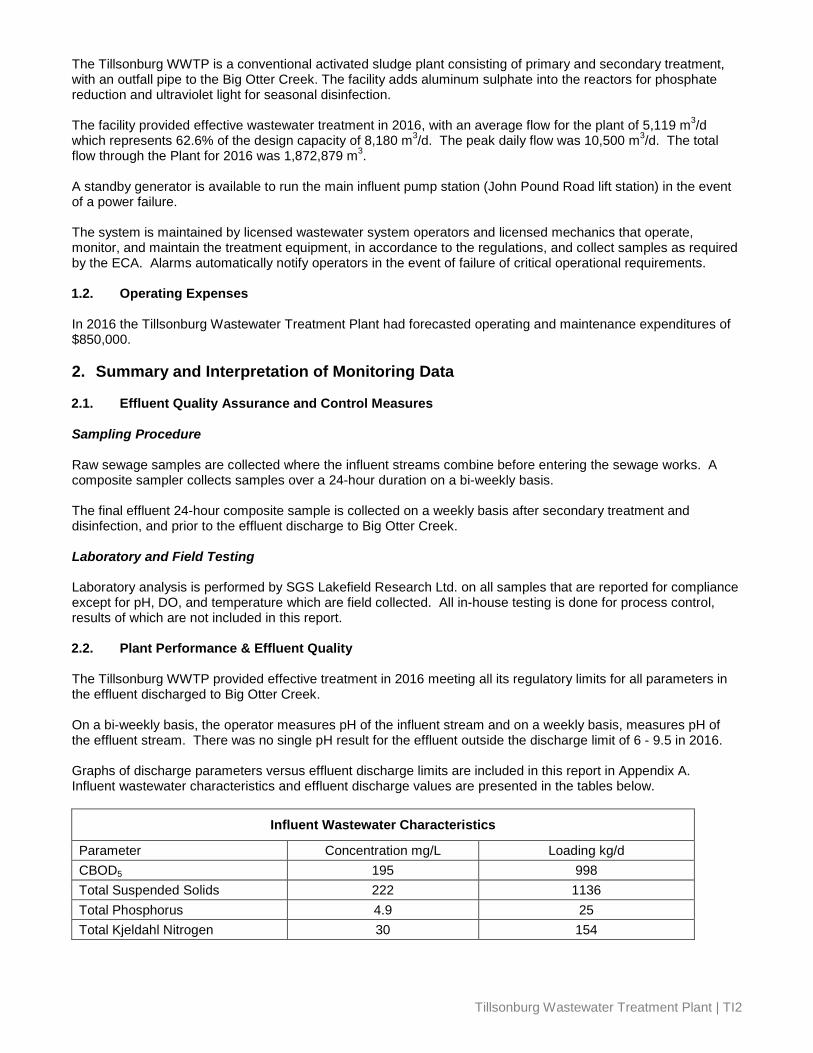
Tillsonburg Wastewater Treatment Plant | TI2
The Tillsonburg WWTP is a conventional activated sludge plant consisting of primary and secondary treatment, with an outfall pipe to the Big Otter Creek. The facility adds aluminum sulphate into the reactors for phosphate reduction and ultraviolet light for seasonal disinfection. The facility provided effective wastewater treatment in 2016, with an average flow for the plant of 5,119 m3/d which represents 62.6% of the design capacity of 8,180 m3/d. The peak daily flow was 10,500 m3/d. The total flow through the Plant for 2016 was 1,872,879 m3. A standby generator is available to run the main influent pump station (John Pound Road lift station) in the event of a power failure. The system is maintained by licensed wastewater system operators and licensed mechanics that operate, monitor, and maintain the treatment equipment, in accordance to the regulations, and collect samples as required by the ECA. Alarms automatically notify operators in the event of failure of critical operational requirements. 1.2. Operating Expenses In 2016 the Tillsonburg Wastewater Treatment Plant had forecasted operating and maintenance expenditures of $850,000. 2. Summary and Interpretation of Monitoring Data 2.1. Effluent Quality Assurance and Control Measures Sampling Procedure Raw sewage samples are collected where the influent streams combine before entering the sewage works. A composite sampler collects samples over a 24-hour duration on a bi-weekly basis. The final effluent 24-hour composite sample is collected on a weekly basis after secondary treatment and disinfection, and prior to the effluent discharge to Big Otter Creek. Laboratory and Field Testing Laboratory analysis is performed by SGS Lakefield Research Ltd. on all samples that are reported for compliance except for pH, DO, and temperature which are field collected. All in-house testing is done for process control, results of which are not included in this report. 2.2. Plant Performance & Effluent Quality The Tillsonburg WWTP provided effective treatment in 2016 meeting all its regulatory limits for all parameters in the effluent discharged to Big Otter Creek. On a bi-weekly basis, the operator measures pH of the influent stream and on a weekly basis, measures pH of the effluent stream. There was no single pH result for the effluent outside the discharge limit of 6 - 9.5 in 2016. Graphs of discharge parameters versus effluent discharge limits are included in this report in Appendix A. Influent wastewater characteristics and effluent discharge values are presented in the tables below.
Influent Wastewater Characteristics
Parameter Concentration mg/L Loading kg/d CBOD5 195 998 Total Suspended Solids 222 1136 Total Phosphorus 4.9 25 Total Kjeldahl Nitrogen 30 154

Tillsonburg Wastewater Treatment Plant | TI3
Effluent Parameter
Sample Frequency
ECA Effluent Limit (Monthly Average) (milligram per liter unless
otherwise indicated)
Monthly Average Result Min.-Max.
(milligram per liter unless otherwise indicated)
Percentage Removal
CBOD5 weekly 25 2 – 3.4 98.3 – 99.0
Total Suspended Solids weekly 25 5.2 – 7.6 96.6 – 97.7
Total Phosphorus weekly 1 0.3 - 0.6 87.8 – 93.9
E.coli (May 1 – October 31) weekly 200
organisms/100 mL (monthly Geometric Mean
Density)
3 - 14 --
pH any single sample weekly 6.0 - 9.5 6.6 – 7.9 --
2.3. Effluent Objectives Objectives are non-enforceable effluent quality values which the owner is obligated to use best efforts to strive towards achieving on an ongoing basis. These objectives are to be used as a mechanism to trigger corrective action proactively, and voluntarily before environmental impairment occurs and before the compliance limits are exceeded. All effluent discharge objectives listed in the Plant’s ECA were met at the Tillsonburg WWTP in 2016 with the exception of a single sample exceedance for TSS on August 6, 2016 of 16 mg/L compared to the objective of 15 mg/L; however, the monthly average was 6.8 mg/L. The following table presents the range of effluent discharge values vs. ECA Objectives.
Effluent Parameter
Sample Frequency
Monthly Average Objective Concentration
(milligram per liter unless otherwise indicated)
Monthly Average Result Min-Max
(milligram per liter unless otherwise indicated)
CBOD5 weekly 15 2 – 3.4
Total Suspended Solids weekly 15 5.2 – 7.6
Total Phosphorus weekly 0.8 0.3 - 0.6
E.coli (May 1 – October 31) weekly 150 organisms/100 mL (monthly Geometric Mean Density) 3 - 14
pH any single sample weekly 6.5 - 8.0 6.6 – 7.9
3. Overflows, Bypassing, Upsets, Spills, and Abnormal Conditions There were no overflows, bypasses, upsets, spills, or abnormal conditions at the Tillsonburg WWTP in 2016. 4. Maintenance of Works
The operating and maintenance staff at the Tillsonburg WWTP conducts regularly scheduled maintenance of the plant equipment. The Plant utilizes a database system known as City Works to issue work orders and maintain records for regular maintenance and repair at the treatment facility. 5. Monitoring Equipment Maintenance and Calibration
Calibration of flow meters is conducted yearly by R&R Instrumentation. The records are kept on-site at the Plant. Operational monitoring equipment calibration records are kept on-site at the Plant.

Tillsonburg Wastewater Treatment Plant | TI4
6. Biosolids 2016
Discussion: Biosolids are aerobically digested and dewatered at the Tillsonburg WWTP using an Alfa-Laval Centrifuge. The Biosolids are then stored at the Oxford County Biosolids Centralized Storage Facility (BCSF) prior to land application. The sampling results and land application details are summarized in a separate Biosolids Annual report, available at www.oxfordcounty.ca/Services-for-You/Water-Wastewater/Wastewater/Annual-reports. 7. Result of MOECC 2016 Audit covering January 1, 2012 to December 31, 2015
Non-compliance with regulatory requirements and actions required
I. Some older annual reports did not include calibration / maintenance of monitoring equipment records which while it is understood existed were not included. Action Required:
a. The owner needs to assess each of the specific requirements presented in the ECA and ensure they are included. (Since 2013, Oxford County reports have included the calibration / maintenance records.)
II. The logs over this period contained white out which should not be used; instead the error should be
crossed out and initialed by the operator. Also entries need initials even if name listed on the shift. Action Required:
a. The owner shall ensure that entries made to the logbooks meet the requirements of Reg. 129/04
III. Operations and Maintenance manual did not meet the requirements of the ECA. Action Required:
a. Make amendments and submit updated manual by October 31, 2016. (Revised O&M Manual Submitted October 28, 2016 to MOECC)
IV. Operations and Maintenance Manuals did not contain all the drawings and plans and process descriptions. Action Required:
a. Make amendments and submit updated manual by October 31, 2016. (Revised O&M Manual Submitted October.28, 2016 to MOECC)
V. The annual reports stated no complaints during the review period 2012-2015 however one log book entry in 2014 noted a response to an odour complaint. Therefore the information in the annual report for 2014 was inaccurate. (The operator investigating at the time reported the odour was not from the WWTP so it did not form part of the year end summary.) Action Required:
a. Owner shall make every effort to ensure the information reported in their Annual Report is accurate.
Summary of Recommendations and Best Practices
I. The owner was not in conformance with the design rated capacity for average daily flow into the sewage works of 8,130 m3/d on eleven occasions. Recommendation:
a. From herein the owner shall use best efforts to operate the works within the rated capacity and initiate the implementation from the Class Environmental Assessment when appropriate.

Tillsonburg Wastewater Treatment Plant | TI5
II. The owner did not meet the objectives in the ECA for pH a total of twelve times. Recommendation:
a. The owner shall continue to use best efforts to conform to the effluent objectives in the ECA.
III. There is no limit specified for Total Ammonia Nitrogen in the Tillsonburg ECA however Provincial Water
Quality Objectives (PWQO) are a desirable level of water quality that the MOECC strives to Maintain. Recommendation:
a. The owner should use best efforts to operate the works such that the PWQO for unionized ammonia is not exceeded from the works.
IV. The Owner does not have written contingency plans in place to be used in the event the facility’s sludge storage capacity is inadequate. Recommendation:
a. The owner should develop a contingency plant. (Included in O&M Manual submitted October. 28, 2016)
V. The Owner has odour abatement equipment in use that is not listed in the ECA. Recommendation:
a. The owner shall assess the ECA for the odour abatement equipment and provide the conclusion of this assessment to the MOECC by Friday July 29, 2016. (After correspondence with MOECC approvals, the engineering design firm, and the MOECC abatement branch it was noted that the equipment was listed in the application package during the last upgrade and therefore was part of the ECA, just not listed. MOECC decided that it is not necessary to capture the equipment in question in the existing ECA at this time as a new ECA application will be submitted in the near future to include upgrades and equipment changes to the existing sewage works and it may be listed at that time.)
8. Summary The Tillsonburg WWTP operated within its design flow criteria and met all effluent discharge quality limits in 2016. The Biosolids generated were utilized for beneficial reuse on agricultural land as a Non-agricultural source material (NASM) as regulated under the Nutrient Management Act (NMA); details of which are included in a separate report, available at www.oxfordcounty.ca/Services-for-You/Water-Wastewater/Wastewater/Annual-reports.

Tillsonburg Wastewater Treatment Plant | TI6
APPENDIX A: GRAPHS OF 2016 DISCHARGE PARAMETERS VERSUS EFFLUENT DISCHARGE LIMITS
5261 5451 5969
6461
5165 4915
4626 4676 4601 4722 4606 4979
0
1000
2000
3000
4000
5000
6000
7000
8000
9000
10000
Jan Feb Mar Apr May Jun Jul Aug Sep Oct Nov Dec
Efflu
ent F
low
m3/
d
Tillsonburg WWTP Effluent, Monthly Average Daily Flow - 2016
Flow (m3/d)
Criteria
Month
2.8 2.0 2.6 2.0 2.0 3.4
2.0 2.0 2.0 2.0 2.2 3.0
0
5
10
15
20
25
30
Jan Feb Mar Apr May Jun Jul Aug Sep Oct Nov Dec
Efflu
ent C
BO
D5 (
mg/
L)
Month
Tillsonburg WWTP Efluent, Monthly Average CBOD5 - 2016
CBOD5 (mg/L)
Criteria
Criteria 25 (mg/L)
Design Criteria 8180 m3/d

Tillsonburg Wastewater Treatment Plant | TI7
6.8 6.8 5.2 5.3
6.5 7.6
6.0 6.8 6.3 6.3 6.0 6.5
0.0
5.0
10.0
15.0
20.0
25.0
30.0
Jan Feb Mar Apr May Jun Jul Aug Sep Oct Nov Dec
Efflu
ent T
SS (m
g/L)
Month
Tillsonburg WWTP Effluent, Monthly Average TSS - 2016
TSS (mg/L)
Criteria
0.5 0.5
0.6
0.5 0.5
0.4 0.4 0.4 0.4
0.5
0.3
0.3
0.0
0.2
0.4
0.6
0.8
1.0
1.2
Jan Feb Mar Apr May Jun Jul Aug Sep Oct Nov Dec
TP (m
g/L)
Month
Tillsonburg WWTP Effluent, Monthly Average TP - 2016
Total P (mg/L)
Criteria
Criteria 25 (mg/L)
Criteria 1 (mg/L)

Tillsonburg Wastewater Treatment Plant | TI8
3 7 5 3 6 14
0
50
100
150
200
250
Jan Feb Mar Apr May Jun Jul Aug Sep Oct Nov Dec
Efflu
ent E
.Col
i (#/
100
ml)
Month
Tillsonburg WWTP Effluent Monthly Geometric Mean Density E. Coli - 2016
E.Coli (#/100ml)
Criteria
Criteria 200 (#/100 mL)

Woodstock Wastewater Treatment Plant | W1
2016 ANNUAL WASTEWATER TREATMENT SYSTEM SUMMARY REPORT
Woodstock Wastewater Treatment Plant
1. General Information Oxford County prepares individual annual reports summarizing each wastewater treatment plant’s operation and treated effluent discharge quality for the nine wastewater treatment plants it owns and operates. The reports detail the latest quality testing results and quantity statistics and any non-compliance conditions that may have occurred. They are available for review by the end of February on the internet at www.oxfordcounty.ca/Services-for-You/Water-Wastewater/Wastewater/Annual-reports or by contacting the Public Works Department. All efforts have been made to ensure the information presented in this report is as accurate as possible. If you have any questions or comments concerning the report, please contact the County of Oxford at the address and phone number listed below or by email at [email protected]. Wastewater Treatment Plant: Woodstock Wastewater Treatment Plant Wastewater Treatment Plant Number: 120000685
Wastewater Treatment Plant Owner & Contact Information:
Oxford County Public Works Department Environmental Services (Wastewater) P.O. Box 1614, 21 Reeve Street Woodstock, ON N4S 7Y3 Telephone: 519-539-9800 | Toll Free: 866-537-7778
Reporting Period: January 1, 2016 – December 31, 2016 1.1. System Description The Woodstock WWTP provides wastewater treatment for residential, commercial, and industrial users in the City of Woodstock and for the communities of Embro and Innerkip. It also provides treatment for septic tank waste, hauled waste, and holding tank waste from within Oxford County. In 2009, the plant completed a hydraulic capacity upgrade increasing the plant capacity from 25,000 m3/d to the current approved average daily flow capacity of 33,000 m3/d, with a peak flow capacity of 66,000 m3/d. The wastewater treatment plant is located at 195 Admiral Street Woodstock, Ontario. The Facility description is provided below.
Facility Woodstock Wastewater Treatment Plant
Design Capacity 33,000 m3/d
2016 Average Daily Flow 20,284 m3/d
2016 Maximum Daily Flow 74,771 m3/d
2016 Total Volume of Wastewater 7,413,814 m3/year
2016 Total Received Hauled Waste 20,796 m3/year
Classification WWT – IV
Environmental Compliance Approval (ECA) #5950-7XQKXS

Woodstock Wastewater Treatment Plant | W2
The Woodstock WWTP is a conventional activated sludge system consisting of primary and secondary treatment, with an outfall pipe to the Thames River. The facility adds ferrous chloride into the reactors for phosphorous removal. Sodium hypochlorite is added seasonally for disinfection along with sodium bisulfite for de-chlorination. The facility provided effective wastewater treatment in 2016, with an average flow for the plant of 20,284 m3/d which represents 61.4% of the design capacity of 33,000 m3/d. In 2016, the peak daily flow was 74,771 m3/d. The total flow through the Plant for 2016 was 7,413,814 m3. A standby generator is available to run the onsite Thames Valley Lift Station in the event of a power failure. The system is maintained by licensed wastewater system operators and licensed mechanics that operate, monitor, and maintain the treatment equipment, in accordance to the regulations, and collect samples as required by the ECA. Alarms automatically notify operators in the event of failure of critical operational requirements. 1.2. Operating Expenses In 2016 the Woodstock Wastewater Treatment Plant had forecasted operating and maintenance expenditures of $1,812,000. 2. Summary and Interpretation of Monitoring Data
2.1. Effluent Quality Assurance and Control Measures Sampling Procedure Wastewater samples are collected on a weekly basis. Raw sewage samples are collected at a location where the sewer trunks combine before entering the sewage works. A composite sampler collects samples over a 24-hour period. Following primary treatment, a second 24-hour composite sample is collected. Laboratory and Field Testing A final effluent 24-hour composite sample is collected following secondary treatment, disinfection and de-chlorination but prior to the effluent discharge to the Thames River. Laboratory analysis is performed by SGS Lakefield Research Ltd. on all samples that are reported for compliance, except for pH, DO, chlorine residual and temperature, which are field collected. All in-house testing is done for process control and is not included in this report. 2.2. Plant Performance & Effluent Quality The Woodstock WWTP provided effective treatment in 2016 meeting all its regulatory limits for all parameters in the effluent discharged to the Thames River. On a weekly basis (minimum), the operator measures pH of both the influent and effluent streams. There was no single pH result for the effluent outside the discharge limit of 6 - 9.5 in 2016. Staff tests Total Residual Chlorine (TRC) in the treated effluent on a daily basis; well in excess of the required weekly testing frequency. In 2016, the monthly average results at all times met the Monthly Average TRC limit and were less than 0.05 mg/L and, therefore, were in compliance. The Federal Government’s P2 target for TRC of 0.02 mg/L was met in 2016. Graphs of discharge parameters versus effluent discharge limits are included in this report in Appendix A. Influent wastewater characteristics and effluent discharge values are presented in the tables below.
Influent Wastewater Characteristics Parameter Concentration mg/L Loading kg/d
BOD5 132 2677 Total Suspended Solids 196 3976
Total Phosphorus 3.3 67 Total Kjeldahl Nitrogen 22.6 458

Woodstock Wastewater Treatment Plant | W3
Effluent Parameter Sample
Frequency
ECA Effluent Limit (Monthly Average) (milligram per liter unless
otherwise indicated)
Monthly Average Result Min.-Max.
(milligram per liter unless otherwise indicated)
Percentage Removal
CBOD5 (May 01 to November 30) weekly 15 2.0 - 4.0 97 – 98.5
CBOD5 (December 01 to April 30) weekly 20 2.0 - 3.5 97.1 – 98.3
Total Suspended Solids weekly 15 2.3 – 5.3 97.3 – 98.8
Total Phosphorus weekly 0.75 0.14 - 0.3 90.9 – 95.8 Total Ammonia Nitrogen (May 1 to November 30)
weekly 3 0.1 - 0.23 98.6 – 99.4
Total Ammonia Nitrogen (Dec. 1 to April 30)
weekly 5.0 0.1 - 0.27 98.2 - 99.3
Total Chlorine Residual (May 1-October 31) weekly <0.05 0.02 - 0.02 --
E.coli (May 1 – October 31) weekly
200 organisms/100 mL
(monthly Geometric Mean Density)
7.9 – 71.3 --
pH any single sample weekly 6.0 - 9.5 6.7 - 8.5 --
2.3. Effluent Objectives Objectives are non-enforceable effluent quality values which the owner is obligated to use best efforts to strive towards achieving on an ongoing basis. These objectives are to be used as a mechanism to trigger corrective action proactively, and voluntarily before environmental impairment occurs and before the compliance limits are exceeded. All effluent discharge objectives listed in the Plant’s ECA were met at the Woodstock WWTP in 2016. The following table presents the range of effluent discharge values vs. ECA Objectives.
Effluent Parameter
Sample Frequency
Monthly Average Objective Concentration
(milligram per liter unless otherwise indicated)
Monthly Average Result Min-Max
(milligram per liter unless otherwise indicated)
CBOD5 weekly 12 2.0 – 4.0
Total Suspended Solids weekly 12 2.3 – 5.3
Total Phosphorus weekly 0.5 0.14 - 0.3
Total Ammonia Nitrogen (May 1 to November 30) weekly 2.0 0.1 - 0.23
Total Ammonia Nitrogen (Dec. 1 to April 30) weekly 3.0 0.1 - 0.27
E.coli (May 1 – October 31) weekly
200 organisms/100 mL (monthly Geometric Mean
Density) 7.9 – 71.3
pH any single sample weekly 6.0 - 8.5 6.7 - 8.5

Woodstock Wastewater Treatment Plant | W4
3. Overflows, Bypassing, Upsets, Spills, and Abnormal Conditions
There were no bypasses or overflows from the Woodstock WWTP in 2016, however, there was a single event upset condition noted during the year. On May 4, 2016, there was some minor foaming going to the River due to multiple electrical failures. A generator was rented to run the blower building and an outside consulting electrical engineer was hired to troubleshoot the electrical issues and provide guidance. There were several issues identified: one was associated with the current grounding between the substation and the blower building MCC. In addition, the switchgear was not resetting. The fusing and trip protection required adjustment. The current grounding was caused by scoring of the buried wire making contact with groundwater as the underground conduit had flooded. The scoring had likely occurred during installation at the last upgrade and was made worse as the freeze and thaw caused a shifting of the conduit. Two of the switch gears at the substation were identified as problem units and were rebuilt as they would not reset or hold once tripped. A short circuit protective device coordination study was completed and a report was prepared with recommendations for adjustments to the fusing between the blower building and the substation. Corrective measures were implemented for all of these items. A report was prepared by the consulting engineer on long-term alternatives for possible upgrade options for the substation due to its age and condition. The MOECC was notified at the time and follow-up reports were submitted to the Ministry during the repairs. On February 17, 2016 there was a leak of approximately 84 m3 of wastewater from the forcemain that connects Innerkip to the Woodstock sewer system. The leak was caused by a contractor when they broke the forcemain during scheduled excavation work. A vacuum truck was called in and the affected area was cleaned up immediately. This event was reported to the MOECC at the time it occurred. 4. Maintenance of Works
The operating and maintenance staff at the Woodstock WWTP conducts regularly scheduled maintenance of the plant equipment. The Plant utilizes a database system known as City Works to issue work orders and maintain records for regular maintenance and repair at the treatment facility. 5. Monitoring Equipment Maintenance and Calibration Calibration of flow meters is conducted Flowmetrics Technical Services Inc. The records are kept on-site at the Plant. Operational monitoring equipment calibration records are kept on-site at the Plant. 6. Biosolids 2016 Discussion: Biosolids are anaerobically digested and dewatered at the Woodstock WWTP using two Alfa-Laval Centrifuges. The biosolids are then stored at the Oxford County Biosolids Centralized Storage Facility (BCSF) prior to land application. The sampling results and land application details are summarized in a separate Biosolids Annual report, available at www.oxfordcounty.ca/Services-for-You/Water-Wastewater/Wastewater/Annual-reports. 7. Result of MOECC 2016 Audit covering September 30, 2009 to March 17, 2016
Non-compliance with regulatory requirements and actions required
I. Older annual reports did not include calibration / maintenance of monitoring equipment records which while it is understood existed were not included. Since the issuance of the 2013 Annual Performance

Woodstock Wastewater Treatment Plant | W5
Report the owner has started including the calibration / maintenance records as such no further action is required. Action required:
a. No further action is required the owner needs to continue providing calibration / maintenance equipment records.
II. Operations and Maintenance manual did not meet the requirements of the ECA.
Action Required:
a. Make amendments and submit updated manual by January 30, 2017. (O&M Manual submitted on January 24, 2017 to MOECC)
III. The O&M Manual did not contain up to date drawings. The last two upgrades were provided but the overall site plan of the property has not been updated. Action Required:
a. The owner shall prepare an updated plan of the site property which shall include the current configuration of the property and all components/buildings on site. The updated drawing was forwarded to MOECC on January 24, 2017.
Summary of Recommendations and Best Practices
I. The owner did not have a written contingency plan if the sludge storage was not sufficient. Recommend:
a. Develop and include in O&M manual (Submitted with O&M Manual January 24, 2017).
8. Summary The Woodstock WWTP operated within its design flow criteria and met all effluent discharge quality limits in 2016. The Biosolids generated were utilized for beneficial reuse on agricultural land as a Non-agricultural source material (NASM) as regulated under the Nutrient Management Act (NMA); details of which are included in a separate report, available at www.oxfordcounty.ca/Services-for-You/Water-Wastewater/Wastewater/Annual-reports.

Woodstock Wastewater Treatment Plant | W6
APPENDIX A: GRAPHS OF 2016 DISCHARGE PARAMETERS VS. EFFLUENT DISCHARGE LIMITS
18,363
22,882
29,087
35,431
20,737
16,900 15,312
18,784 16,820 16,017 15,823
17,250
0
5,000
10,000
15,000
20,000
25,000
30,000
35,000
40,000
Jan Feb Mar Apr May Jun Jul Aug Sep Oct Nov Dec
Efflu
ent F
low
(m3 /d
)
Month
Woodstock WWTP Effluent, Monthly Average Daily Flow, - 2016
Monthly Avg. DailyFlow (m3/d)
Plant Capacity 33,000m3/d
2.0 2.0 2.0 2.8
2.0
4.0
2.0 2.0 2.0 2.3 2.4 3.5
0.0
5.0
10.0
15.0
20.0
25.0
Jan Feb Mar Apr May Jun Jul Aug Sep Oct Nov Dec
Efflu
ent C
BO
D5
(mg/
L)
Month
Woodstock WWTP Effluent, Monthly Average CBOD5 - 2016
CBOD5 (mg/L)
Freezing Criteria
Non-freezing Criteria
Freezing Criteria 20 (mg/L)
Non-freezing Criteria 15 (mg/L)
Freezing Criteria 20 (mg/L)
Plant Capacity 33,000 m3/d

Woodstock Wastewater Treatment Plant | W7
2.3 2.3 2.3 3.3 3.0
3.5 3.5 2.6
4.5 5.3
2.8 2.3
0
2
4
6
8
10
12
14
16
Jan Feb Mar Apr May Jun Jul Aug Sep Oct Nov Dec
Efflu
ent S
S (m
g/L)
Month
Woodstock WWTP Effluent, Monthly Average SS - 2016
SS (mg/L)
Criteria
0.22
0.15
0.22
0.14
0.21 0.23
0.30 0.29 0.29 0.28
0.22
0.16
0.0
0.1
0.2
0.3
0.4
0.5
0.6
0.7
0.8
Jan Feb Mar Apr May Jun Jul Aug Sep Oct Nov Dec
Efflu
ent T
P (m
g/L)
Month
Woodstock WWTP Effluent, Monthly Average TP - 2016
Total P (mg/L)
Criteria
Criteria 0.75 (mg/L)
Criteria 15 (mg/L)

Woodstock Wastewater Treatment Plant | W8
0.27 0.20 0.27 0.10 0.12 0.23 0.13 0.12 0.13 0.13 0.10 0.10
0
1
2
3
4
5
6
Jan Feb Mar Apr May Jun Jul Aug Sep Oct Nov Dec
Efflu
ent A
mm
onia
(mg/
L)
Month
Woodstock WWTP Effluent, Monthly Average Ammonia - 2016
Ammonia (mg/L)
Freezing Period Criteria
Non-freezing Period Criteria
0
50
100
150
200
250
Jan Feb Mar Apr May Jun Jul Aug Sep Oct Nov Dec
Efflu
ent E
. Col
i (#/
100
mL)
Month
Woodstock WWTP Effluent, Monthly Geomean E. Coli, - 2016
E. Coli (#/100 mL) geomean
Criteria
Criteria 200 #/100 mL
Freezing Period Criteria 5 (mg/L)
Non-freezing Period Criteria 3 (mg/L)
Freezing Period Criteria 5 (mg/L)