2016 Annual Results - premieroil.prod-mid-euw3.investis.com
34
2016 Annual Results 9 March 2017
Transcript of 2016 Annual Results - premieroil.prod-mid-euw3.investis.com
2016 Annual Results 9 March 2017

Forward-looking statements
This presentation may contain forward-looking statements and information that both represents management's current expectations or beliefs concerning future
events and are subject to known and unknown risks and uncertainties.
A number of factors could cause actual results, performance or events to differ materially from those expressed or implied by these forward-looking statements.
March 2017 | P1

Agenda
2016 highlights
Financial results
Refinancing update
Production update
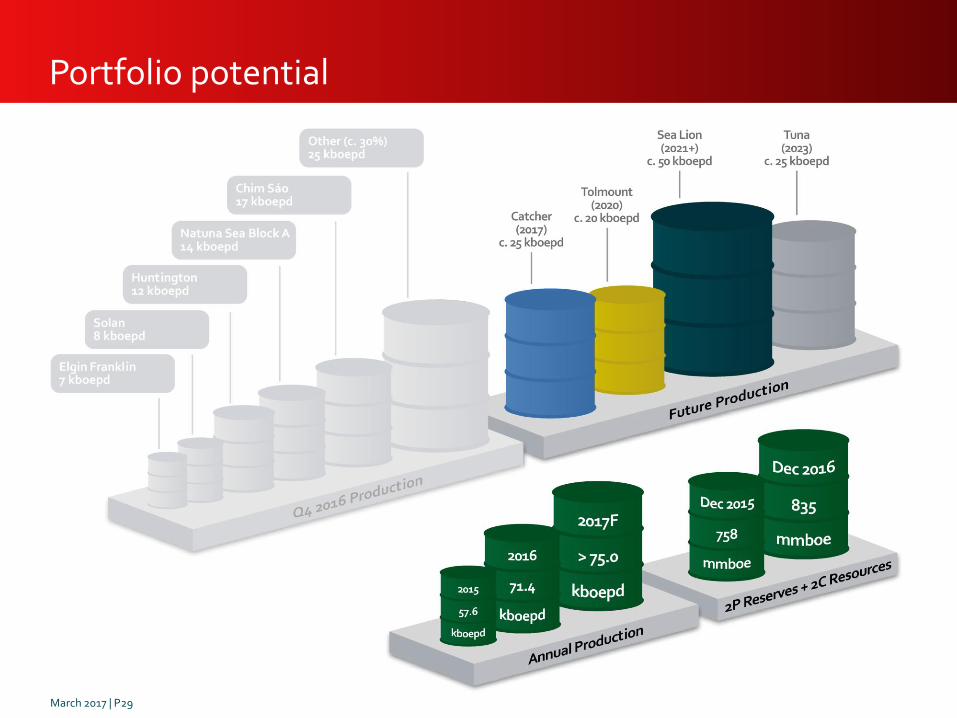
Portfolio potential
Outlook
Tony Durrant
Richard Rose
Richard Rose
Tony Durrant
Robin Allan
Tony Durrant
March 2017 | P2

2016 highlights
March 2017 | P3
Liquidity preserved and covenants headroom expanded; Debt maturities re-set at 2021 or beyond
71.4 kboepd, above guidance, driven by high operating efficiency across the portfolio
Strong production performance
Reduction in cost base
Re-focussing the portfolio
Progressing Catcher
Increased 2P reserves and 2C resources
Financial performance
$15.8/boe opex, 10% under budget; Other savings in capex and G&A costs
Value accretive E.ON acquisition completed; Disposal programme for non-core assets
On target for mid-year sailaway and Q4 first oil; Project costs down 29% against sanction
2P reserves increased to 353 mmboe; Reserves and resources up by 10% to 835 mmboe
Net debt reduced from peak levels Profits of $123m for full year (2015: $ 1.1 bn loss)
Refinancing substantially complete

Financial results Richard Rose

Financial highlights and outlook
March 2017 | P5
2016 highlights
• Profitable and positive operating cash flow
• Low and stable operating costs of $15.8/boe
• Reduced capex commitments
• Net debt down from peak in Q3 2016
Outlook
• Refinancing expected to complete by end of May
• E.ON acquisition to reach payback earlier than anticipated
• Cash flow positive in 2017; accelerated debt reduction once Catcher on-stream
• Targeting Net Debt/EBITDA <3x by end 2018
2015 2016 2017F
UK 30.0 24.4 21.4
Vietnam 11.7 8.7 10.9
Indonesia 10.0 10.1 10.1
Pakistan 3.7 3.7 4.0
Group 15.5 15.8 15.9
Capex ($m)
Opex ($/boe)
0
200
400
600
800
2016A 2017F
Exploration & appraisal
Development
Abandonment & payments into escrow

Positive operating cash flow
12 months to 31 Dec 2016 $m
12 months to 31 Dec 2015 $m
Working Interest production (kboepd) 71.4 57.6
Entitlement production (kboepd) 66.1 53.4
Realised oil price (US$/bbl) – post hedge 52.2 79.0
Realised int’l gas price (US$/mcf) – post hedge 4.9 6.0
Realised UK gas price (p/therm) – post hedge 47.6 -
$m $m
Cash flow from operations 492 903
Taxation (61) (94)
Operating cash flow 431 809
Capital expenditure (678) (1,070)
Decommissioning cash escrow (62) -
Acquisitions / disposals (119) 220
Finance and other charges, net (152) (101)
Net cash in (out) flow (580) (142)
Net Debt (2,765) (2,242)
Capital expenditure ($m) 2017 liquids and UK gas hedging Oil hedges % hedged
Price ($/bbl)
Fixed price oil hedges 21% 50.8
Oil option sales 16% 50.7
UK gas hedges % hedged Price
(p/therm)
Fixed price 41% 49.6
2016 2017F
Exploration $102 $50
Development $550 $290
Abandonment $27 $50
Total $678 $390
March 2017 | P6

12 months to 31 Dec 2016 $m
12 months to 31 Dec 2015 $m
Sales and other operating revenues 983 1,099
Cost of Sales (773) (661)
Impairments (556) (1,024)
Gross profit/(loss) (345) (586)
Exploration/New Business (58) (109)
Reduction in decommissioning estimate 76 -
General and administration costs (24) (14)
Gain (loss) on disposals (incl. E.ON excess over acquired value) 207 1
Operating profit/(loss) (145) (708)
Financial items (245) (122)
Profit/(loss) before taxation (390) (830)
Tax credit/(charge) 522 (241)
Loss from discontinued operation (9) (33)
Profit/(loss) after taxation 123 (1,104)
Return to profit 2016
EBITDAX1 526 752
March 2017 | P7 1 Covenant EBITDAX estimated at $583m, includes pro forma adjustments for acquisitions & disposals

Refinancing Richard Rose
Q1 2017
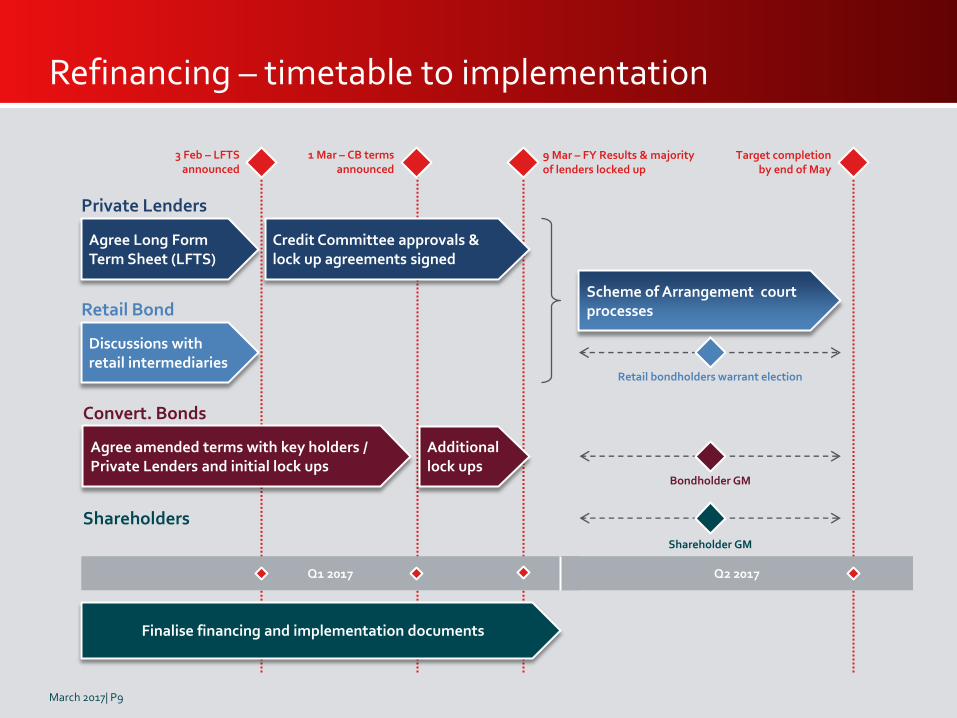
Refinancing – timetable to implementation
March 2017| P9
Private Lenders
Agree Long Form Term Sheet (LFTS)
Agree amended terms with key holders / Private Lenders and initial lock ups
Discussions with retail intermediaries
Convert. Bonds
Retail Bond Scheme of Arrangement court processes
3 Feb – LFTS announced
Q2 2017
1 Mar – CB terms announced
Additional lock ups
Target completion by end of May
Credit Committee approvals & lock up agreements signed
9 Mar – FY Results & majority of lenders locked up
Shareholders
Bondholder GM
Shareholder GM
Finalise financing and implementation documents
Retail bondholders warrant election

Refinancing terms
March 2017 | P10
Debt type Key amended terms
Private lenders ($3.3bn) • RCF & LC: $2.5bn • Term Loans1: $314m • USPP1: $380m • Schuldschein: $130m
• Total facilities confirmed • Alignment of maturity dates to 31 May 2021 • Amendment of financial covenants • Enhanced economics • A security package • Corporate governance controls
Retail bonds (£150m)
• Maturity date extended to 31 May 2021 • Enhanced economics • Security package, ranking alongside the
private debt facilities
Convertible bonds ($245m)
• Maturity date extended to 31 May 2022 • Interest rate to remain at 2.50% • Conversion price reset • Equity warrants • No cash amendment fee • Issuer call after 1 year at 140% of
conversion price
Drawn Debt Total Facilities(incl cash)
Cash & Undrawn
$4.0 bn Facilities confirmed 1
$3.4 bn
Outlook • Cash and undrawn facilities of $593m • Cash flow positive at forward curve; debt reduction accelerating once Catcher on-stream • Targeting Net Debt/EBITDA <3x by end 2018
1 FX as at when facilities entered into
0
1,000
2,000
3,000
4,000
2017 2018 2019 2020 2021 2022
Existing
Proposed
Maturities extended 1

Producing portfolio Tony Durrant

Production overview
March 2017 | P12
Largest 5 fields account for c. 70% of production

Chim Sáo, Vietnam (53.125%, operator)
March 2017 | P13
20P 5IPST1
2016 highlights • Operating efficiency of 94% • $8.7/boe operating cost • Strong reservoir performance • Reduction in FPSO lease rate • Reserves increase of 13 mmboe Outlook • 2 infill wells planned in 2017 • Field life extended to 2028
0
5
10
15
20
25
30
35
2016 2017 2018 2019 2020
CurrentPrevious
Improved Production Profile kboepd (gross)
59 mmboe reserves
remaining
55 mmboe at sanction
57 mmboe produced
to date

March 2017 | P14
Natuna Sea Block A, Indonesia (28.67%, operator)
2016 highlights • Singapore demand above take or pay • 44% of GSA vs 41% contractual share • Record deliveries under GSA2 • Operating efficiency >90% • Opex of $8.3/boe Outlook • Singapore demand stable • GSA1 market share increasing • Lama well tied into production (Q3 2017) • Gajah Baru infill drilling opportunities • BIGP first gas 2019
0
20
40
60
80
100
0
5
10
15
20
2016 2017 2018 2019 2020
NSBA Production net to PMO (kboepd)
Market Share GSA1 (%)
BIGP
30% IRR
93 Bcf
$340m gross capex

Huntington, Central North Sea (100%, operator)
March 2017 | P15
2016 highlights • Increased equity to 100% • Production significantly increased
− High operating efficiency − Strong reservoir performance
Outlook • FPSO lease extension discussions underway
Currently producing
~15 kboepd

March 2017 | P16
Solan, West of Shetlands (100%, operator)
2016 highlights • First oil achieved • Operational concept working well • Central reservoir on prognosis Outlook • Eastern area of field under-performing • Secured Transocean Spitzbergen rig at
competitive rate to install 2 ESPs in P1
P1
W2
P2
W1
500m
Top Solan Sand Depth Map

March 2017 | P17
Elgin-Franklin, Central North Sea (5.2%)
2016 production (gross)
2016 highlights • 105 kboepd for 8 months to 31
December 2016
• Strong winter gas demand
• Low opex of $6.3/boe
Outlook • Long field life; production forecast to
continue until 2037
• 350 mmboe remaining reserves
• Ongoing infill drilling, well intervention programme & exploration upside
0
20
40
60
80
100
120
140
May Jun Jul Aug Sep Oct Nov Dec
kboepd 2016 production (gross)
Summer Maintenance

Portfolio potential Robin Allan
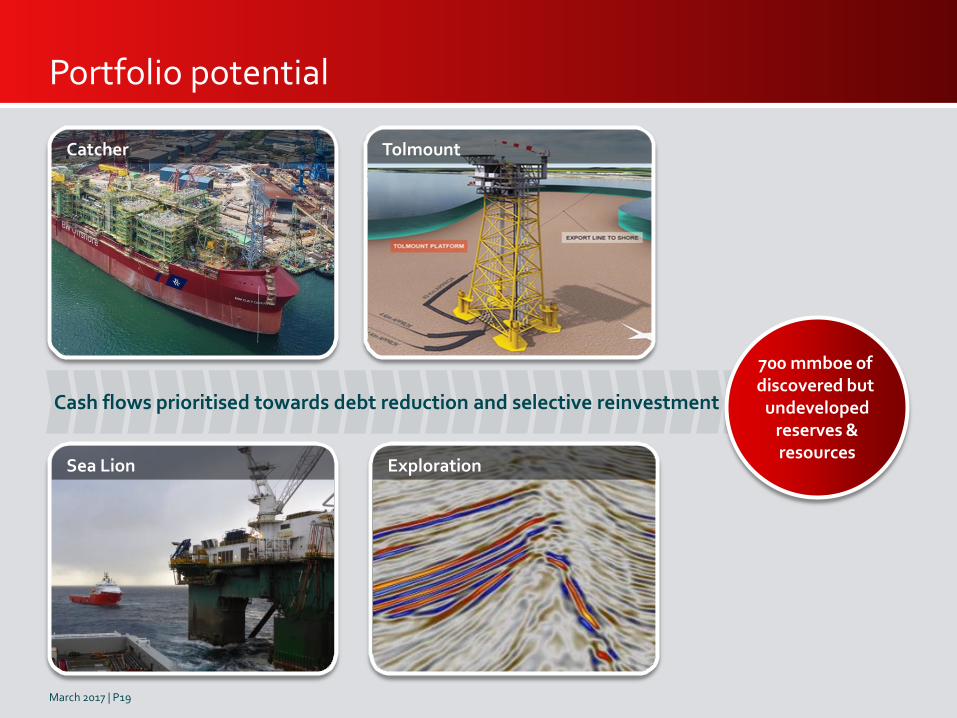
Portfolio potential
Catcher Tolmount
Sea Lion
Cash flows prioritised towards debt reduction and selective reinvestment
700 mmboe of discovered but
undeveloped reserves & resources
Exploration
March 2017 | P19

Catcher – under budget, start up 2017 2H
2016 Highlights
• Subsea installation programme successfully completed below budget
• 9 wells completed to date with excellent operational performance
• Fabrication of FPSO hull completed and all topside modules lifted onto vessel
• Capex reduced by 29% to $1.6bn
1,000
1,200
1,400
1,600
1,800
2,000
2,200
2,400
Sanctionedcapex
FX Subsea Drillex Owners Capexestimate
US$mm
March 2017 | P20
Varadero
Catcher
Burgman 0
2000
4000
6000
8000
10000
12000
CCP3 CTP1 BP3 BP5 VP2 VP3 VP4
Net pay length (ft)
Net pay length - Producers
Predicted cumulative NPL
Actual cumulative NPL
Net pay encountered
above prognosis

Catcher FPSO progress since 2015
March 2017 | P21
March 2-16 – STB Japan
March
2017 June
2016 March
2015
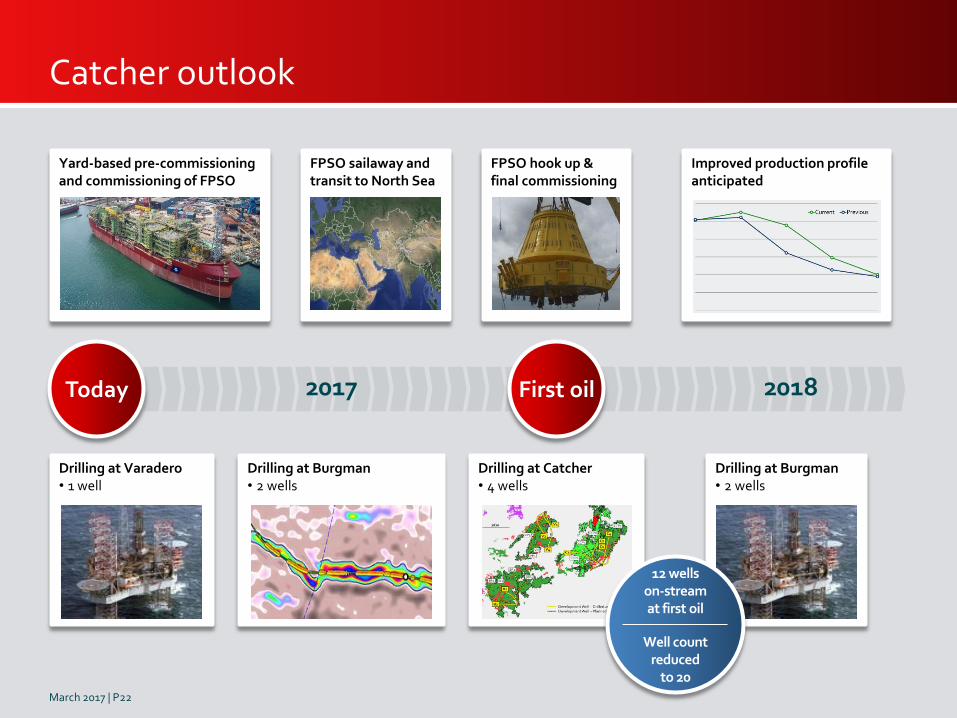
Drilling at Burgman • 2 wells
Drilling at Varadero • 1 well
Yard-based pre-commissioning and commissioning of FPSO
Drilling at Burgman • 2 wells
Catcher outlook
FPSO hook up & final commissioning
Improved production profile anticipated
Drilling at Catcher • 4 wells
FPSO sailaway and transit to North Sea
2017 2018 Today First oil
12 wells on-stream at first oil
Well count reduced
to 20
March 2017 | P22

Indicative metrics • ~1 Tcf potential (GTA) • Capex ~$550m • Designed for daily peak
production of 300 mmcfd • First gas 2020
Tolmount – next phase of growth
Timetable to sanction • Most significant discovery in SNS since 1997 • Concept selected Q1
– Standalone, normally unmanned – 4 platform wells – 48km x 20” gas export to onshore
• Offshore FEED contract awarded; engineering commenced
• Potential 3rd party infrastructure funding • FID targeted for Q1 2018
High return project robust down to low
gas prices
Drillex 25%
Owners 14%
Platform 16%
SURF 19%
Onshore terminal
27%
Capex Split
March 2017 | P23

2017 2018 2019 2020 2021 2022
JV Project Sanction
Platform
Gas Export Pipeline
Landfall Construction
Host Modifications
Development Drilling
First Gas
Tolmount East (Illustrative) Subsurface studies & pre development
Tolmount – project timeline
FEED & EPC tendering
Design and Fabrication
Design and Fabrication
Design and Construction
Well 1
Well 2
Well 3
Well 4
Onshore pipeline, shaft & tunnel construction
Cofferdam & nearshore
Offshore pipelay
Commissioning
Topsides HUC
March 2017 | P24
Execute

Tolmount – future phases planned
March 2017 | P25
Tolmount East • Subsea tie-back or small platform
Tolmount Far East • Subsea tie-back or small platform
to Tolmount or Tolmount East
Mongour • Subsea tie-back or extended reach
well from Tolmount East
3rd party business potential • A new hub with 20+ year life
Tolmount
Mongour
Tolmount East
Tolmount Far East
Tolmount area
~ 1 Tcf
Indicative production profile
42/28d-12 NE SW
Tolmount Tolmount East
Tolmount Far-East
Gas water contact

Southern Gas Basin: portfolio of opportunities
Portfolio of opportunities
which are economic at
low gas prices
Tolmount Main (50% op) • On path to sanction
Ravenspurn North Deep (5% carried interest) • Play-opening carboniferous well
currently drilling Babbage (47% op)
• Infill opportunities
Cobra (50% op) • Appraisal planning underway
Tolmount Area (50% op) • Future phases in planning
March 2017 | P26

Sea Lion
March 2017 | P27
Highlights
• FEED substantially completed
• Breakeven reduced to $45/bbl
– Capex to first oil reduced to $1.5bn
– Field opex reduced to $15/bbl
– Indicative FPSO cost of $10/bbl (LOF)
Outlook
• Positive commercial and fiscal engagement with FIG
• Positive engagement with contractor market and export credit government funding sources
• Licence extension to April 2020
0
20
40
60
80
100
120
140
160
0 5 10 15 20
An
nu
al a
vera
ge
oil
ra
te (
mb
op
d)
Years from first production
Phase 2
Phase 1

Exploration update – Mexico
ENSCO 8503
Flat Spot
• Exercised option to increase to 25% in Block 7, Mexico
• 100-500 mmbbl prospect in 165m of water
• Drilling Q2 2017, rig contracted
full stack reprocessed seismic data in depth
E W Zama-1 Well
March 2017 | P28
Good conformance of seismic amplitude with structural contours
salt
salt
3D view of the Zama Prospect showing top structure map and seismic amplitudes of the target interval
Zama-1 Well
Portfolio potential
March 2017 | P29

Outlook Tony Durrant

Financing and commercial initiatives to bring Sea Lion to next phase in 2018
2017 – Targets
Maintain operating efficiency levels; Meet guidance of 75 kboepd (excluding Catcher)
Production
Cost Base
Non-core disposals
Catcher
Tolmount
Exploration
Targeting further reductions in opex and G&A costs
Realise >$100m from non-core disposals
Deliver first oil in 2017; build on development drilling programme to optimise forward production; further cost reduction
Progress FEED and commercial discussions for Premier Board approval in Q4
Identify and test best prospects eg Mexico (2017)
Future Growth
March 2017 | P31
Net debt reduction Positive net cash flow, post disposals

• De-leveraging from free cash flow • Covenant and liquidity headroom • Stable and low cost base
19.7 18.5
15.5 15.8 15.9
2013 2014 2015 2016 2017F
Opex $/boe
• Optimise quality producing assets in UK, Vietnam, Indonesia
• Falklands, Mexico, Brazil offer transforming upside • Continuing programme of disposals
Looking forward
Strategy
Financial flexibility
• Tolmount – high quality project • Optimising Sea Lion • Material exploration upside in SNS, Mexico & Brazil • Potential UK acquisitions
Selective growth
opportunities
• 80-90 kboepd; $15-20/bbl opex long-life asset base • Balance sheet debt reduction • Highly leveraged to further oil and gas price recovery
Forward Position
March 2017 | P32
0
500
1000
OperatingCash Flow
Capex& Abex
OperatingCash Flow
Capex& Abex
$m $55/bbl
$65/bbl
$75/bbl
On production 2P reserves
Discovered but undeveloped 2P reserves and 2C resources
~140 mmboe
~700 mmboe
2018 2019

Premier Oil Plc 23 Lower Belgrave Street London SW1W 0NR Tel: +44 (0)20 7730 1111 Fax: +44 (0)20 7730 4696 Email: [email protected]
www.premier-oil.com
March 2017