
2016 Annual Report - UTG – Ins€¦ · 2016 Annual Report . 1 March 28, 2017 ... FSBI operates...
53
2016 Annual Report
Transcript of 2016 Annual Report - UTG – Ins€¦ · 2016 Annual Report . 1 March 28, 2017 ... FSBI operates...

2016 Annual Report

1
March 28, 2017 Dear Shareholder: In 1998, we became a shareholder of UTG. Just like you, we were interested in the growth of the Company and the value this growth created for all shareholders. However, during the early years the stock didn’t provide the level of performance we hoped for. As a result, we decided to assume the responsibility of management and operations in 2001. Since that time, the Company has experienced steady growth even during tough economic times. Some of the highlights are as follows:
STAT Capital has increased from $14MM to $45MM.
The stock price rose from $4.00 to a high of $19.00 and as of March 2017 was trading at $17.50.
For the last two years, we have been blessed with investments that continue to strengthen our balance sheet.
In 2016, we successfully moved a majority of our operations from Springfield, Illinois to Stanford, Kentucky. We plan to keep in place the remaining team members in Springfield. The move was accomplished with very little interruption and has already provided many benefits.
We take seriously our job of providing a safe and growing Company for all of our shareholders. As we move into 2017, we continue to focus on having a strong triple bottom line with an economic, social and spiritual impact. We continue to buy back shares for those who want to sell. Just give our office a call for additional information if you are so inclined. It is our honor to serve you. Sincerely, Jesse T. Correll Chairman

2
Mission Statement
The UTG Family is committed to making a positive difference in the lives of those we touch by: Believing in ourselves and each other. Providing quality, one-on-one customer service and valuing our relationships. Ensuring profitability through administrative efficiency. Giving of ourselves to the community and sharing the rewards of our endeavors.
MOTTO:
WE CARE
Corporate Values
1 We give our best in all we do.
2 We strive to be problem solvers.
3 We believe in a positive and festive work environment.
4 We practice appropriate communication etiquette.
5 We value everyone by treating them with dignity, honesty and respect.
6 We always accomplish more as a team.
7 We consider ourselves as hosts to our guests.
8 We promote a humble, servant’s attitude with others.
9 We strive to be good stewards of our time and resources.
10 We deliver more than is expected.
11 We give credit where credit is due.
12 We foster new ideas and learn from those that fail.
13 We maintain a balance in life by making time for faith, family and friendships.
14 We seek to learn from our mistakes.
15 We welcome and embrace change.

3
Business Overview UTG, Inc. (the "Registrant", “Company” or “UTG”) is an insurance holding company incorporated in the state of Delaware in 2005. Its primary direct subsidiary is Universal Guaranty Life Insurance Company (“UG”). The Registrant and its primary subsidiary have only one significant segment, insurance. The Company’s dominant business is individual life insurance, which includes the servicing of existing insurance business in-force, the acquisition of other companies in the insurance business, and the administration processing of life insurance business for other entities. The holding company has no significant business operations of its own and relies on fees, dividends and other distributions from its operating subsidiary as the principal source of cash flows to meet its obligations. Additional information regarding the cash flow and liquidity needs of the holding company can be found in the Liquidity and Capital Resources section of the Management’s Discussion and Analysis of Financial Conditions and Results of Operations. UG has several wholly-owned and majority-owned subsidiaries. The subsidiaries were formed to hold certain real estate and other investments. The investments were placed into the limited liability companies and partnerships to provide additional protection to the policyholders and to UG. Increased global IT security threats and more sophisticated and targeted computer crime pose a risk to the security of systems and networks and the confidentiality, availability and integrity of data. Although the Company makes efforts to maintain the security and integrity of the networks and systems, there can be no assurance that the security efforts will be effective or that attempted security breaches or disruptions would not be successful or damaging. In the event a security breach or failure results in the disclosure of sensitive third party data or the transmission of harmful/malicious code to third parties, the Company could be subject to liability claims. The Company does not currently carry insurance coverage against such liabilities. Depending on their nature and scope, such threats also could potentially lead to improper use of our systems and networks, manipulation and destruction of data, loss of trade secrets, system downtimes and operational disruptions, which in turn, could adversely affect our reputation, competitiveness and results of operations. This document at times will refer to the Registrant’s largest shareholder, Mr. Jesse T. Correll and certain companies controlled by Mr. Correll. Mr. Correll holds a majority ownership of First Southern Funding LLC, a Kentucky corporation, (“FSF”) and First Southern Bancorp, Inc. (“FSBI”), a financial services holding company. FSBI operates through its 100% owned subsidiary bank, First Southern National Bank (“FSNB”). Banking activities are conducted through multiple locations within south-central and western Kentucky. Mr. Correll is Chief Executive Officer and Chairman of the Board of Directors of UTG and is currently UTG’s largest shareholder through his ownership control of FSF, FSBI and affiliates. At December 31, 2016, Mr. Correll owns or controls directly and indirectly approximately 63.75% of UTG’s outstanding stock. UTG’s website is: www.utgins.com. Information regarding the Company, including recent filings with the Securities and Exchange Commission, are accessible via this website. Management’s Discussion and Analysis of Financial Condition and Results of Operations The following is Management’s discussion and analysis of the financial condition and results of operations of UTG, Inc. and its subsidiaries (collectively with the Parent, the “Company”) for the years ended December 31, 2016 and 2015. This discussion should be read in conjunction with the consolidated financial statements and notes thereto included elsewhere in this report.

4
Cautionary Statement Regarding Forward-Looking Statements
This report on Form 10-K contains certain forward-looking statements within the meaning of Section 27A of the Securities Act of 1933 and Section 21E of the Securities Exchange Act of 1934, which are intended to be covered by the safe harbors created by those laws. We have based our forward-looking statements on our current expectations and projections about future events. Our forward-looking statements include information about possible or assumed future results of operations. All statements, other than statements of historical facts, included or incorporated by reference in this report that address activities, events or developments that we expect or anticipate may occur in the future, including such things as the growth of our business and operations, our business strategy, competitive strengths, goals, plans, future capital expenditures and references to future successes may be considered forward-looking statements. Also, when we use words such as “anticipate,” “believe,” “estimate,” “expect,” “intend,” “plan,” “probably,” or similar expressions, we are making forward-looking statements. Numerous risks and uncertainties may impact the matters addressed by our forward-looking statements, any of which could negatively and materially affect our future financial results and performance. Although we believe that the assumptions underlying our forward-looking statements are reasonable, any of these assumptions, and, therefore, the forward-looking statements based on these assumptions, could themselves prove to be inaccurate. In light of the significant uncertainties inherent in the forward-looking statements that are included in this report, our inclusion of this information is not a representation by us or any other person that our objectives and plans will be achieved. In light of these risks, uncertainties and assumptions, any forward-looking event discussed in this report may not occur. Our forward-looking statements speak only as of the date made, and we undertake no obligation to update or review any forward-looking statement, whether as a result of new information, future events or other developments, unless the securities laws require us to do so.
Overview UTG, Inc., a Delaware corporation, is a life insurance holding company. The Company’s dominant business is individual life insurance, which includes the servicing of existing insurance policies in-force, the acquisition of other companies in the life insurance business, the acquisition of blocks of business and the administration and processing of life insurance business for other entities. UTG has a strong philanthropic program. The Company generally allocates a portion of its earnings to be used for its philanthropic efforts primarily targeted to Christ-centered organizations or organizations that help the weak or poor. The Company also encourages its staff to be involved on a personal level through monetary giving, volunteerism and use of their talents to assist those less fortunate than themselves. Through these efforts, the Company hopes to make a positive difference in the local community, state, nation and world.
Critical Accounting Policies
We have identified the accounting policies below as critical to the understanding of our results of operations and our financial condition. The application of these critical accounting policies in preparing our consolidated financial statements requires Management to use significant judgments and estimates concerning future results or other developments including the likelihood, timing or amount of one or more future transactions or amounts. Actual results may differ from these estimates under different assumptions or conditions. On an on-going basis, we evaluate our estimates, assumptions and judgments based upon historical experience and various other information that we believe to be reasonable under the circumstances. For a detailed discussion of other significant

5
accounting policies, see Note 1 – Summary of Significant Accounting Policies in the Notes to the Consolidated Financial Statements. Future Policy Benefits – Because of the long-term nature of insurance contracts, the insurance company is liable for policy benefit payments that will be made in the future. The liability for future policy benefits is determined by standard actuarial procedures common to the life insurance industry. The accounting policies for determining this liability are disclosed in Note 1 – Summary of Significant Accounting Policies in the Notes to the Consolidated Financial Statements. Cost of Insurance Acquired – The costs of acquiring blocks of insurance form other companies or through the acquisition of other companies are deferred and recorded as deferred acquisition costs. The deferred amounts are recorded as an asset and amortized to expense in a systematic manner as indicated in Note 1 – Summary of Significant Accounting Policies in the Notes to the Consolidated Financial Statements. Valuation of Securities – The Company’s investment portfolio consists of fixed maturities, equity securities, trading securities, mortgage loans and real estate to provide funding of future policy contractual obligations. The Company’s fixed maturities and equity securities are classified as available-for-sale. Available-for-sale investments are carried at fair value with unrealized gains and losses reported in accumulated other comprehensive income (loss) in the Consolidated Balance Sheets. The Company’s trading securities are carried at fair value with unrealized gains and losses reported in income in the Consolidated Statements of Operations. Fair value is the price that the Company would expect to receive upon sale of the asset in an orderly transaction. Mortgage loans on real estate are carried at their unpaid principal balances, adjusted for amortization of premium or discount and valuation allowances. Valuation allowances are established for impaired loans when it is probable that contractual principal and interest will not be collected. A portion of the mortgage loan balance consists of discounted mortgage loans that were purchased at deep discounts through an auction process led by the Federal Government. In general, the discounted mortgage loans are non-performing and there is a significant amount of uncertainty surrounding the timing and amount of cash flows to be received by the Company. Accordingly, the Company records its investment in the discounted mortgage loans at its original purchase price adjusted for any principal receipts received. Investment real estate held for sale is reported at the lower of cost or fair value less cost to sell. Expenses to maintain the property are expensed as incurred. Notes receivable are reported at their unpaid principal balances, adjusted for valuation allowances. Valuation allowances are established for impaired loans when it is probable that contractual principal and interest will not be collected. Interest accruals are analyzed based on the likelihood of repayment. The Company does not utilize a specified number of days delinquent to cause an automatic non-accrual status. While the available-for-sale securities are generally expected to be held to maturity, they are classified as available-for-sale and are sold periodically to manage risk. Although a majority of the investment portfolio is classified as available-for-sale, the Company has the ability and intent to hold the securities until maturity. See Note 2 – Investments in the Notes to the Consolidated Financial Statements for detailed disclosures regarding the Company’s investment portfolio.

6
Impairment of Investments – The Company continually monitors the investment portfolio for investments that have become impaired in value; where fair value has declined below carrying value. While the value of the investments in the Company’s portfolio continuously fluctuate due to market conditions, an other-than-temporary impairment charge is recorded only when a security has experienced a decline in fair market value which is deemed to be other than temporary. The policies and procedures the Company uses to evaluate and account for impairments of investments are disclosed in Note 1 – Summary of Significant Accounting Policies and Note 2 – Investments in the Notes to the Consolidated Financial Statements. The Company makes every effort to appropriately assess the status and value of the securities with the information available regarding an other-than-temporary impairment. However, it is difficult to predict the future prospects of a distressed or impaired security. Deferred Income Taxes – The provision for deferred income taxes is based on the asset and liability method of accounting for income taxes. Under this method, deferred income taxes are recognized by applying enacted statutory tax rates to temporary differences between amounts reported in the Consolidated Financial Statements and the tax basis of existing assets and liabilities. A valuation allowance is recognized for the portion of deferred tax assets that, in Management's judgment, is not likely to be realized. The effect on deferred income taxes of a change in tax rates or laws is recognized in income tax expense in the period that includes the enactment date. Refer to Note 1 – Summary of Significant Accounting Policies in the Notes to the Consolidated Financial Statements for detailed information regarding the Company’s significant accounting policies.
Results of Operations On a consolidated basis, the Company had net income attributable to common shareholders of $1.2 million and $917,000 in 2016 and 2015, respectively. In 2016, income before income taxes was $2.1 million compared to $273,000 in 2015. Total revenue was $27.8 million in 2016 and $28.8 million in 2015. One-time events, primarily reflected in realized gains, comprise a substantial portion of the net income and revenue reported by the Company during 2016 and 2015. The magnitude of realized investment gains and losses in a given year is a function of the timing of trades of investments relative to the markets themselves as well as the recognition of any impairments on investments. Future earnings will be significantly negatively impacted should earnings from these one-time items not be realizable in a future period. While Management believes there remain additional investments with such one-time earnings, when or if realized remains uncertain. Total benefits and other expenses paid in 2016 were $25.7 million compared to $28.5 million in 2015. Revenues Premiums and policy fee revenues, net of reinsurance premiums and policy fees, decreased approximately 15% when comparing 2016 to 2015. The Company writes very little new business. Unless the Company acquires a new company or a block of in-force business, Management expects premium revenue to continue to decline on the existing block of business at a rate consistent with prior experience. The Company’s average persistency rate for all policies in-force for 2016 and 2015 was approximately 96.6% and 96.2%, respectively. Persistency is a measure of insurance in-force retained in relation to the previous year.
7
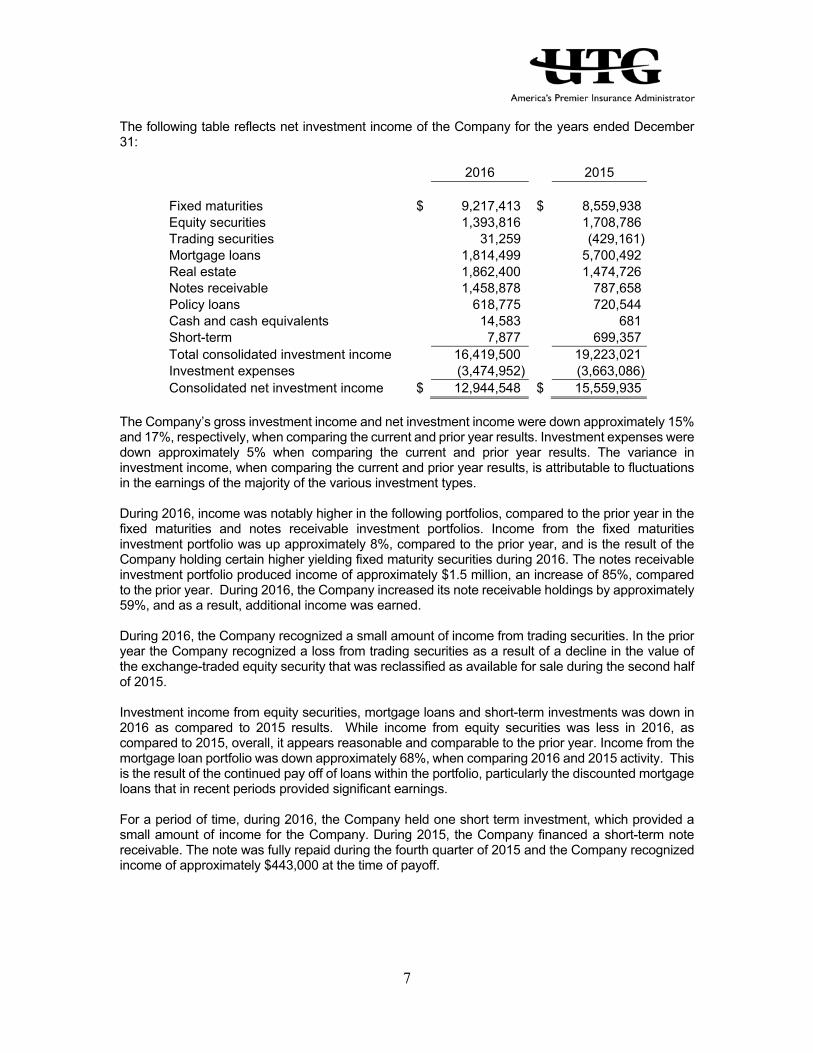
The following table reflects net investment income of the Company for the years ended December 31:
2016 2015 Fixed maturities $ 9,217,413 $ 8,559,938 Equity securities 1,393,816 1,708,786 Trading securities 31,259 (429,161) Mortgage loans 1,814,499 5,700,492 Real estate 1,862,400 1,474,726 Notes receivable 1,458,878 787,658 Policy loans 618,775 720,544 Cash and cash equivalents 14,583 681 Short-term 7,877 699,357 Total consolidated investment income 16,419,500 19,223,021 Investment expenses (3,474,952) (3,663,086) Consolidated net investment income $ 12,944,548 $ 15,559,935
The Company’s gross investment income and net investment income were down approximately 15% and 17%, respectively, when comparing the current and prior year results. Investment expenses were down approximately 5% when comparing the current and prior year results. The variance in investment income, when comparing the current and prior year results, is attributable to fluctuations in the earnings of the majority of the various investment types. During 2016, income was notably higher in the following portfolios, compared to the prior year in the fixed maturities and notes receivable investment portfolios. Income from the fixed maturities investment portfolio was up approximately 8%, compared to the prior year, and is the result of the Company holding certain higher yielding fixed maturity securities during 2016. The notes receivable investment portfolio produced income of approximately $1.5 million, an increase of 85%, compared to the prior year. During 2016, the Company increased its note receivable holdings by approximately 59%, and as a result, additional income was earned. During 2016, the Company recognized a small amount of income from trading securities. In the prior year the Company recognized a loss from trading securities as a result of a decline in the value of the exchange-traded equity security that was reclassified as available for sale during the second half of 2015. Investment income from equity securities, mortgage loans and short-term investments was down in 2016 as compared to 2015 results. While income from equity securities was less in 2016, as compared to 2015, overall, it appears reasonable and comparable to the prior year. Income from the mortgage loan portfolio was down approximately 68%, when comparing 2016 and 2015 activity. This is the result of the continued pay off of loans within the portfolio, particularly the discounted mortgage loans that in recent periods provided significant earnings. For a period of time, during 2016, the Company held one short term investment, which provided a small amount of income for the Company. During 2015, the Company financed a short-term note receivable. The note was fully repaid during the fourth quarter of 2015 and the Company recognized income of approximately $443,000 at the time of payoff.

8
The following table reflects net realized investment gains (losses) for the years ended December 31:
2016 2015
Fixed maturities available for sale $ 1,360,235 $ 1,248,240 Equity securities 1,582,611 780,396 Real estate 4,934,566 5,968,558 Equity securities – OTTI 0 (3,515,700) Real estate – OTTI 0 (54,901) Notes receivable – OTTI (465,754) 0 Consolidated net realized investment gains $ 7,411,658 $ 4,426,593
The Company recognized approximately $3 million more in net realized gains in 2016 as compared to 2015. Gains from fixed maturities were comparable from year to year. The gains from equity securities were up approximately $800,000 and are the result of selling certain equity securities. The 2016 realized gains from real estate are mainly attributable to the sale of two real estate parcel, which produced realized gains of approximately $4.4 million. During 2015, the realized gains from real estate were mainly attributable to the sale of three real estate parcels, which produced net gains of approximately $5 million. Gains from the sale of real estate are the result of one-time events and are expected to vary from year to year. During 2016 and 2015, realized gains were offset by other-than-temporary impairments of approximately $467,000 and $3.6 million, respectively. The other-than-temporary impairments were taken as a result of Management’s assessment and consideration of the length of time the securities have remained in an unrealized loss position and as a result of management’s analysis and determination of value. The investments were written down to better reflect their current estimated fair value. In summary, the Company’s basis for future revenue is expected to come from the following primary sources: Conservation of business currently in-force, the maximization of investment earnings and the acquisition of other companies or policy blocks in the life insurance business. Management has placed a significant emphasis on the development of these revenue sources to enhance these opportunities. Expenses The Company reported total benefits and other expenses of $25.7 million and $28.5 million for the twelve-month period ended December 31, 2016 and 2015, respectively. Benefits, claims and settlement expenses represented approximately 69% and 66% of the Company’s total expenses for 2016 and 2015, respectively. The other major expense category of the Company is operating expenses, which represented 28% and 31% of the Company’s total expenses for 2016 and 2015, respectively. Benefits, claims and settlement expenses, net of reinsurance benefits, decreased approximately 6% in 2016 compared to 2015. The decrease primarily relates to changes in the Company’s death claim experience. Policy claims vary from year to year and therefore, fluctuations in mortality are to be expected and are not considered unusual by Management. Changes in policyholder reserves, or future policy benefits, also impact this line item. Reserves are calculated on an individual policy basis and generally increase over the life of the policy as a result of additional premium payments and acknowledgement of increased risk as the insured continues to age.

9
The short-term impact of policy surrenders is negligible since a reserve for future policy benefits payable is held which is, at a minimum, equal to and generally greater than the cash surrender value of a policy. The benefit of fewer policy surrenders is primarily received over a longer time period through the retention of the Company’s asset base. Operating expenses decreased approximately 18% in 2016 compared to 2015. When analyzing 2016 and 2015 operating expenses, expenses were down slightly in the majority of the categories. The salaries and charitable contribution expense categories recognized the largest decrease when comparing current and prior year activity. The decrease in salary expense is the result of changes in staffing. Charitable contributions are a function of the Company’s earnings. As mentioned above in the Overview section of the Management Discussion and Analysis, UTG has a strong philanthropic program. The Company generally allocates a portion of its earnings to be used for its philanthropic efforts primarily targeted to Christ-centered organizations or organizations that help the weak or poor. Charitable contributions made by the Company are expected to vary from year to year depending on the earnings of the Company. Net amortization of cost of insurance acquired decreased approximately 4% when comparing current and prior year activity. Cost of insurance acquired is established when an insurance company is acquired or when the Company acquires a block of in-force business. The Company assigns a portion of its cost to the right to receive future profits from insurance contracts existing at the date of the acquisition. Cost of insurance acquired is amortized with interest in relation to expected future profits, including direct charge-offs for any excess of the unamortized asset over the projected future profits. The interest rates may vary due to risk analysis performed at the time of acquisition on the business acquired. The Company utilizes a 12% discount rate on the remaining unamortized business. The amortization is adjusted retrospectively when estimates of current or future gross profits to be realized from a group of products are revised. Amortization of cost of insurance acquired is particularly sensitive to changes in interest rate spreads and persistency of certain blocks of insurance in-force. This expense is expected to decrease, unless the Company acquires a new block of business. During 2015, Management determined it was in the Company’s best long term interest to relocate its main operations from Springfield, Illinois to Stanford, Kentucky. The Company’s majority shareholder, Jess Correll, headquarters his other operating entities in Stanford, Kentucky. Management believes this move will provide the Company with significant synergies, improve efficiencies and reduce overall operating expenses. The relocation was substantially complete as of December 31, 2016. Effective January 1, 2017, the Company and FSNB began sharing certain services. The shared services focuses on departments commonly utilized by both organizations such as Financial Accounting, Human Resources and Information Technology. Management continues to place significant emphasis on expense monitoring and cost containment. Maintaining administrative efficiencies directly impacts net income.

10
Financial Condition
Investment Information Investments are the largest asset group of the Company. The Company's insurance subsidiary is regulated by insurance statutes and regulations as to the type of investments they are permitted to make, and the amount of funds that may be used for any one type of investment. The following table reflects, by investment category, the investments held by the Company as of December 31:
2016
As a % of Total
Investments
As a % of
Total Assets
Fixed maturities $ 187,239,718 55 % 47 %Trading securities 2,500 0 % 0 %Equity securities 51,707,103 15 % 13 %Mortgage loans 18,577,372 5 % 5 %Real estate 57,138,980 17 % 14 %Notes receivable 16,876,485 5 % 4 %Policy loans 10,070,134 3 % 3 %Total investments $ 341,612,292 100 % 86 %
2015
As a % of Total
Investments
As a % of
Total Assets
Fixed maturities $ 185,119,097 58 % 49 %Equity securities 45,685,340 15 % 12 %Mortgage loans 17,769,930 6 % 5 %Real estate 47,650,102 15 % 13 %Notes receivable 10,597,907 3 % 3 %Policy loans 10,684,244 3 % 3 %Total investments $ 317,506,620 100 % 85 %
The Company's investments are generally managed to match related insurance and policyholder liabilities. The comparison of investment return with insurance or investment product crediting rates establishes an interest spread. Interest crediting rates on adjustable rate policies have been reduced to their guaranteed minimum rates, and as such, cannot be lowered any further. Policy interest crediting rate changes and expense load changes become effective on an individual policy basis on the next policy anniversary. Therefore, it takes a full year from the time the change was determined for the full impact of such change to be realized. If interest rates decline in the future, the Company will not be able to lower rates and both net investment income and net income will be impacted negatively. The Company’s total investments represented 86% and 85% of the Company’s total assets as of December 31, 2016 and 2015, respectively. Fixed maturities consistently represented a substantial portion, 55% and 58%, respectively, of the total investments during 2016 and 2015. The overall investment mix, as a percentage of total investments, remained fairly consistent when comparing the investments held as of December 31, 2016 and 2015.

11
As of December 31, 2016, the carrying value of fixed maturity securities in default as to principal or interest was immaterial in the context of consolidated assets, shareholders’ equity or results from operations. To provide additional flexibility and liquidity, the Company has identified all fixed maturity securities as "investments available for sale". Investments available for sale are carried at market value, with changes in market value charged directly to the other comprehensive component of shareholders' equity. Changes in the market value of available for sale securities resulted in net unrealized gains of approximately $22.4 million during 2016 and net unrealized losses of approximately $(7.2) million during 2015. The variance in the net unrealized gains and losses is the result of normal market fluctuations mainly related to changes in interest rates in the market place. During 2015, the trading securities asset balance decreased while the equity securities balance increased. As disclosed in Note 2 - Investment of the Consolidated Financial Statements, as of June 30, 2015, the Company reclassified its remaining exchange-traded equity trading security to the available for sale category. The fair value of the security at the time of the reclassification was $3,224,000. Trading securities are purchased and held primarily for purposes of selling them in the near term and reflect active and frequent buying and selling. Management analyzed the recent buying and selling activity related to the exchange-traded equity and deemed the available for sale category to better reflect Management’s intent for this security going forward. Through June 30, 2015, unrealized gains and losses from this exchange-traded equity were recorded as a component of earnings. Going forward unrealized gains/losses are reported as a component of comprehensive income. Management continues to view the Company’s investment portfolio with utmost priority. Significant time has been spent internally researching the Company’s risk and communicating with outside investment advisors about the current investment environment and ways to ensure preservation of capital and mitigate losses. Management has put extensive efforts into evaluating the investment holdings. Additionally, members of the Company’s Board of Directors and investment committee have been solicited for advice and provided with information. Management reviews the Company’s entire portfolio on a security level basis to be sure all understand our holdings, potential risks and underlying credit supporting the investments. Management intends to continue its close monitoring of its bond holdings and other investments for additional deterioration or market condition changes. Future events may result in Management’s determination that certain current investment holdings may need to be sold which could result in gains or losses in future periods. Such future events could also result in other than temporary declines in value that could result in future period impairment losses. There are a number of significant risks and uncertainties inherent in the process of monitoring impairments and determining if impairment is other-than-temporary. These risks and uncertainties related to Management’s assessment of other-than-temporary declines in value include but are not limited to: the risk that Company's assessment of an issuer's ability to meet all of its contractual obligations will change based on changes in the credit characteristics of that issuer; the risk that the economic outlook will be worse than expected or have more of an impact on the issuer than anticipated; the risk that fraudulent information could be provided to the Company's investment professionals who determine the fair value estimates. Liquidity Liquidity provides the Company with the ability to meet on demand the cash commitments required by its business operations and financial obligations. The Company’s liquidity is primarily derived from a portfolio of marketable securities and line of credit facilities. The Company has two principal needs for cash – the insurance company’s contractual obligations to policyholders and the payment of operating expenses.

12
Parent Company Liquidity UTG is a holding company that has no day-to-day operations of its own. Cash flows from UTG’s insurance subsidiary, UG, are used to pay costs associated with maintaining the Company in good standing with states in which it does business and purchasing outstanding shares of UTG stock. UTG's cash flow is dependent on management fees received from its insurance subsidiary, stockholder dividends from its subsidiary and earnings received on cash balances. As of December 31, 2016 and 2015, substantially all of the consolidated shareholders’ equity represents net assets of its subsidiaries. In 2016, the Parent company received $1 million in dividends from its insurance subsidiary and $4 million in 2015. Certain restrictions exist on the payment of dividends from the insurance subsidiary to the Parent company. For further information regarding the restrictions on the payment of dividends by the insurance subsidiary, see Note 9 – Shareholders’ Equity in the Notes to the Consolidated Financial Statements. Although these restrictions exist, dividend availability from the insurance subsidiary has historically been sufficient to meet the cash flow needs of the Parent company. Insurance Subsidiary Liquidity Sources of cash flows for the insurance subsidiary primarily consist of premium and investment income. Cash outflows from operations include policy benefit payments, administrative expenses, taxes and dividends to the Parent company. Short-Term Borrowings An additional source of liquidity to the Parent company and its subsidiaries is the line of credit facilities extended to them. As of December 31, 2016 and 2015, the Company and its subsidiaries had available $18 million in line of credit facilities. For additional information regarding the line of credit facilities, see Note 7 – Credit Arrangements in the Notes to the Consolidated Financial Statements. The Company expects to have readily available funds for the foreseeable future to conduct its operations and to maintain target capital ratios in the insurance subsidiary through internally generated cash flow and the credit facilities. In the unlikely event that more liquidity is needed, the Company could generate additional funds through such sources as a short-term credit facility and intercompany borrowing. Consolidated Liquidity Cash used in operating activities was approximately $11.4 million and $11.1 million in 2016 and 2015, respectively. Sources of operating cash flows of the Company, as with most insurance entities, is comprised primarily of premiums received on life insurance products and income earned on investments. Uses of operating cash flows consist primarily of payments of benefits to policyholders and beneficiaries and operating expenses. The Company has not marketed any significant new products for several years. As such, premium revenues continue to decline. Management anticipates future cash flows from operations to remain similar to historic trends. During 2016, the Company’s investing activities provided net cash of approximately $16.7 million. During 2015, the Company’s investing activities provided net cash of approximately $13.6 million. Proceeds from investments sold decreased approximately 15% or $12 million when comparing 2016 to 2015. Investment purchases decreased approximately 21% or $13.7 million. The net cash provided by investing activities is expected to vary from year to year depending on market conditions and management’s ability to find and negotiate favorable investment contracts.

13
Net cash used in financing activities was approximately $2 million and $6 million during 2016 and 2015, respectively. On July 22, 2016, the Company entered in to an agreement to acquire 300,000 shares of its outstanding common stock from a shareholder that owned approximately 8% of the Company’s outstanding common stock. The acquisition was made under the Company’s stock buy-back program. As part of this transaction, two promissory notes totaling $2.9 million were issued. The notes require principal payments of one half of the note value to be paid one year from the date of purchase and the other one half to be paid two years from the date of purchase. The notes bear interest at 0%. During 2015, the Company made principal payments on its outstanding debt of approximately $4.4 million and as of December 31, 2015 the Company had no debt outstanding with third parties. The Company had cash and cash equivalents of approximately $15.2 million and $11.8 million as of December 31, 2016 and 2015, respectively. The Company has a portfolio of marketable fixed and equity securities that are available for sale, if an unexpected event were to occur. These securities had a fair value of approximately $239 million and $231 million at December 31, 2016 and 2015, respectively. However, the strong cash flows from investing activities, investment maturities and the availability of the line of credit facilities make it unlikely that the Company would need to sell securities for liquidity purposes. See Note 2 – Investments in the Notes to the Consolidated Financial Statements for detailed disclosures regarding the Company’s investment portfolio. Management believes the overall sources of liquidity available will be sufficient to satisfy its financial obligations. Capital Resources The Company’s capital structure consists of short-term debt, long-term debt and shareholders’ equity. A complete analysis and description of the short-term and long-term debt issues outstanding as of December 31, 2016 and 2015 are presented in Note 7 – Credit Arrangements in the Notes to the Consolidated Financial Statements. The Company had $2.9 million of outstanding debt as of December 31, 2016 and $0 as of December 31, 2015. On July 22, 2016, the Company entered in to an agreement to acquire 300,000 shares of its outstanding common stock from a shareholder that owned approximately 8% of the Company’s outstanding common stock. The acquisition was made under the Company’s stock buy-back program. As part of this transaction, two promissory notes totaling $2.9 million were issued. The notes require principal payments of one half of the note value to be paid one year from the date of purchase and the other one half to be paid two years from the date of purchase. The notes bear interest at 0%. See Note 7 – Credit Arrangements in the Notes to the Consolidated Financial Statements for detailed disclosures regarding the Company’s notes payable. The NAIC's risk-based capital requirements require insurance companies to calculate and report information under a risk-based capital formula. The risk-based capital (RBC) formula measures the adequacy of statutory capital and surplus in relation to investment and insurance risks such as asset quality, mortality and morbidity, asset and liability matching and other business factors. The RBC formula is used by state insurance regulators as an early warning tool to identify, for the purpose of initiating regulatory action, insurance companies that potentially are inadequately capitalized. At December 31, 2016, UG has a ratio of approximately 4.97, which is 497% of the authorized control level. Accordingly, the Company meets the RBC requirements.

14
The Board of Directors of UTG has authorized the repurchase in the open market or in privately negotiated transactions of UTG's common stock. At a meeting of the Board of Directors on June 15, 2016, the Board of Directors of UTG authorized the repurchase of up to an additional $2 million of UTG’s common stock and on July 14, 2016, the Board of Directors again increased the amount available by an additional $4.5 million, for a total repurchase of $14.5 million. Repurchased shares are available for future issuance for general corporate purposes. Company Management has broad authority to operate the program, including the discretion of whether to purchase shares and the ability to suspend or terminate the program. Open market purchases are made based on the last available market price but may be limited. During 2016, the Company repurchased approximately 370,172 shares through the stock repurchase program for $5,432,195. Through December 31, 2016, UTG has spent approximately $11.9 million in the acquisition of approximately 1,059,000 shares under this program. As mentioned in Note 7 above, on July 22, 2016 the Company entered in to an agreement to acquire 300,000 shares of its outstanding common stock from a shareholder that owned approximately 8% of the Company’s outstanding common stock. The purchase price per share was $14.50 was derived through private negotiation. The purchase was paid with cash and the issuance of promissory notes. Shareholders’ equity was approximately $94 million and $77 million as of December 31, 2016 and 2015, respectively. Total shareholders' equity increased approximately 22% in 2016 compared to 2015. The increase is primarily attributable to the change in accumulated other comprehensive income (loss). As of December 31, 2016, the Company reported an accumulated other comprehensive income of approximately $20.4 million and accumulated other comprehensive loss of approximately $1.2 million as of December 31, 2015. The change in accumulated other comprehensive income (loss) is mainly attributable to the net unrealized holding gains of approximately $22.4 million during 2016 compared to net unrealized holding losses of $7.2 million reported during 2015. As previously discussed in the above in the Financial Condition – Investment Information section of the MD&A, the variance in the net unrealized gains and losses is the result of normal market fluctuations mainly related to changes in interest rates in the market place. The Company's investments provide sufficient return to cover future obligations. The Company carries all of its fixed maturity holdings as available for sale, which are reported in the Consolidated Financial Statements at their fair value.
New Accounting Pronouncements
See Note 1 – Summary of Significant Account Policies in the Notes to the Consolidated Financial Statements for information regarding new accounting pronouncements.
Off-Balance Sheet Arrangements
The Company does not have any off-balance sheet arrangements, financing activities or other relationships with unconsolidated entities or other persons.
Contractual Obligations
As a smaller reporting company, as defined by Rule 12b-2 of the Exchange Act and Item 10(f)(1) of Regulation S-K, the Company has elected to comply with certain scaled disclosure reporting obligations, and therefore does not have to provide the information required by this item.

15
Management’s Report on Internal Controls Over Financial Reporting Our Management is responsible for establishing and maintaining adequate internal control over financial reporting, as such term is defined in Exchange Act Rules 13a-15(f) and 15d-15(f). The Company’s internal control over financial reporting is designed to provide reasonable assurance regarding the preparation of financial statements for external purposes in accordance with generally accepted accounting principles.
The Company’s Management assessed the effectiveness of the Company’s internal control over financial reporting as of December 31, 2016. In making the assessment, Management used the criteria issued by the Committee of Sponsoring Organizations of the Treadway Commission (“COSO”) in Internal Control-Integrated Framework. Based on Management’s assessment, Management concluded that, as of December 31, 2016, the Company’s internal control over financial reporting was effective.
This annual report does not include an attestation report of the Company’s independent registered public accounting firm regarding internal control over financial reporting. Management’s report was not subject to attestation by the Company’s independent registered public accounting firm pursuant to rules of the Securities and Exchange Commission that permit the Company to provide only Management’s report in this Annual Report.
Changes in Internal Controls There have been no changes in the Company’s internal control over financial reporting since December 31, 2016, in connection with the evaluation required by paragraph (d) of Exchange Act Rule 13a-15(e) and 15d-15(e), that have materially affected, or are reasonably likely to materially affect, the Company’s internal control over financial reporting. The Company’s process for evaluating controls and procedures is continuous and encompasses constant improvement of the design and effectiveness of established controls and procedures and the remediation of any deficiencies, which may be identified during this process.

16

17
See accompanying notes.
2016 2015Investments: Investments available for sale: Fixed maturities, at fair value (amortized cost $170,595,860 and $188,647,671) $ 187,239,718 $ 185,119,097 Equity securities, at fair value (cost $37,014,712 and $43,954,737) 51,707,103 45,685,340 Trading securities, at fair value (cost $70,690 and $0) 2,500 0 Mortgage loans on real estate, at amortized cost 18,577,372 17,769,930 Investment real estate 57,138,980 47,650,102 Notes receivable 16,876,485 10,597,907 Policy loans 10,070,134 10,684,244 Total investments 341,612,292 317,506,620
Cash and cash equivalents 15,156,548 11,822,615Accrued investment income 2,872,850 2,821,338Reinsurance receivables:
Future policy benefits 26,974,819 27,462,830Policy claims and other benefits 3,952,465 3,553,978
Cost of insurance acquired 7,267,397 8,140,379Property and equipment, net of accumulated depreciation 1,564,944 2,016,611Income taxes recoverable 1,223,682 619,043Other assets 1,476,356 3,283,681 Total assets $ 402,101,353 $ 377,227,095
Liabilities:Policy liabilities and accruals:
Future policy benefits $ 263,844,559 $ 269,119,859Policy claims and benefits payable 3,889,572 3,759,565Other policyholder funds 428,769 457,774Dividend and endowment accumulations 14,504,583 14,233,644
Deferred income taxes 15,459,049 3,405,467Notes payable 2,900,000 0Trading securities, at fair value (proceeds $181,159 and $108,881) 1,439 28,609Other liabilities 6,771,540 9,234,675
Total liabilities 307,799,511 300,239,593
Shareholders' equity:Common stock - no par value, stated value $.001 per share
Authorized 7,000,000 shares - 3,349,927 and 3,699,447 shares issued and outstanding 3,350 3,699Additional paid-in capital 37,878,712 43,002,670Retained earnings 34,230,307 33,062,282Accumulated other comprehensive income (loss) 20,353,692 (1,183,552)Total UTG shareholders' equity 92,466,061 74,885,099Noncontrolling interest 1,835,781 2,102,403
Total shareholders' equity 94,301,842 76,987,502 Total liabilities and shareholders' equity $ 402,101,353 $ 377,227,095
ASSETS
LIABILITIES AND SHAREHOLDERS' EQUITY
UTG, Inc.Consolidated Balance Sheets
As of December 31, 2016 and 2015

18
See accompanying notes.
2016 2015
Revenues:
Premiums and policy fees $ 9,742,849 $ 11,164,857 Reinsurance premiums and policy fees (2,853,741) (3,090,503) Net investment income 12,944,548 15,559,935 Other income 591,919 707,069 Revenues before realized gains (losses) 20,425,575 24,341,358 Realized investment gains (losses), net: Other-than-temporary impairments (465,754) (3,570,601) Other realized investment gains, net 7,877,412 7,997,194 Total realized investment gains, net 7,411,658 4,426,593 Total revenues 27,837,233 28,767,951
Benefits and other expenses:
Benefits, claims and settlement expenses: Life 18,657,060 20,245,920 Ceded reinsurance benefits and claims (2,517,075) (2,919,064) Annuity 1,120,684 996,485 Dividends to policyholders 432,150 446,567 Commissions (139,167) (168,533) Amortization of cost of insurance acquired 872,982 907,605 Operating expenses 7,288,133 8,916,771 Interest expense 0 68,876 Total benefits and other expenses 25,714,767 28,494,627
Income before income taxes 2,122,466 273,324Income tax benefit (expense) (666,181) 932,715
Net income 1,456,285 1,206,039
Net income attributable to noncontrolling interest (288,260) (289,419)
Net income attributable to common shareholders' $ 1,168,025 $ 916,620
Amounts attributable to common shareholders':
Basic income per share $ 0.33 $ 0.25
Diluted income per share $ 0.33 $ 0.25
Basic weighted average shares outstanding 3,537,394 3,704,322
Diluted weighted average shares outstanding 3,537,394 3,704,322
UTG, Inc.Consolidated Statements of Operations
For the Years Ended December 31, 2016 and 2015

19
See accompanying notes.
2016 2015
Net Income $ 1,456,285 $ 1,206,039
Other comprehensive income (loss):
Unrealized holding gains (losses) arising during period, pre-tax 34,494,457 (11,117,183) Tax (expense) benefit on unrealized holding gains (losses) arising during the period (12,073,060) 3,891,014 Unrealized holding gains (losses) arising during period, net of tax 22,421,397 (7,226,169)
Less reclassification adjustment for gains included in net income (1,360,235) (1,248,241) Tax expense for gains included in net income 476,082 436,884 Reclassification adjustment for gains included in net income, net of tax (884,153) (811,357) Subtotal: Other comprehensive income (loss), net of tax 21,537,244 (8,037,526)
Comprehensive income (loss) 22,993,529 (6,831,487)
Less comprehensive income attributable to non controlling interest (288,260) (289,419)
Comprehensive income (loss) attributable to UTG, Inc. $ 22,705,269 $ (7,120,906)
UTG, Inc.
For the Years Ended December 31, 2016 and 2015Consolidated Statements of Comprehensive Income (Loss)

20
See accompanying notes.
Yea
r en
ded
Dec
embe
r 31
, 20
16C
omm
on
Sto
ckA
dditi
onal
Pai
d-In
C
apita
lR
etai
ned
Ear
ning
s
Acc
umul
ated
O
ther
C
ompr
ehen
sive
In
com
e (L
oss)
Non
cont
rolli
ng
Inte
rest
Tota
l S
hare
hold
ers'
E
quity
Bal
ance
at
Janu
ary
1, 2
016
$3,
699
$43
,002
,670
$33
,062
,282
$(1
,183
,552
)$
2,10
2,40
3$
76,9
87,5
02C
omm
on s
tock
issu
ed d
urin
g ye
ar21
307,
866
00
030
7,88
7Tr
easu
ry s
hare
s ac
quire
d (3
70)
(5,4
31,8
24)
00
0(5
,432
,194
)N
et in
com
e at
trib
utab
le t
o co
mm
on s
hare
hold
ers
00
1,16
8,02
50
01,
168,
025
Unr
ealiz
ed h
oldi
ng g
ain
on s
ecur
ities
net
of n
onco
ntro
lling
in
tere
st a
nd r
ecla
ssifi
catio
n ad
just
men
t an
d ta
xes
00
021
,537
,244
021
,537
,244
Con
trib
utio
ns0
00
083
,696
83,6
96D
istr
ibut
ions
00
00
(638
,578
)(6
38,5
78)
Gai
n at
trib
utab
le t
o no
ncon
trol
ling
inte
rest
00
00
288,
260
288,
260
Bal
ance
at
Dec
embe
r 31
, 20
16$
3,35
0$
37,8
78,7
12$
34,2
30,3
07$
20,3
53,6
92$
1,83
5,78
1$
94,3
01,8
42
Yea
r en
ded
Dec
embe
r 31
, 20
15C
omm
on
Sto
ckA
dditi
onal
Pai
d-In
C
apita
lR
etai
ned
Ear
ning
s
Acc
umul
ated
O
ther
C
ompr
ehen
sive
In
com
e (L
oss)
Non
cont
rolli
ng
Inte
rest
Tota
l S
hare
hold
ers'
E
quity
Bal
ance
at
Janu
ary
1, 2
015
$3,
706
$43
,122
,944
$32
,145
,662
$6,
853,
974
$1,
446,
314
$83
,572
,600
Com
mon
sto
ck is
sued
dur
ing
year
1925
4,90
80
00
254,
927
Trea
sury
sha
res
acqu
ired
(26)
(375
,182
)0
00
(375
,208
)N
et in
com
e at
trib
utab
le t
o co
mm
on s
hare
hold
ers
00
916,
620
00
916,
620
Unr
ealiz
ed h
oldi
ng lo
ss o
n se
curit
ies
net
of n
onco
ntro
lling
in
tere
st a
nd r
ecla
ssifi
catio
n ad
just
men
t an
d ta
xes
00
0(8
,037
,526
)0
(8,0
37,5
26)
Con
trib
utio
ns0
00
01,
124,
217
1,12
4,21
7D
istr
ibut
ions
00
00
(757
,547
)(7
57,5
47)
Gai
n at
trib
utab
le t
o no
ncon
trol
ling
inte
rest
00
00
289,
419
289,
419
Bal
ance
at
Dec
embe
r 31
, 20
15$
3,69
9$
43,0
02,6
70$
33,0
62,2
82$
(1,1
83,5
52)
$2,
102,
403
$76
,987
,502
UT
G,
Inc.
Co
nso
lid
ate
d S
tate
me
nts
of
Sh
are
ho
lde
rs' E
qu
ity

21
See accompanying notes.
2016 2015
Cash flows from operating activities: Net income attributable to common shares $ 1,168,025 $ 916,620 Adjustments to reconcile net income to net cash used in operating activities:
Amortization (accretion) of investments (457,864) (2,753,269)Realized investment gains, net (7,411,658) (4,426,593)Unrealized trading (gains) losses included in income (31,259) 945,128Amortization of cost of insurance acquired 872,982 907,605Depreciation 698,374 814,336Net income attributable to noncontrolling interest 288,260 289,419
(5,588,667) (6,640,391)Interest credited to account balances 4,539,416 4,835,215Change in accrued investment income (51,512) (158,473)Change in reinsurance receivables 89,524 678,391Change in policy liabilities and accruals (4,679,857) (3,132,596)Change in income taxes receivable (payable) (604,639) (2,552,286)Change in other assets and liabilities, net (207,312) (871,642)
Net cash used in operating activities (11,376,187) (11,148,536)
Cash flows from investing activities: Proceeds from investments sold and matured:
Fixed maturities available for sale 30,355,159 22,484,522Equity securities available for sale 13,785,226 8,087,827Trading securities 72,279 125,774Mortgage loans 7,047,158 20,140,224Real estate 11,142,322 19,829,665Notes receivable 4,463,966 0Policy loans 723,317 3,102,284Short-term investments 0 4,482,329
Total proceeds from investments sold and matured 67,589,427 78,252,625 Cost of investments acquired:
Fixed maturities available for sale (11,404,577) (21,733,834)Equity securities available for sale (5,262,588) (12,278,232)Trading securities (70,690) (463,895)Mortgage loans (6,935,273) (13,774,698)Real estate (15,935,233) (8,650,084)Notes receivable (11,208,299) (4,985,347)Policy loans (109,207) (2,682,043)Short-term investments 0 (100,149)
Total cost of investments acquired (50,925,867) (64,668,282) Purchase of property and equipment 0 0
Net cash provided by investing activities 16,663,560 13,584,343
Cash flows from financing activities:Policyholder contract deposits 5,087,358 5,189,311Policyholder contract withdrawals (4,261,609) (5,514,232)Proceeds from notes payable/line of credit 2,900,000 0Payments of principal on notes payable/line of credit 0 (4,400,000)Purchase of treasury stock (5,124,307) (120,281)Noncontrolling contributions/(distributions) of consolidated subsidiary (554,882) 254,567
Net cash used in financing activities (1,953,440) (4,590,635)
Net decrease in cash and cash equivalents 3,333,933 (2,154,828)Cash and cash equivalents at beginning of year 11,822,615 13,977,443Cash and cash equivalents at end of year $ 15,156,548 $ 11,822,615
UTG, INC.Consolidated Statements of Cash Flows
For the Years Ended December 31, 2016 and 2015
Charges for mortality and administration of universal life and annuity products

22
Notes to Consolidated Financial Statements
Note 1 – Summary of Significant Accounting Policies Business – UTG, Inc. is an insurance holding company. The Company’s dominant business is individual life insurance, which includes the servicing of existing insurance in-force and the acquisition of other companies in the life insurance business. UTG and its subsidiaries are collectively referred to as the “Company”. This document at times will refer to the Registrant’s largest shareholder, Mr. Jesse T. Correll and certain companies controlled by Mr. Correll. Mr. Correll holds a majority ownership of First Southern Funding, LLC (“FSF”), a Kentucky corporation, and First Southern Bancorp, Inc. (“FSBI”), a financial services holding company. FSBI operates through its 100% owned subsidiary bank, First Southern National Bank (“FSNB”). Banking activities are conducted through multiple locations within south-central and western Kentucky. Mr. Correll is Chief Executive Officer and Chairman of the Board of Directors of UTG and is currently UTG’s largest shareholder through his ownership control of FSF, FSBI and affiliates. At December 31, 2016, Mr. Correll owns or controls directly and indirectly approximately 63.75% of UTG’s outstanding stock. UTG’s life insurance subsidiary has several wholly-owned and majority-owned subsidiaries. The subsidiaries were formed to hold certain real estate and other investments. The investments were placed into the limited liability companies and partnerships to provide additional protection to the policyholders and to UG. Basis of Presentation – The accompanying consolidated financial statements have been prepared in conformity with accounting principles generally accepted in the United States of America (“GAAP”), under guidance issued by the Financial Accounting Standards Board (“FASB”). The preparation of financial statements in accordance with GAAP requires Management to make estimates and assumptions that affect the reported amounts of assets and liabilities at the date of the financial statements and the reported amounts of revenues and expenses during the reporting period. Actual results could differ from those estimates. Principles of Consolidation – The accompanying consolidated financial statements include the accounts of the Registrant and its wholly and majority-owned subsidiaries. All significant intercompany accounts and transactions have been eliminated during consolidation. Business Segments – The Company has only one business segment – life insurance. Investments – The Company reports its investments as follows: Fixed Maturity Investments – The Company classifies its fixed maturity investments, which include bonds, as available for sale. Investments classified as available for sale are carried at fair value with unrealized gains and losses, net of deferred taxes, reflected directly in accumulated other comprehensive income. Premiums and discounts on debt securities purchased at other than par value are amortized and accreted, respectively, to interest income in the Consolidated Statements of Operations, using the constant yield method over the period to maturity. Net realized gains and losses on sales of available for sale securities, and unrealized losses considered to be other-than-temporary, are recorded to net realized investment gains (losses) in the Consolidated Statements of Operations. Equity Securities – Investments in equity securities, which include common and preferred stocks, are reported at fair value with unrealized gains and losses, net of deferred taxes, reflected directly in accumulated other comprehensive income (loss).
23
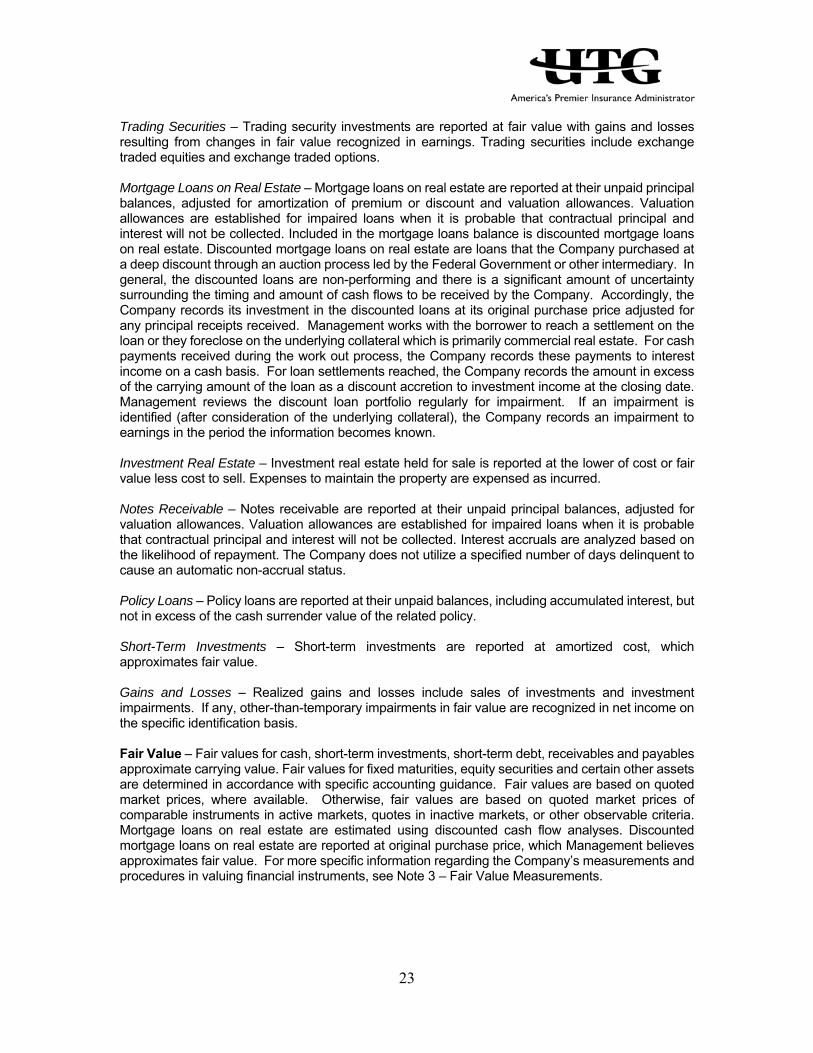
Trading Securities – Trading security investments are reported at fair value with gains and losses resulting from changes in fair value recognized in earnings. Trading securities include exchange traded equities and exchange traded options. Mortgage Loans on Real Estate – Mortgage loans on real estate are reported at their unpaid principal balances, adjusted for amortization of premium or discount and valuation allowances. Valuation allowances are established for impaired loans when it is probable that contractual principal and interest will not be collected. Included in the mortgage loans balance is discounted mortgage loans on real estate. Discounted mortgage loans on real estate are loans that the Company purchased at a deep discount through an auction process led by the Federal Government or other intermediary. In general, the discounted loans are non-performing and there is a significant amount of uncertainty surrounding the timing and amount of cash flows to be received by the Company. Accordingly, the Company records its investment in the discounted loans at its original purchase price adjusted for any principal receipts received. Management works with the borrower to reach a settlement on the loan or they foreclose on the underlying collateral which is primarily commercial real estate. For cash payments received during the work out process, the Company records these payments to interest income on a cash basis. For loan settlements reached, the Company records the amount in excess of the carrying amount of the loan as a discount accretion to investment income at the closing date. Management reviews the discount loan portfolio regularly for impairment. If an impairment is identified (after consideration of the underlying collateral), the Company records an impairment to earnings in the period the information becomes known. Investment Real Estate – Investment real estate held for sale is reported at the lower of cost or fair value less cost to sell. Expenses to maintain the property are expensed as incurred. Notes Receivable – Notes receivable are reported at their unpaid principal balances, adjusted for valuation allowances. Valuation allowances are established for impaired loans when it is probable that contractual principal and interest will not be collected. Interest accruals are analyzed based on the likelihood of repayment. The Company does not utilize a specified number of days delinquent to cause an automatic non-accrual status. Policy Loans – Policy loans are reported at their unpaid balances, including accumulated interest, but not in excess of the cash surrender value of the related policy. Short-Term Investments – Short-term investments are reported at amortized cost, which approximates fair value. Gains and Losses – Realized gains and losses include sales of investments and investment impairments. If any, other-than-temporary impairments in fair value are recognized in net income on the specific identification basis. Fair Value – Fair values for cash, short-term investments, short-term debt, receivables and payables approximate carrying value. Fair values for fixed maturities, equity securities and certain other assets are determined in accordance with specific accounting guidance. Fair values are based on quoted market prices, where available. Otherwise, fair values are based on quoted market prices of comparable instruments in active markets, quotes in inactive markets, or other observable criteria. Mortgage loans on real estate are estimated using discounted cash flow analyses. Discounted mortgage loans on real estate are reported at original purchase price, which Management believes approximates fair value. For more specific information regarding the Company’s measurements and procedures in valuing financial instruments, see Note 3 – Fair Value Measurements.

24
Impairment of Investments – The Company evaluates its investment portfolio for other-than-temporary impairments as described in Note 2 – Investments. If a security is deemed to be other-than-temporarily impaired, the cost basis of the security is written down to fair value and is treated as a realized loss. Current accounting guidance states that if an entity intends to sell or if it is more likely than not that it will be required to sell an impaired security prior to recovery of its cost basis, the security is to be considered other-than-temporarily impaired and the full amount of impairment must be charged to earnings. Otherwise, losses on fixed maturities which are other-than-temporarily impaired are separated into two categories, the portion of the loss which is considered credit loss and the portion of the loss which is due to other factors. The credit loss portion is charged to earnings while the loss due to other factors is charged to other comprehensive income. Cash Equivalents – The Company considers certificates of deposit and other short-term instruments with an original purchased maturity of three months or less to be cash equivalents. Cash – Cash consists of balances on hand and on deposit in banks and financial institutions. Reinsurance - In the normal course of business, the Company seeks to limit its exposure to loss on any single insured and to recover a portion of benefits paid by ceding reinsurance to other insurance enterprises or reinsurers under excess coverage and coinsurance contracts. The Company retains a maximum of $125,000 of coverage per individual life. Reinsurance receivables are recognized in a manner consistent with the liabilities relating to the underlying reinsured contracts. The cost of reinsurance related to long-duration contracts is accounted for over the life of the underlying reinsured policies using assumptions consistent with those used to account for the underlying policies. Cost of Insurance Acquired - When an insurance company is acquired, the Company assigns a portion of its cost to the right to receive future cash flows from insurance contracts existing at the date of the acquisition. The cost of policies purchased represents the actuarially determined present value of the projected future profits from the acquired policies. Cost of insurance acquired is amortized with interest in relation to expected future profits, including direct charge-offs for any excess of the unamortized asset over the projected future profits. The amortization is adjusted retrospectively when estimates of current or future gross profits to be realized from a group of products are revised. Property and Equipment - Company-occupied property, data processing equipment and furniture and office equipment are stated at cost less accumulated depreciation of $4,779,216 and $4,327,549 at December 31, 2016 and 2015, respectively. Depreciation is computed on a straight-line basis for financial reporting purposes using estimated useful lives of three to thirty years. Depreciation expense was $451,667 and $459,218 for the years ended December 31, 2016 and 2015, respectively. Future Policy Benefits and Expenses - The liabilities for traditional life insurance and accident and health insurance policy benefits are computed using a net level method. These liabilities include assumptions as to investment yields, mortality, withdrawals, and other assumptions based on the life insurance subsidiary’s experience adjusted to reflect anticipated trends and to include provisions for possible unfavorable deviations. The Company makes these assumptions at the time the contract is issued or, in the case of contracts acquired by purchase, at the purchase date. Future policy benefits for individual life insurance and annuity policies are computed using interest rates ranging from 2% to 6% for life insurance and 2.5% to 7.5% for annuities. Benefit reserves for traditional life insurance policies include certain deferred profits on limited-payment policies that are being recognized in income over the policy term. Policy benefit claims are charged to expense in the period that the claims are incurred. The mortality rate assumptions for policies currently issued by the Company are based
25
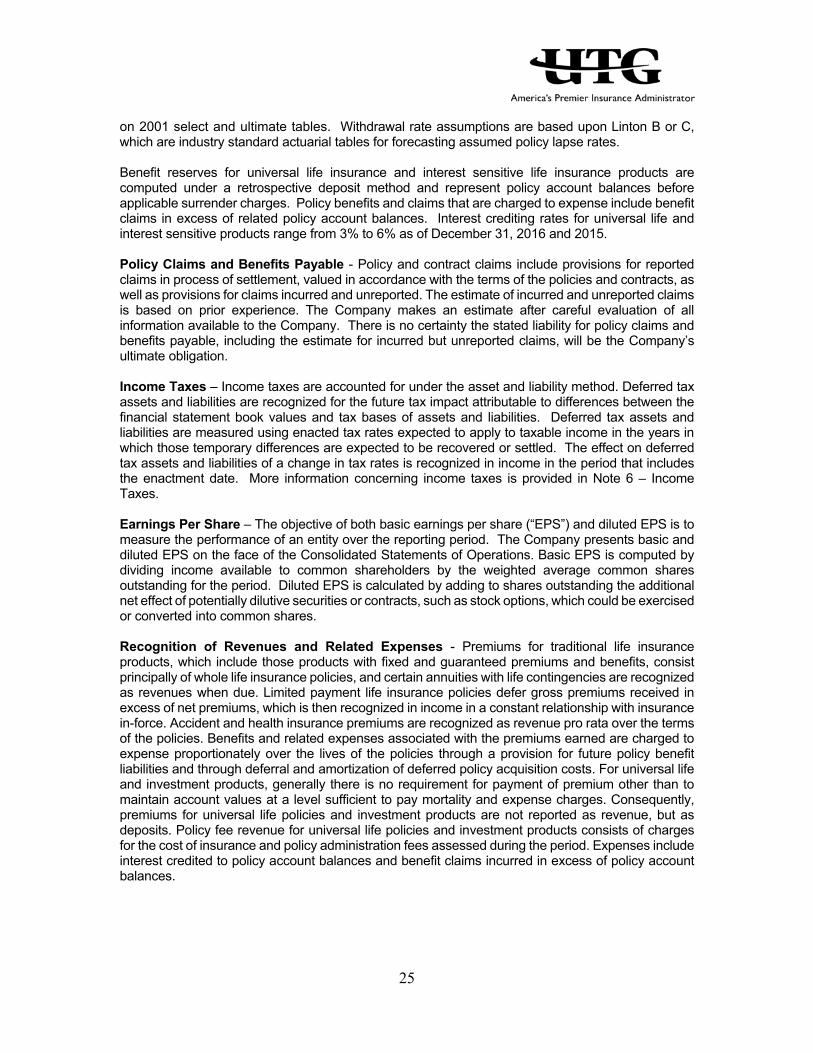
on 2001 select and ultimate tables. Withdrawal rate assumptions are based upon Linton B or C, which are industry standard actuarial tables for forecasting assumed policy lapse rates. Benefit reserves for universal life insurance and interest sensitive life insurance products are computed under a retrospective deposit method and represent policy account balances before applicable surrender charges. Policy benefits and claims that are charged to expense include benefit claims in excess of related policy account balances. Interest crediting rates for universal life and interest sensitive products range from 3% to 6% as of December 31, 2016 and 2015. Policy Claims and Benefits Payable - Policy and contract claims include provisions for reported claims in process of settlement, valued in accordance with the terms of the policies and contracts, as well as provisions for claims incurred and unreported. The estimate of incurred and unreported claims is based on prior experience. The Company makes an estimate after careful evaluation of all information available to the Company. There is no certainty the stated liability for policy claims and benefits payable, including the estimate for incurred but unreported claims, will be the Company’s ultimate obligation. Income Taxes – Income taxes are accounted for under the asset and liability method. Deferred tax assets and liabilities are recognized for the future tax impact attributable to differences between the financial statement book values and tax bases of assets and liabilities. Deferred tax assets and liabilities are measured using enacted tax rates expected to apply to taxable income in the years in which those temporary differences are expected to be recovered or settled. The effect on deferred tax assets and liabilities of a change in tax rates is recognized in income in the period that includes the enactment date. More information concerning income taxes is provided in Note 6 – Income Taxes. Earnings Per Share – The objective of both basic earnings per share (“EPS”) and diluted EPS is to measure the performance of an entity over the reporting period. The Company presents basic and diluted EPS on the face of the Consolidated Statements of Operations. Basic EPS is computed by dividing income available to common shareholders by the weighted average common shares outstanding for the period. Diluted EPS is calculated by adding to shares outstanding the additional net effect of potentially dilutive securities or contracts, such as stock options, which could be exercised or converted into common shares. Recognition of Revenues and Related Expenses - Premiums for traditional life insurance products, which include those products with fixed and guaranteed premiums and benefits, consist principally of whole life insurance policies, and certain annuities with life contingencies are recognized as revenues when due. Limited payment life insurance policies defer gross premiums received in excess of net premiums, which is then recognized in income in a constant relationship with insurance in-force. Accident and health insurance premiums are recognized as revenue pro rata over the terms of the policies. Benefits and related expenses associated with the premiums earned are charged to expense proportionately over the lives of the policies through a provision for future policy benefit liabilities and through deferral and amortization of deferred policy acquisition costs. For universal life and investment products, generally there is no requirement for payment of premium other than to maintain account values at a level sufficient to pay mortality and expense charges. Consequently, premiums for universal life policies and investment products are not reported as revenue, but as deposits. Policy fee revenue for universal life policies and investment products consists of charges for the cost of insurance and policy administration fees assessed during the period. Expenses include interest credited to policy account balances and benefit claims incurred in excess of policy account balances.

26
Recently Issued Accounting Standards Accounting Standards Update (ASU) 2017-04, Intangibles – Goodwill and Other (Topic 350): Simplifying the Test for Goodwill Impairment – The amendments included in ASU 2017-04 eliminate Step 2 from the goodwill impairment test. The annual, or interim, goodwill impairment test is performed by comparing the fair value of a reporting unit with its carrying amount. An impairment charge should be recognized for the amount by which the carrying amount exceeds the reporting unit’s fair value; however, the loss recognized should not exceed the total amount of goodwill allocated to that reporting unit. In addition, income tax effects from any tax deductible goodwill on the carrying amount of the reporting unit should be considered when measuring the goodwill impairment loss, if applicable. The amendments also eliminate the requirements for any reporting unit with a zero or negative carrying amount to perform a qualitative assessment and, if it fails that qualitative test, to perform Step 2 of the goodwill impairment test. An entity still has the option to perform the qualitative assessment for a reporting unit to determine if the quantitative impairment test is necessary. ASU 2017-04 is effective for public companies for fiscal years beginning after December 15, 2019. The adoption of this guidance is not expected to have a material impact on the Company’s consolidated financial statements. Accounting Standards Update (ASU) 2016-18, Statement of Cash Flows (Topic 230): Restricted Cash – The amendments included in ASU 2016-18 require that a statement of cash flows explain the change during the period in the total of cash, cash equivalents, and amounts generally described as restricted cash or restricted cash equivalents. As a result, amounts generally described as restricted cash and restricted cash equivalents should be included with cash and cash equivalents when reconciling the beginning-of-period and end-of-period total amounts shown on the statement of cash flows. The amendments do not provide a definition of restricted cash or restricted cash equivalents. ASU 2016-18 is effective for public companies for fiscal years beginning after December 15, 2017. The adoption of this guidance is not expected to have a material impact on the Company’s consolidated financial statements. Accounting Standards Update (ASU) 2016-17, Consolidation (Topic 810): Interests Held through Related Parties that are Under Common Control – The amendments included in ASU 2016-17 change the evaluation of whether a reporting entity is the primary beneficiary of a variable interest entity by changing how a reporting entity that is a single decision maker of a variable interest entity treats indirect interests in the entity held through related parties that are under common control with the reporting entity. If a reporting entity satisfies the first characteristic of a primary beneficiary (such that it is the single decision maker of a variable interest entity), the amendments require that reporting entity, in determining whether it satisfies the second characteristic of a primary beneficiary, to include all of its direct variable interests in a variable interest entity and, on a proportionate basis, its indirect variable interests in a variable interest entity held through related parties, including related parties that are under common control with the reporting entity. ASU 2016-17 is effective for public companies for fiscal years beginning after December 15, 2016. The adoption of this guidance is not expected to have a material impact on the Company’s consolidated financial statements. Accounting Standards Update (ASU) 2016-16, Income Taxes (Topic 740): Intra-Entity Transfers of Assets Other Than Inventory – The amendments included in ASU 2016-16 require an entity to recognize the income tax consequences of an intra-entity transfer of an asset other than inventory when the transfer occurs. The amendments eliminate the exception for an intra-entity transfer of an asset other than inventory. The amendments do not include new disclosure requirements; however, existing disclosure requirements might be applicable when accounting for the current and deferred income taxes for an intra-entity transfer of an asset other than inventory. ASU 2016-16 is effective for public companies for fiscal years beginning after December 15, 2017. The adoption of this guidance is not expected to have a material impact on the Company’s consolidated financial statements.

27
Accounting Standards Update (ASU) 2016-15, Statement of Cash Flows (Topic 230): Classification of Certain Cash Receipts and Cash Payments – The amendments included in ASU 2016-15 provide cash flow statement classification guidance for debt prepayment or debt extinguishment costs, settlement of zero-coupon debt instruments or other debt instruments with coupon interest rates that are insignificant in relation to the effective Interest Rate of the Borrowing, contingent consideration payments made after a business combination, proceeds from the settlement of insurance claims, proceeds from the settlement of corporate-owned life insurance policies, including bank-owned life insurance policies, distributions received from equity method investees, beneficial interests in securitization transactions; and separately identifiable cash flows and application of the predominance principle. ASU 2016-15 is effective for public companies for fiscal years beginning after December 15, 2017. The adoption of this guidance is not expected to have a material impact on the Company’s consolidated financial statements. Accounting Standards Update (ASU 2016-13), Financial Instruments – Credit Losses (Topic 326): Measurement of Credit Losses on Financial Instruments – The amendments included in ASU 2016-13 require the measurement of all expected credit losses for financial assets held at the reporting date based on historical experience, current conditions, and reasonable and supportable forecasts. Financial institutions and other organizations will now use forward-looking information to better evaluate their credit loss estimates. Many of the loss estimation techniques applied today will still be permitted, although the inputs to those techniques will change to reflect the full amount of expected credit losses. In addition, the ASU amends the accounting for credit losses on available-for-sale debt securities and purchased financial assets with credit deterioration. ASU 2016-13 is effective for public companies for fiscal years beginning after December 15, 2019. The Company is currently evaluating the impact that the adoption of this guidance will have on its consolidated financial statements. Accounting Standards Update (ASU 2016-07), Investments – Equity Method and Joint Ventures (Topic 323): Simplifying the Transition to the Equity Method of Accounting – The amendments included in ASU 2016-07 eliminate the requirement that when an investment qualifies for use of the equity method as a result of an increase in the level of ownership interest or degree of influence, an investor must adjust the investment, results of operations, and retained earnings retroactively on a step-by-step basis as if the equity method had been in effect during all previous periods that the investment had been held. The amendments require that the equity method investor add the cost of acquiring the additional interest in the investee to the current basis of the investor’s previously held interest and adopt the equity method of accounting as of the date the investment becomes qualified for equity method accounting. Therefore, upon qualifying for the equity method of accounting, no retroactive adjustment of the investment is required. The amendments require that an entity that has an available-for-sale equity security that becomes qualified for the equity method of accounting recognize through earnings the unrealized holding gain or loss in accumulated other comprehensive income at the date the investment becomes qualified for use of the equity method. ASU 2016-07 is effective for public companies for fiscal years beginning after December 15, 2016. The adoption of this guidance is not expected to have a material impact on the Company’s consolidated financial statements. Accounting Standards Update (ASU) 2016-01, Financial Instruments-Overall (Subtopic 825-10): Recognition and Measurement of Financial Assets and Financial Liabilities – The amendments included in ASU 2016-01 requires equity investments (except those accounted for under the equity method of accounting, or those that result in consolidation of the investee) to be measured at fair value with changes in fair value recognized in net income. Requires public business entities to use the exit price notion when measuring the fair value of financial instruments for disclosure purposes. ASU 2016-01 also requires separate presentation of financial assets and financial liabilities by measurement category and form of financial asset (i.e., securities or loans and receivables). The guidance eliminates the requirement for public business entities to disclose the method(s) and significant assumptions used to estimate the fair value that is required to be disclosed for financial instruments measured at amortized cost. ASU 2016-01 is effective for public companies for fiscal

28
years beginning after December 15, 2017. The Company is currently evaluating the impact that the adoption of this guidance will have on its consolidated financial statements. Accounting Standards Update (ASU) 2015-17, Income Taxes: Balance Sheet Classification of Deferred Taxes – The amendments included in ASU 2015-17 eliminate the current requirement for organizations to present deferred tax liabilities and assets as current and noncurrent in a classified balance sheet. Instead, organizations will be required to classify all deferred tax assets and liabilities as noncurrent. ASU 2015-17 is effective for public companies for fiscal years beginning after December 15, 2016. The adoption of this guidance is not expected to have a material impact on the Company’s consolidated financial statements. Note 2 – Investments Available for Sale Securities – Fixed Maturity and Equity Securities The following tables provide a summary of fixed maturities available for sale and equity securities by original or amortized cost and estimated fair value:
December 31, 2016
Original or Amortized
Cost
Gross Unrealized
Gains
Gross Unrealized
Losses
Estimated Fair
Value Investments available for sale: Fixed maturities U.S. Government and govt. agencies and authorities
$ 9,058,210 $ 74,581 $ (96,981)
$ 9,035,810
U.S. special revenue and assessments 10,145,531 1,002,789 (14,043) 11,134,277All other corporate bonds 151,392,119 17,234,691 (1,557,179) 167,069,631 170,595,860 18,312,061 (1,668,203) 187,239,718Equity securities 37,014,712 15,214,862 (522,471) 51,707,103Total $ 207,610,572 $ 33,526,923 $ (2,190,674) $ 238,946,821
December 31, 2015
Original or Amortized
Cost
Gross Unrealized
Gains
Gross Unrealized
Losses
Estimated Fair
Value Investments available for sale: Fixed maturities U.S. Government and govt. agencies and authorities
$ 20,336,681 $ 1,441,890 $ (32,083)
$ 21,746,488
U.S. special revenue and assessments 1,137,546 7,843 (2,550) 1,142,839All other corporate bonds 167,173,444 3,762,156 (8,705,830) 162,229,770 188,647,671 5,211,889 (8,740,463) 185,119,097Equity securities 43,954,737 2,119,205 (388,602) 45,685,340Total $ 232,602,408 $ 7,331,094 $ (9,129,065) $ 230,804,437
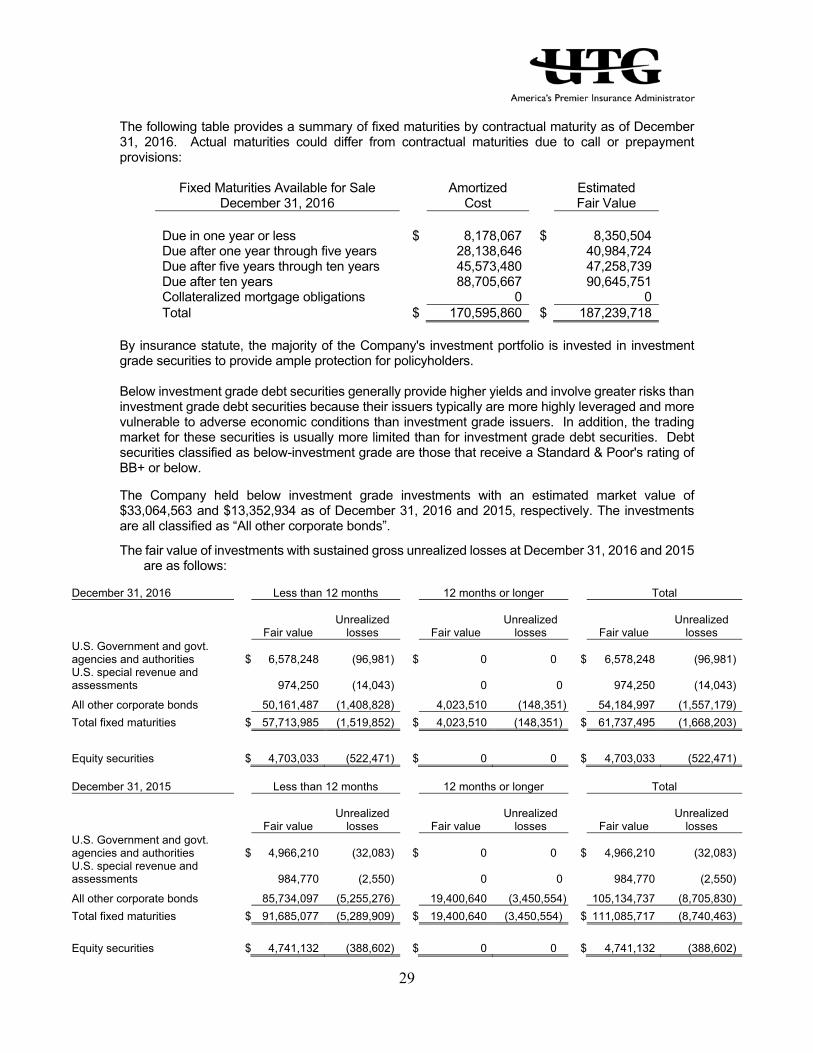
29
The following table provides a summary of fixed maturities by contractual maturity as of December 31, 2016. Actual maturities could differ from contractual maturities due to call or prepayment provisions:
Fixed Maturities Available for Sale December 31, 2016
Amortized Cost
Estimated Fair Value
Due in one year or less $ 8,178,067 $ 8,350,504 Due after one year through five years 28,138,646 40,984,724 Due after five years through ten years 45,573,480 47,258,739 Due after ten years 88,705,667 90,645,751 Collateralized mortgage obligations 0 0 Total $ 170,595,860 $ 187,239,718
By insurance statute, the majority of the Company's investment portfolio is invested in investment grade securities to provide ample protection for policyholders. Below investment grade debt securities generally provide higher yields and involve greater risks than investment grade debt securities because their issuers typically are more highly leveraged and more vulnerable to adverse economic conditions than investment grade issuers. In addition, the trading market for these securities is usually more limited than for investment grade debt securities. Debt securities classified as below-investment grade are those that receive a Standard & Poor's rating of BB+ or below. The Company held below investment grade investments with an estimated market value of $33,064,563 and $13,352,934 as of December 31, 2016 and 2015, respectively. The investments are all classified as “All other corporate bonds”.
The fair value of investments with sustained gross unrealized losses at December 31, 2016 and 2015 are as follows:
December 31, 2016 Less than 12 months 12 months or longer Total
Fair value Unrealized
losses Fair value Unrealized
losses Fair value Unrealized
losses U.S. Government and govt. agencies and authorities $ 6,578,248 (96,981) $ 0 0 $ 6,578,248 (96,981)U.S. special revenue and assessments 974,250 (14,043) 0 0 974,250 (14,043)
All other corporate bonds 50,161,487 (1,408,828) 4,023,510 (148,351) 54,184,997 (1,557,179)
Total fixed maturities $ 57,713,985 (1,519,852) $ 4,023,510 (148,351) $ 61,737,495 (1,668,203)
Equity securities $ 4,703,033 (522,471) $ 0 0 $ 4,703,033 (522,471)
December 31, 2015 Less than 12 months 12 months or longer Total
Fair value Unrealized
losses Fair value Unrealized
losses Fair value Unrealized
losses U.S. Government and govt. agencies and authorities $ 4,966,210 (32,083) $ 0 0 $ 4,966,210 (32,083)U.S. special revenue and assessments 984,770 (2,550) 0 0 984,770 (2,550)
All other corporate bonds 85,734,097 (5,255,276) 19,400,640 (3,450,554) 105,134,737 (8,705,830)
Total fixed maturities $ 91,685,077 (5,289,909) $ 19,400,640 (3,450,554) $ 111,085,717 (8,740,463)
Equity securities $ 4,741,132 (388,602) $ 0 0 $ 4,741,132 (388,602)
30
The following table provides additional information regarding the number of securities that were in an unrealized loss position for greater than or less than twelve months:
Less than 12
months 12 months or
longer Total
As of December 31, 2016
Fixed maturities 25 3 28
Equity securities 3 0 3
As of December 31, 2015
Fixed maturities 40 9 49
Equity securities 9 0 9 Substantially all of the unrealized losses on fixed maturities available for sale at December 31, 2016 and 2015 are attributable to changes in market interest rates and general disruptions in the credit market subsequent to purchase. The unrealized losses on equity investments were primarily attributable to normal market fluctuations. The Company does not currently intend to sell nor does it expect to be required to sell any of the securities in an unrealized loss position. Based upon the Company’s expected continuation of receipt of contractually required principal and interest payments and its intent and ability to retain the securities until price recovery, as well as the Company’s evaluation of other relevant factors, the Company deems these securities to be temporarily impaired as of December 31, 2016 and 2015. Trading Securities Securities designated as trading securities are reported at fair value, with gains or losses resulting from changes in fair value recognized in net investment income on the Consolidated Statements of Operations. Trading securities include exchange-traded equities and exchange-traded options. Trading securities carried as liabilities are securities sold short. A gain, limited to the price at which the security was sold short, or a loss, potentially unlimited in size, will be recognized upon the termination of the short sale. The fair value of derivatives included in trading security assets and trading security liabilities as of December 31, 2016 was $2,500 and ($1,439), respectively. The fair value of derivatives included in trading security assets and trading security liabilities as of December 31, 2015 was $0 and ($28,609), respectively. Earnings from trading securities are classified in cash flows from operating activities. The derivatives held by the Company are for income generation purposes only. As of June 30, 2015, the Company reclassified its remaining exchange-traded equity trading security to the available for sale category. The fair value of the security at the time of the reclassification was $3,224,000. Trading securities are purchased and held primarily for purposes of selling them in the near term and reflect active and frequent buying and selling. Management analyzed the recent buying and selling activity related to the exchange-traded equity and deems the available for sale category to better reflect Management’s intent for this security going forward. Through June 30, 2015, unrealized gains and losses from this exchange-traded equity were recorded as a component of earnings. Subsequent unrealized gains/losses are reported as a component of comprehensive income.

31
The following table reflects trading securities revenue charged to net investment income for the periods ended December 31:
2016 2015
Net unrealized gains (losses) $ 31,259 $ (945,128) Net realized gains (losses) 0 515,967 Net unrealized and realized gains (losses) $ 31,259 $ (429,161)
Mortgage Loans on Real Estate The Company, from time to time, acquires mortgage loans through participation agreements with FSNB. FSNB has been able to provide the Company with additional expertise and experience in underwriting commercial and residential mortgage loans, which provide more attractive yields than the traditional bond market. The Company is able to receive participations from FSNB for three primary reasons: 1) FSNB has already reached its maximum lending limit to a single borrower, but the borrower is still considered a suitable risk; 2) the interest rate on a particular loan may be fixed for a long period that is more suitable for UG given its asset-liability structure; and 3) FSNB’s loan growth might at times outpace its deposit growth, resulting in FSNB participating such excess loan growth rather than turning customers away. For originated loans, the Company’s Management is responsible for the final approval of such loans after evaluation. Before a new loan is issued, the applicant is subject to certain criteria set forth by Company Management to ensure quality control. These criteria include, but are not limited to, a credit report, personal financial information such as outstanding debt, sources of income, and personal equity. Once the loan is approved, the Company directly funds the loan to the borrower. The Company bears all risk of loss associated with the terms of the mortgage with the borrower. Approximately 12% and 30% of the mortgage loan portfolio consists of discounted commercial mortgage loans as of December 31, 2016 and 2015, respectively. The Company began purchasing discounted commercial mortgage loans in 2009. Management has extensive background and experience in the analysis and valuation of commercial real estate. The discounted loans are available through the FDIC’s sale of assets of closed banks and from banks wanting to reduce their loan portfolios. The loans are available on a loan by loan bid process. Once a loan has been acquired, contact is made with the appropriate individuals to begin a dialog with a goal of determining the borrower’s willingness to work together. There are generally three paths a discounted loan will take: the borrowers pay as required; a settlement is reached with the loan being paid off at a discounted value; or the loan is foreclosed. During 2016 and 2015, the Company acquired $6,935,273 and $13,774,698 in mortgage loans, respectively, including both regular participation mortgage loans as well as discounted mortgage loans. FSNB services the majority of the Company’s mortgage loan portfolio. The Company pays FSNB a .25% servicing fee on these loans and a one-time fee at loan origination of .50% of the original loan cost to cover costs incurred by FSNB relating to the processing and establishment of the loan. During 2016 and 2015, the maximum and minimum lending rates for mortgage loans were:
2016 2015 Maximum
rate Minimum
rate Maximum
rate Minimum
rate Farm Loans
5.00%
5.00%
0.00%
0.00%
Commercial Loans 8.00% 4.00% 8.00% 4.00% Residential Loans 8.00% 3.94% 8.00% 3.00%

32
Most mortgage loans are first position loans. Loans issued are generally limited to no more than 80% of the appraised value of the property. The Company has in place a monitoring system to provide Management with information regarding potential troubled loans. Letters are sent to each mortgagee when the loan becomes 30 days or more delinquent. Management is provided with a monthly listing of loans that are 60 days or more past due along with a brief description of what steps are being taken to resolve the delinquency. All loans 90 days or more past due are placed on a non-performing status and classified as delinquent loans. Quarterly, coinciding with external financial reporting, the Company reviews each delinquent loan and determines how each delinquent loan should be classified. Management believes the current internal controls surrounding the mortgage loan selection process provide a quality portfolio with minimal risk of foreclosure and/or negative financial impact. Changes in the current economy could have a negative impact on the loans, including the financial stability of the borrowers, the borrowers’ ability to pay or to refinance, the value of the property held as collateral and the ability to find purchasers at favorable prices. Given the uncertainty of the current market, Management has taken a conservative approach with the discounted mortgage loans and has classified all discounted mortgage loans held as non-accrual. In such status, the Company is not recording any accrued interest income nor is it recording any accrual of discount on the loans held. The Company records repayments on loans as discount accrual when the loan basis has been paid in full. On the remainder of the mortgage loan portfolio, interest accruals are analyzed based on the likelihood of repayment. In no event will interest continue to accrue when accrued interest along with the outstanding principal exceeds the net realizable value of the property. The Company does not utilize a specified number of days delinquent to cause an automatic non-accrual status. A mortgage loan reserve is established and adjusted based on Management's quarterly analysis of the portfolio and any deterioration in value of the underlying property which would reduce the net realizable value of the property below its current carrying value. The Company acquired the discounted mortgage loans at below contract value, and believes that it will fully recover its carrying value upon disposal, therefore no reserve for delinquent loans is deemed necessary. Those not currently paying are being vigorously worked by Management. The current discounted commercial mortgage loan portfolio has an average price of 32% and 39% of face value as of December 31, 2016 and 2015, respectively. Management has determined that this deep discount provides a financial cushion or built in allowance for any of the loans that are not currently performing within the portfolio of loans purchased. The mortgage loan reserve was $0 at December 31, 2016 and 2015. The following table summarizes the number of loans held in the discounted mortgage loan portfolio and the carrying value of the loans:
December 31, 2016 Payment Frequency
Number of Loans
Carrying Value
No payments received 8 $ 0 One-time payment received 1 0 Irregular payments received 2 20,834 Periodic payments received 5 2,168,062
Total 16 $ 2,188,896

33
December 31, 2015 Payment Frequency
Number of Loans
Carrying Value
No payments received 8 $ 0 One-time payment received 1 0 Irregular payments received 2 20,834 Periodic payments received 7 5,347,215
Total 18 $ 5,368,049 The following table summarizes the mortgage loan holdings of the Company for the periods ended December 31:
2016 2015 In good standing $ 16,388,477 $ 14,701,228 Overdue interest over 90 days 20,834 20,834 Restructured 60,827 126,118 In process of foreclosure 2,107,234 2,921,750 Total mortgage loans $ 18,577,372 $ 17,769,930 Total foreclosed loans during the year
$
735,000
$
0
Investment Real Estate Real estate acquired through foreclosure, consisting of properties obtained through foreclosure proceedings or acceptance of a deed in lieu of foreclosure, is reported on an individual asset basis at the lower of cost or fair value, less disposal costs. Fair value is determined on the basis of current appraisals, comparable sales, and other estimates of value obtained principally from independent sources. When properties are acquired through foreclosure, any excess of the loan balance at the time of foreclosure over the fair value of the real estate held as collateral is recognized and charged to the Consolidated Statements of Operations. Based upon Management’s evaluation of the real estate acquired through foreclosure, additional expense is recorded when necessary in an amount sufficient to reflect any declines in estimated fair value. Gains and losses recognized on the disposition of the properties are recorded as realized gains and losses in the Consolidated Statements of Operations. Notes Receivable Notes receivable represent collateral loans and promissory notes issued by the Company and are reported at their unpaid principal balances, adjusted for valuation allowances. Valuation allowances are established for impaired loans when it is probable that contractual principal and interest will not be collected. The valuation allowance as of December 31, 2016 and 2015 was $0. Interest accruals are analyzed based on the likelihood of repayment. The Company does not utilize a specified number of days delinquent to cause an automatic non-accrual status. Before a new note is issued, the applicant is subject to certain criteria set forth by Company Management to ensure quality control. Once the note is approved, the Company directly funds the note to the borrower. Several of the notes have participation agreements in place, whereas the Company has reduced its investment in the note receivable by participating a portion of the note to a third party.

34
Similar to the mortgage loans, FSNB services several of the notes receivable. The Company, and the participants in the notes, share in the risk of loss associated with the terms of the note with the borrower, based upon their ownership percentage in the note. The Company has in place a monitoring system to provide Management with information regarding potential troubled loans. Analysis of Investment Operations The following table reflects the Company’s net investment income for the periods ended December 31:
2016 2015 Fixed maturities $ 9,217,413 $ 8,559,938 Equity securities 1,393,816 1,708,786 Trading securities 31,259 (429,161) Mortgage loans 1,814,499 5,700,492 Real estate 1,862,400 1,474,726 Notes receivable 1,458,878 787,658 Policy loans 618,775 720,544 Cash and cash equivalents 14,583 681 Short-term 7,877 699,357 Total consolidated investment income 16,419,500 19,223,021 Investment expenses (3,474,952) (3,663,086) Consolidated net investment income $ 12,944,548 $ 15,559,935
The following table reflects the Company’s net realized investments gains and losses for the periods ended December 31:
2016
Gross Realized
Gains
Gross Realized (Losses)
Net Realized
Gains (Losses) Fixed maturities $ 1,449,956 $ (89,721) $ 1,360,235 Real estate 4,942,675 (8,109) 4,934,566 Common stock 1,615,446 (32,835) 1,582,611 Notes receivable – OTTI 0 (465,754) (465,754)
Total realized gains (losses) $ 8,008,077 $ (596,419) $ 7,411,658
2015
Gross Realized
Gains
Gross Realized (Losses)
Net Realized
Gains (Losses) Fixed maturities $ 1,289,455 $ (41,215) $ 1,248,240 Real estate 5,968,558 0 5,968,558 Common stock 48,165 (238,794) (190,629)Preferred stock 971,662 (637) 971,025 Real estate – OTTI 0 (54,901) (54,901)Common stock – OTTI 0 (3,515,700) (3,515,700)
Total realized gains (losses) $ 8,277,840 $ (3,851,247) $ 4,426,593

35
Other-Than-Temporary Impairments The Company regularly reviews its investment securities for factors that may indicate that a decline in fair value of an investment is other than temporary. The factors considered by Management in its regular review to identify and recognize other-than-temporary impairment losses on fixed maturities include, but are not limited to: the length of time and extent to which the fair value has been less than cost; the Company’s intent to sell, or be required to sell, the debt security before the anticipated recovery of its remaining amortized cost basis; the financial condition and near-term prospects of the issuer; adverse changes in ratings announced by one or more rating agencies; subordinated credit support, whether the issuer of a debt security has remained current on principal and interest payments; current expected cash flows; whether the decline in fair value appears to be issuer specific or, alternatively, a reflection of general market or industry conditions, including the effect of changes in market interest rates. If the Company intends to sell a debt security, or it is more likely than not that it would be required to sell a debt security before the recovery of its amortized cost basis, the entire difference between the security’s amortized cost basis and its fair value at the balance sheet date would be recognized by a charge to other-than-temporary losses in the Consolidated Statements of Operations. Equity securities may experience other-than-temporary impairments in the future based on the prospects for full recovery in value in a reasonable period of time and the Company’s ability and intent to hold the security to recovery. If a decline in fair value is judged by Management to be other-than-temporary or Management does not have the intent or ability to hold a security, a loss is recognized by a charge to other-than-temporary impairment losses in the Consolidated Statements of Operations. Management regularly reviews its real estate portfolio in comparison to appraisal valuations and current market conditions for indications of other-than-temporary impairments. If a decline in value is judged by Management to be other-than-temporary, a loss is recognized by a charge to other-than-temporary impairment losses in the Consolidated Statements of Operations. Based on Management’s review of the investment portfolio, the Company recorded the following losses for other-than-temporary impairments in the Consolidated Statements of Operations for the periods ended December 31:
2016 2015 Other than temporary impairments: Common stock $ 0 $ 3,515,700 Real estate 0 54,901 Notes receivable 465,754 0 Total other than temporary impairments $ 465,754 $ 3,570,601
The other-than-temporary impairments recognized during 2016 and 2015 were taken as a result of Management’s assessment and consideration of the length of time the securities have remained in an unrealized loss position and as a result of management’s analysis and determination of value. The investments were written down to better reflect their current expected market value. Investments on Deposit The Company had investments with a fair value of $8,692,705 and $8,932,241 on deposit with various state insurance departments as of December 31, 2016 and 2015, respectively.

36
Note 3 – Fair Value Measurements The Company measures its assets and liabilities recorded at fair value in the Condensed Consolidated Balance Sheets based on the framework set forth in the GAAP fair value accounting guidance. The framework establishes a fair value hierarchy of three levels based upon the transparency of information used in measuring the fair value of assets or liabilities as of the measurement date. The fair value hierarchy prioritizes the inputs in the valuation techniques used to measure fair value into three categories. Level 1 – Valuation is based upon quoted prices for identical assets or liabilities in active markets that the Company is able to access. Level 1 fair value is not subject to valuation adjustments. Level 2 – Valuation is based upon quoted prices for similar assets and liabilities in active markets or quoted prices for identical or similar instruments in markets that are not active. In addition, the Company may use various valuation techniques or pricing models that use observable inputs to measure fair value. Level 3 – Valuation is based upon unobservable inputs that are supported by little or no market activity and are significant to the fair value of the assets or liabilities. Unobservable inputs reflect the Company’s own assumptions about the inputs that market participants would use in pricing the asset or liability. The Company determines the existence of an active market for an asset or liability based on its judgment as to whether transactions for the asset or liability occur in such market with sufficient frequency and volume to provide reliable pricing information. If the Company concludes that there has been a significant decrease in the volume and level of activity for an investment in relation to normal market activity for such investment, adjustments to transactions and quoted prices are made to estimate fair value. The inputs used in the valuation techniques employed by the Company are provided by nationally recognized pricing services, external investment managers and internal resources. To assess these inputs, the Company’s review process includes, but is not limited to, quantitative analysis including benchmarking, initial and ongoing evaluations of methodologies used by external parties to calculate fair value, and ongoing evaluations of fair value estimates based on the Company’s knowledge and monitoring of market conditions. The Company periodically reviews the pricing service provider’s policies and procedures for valuing securities. The assumptions underlying the valuations from external service providers, including unobservable inputs, are generally not readily available as this information is often deemed proprietary. Accordingly, the Company is unable to obtain comprehensive information regarding these assumptions and methodologies. The Company’s investments in fixed maturity securities available for sale, equity securities available for sale and trading securities assets and liabilities are carried at fair value. The following are the Company’s methodologies and valuation techniques for assets and liabilities measured at fair value. Fixed maturities available for sale mainly consist of U.S. treasury securities and corporate debt securities. The Company employs a market approach to the valuation of securities where there are sufficient market transactions involving identical or comparable assets. If sufficient market data is not available for identical or comparable assets, the Company uses an income approach to valuation. The majority of the financial instruments included in fixed maturity securities available for sale are evaluated utilizing observable inputs; accordingly, they are categorized in either Level 1 or Level 2 of the fair value hierarchy. However, in instances where significant inputs utilized in

37
valuation of the securities are unobservable, the securities are categorized in Level 3 of the fair value hierarchy. Corporate securities primarily include fixed rate corporate bonds. Inputs utilized in connection with the Company’s valuation techniques relating to this class of securities include recently executed transactions, market price quotations, benchmark yields and issuer spreads. Corporate securities are categorized in Level 2 of the fair value hierarchy. U.S. treasury securities are based on quoted prices in active markets and are generally categorized in Level 1 of the fair value hierarchy. Equity securities available for sale consist of common and preferred stocks mainly in private equity investments, financial institutions and insurance companies. Equity securities for which there is sufficient market data are categorized as Level 1 or 2 in the fair value hierarchy. For the equity securities in which quoted market prices are not available, the transaction price is used as the best estimate of fair value at inception. When evidence is believed to support a change to the carrying value from the transaction price, adjustments are made to reflect the expected exit values. The Company performs ongoing reviews of the underlying investments. The reviews consist of the evaluations of expected cash flows, material events and market data. These investments are included in Level 3 of the fair value hierarchy. Securities designated as trading securities consist of exchange traded equities and exchange traded options. These securities are primarily valued at quoted active market prices, and are therefore categorized as Level 1 in the fair value hierarchy. The following table presents the Company’s assets and liabilities measured at fair value in the consolidated balance sheet on a recurring basis as of December 31, 2016.
Level 1 Level 2 Level 3 Total Assets Fixed Maturities, available for sale $ 9,035,810 $ 175,120,657 $ 3,083,251 $ 187,239,718Equity Securities, available for sale 19,360,394 6,553,410 25,793,299 51,707,103Trading Securities 2,500 0 0 2,500Total $ 28,398,704 $ 181,674,067 $ 28,876,550 $ 238,949,321 Liabilities Trading Securities $ 1,439 $ 0 $ 0 $ 1,439
The following table presents the Company’s assets and liabilities measured at fair value in the consolidated balance sheet on a recurring basis as of December 31, 2015.
Level 1 Level 2 Level 3 Total Assets Fixed Maturities, available for sale $ 10,459,758 $ 173,632,645 $ 1,026,694 $ 185,119,097Equity Securities, available for sale 13,312,331 5,567,061 26,805,948 45,685,340Total $ 23,772,089 $ 179,199,706 $ 27,832,642 $ 230,804,437 Liabilities Trading Securities $ 28,609 $ 0 $ 0 $ 28,609

38
The following table provides reconciliations for Level 3 assets measured at fair value on a recurring basis. Transfers into and out of Level 3 are recognized as of the end of the quarter in which they occur.
Fixed Maturities, Available for Sale
Equity Securities, Available for Sale
Total
Balance at December 31, 2015 $ 1,026,694 $ 26,805,948 $ 27,832,642 Transfers in to Level 3 164,039 0 164,039 Total unrealized gains (losses): Included in realized gains (losses) 60,392 0 60,392 Included in other comprehensive income 1,931,586 3,260,805 5,192,391 Purchases 0 1,232,946 1,232,946 Sales (99,460) (5,506,400) (5,605,860)Balance at December 31, 2016 $ 3,083,251 $ 25,793,299 $ 28,876,550
The Level 3 securities include collateralized debt obligations of trust preferred securities issued by banks and insurance companies and certain equity securities with unobservable inputs. The Company computed fair value of Level 3 equity investments based on a review of current financial information, earnings trends and similar companies in the same industries. The Company transferred one fixed maturity security in to Level 3 during 2016 based upon a change in rating. There were no transfers in or out of Level 3 during 2015. Transfers occur when there is a lack of observable market information. Certain assets are not carried at fair value on a recurring basis, including investments such as mortgage loans and policy loans. Accordingly, such investments are only included in the fair value hierarchy disclosure when the investment is subject to re-measurement at fair value after initial recognition and the resulting re-measurement is reflected in the Consolidated Financial Statements. The carrying values and estimated fair values of certain of the Company’s financial instruments not recorded at fair value in the Consolidated Balance Sheets are shown below. Because the fair value for all Consolidated Balance Sheet items are not required to be disclosed, the aggregate fair value amounts presented below are not reflective of the underlying value of the Company.
December 31, 2016 December 31, 2015 Assets
Carrying Amount
Estimated Fair
Value
Carrying Amount
Estimated Fair
Value Mortgage loans on real estate $ 18,577,372 $ 18,577,372 $ 17,769,930 $ 17,775,178Investment real estate 57,138,980 57,138,980 47,650,102 47,650,102Notes receivable 16,876,485 16,876,485 10,597,907 10,597,907Policy loans 10,070,134 10,070,134 10,684,244 10,684,244Cash and cash equivalents 15,156,548 15,156,548 11,822,615 11,822,615
The above estimated fair value amounts have been determined based upon the following valuation methodologies. Considerable judgment was required to interpret market data in order to develop these estimates. Accordingly, the estimates are not necessarily indicative of the amounts which could be realized in a current market exchange. The use of different market assumptions or estimation methodologies may have a material effect on the fair value amounts.

39
The fair values of mortgage loans on real estate are estimated using discounted cash flow analyses and interest rates being offered for similar loans to borrowers with similar credit ratings. The inputs used to measure the fair value of our mortgage loans on real estate are classified as Level 3 within the fair value hierarchy. A portion of the mortgage loans balance consists of discounted mortgage loans. The Company has been purchasing non-performing discounted mortgage loans at a deep discount through an auction process led by the Federal Government. In general, the discounted loans are non-performing and there is a significant amount of uncertainty surrounding the timing and amount of cash flows to be received by the Company. Accordingly, the Company records its investment in the discounted loans at its original purchase price, which Management believes approximates fair value. The inputs used to measure the fair value of our discounted mortgage loans are classified as Level 3 within the fair value hierarchy. Investment real estate is recorded at the lower of the net investment in the real estate or the fair value of the real estate less costs to sell. The determination of fair value assessments are performed on a periodic, non-recurring basis by external appraisal and assessment of property values by Management. The inputs used to measure the fair value of our investment real estate are classified as Level 3 within the fair value hierarchy. Notes receivable are carried at their unpaid principal balances, which approximates fair value. The inputs used to measure the fair value of the loans are classified as Level 3 within the fair value hierarchy. Policy loans are carried at the aggregate unpaid principal balances in the Consolidated Balance Sheets which approximate fair value, and earn interest at rates ranging from 4% to 8%. Individual policy liabilities in all cases equal or exceed outstanding policy loan balances. The inputs used to measure the fair value of our policy loans are classified as Level 3 within the fair value hierarchy. The carrying amount of cash and cash equivalents in the Consolidated Balance Sheets approximates fair value given the highly liquid nature of the instruments. The inputs used to measure the fair value of our cash and cash equivalents are classified as Level 1 within the fair value hierarchy. The carrying amount of short term investments in the Consolidated Balance Sheets approximates fair value. The inputs used to measure the fair value of our short term investments are classified as Level 3 within the fair value hierarchy. The carrying value is a reasonable estimate of fair value for notes payable subject to floating rates of interest. The fair value of notes payable with fixed rate borrowings is determined based on the borrowing rates currently available to the Company for loans with similar terms and average maturities. The inputs used to measure the fair value of our notes payable are classified as Level 2 within the fair value hierarchy. Note 4 - Reinsurance As is customary in the insurance industry, the insurance subsidiary cedes insurance to, and assumes insurance from, other insurance companies under reinsurance agreements. Reinsurance agreements are intended to limit a life insurer's maximum loss on a large or unusually hazardous risk or to obtain a greater diversification of risk. The ceding insurance company remains primarily liable with respect to ceded insurance should any reinsurer be unable to meet the obligations assumed by it. However, it is the practice of insurers to reduce their exposure to loss to the extent that they have been reinsured with other insurance companies. The Company sets a limit on the amount of insurance retained on the life of any one person. The Company will not retain more than $125,000, including accidental death benefits, on any one life. At December 31, 2016, the Company had gross

40
insurance in-force of $1.3 billion of which approximately $266 million was ceded to reinsurers. At December 31, 2015, the Company had gross insurance in-force of $1.3 billion of which approximately $272 million was ceded to reinsurers. The Company's reinsured business is ceded to numerous reinsurers. The Company monitors the solvency of its reinsurers in seeking to minimize the risk of loss in the event of a failure by one of the parties. The Company is primarily liable to the insureds even if the reinsurers are unable to meet their obligations. The primary reinsurers of the Company are large, well-capitalized entities. Most recently, UG utilized reinsurance agreements with Optimum Re Insurance Company (“Optimum”), and Swiss Re Life and Health America Incorporated (“SWISS RE”). Optimum and SWISS RE currently hold an “A-” (Excellent) and "A+" (Superior) rating, respectively, from A.M. Best, an industry rating company. The reinsurance agreements were effective December 1, 1993, and covered most new business of UG. Under the terms of the agreements, UG cedes risk amounts above its retention limit of $100,000 with a minimum cession of $25,000. Ceded amounts are shared equally between the two reinsurers on a yearly renewable term (“YRT”) basis, a common industry method. The treaty is self-administered; meaning the Company records the reinsurance results and reports them to the reinsurers. Also, Optimum is the reinsurer of 100% of the accidental death benefits (“ADB”) in-force of UG. This coverage is renewable annually at the Company’s option. Optimum specializes in reinsurance agreements with small to mid-size carriers such as UG. UG entered into a coinsurance agreement with Park Avenue Life Insurance Company (“PALIC”) effective September 30, 1996. Under the terms of the agreement, UG ceded to PALIC substantially all of its then in-force paid-up life insurance policies. Paid-up life insurance generally refers to non-premium paying life insurance policies. Under the terms of the agreement, UG sold 100% of the future results of this block of business to PALIC through a coinsurance agreement. UG continues to administer the business for PALIC and receives a servicing fee through a commission allowance based on the remaining in-force policies each month. PALIC has the right to assumption reinsure the business, at its option, and transfer the administration. The Company is not aware of any such plans. PALIC’s ultimate parent, The Guardian Life Insurance Company of America (“Guardian”), currently holds an "A++" (Superior) rating from A.M. Best. The PALIC agreement accounts for approximately 63% of UG’s reinsurance reserve credit, as of December 31, 2016 and 2015. On September 30, 1998, UG entered into a coinsurance agreement with The Independent Order of Vikings, (IOV) an Illinois fraternal benefit society. Under the terms of the agreement, UG agreed to assume, on a coinsurance basis, 25% of the reserves and liabilities arising from all in-force insurance contracts issued by the IOV to its members. At December 31, 2016, the IOV insurance in-force assumed by UG was $1,442,637, with reserves being held on that amount of $349,149. At December 31, 2015, the IOV insurance in-force assumed by UG was approximately $1,451,366, with reserves being held on that amount of approximately $349,675. The Company does not have any short-duration reinsurance contracts. The effect of the Company's long-duration reinsurance contracts on premiums earned in 2016 and 2015 were as follows:
2016 Premiums
Earned
2015 Premiums
Earned
Direct $ 9,720,712 $ 11,140,266 Assumed 22,137 24,591 Ceded (2,853,741) (3,090,503) Net Premiums $ 6,889,108 $ 8,074,354

41
Note 5 – Cost of Insurance Acquired When an insurance company is acquired, the Company assigns a portion of its cost to the right to receive future cash flows from insurance contracts existing at the date of the acquisition. The cost of policies purchased represents the actuarially determined present value of the projected future profits from the acquired policies. Cost of insurance acquired is amortized with interest in relation to expected future profits, including direct charge-offs for any excess of the unamortized asset over the projected future profits. The interest rates utilized may vary due to differences in the blocks of business. The interest rate utilized in the amortization calculation of the remaining cost of insurance acquired is 12%. The amortization is adjusted retrospectively when estimates of current or future gross profits to be realized from a group of products are revised.
2016 2015
Cost of insurance acquired, beginning of year $ 8,140,379 $ 9,047,984 Interest accretion 1,071,790 1,180,703 Amortization (1,944,772) (2,088,308) Net amortization (872,982) (907,605) Cost of insurance acquired, end of year $ 7,267,397 $ 8,140,379
Estimated net amortization expense of cost of insurance acquired for the next five years is as follows:
Interest Accretion
Amortization
Net Amortization
2017 967,032 1,806,137 839,105 2018 866,339 1,672,404 806,065 2019 769,612 1,545,518 775,906 2020 676,503 1,421,353 744,850 2021 587,120 1,302,090 714,970
Note 6 – Income Taxes UTG and UG file separate federal income tax returns. Income tax expense (benefit) consists of the following components:
2016 2015
Current tax $ 209,576 $ 747,714 Deferred tax 456,605 (1,680,429) Income tax expense (benefit) $ 666,181 $ (932,715)
42
The expense for income differed from the amounts computed by applying the applicable United States statutory rate of 35% before income taxes as a result of the following differences:
2016 2015
Tax computed at statutory rate $ 742,863 $ 95,663 Changes in taxes due to: Non-controlling interest (100,891) (101,297) Current period loss for which no tax benefit was recognized 0 17,693 Small company deduction (260,660) (552,694) Dividend received deduction (92,731) (100,349) Other 377,600 (291,731) Income tax expense (benefit) $ 666,181 $ (932,715)
The following table summarizes the major components that comprise the deferred tax liability as reflected in the balance sheets:
2016 2015
Investments $ 9,690,287 $ (2,735,072) Cost of insurance acquired 2,543,589 2,849,133 Management/consulting fees (52,797) (55,125) Future policy benefits 1,404,177 1,546,770 Deferred gain on sale of subsidiary 2,312,483 2,312,483 Other assets (liabilities) 13,245 27,406 Federal tax DAC (451,935) (540,128) Deferred tax liability $ 15,459,049 $ 3,405,467
At December 31, 2016 and 2015, the Company had gross deferred tax assets of $1,727,307 and $4,896,464, respectively, and gross deferred tax liabilities of $17,186,356 and $8,301,931, respectively, resulting from temporary differences primarily related to the life insurance subsidiary. A valuation allowance is to be provided when it is more likely than not that deferred tax assets will not be realized by the Company. No valuation allowance has been recorded (except as noted below) relating to the Company’s deferred tax assets since, in Management’s judgment, the Company will more likely than not have sufficient taxable income in future periods to fully realize its existing deferred tax assets. As of December 31, 2016 and 2015, the Company had a deferred tax asset of $0 and $35,094, respectively, relating to a net operating loss carryforward. The Company established an allowance of $0 and $35,094 against this deferred tax asset as of December 31, 2016 and 2015, respectively. The Company also has a deferred tax asset of $155,930 and $118,693 relating to an AMT tax carryforward as of December 31, 2016 and 2015, respectively. The Company established an allowance of $155,930 and $118,693 against this deferred tax asset as of December 31, 2016 and 2015, respectively. The allowances were established based on Management’s assessment of the recoverability of these deferred assets. The Company’s Federal income tax returns are periodically audited by the Internal Revenue Service (“IRS”). There are currently no examinations in process, nor is Management aware of any pending examination by the IRS. The Company follows the accounting guidance for uncertainty in income taxes using the provisions of Financial Accounting Standards Board (“FASB”) ASC 740, Income Taxes. Using that guidance, tax positions initially need to be recognized in the financial

43
statements when it is more-likely-than-not the position will be sustained upon examination by the tax authorities. Such tax positions initially and subsequently need to be measured as the largest amount of tax benefit that has a greater than 50% likelihood of being realized upon ultimate settlement with the tax authority assuming full knowledge of the position and relevant facts. The Company has evaluated its tax positions, expiring statutes of limitations, changes in tax law and new authoritative rulings and believes that no disclosure relative to a provision of income taxes is necessary, at this time, to cover any uncertain tax positions. Tax years that remain subject to examination are the years ended December 31, 2013, 2014, 2015 and 2016. The Company classifies interest and penalties on underpayment of income taxes as income tax expense. No interest or penalties were included in the reported income taxes for the years presented. The Company is not aware of any potential or proposed changes to any of its tax filings. Note 7 – Credit Arrangements At December 31, 2016 and 2015, the Company had the following outstanding debt:
Outstanding Principal Balance
Instrument Issue Date Maturity Date
December 31,
2016
December 31, 2015
Promissory Note:
SoftVest, L.P. 7/22/2016 7/22/2018 $ 1,450,000 $ 0
SoftSearch Investment, L.P. 7/22/2016 7/22/2018 1,450,000 0
Instrument Issue Date Maturity
Date
Revolving Credit Limit
December 31, 2015 Borrowings Repayments
December 31, 2016
Lines of Credit:
UTG 11/20/2013 11/20/2017 $ 8,000,000 $ 0 0 0 $ 0
UG 6/2/2015 5/10/2017 10,000,000 0 0 0 0
The UTG line of credit carries interest at a fixed rate of 3.75% and is payable monthly. As collateral, UTG has pledged 100% of the common voting stock of its wholly owned subsidiary, Universal Guaranty Life Insurance Company (“UG”). During May of 2016, the Federal Home Loan Bank approved UG’s Cash Management Advance Application (“CMA”). The CMA gives the Company the option of selecting a variable rate of interest for up to 90 days or a fixed rate for a maximum of 30 days. The variable rate CMA is prepayable at any time without a fee, while the fixed CMA is not prepayable prior to maturity. On July 22, 2016, the Company entered in to an agreement to acquire 300,000 shares of its outstanding common stock from a shareholder that owned approximately 8% of the Company’s outstanding common stock. The acquisition was made under the Company’s stock buy-back program. As part of this transaction, two promissory notes totaling $2.9 million were issued. The notes require principal payments of one half of the note value to be paid one year from the date of purchase and the other one half to be paid two years from the date of purchase. The notes bear interest at 0%.

44
Note 8 – Commitments and Contingencies The insurance industry has experienced a number of civil jury verdicts which have been returned against life and health insurers in the jurisdictions in which the Company does business involving the insurers' sales practices, alleged agent misconduct, failure to properly supervise agents, and other matters. Some of the lawsuits have resulted in the award of substantial judgments against the insurer, including material amounts of punitive damages. In some states, juries have substantial discretion in awarding punitive damages in these circumstances. In the normal course of business, the Company is involved from time to time in various legal actions and other state and federal proceedings. Management is of the opinion that the ultimate disposition of the matters will not have a materially adverse effect on the Company’s results of operations or financial position. Under the insurance guaranty fund laws in most states, insurance companies doing business in a participating state can be assessed up to prescribed limits for policyholder losses incurred by insolvent or failed insurance companies. Although the Company cannot predict the amount of any future assessments, most insurance guaranty fund laws currently provide that an assessment may be excused or deferred if it would threaten an insurer's financial strength. Mandatory assessments may be partially recovered through a reduction in future premium tax in some states. The Company does not believe such assessments will be materially different from amounts already provided for in the condensed consolidated financial statements, though the Company has no control over such assessments. Within the Company’s trading accounts, certain trading securities carried as liabilities represent securities sold short. A gain, limited to the price at which the security was sold short, or a loss, potentially unlimited in size, will be recognized upon the termination of the short sale. The following table represents the total funding commitments and the unfunded commitment as of December 31, 2016 related to certain investments:
Total Funding Unfunded Commitment Commitment
RLF III, LLC $ 4,000,000 $ 398,120
Sovereign’s Capital, LP Fund I 500,000 33,642
UGLIC, LLC 1,600,000 120,000
Sovereign’s Capital, LP Fund II 1,000,000 596,064
Barton Springs Music, LLC 2,500,000 1,558,850
Master Mineral Holdings II, LP 4,122,167 1,788,786 During 2006, the Company committed to invest in RLF III, LLC (“RLF”), which makes land-based investments in undervalued assets. RLF makes capital calls as funds are needed for continued land purchases. During 2012, the Company committed to invest in Sovereign’s Capital, LP Fund I (“Sovereign’s”), which invests in companies in emerging markets. Sovereign’s makes capital calls to investors as funds are needed. During 2014, the Company committed to invest in UGLIC, LLC, which purchases real estate tax receivables. UGLIC, LLC makes capital calls as funds are needed for additional purchases. During 2015, the Company committed to invest in Sovereign’s Capital, LP Fund II (“Sovereign’s II”), which invests in companies in emerging markets. Sovereign’s II makes capital calls to investors as funds are needed.
45
During 2016, the Company made a commitment to invest in Barton Springs Music, LLC (“Barton”), which invests in music royalties. Barton makes capital calls to its investors as funds are needed to acquire the royalty rights. During 2016, the Company made a commitment to invest in Master Mineral Holdings II, LP (“MMH”), which purchases land for leasing opportunities to those looking to harvest natural resources. MMH makes capital calls to its investors as funds are needed for continued land purchases. Note 9 – Shareholders’ Equity Stock Repurchase Program – The Board of Directors of UTG has authorized the repurchase in the open market or in privately negotiated transactions of UTG's common stock. At a meeting of the Board of Directors on June 15, 2016, the Board of Directors of UTG authorized the repurchase of up to an additional $2 million of UTG’s common stock and on July 14, 2016, the Board of Directors again increased the amount available by an additional $4.5 million, for a total repurchase of $14.5 million. Repurchased shares are available for future issuance for general corporate purposes. Company Management has broad authority to operate the program, including the discretion of whether to purchase shares and the ability to suspend or terminate the program. Open market purchases are made based on the last available market price but may be limited. During 2016, the Company repurchased 370,172 shares through the stock repurchase program for $5,432,194. Through December 31, 2016, UTG has spent approximately $11.9 million in the acquisition of approximately 1,059,000 shares under this program. As mentioned in Note 7 above, on July 22, 2016 the Company entered in to an agreement to acquire 300,000 shares of its outstanding common stock from a shareholder that owned approximately 8% of the Company’s outstanding common stock. The purchase price per share was $14.50 was derived through private negotiation. The purchase was paid with cash and the issuance of promissory notes. Director Compensation - Effective September 18, 2013, each outside Director will annually receive $8,000 as a retainer and $1,000 per meeting attended. The compensation, however, shall be paid in UTG common stock. The value will be determined annually on the close of business December 20th or the next business day should December 20th be a weekend or holiday, based on the activity of the year just ending. UTG's director compensation policy also provides that Directors who are employees of UTG or its affiliates do not receive any compensation for their services as Directors except for reimbursement for reasonable travel expenses for attending each meeting. In December of 2016, the Company issued 3,575 shares of its common stock as compensation to the Directors. The shares were valued at $17.05 per share, the market value at the date of issue. During 2016, the Company recorded $60,954 in operating expense related to the stock issuance. In December of 2015, the Company issued 4,245 shares of its common stock as compensation to the Directors. The shares were valued at $14.36 per share, the market value at the date of issue. During 2015, the Company recorded $60,958 in operating expense related to the stock issuance. Earnings Per Share - The following is a reconciliation of basic and diluted weighted average shares outstanding used in the computation of basic and diluted earnings per share:
2016 2015 Basic weighted average shares outstanding 3,537,394 3,704,322Weighted average dilutive options outstanding 0 0Diluted weighted average shares outstanding 3,537,394 3,704,322

46
The computation of diluted earnings per share is the same as basic earnings per share for the years ending December 31, 2016 and 2015, as there were no outstanding securities, options or other offers that give the right to receive or acquire common shares of UTG. Statutory Restrictions – Restrictions exist on the flow of funds to UTG from its insurance subsidiary. Statutory regulations require life insurance subsidiaries to maintain certain minimum amounts of capital and surplus. UG is required to maintain minimum statutory surplus of $2,500,000. At December 31, 2016, substantially all of the consolidated shareholders' equity represents net assets of UTG’s subsidiaries. UG is domiciled in the state of Ohio. Ohio requires notification within five business days to the insurance commissioner following the declaration of any ordinary dividend and at least ten calendar days prior to payment of such dividend. Ordinary dividends are defined as the greater of: a) prior year statutory net income or b) 10% of statutory capital and surplus. Extraordinary dividends (amounts in excess of ordinary dividend limitations) require prior approval of the insurance commissioner and are not restricted to a specific calculation. UG paid ordinary dividends of $1 million and $4 million to UTG in 2016 and 2015, respectively. No extraordinary dividends were paid during the two year period. UTG used the dividends received during 2016 and 2015 to purchase outstanding shares of UTG stock and for general operations of the Company. Note 10 - Statutory Accounting The insurance subsidiary prepares its statutory-based financial statements in accordance with accounting practices prescribed or permitted by the Ohio Department of Insurance. These principles differ significantly from accounting principles generally accepted in the United States of America. "Prescribed" statutory accounting practices include state laws, regulations, and general administrative rules, as well as a variety of publications of the National Association of Insurance Commissioners (NAIC). "Permitted" statutory accounting practices encompass all accounting practices that are not prescribed; such practices may differ from state to state, from company to company within a state, and may change in the future. The following table reflects UG’s statutory basis net income and capital and surplus (shareholders’ equity) as of December 31:
2016 2015
Net income (loss) $ 4,590,139 $ 306,059
Capital and surplus 45,167,092 39,752,432
Note 11 – Related Party Transactions The articles of incorporation of UG contain the following language under item 12 relative to related party transactions: A director shall not be disqualified from-dealing with or contracting with the corporation as vendor, purchaser; employee, agent or otherwise; nor, in the absence of fraud, shall any transaction or contract or act of this corporation be void or in any way affected or invalidated by the fact that any director or any firm of which any director is a member or any corporation of which any director is a shareholder, director or officer is in any way interested in such transaction or contract or act, provided the fact that such director or such firm or such corporation so interested shall be disclosed or shall be known to the Board of Directors or such members thereof as shall be present at any meeting of the Board of Directors at which action upon any such contract or transaction or act shall be taken: nor shall any such director be accountable .or responsible to the company for or in respect
47
to such transaction or contract or act of. this corporation or for any gains or profits realized by him by reason of the fact that he or any firm of which he is a member or any corporation of which he is a shareholder, director or officer is interested in such action or contract; and any such director may be counted in determining the existence of a quorum of any meeting of the Board of Directors of the company which shall authorize or take action in respect to any such contract or transaction or act and may vote thereat to authorize, ratify, or approve any such contract or transaction or act, with like force and effect as if he or any firm of which he is a member or any corporation of which he is a shareholder, director or officer were not interested in such transaction or contract or act. On February 20, 2003, UG purchased $4 million of a trust preferred security offering issued by First Southern Bancorp, Inc. (“FSBI”). The security has a mandatory redemption after 30 years with a call provision after 5 years. The security pays a quarterly dividend at a fixed rate of 6.515%. The Company received dividends of $264,946 and $264,219 during 2016 and 2015, respectively. On March 30, 2009, UG purchased $1 million of FSBI common stock. The sale and transfer of this security is restricted by the provisions of a stock restriction and buy-sell agreement. On September 28, 2011 UTG entered a joint ownership agreement with Bandyco, LLC and First Southern National Bank, for an 8.08% interest in an aircraft. Bandyco, LLC is affiliated with Ward F Correll, a former Director of the Company. The Company paid a monthly operational fee of $25,000 through July of 2014 when the aircraft was sold. During July of 2014, the Company acquired a different aircraft. UTG paid $1,600,000 in the acquisition of the aircraft, increasing the Company’s ownership interest to 30.1%. The aircraft is used for business related travel by various officers and employees of the Company. For years 2016 and 2015, UTG paid $418,104 and $255,920 for costs associated with the aircraft, respectively. Effective January 1, 2007, UTG entered into administrative services and cost sharing agreements with its subsidiary. Under this arrangement, the subsidiary pays its proportionate share of expenses, based on an allocation formula. During 2016 and 2015, UG paid $7,561,326 and $6,867,882, respectively, in expenses. The Ohio Department of Insurance has approved the cost sharing agreement and it is Management’s opinion that where applicable, costs have been allocated fairly and such allocations are based upon accounting principles generally accepted in the United States of America. The Company from time to time acquires mortgage loans through participation agreements with FSNB. FSNB services the Company's mortgage loans including those covered by the participation agreements. The Company pays a .25% servicing fee on these loans and a one-time fee at loan origination of .50% of the original loan cost to cover costs incurred by FSNB relating to the processing and establishment of the loan. The Company paid $13,517 and $11,622 in servicing fees and $0 and $25,000 in origination fees to FSNB during 2016 and 2015, respectively. The Company reimbursed expenses incurred by employees of FSNB relating to salaries, travel and other costs incurred on behalf of or relating to the Company. The Company paid $269,262 and $324,918 in 2016 and 2015, respectively to FSNB in reimbursement of such costs. In addition, the Company reimburses FSNB a portion of salaries and pension costs for Mr. Correll and Mr. Ditto. The reimbursement was approved by the UTG Board of Directors and totaled $335,769 and $349,351 in 2016 and 2015, respectively, which included salaries and other benefits. During 2016, the Company began renting approximately 8,000 square feet of office space, located in Stanford, Kentucky, from FSNB and pays $2,000 per month in rent. The Company paid rent of $8,000 to FSNB during 2016. As previously disclosed in the Notes Receivable section of Note 2 – Investments, several of the Company’s notes have participation agreements in place with third parties. Certain participation agreements are with FSF, a related party. The participation agreements are sold without recourse

48
and assigned to the participant based on their pro-rata share of the principal, interest and collateral as specified in the participation agreements. The undivided participations in the notes receivable range from 20% - 50%. The total amount of loans participated to FSF were $250,000 and $3,170,000 as of December 31, 2016 and 2015, respectively. During 2016, UTG and FSF established a partnership agreement and formed a limited liability company to purchase real estate. FSF contributed $140,000 to the partnership, which gave them a 10% ownership in the LLC. Note 12 – Other Cash Flow Disclosures On a cash basis, the Company paid the following expenses for the periods ended December 31:
2016 2015 Interest $ 0 $ 70,141
Federal income tax 811,000 3,300,000 Note 13 - Concentrations The Company maintains cash balances in financial institutions that at times may exceed federally insured limits. The Company maintains its primary operating cash accounts with First Southern National Bank, an affiliate of the largest shareholder of UTG, Mr. Jesse T. Correll, the Company’s CEO and Chairman. The Company has not experienced any losses in such accounts and believes it is not exposed to any significant credit risk on cash and cash equivalents. Because UTG serves primarily individuals located in four states, the ability of our customers to pay their insurance premiums is impacted by the economic conditions in these areas. As of December 31, 2016 and 2015, approximately 55% and 54%, respectively, of the Company’s total direct premium was collected from Illinois, Ohio, Texas and West Virginia. Thus, results of operations are heavily dependent upon the strength of these economies. The Company reinsures that portion of insurance risk which is in excess of its retention limits. Retention limits range up to $125,000 per life. Life insurance ceded represented 21% of total life insurance in-force at December 31, 2016 and 2015. Insurance ceded represented 28% and 31% of premium income for 2016 and 2015, respectively. The Company would be liable for the reinsured risks ceded to other companies to the extent that such reinsuring companies are unable to meet their obligations. Note 14 – Selected Quarterly Financial Data As a smaller reporting company, as defined by Rule 12b-2 of the Exchange Act and Item 10(f)(1) of Regulation S-K, the Company has elected to comply with certain scaled disclosure reporting obligations, and therefore does not have to provide the information required by this item.

49
BOARD OF DIRECTORS OFFICERS Randall L. Attkisson Jesse T. Correll Partner of Bluegrass Financial Holdings Chairman of the Board and Chief Executive Officer Joseph A. Brinck, II Chief Executive Officer, Stelter & James P. Rousey Brinck, LTD President Jesse T. Correll Theodore C. Miller Chairman, President and Director Senior Vice President, of First Southern Bancorp, Inc. Chief Financial Officer and Corporate Secretary Brian J. Crall Owner and President of foreClarity! Douglas P. Ditto Vice President Howard L. Dayton, Jr. Founder and Chief Executive Officer of Compass – finances God’s way Thomas E. Harmon Owner and President of Harmon Foods, Inc. Peter L. Ochs Founder of Capital III and Founding Member of Trinity Academy James P. Rousey President

50
SHAREHOLDER INFORMATION Annual Meeting The 2017 Annual Meeting of Shareholders will be held on Tuesday, June 13, 2017 at 6:00 p.m. eastern time at 205 North Depot Street, Stanford, Kentucky 40484. All shareholders are welcome to attend and to take part in the discussion of Company affairs. Market for Registrant’s Common Equity, Related Stockholder Matters and Issuer Purchases of Equity Securities The Registrant is a public company whose common stock is traded in the over-the-counter market. Over-the-counter quotations can be obtained using the UTGN stock symbol. The following table shows the high and low closing prices for each quarterly period during the past two years, without retail mark-up, mark-down or commission and may not necessarily represent actual transactions. The quotations below were acquired from the Yahoo Finance web site, which also provides quotes for over-the-counter traded securities such as UTG.
2016 2015 Period High Low High Low First quarter 16.05 14.26 14.25 13.05 Second quarter 16.05 14.55 15.99 13.50 Third quarter 16.05 14.85 19.00 14.80 Fourth quarter 17.75 16.05 17.00 14.36
UTG has not declared or paid any dividends on its common stock in the past two fiscal years, and has no current plans to pay dividends on its common stock as it intends to retain all earnings for investment in and growth of the Company’s business. See Note 9 – Shareholders’ Equity in the Notes to the Consolidated Financial Statements for information regarding dividend restrictions, including applicable restrictions on the ability of the Company’s life insurance subsidiary to pay dividends. As of February 15, 2017 there were 6,129 record holders of UTG common stock. Purchases of Equity Securities The following table provides information with respect to purchases we made of our common stock during the three months ended December 31, 2016 and total repurchases:
Total Number of
Shares Purchased
Average Price
Paid Per Share
Total Number of
Shares Purchased as Part of Publicly
Announced Program
Maximum Number of
Shares That May
Yet Be Purchased Under the Program
Approximate Dollar Value That May Yet
Be Purchased Under the Program
Oct. 1 through Oct. 31, 2016 8,092 $ 16.19 8,092 N/A $ 2,767,343
Nov. 1 through Nov. 30, 2016 0 $ 0 0 N/A $ 2,767,343
Dec. 1 through Dec. 31, 2016 267 $ 16.00 267 N/A $ 2,763,071
Total 8,359 8,359

51
The Board of Directors of UTG has authorized the repurchase in the open market or in privately negotiated transactions of UTG's common stock. At a meeting of the Board of Directors on June 15, 2016, the Board of Directors of UTG authorized the repurchase of up to an additional $2 million of UTG’s common stock and on July 14, 2016, the Board of Directors again increased the amount available by an additional $4.5 million, for a total repurchase of $14.5 million. Repurchased shares are available for future issuance for general corporate purposes. Company Management has broad authority to operate the program, including the discretion of whether to purchase shares and the ability to suspend or terminate the program. Open market purchases are made based on the last available market price but may be limited. During 2016, the Company repurchased approximately 370,000 shares through the stock repurchase program for approximately $5.4 million. Through December 31, 2016, UTG has spent approximately $11.9 million in the acquisition of approximately 1,059,000 shares under this program. On July 22, 2016, the Company entered in to an agreement to acquire 300,000 shares of its outstanding common stock from a shareholder that owned approximately 8% of the Company’s outstanding common stock. The purchase price per share was $14.50 and was paid with cash and the issuance of promissory notes. The acquisition was made under the Company’s stock buy-back program. As part of this transaction, two promissory notes totaling $2.9 million were issued. The notes require principal payments of one half of the note value to be paid one year from the date of purchase and the other one half to be paid two years from the date of purchase. The notes bear interest at 0%. See Note 7 – Credit Arrangements in the Notes to the Consolidated Financial Statements for additional information regarding this transaction.

52
Corporate Office Street Address 205 North Depot Street Stanford, KY 40484 (217) 241-6300 Mailing Address P.O. Box 13080 Springfield, IL 62791-3080 Corporate Website www.utgins.com Shareholder Services The Company acts as its own transfer agent. Communications regarding stock transfer, lost certificates or changes of address should be directed to the Stock Transfer Department at the corporate office address above or telephone (217) 241-6410. Certified Public Accountants Brown Smith Wallace LLC St. Louis, Missouri Request for Information Shareholders may receive a copy, without charge, of the annual report, Form 10-K, or Form 10-Q upon written request. Copies of Form 10-K or Form 10-Q are also available electronically at our Web site address at www.utgins.com or the Securities and Exchange Commission’s Web site address at www.sec.gov.


